
Off-Cycle Emissions of Particle Number from Gasoline and DPF Diesel Passenger Cars in High-Load Conditions


1
Graduate School of Engineering, Tokyo Denki University, Tokyo 120-8551, Japan
2
Regional Environment Conservation Division, National Institute for Environmental Studies, Ibaraki, Mito 305-8506, Japan
*
Author to whom correspondence should be addressed.
Atmosphere 2023, 14(4), 732; https://doi.org/10.3390/atmos14040732
Submission received: 22 March 2023
/
Revised: 13 April 2023
/
Accepted: 15 April 2023
/
Published: 18 April 2023
(This article belongs to the Special Issue Vehicle Emissions: New Challenges and Potential Solutions)
Abstract
:To evaluate regulated gases and solid particle number (SPN) emissions in high-load off-cycle conditions, two diesel vehicles with a diesel particulate filter (DPF) and a urea selective catalytic reduction (SCR) system, respectively, and four gasoline port fuel injection (PFI) vehicles were tested with the worldwide light-duty test cycle, including an extra-high (Ex-hi) phase. All the tested vehicles were developed for the Japanese market and did not comply with the Ex-hi phase. All vehicles exhibited higher CO2 emissions in the Ex-hi phase than in low, the mid and high phases. Increased NOx and SPN10-23 emissions were observed with the DPF vehicle. These increased emissions were due to the occurrence of passive regeneration of the DPF, and the urea SCR system was stopped as a result. The small gasoline PFI cars showed increased CO and SPN emissions in the Ex-hi phase. These emissions were due to enrichment control, which occurred in a quite high load operation condition. The feature of higher emissions with enrichment control differed from that observed in a warming-up process in the cold-start mode. SPN23 increased mainly in the warming-up process, whereas SPN10-23 increased in the Ex-hi phase with enrichment control. Hybrid vehicles seem to have fewer opportunities to show the enrichment control due to motor assist.
1. Introduction
The toxicity of particulate matter (PM) 2.5 has been clearly shown in past studies [1,2]. One of the highest emitters of PM2.5 among artificial sources is thought to be automobiles, and therefore, there have been great efforts to reduce PM from automobiles. The PM from automobiles is mainly PM2.5 [3], and thus reduction of PM from automobiles means a reduction of PM2.5. Until the 1990′s, PM from automobiles was thought to be a particular issue for diesel engines, but this situation has changed since the development of Diesel Particulate Filters (DPFs). Consequently, PM emissions from automobiles are not only an issue particular to diesel engines, but also gasoline engines. It should be noted that gasoline direct injection (DI) engines, the share of which has recently increased due to their higher thermal efficiency, emit a higher amount of PM than diesel engines with DPFs.
The great reduction of PM from diesel exhausts has led to changes in the evaluation methodology of PM from automobiles. The traditional methodology, the gravimetric method, does not have high enough sensitivity to detect PM from DPF diesel vehicles. Against this backdrop, a more sensitive evaluation method has been developed by the PMP IWG of GRPE/WP29/ECE [4,5,6,7,8]. This methodology counts a solid particle number (SPN). Some researchers have shown that SPN from automobiles has a certain correlation with PM [9,10,11], suggesting that SPN measurement may be an alternative to PM measurement. Moreover, SPN measurement has higher sensitivity to detect ultrafine particles, which are believed to be more toxic than larger particles [12,13,14]. After a campaign for evaluating the performance of the SPN methodology, this method has been adopted for exhaust emissions regulation [15,16].
Since the widespread adoption of DPFs, the ratio of PM from gasoline vehicles relative to the total amount of PM has increased because PM from diesel vehicles has been reduced. It is known that gasoline direct injection (DI) vehicles emit higher amounts of PM and SPN than port fuel injection (PFI) gasoline vehicles. In 2014, the SPN regulations in Europe were extended to gasoline DI vehicles. Until 2017, the regulatory limit for gasoline DI vehicles was set to 6 × 10¹² #/km, which was ten times higher than that for diesel vehicles. This is because gasoline DI vehicles emit higher SPN than DPF-equipped diesel vehicles, and a preparation period to develop devices for reducing SPN from gasoline DI vehicles was required. From 2017, the regulatory limit for SPN was reduced to the same level as diesel vehicles (6 × 10¹¹ #/km). Currently, most gasoline DI vehicles are equipped with a gasoline particulate filter (GPF) to meet the regulations. Only PFI gasoline vehicles have not been equipped with filters to reduce SPN. Previous research has indicated that PFI gasoline vehicles emit a higher amount of SPN and PM than DPF diesel vehicles [9,17,18], and thus, the effects of SPN and PM from PFI gasoline vehicles should be evaluated.
There is another issue related to a change to SPN regulations which is expected in the near future. The expected modification is a change to the lower detection limit from 23 nm (SPN23) to 10 nm (SPN10) to include a wider range of particles. This is because some vehicles have exhibited different emission properties in this size range [18,19].
Another important topic regarding exhaust emission regulations is the introduction of real driving emission (RDE) regulations [20,21,22]. This is a method of evaluating emissions while driving on actual roads with a portable emission measurement system (PEMS). Recent cars are tunable enough to perform quite low-emission driving only while the car is running in certification cycles. This kind of emission control results in a divergence between certification tests and real-world driving, which will not lead to improved atmospheric condition, and therefore, evaluation of off-cycle emissions is important. To avoid such a situation, RDE is being adopted in the certification process. As for off-cycle conditions, there are several cases: extremely low- and high-temperature conditions, high-altitude conditions, and high-load conditions. Among these, the high-load conditions case seems to be the most important, because it is not meteorologically special, and can occur anywhere.
There are some studies that have revealed that the SPN concentration in the idling condition has a correlation with the SPN result in the certification tests. According to these studies, introducing SPN measurement in a periodic technical inspection (PTI) to detect vehicles with malfunctioning DPFs has also been discussed [23,24,25].
In this study, SPN23 and SPN10 from DPF diesel vehicles and PFI gasoline vehicles, which are known to emit little PM, developed for the Japanese market were evaluated with a chassis dynamometer. The evaluated tested modes were not only the Japanese certification cycle (worldwide light-duty test cycle; WLTC) consisting of low, middle and high (LMH) phases, but also the full WLTC cycle consisting of LMH and extra-high (Ex-hi) phases. Emissions in the Ex-hi phase and LMH phases were estimated separately from the results. This study focused on comparing these results assuming that the emissions in the Ex-hi phase are off-cycle emissions, because the load in the Ex-hi phase is too high, and the emissions are not regulated in Japan.
2. Experimental Methods
2.1. Emission Measurement in Chassis Dynamometer
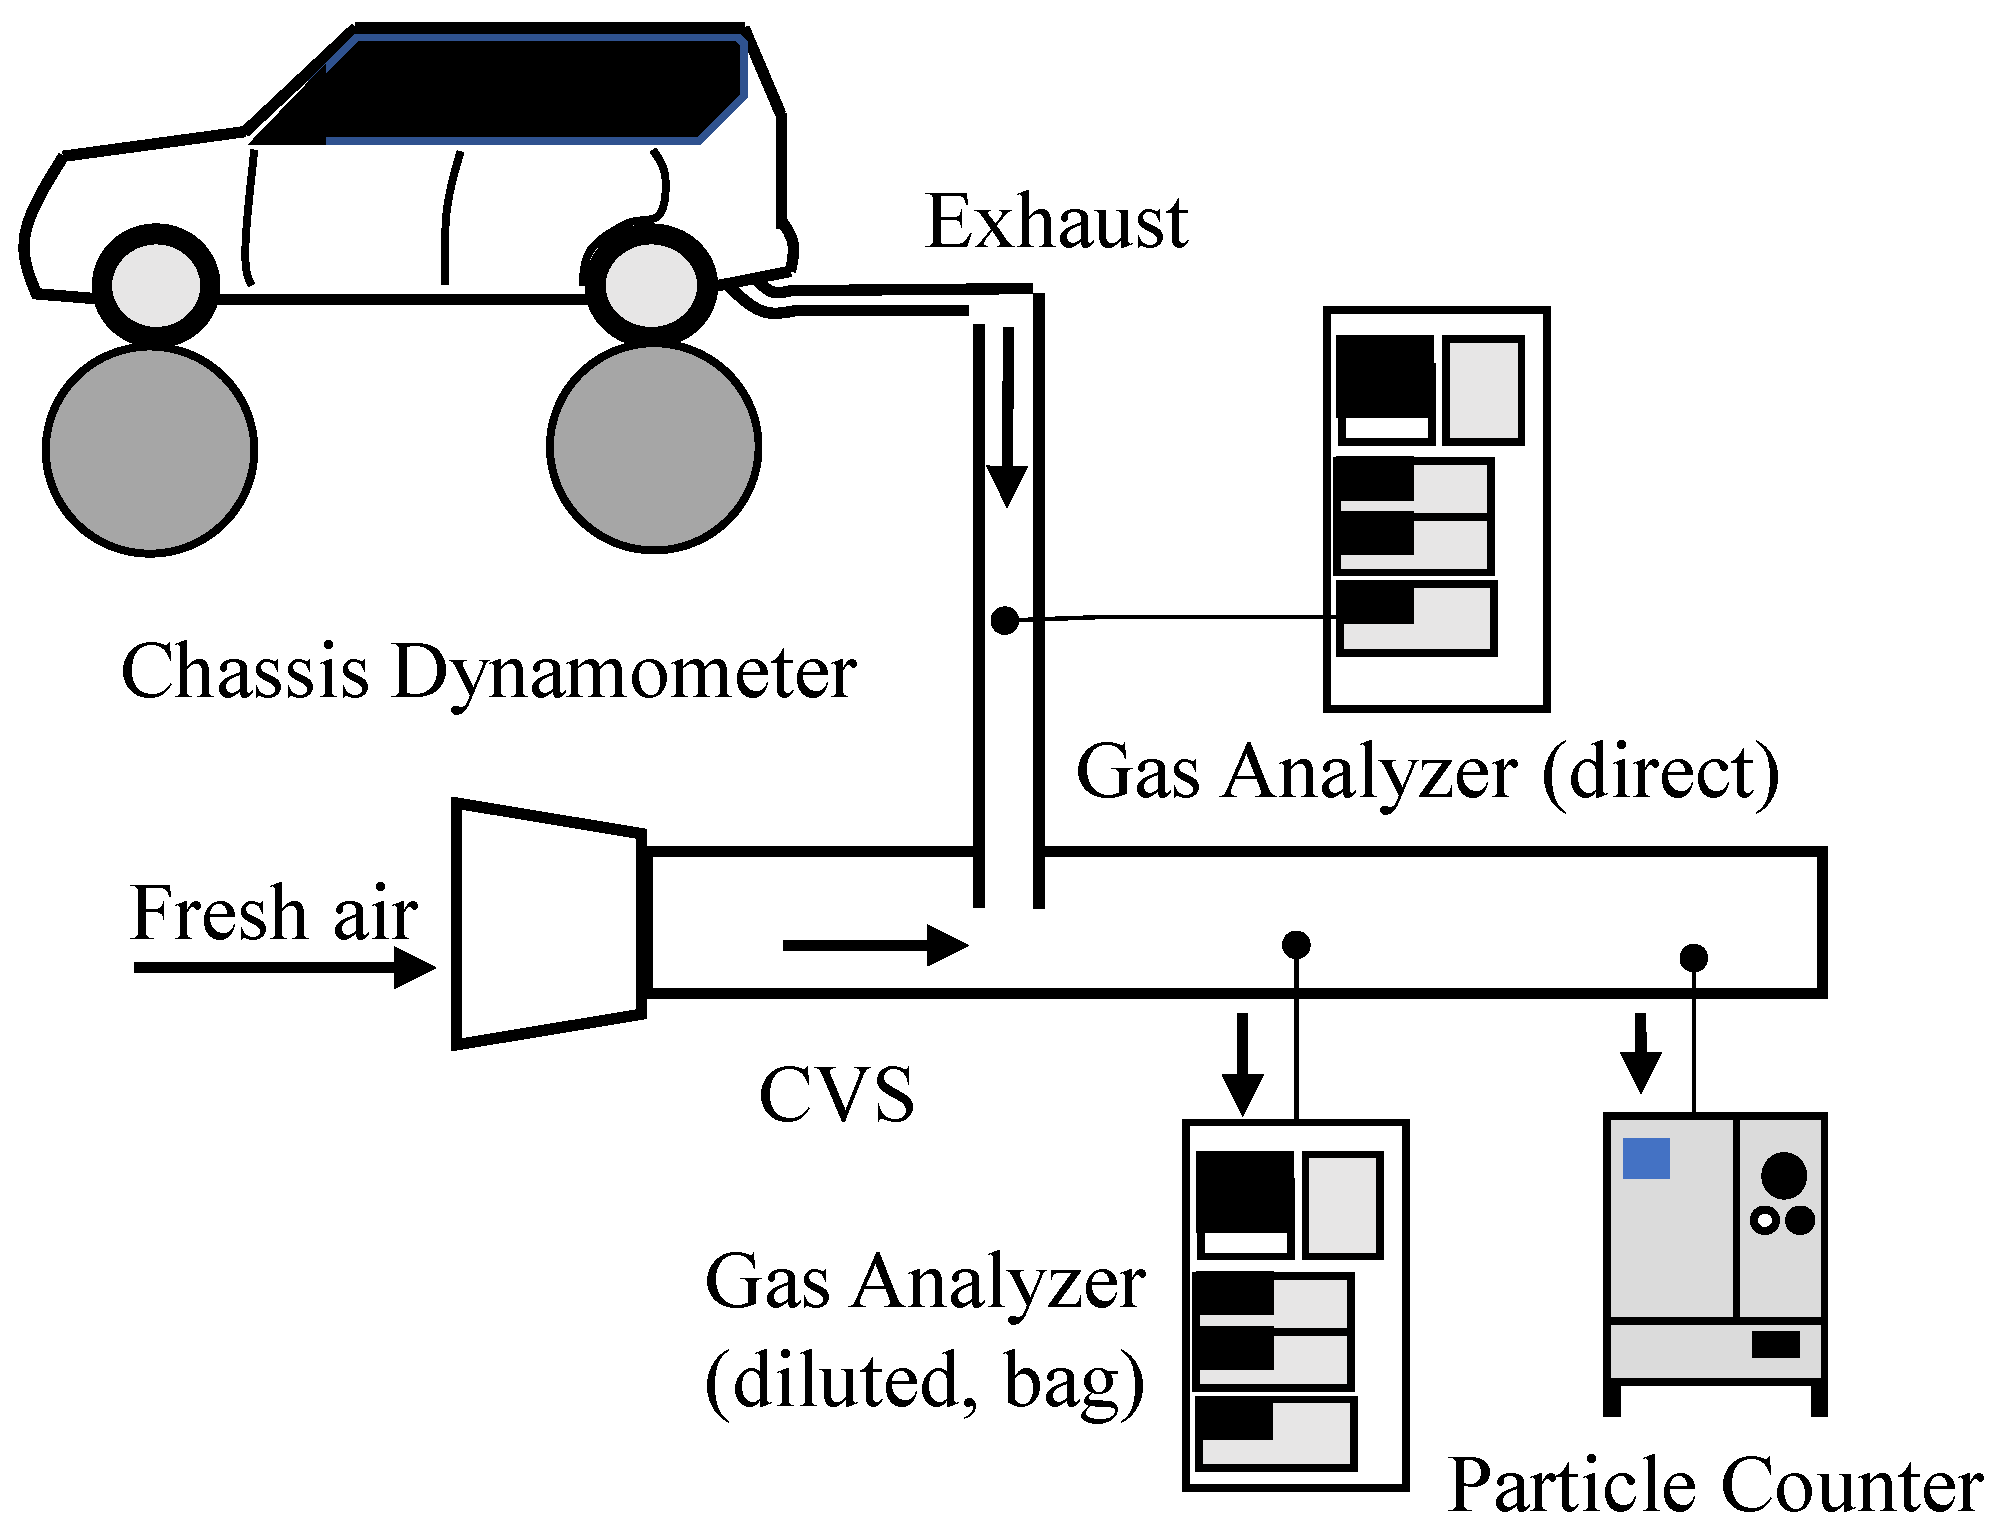
An outline of the experimental setup is shown in Figure 1. The tested vehicle was set on a four-wheel chassis dynamometer, and its exhaust was diluted with a constant volume sampler (CVS). The ambient air temperature was controlled to 23 °C. Regulated gas emissions (NOx, total hydrocarbon (THC), non-methane hydrocarbon (NMHC) and CO) and CO2 were sampled from the CVS into sampling bags and measured with a gas analyzer (MEXA-7400D, Horiba, Ltd., Kyoto, Japan). The methodologies adopted with the gas analyzer were non-dispersive infra-red (ND-IR) spectroscopy for CO and CO2, chemiluminescence detection for NOx, the flame ionization detection (FID) method for THC, and gas chromatography + FID for methane measurements. The gas analyzer was calibrated by span gases whose concentrations were near the regulation limits. The PM was trapped by a TX-40 filter and weighed with a micro-balance (UMX2 Mettler Toledo International Inc., Columbus, OH, USA). These measurement systems meet with the requirements of type approval tests in Japan. Exhaust gas emissions (CO, CO2 and THC) at the exhaust pipe were also monitored by another gas analyzer (MEXA-7400D Horiba, Ltd., Kyoto, Japan) to obtain the air-fuel ratio (AFR). The detailed methodology used for the AFR estimation is described in a later section.
The measurement methods for SPN10 and SPN23 are summarized in the following section. In addition to these devices, information in an engine control unit (ECU) was monitored using an on-board diagnostics (OBD) scan tool (DTS-i, Denso Corporation, Aichi, Japan).
Two patterns of driving cycles were tested in this study. One is a Japanese certification cycle. It is an WLTC consisting of LMH phases. The other is a full WLTC consisting of LMH phases followed by an Ex-hi phase. Cold-start and hot-start tests with both cycles were performed, even though only the cold-start test is checked in the certification tests. Results were summarized based on emissions in the LMH phases and Ex-hi phase, respectively. Emissions in the LMH phases were the results of the Japanese certification mode, and emissions in the Ex-hi phase were the results of the Ex-hi phase of the full WLTC cycle. Only one test per condition was performed; however, the repeatability of each test was confirmed with emissions in overlapped (LMH) phases of the Japanese certification test and the full WLTC test. PM in the Ex-hi phase was estimated by subtracting PM with the Japanese certification cycle from that with the full WLTC cycle.
2.2. SPN10 and SPN23 Measurements
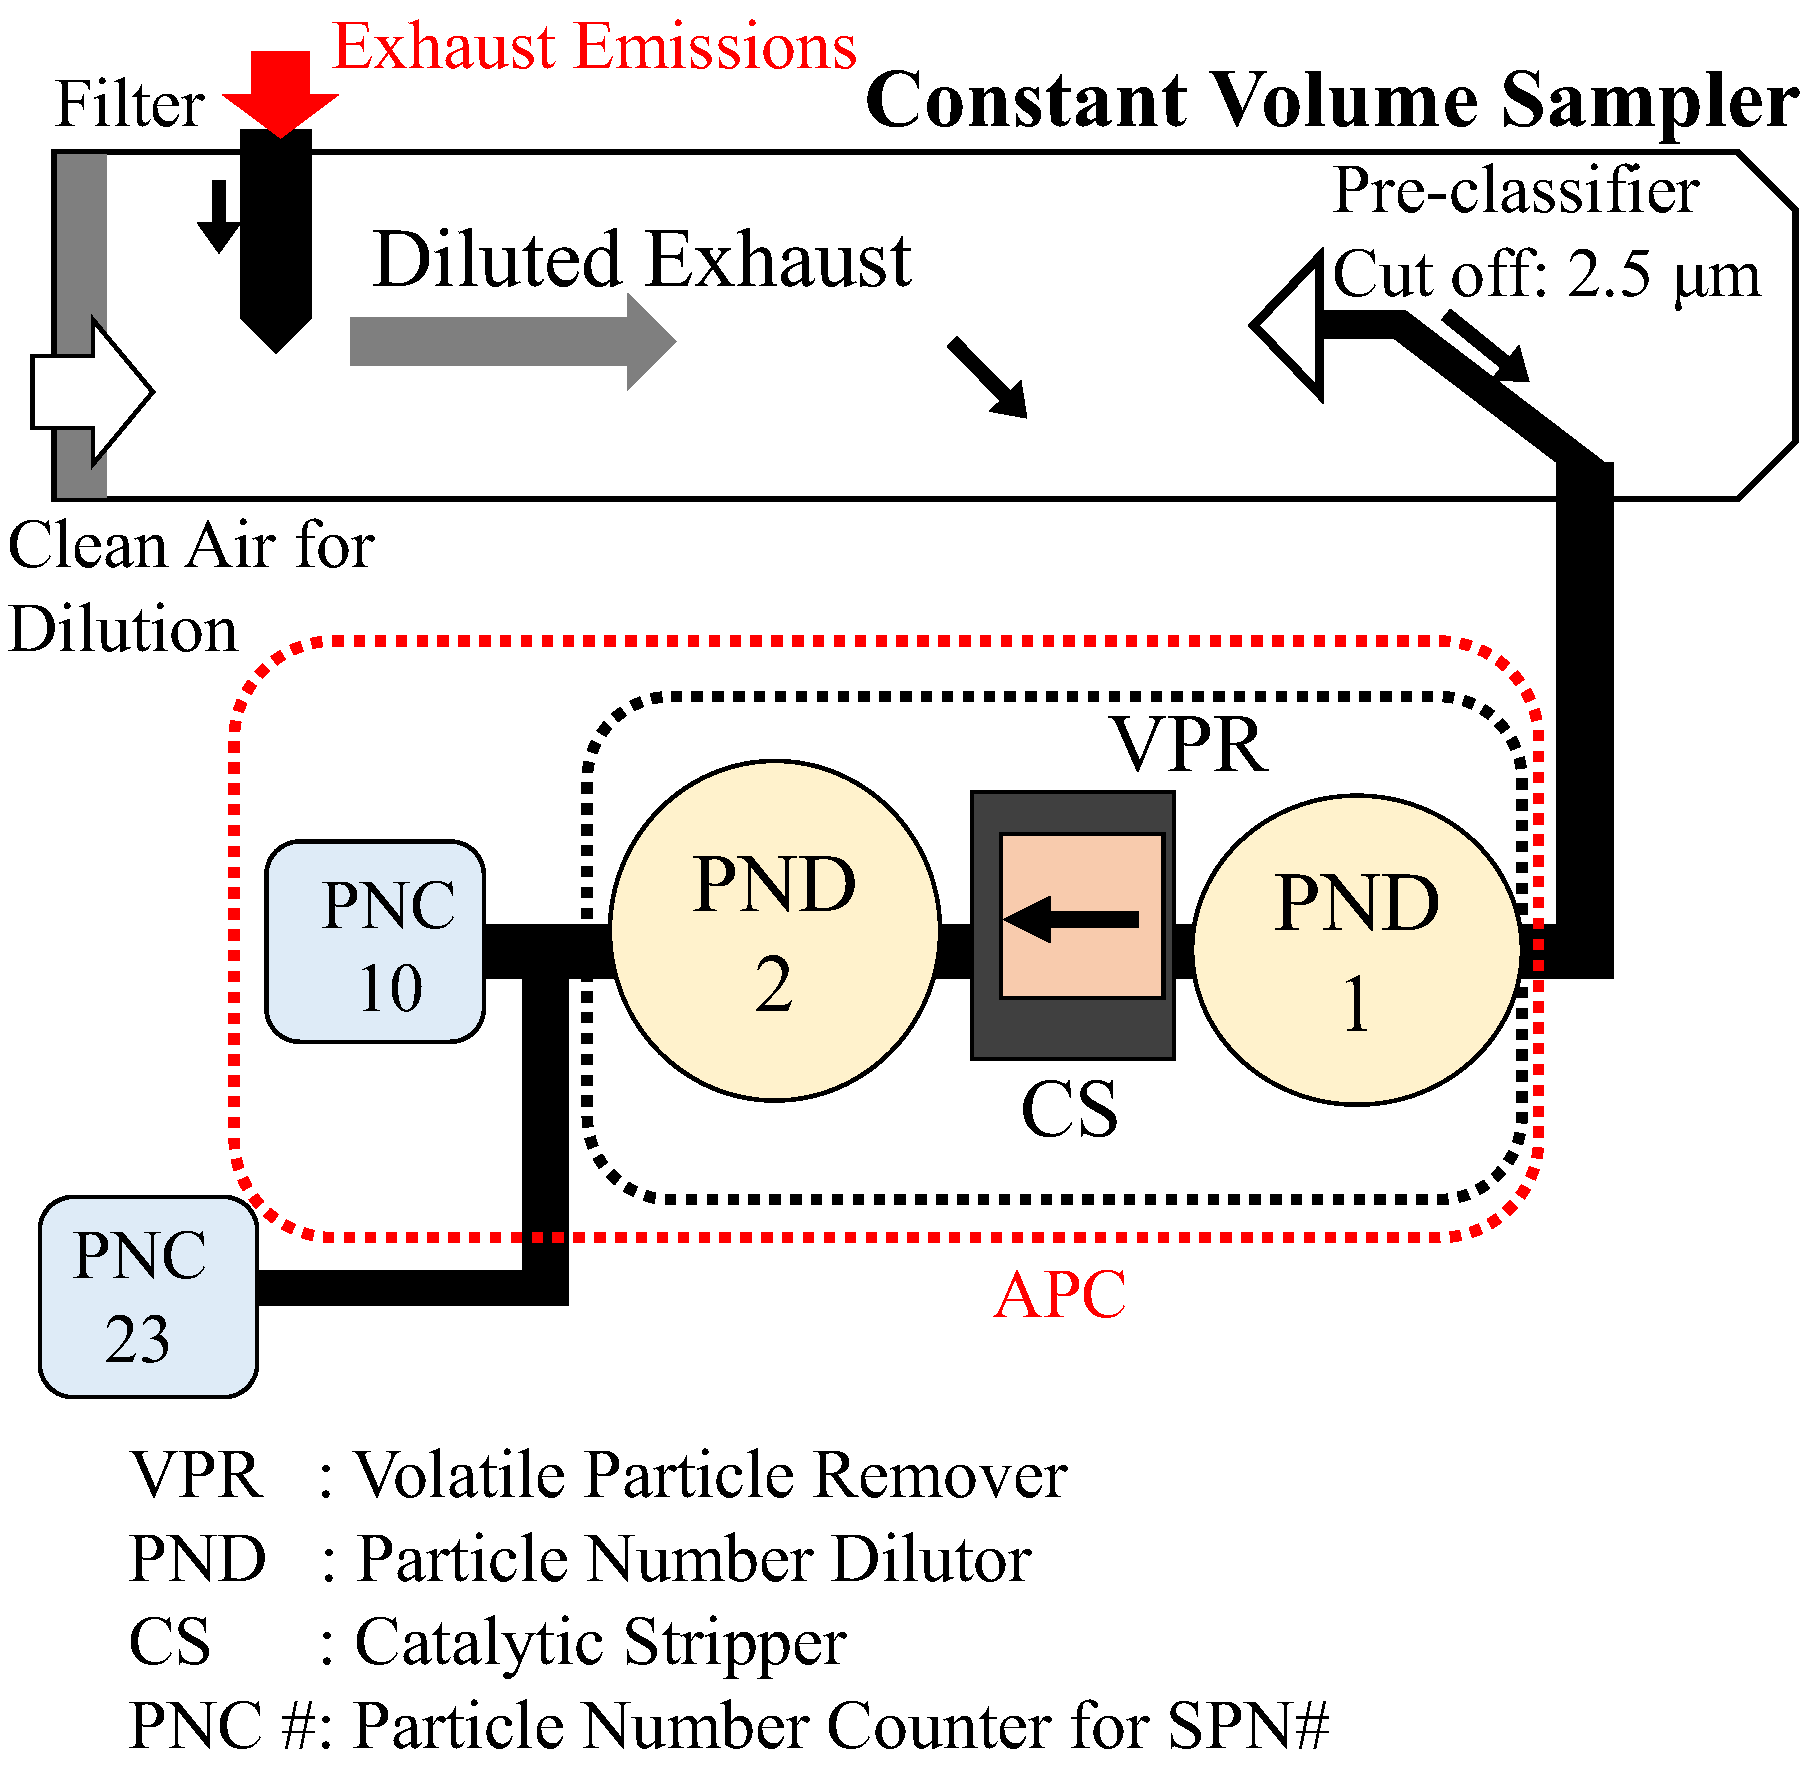
SPN10 and SPN23 were measured simultaneously by the methodology shown in Figure 2. SPN10 was measured with a particle number measurement system (APC489 plus; APC AVL LIST GmbH, Graz, Austria). Emissions were sampled from the CVS, and the larger particles over 2.5 μm were eliminated by a pre-classifier. After that, sampled emissions were introduced to a volatile particle remover (VPR) provided in the APC. In the VPR, sampled emissions were diluted by hot air to vaporize the volatile particles, and then the vaporized gases were oxidized at a catalytic stripper (CS) to avoid re-nucleation to particles. With these procedures, the volatile particles were removed, and only solid particles were contained in the exhaust of the VPR. The flow from the VPR was monitored with a particle number counter provided in the APC in which the 65% cutoff diameter (D65) was 10 nm, and the estimated 50% cutoff point (D50) was almost 7 nm, to measure SPN10. The particle counter had a detection efficiency of more than 90% with particles over 15 nm. Particles downstream of the VPR were also monitored by an additional PNC (488CPC AVL LIST GmbH, Graz, Austria) in which D50 was 23 nm to measure SPN23. The methodology adopted in this study meets the most recent requirements of PMP [26]. Background levels of SPN23 and SPN10 were on the order of 108 #/km throughout the experiments.
2.3. Tested Vehicles
The specifications of the tested vehicles are listed in Table 1. Six vehicles (two DPF diesel vehicles and four PFI gasoline vehicles) were tested in total. All the vehicles were manufactured for the Japanese market. PFI-2 is a small car category peculiar to the Japanese market, with an engine displacement below 0.66 L. PFI-3 is a hybrid car having a relatively small motor and battery (3.6 Ah). In the case of tests with PFI-3, the initial state of charge (SOC) was controlled by the preconditioning cycle to make the delta SOC in the test to be within 5%. PFI-4 is also a compact car but has a larger gross vehicle weight (GVW) and an engine with a larger displacement. DPF-1 and DPF-2 are diesel vehicles equipped with a DPF and a urea selective catalytic reduction (SCR) system to reduce NOx emissions. All vehicles except DPF-2 are passenger cars; DPF-2 is a commercial vehicle with a GVW below 3.5 t.
2.4. AFR Estimation Method
The real-time AFR was estimated from the CO2, CO and THC concentrations at the tailpipe via the following procedure. The combustion process in the engine was assumed to be a simplified chemical reaction described by:
CxHy + n (O2 + AN2) → aCO2 + bCO + cH2O + dO2 + eCxHy + AnN2
In (R-1), it was assumed for simplicity, that neither CO2 nor H2O was contained in fresh air, and the combustion emissions were only CO2, CO, H2O and unburned fuel. Furthermore, it was assumed that nitrogen was contained only in air as nitrogen molecules and did not react with other molecules. In this case, the AFR can be expressed as:
where mair-comp is the required mass of air to achieve complete combustion, and mfuel is the mass of fuel. They can be expressed respectively as:
From (R-1), the following equations can be obtained using atomic balances of C, H and O atoms, where:
Defining Exhaust moles in (R-1) as
the CO2, CO and THC concentrations at the tailpipe can be expressed as:
From Equations (4) to (10), n can be obtained as:
In this study, A = 3.773, x = 7, and y =1.85 (gasoline vehicles) and 1.90 (diesel vehicles) were used to calculate the AFR. In the case of a gasoline vehicle, AFR is 14.7 if the combustion is stoichiometric.
3. Results and Discussion
3.1. Gaseous Emissions
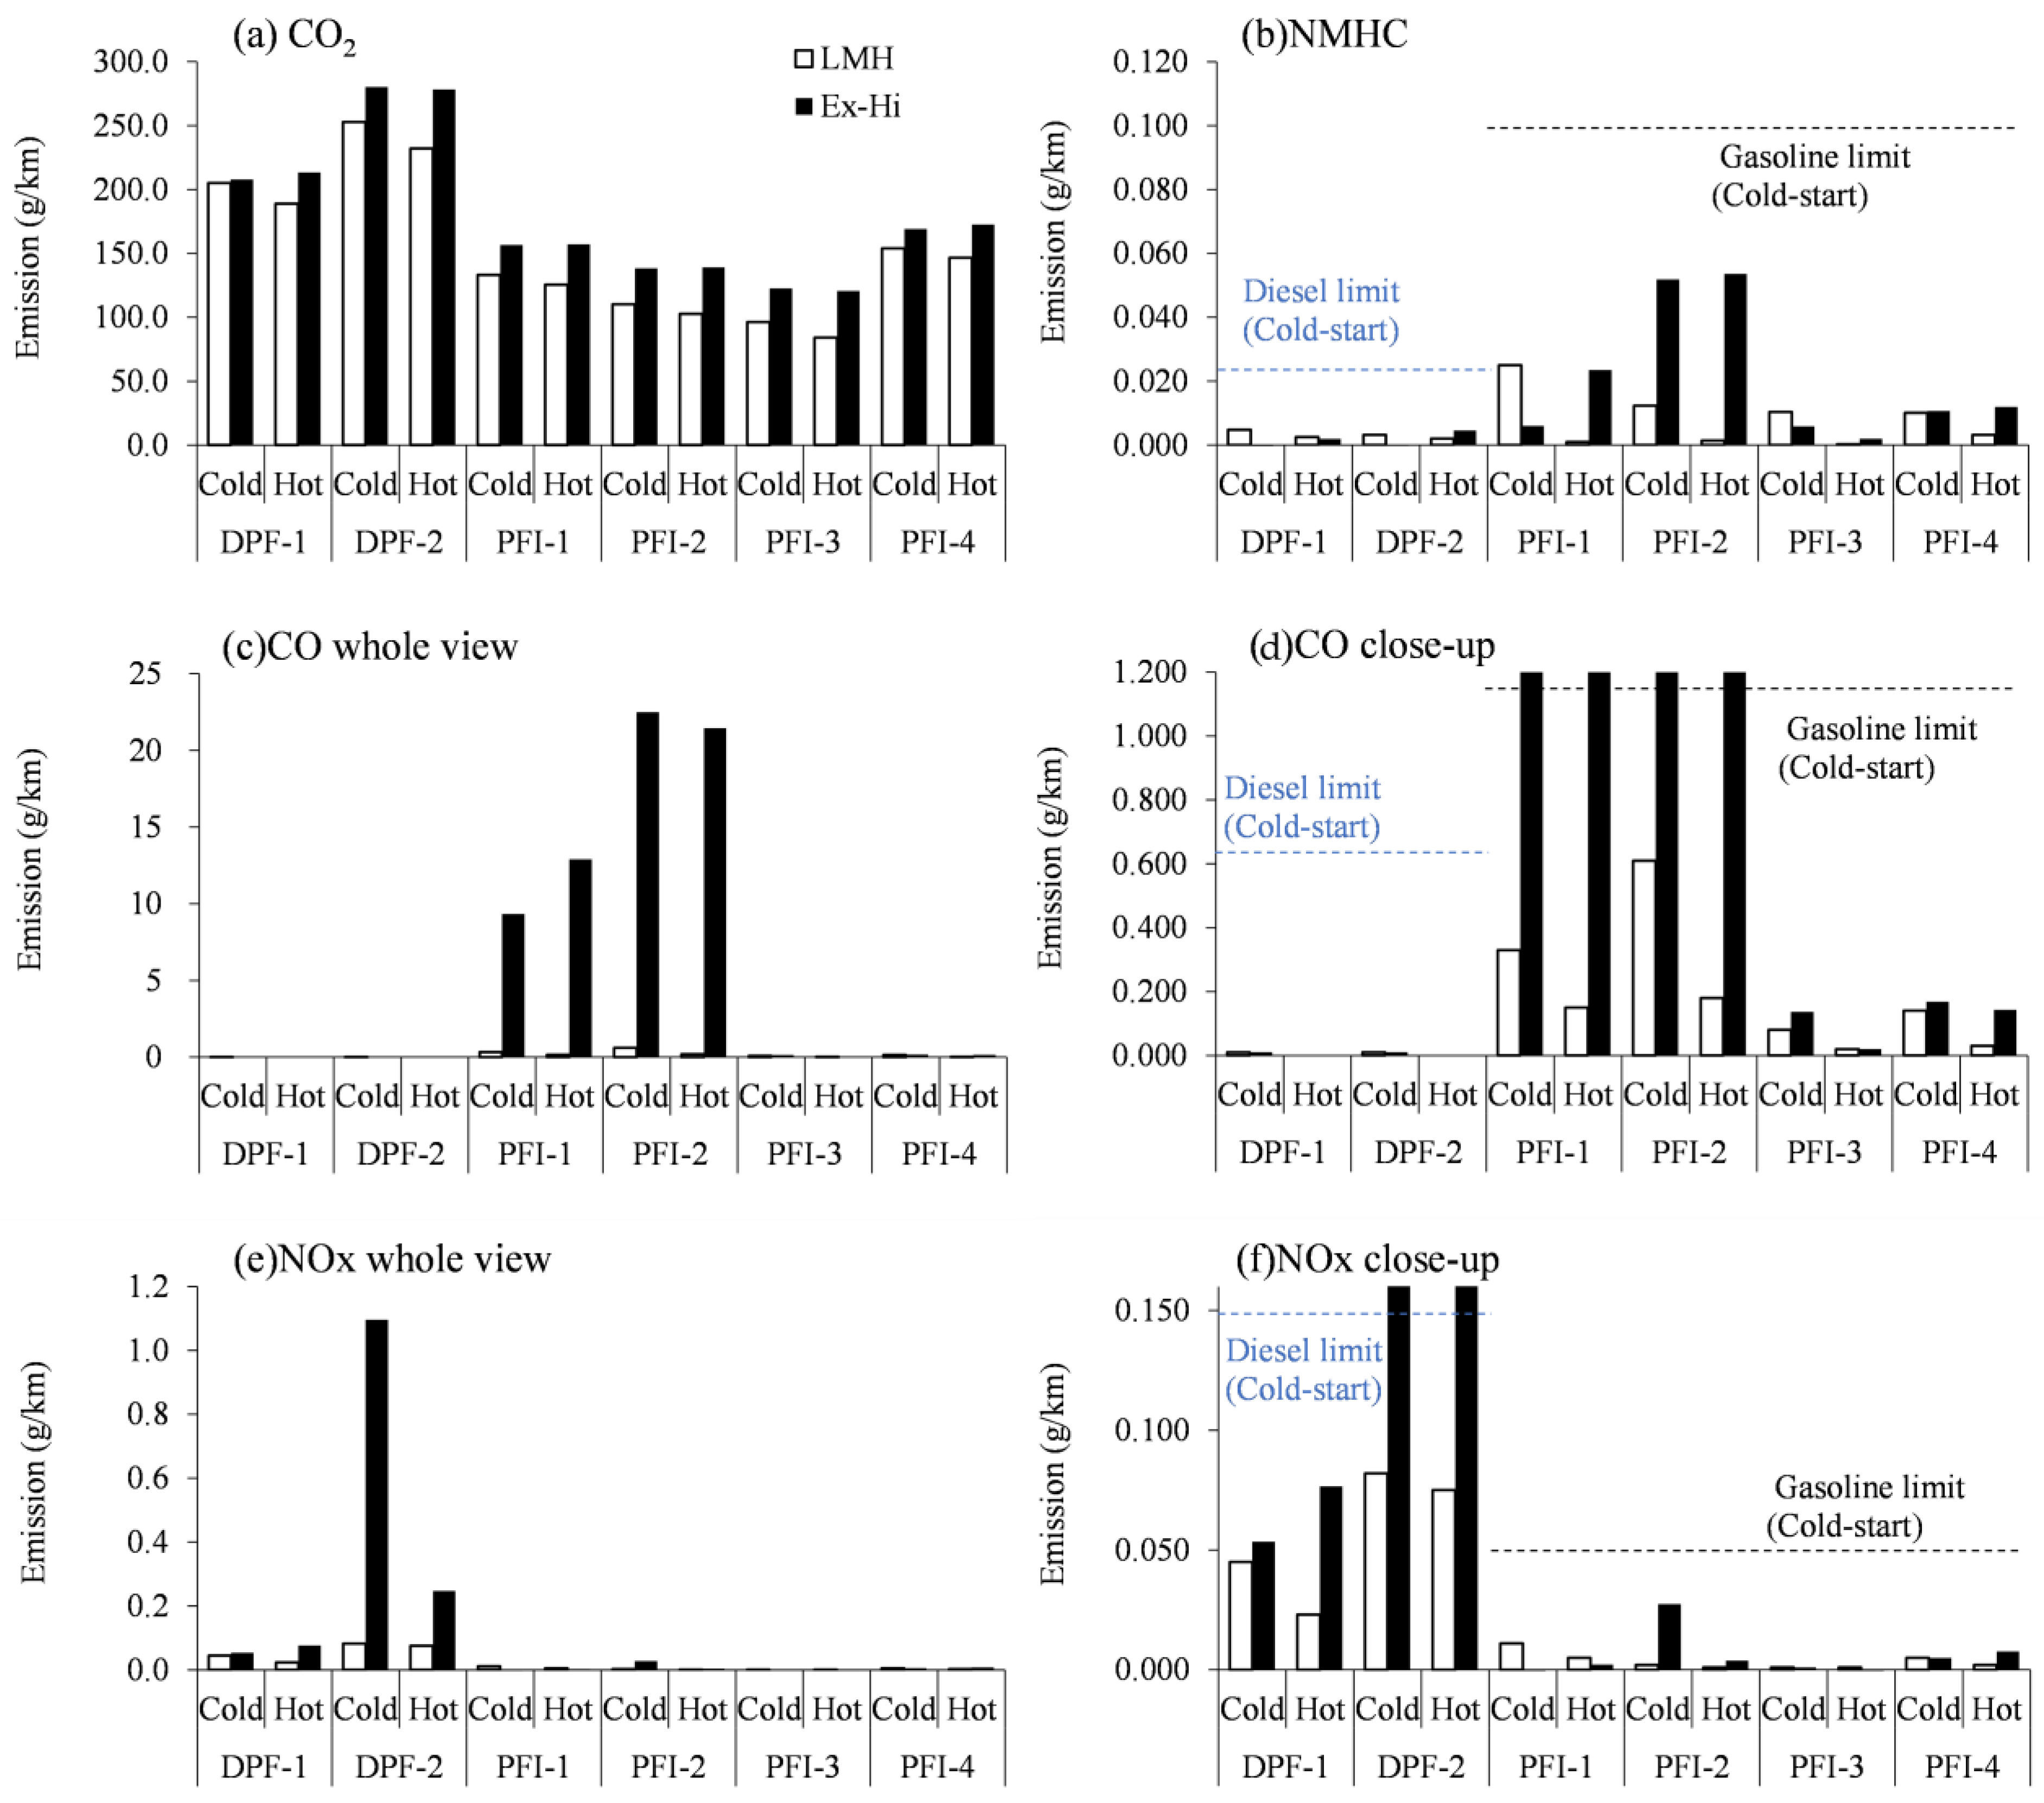
Gaseous emissions from all vehicles are summarized in Figure 3. The results are shown as emissions per km. The Japanese certification limits for NMHC, CO and NOx for gasoline and diesel passenger cars are also shown in Figure 3. As for CO2 emissions, all vehicles exhibited similar properties, namely, higher emissions in the cold-start mode than in the hot mode and higher emissions in the Ex-hi phase than in the LMH phases. These properties are due to higher loads in the cold-start mode and the Ex-hi phase. The DPF diesel vehicles (DPF-1 and DPF-2) exhibited higher CO2 than the gasoline vehicles. This was due to their heavier GVW than the gasoline vehicles and was not because of the different engine types. CO2 emissions from PFI-1 and PFI-2 were lower than the other vehicles because of their lower GVW. It is noted that the GVW of PFI-3 was relatively heavy and almost the same as that of PFI-4; however, the CO2 emissions were almost the same level as PFI-1 and PFI-2. This is because PFI-3 was a hybrid vehicle.
CO emissions from the diesel vehicles were quite low. The emissions from all the vehicles were below the regulatory limits in the LMH phases; however, PFI-1 and PFI-2 exhibited tremendously increased emissions in the Ex-hi phase. Emissions from PFI-1 and PFI-2 were more than ten times higher than the regulatory limits. DPF-2 exhibited quite high NOx emissions in the Ex-hi phase, although DPF-1 and gasoline vehicles were well below the regulatory limits.
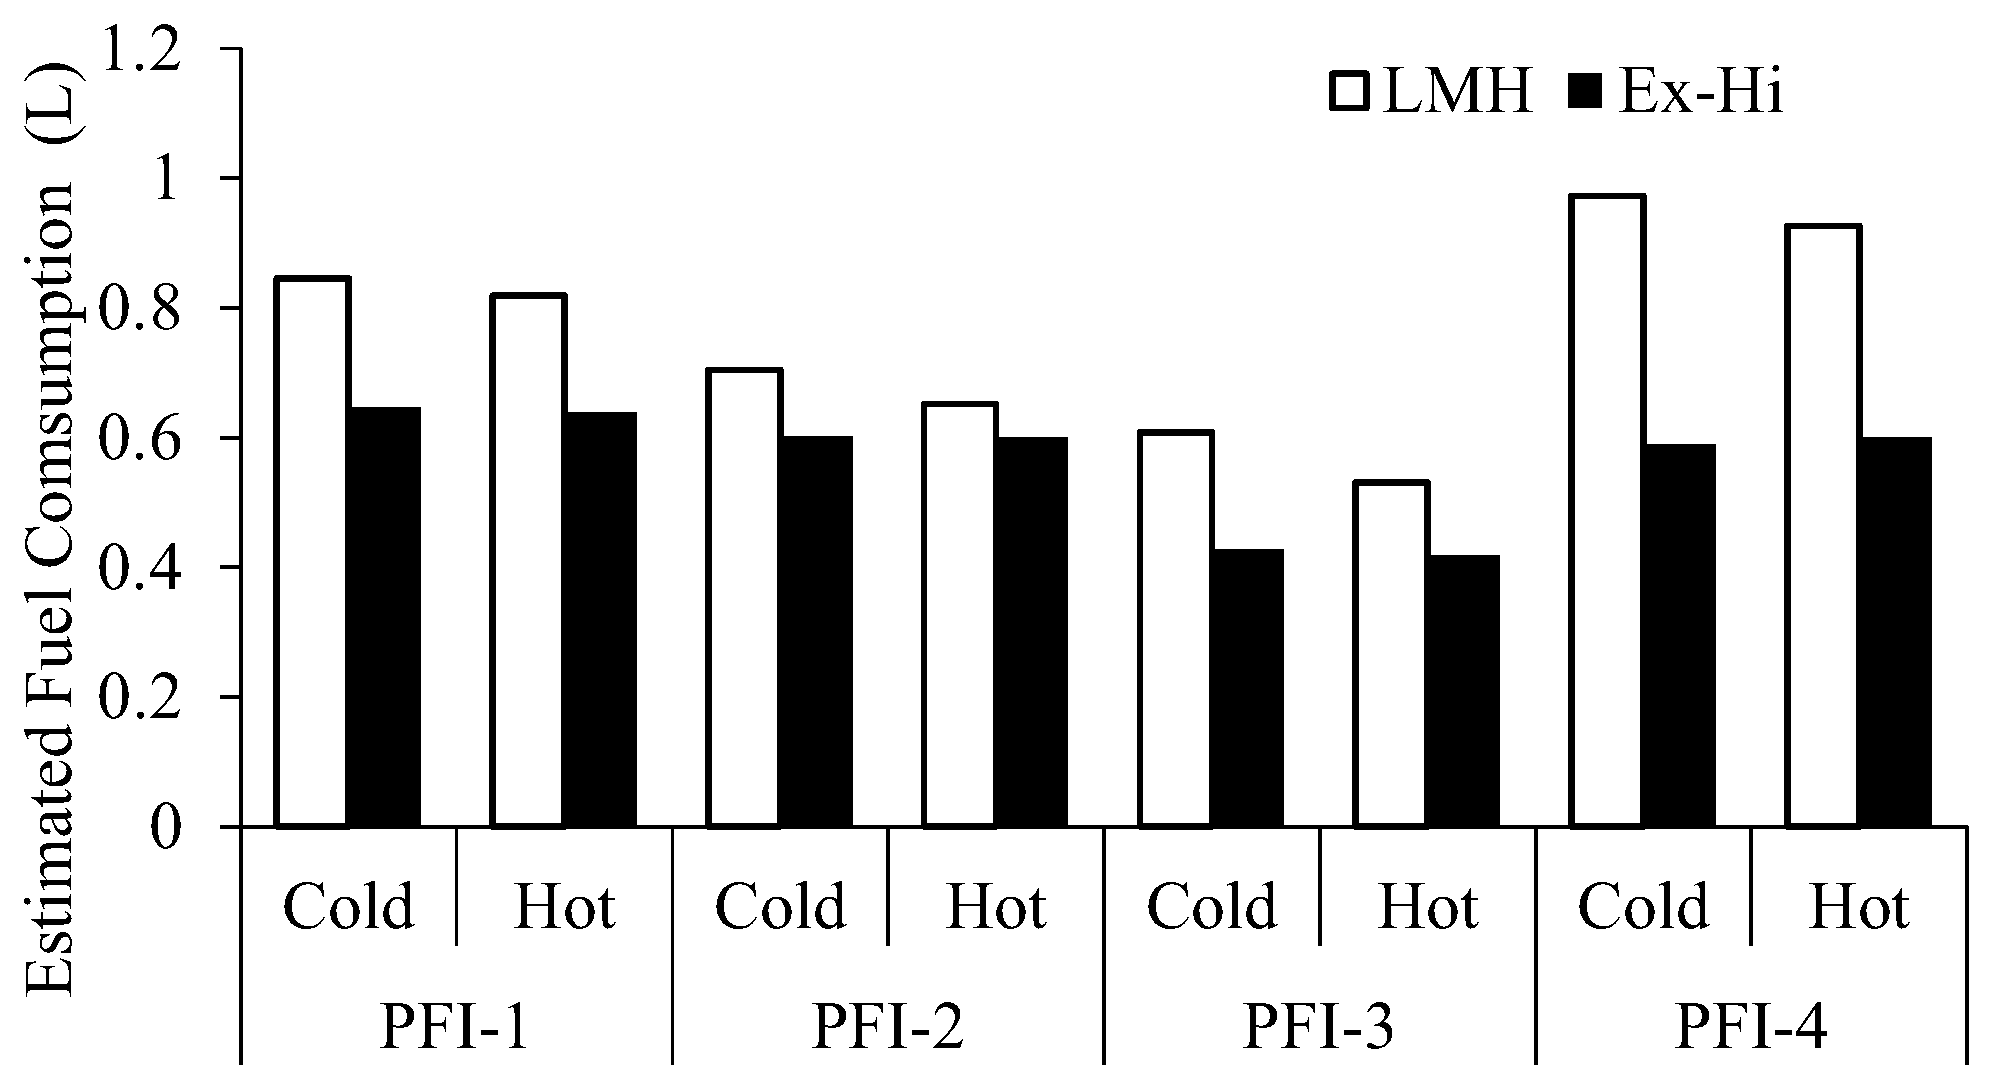
Figure 4 shows the estimated fuel consumption of the gasoline vehicles (PFI-1 to PFI-4) in the LMH and Ex-hi phases. The fuel consumption was estimated under the assumptions that the fuel density was 0.727 kg/L and the C/H ratio was 1.85. The properties shown in the LMH phase were similar to those of CO2 emission shown in Figure 3. However, the fuel consumption in the Ex-hi phase showed different properties to CO2 emissions. The fuel consumption of PFI-1 and PFI-2 in the Ex-hi phase was higher than that of PFI-4 which had the highest GVW. This was due to quite high CO emissions in the Ex-hi phase. The higher ratio of CO in the emissions indicated lower relative heat release in the engine combustion, resulting in requiring more fuel to drive the vehicle in the Ex-hi phase. The fuel consumption of PFI-3 was the lowest in both the LMH and Ex-hi phases. This is because PFI-3 was a hybrid vehicle, and using regenerative energy reduced the fuel consumption and CO2 emissions.
3.2. PM and PN
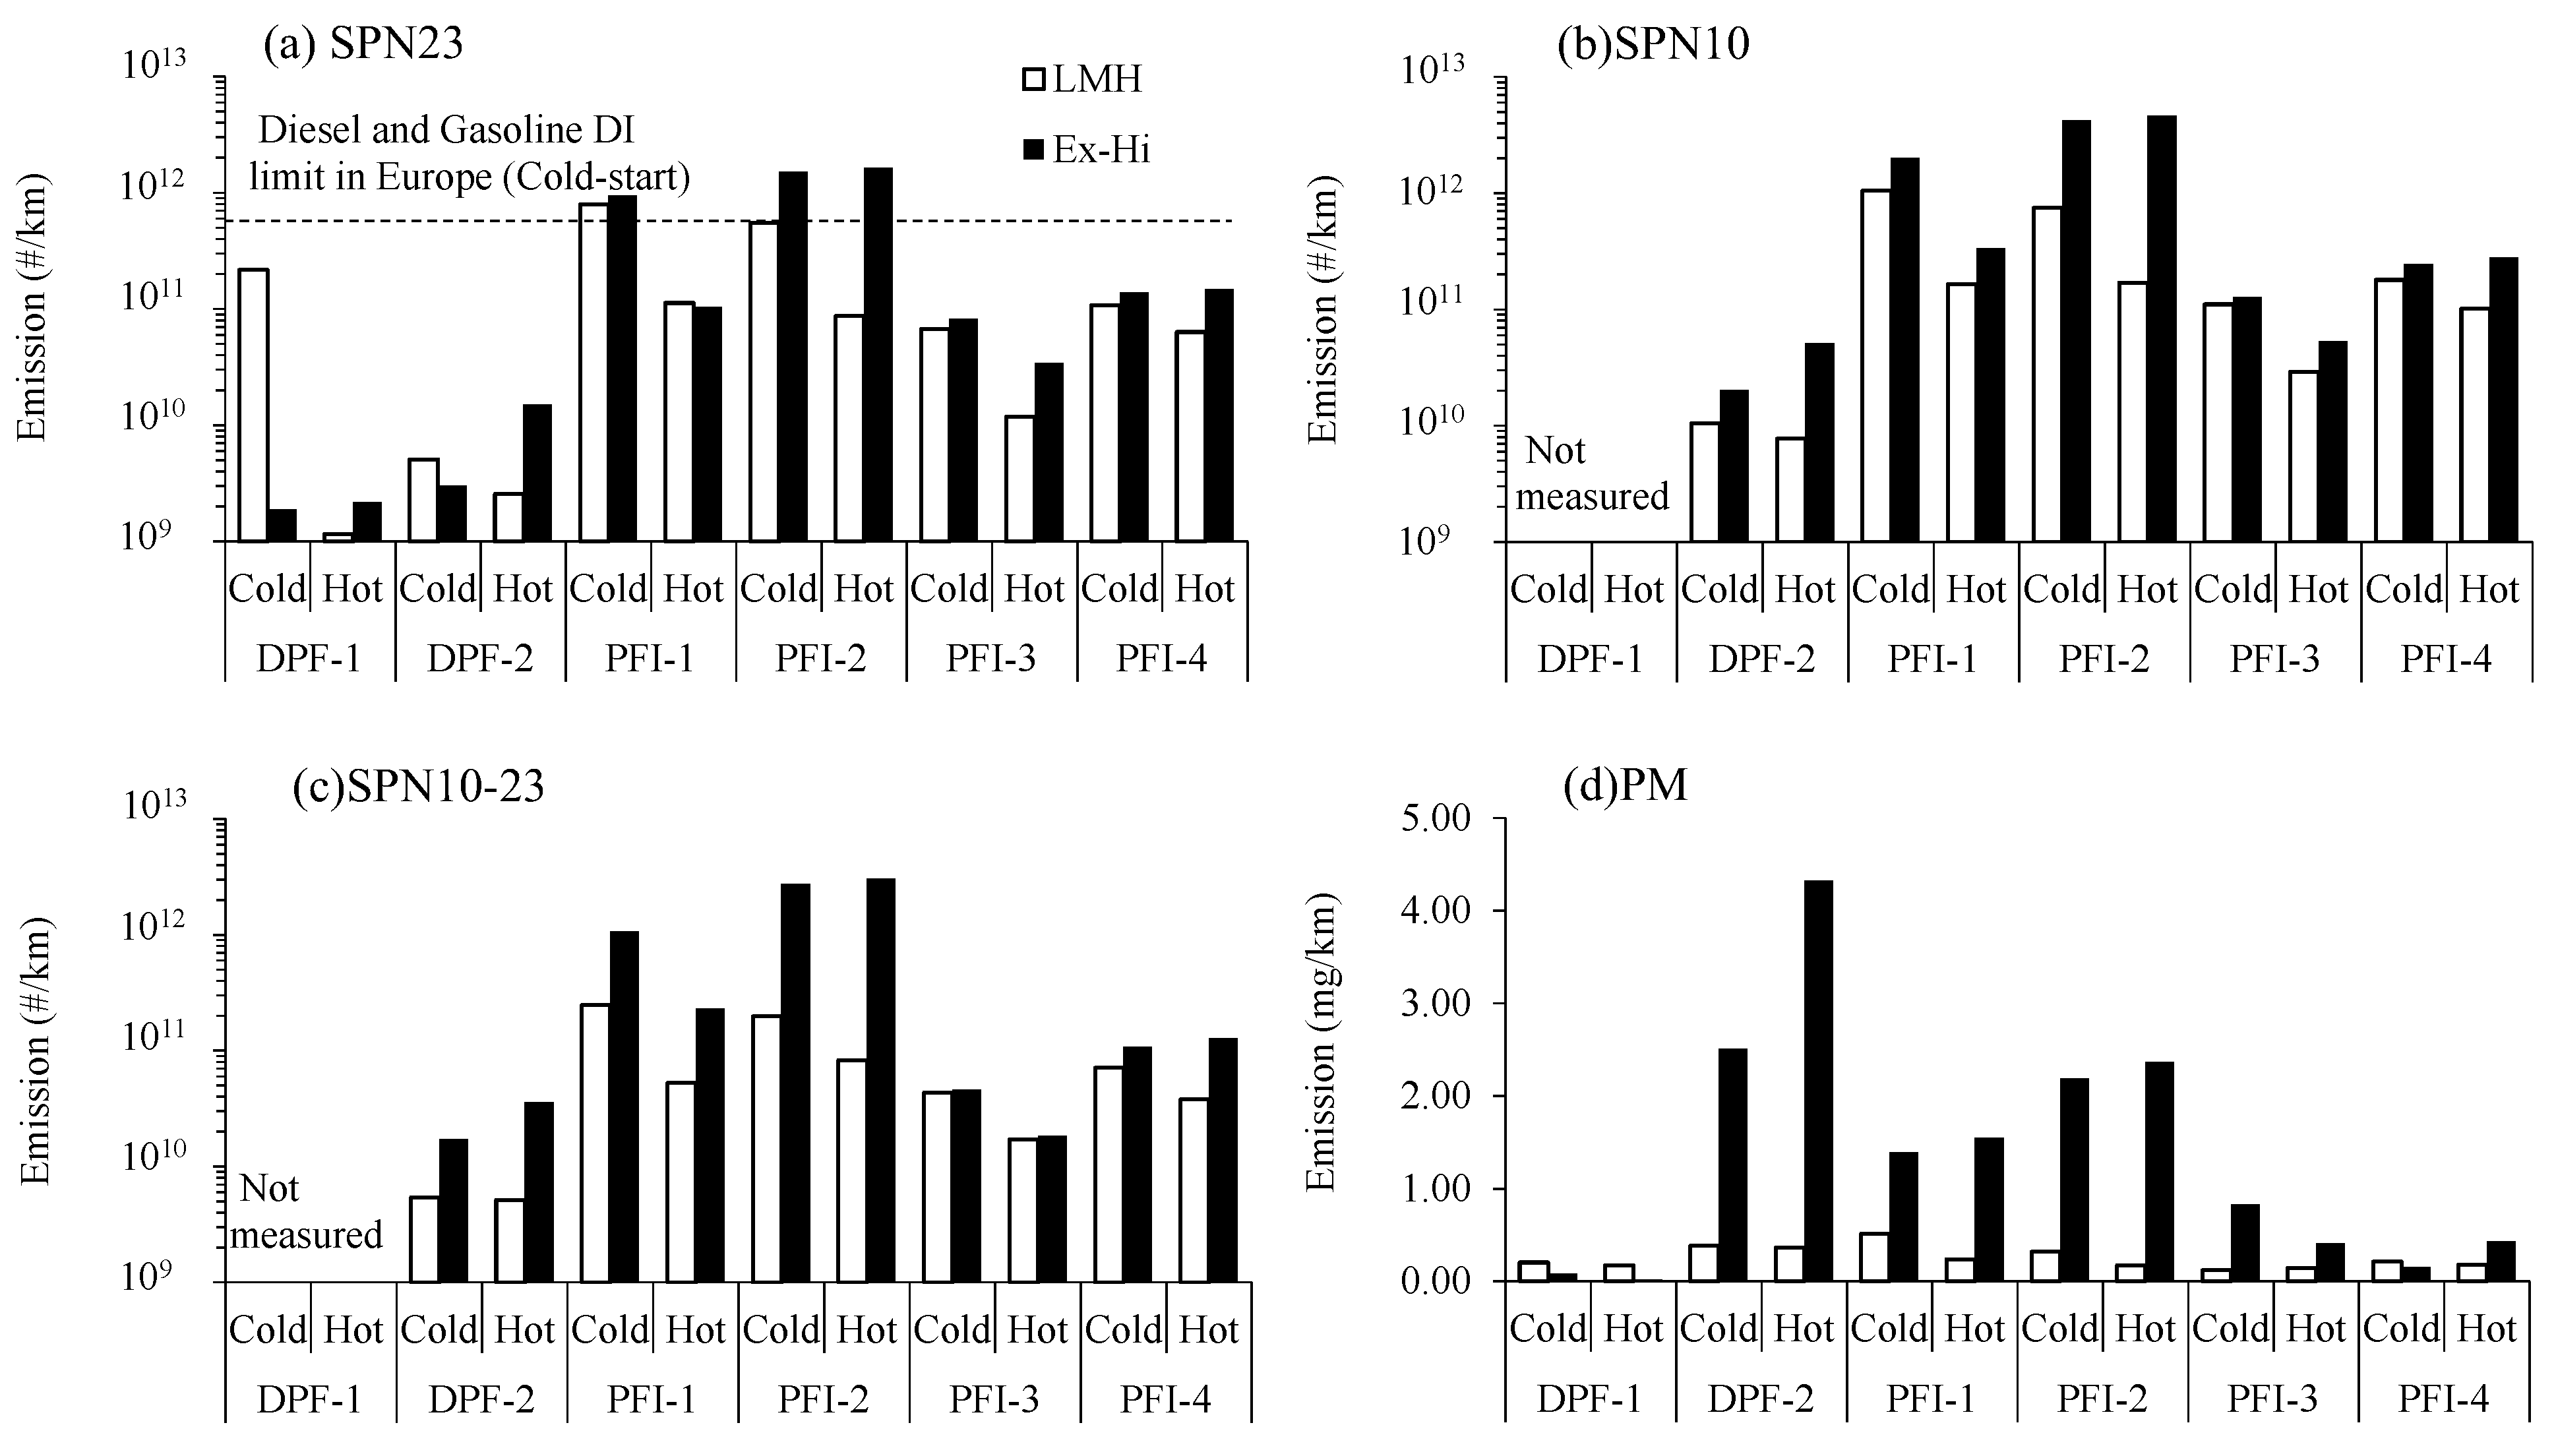
Total emissions of SPN23, SPN10, and SPN10-23 (SPN23 subtracted from SPN10) of the WLTC cold-start and hot-start modes are shown in Figure 5. In the figure, SPN in the LMH and the Ex-hi phases are shown separately. SPN10 was not measured in the case of DPF-1 due to mechanical trouble. SPNs from the diesel vehicles were lower than those from the gasoline PFI vehicles in both the LMH and Ex-hi phases, except for the cold-start in the LMH phase of DPF-1. This property is consistent with our former observation [27], suggesting that the DPFs reduce SPN effectively to a lower level than the PFI gasoline vehicles. The increased SPN observed with DPF-1 was due to higher emissions in the warming-up process in the cold-start mode. It is noted that PFI-1 and PFI-2 exhibited higher SPN23 than the regulatory limit in the cold-start mode even in the LMH phase and much higher in the Ex-hi phase. The emission characteristics of SPN10 were almost the same as those of SPN23.
Higher SPN10-23 emissions in the Ex-hi phase than in the LMH phase were observed in all vehicles except for DPF-1 for which SPN10 was not measured. Among them, DPF-2, PFI-1 and PFI-2 exhibited somewhat higher emissions of SPN10-23 in the Ex-hi phase. This suggests that SPN emissions in the Ex-hi phase were mainly SPN10-23.
PM emissions in the Ex-hi phase were higher than those in the LMH phase, except for DPF-1 and PFI-4. Comparing the SPN and PM results, no clear correlation with each other was observed.
3.3. Analysis of High NOx and SPN10-23 Emissions Observed with DPF-2
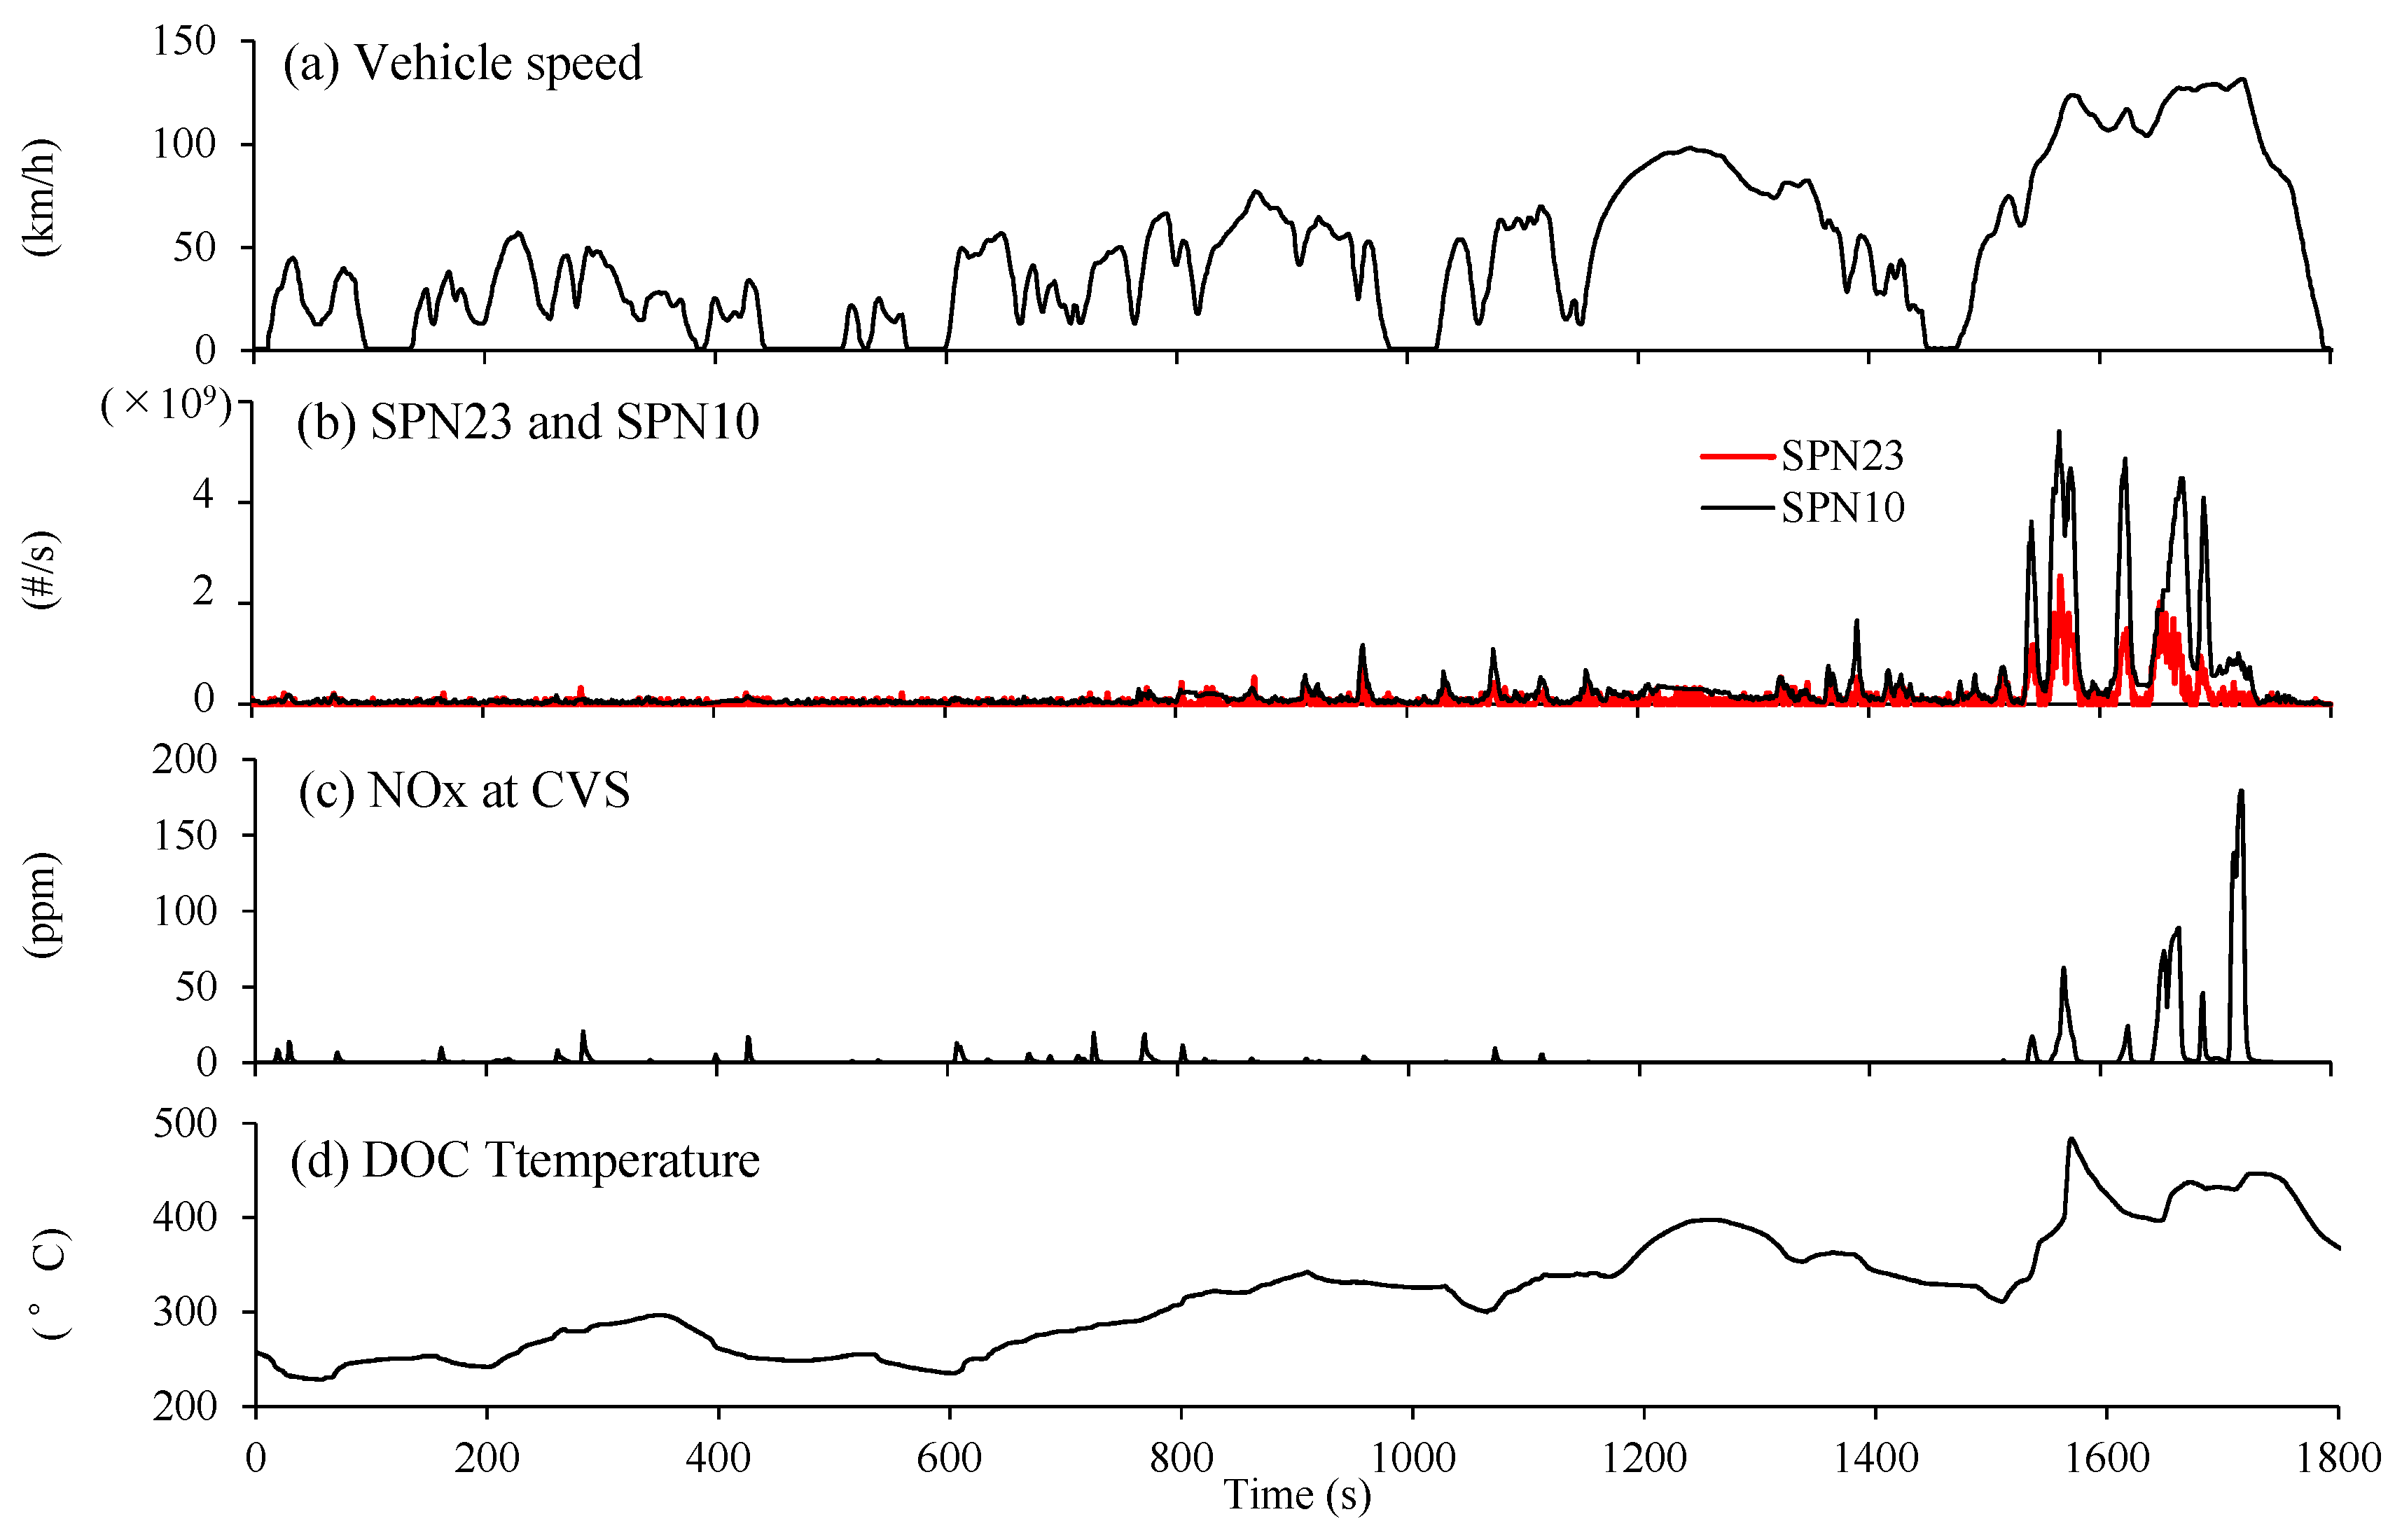
DPF-2 exhibited quite high emissions of NOx in the Ex-hi phase. Figure 6 indicates real-time profiles of SPN, NOx and the diesel oxidation catalyst (DOC) temperature along with vehicle speed in the full WLTC mode cold-start condition with DPF-2. The DOC was located upstream of the DPF, and the temperature was acquired from the OBD signal. High peaks of SPN were observed in the Ex-hi phase, and NOx was also mainly emitted in the Ex-hi phase. The DOC temperature increased gradually from almost 250 °C to more than 400 °C in the Ex-hi phase. Increased SPN and NOx emissions were observed when the DOC temperature was more than 400 °C. In this region, SPN10 was much higher than SPN23, suggesting that the size of emitted particles was mainly 10 to 23 nm. These properties may have been due to a passive regeneration that occurred in the Ex-hi phase. Our former study observed increased emission of SPN10-23 during such regeneration [27]. The extremely higher emissions of NOx can be explained by an interruption of NOx reduction in the urea SCR system due to the high temperature caused by the regeneration.
3.4. Analysis of High CO and SPN Mmissions Observed with PFI-2
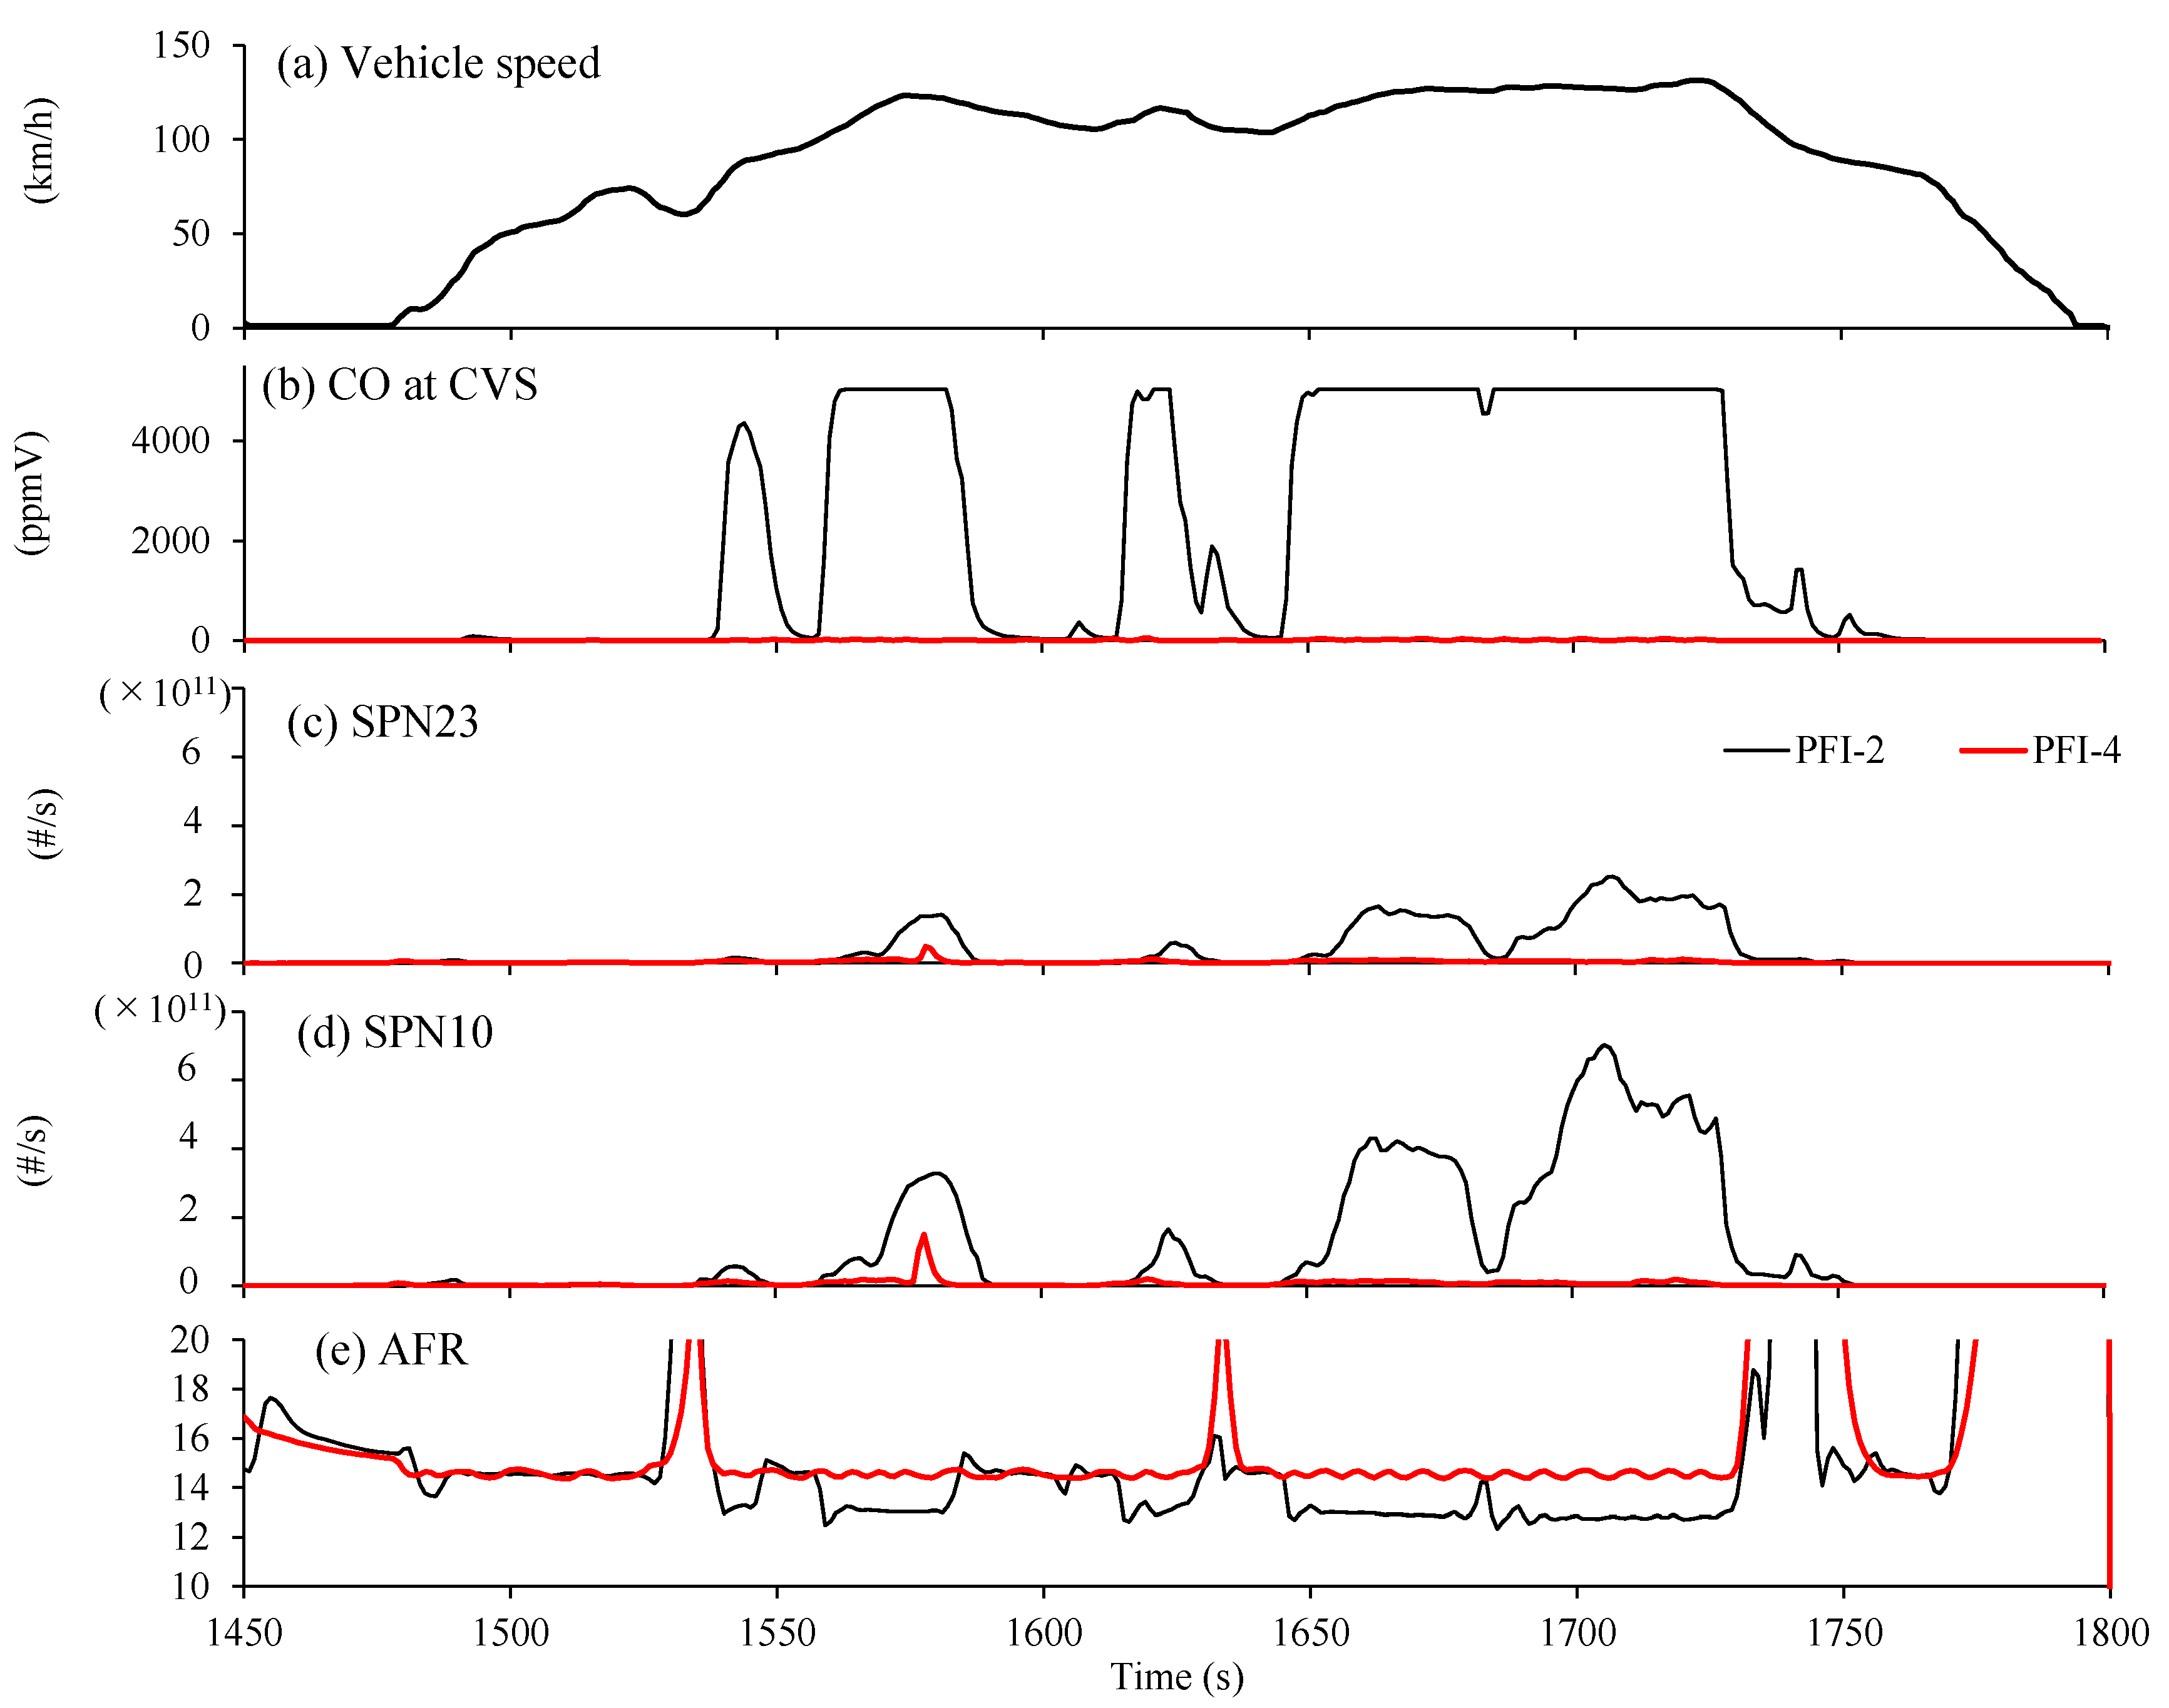
Figure 7 shows SPN, CO at the CVS and AFR with PFI-2, which exhibited quite high CO emissions, and PFI-4, which did not exhibit increased CO emissions, in the Ex-hi phase. Almost no peaks were observed in the LMH phase for all emissions shown in Figure 7. The CO concentration from PFI-2 exceeded 5000 ppmV, which is the maximum detectable limit of the gas analyzer. On the other hand, CO from PFI-4 was almost zero throughout the phase. It should be noted that the CO emission profiles shown in Figure 7 were obtained with the gas analyzer for direct exhaust gas measurements. The gas analyzer used for the measurement of total emissions shown in Figure 3 was different from that, suggesting that the range shown in Figure 7 has no effect on the total CO emissions shown in Figure 3. SPN10 and SPN23 were emitted at almost the same timing as the appearance of increased CO emission. These emissions can be explained by AFR. PFI-2 often exhibited AFR below 14.7 where the load was quite high. And the timings of the increased emissions synchronous with the appearance of AFR below 14.7, suggesting a stoichiometric condition. On the other hand, AFR of PFI-4 was always almost 14.7, and no increased CO or SPN emissions were observed. The engine displacement of PFI-4 was relatively high, and PFI-4 was powerful enough to run the Ex-hi phase without an enrichment control. PFI-2 is a small car and is not powerful; therefore, enrichment control is essential to run the Ex-hi phase. The enrichment control resulted in quite high CO and SPN emissions. As discussed in the next section, similar features to PFI-2 were observed in PFI-1, which was also equipped with a relatively small engine. These observations indicated that vehicles with relatively small gasoline engines have a possibility to exhibit quite high CO and SPN emissions caused by the enrichment control in high-load off-cycle operation.
3.5. Comparisons of PN23 and PN10 Observed with PFI-1 in Cold-Start Mode
Figure 8 shows CO and THC, SPN23 and SPN10, and the AFR observed with PFI-1, which exhibited similar PN and CO emissions properties to PFI-2, in the cold-start mode. Generally, two types of emissions can be observed in Figure 8. One is the emission due to the enrichment control discussed in Section 3.3 which appeared in the Ex-hi phase. The other is emission due to warming up processes observed at the beginning of the test. As for CO and THC, both types of increased emissions were observed; however, the emission properties were different. THC was mainly emitted at the beginning of the test, whereas CO was emitted due to the enrichment control that appeared in the Ex-hi phase. At the beginning of the cold-start test, the temperature of the catalyst was not high enough to decompose unburned fuel, and therefore, the unoxidized fuel and incompletely oxidized fuel were detected as THC. On the other hand, in the Ex-hi phase, the catalyst temperature was high enough to decompose the unburned fuel; however there was no oxygen to oxidize the CO to CO2 due to the enrichment control. Thus, the emissions in this region were mainly CO.
A similar feature was observed in the results of SPN23 and SPN10. At the beginning of the test, both SPN23 and SPN10 emissions increased; however in the Ex-hi phase, only the SPN23 emission increased. This feature was also observed with PFI-2 in the cold-start mode. This suggested that PN emissions during the warming-up process were mainly particles over 23 nm; on the other hand, the size of particles emitted due to the enrichment control was mainly 10 to 23 nm. The nature of these emissions was unclear; however, the mechanism seems to differ from those observed with CO and THC.
3.6. Emission Properties with PFI3 in Cold-Start Mode including the Ex-hi Phase
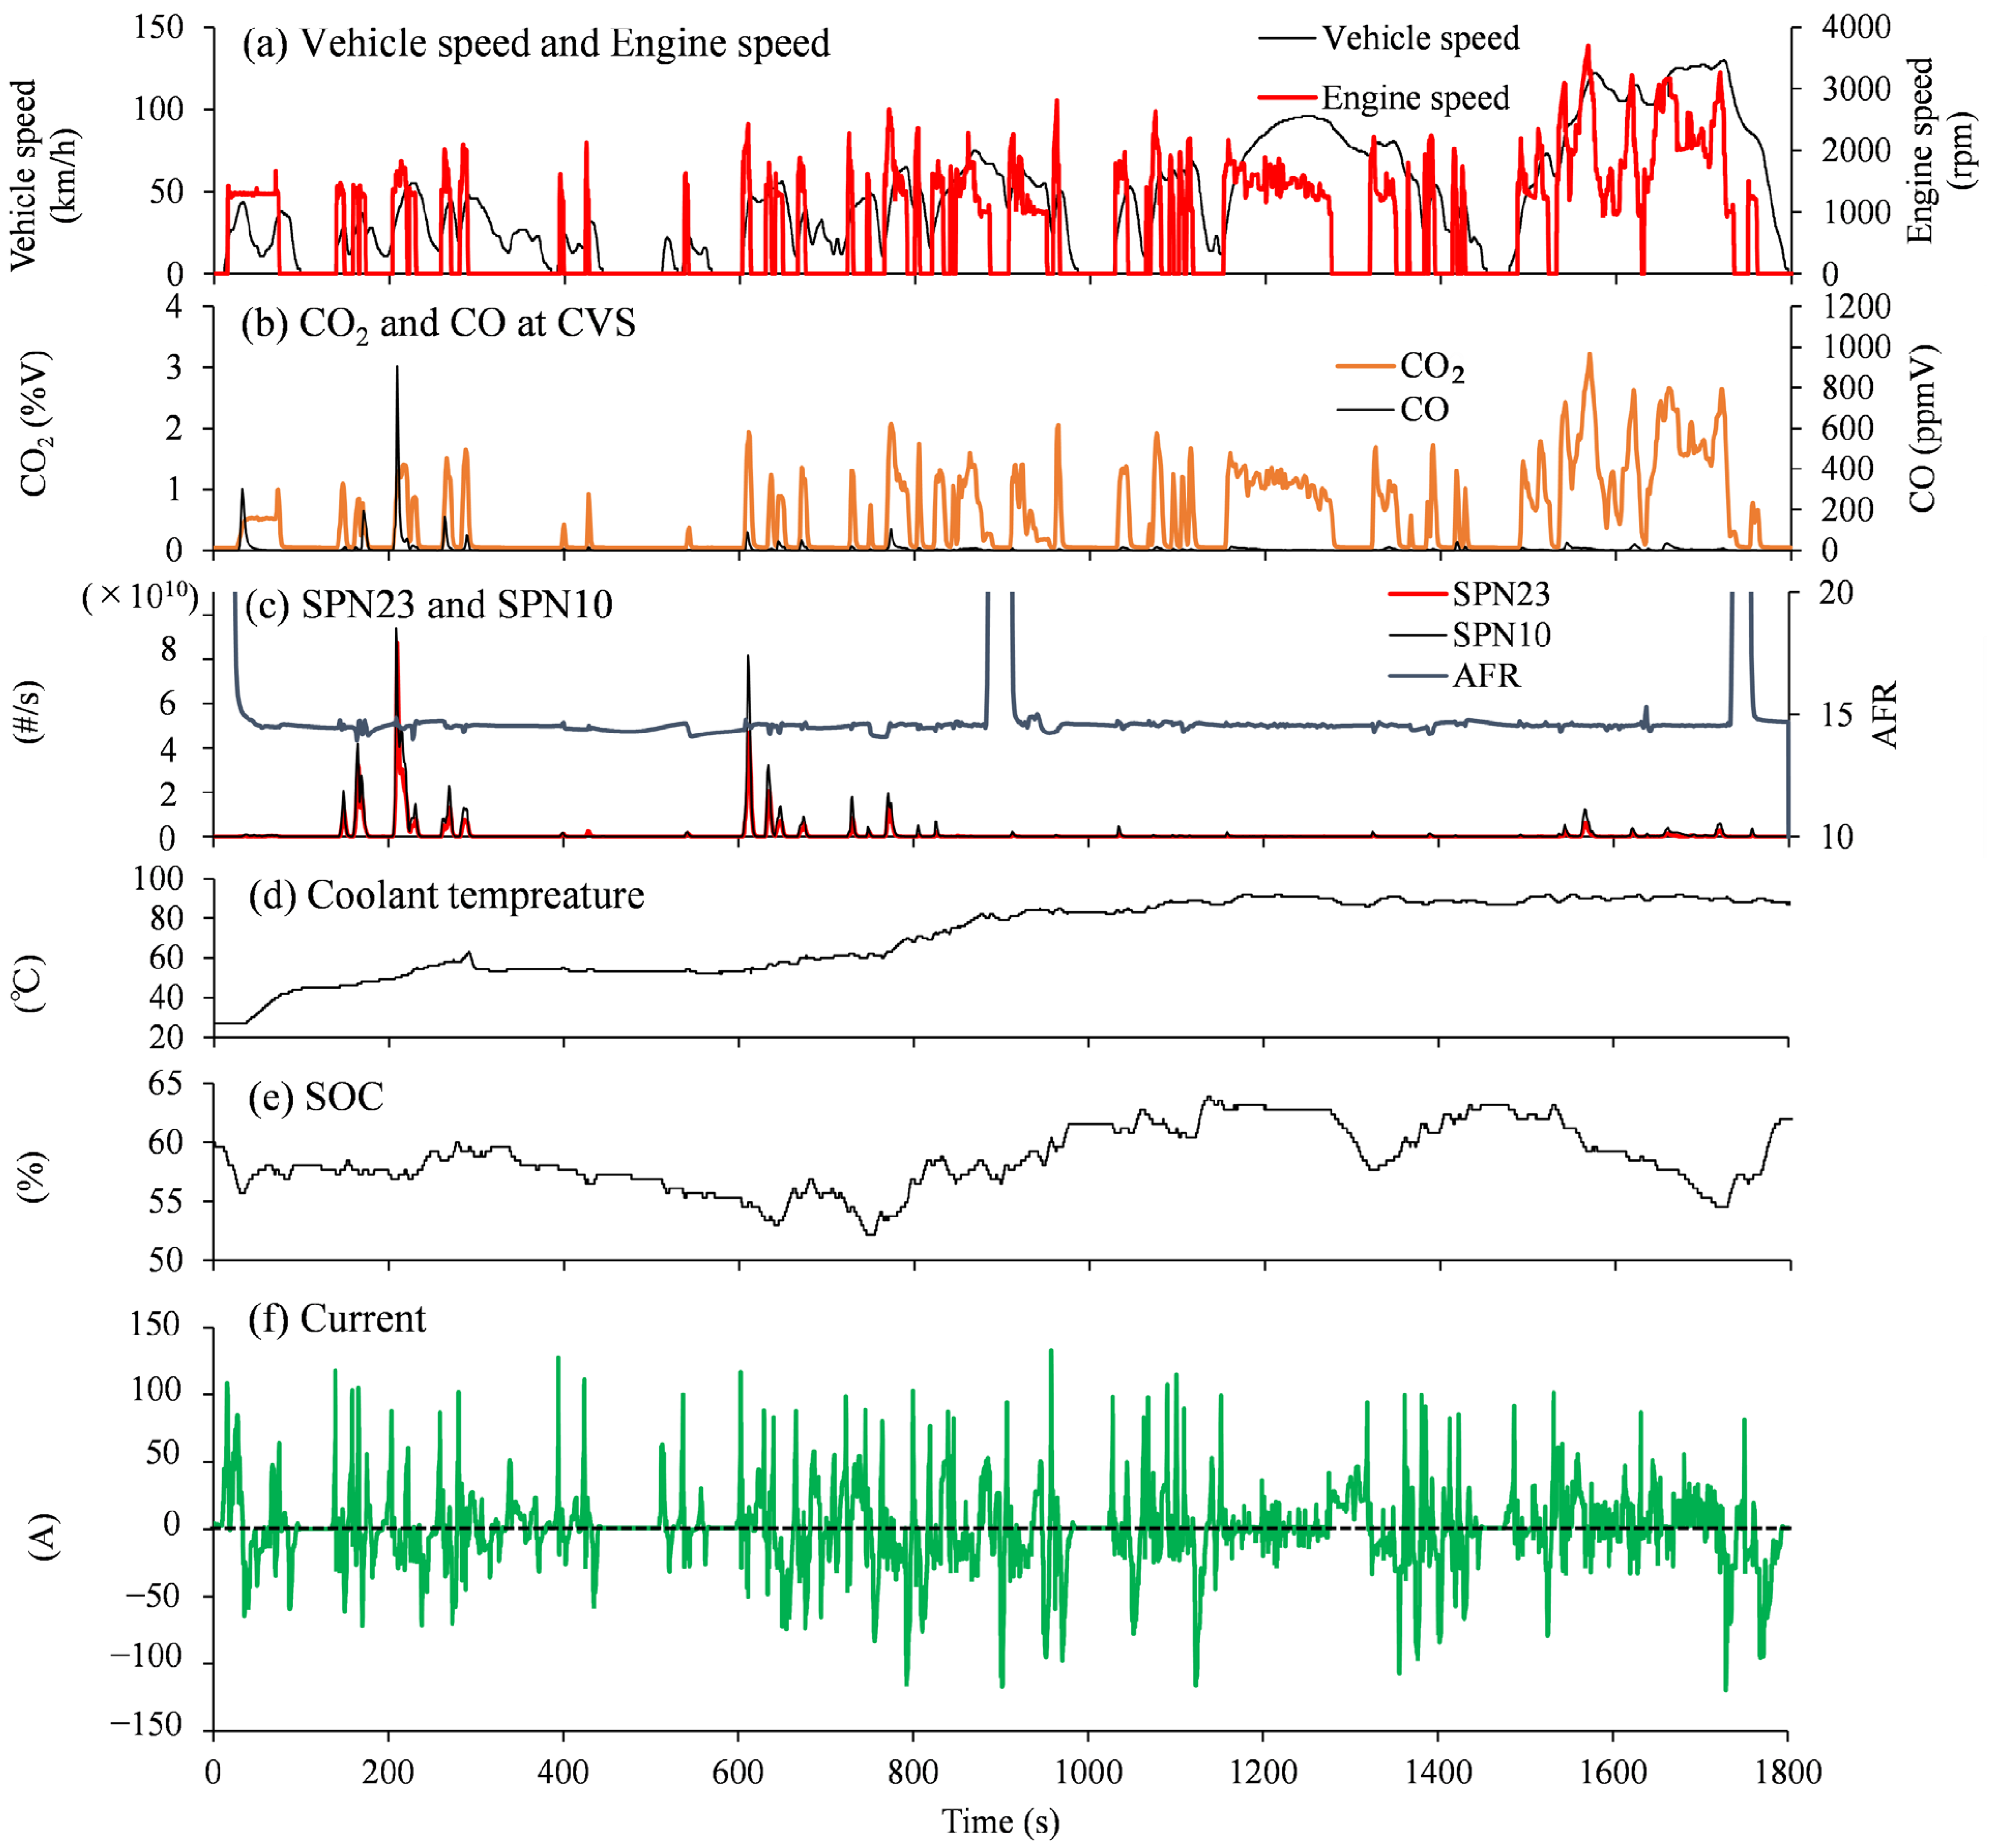
As shown in Figure 3, PFI-3 exhibited the lowest CO2 emissions because it is a hybrid vehicle. Figure 9 shows profiles of the vehicles speed and engine speed, CO2 and CO emissions, SPN23 SPN10 and AFR, the coolant temperature, the SOC, and the current in the motor with PFI-3 in the cold-start mode. The delta SOC during the test was within 5%, suggesting that the electric energy of PFI-3 was almost balanced. Even in a warming-up process in the cold-start mode, the engine stopped intermittently. Engine operation was observed mainly in the acceleration period. The shape of the CO2 emission profile was almost the same as the engine speed. CO emissions were observed when the engine started during the warming-up process. SPN10 and SPN23 peaks were observed in the acceleration phase when the engine coolant temperature was below 80 °C. Increased CO, SPN10 and SPN23 emissions during the warming-up process were observed in all tested vehicles; however the period of increased emissions lasted longer with PFI-3 than the other vehicles (see Figure 8 and Figure 9). This is because PFI-3 is a hybrid vehicle and it took a longer time to warm up because the engine stopped frequently.
In the Ex-hi phase, the AFR was almost 14.7. CO and SPN emission peaks due to the enrichment control were not observed. In this period, the motor current was steadily positive except during deceleration. The SOC decreased while driving. These observations suggest that the motor assist reduced the engine load, and the enrichment control did not appear.
4. Conclusions
Regulated gas emissions, SPN10, and SPN23 were measured in the full WLTC mode and the Japanese certification cycle with two diesel passenger vehicles equipped with a DPF and urea SCR system and four gasoline PFI passenger vehicles. Emissions in the Ex-hi phase can be assumed to be off-cycle emissions, because all the tested vehicles were developed for the Japanese market and were not certified in such a high-load condition.
According to the results of total emissions, all the vehicles exhibited higher emissions of CO2 in the Ex-hi phase than in the LMH phase. The hybrid vehicle exhibited the lowest CO2 emission among the tested vehicles, including diesel vehicles. In the results of real -time observation of the emissions from the diesel vehicles, increased NOx and SPN10-23 emissions were observed in the Ex-hi phase. These increased emissions may be due to the occurrence of passive regeneration resulting in stopping of the urea SCR system. The small gasoline PFI vehicles exhibited increased CO and SPN emissions in the Ex-hi phase. The timings at which the increased emissions appeared were synchronous with the appearance of the enrichment control. This indicated that small vehicles sometimes exhibit enrichment control in off-cycle high load conditions because their engines are not powerful enough to run without the enrichment control. As a result, quite high emissions of CO and SPN10-23 appeared.
Increased CO and SPN emissions were also observed in the warming-up process in the cold-start mode test with the PFI vehicles; however, the properties were different from the emissions due to the enrichment control. Increased THC was also observed in the warming-up process because the catalyst temperature was not high enough to oxidize unburned fuel. In addition to that, SPN emissions in the warming-up process were mainly particles over 23 nm, whereas the SPN emissions in the enrichment control were mainly particles between 10 and 23 nm.
The duration of increased CO and SPN emissions that appeared during the warming-up process in the cold-start mode was longer in the case of the hybrid vehicle, because the engine often stopped even in the warming-up process. In the high load operation condition, the appearance of the enrichment control was avoided due to electric motor assist.
These observations indicated the possibility of increased CO and SPN10-23 emissions in high-load off-cycle operation both with diesel vehicles equipped with DPFs and small gasoline vehicles. In the case of diesel vehicles, the emissions are due to the passive regeneration. In the case of small gasoline vehicles, the emissions are the result of enrichment control.
Author Contributions
Conceptualization, H.Y., H.K. and Y.K.; methodology, H.Y., T.K. and H.K.; validation, Y.K; formal analysis, Y.K.; investigation, H.Y.; data curation, T.K. and H.K.; writing—original draft preparation, H.Y.; writing—review and editing, Y.K.; supervision, H.K. All authors have read and agreed to the published version of the manuscript.
Funding
Part of this research was funded by the Ministry of the Environment, Japan.
Data Availability Statement
Data used in this study can be provided from the corresponding author. according to a request by e-mail.
Conflicts of Interest
The authors declare no conflict of interest.
References
- World Health Organization Regional Office for Europe. Review of Evidence on Health Aspects of Air Pollution—REVIHAAP Project Technical Report; WHO/EURO:2013-4101-43860-61757; WHO Regional Office for Europe: København, Denmark, 2021. [Google Scholar]
- Dockery, D.W.; Pope, C.A., 3rd; Xu, X.; Spengler, J.D.; Ware, H.; Fay, M.E.; Ferris, B.G., Jr.; Speizer, F.E. An Association between Air Pollution and Mortality in Six U.S. Cities. N. Engl. J. Med. 1993, 329, 1753–1759. [Google Scholar] [CrossRef]
- Matti Maricq, M.; Podsiadlik, D.H.; Chase, R.E. Size distributions of motor vehicle exhaust PM: A comparison between ELPI and SMPS. Aerosol Sci. Technol. 2000, 33, 239–260. [Google Scholar] [CrossRef]
- Andersson, J.; Giechaskiel, B.; Munoz-Bueno, R.; Dilara, P. Particle Measurement Programme (PMP): Light-Duty Inter-Laboratory Correlation Exercise (ILCE LD)—Final Report; EUR 22775 EN, JRC37386; Publications Office of the European Union: Luxembourg, 2007. [Google Scholar]
- Giechaskiel, B.; Dilara, P.; Andersson, J. Particle measurement programme (PMP) light-duty inter laboratory exercise: Repeatability and reproducibility of the particle number method. Aerosol Sci. Technol. 2008, 42, 528–543. [Google Scholar] [CrossRef]
- Andersson, J.; Mamakos, T.; Martini, G.; Giechaskiel, B. Particle Measurement Programme (PMP) Heavy-Duty Inter-Laboratory Correlation Exercise (ILCE HD) Final Report; EUR 24561EN; Publications Office of the European Union: Luxembourg, 2010. [Google Scholar]
- Giechaskiel, B.; Mamakos, A.; Andersson, J.; Dilara, P.; Martini, G.; Schindler, W.; Bergmann, A. Measurement of automotive nonvolatile particle number emissions within the European legislative framework: A review. Aerosol Sci. Technol. 2012, 46, 719–749. [Google Scholar] [CrossRef]
- Yamada, H.; Goto, Y. Optimization of PM Measurements with a Number Counting Method. SAE Int. J. Engines 2009, 1, 1179–1185. [Google Scholar] [CrossRef]
- Yamada, H.; Inomata, S.; Tanimoto, H. Particle and VOC Emissions from Stoichiometric Gasoline Direct Injection Vehicles and Correlation between Particle Number and Mass Emissions. Emiss. Control. Sci. Technol. 2017, 3, 135–141. [Google Scholar] [CrossRef]
- Worrton, D.R.; Isaacman, G.; Gentner, D.R.; Dallmann, T.R.; Chan, A.W.H.; Ruehl, C.; Kirchstetter, T.W.; Wilson, K.R.; Harley, R.A.; Goldstein, A.H. Lubricating oil dominates primary organic aerosol emissions from motor vehicles. Environ. Sci. Technol. 2014, 48, 3698–3706. [Google Scholar] [CrossRef]
- Quiros, D.C.; Zhang, S.; Sardar, S.; Kamboures, M.A.; Eiges, D.; Zang, M.; Jung, H.S.; Mccarthy, M.J.; Chang, M.C.O.; Ayala, A.; et al. Measuring particulate emissions of light duty passenger vehicles using integrated particle size distribution (IPSD). Environ. Sci. Technol. 2015, 49, 5618–5627. [Google Scholar] [CrossRef]
- Oberdörster, G.; Oberdörster, E.; Oberdörster, J. Nanotoxicology: An emerging discipline evolving from studies of ultrafine particles. Environ. Health Perspect. 2005, 113, 823–839. [Google Scholar] [CrossRef]
- Fujitani, Y.; Kumar, P.; Tamura, K.; Fushimi, A.; Hasegawa, S.; Takahashi, K.; Tanabe, K.; Kobayashi, S.; Hirano, S. Seasonal differences of the atmospheric particle size distribution in a metropolitan area in Japan. Sci. Total Environ. 2012, 437, 339–347. [Google Scholar] [CrossRef]
- Bakand, D.; Hayes, A.; Dechsakultorn, F. Nanoparticles: A review of particle toxicology following inhalation exposure. Inhal. Toxicol. 2012, 24, 125–135. [Google Scholar] [CrossRef]
- UNECE. Regulations No. 83 (Uniform Provisions Concerning the Approval of Vehicles with Regard to the Emission of Pollutants According to Engine Fuel Requirements). Available online: http://www.unece.org/trans/main/wp29/wp29regs81-100.html (accessed on 10 February 2022).
- UNECE. Regulations No. 49 (Uniform Provisions Concerning the Measures to Be Taken against the Emission of Gaseous and Particulate Pollutants from Compression-Ignition Engines and Positive Ignition Engines for Use in Vehicles). Available online: http://www.unece.org/trans/main/wp29/wp29regs41-60.html (accessed on 10 February 2022).
- Platt, S.M.; El Haddad, I.; Pieber, M.; Zardini, A.A.; Suarez-Bertoa, R.; Clairotte, M.; Daellenbach, K.R.; Huang, R.J.; Slowwik, J.G.; Hellebust, S.; et al. Gasoline cars produce more carbonaceous particulate matter than modern filter-equipped diesel cars. Sci. Rep. 2017, 7, 4926. [Google Scholar]
- Lahde, T.; Giechaskiel, B.; Pavlovic, J.; Suarez-Bertoa, R.; Valverde, V.; Clairotte, M.; Martini, G. Solid particle number emissions of 56 light-duty Euro 5 and Euro 6 vehicles. J. Aerosol Sci. 2022, 159, 105873. [Google Scholar] [CrossRef]
- Giechaskiel, B.; Lahde, T.; Suarez-Bertoa, R.; Clairotte, M.; Grigoratos, T.; Zardini, A.; Perujo, A.; Martini, G. Particle number measurements in the European legislation and future JRC activities. Combust. Engines 2018, 174, 3–16. [Google Scholar] [CrossRef]
- Yang, Z.; Ge, Y.; Thomas, D.; Wang, X.; Su, S.; Li, H.; He, H. Real Driving particle number (PN) emissions from China-6 compliant PFI and GDI hybrid electrical vehicles. Atmos. Environ. 2019, 199, 70–79. [Google Scholar] [CrossRef]
- Engelmann, D.; Zimmerli, Y.; Czerwinski, J.; Bonsack, P. Real driving emissions in extended driving conditions. Energies 2021, 14, 7310. [Google Scholar] [CrossRef]
- Valverde Morales, V.; Bonnel, P. On-Road Testing with Portable Emissions Measurement Systems (PEMS)—Guidance Note for Light-Duty Vehicles; JRC109812; Publications Office of the European Union: Luxembourg, 2018. [Google Scholar]
- Yamada, H. Improving methodology of particulate measurement in periodic technical inspection with high-sensitivity techniques: Laser light scattering photometry and particle number method. Emiss. Control. Sci. Technol. 2019, 5, 37–44. [Google Scholar] [CrossRef]
- Bainschab, M.; Schriefl, M.A.; Bergmann, A. Partcle number measurements within periodic technical inspections: A first quantitative assessment of the influence of size distributions and the fleet emission reduction. Atmos. Environ. X 2020, 8, 100095. [Google Scholar]
- Melas, A.; Selleri, T.; Suarez-Bertoa, R.; Biechaskiel, B. Evaluation of measurement procedures for solid particle number (SPN) measurements during the periodic technical inspection (PTI) of vehicles. Int. J. Environ. Res. Public Health 2022, 19, 7602. [Google Scholar] [CrossRef]
- Economic Commission for Europe, Inland Transport Committee, World Forum for Harmonization of Vehicle Regulations. Consolidated Resolution No. 7 Concerning Exhaust Ultra-Fine Particle Number Measurement for Heavy Duty Engines; ECE/TRANS/WP.29/1169; Economic Commission for Europe: Geneva, Switzerland, 2022. [Google Scholar]
- Yamada, H.; Inomata, S.; Tanimoto, H. Mechanisms of Increased Particle and VOC Emissions during DPF Active Regeneration and Practical Emissions Considering the Regeneration. Environ. Sci. Technol. 2017, 51, 2914–2923. [Google Scholar] [CrossRef]
Figure 1.
Schematic illustration of experimental setup.

Figure 2.
Details of measurement systems for SPN10 and SPN23.

Figure 3.
Total Emissions of CO2 (a), NMHC (b), CO (c), (d) and NOx (e), (f) in WLTC LMH and Ex-Hi mode (Cold and Hot).
Figure 3.
Total Emissions of CO2 (a), NMHC (b), CO (c), (d) and NOx (e), (f) in WLTC LMH and Ex-Hi mode (Cold and Hot).

Figure 4.
Estimated fuel consumptions of gasoline vehicles in LMH and Ex-hi phase.

Figure 5.
Total Emissions of SPN23 (a), SPN10 (b) SPN10-23 (c) and PM (d) in WLTC LMH and Ex-Hi mode (Cold and Hot).
Figure 5.
Total Emissions of SPN23 (a), SPN10 (b) SPN10-23 (c) and PM (d) in WLTC LMH and Ex-Hi mode (Cold and Hot).

Figure 6.
Real-time profile of vehicle speed (a), SPN23 and SPN10 (b), NOx at the CVS (c) and DOC temperature (d) with DPF-2 hot-start mode.
Figure 6.
Real-time profile of vehicle speed (a), SPN23 and SPN10 (b), NOx at the CVS (c) and DOC temperature (d) with DPF-2 hot-start mode.

Figure 7.
Real-time profile of vehicle speed (a), CO at the CVS (b), SPN23 (c), SPN10 (d) and AFR (e) with PFI-2 and PFI-4 in the Ex-hi phase of the hot-start mode.
Figure 7.
Real-time profile of vehicle speed (a), CO at the CVS (b), SPN23 (c), SPN10 (d) and AFR (e) with PFI-2 and PFI-4 in the Ex-hi phase of the hot-start mode.

Figure 8.
Real-time profile of vehicle speed (a), CO and THC at the CVS (b), SPN23 and SPN10 (c) and AFR (d) with PFI-1 cold-start mode including the Ex-hi phase.
Figure 8.
Real-time profile of vehicle speed (a), CO and THC at the CVS (b), SPN23 and SPN10 (c) and AFR (d) with PFI-1 cold-start mode including the Ex-hi phase.

Figure 9.
Real-time profile of vehicle speed and engine speed (a), CO2 and CO at the CVS (b), SPN23, SPN10 and AFR (c), coolant temperature (d), SOC (e), and motor current (f) with PFI-3 in the cold-start mode including the Ex-hi phase.
Figure 9.
Real-time profile of vehicle speed and engine speed (a), CO2 and CO at the CVS (b), SPN23, SPN10 and AFR (c), coolant temperature (d), SOC (e), and motor current (f) with PFI-3 in the cold-start mode including the Ex-hi phase.


Table 1.
Detailed specifications of tested vehicles.
| Car Name | DPF-1 | DPF-2 | PFI-1 | PFI-2 | PFI-3 | PFI-4 |
|---|---|---|---|---|---|---|
| Category | Mini-Van | Van | Compact | Small | Compact | Compact |
| Engine type | Diesel | Diesel | PFI | PFI | PFI Hybrid | PFI |
| Displacement (l) | 2.26 | 2.75 | 0.99 | 0.66 | 1.79 | 1.98 |
| Aftertreatment | DPF + SCR | DPF + SCR | TWC | TWC | TWC | TWC |
| GVW (t) | 2.4 | 3.2 | 1.3 | 1.1 | 1.7 | 1.8 |
| Transmission | 8A/T | 6A/T | CVT | CVT | CVT | CVT |
Disclaimer/Publisher’s Note: The statements, opinions and data contained in all publications are solely those of the individual author(s) and contributor(s) and not of MDPI and/or the editor(s). MDPI and/or the editor(s) disclaim responsibility for any injury to people or property resulting from any ideas, methods, instructions or products referred to in the content. |
© 2023 by the authors. Licensee MDPI, Basel, Switzerland. This article is an open access article distributed under the terms and conditions of the Creative Commons Attribution (CC BY) license (https://creativecommons.org/licenses/by/4.0/).
Share and Cite
MDPI and ACS Style
Yamada, H.; Kimura, T.; Konno, H.; Kondo, Y. Off-Cycle Emissions of Particle Number from Gasoline and DPF Diesel Passenger Cars in High-Load Conditions. Atmosphere 2023, 14, 732. https://doi.org/10.3390/atmos14040732
AMA Style
Yamada H, Kimura T, Konno H, Kondo Y. Off-Cycle Emissions of Particle Number from Gasoline and DPF Diesel Passenger Cars in High-Load Conditions. Atmosphere. 2023; 14(4):732. https://doi.org/10.3390/atmos14040732
Chicago/Turabian StyleYamada, Hiroyuki, Taichi Kimura, Hidenori Konno, and Yoshinori Kondo. 2023. "Off-Cycle Emissions of Particle Number from Gasoline and DPF Diesel Passenger Cars in High-Load Conditions" Atmosphere 14, no. 4: 732. https://doi.org/10.3390/atmos14040732
Note that from the first issue of 2016, this journal uses article numbers instead of page numbers. See further details here.