Article

Evaluation on the Forecast Skills of Precipitation and Its Influencing Factors in the Flood Season in Liaoning Province of China

1
Regional Climate Center of Shenyang, Liaoning Provincial Meteorological Administration, Shenyang 110016, China
2
Key Opening Laboratory for Northeast China Cold Vortex Research, China Meteorological Administration, Shenyang 110016, China
3
Liaoning Provencal Meteorological Administration, Shenyang 110016, China
4
Shenyang Central Meteorological Observatory, Liaoning Provincial Meteorological Administration, Shenyang 110016, China
5
Laboratory for Climate Studies, National Climate Center, China Meteorological Administration, Beijing 100081, China
*
Author to whom correspondence should be addressed.
Atmosphere 2023, 14(4), 668; https://doi.org/10.3390/atmos14040668
Submission received: 26 February 2023 / Revised: 24 March 2023 / Accepted: 30 March 2023 / Published: 31 March 2023
(This article belongs to the Special Issue Climate Change on Ocean Dynamics)

Abstract

:
To clarify the precipitation forecast skills of climate forecast operations in the flood season in Liaoning Province of China, this study examines the forecast accuracies of China’s national and provincial operational climate prediction products and the self-developed objective prediction methods and climate model products by Shenyang Regional Climate Center (SRCC) in the flood season in Liaoning. Furthermore, the forecast accuracies of the main influencing factors on the precipitation in the flood season of Liaoning are assessed. The results show that the SRCC objective methods have a relatively high accuracy. The European Centre for Medium-Range Weather Forecasts (ECMWF) sub-seasonal forecast initialized at the sub-nearest time has the best performance in June. The National Climate Center (NCC) Climate System Model sub-seasonal forecast initialized at the sub-nearest time, and the ECMWF seasonal and sub-seasonal forecasts initialized at the nearest time, perform the best in July. The NCC sub-seasonal forecast initialized at the sub-nearest time has the best performance in August. For the accuracy of the SRCC objective method, the more significant the equatorial Middle East Pacific sea surface temperature (SST) anomaly is, the higher the evaluation score of the dynamic–analogue correction method is. The more significant the North Atlantic SST tripole is, the higher the score of the hybrid downscaling method is. For the forecast accuracy of the main influencing factors of precipitation, the tropical Atlantic SST and the north–south anti-phase SST in the northwest Pacific can well predict the locations of the southern vortex and the northern vortex in early summer, respectively. The warm (clod) SST in China offshore has a good forecast performance on the weak (strong) southerly wind in midsummer in Northeast China. The accuracy of using the SST in the Nino 1+2 areas to predict the north–south location of the western Pacific subtropical high is better than that of using Kuroshio SST. The accuracy of predicting northward-moving typhoons from July to September by using the SST in the west-wind-drift area is better than using the SST in the Nino 3 area. The above conclusions are of great significance for improving the short-term climate prediction in Liaoning.

1. Introduction

Severe floods frequently occur in Northeast China, which may cause huge socio-economic losses [1,2], such as the flood in the Songliao River Basin in 1995, the flood in the Songneng River Basin in 1998, and the mega-flood in the Raoyang River Basin in 2022. In terms of short-term forecasts, a strong indication of the forthcoming flash flood could have been provided at least 2 days in advance based on the WRF-based HEC-HMS-simulated flood peak [3]. Additionally, the WRF model assimilating radar data and in situ weather stations showed very good predictive capability for rainfall timing and location, thus supporting accurate river flow peak forecasting with the hydrological model Continuum [4]. Liaoning Province is located in the southern part of Northeast China. The heavy rainfall in Liaoning is mostly concentrated in June–August, which is characterized by obvious locality, suddenness, and great difficulty in forecasting [5]. Climate change has already affected many extreme weather events and events in every region of the globe [6]. Therefore, precipitation forecasting in the flood season plays an important role in flood prevention and mitigation in Liaoning.
At present, the flood-season climate forecast operations in China mainly use a combination of dynamical climate models and statistical methods. The BCC_CSM model is a coupled atmosphere–ocean model developed by the National Climate Center (NCC) of China, and it has a good performance in simulating the precipitation and temperature in China but cannot predict the geopotential-height field well [7,8,9,10]. The European Centre for Medium-Range Weather Forecasts (ECMWF) model has a high level of forecasting [11,12]. The National Centers for Environmental Prediction (NCEP) model is not prominent in the regional precipitation forecast in China but performs well in the forecast of precipitation spatial distribution [13]. In the evaluation of the dynamical climate models, Chi et al. [14] used the prediction score (PS) method to assess the performance of the BCC_CSM model in predicting the pre-flood-season precipitation in the Fujian Province of China, and they found that there are large inter-annual variations in the PS score. Chen [15] used the anomaly coefficient method to evaluate the precipitation forecast of DERF2.0 (Dynamical Extension Regional Forecast Model Version 2.0), which was also developed by NCC, and found that the prediction effect has obvious monthly variations. Ma et al. [16] evaluated the multiscale forecasting skill of the NCEP Climate Forecast System version 2 (NCEP_CFSv2) and found that the forecasting skill is not gradually improved with the shortening of forecast leading time. Instead, there is an optimal forecast leading time. Furthermore, de Andrade, F.M. et al. [17] assessed sub-seasonal global precipitation hindcast quality from all sub-seasonal to seasonal (S2S) prediction project models. The deterministic forecast quality of weekly accumulated precipitation was verified using different metrics and hindcast data considering lead times up to 4 weeks. The model’s rank showed ECMWF, UKMO, and KMA as the top scoring models. Zhang et al. [18] comprehensively evaluated the S2S precipitation forecasts from the NMME-2 dataset over the contiguous United States (CONUS) and during the study period from 1982 to 2011. Three aspects of precipitation forecast capabilities are compared and analyzed: bias, skill scores, and the ability to predict extreme precipitation events. The results show that the forecast biases are not sensitive to lead times but are seasonally dependent of all NMME-2 models.
Meanwhile, they found the model has poor performance in precipitation forecasting. Therefore, meteorologists have developed some precipitation forecast methods based on model interpretation applications. For example, we may obtain predictors through slowly varying fields, and the predictors can take into account both the contemporaneous factors derived from climate model forecasts and the preceding factors derived from the preceding observation information. This scheme is known as the hybrid downscaling method [19,20]. The dynamic–analogue correction method is also used to correct the climate forecast error in the Yangtze River Basin [21], Northeast China [22] and North China [23]. For some extreme precipitation events, the dynamic–analogue correction method shows some positive forecasting skills and can accurately forecast the stations of extreme precipitation [24].
China is located in the East Asian monsoon region, and has numerous climatic factors [25]. The early summer precipitation in Northeast China is mainly influenced by the northeast cold vortex (NCV), while the midsummer precipitation is mainly influenced by the western Pacific subtropical high (WPSH) [26,27], summer monsoon, and northward-moving typhoons [28,29,30]. Scholars often used the precedent signals of the underlying surface to predict the above-mentioned atmospheric circulation factors of the flood-season precipitation in Northeast China. The positive phase of the North Atlantic sea surface temperature (SST) anomaly tripole in spring can lead to the enhanced blocking high on the northwest side of Lake Baikal and the strengthening of an NCV in early summer, which finally results in the more-than-normal precipitation in Northeast China [31]. Taking 45° N as the boundary, the NCVs are divided into northern NCVs and southern NCVs. The SST factors of the northern NCV is the northwest Pacific north–south anti-phase SST preceding March and the tropical southeast Pacific SST preceding May; the SST factor of southern NCV is the North Atlantic SST tripole preceding April [32]. When the Kuroshio SST is significantly low, the persistence of ocean temperature anomalies can lead to a northeasterly anomaly on the northwestern side of the WPSH and a southwesterly anomaly on the southeastern side of the NCV, thus weakening the WPSH and intensifying the NCV [33]. The decade variations of SST in the Nino 1+2 areas coincide with the variations in the western Pacific subtropical high [34]. The SST anomalies in the Nino 3 area in late winter and early spring in the preceding period and the SST anomalies in the west-wind-drift area in late spring and early summer are conducive to the genesis of northward-moving typhoons [35].
In terms of climate prediction, at present, there has been little work conducted on comparing the operational precipitation products, model interpretation and application products, and the climate model forecasting skills. There has also been little work conducted to analyze and evaluate the accuracy of using underlying surface signals to predict the atmospheric circulation factors of flood precipitation. Therefore, this study evaluates the accuracy of China’s national and provincial climate operational forecast products, objective forecast methods, and climate model products in predicting the flood-season precipitation in Liaoning Province. Furthermore, the forecast accuracy of the main influencing factors of flood-season precipitation is investigated. We hope this study can help clarify the forecast skills of each method, thus providing a reference for short-term climate forecast operations.
The remainder of this paper is organized as follows: Section 2 introduces the data and methods. In Section 3, the evaluation of the accuracy of flood-season precipitation forecasts in Liaoning is presented. Monthly precipitation forecasts are analyzed in Section 4. The accuracy of the objective methods is presented in Section 5. An evaluation of the main influencing factors of flood-season precipitation is discussed in Section 6. Finally, we summarize the whole text and provide a short conclusion in Section 7.

2. Data and Methods

2.1. Data

The daily precipitation observation data in the flood-season (June–August) of Liaoning used in this study is provided by the Chinese National Meteorology Information Center. The data period is from 2017 to 2022. Meanwhile, the monthly precipitation (June–August) and the flood-season precipitation derived from the NCC and the Shenyang Regional Climate Center (SRCC) operational products, and that derived from the objective forecast methods (hybrid downscaling, dynamic–analogue correction, and machine learning), are evaluated.
The seasonal and the sub-seasonal to seasonal (S2S) climate model outputs from June to August during 2017–2022 are also used in this study. The models include the European Centers for Medium-Range Weather Forecasts (ECMWF), National Climate Center Climate System Model (NCC_CSM), and National Centers for Environmental Forecast Climate Forecast System version 2 (NCEP_CFSv2). The S2S model forecasts can be downloaded from http://10.1.64.154/thredds/fileServer, accessed on 25 March 2023. The seasonal model forecasts can be downloaded from ftp://KVUC2CKU:tkgcSC@10.1.64.235/MODESdatasetV2/, accessed on 25 March 2023.

2.2. Methods

2.2.1. Prediction Score

The precipitation forecast accuracy is represented by the PS score, which is calculated as follows.
First, the forecast of precipitation anomaly is judged to be correct or not correct station by station, and the total number of stations with correct forecast is counted as N0.
Second, we determine station by station whether the forecasts of first-order anomalies (precipitation anomalies ≥ 20% and ≤50%) are correct and count the total number of stations with correct first-order anomaly forecasts, denoted by N1.
Third, we determine station by station whether the forecasts of secondary anomalies (precipitation anomaly > 50%) are correct and count the total number of stations with correct secondary-order anomaly forecasts, denoted by N2.
Fourth, if in a certain stain the secondary anomaly is not reported but the precipitation anomaly percentage is ≥100% or equal to −100%, then this is called a missing alarm station. The total number of missing alarm stations is denoted by M.
Fifth, the total number of all stations is denoted by N.
The equation is as follows [36,37]:
P s = a * N 0 + b * N 1 + c * N 2 ( N N 0 ) + a * N 0 + b * N 1 + c * N 2 + M * 100 ,
a, b, and c are weighting factors, and they are set as a = 2, b = 2, and c = 4.

2.2.2. Dynamic–Analogue Correction Method

The dynamic–analogue correction method uses the relationship between the flood-season precipitation forecast errors of seasonal climate model and the preceding SST observation to find the historically similar information of model errors. Then, the model error in the similar years is extracted, which is then used to conduct the dynamic–analogue correction on the flood-season precipitation predicted by climate models [38,39].

2.2.3. Hybrid Downscaling Method

Based on the relationships of the observational precipitation field during the flood season in Northeast China to the atmospheric circulation field output by seasonal climate model and the preceding observational SST, the hybrid downscaling forecast model is established by the field coupling method. Then, the hybrid downscaling model for the flood-season precipitation in Northeast China is established by extracting the optimal type of coupled fields [40,41].

2.2.4. Forecast Accuracy of the Influencing Factors of the Flood-Season Precipitation in Northeast China

The forecast accuracy of the influencing factors of the flood-season precipitation in Northeast China is defined as the ratio of the number of years with accurate forecasting for the anomalies of impact factor to total years.

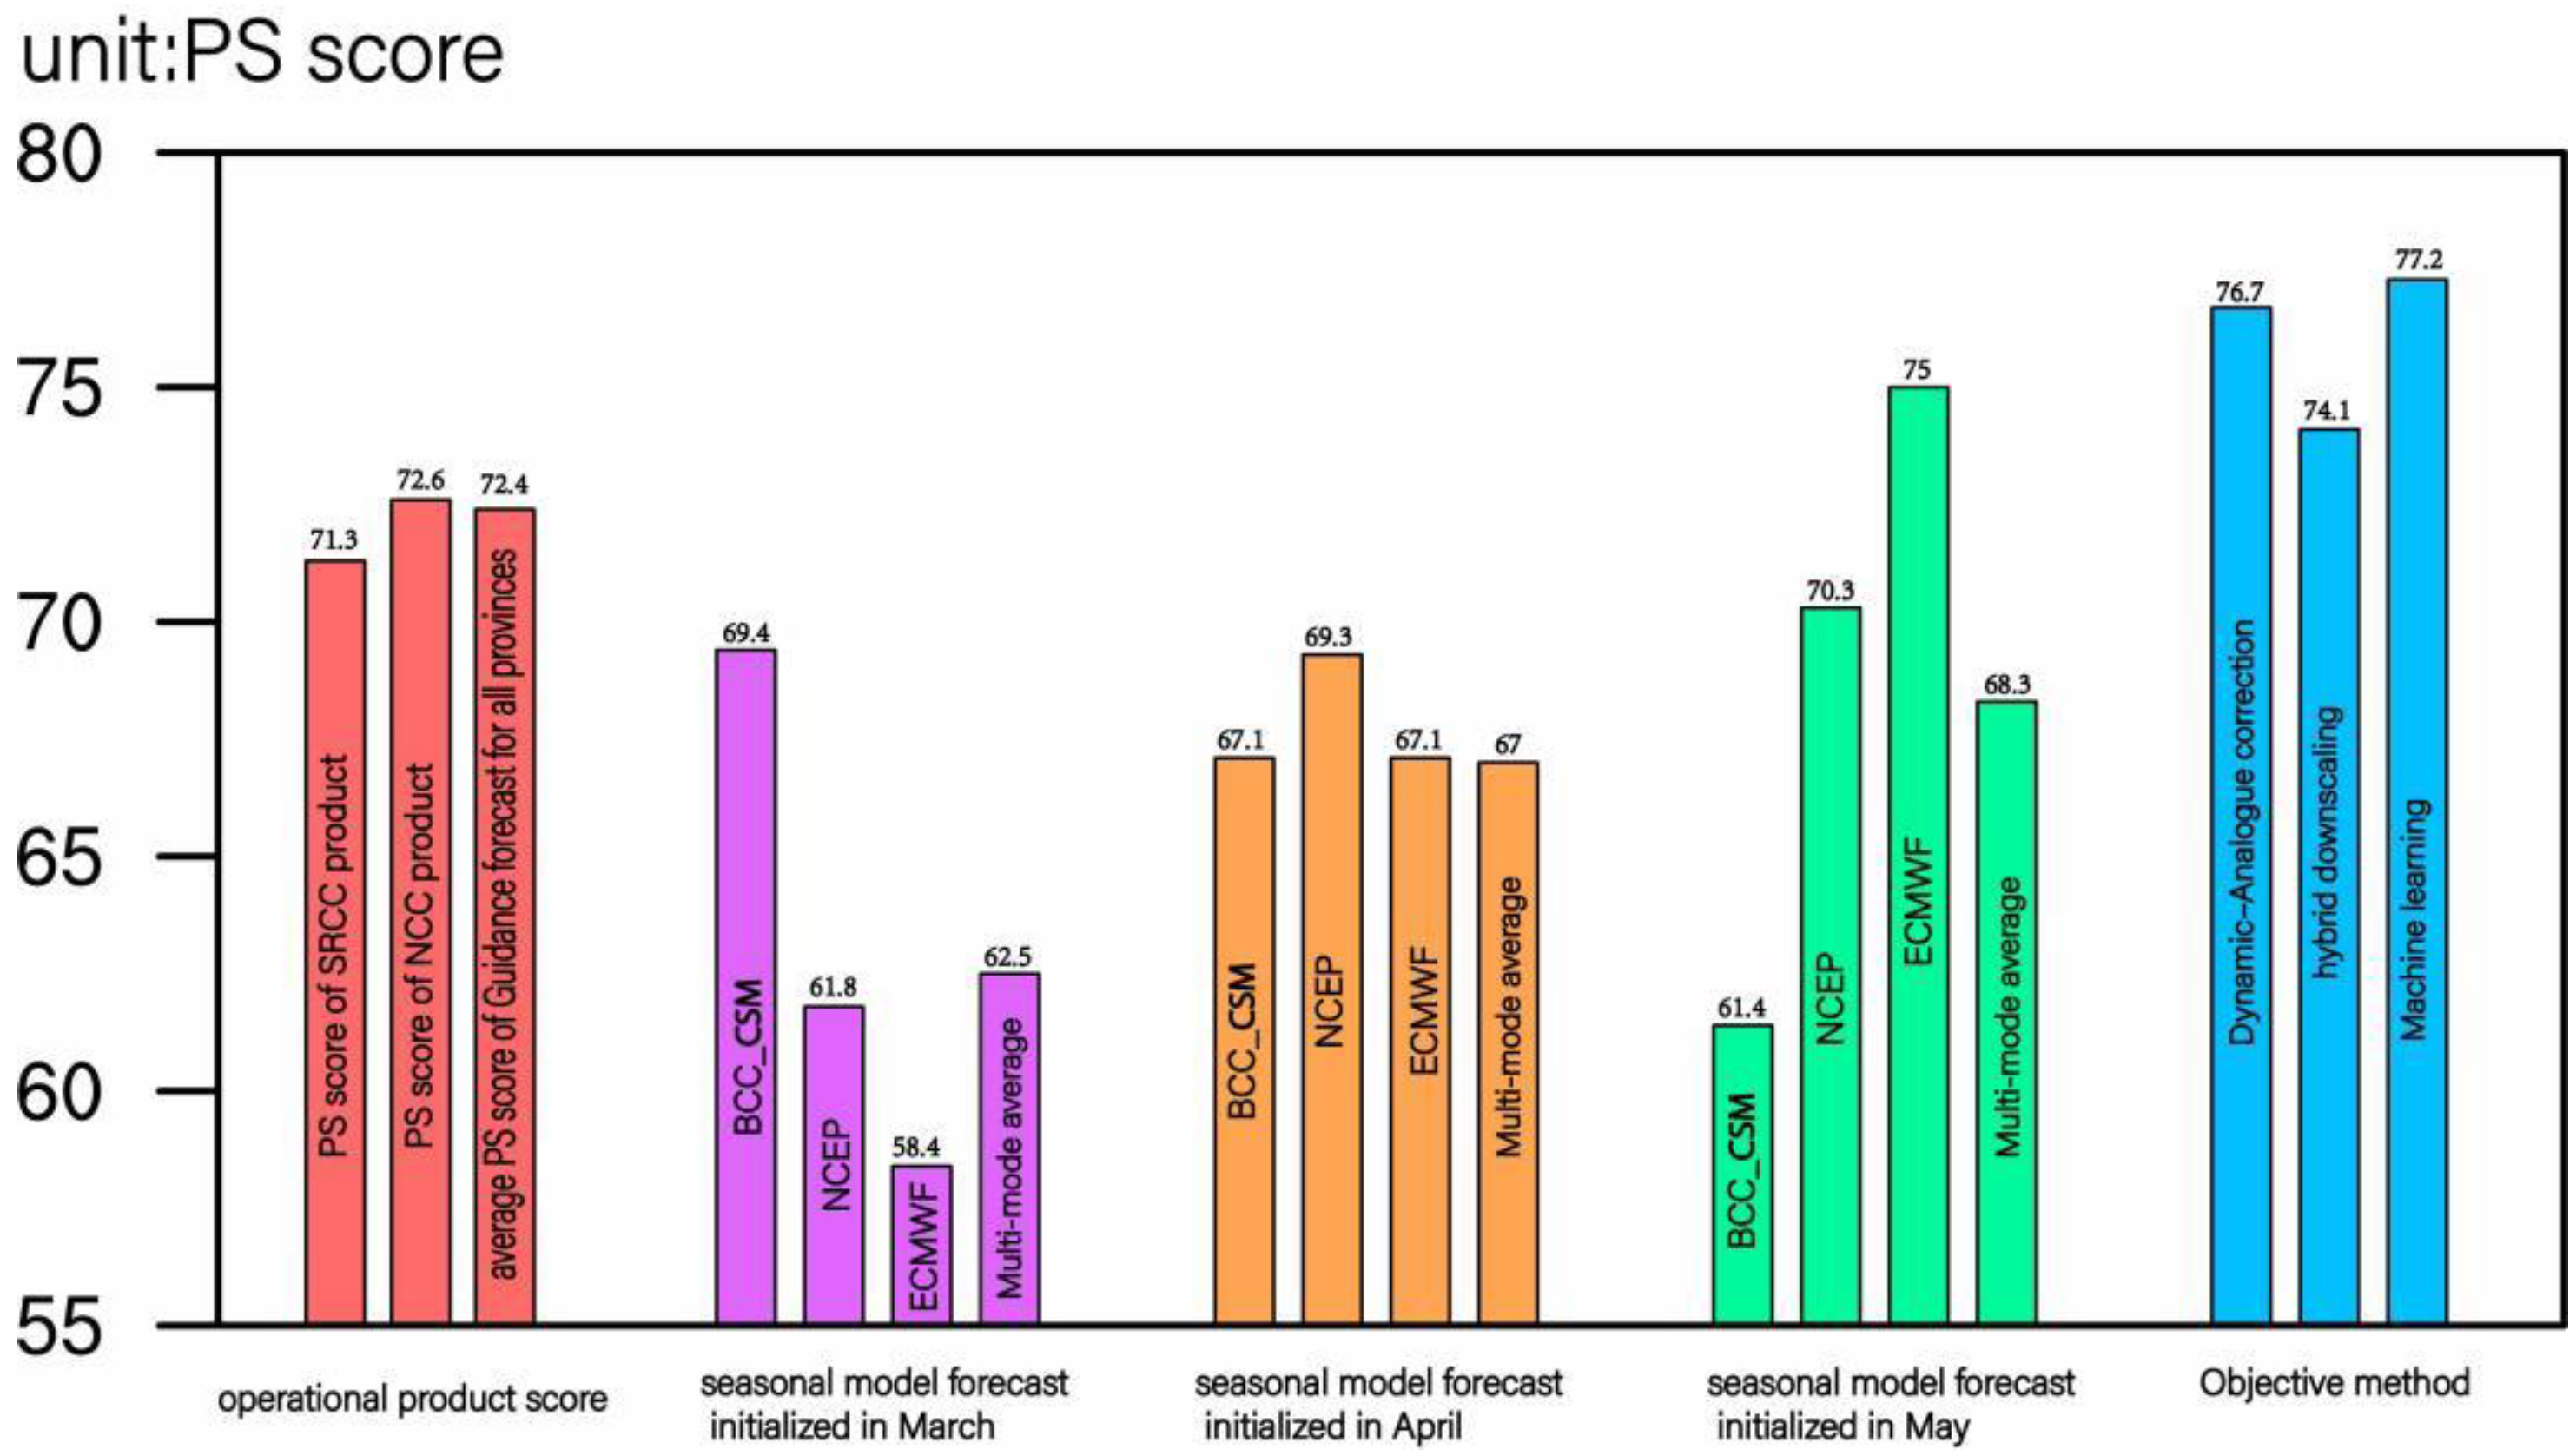
3. Evaluation of the Accuracy of Flood-Season Precipitation Forecasts in Liaoning

Figure 1 shows that the PS scores of the NCC and SRCC operational products are all above 70. The PS score of the NCC product is slightly higher than that of the SRCC product. The PS scores differ obviously for the forecasts of seasonal climate models with different initial times. The PS score of the NCC model decreases when the forecast leading time becomes shorter, and the PS score is especially low in May. However, the PS score of the NCC model (BCC_CSM) initialized in March is much higher than the other two models initialized in the same period, and even performs better than that in April. Table 1 shows that the PS score of the NCEP initialized in April is much higher than that in March (improved by 12%), and the improving rate is much higher than the other two models. However, the improving rate from April to May is only 1%. The PS score of the ECMWF model increases from March to May, and is higher than other models initialized in the same month. Overall, for the seasonal models, the performance of the NCC model initialized in March and the ECMWF model initialized in May is better than that of other models, and their PS scores are about 7 points higher than that of the multi-model average. Therefore, these two can be the key reference in operational climate prediction. The PS score of the NCEP model is the highest among all the models initialized in April; however, its advantage is limited (only about two points higher than the multi-model average). With the shortening of forecast leading time, the average score of all models increases month by month.
As can be seen from Figure 1, the PS scores of the objective methods are better than the operational products and the seasonal model forecasts. The machine learning method has the best score (77.2). Figure 2 shows the performance of the dynamic–analogue correction method and the hybrid downscaling method on the flood-season precipitation prediction. The accuracy of the dynamic–analogue correction method is closely related to the SST anomalies in the equatorial central-east Pacific. When the SST anomalies in the equatorial central-east Pacific are significant, the score is obviously high (red dots) and can reach a maximum of more than 90. Conversely, the maximum PS score does not exceed 75 (black dots). The accuracy of the hybrid downscaling method is closely related to the North Atlantic SST tripole (NAT) anomaly. The score is relatively high (red and black circles) when the NAT phase is evident, and conversely the PS score is relatively low (hollow circles).

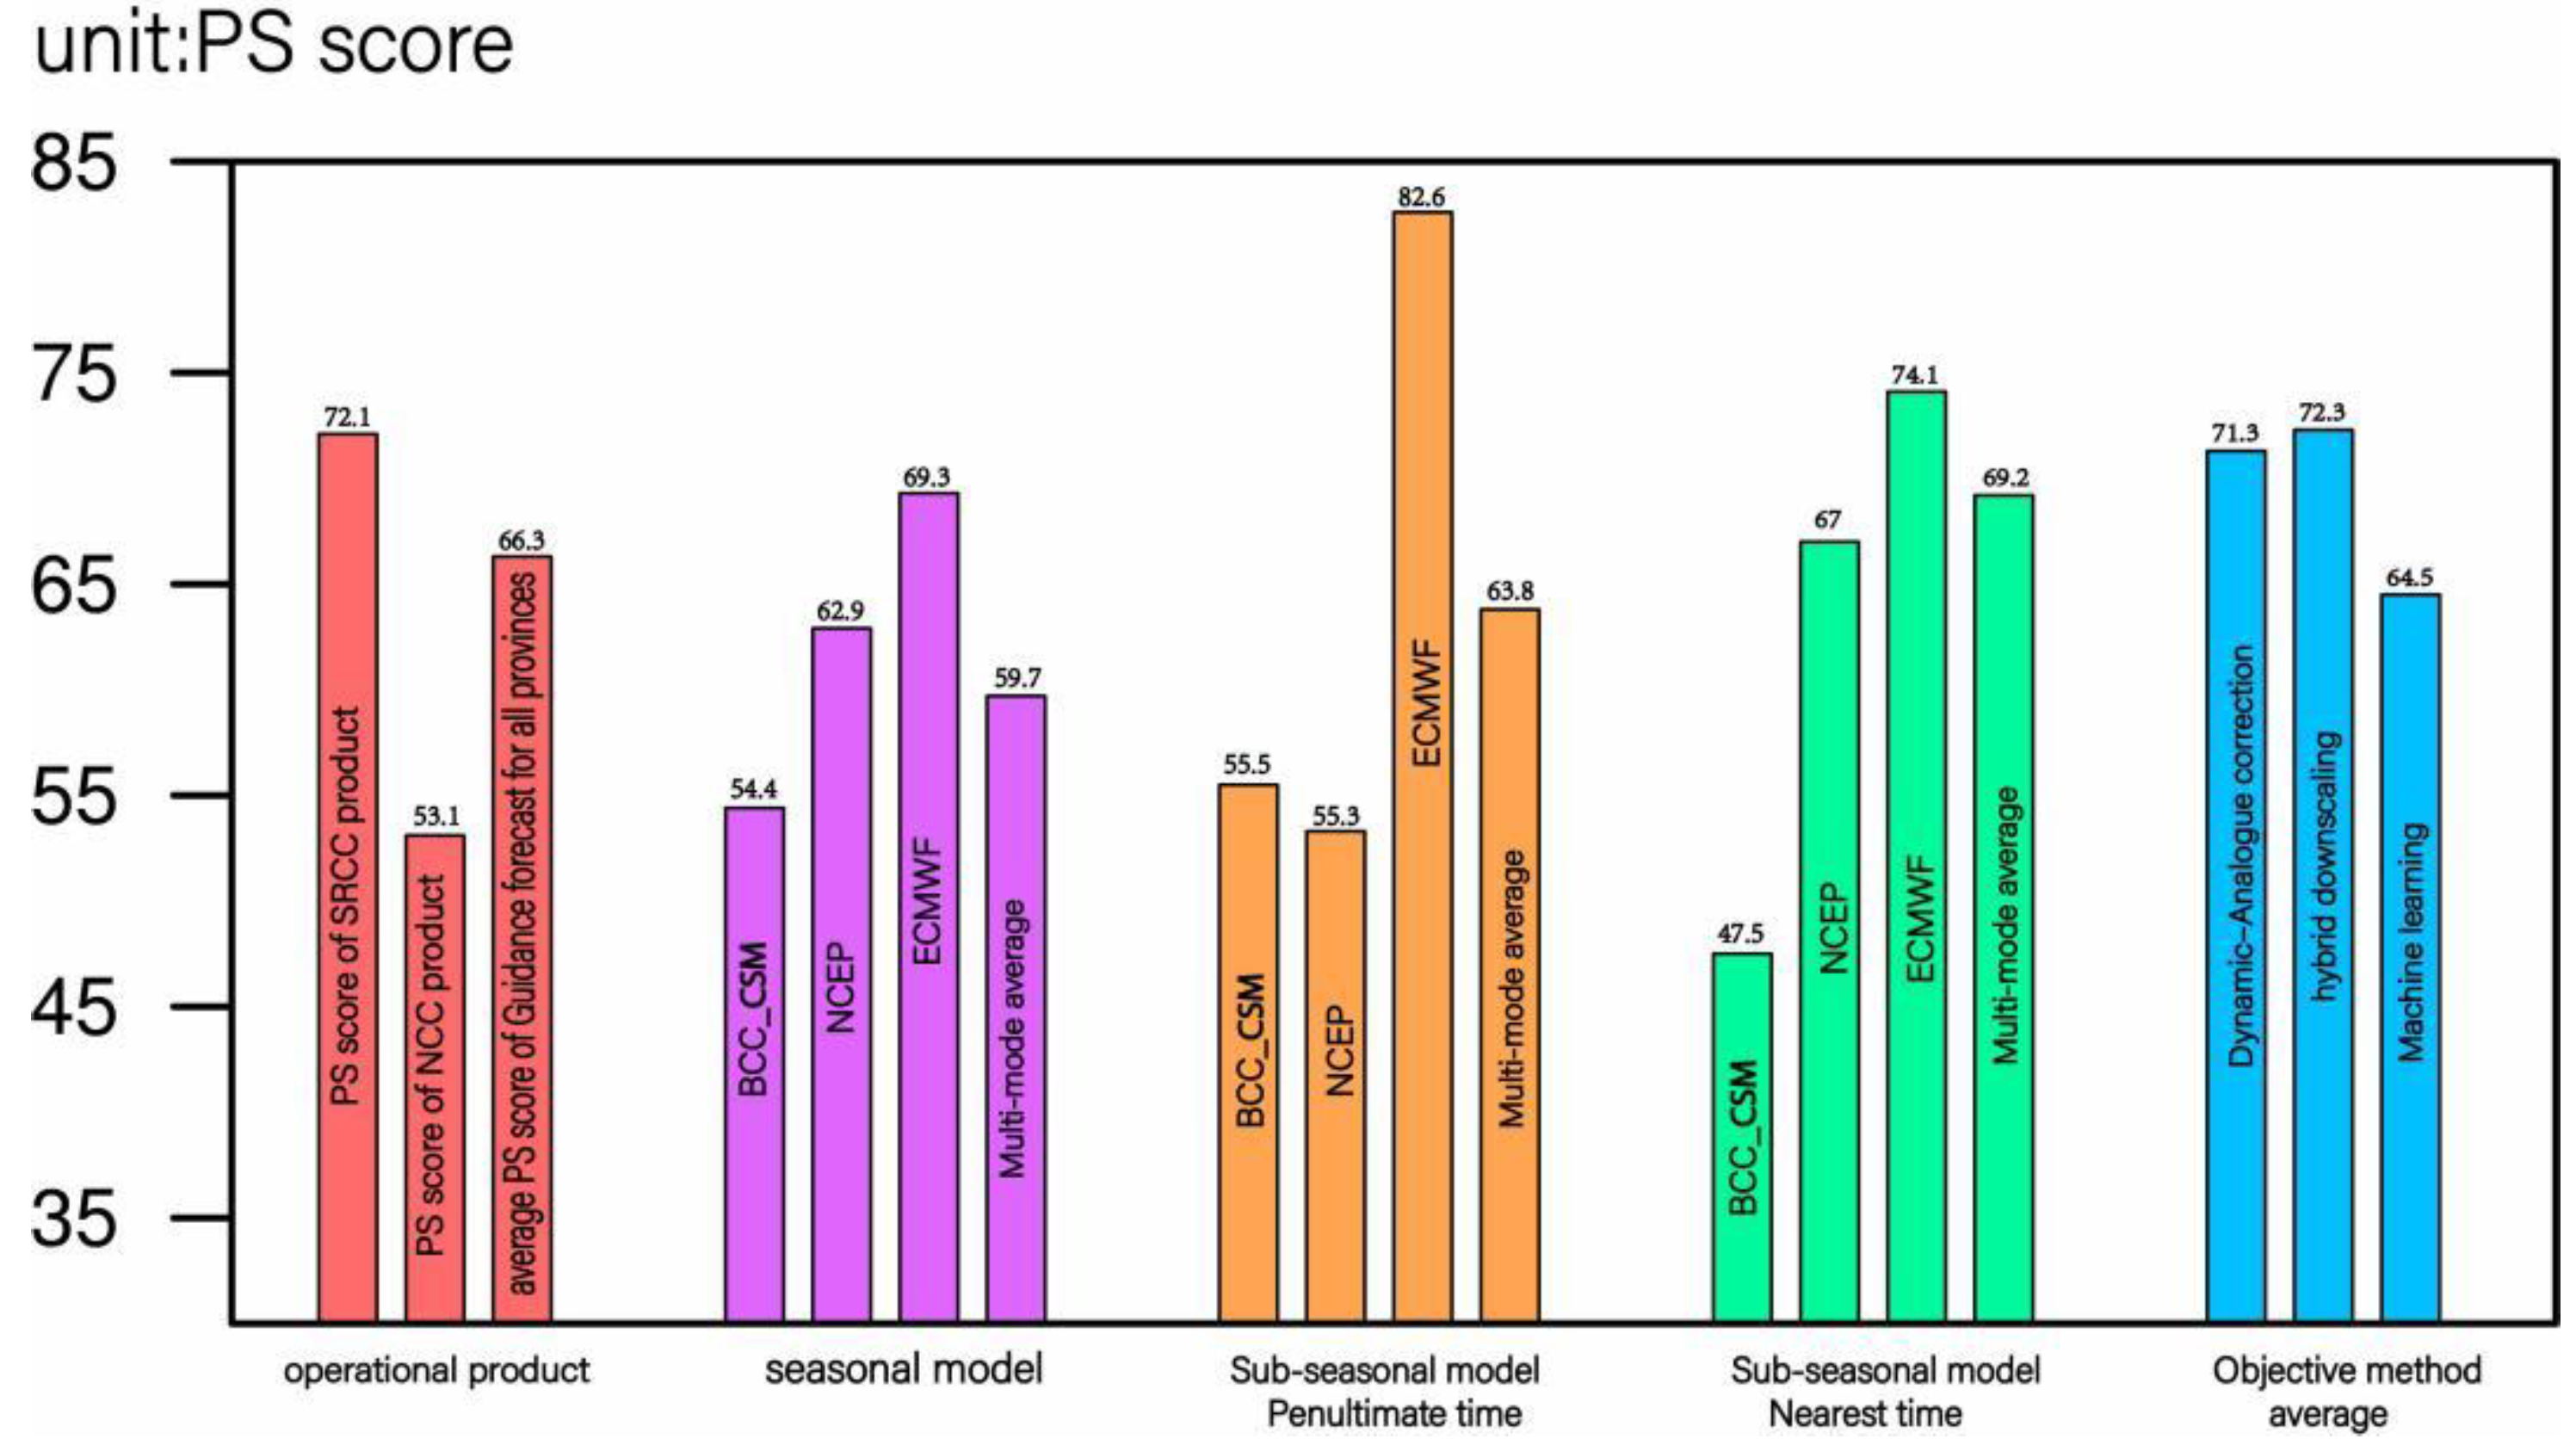
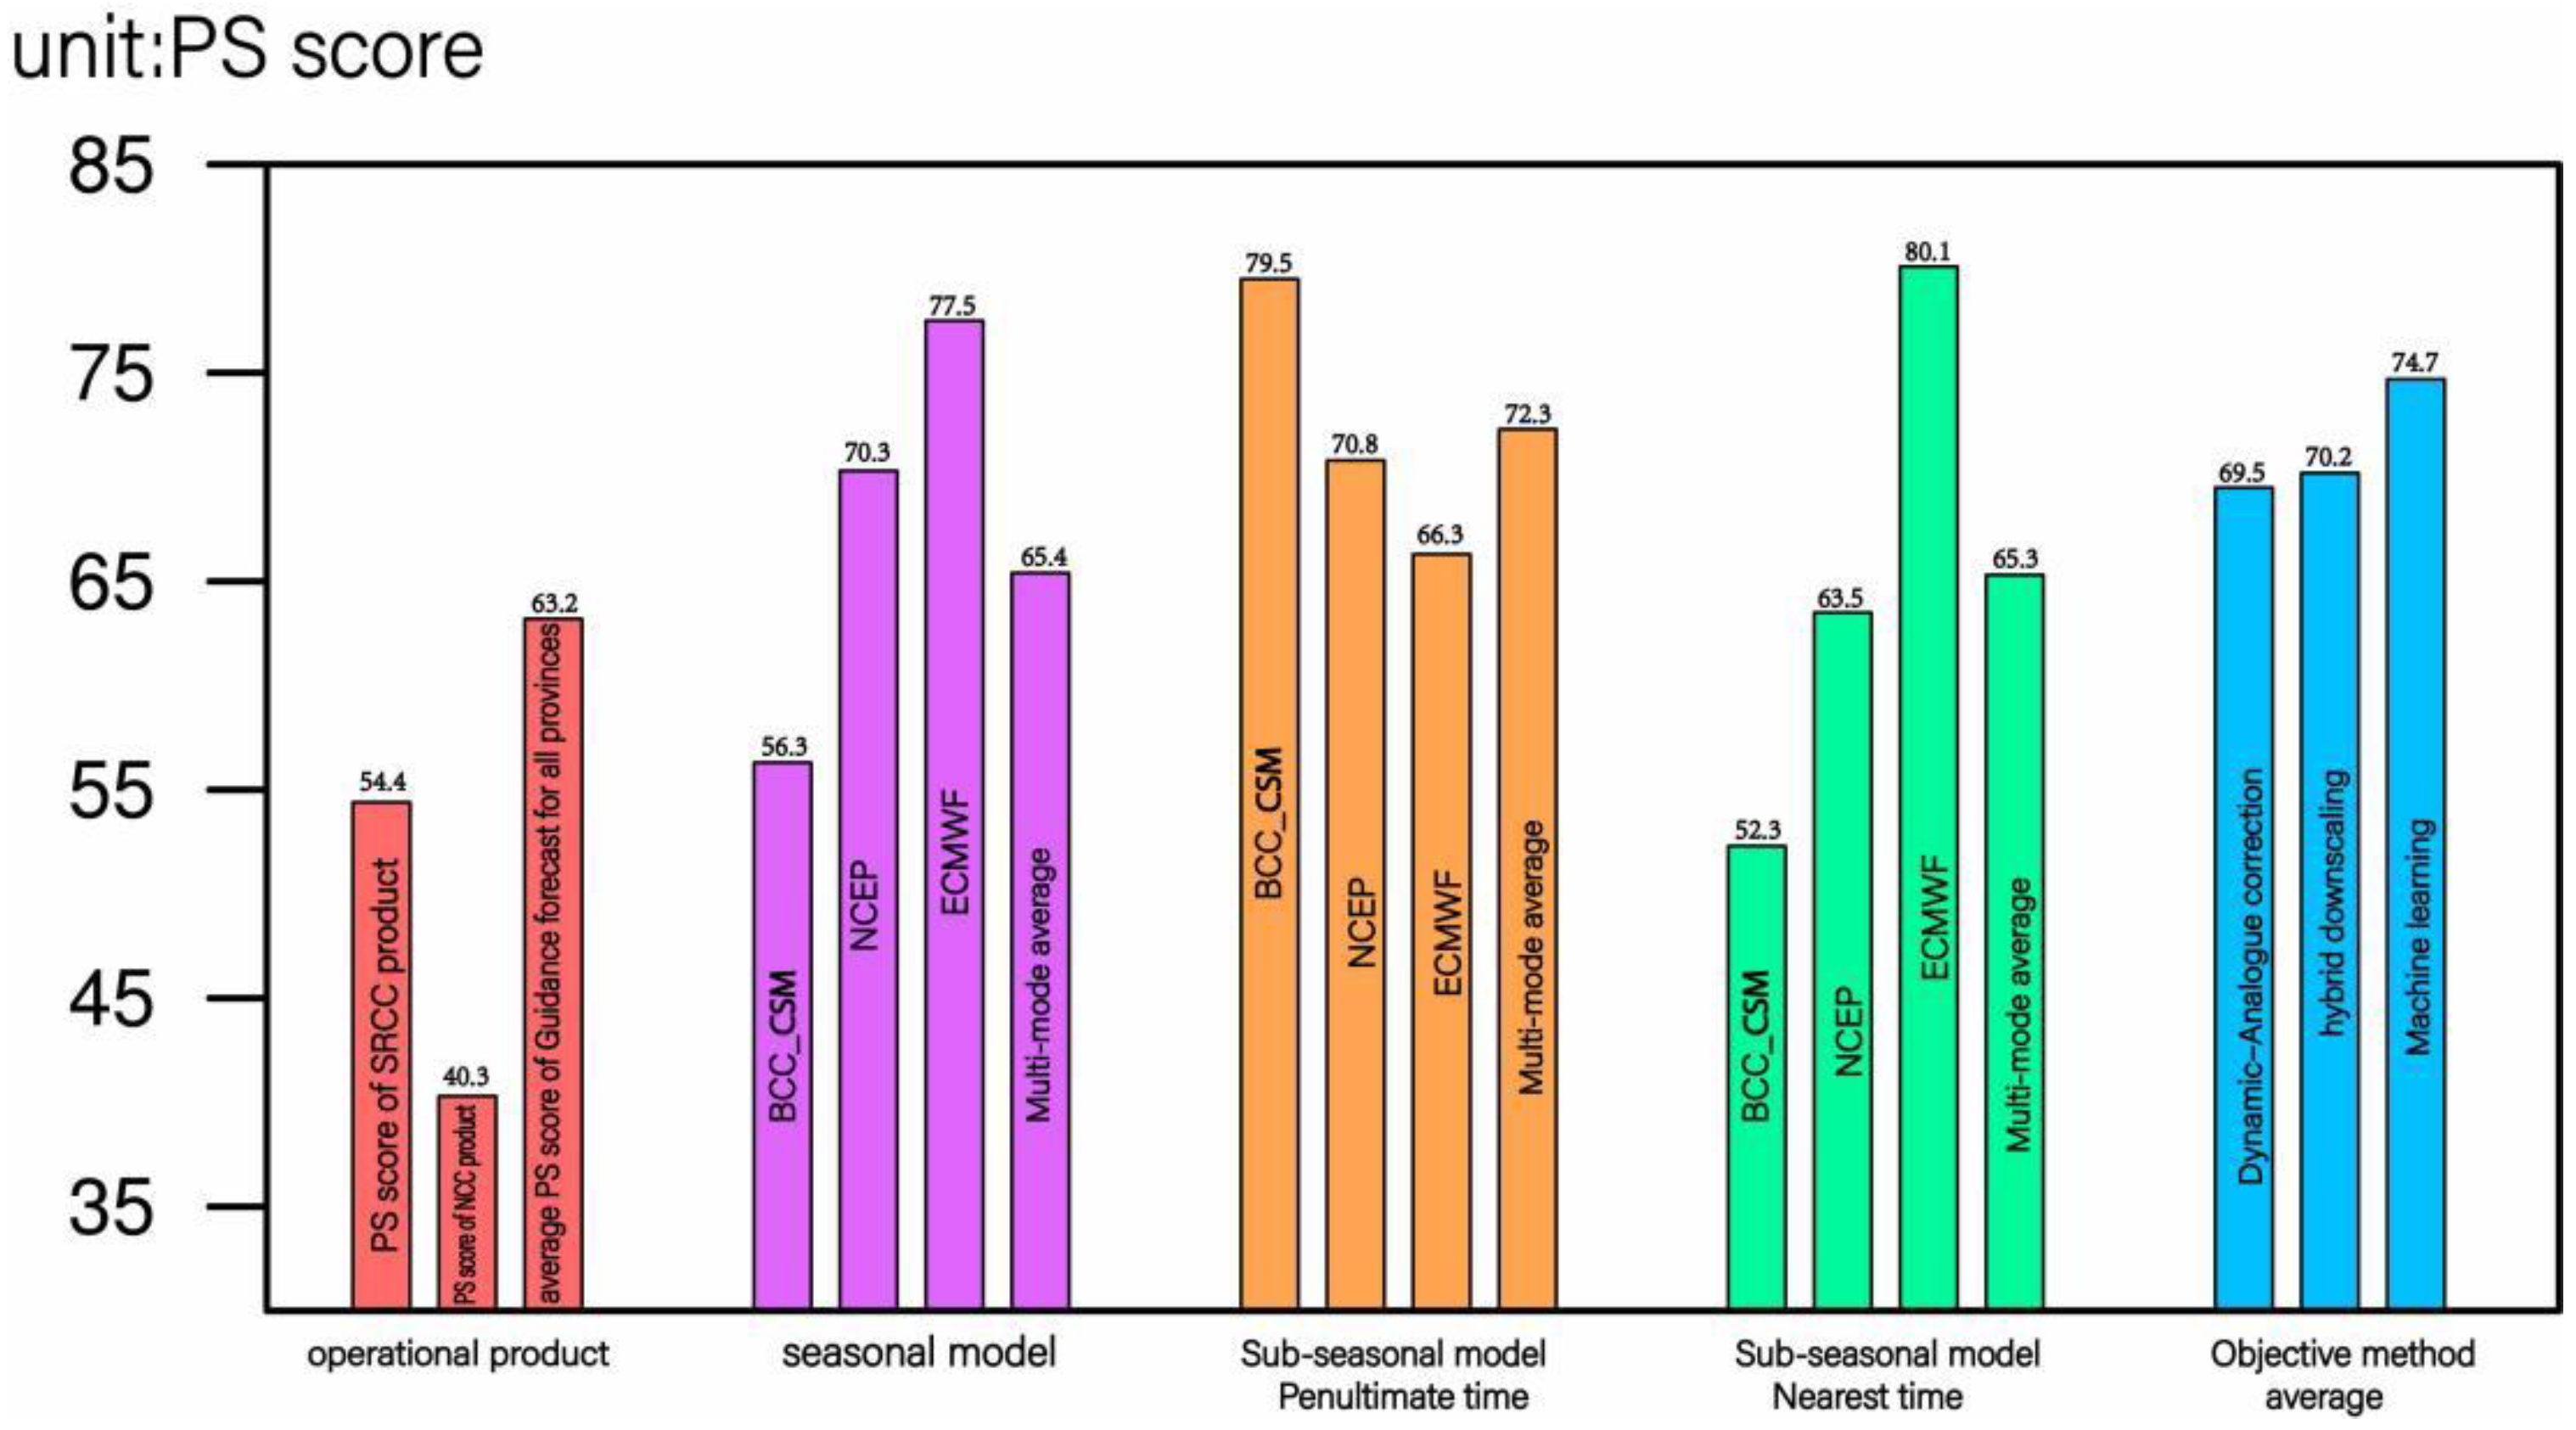
4. Evaluation of the Accuracy of Monthly Precipitation Forecasts in Liaoning during the Flood Season

Figure 3 shows that for the precipitation prediction in June, the PS score of the SRCC product is 72.1, while that of the NCC product is only 53.1. This may be due to the fact that the SRCC product combines objective methods, model projections, and climate mechanism analysis, which helps to improve the forecast accuracy. In terms of the PS scores of the model products, the ECMWF product has the best score, followed by the NECP and BCC_CSM products. The average PS score of the seasonal models for precipitation prediction in June is lower than that of the sub-seasonal models. For the sub-seasonal models, the sub-nearest times initialized by the ECMWF and BCC_CSM products have higher scores than those initialized at the nearest time, while the situation is the opposite for the NCEP model. The ECMWF sub-seasonal model initialized at the sub-nearest time has the best accuracy, with a score of 82.6. The BCC_CSM sub-seasonal model initialized at the nearest time scores the lowest. Seen from the average score of all schemes, the score of the sub-seasonal model initialized at the nearest time is the best for the June precipitation forecast, with an average score of 69.2. The performance of objective methods is close to that of the SRCC product. The PS scores of the dynamic–analogue correction method and the hybrid downscaling method are close. The score of the machine learning method on June precipitation forecasting is relatively low.
As seen in Figure 4, for the July precipitation forecast, the score of the SRCC product score (54.4) is lower than that of the objective methods and model forecasts. This may be due to a lack of understanding on the mechanisms of the summer monsoon and WPSH anomalies. However, the score is higher than that of the NCC product (40.3). By comparing the multi-model average, we find that the average score of the seasonal models is close to the average score of the sub-seasonal models initialized at the nearest time, and both are lower than the score of the sub-seasonal model initialized at the sub-nearest time. For the sub-seasonal models initialized at sub-nearest time, the score of the BCC-CSM is the highest, followed by the NCEP and ECMWF. For the precipitation prediction in July, the sub-seasonal ECMWF initialized at the nearest time shows the best performance, with a PS score of 80.1. The ECMWF seasonal model and the BCC_CSM sub-seasonal model initialized at the nearest time also show good performance, and their scores are both above 77. The scores of the three objective methods are close to each other, and the machine learning method is the best.
Figure 5 shows that, for the August precipitation prediction, the score of the SRCC product is lower than that of the objective methods and some model predictions; however, it is slightly higher than the score of the NCC product. This may be due to the lack of understanding on the mechanisms of the summer monsoon anomaly and WPSH anomaly. The prediction performances of different models differ obviously. The accuracies of seasonal models are close. The score of the sub-seasonal models is about 26% higher than that of seasonal models. Although the average PS scores of the sub-nearest time and the nearest time forecasts are relatively close, the ECMWF performance initialized at the sub-nearest time is poor. The BCC_CSM shows the best performance, with a score over 80, followed by the NCEP (74.6). The sub-seasonal models initialized at the nearest time show a close performance to each other and have good stability. There is little difference between the three objective methods, and the machine learning method has the highest score (73).

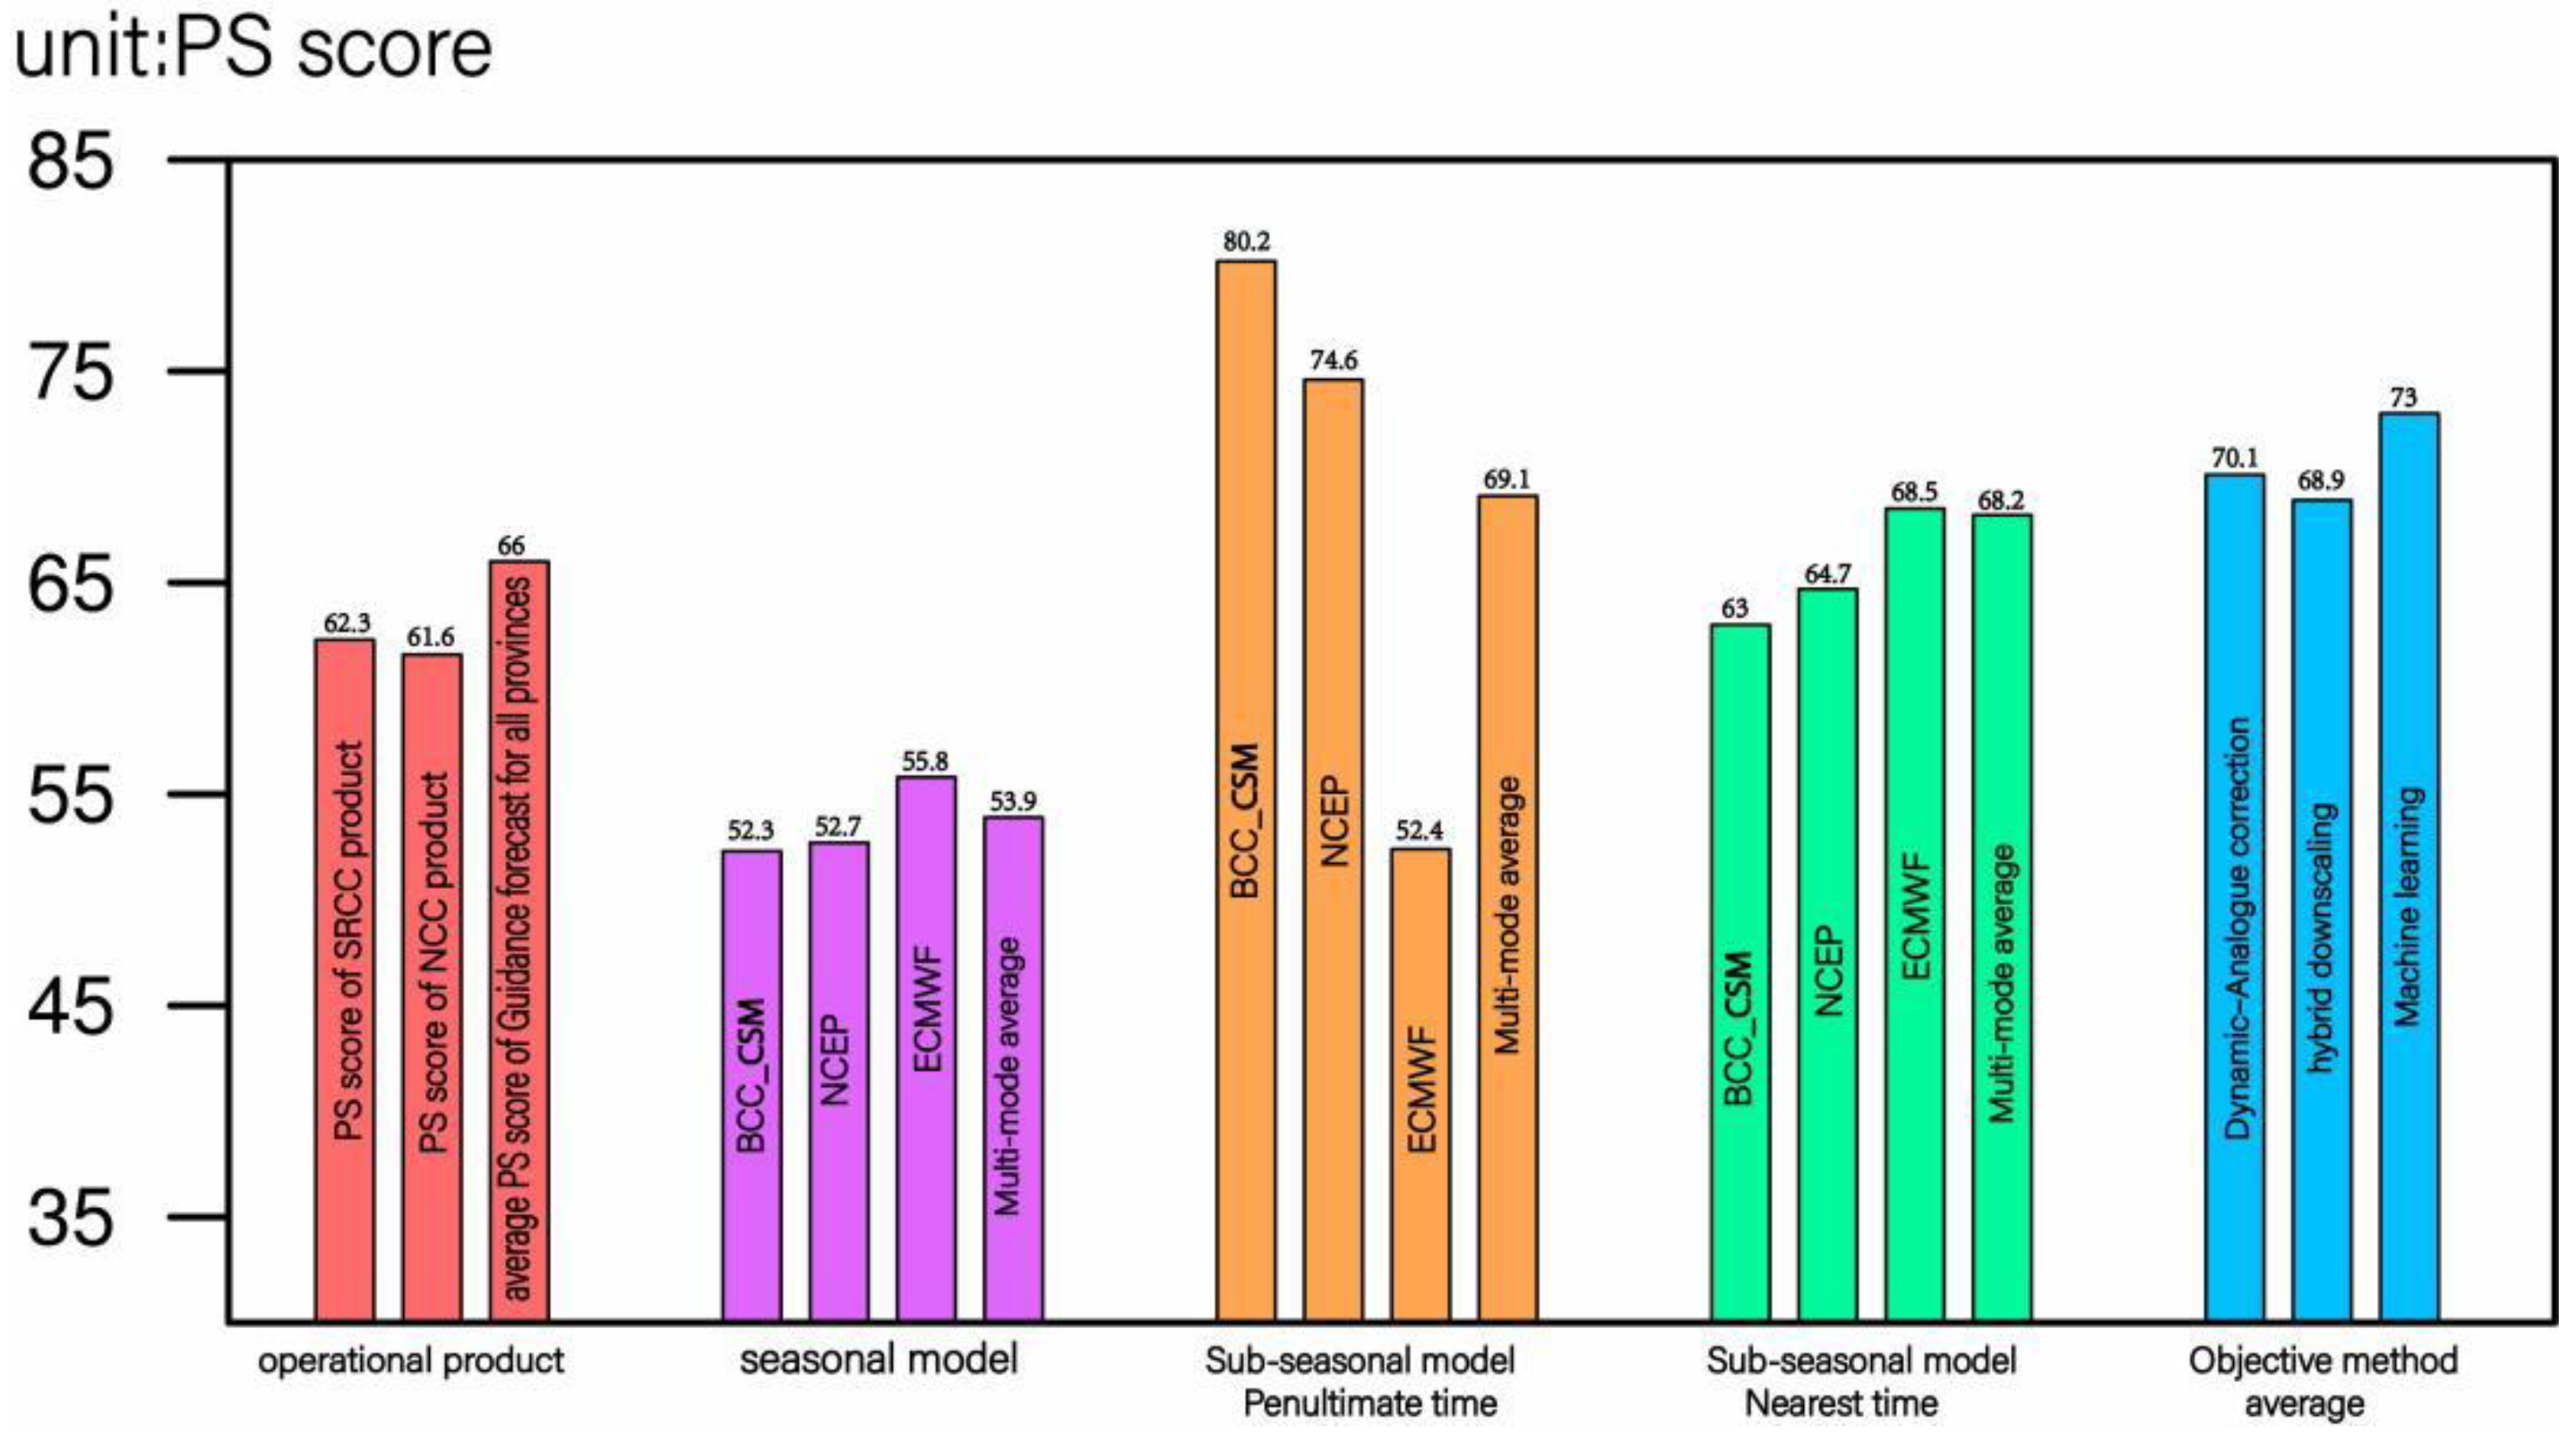
5. Analysis of the Prediction Accuracy of the Objective Methods

Figure 6 shows that the precipitation prediction accuracy of the dynamic–analogue correction method is affected by the SST anomalies in the central-eastern equatorial Pacific, and the correlation between them is most significant in June. From 2017 to 2022, the dynamic–analogue correction method has higher score when the SST anomaly is significant. However, in July the accuracy of the dynamic–analogue correction method is not significantly correlated with the SST anomalies. The dynamic–analogue correction method still has a high score in 2017 when the SST anomaly is not significant. When the SST is anomalous, the score in 2021 is lower than that in 2017 and 2019 when the SST anomaly is significant. The August prediction scores show that when the SST is anomalous, the scores are overall better. Only in 2020, the PS score under normal SST is higher than that under a significant SST anomaly.
The accuracy of the hybrid downscaling method for precipitation prediction is influenced by the NAT anomaly. The accuracy of the hybrid downscaling method for June precipitation prediction is the lowest in 2018 when the NAT anomaly is not significant, and it is relatively higher in the years with a significant NAT anomaly. The situation in August is similar to June, except 2021, where the score for the significant NAT anomaly years is higher than in the years with normal NAT.
Both methods are less influenced by the SST anomaly for July precipitation prediction, and the reasons are to be further analyzed.

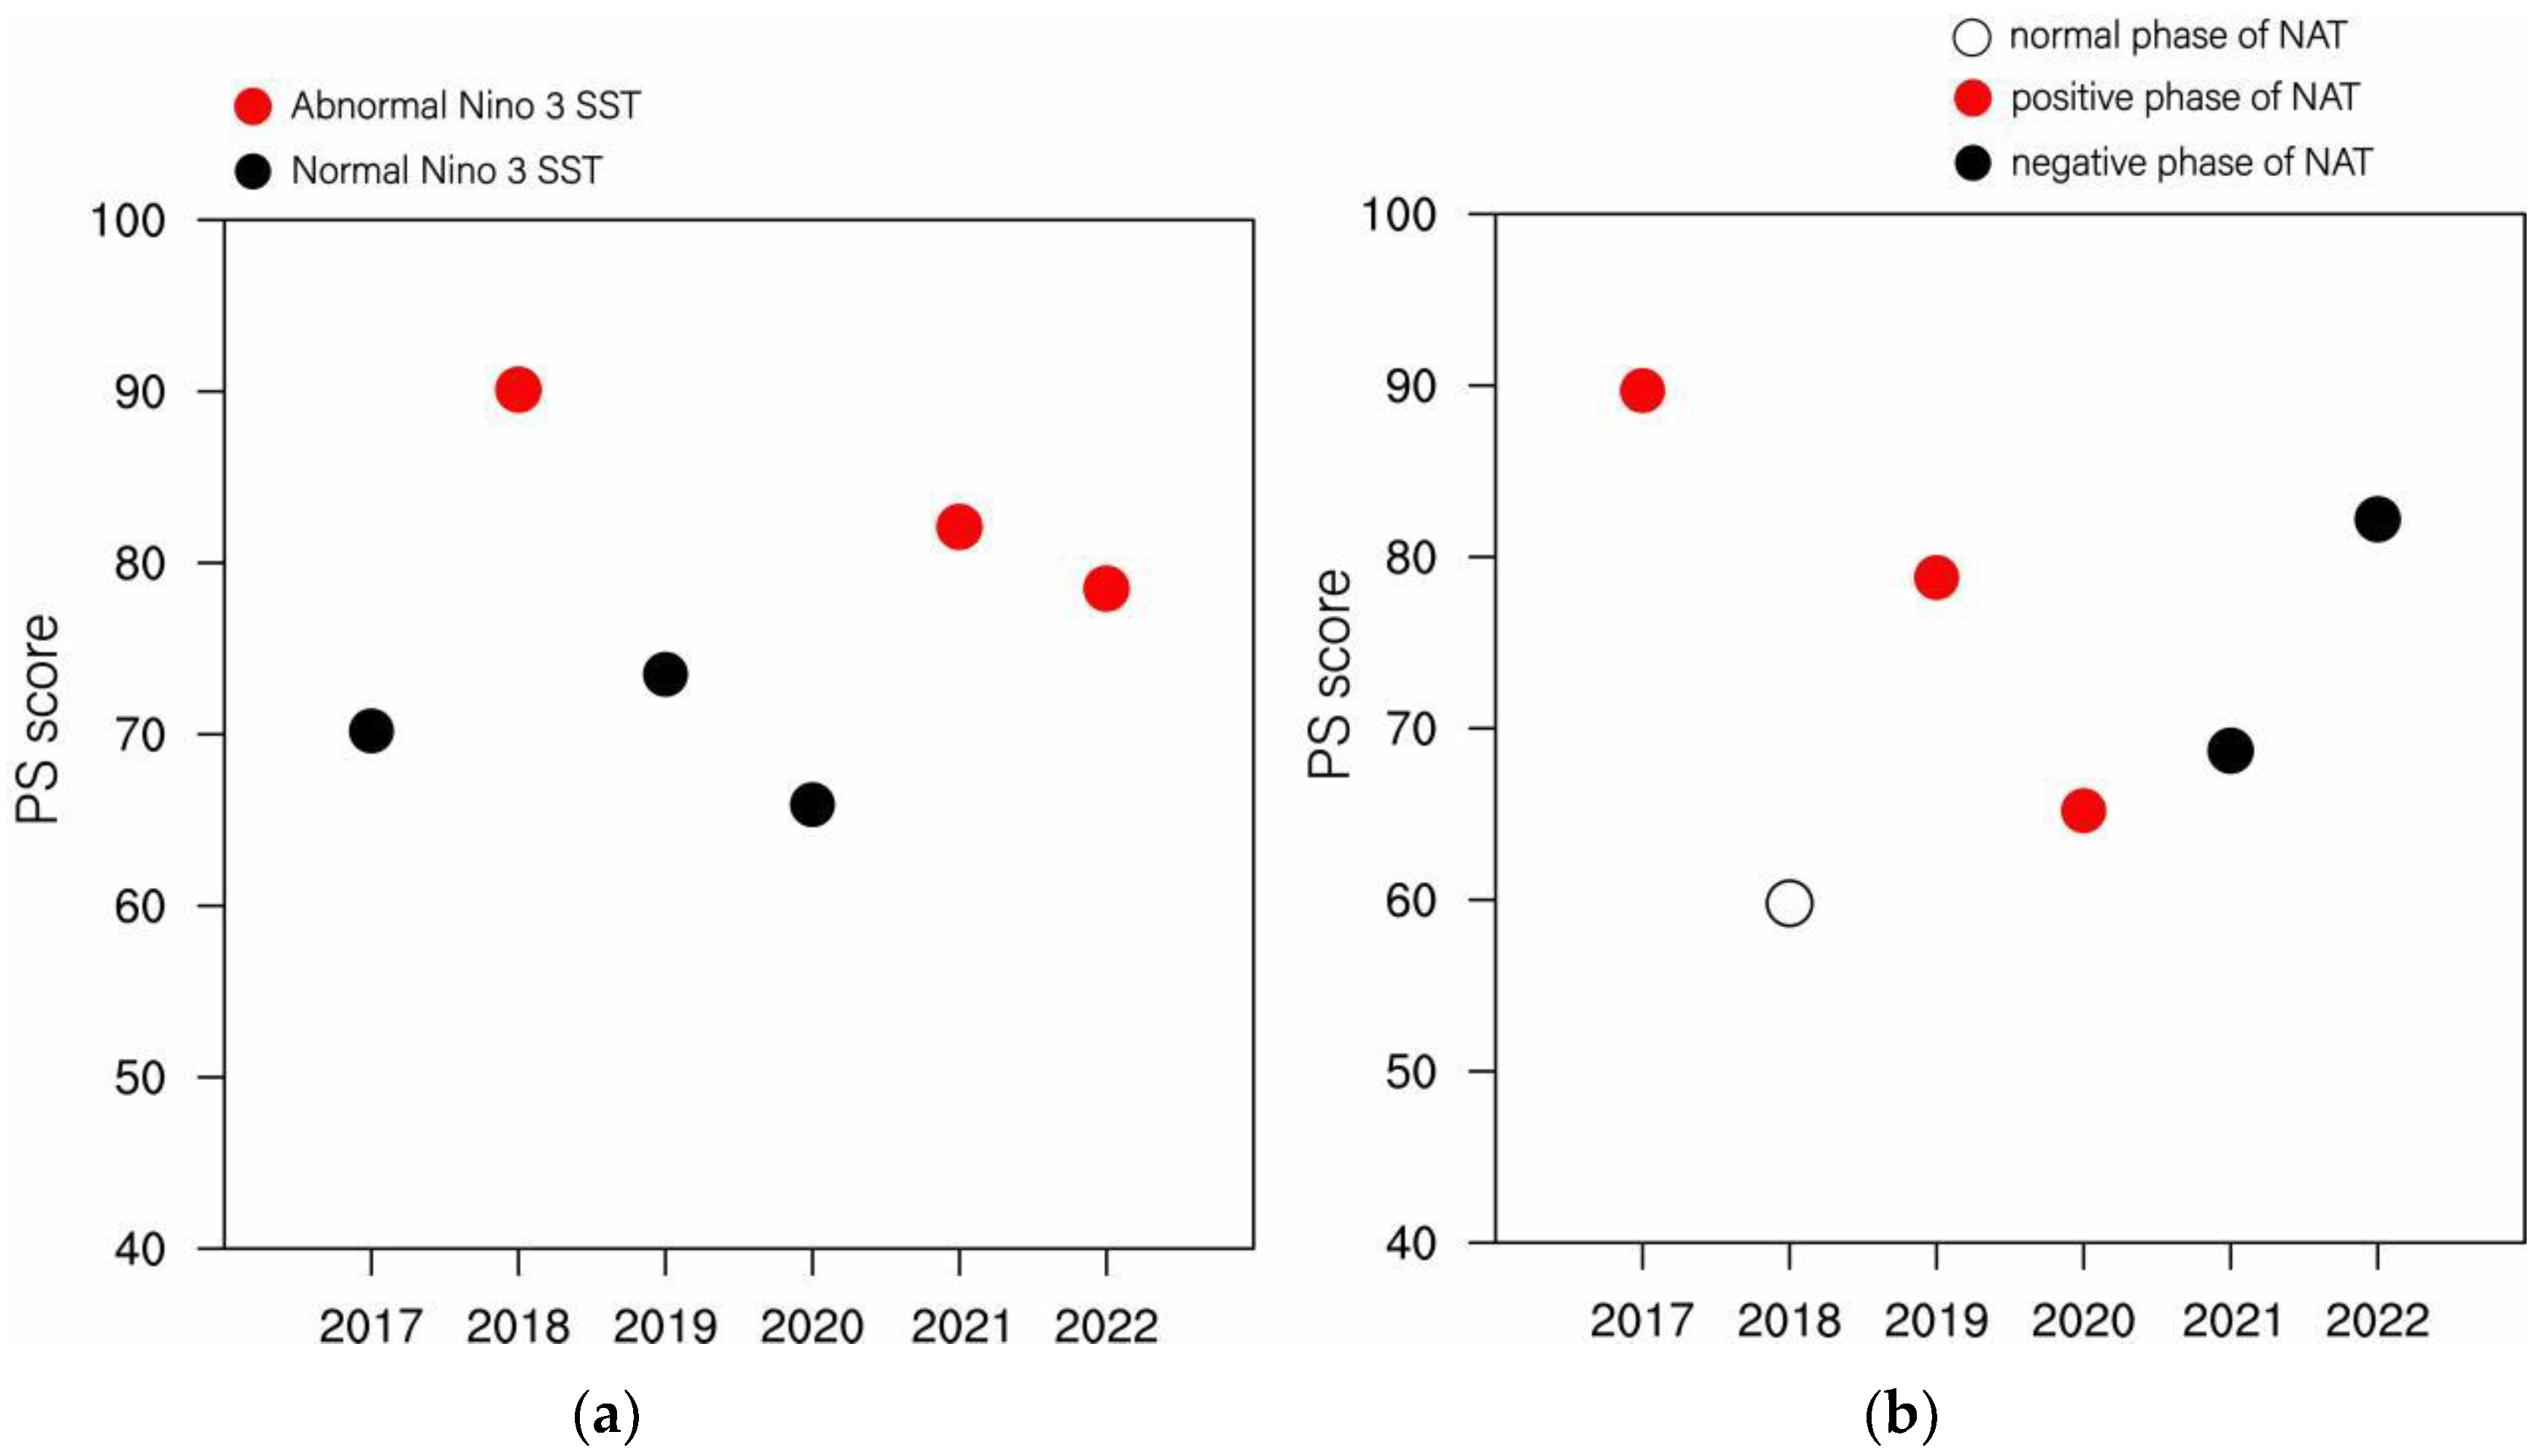
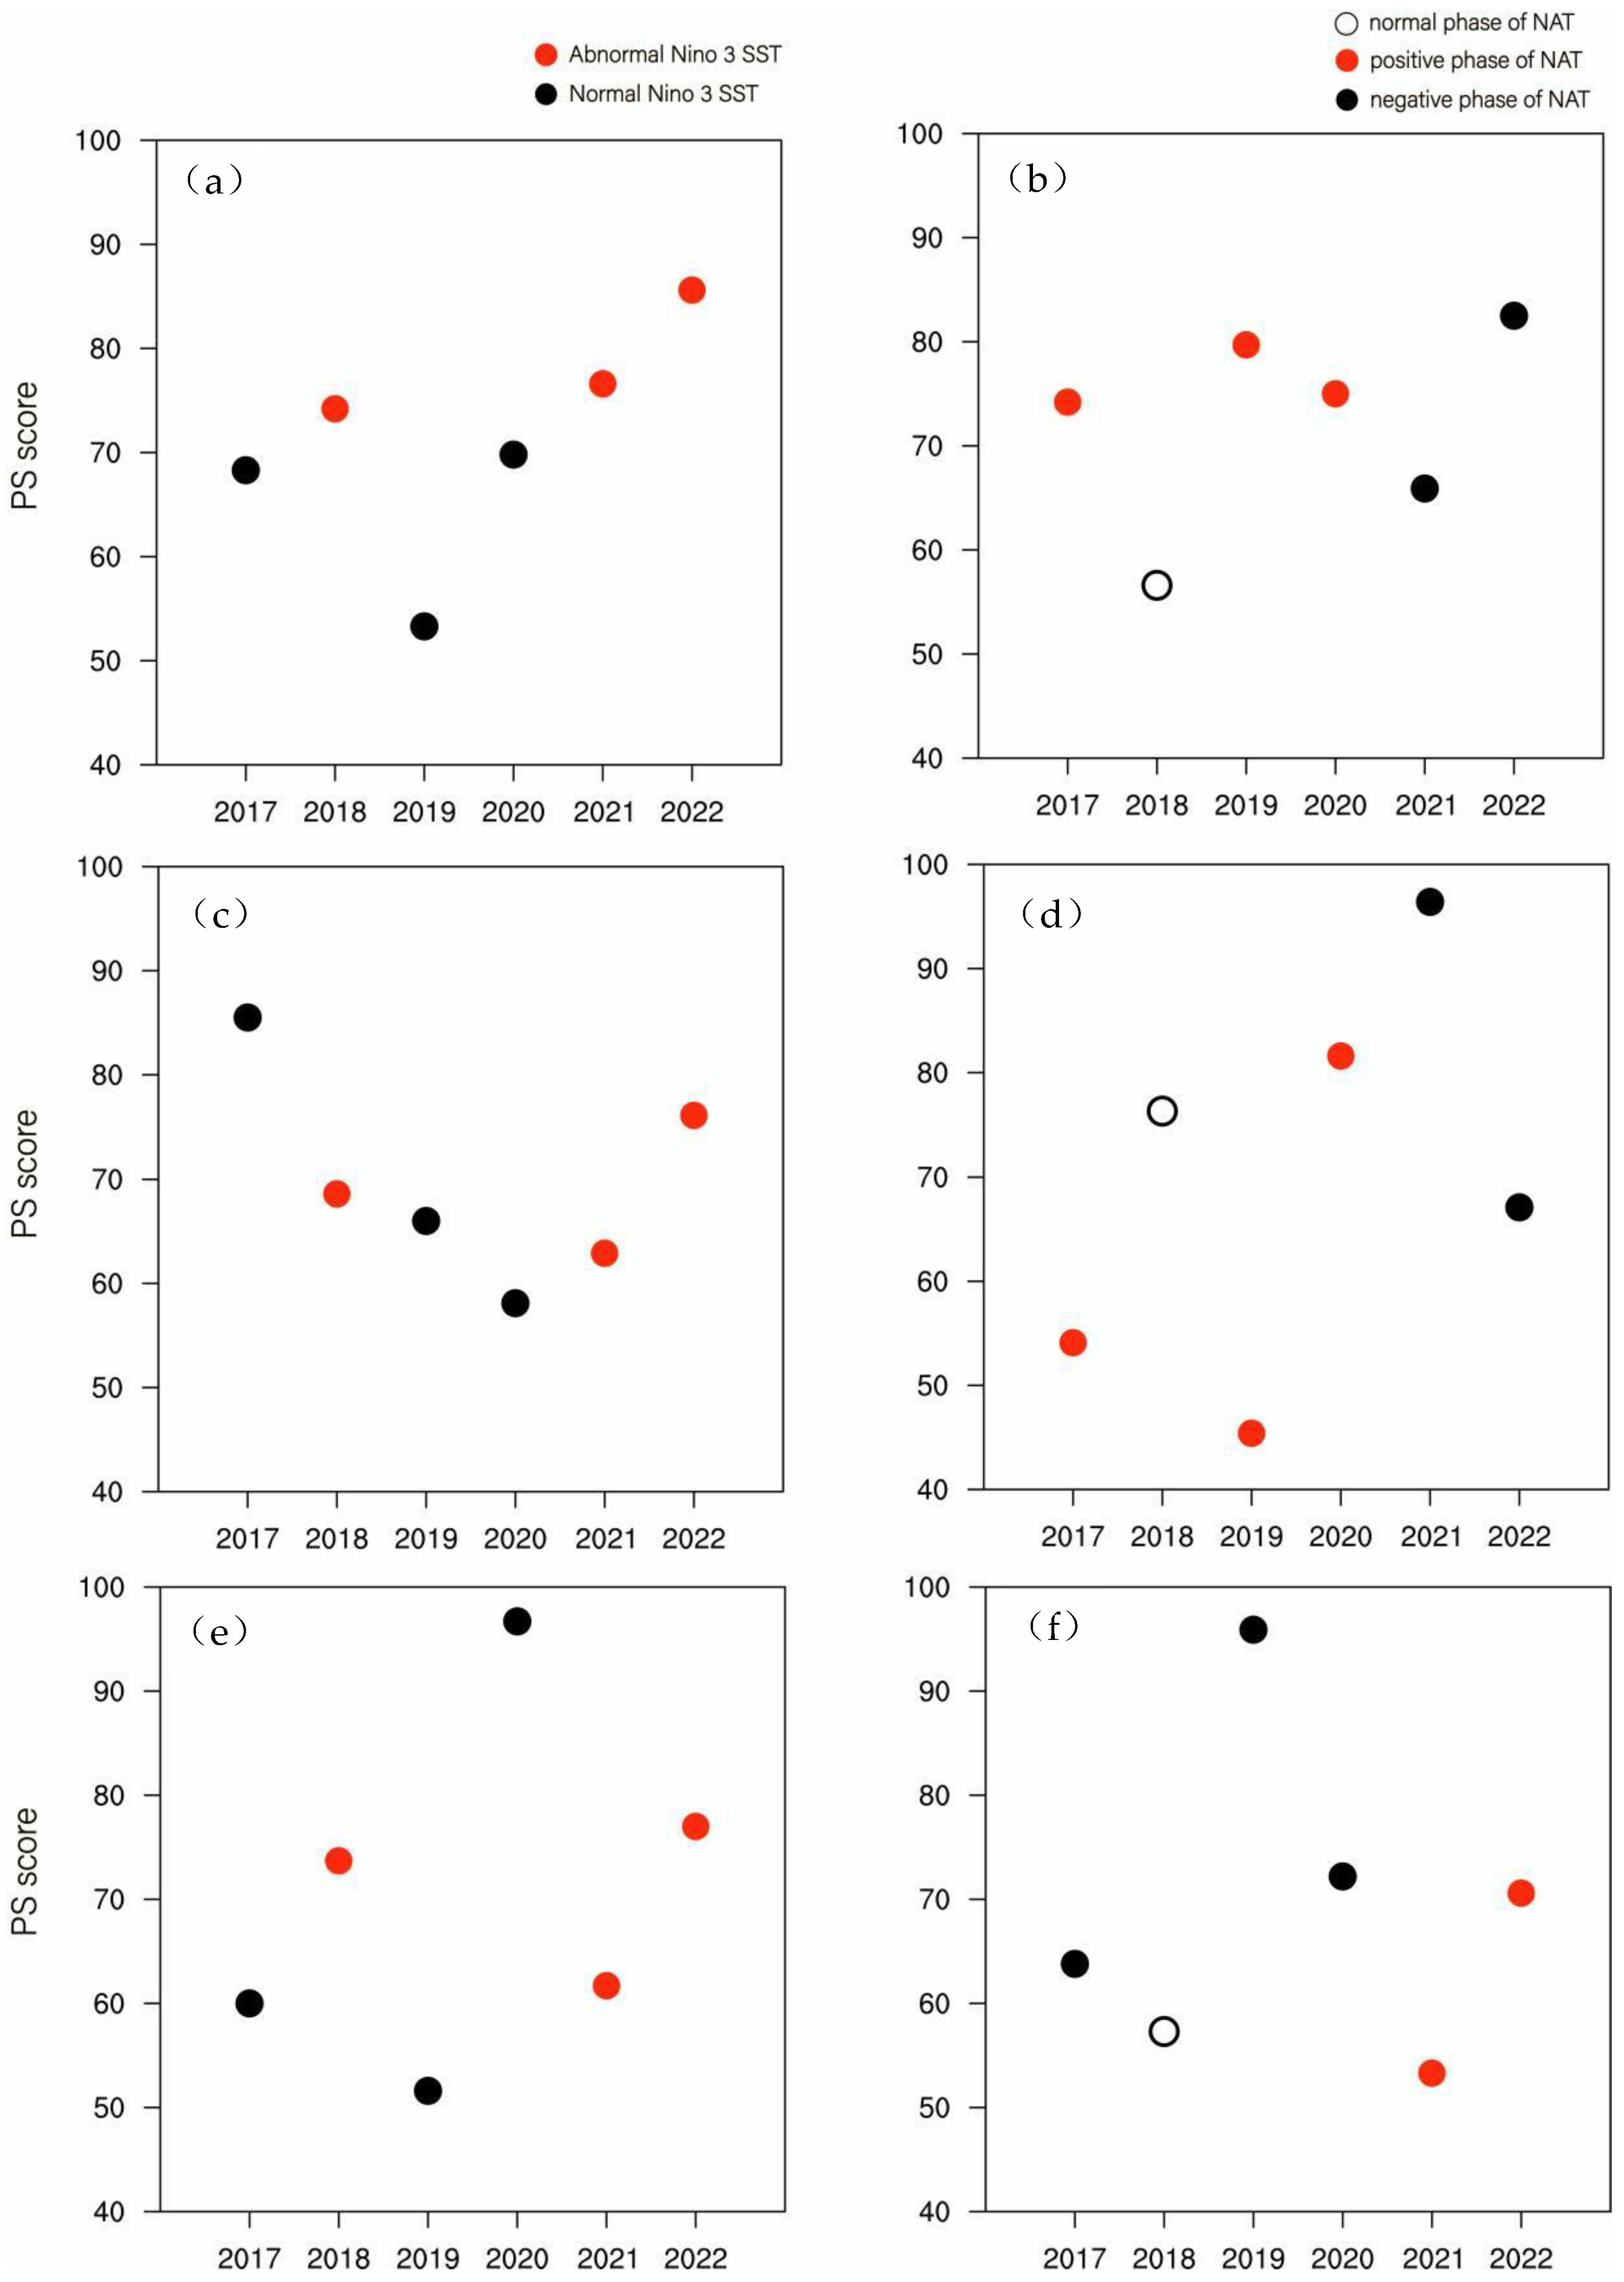
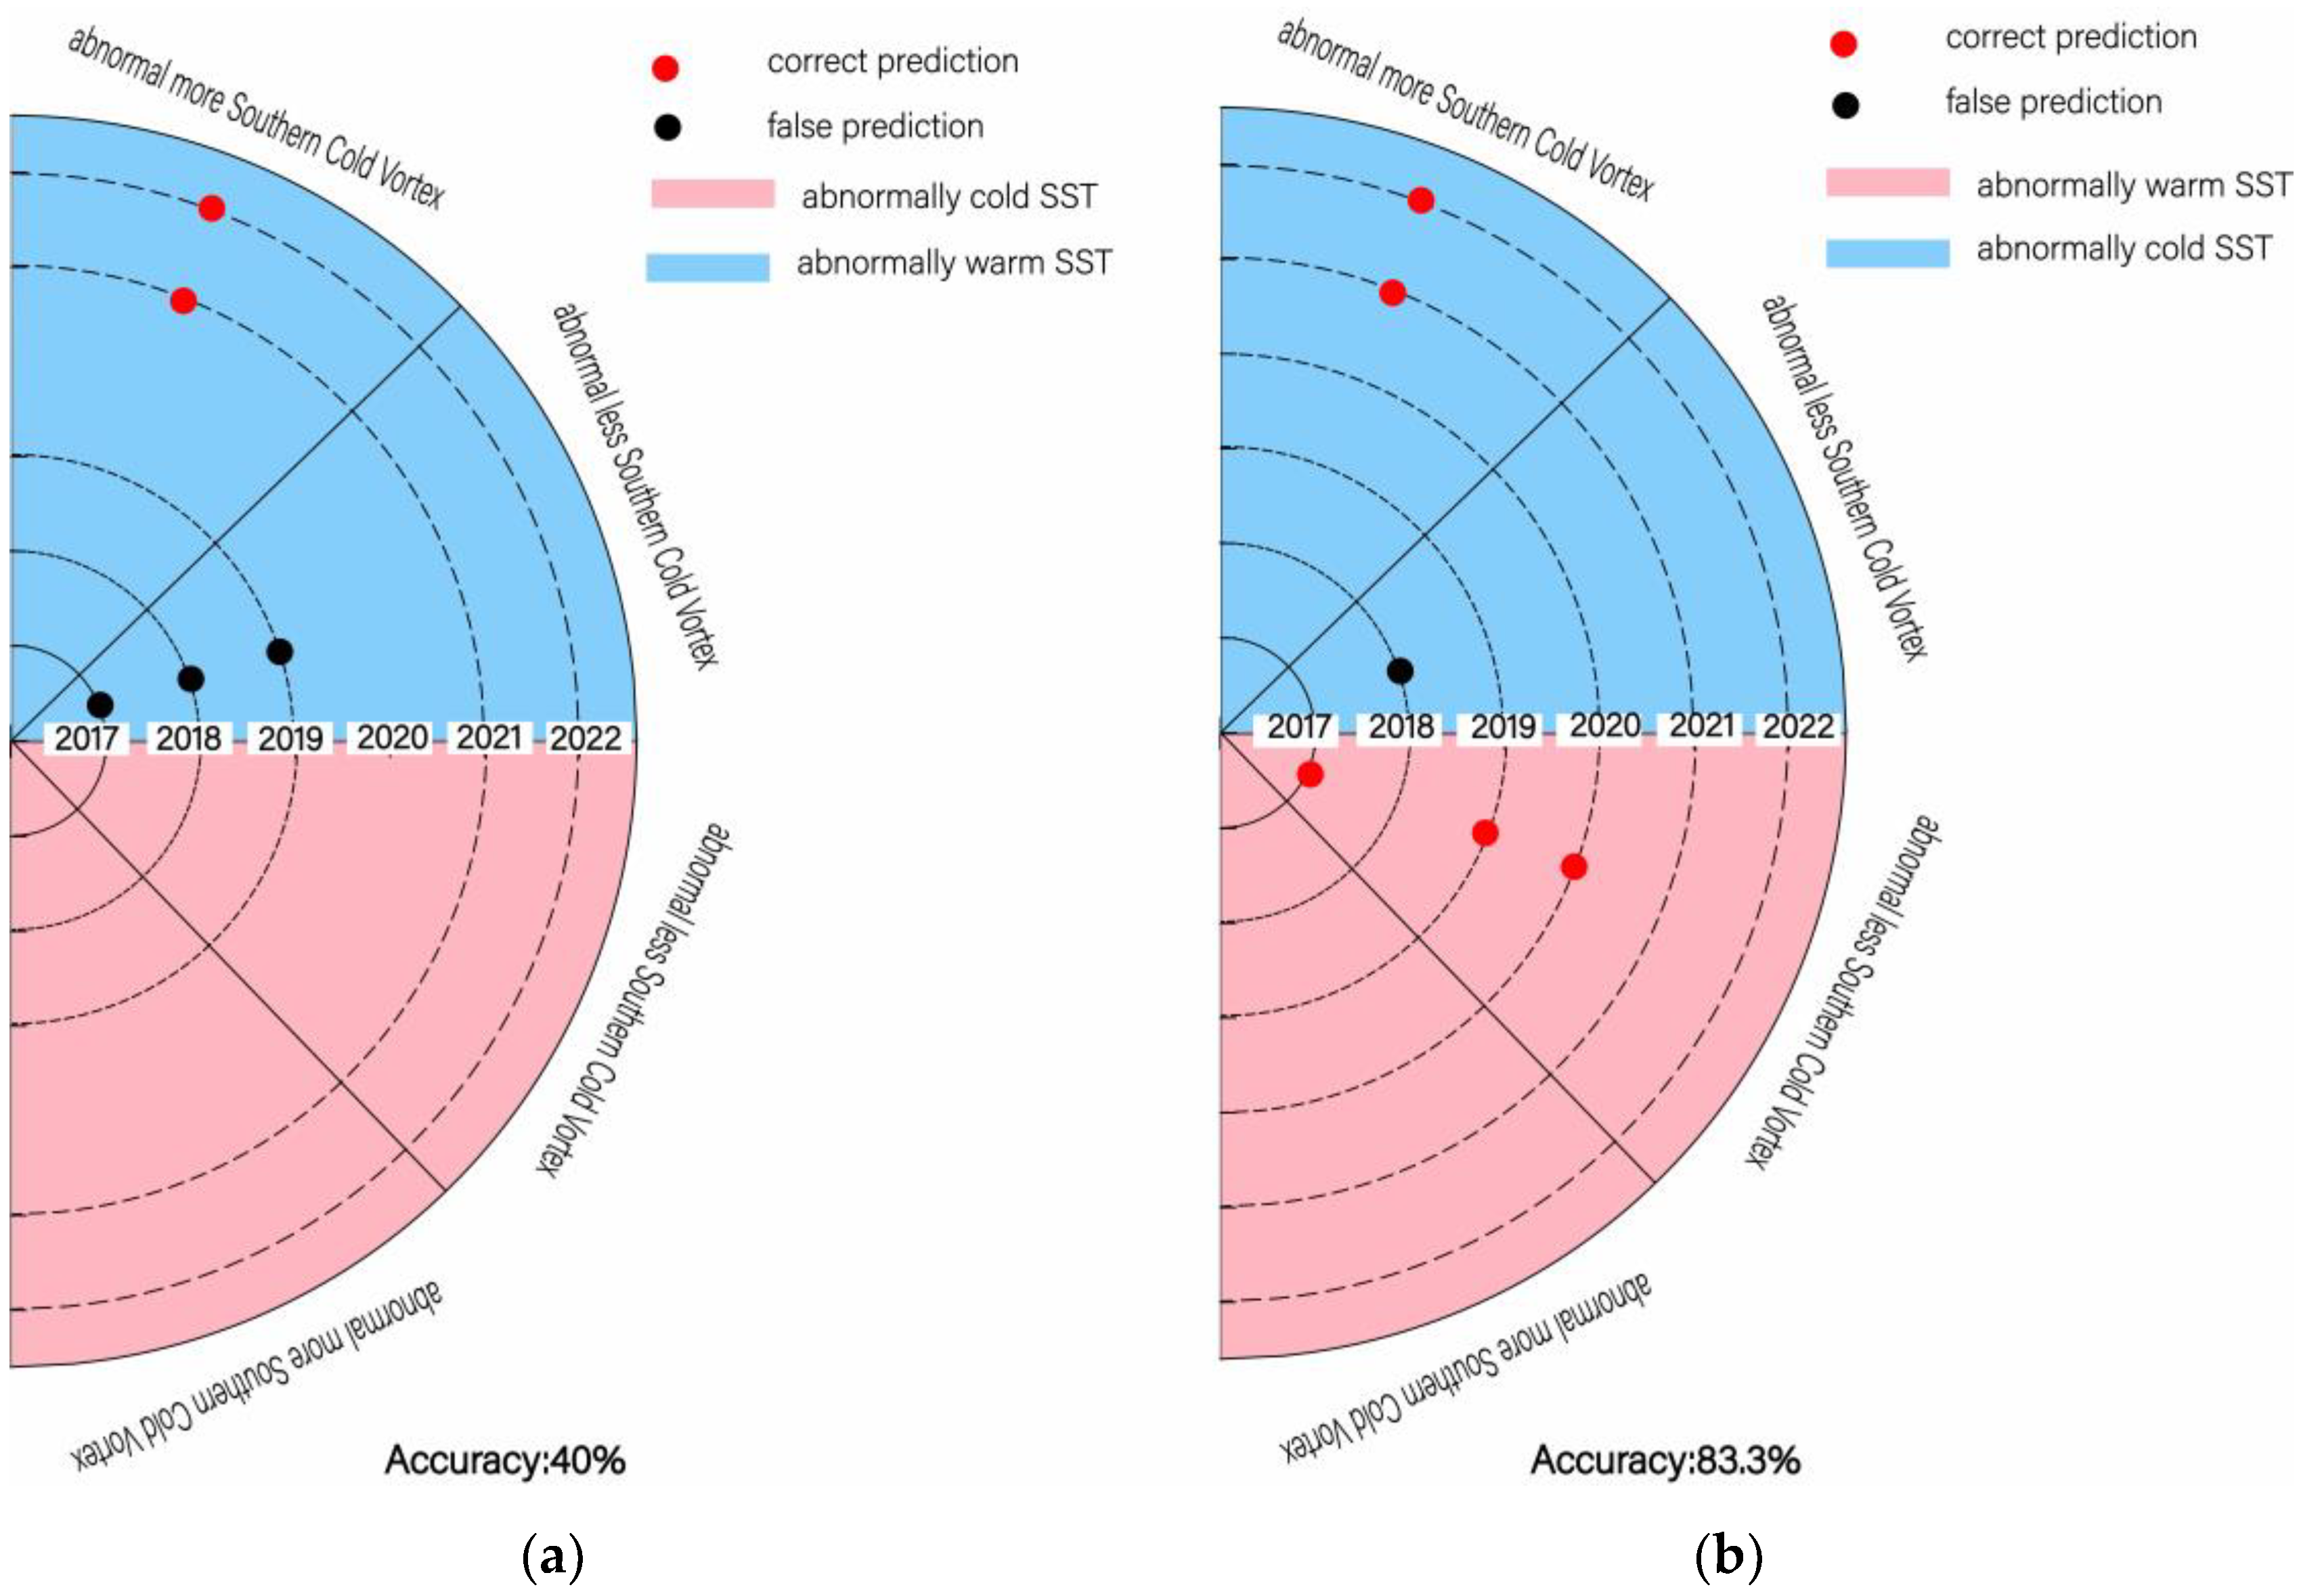
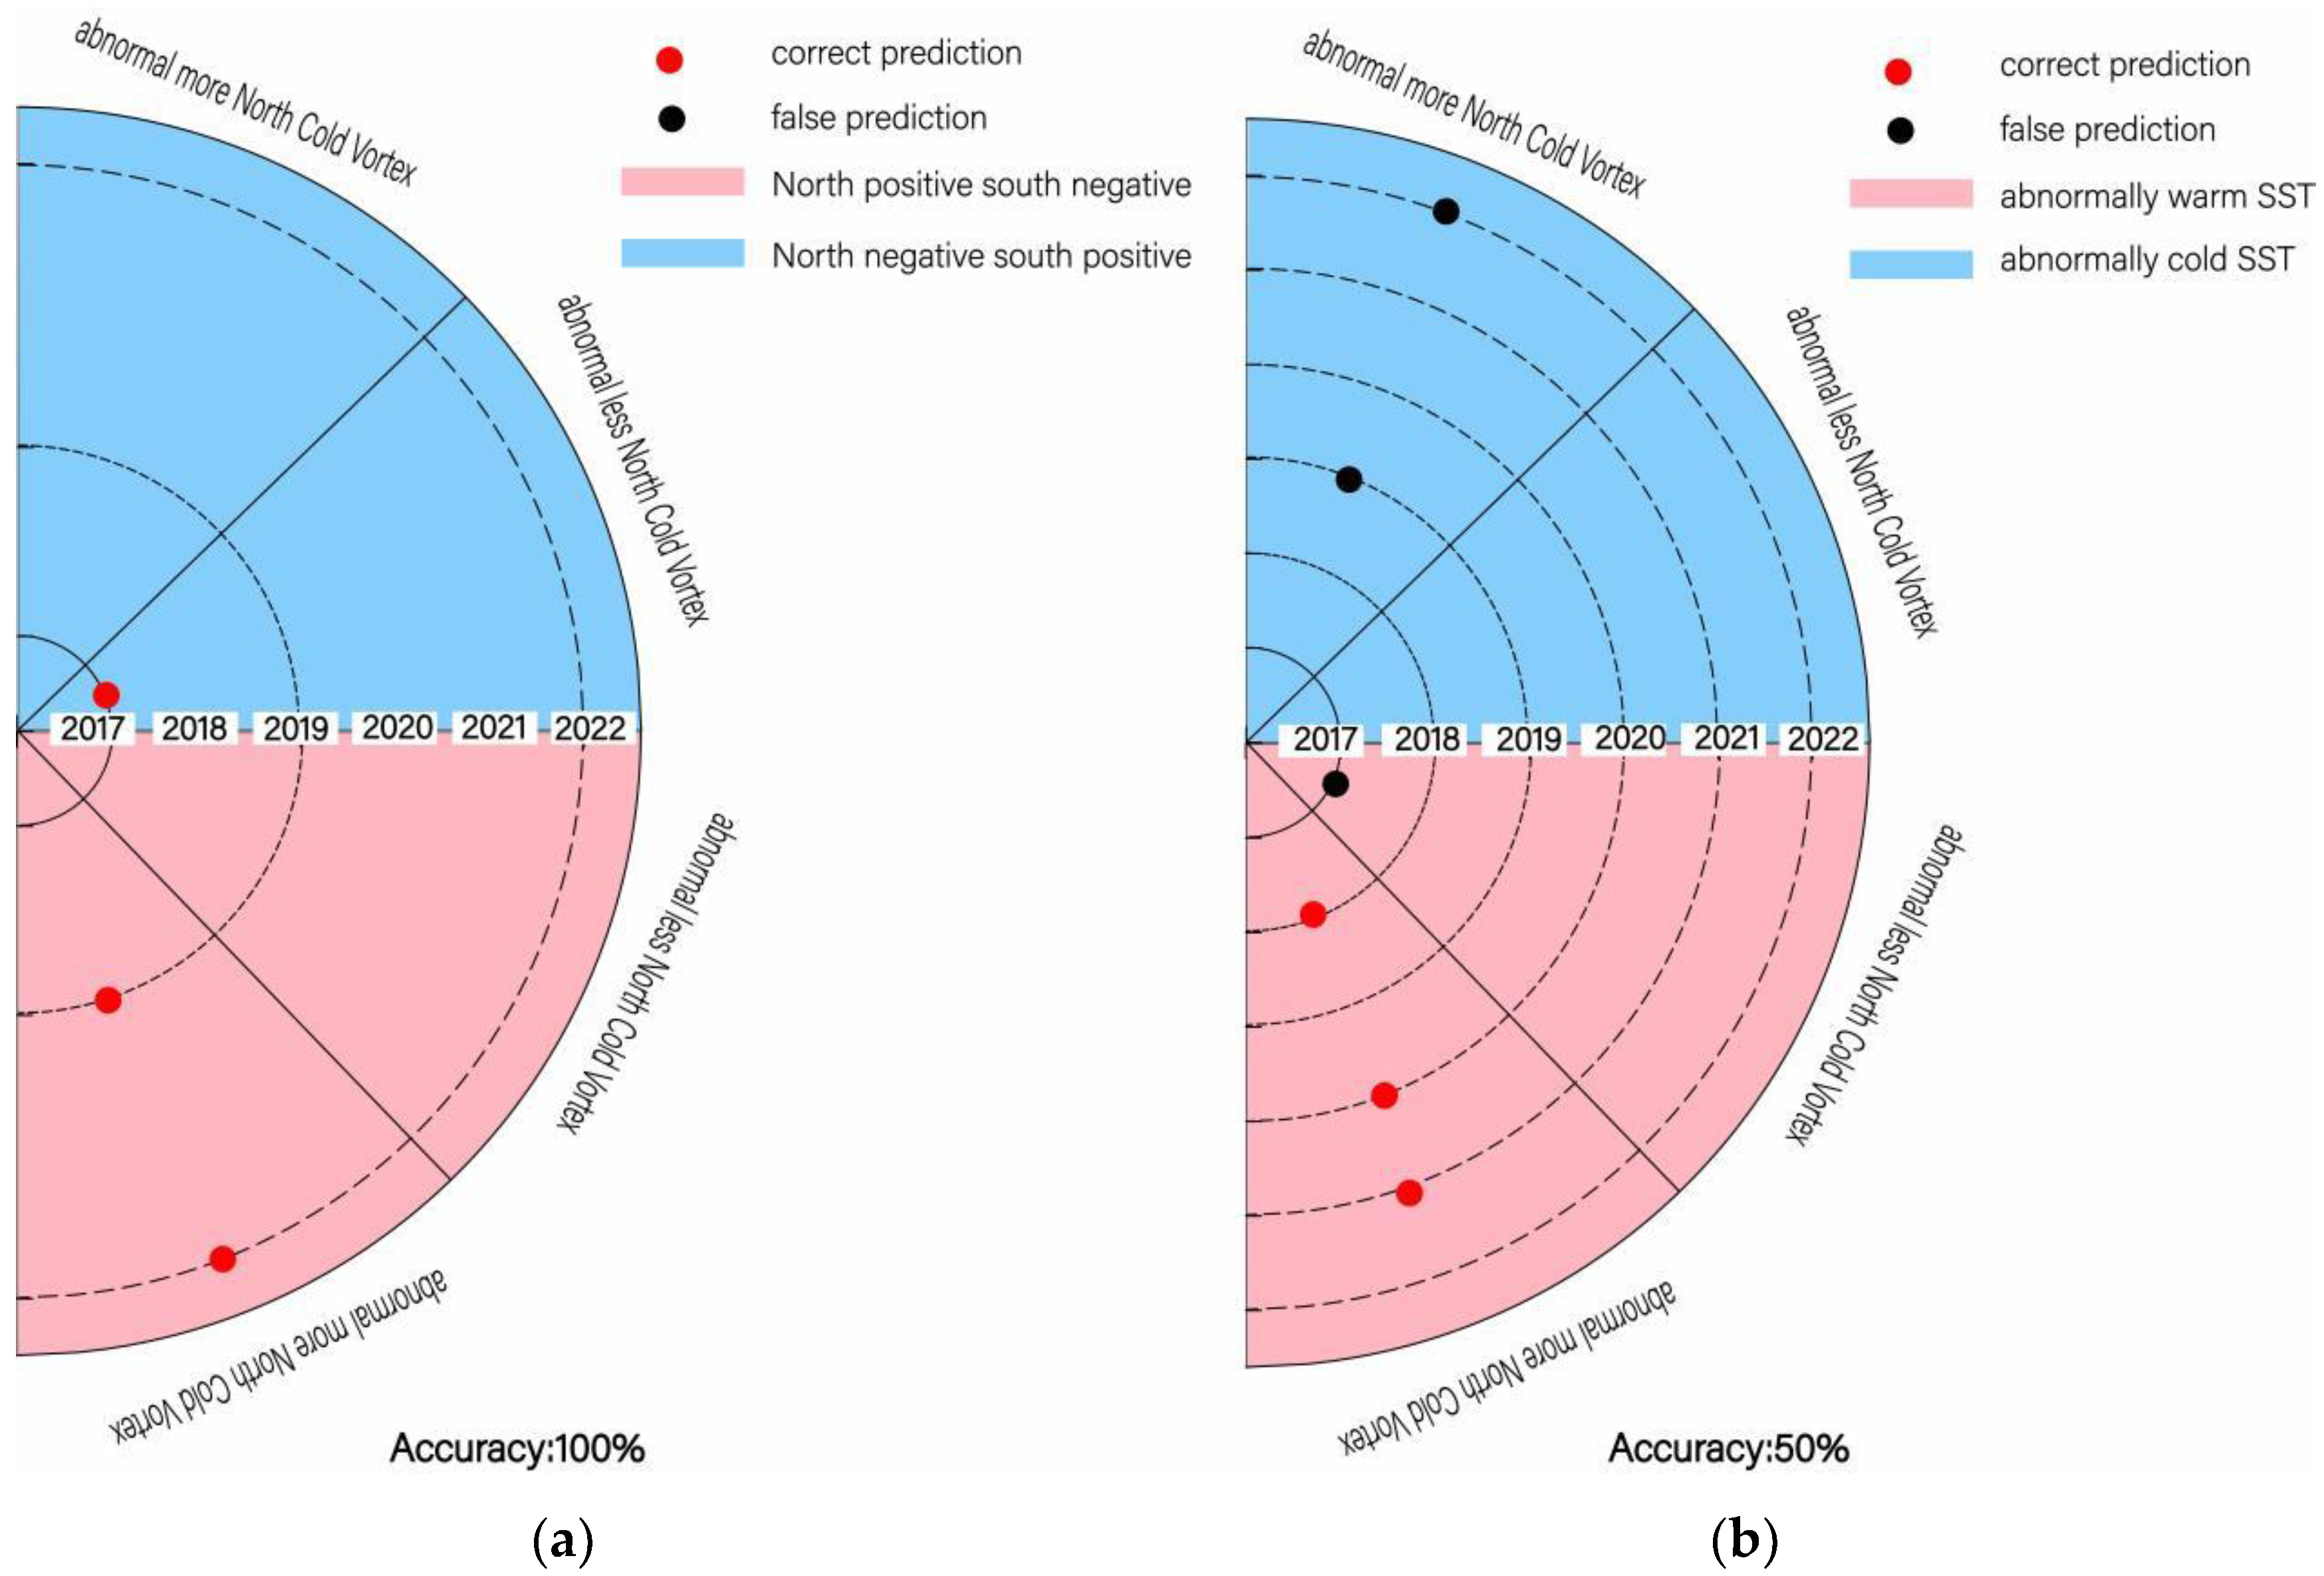
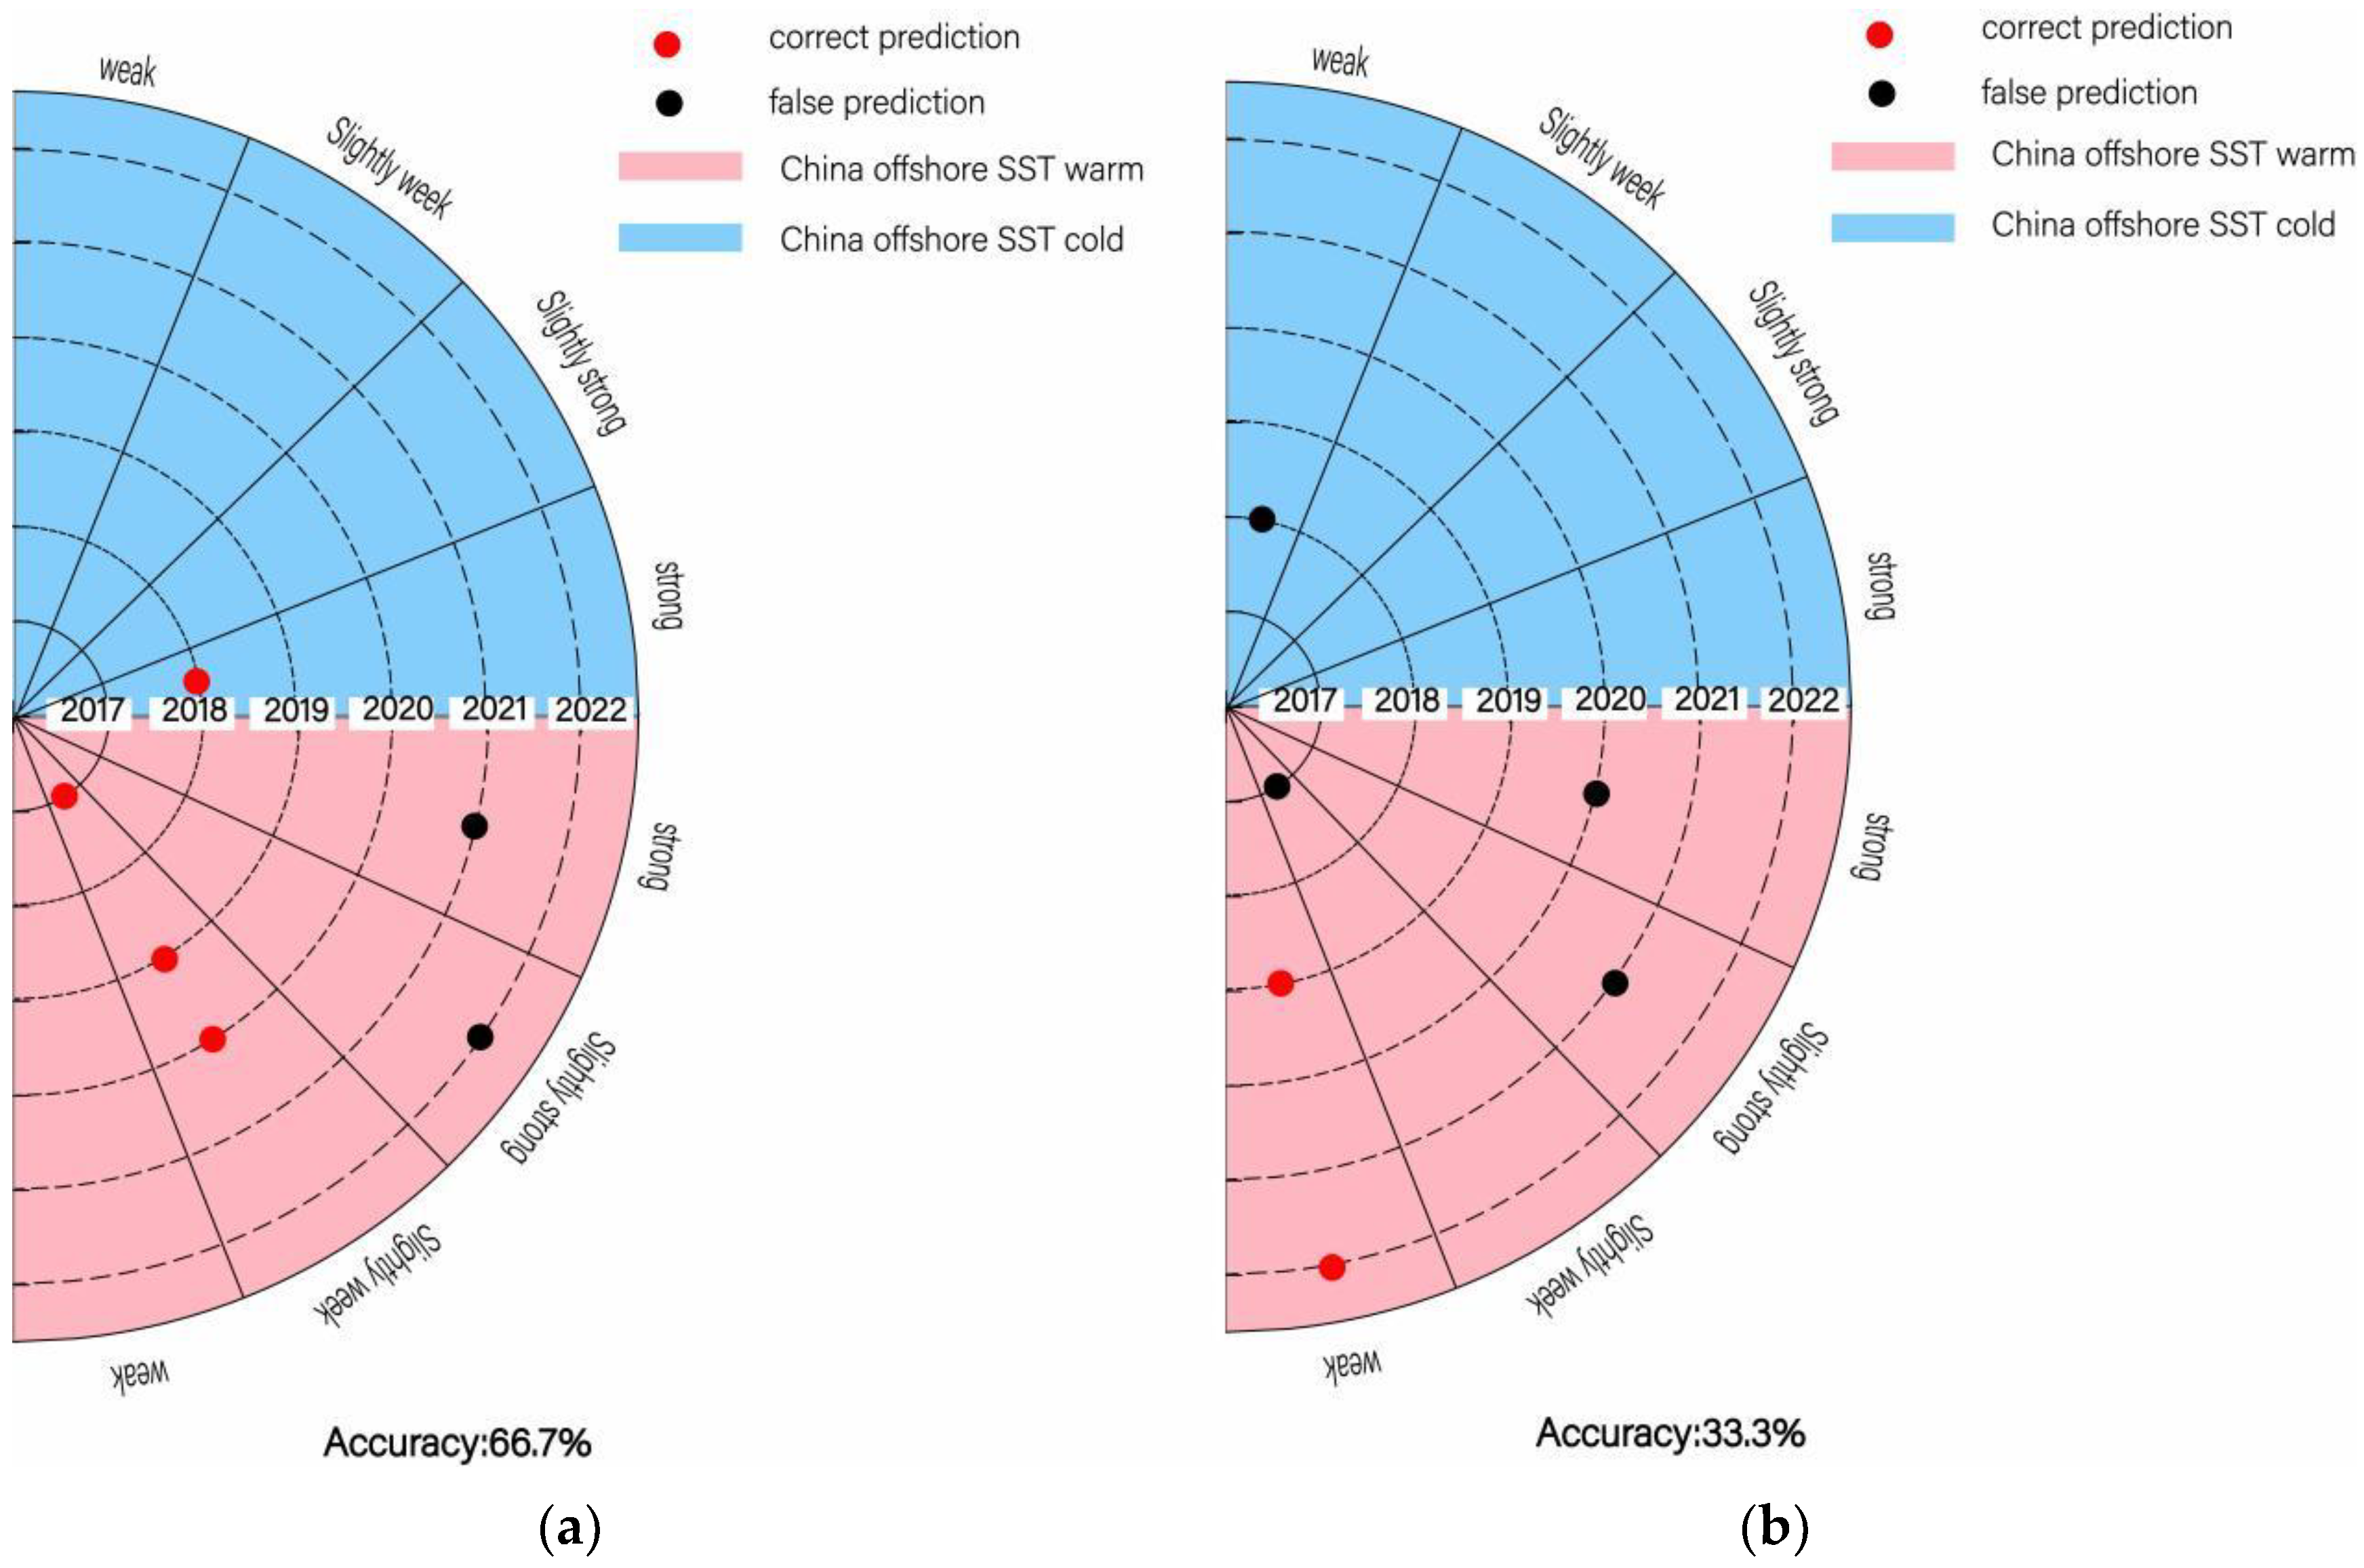
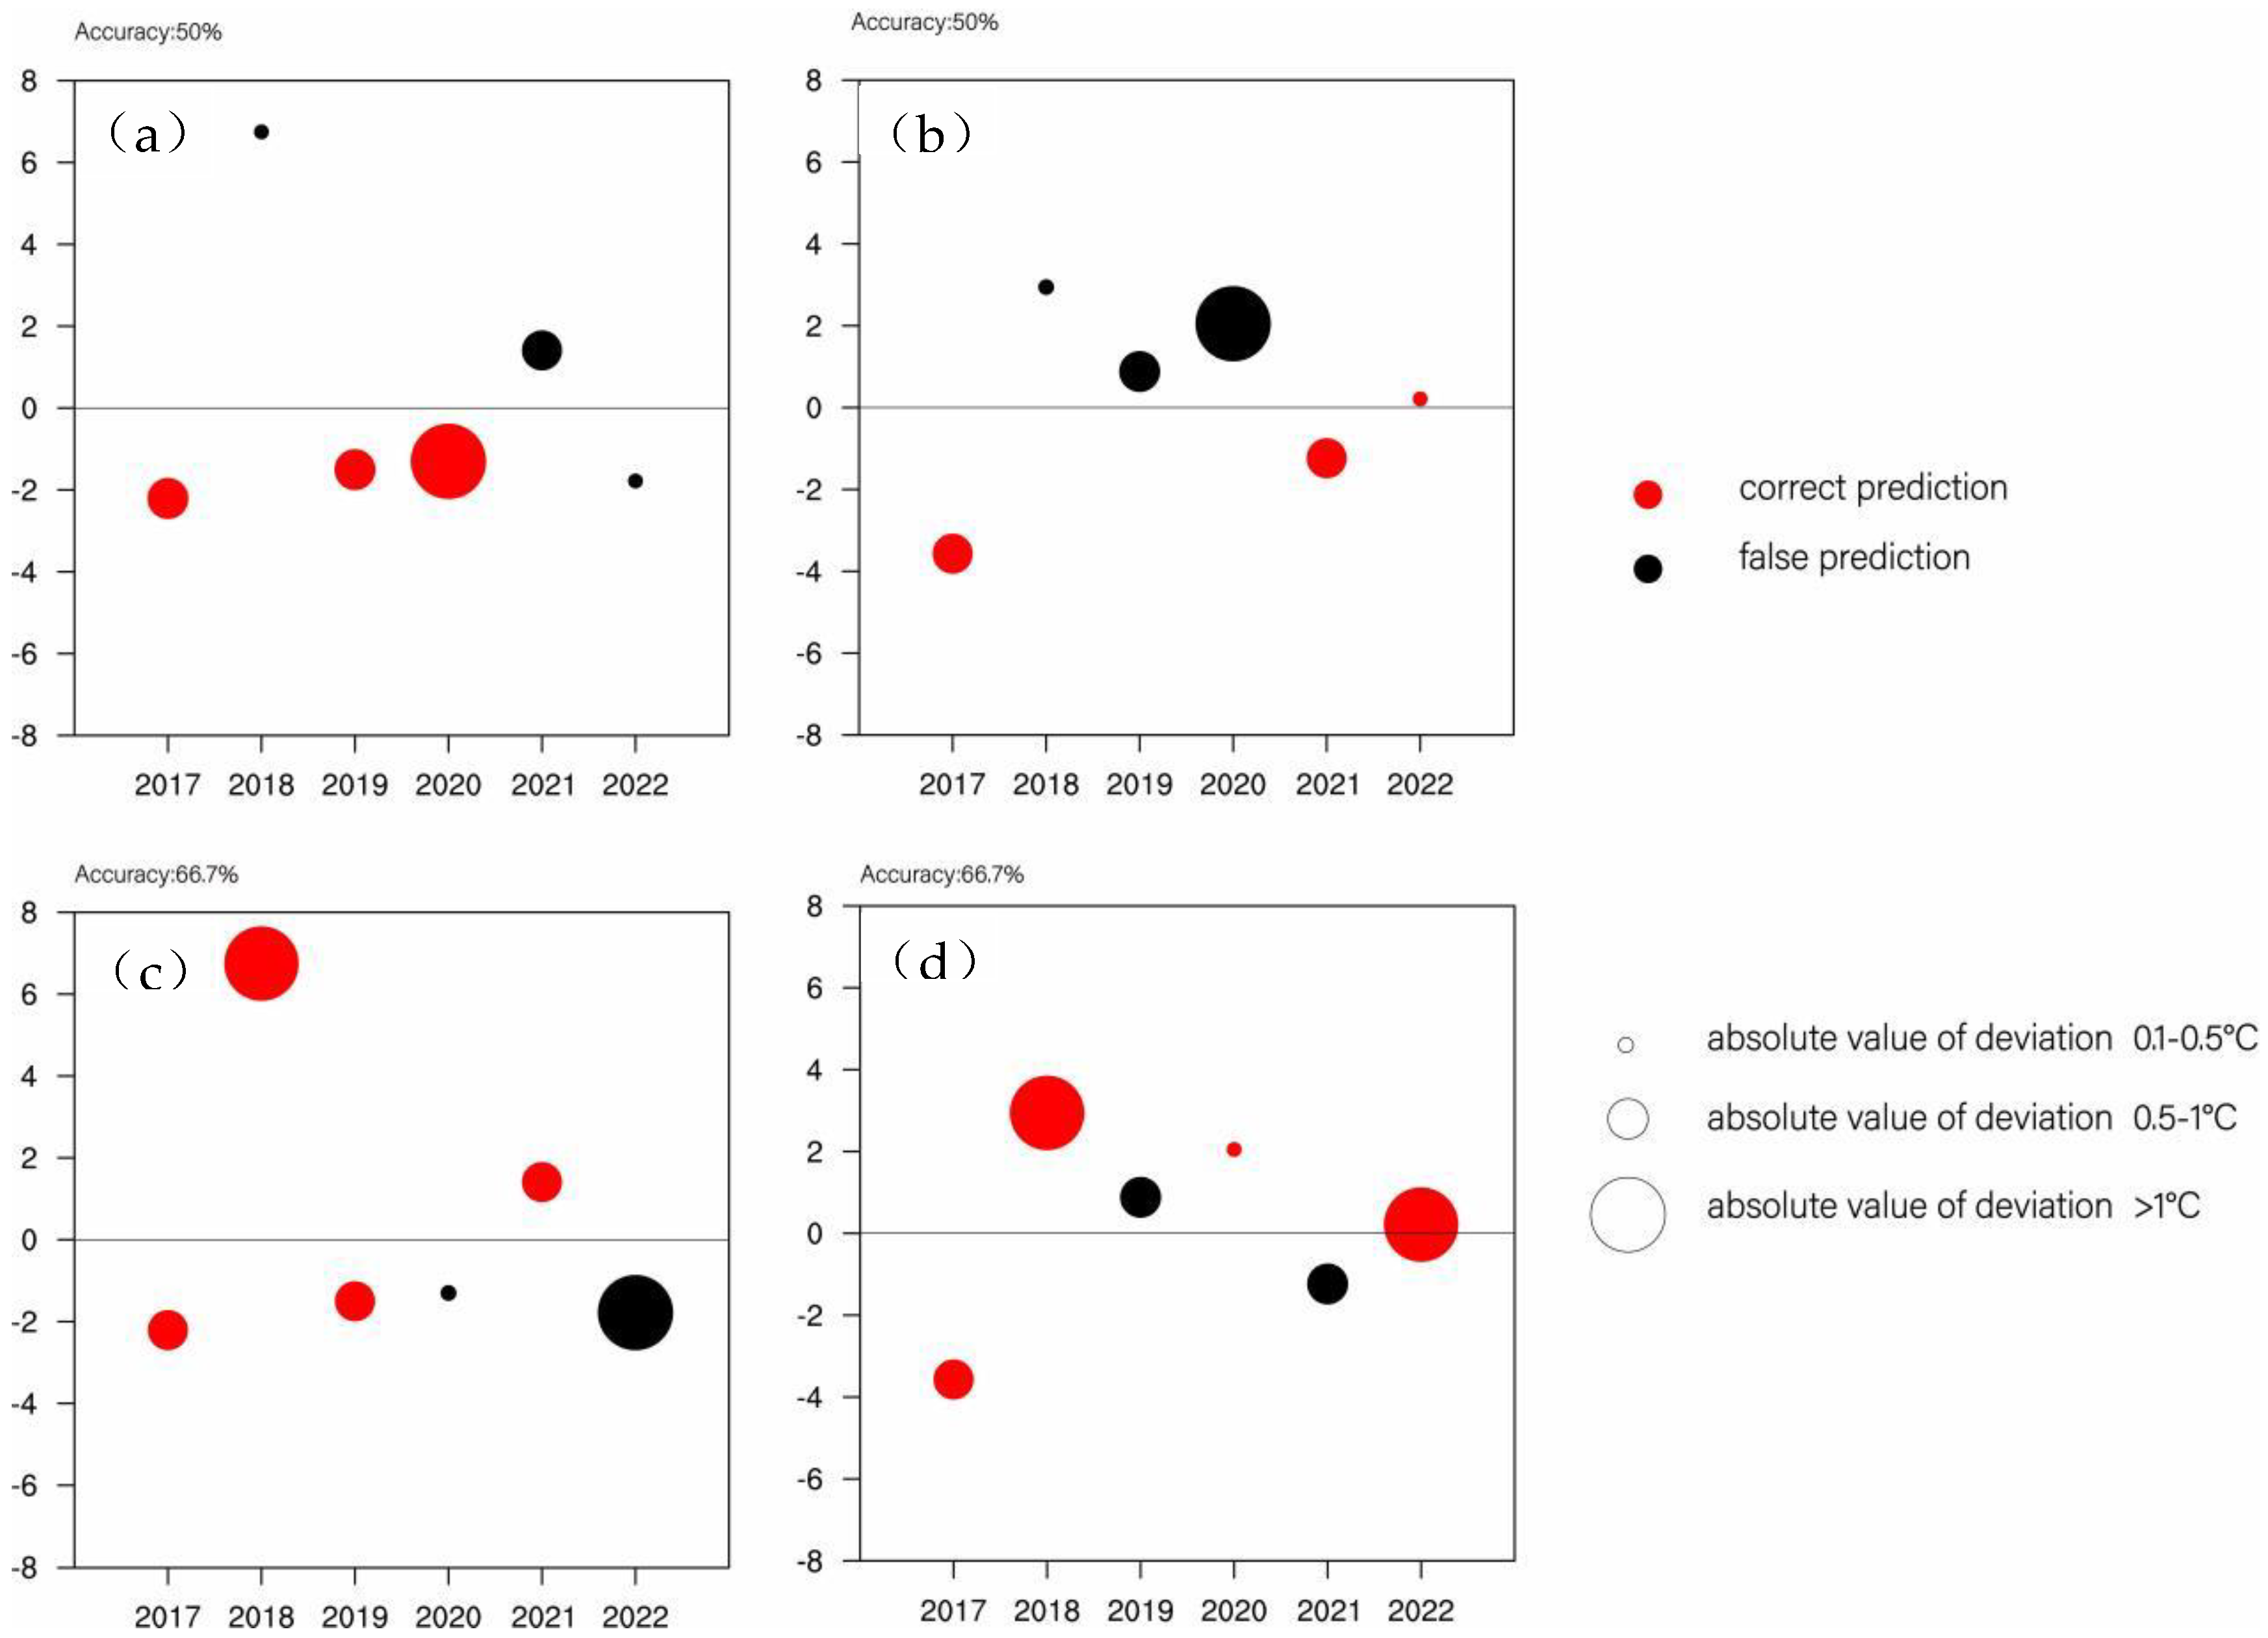
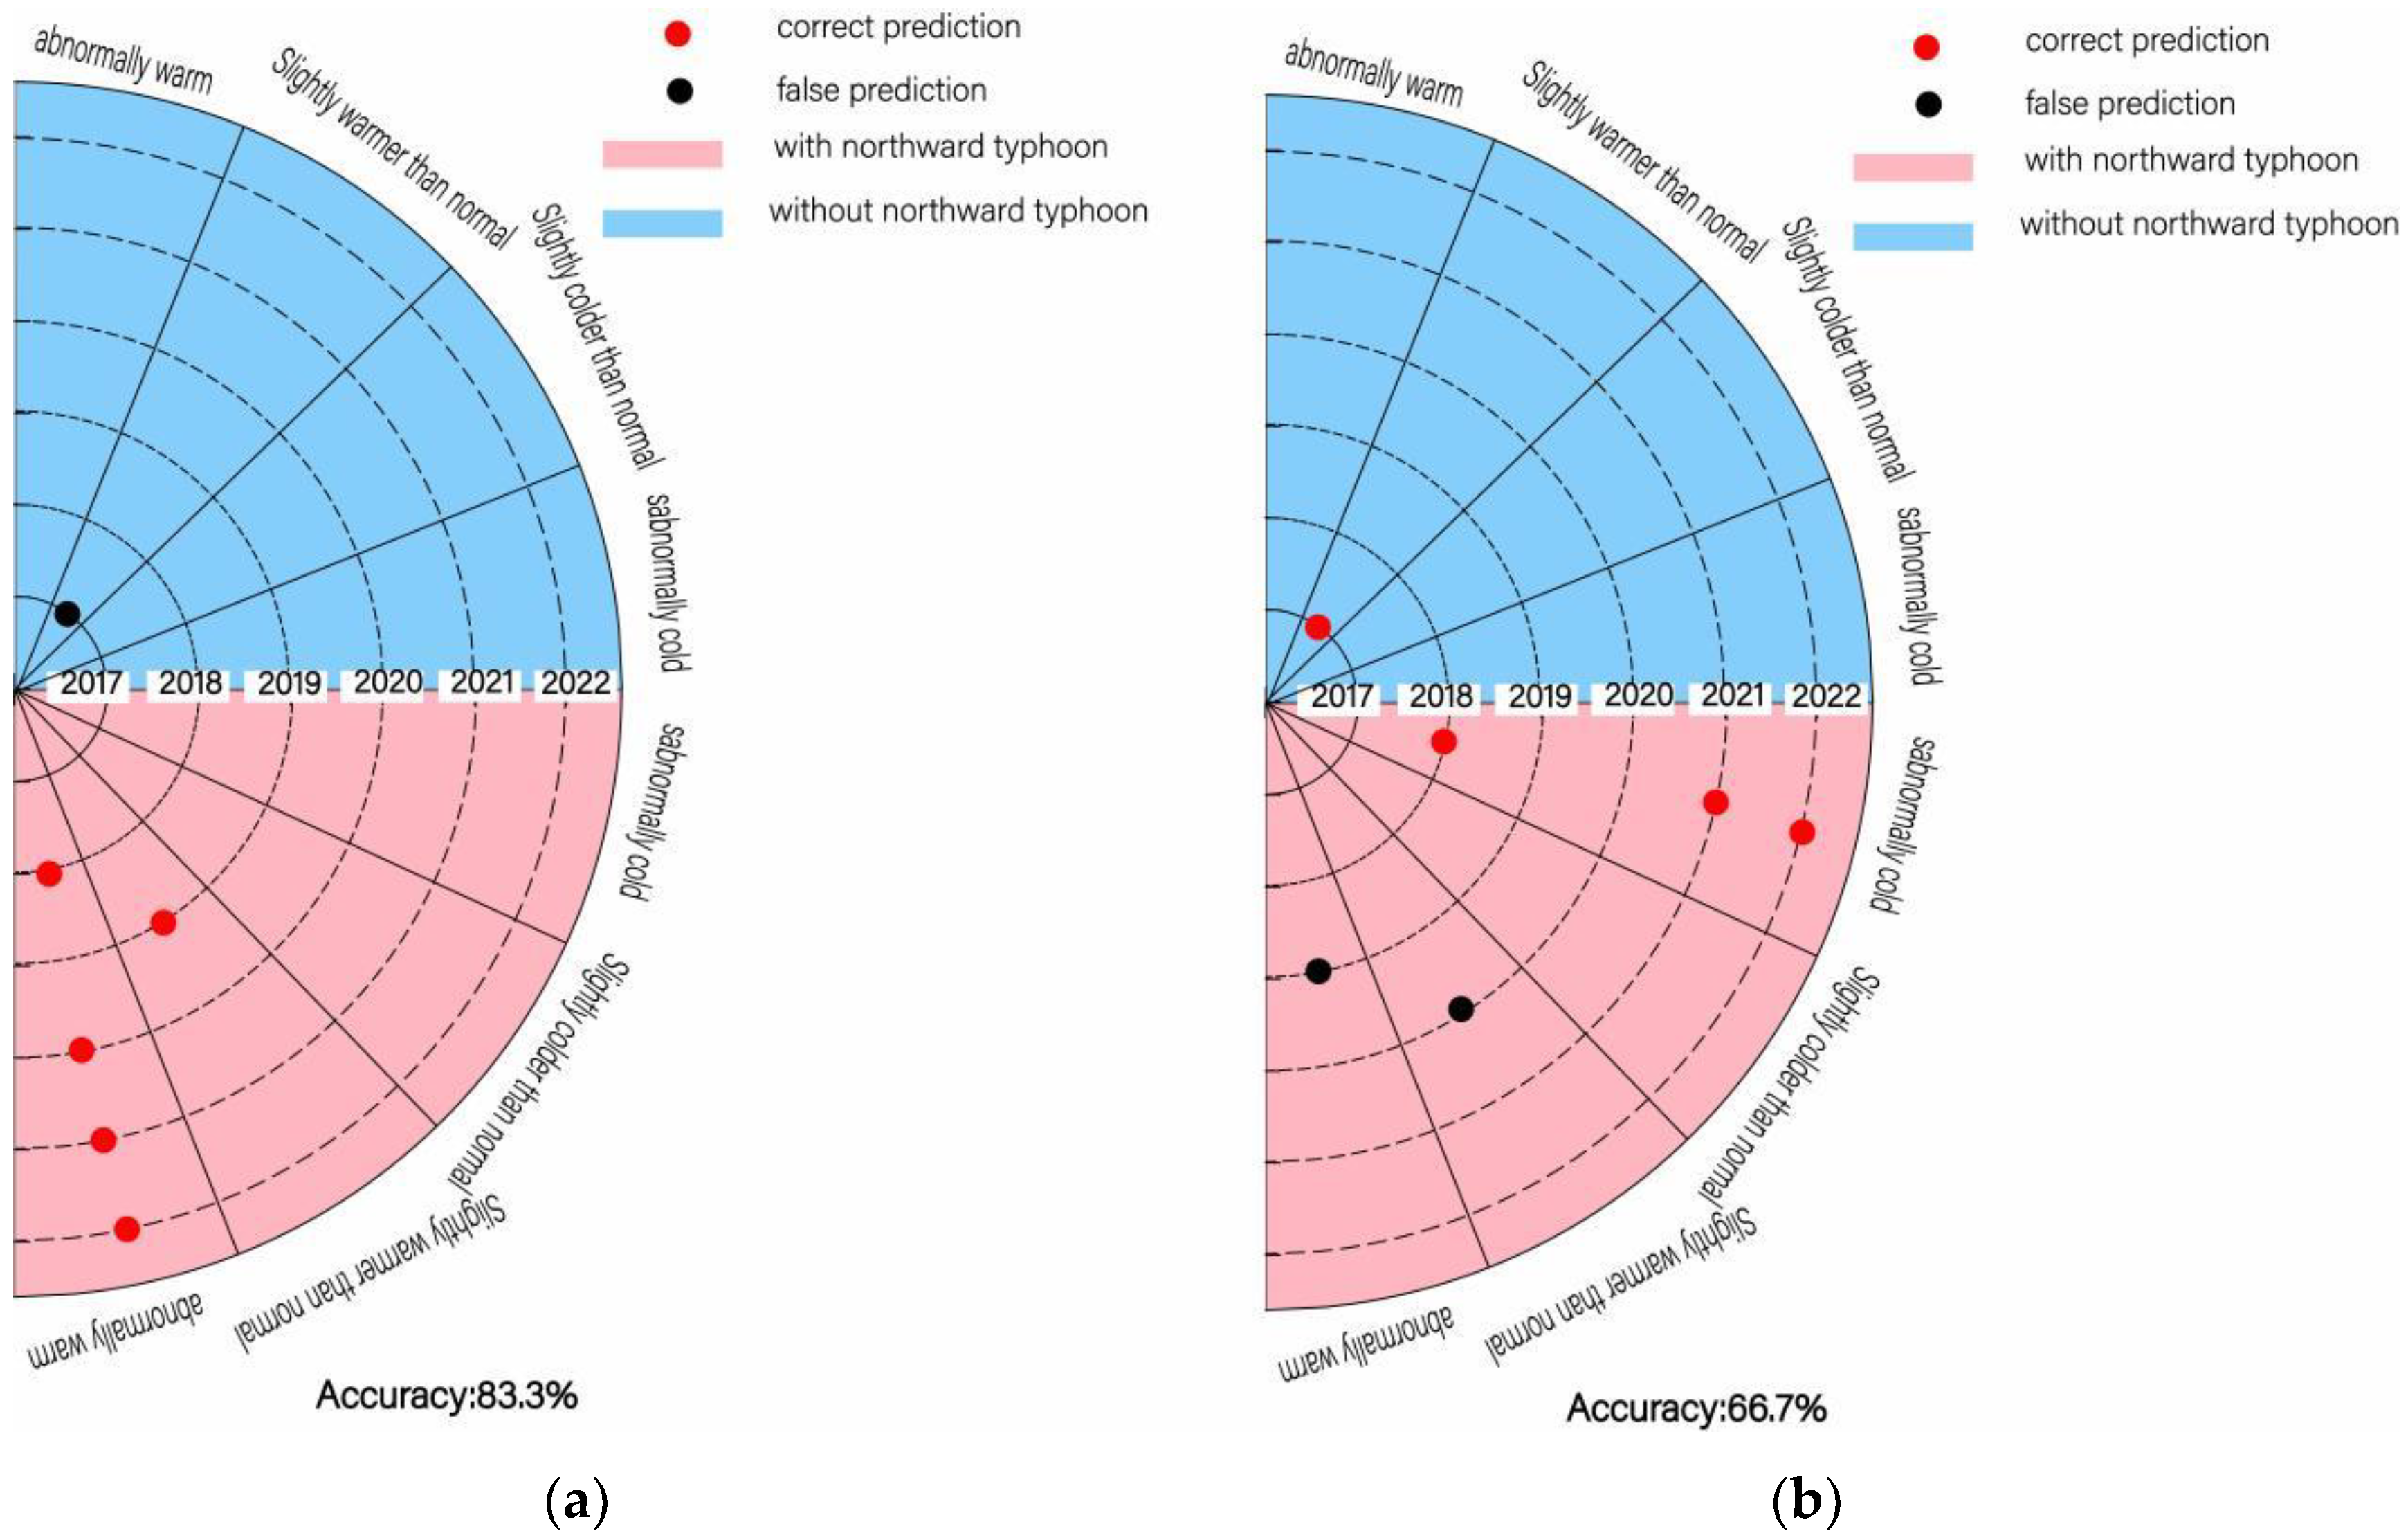
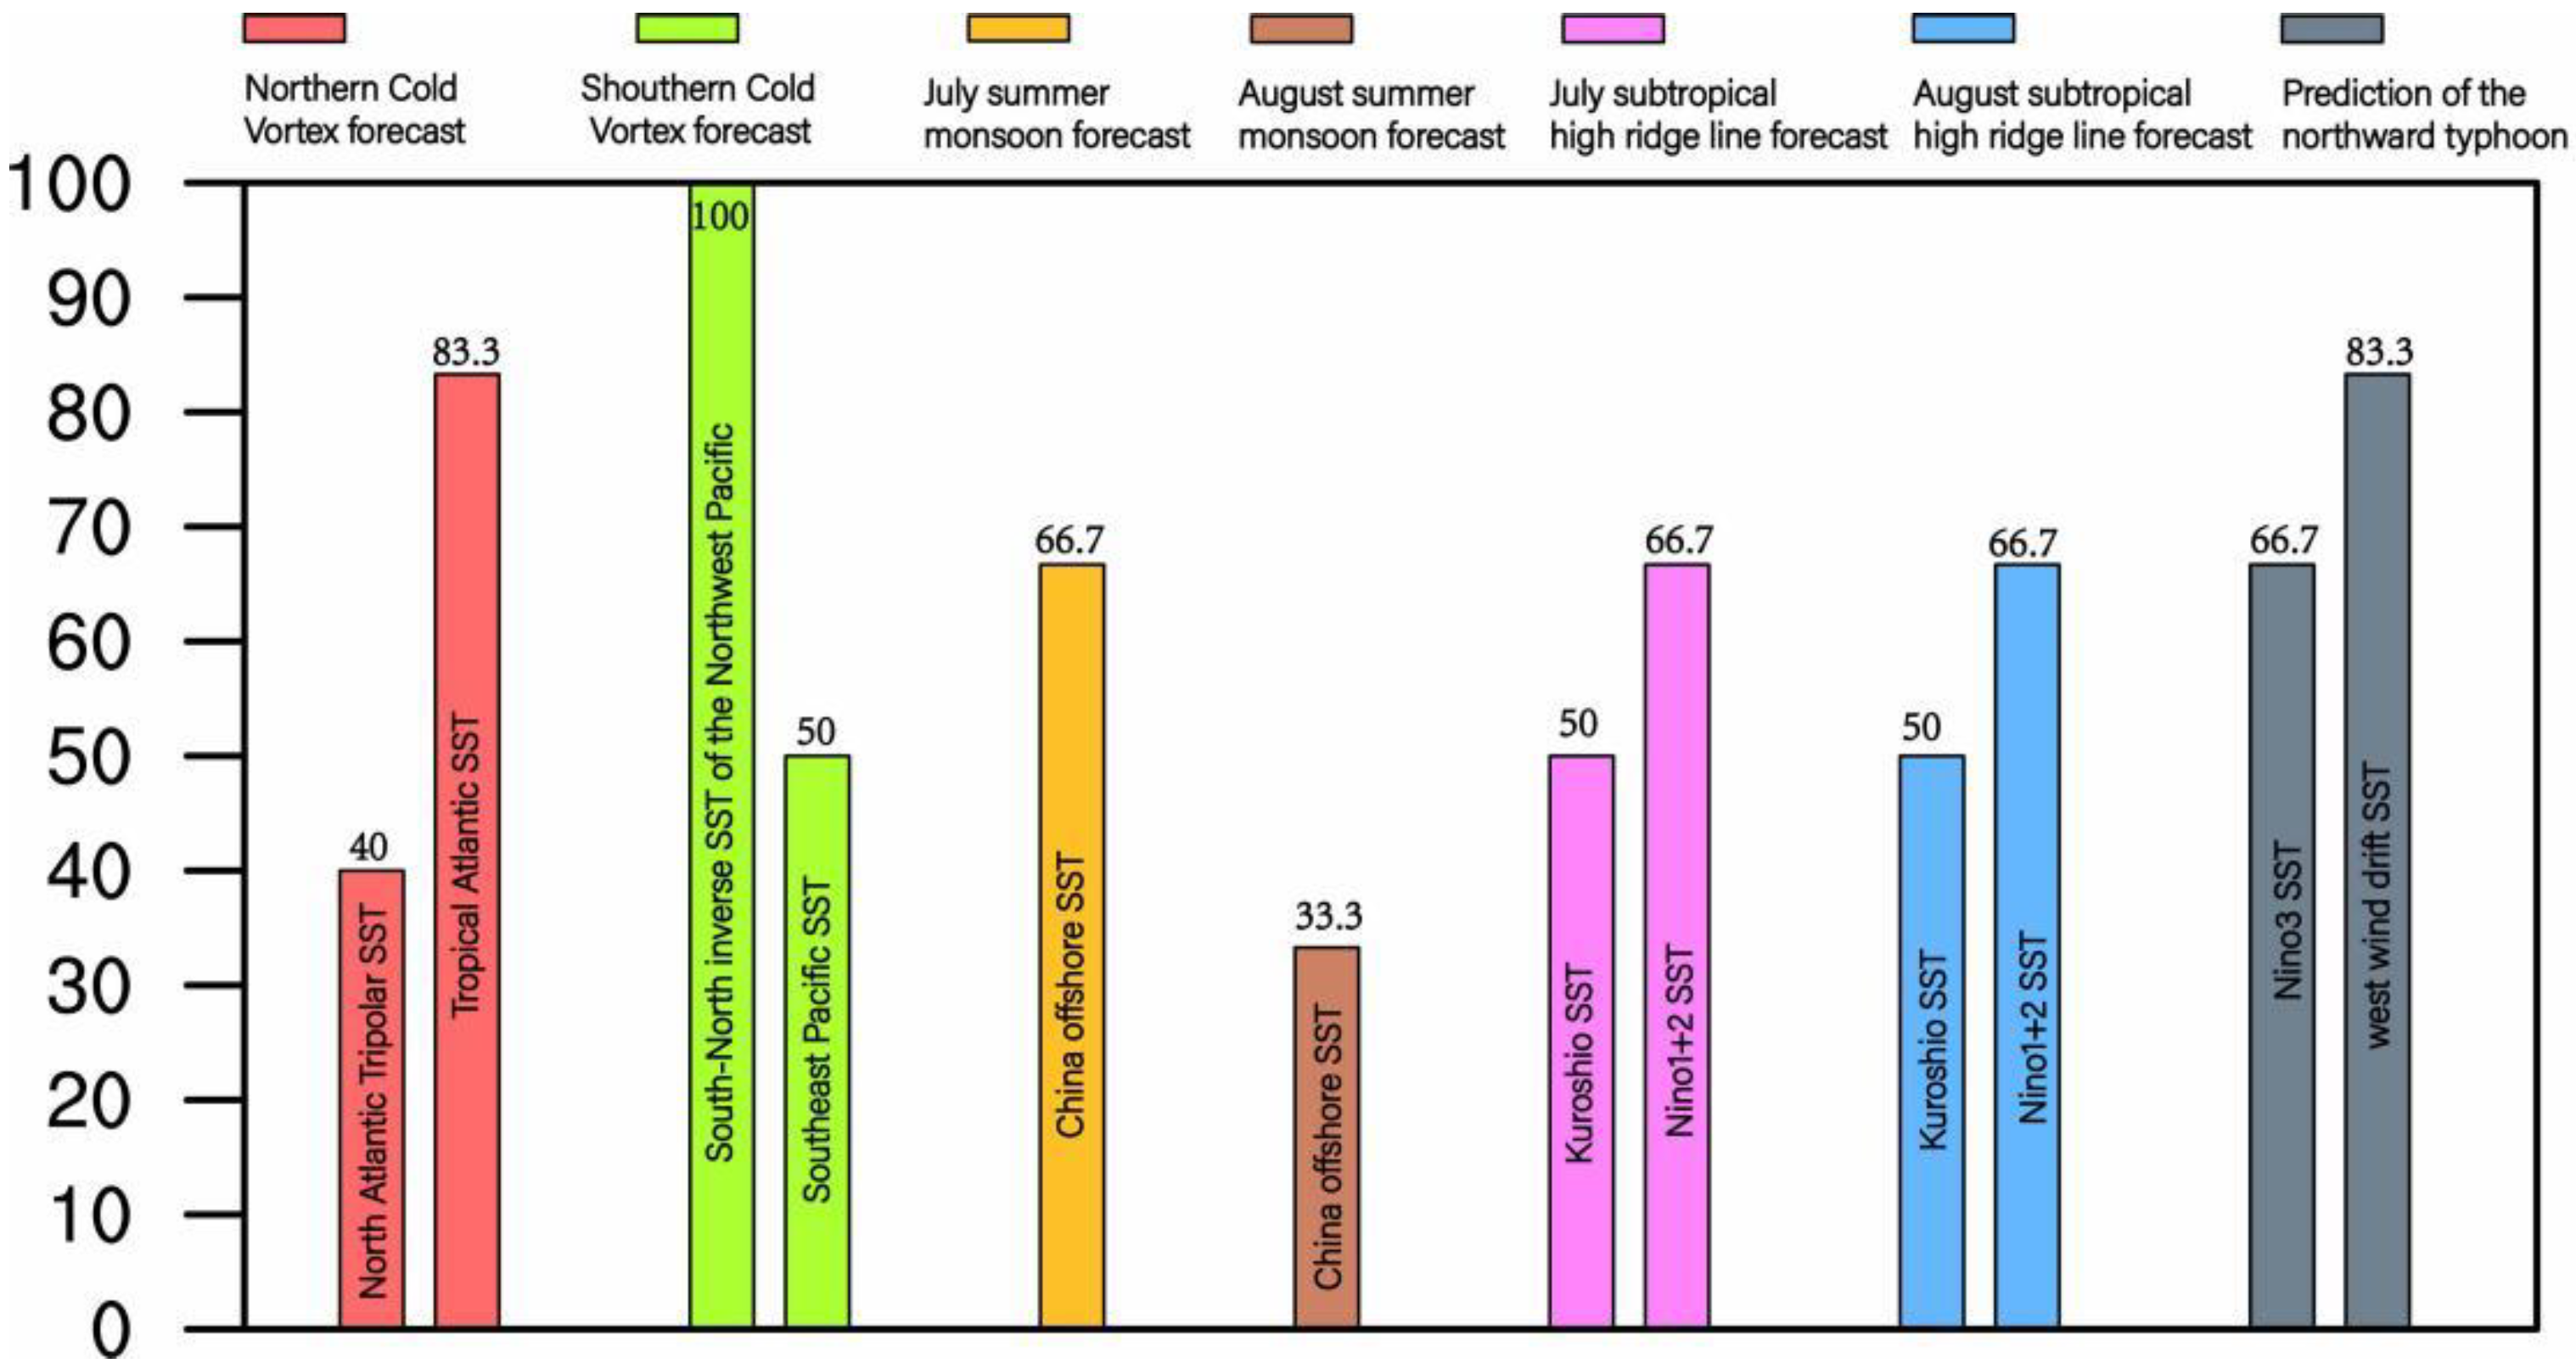
6. Forecast Accuracy of the Influencing Factors of Flood-Season Precipitation in Liaoning

Studies have shown that the early summer precipitation in Liaoning is mainly influenced by the NCV, while the midsummer precipitation is mainly influenced by the WPSH, summer monsoon, and northward-moving typhoons. In operational business, the NAT, the north–south anti-phase SST in northwest Pacific, and the southeast Pacific SST are commonly used to predict the north–south location of the NCV. The offshore SST is used to predict the southerly wind over Northeast China in July and August. The Nino 1+2 SST and Kuroshio SST are used to predict the position of the WPSH in July and August. The SSTs in the Nino 3 area and the west-wind-drift zone are used to predict the number of northward-moving typhoons [32,33]. In the following, we examine the forecast accuracy of the above factors from 2017 to 2022.
There is a noticeable difference in the accuracy of predicting the NCV location using different regional SSTs. Figure 7 shows that, in predicting the southern NCV, the accuracy of using tropical Atlantic SST (83.3%) is higher than using the NAT (40%). The two factors both can accurately predict the NCV when the southern NCVs are higher. When the southern NCV is lower, using NAT can hardly predict the NCV. Figure 8 shows that for the prediction of northern NCV, the northwest Pacific north–south anti-phase SST occurred in 2017, 2019, and 2022, and the forecasts of northern NCV using the northwest Pacific north–south anti-phase SST are all correct in the three years. The forecast accuracy of northern NCV using the southeast Pacific SST is only 50%. When the southeast Pacific SST is warm, the forecast accuracy of more northern NCVs is relatively high.
Figure 9 shows that the forecast accuracies of using the China offshore SST to predict the southerly wind over Northeast China in July and August are 66.7% and 33.3%, respectively. When the China offshore SST is warm, the forecast is better for the weaker southerly wind; however, the forecast is poor for the stronger southerly wind.
Figure 10 shows that, as for the prediction of the position of the WPSH, using the Nino 1+2 SST is better than using the Kuroshio SST. The accuracy of using the Kuroshio SST to predict the position index of the WPSH ridge line in July and August is 50%, while when using the Nino 1+2 SST the accuracy is 66.7%. The Kuroshio SST performs well in predicting the more southerly position of the WPSH, while the Nino 1+2 SST performs better in predicting the more northerly position of the WPSH. When SST anomalies are in the range of 0.5−1°C, both the Kuroshio SST and the Nino 1+2 SST are good predictors of the more southerly WPSH. When SST anomalies are in the range of 0−0.5 °C, both the Kuroshio SST and the Nino 1+2 SST have poor prediction accuracy.
As shown in Figure 11a, the SST in the west-wind-drift zone can well predict the northward-moving typhoons with an accuracy of 83.3%, and the accuracy of using Nino 3 SST is 66.7%. When the SST in the west-wind-drift zone is notably warmer (2018–2022), the prediction accuracy of northward-moving typhoons is 100%. When the Nino 3 SST is cold, it can well predict the typhoon genesis; when the Nino 3 SST is warm (2019 and 2020), the prediction accuracy is low.

7. Conclusions and Discussion

For the flood-season precipitation prediction in Liaoning, the NCC and SRCC products have close PS scores. The closer the forecast leading time of the seasonal model is, the higher the PS score is. The BCC_CSM model initialized in March and the ECMWF model initialized in May perform better than the other model products. The objective methods have the best prediction performance for the flood-season precipitation. The more significant the SST anomaly in the east-central equatorial Pacific is, the higher the PS score of the dynamic–analogue correction method is. The more significant the NAT is, the higher the PS score of the hybrid downscaling method is.
For June precipitation prediction, the PS score of SRCC product is higher than that of the NCC product. Among the model predictions, ECMWF outperforms the others. The optimal scheme is the ECMWF sub-seasonal model initialized at sub-nearest time. Overall, the average of the sub-seasonal models initialized at nearest time is optimal. When the SST anomaly and the central-eastern equatorial Pacific and NAT are significant, the scores of the dynamic–analogue correction and hybrid downscaling methods are relatively high for July precipitation predictions.
For July precipitation prediction, the SRCC product performs better than the NCC product. Among the model predictions, the seasonal and sub-seasonal ECMWF models initialized at the nearest time and the sub-seasonal NCC model initialized at the sub-nearest time have good prediction performance. The PS scores of three objective methods are close to each other.
For August precipitation prediction, the sub-seasonal models are better than the seasonal models. The optimal scheme is the BCC_CSM sub-seasonal model initialized at the sub-nearest time. When the SST anomaly and the central-eastern equatorial Pacific and NAT are significant, the PS scores of the dynamic–analogue correction method and hybrid downscaling method are relatively high.
Figure 12 shows the accuracy of using the tropical Atlantic SST to predict the southern NCV is 83.3%, which is higher than that of the NAT (40%). The accuracy of using the northwest Pacific north–south anti-phase SST to predict the NCV (100%) is higher than that of the southeast Pacific SST (50%).
In midsummer, the accuracies of using the China offshore SST to predict the southerly wind over Northeast China in July and August are 66.7% and 33.3%, respectively. The accuracy of using the Nino 1+2 SST to predict the position of the WPSH ridge line is 66.7%, which is better than that of using the Kuroshio SST (50%). The accuracy of using the SST in the west-wind-drift zone to predict northward-moving typhoons is 83.3%, which is better than that of using the Nino 3 SST (66.7%).
This study presents a comprehensive analysis of the prediction accuracy of flood-season precipitation in Liaoning. The novelty of this study lies in the comprehensive evaluation of the multiple methods for predicting precipitation during the flood season and the accuracy of the circulation characteristics predicted using multiple climatic factors, the local applicability of various medium and long-term climate prediction schemes to Liaoning Province is analyzed, and the results may help improve operational prediction accuracy. The relationship between precipitation circulation factors (such as NCV and northward-moving typhoons) and external forcing signals has been applied in operational business in SRCC. In future studies, first, we would like to increase the number of years of testing because the current study only contains five years of samples, after which we will increase the number of samples used to increase the accuracy of testing in the hope of finding more laws of deviation. Second, we would like to expand the spatial scale of the forecast test because we have only tested the Liaoning Province, after which we will test the Northeast region of China, and a more comprehensive analysis of external forcing signals, such as sea ice and snow cover, will be carried out.

Author Contributions

Conceptualization, D.J.; methodology, Z.K.; software, C.L.; validation, F.L. and Y.Y.; formal analysis, C.L.; investigation, C.Z.; resources, C.Z.; data curation, Y.F.; writing—original draft preparation, C.L.; writing—review and editing, Y.F.; visualization, D.J.; supervision, Y.L.; project administration, D.J.; funding acquisition, Y.F. All authors have read and agreed to the published version of the manuscript.

Funding

This research was funded by the National Natural Science Foundation of China (Grant No. 42005037); Special Project for review and summary, CMA (FPZJ2023-027); Special Project for Innovation and Development, CMA (CXFZ2022J008, CXFZ2021J022); and Research Project of the Institute of Atmospheric Environment, CMA (2021SYIAEKFMS08 and 2020SYIAE08).

Institutional Review Board Statement

Not applicable.

Informed Consent Statement

Not applicable.

Data Availability Statement

The data can be downloaded through the data acquisition scheme in the article, or the author can provide relevant data.

Conflicts of Interest

The authors declare no conflict of interest.

References

  1. Zhou, L.Y.; Ding, Y.H. Characteristics of rainstorm in Northeast China in 1961–2005. Plateau Meteorol. 2010, 29, 1314–1321. [Google Scholar]
  2. Li, G.Y. Went to guide the work of Liaoning Raoyang River rescue. China Water Conserv. 2022, 6. [Google Scholar]
  3. Giannaros, C.; Dafis, S.; Stefanidis, S.; Giannaros, T.M.; Koletsis, I.; Oikonomou, C. Hydrometeorological analysis of a flash flood event in an ungauged Mediterranean watershed under an operational forecasting and monitoring context. Meteorol. Appl. 2022, 29, e2079. [Google Scholar] [CrossRef]
  4. Shi, Y.Q.; Gao, S.Y.; Sun, J.; Zhan, Y. Analysis of the Characteristics and Mechanism of a Regional Heavy Rain Event in Liaoning Province. Plateau Meteorol. 2022, 41, 630–645. [Google Scholar]
  5. Lagasio, M.; Fagugli, G.; Ferraris, L.; Fiori, E.; Gabellani, S.; Masi, R.; Mazzarella, V.; Milelli, M.; Parodi, A.; Pignone, F.; et al. A Complete Meteo/Hydro/Hydraulic Chain Application to Support Early Warning and Monitoring Systems: The Apollo Medicane Use Case. Remote Sens. 2022, 14, 6348. [Google Scholar] [CrossRef]
  6. AR6 Synthesis Report: Climate Change 2023. Available online: https://www.ipcc.ch/report/sixth-assessment-report-cycle/ (accessed on 25 March 2023).
  7. Zhang, D.; Sun, F.H.; Zhang, Y.C. Evaluation of seasonal prediction for summer rainfall in China based on BCC second-generation short-range climate forecast system. Plateau Meteorol. 2019, 38, 1229–1240. [Google Scholar]
  8. Shi, Y.J.; Ren, Y.L.; Wang, S.G.; Shang, K.Z.; Li, X.; Zhou, G.L. Verification of simulation ability of BCC_CSM climate model in regional climate change in China. Plateau Meteorol. 2012, 31, 1257–1267. [Google Scholar]
  9. Jiang, Y.M.; Huang, A.N.; Wu, H.M. Evaluation of the performance of Beijing climate center climate system model with different horizontal resolution in simulating the annual surface temperature over Central Asia. Chin. J. Atmos. Sci. 2015, 39, 535–547. [Google Scholar]
  10. Cheng, Z.; Gao, H.; Zhu, Y.J.; Shi, Y.L.; Liu, J.J.; Wang, X.J. Evaluation on the performance of BCC second-generation climate system model for East Asian summer climate prediction. Meteormon Digimon 2020, 46, 1508–1519. [Google Scholar]
  11. Pan, L.J.; Zhang, H.F.; Zhu, W.J.; Wang, N.; Wang, J.P. Forecast performance verification of the ECMWF model over the Northeast Hemisphere. Clim. Environ. Res. 2013, 18, 111–123. [Google Scholar]
  12. Cao, Y.; Zhao, L.N.; Gong, Y.F.; Xu, D.B.; Gao, Y.J. Evaluation and error analysis of precipitation forecast capability of the ECMWF high-resolution model. Torrential Rain Disasters 2019, 38, 249–258. [Google Scholar]
  13. Huang, X.M.; Jiang, X.W.; Xiao, D.M. Prediction Analysis of Summer Monthly Precipitation and Circulation of 2015 in China by the NCEP CFSv2. Plateau Mt. Meteorol. Res. 2016, 36, 48–58. [Google Scholar]
  14. Chi, Y.Z.; Liang, X.Y.; He, F.; Wu, J.W.; Tang, Z.F. Verification and preliminary correction of the precipitation prediction in the pre-flood season over Fujian province by BCC_CSM1.1m climate model. Clim. Change Res. 2020, 16, 714–724. [Google Scholar]
  15. Chen, S.R.; Zhou, X.H.; He, H.G. Temperature and precipitation evaluation of monthly Dynamic extended range forecast Operational system DERF2.0 in Guangxi. J. Meteorol. Res. Appl. 2016, 37, 16–19. [Google Scholar]
  16. Ma, H.; Yu, F.; Ce, J.W.; Xiao, J.J.; Gao, D.W. Assessment of multi-scale forecast skill of CFSv2 for Meiyu precipitation over Zhejiang in 2018. J. Meteorol. Sci. 2022, 42, 690–702. [Google Scholar]
  17. De Andrade, F.M.; Coelho, C.A.S.; Cavalcanti, I.F.A. Global precipitation hindcast quality assessment of the Subseasonal to Seasonal (S2S) prediction project models. Clim. Dyn. 2019, 52, 5451–5475. [Google Scholar] [CrossRef]
  18. Zhang, L.; Kim, T.; Yang, T.; Hong, Y.; Zhu, Q. Evaluation of Subseasonal-to-Seasonal (S2S) precipitation forecast from the North American Multi-Model ensemble phase II (NMME-2) over the contiguous U.S. J. Hydrol. 2021, 603, 12705. [Google Scholar] [CrossRef]
  19. Fan, K.; Liu, Y.; Chen, H.P. Improving the Prediction of the East Asian Summer Monsoon: New Approaches. Weather Forecast. 2012, 27, 1017–1030. [Google Scholar] [CrossRef]
  20. Liu, Y.; Ren, H.L.; Zhang, P.Q.; Jia, X.L.; Liu, X.W.; Sun, L.H. Improve the prediction of summer precipitation in South China by a new approach with the Tibetan Plateau snow and the applicable experiment in 2014. Chin. J. Atmos. Sci. 2017, 41, 313–320. [Google Scholar]
  21. Wang, Q.G.; Feng, G.L.; Zheng, Z.H.; Zhi, R. A study of the objective and quantifiable forecasting based on optimal factors combinations in precipitation in the middle and lower reaches of the Yangtze River in summer. Chin. J. Atmos. Sci. 2011, 35, 287–297. [Google Scholar]
  22. Fang, Y.H.; Chen, H.S.; Gong, Z.Q.; Xu, F.S.; Zhao, C.Y. Multi-scheme corrected dynamic-analogue prediction of summer precipitation in Northeastern China based on the BCC_CSM. J. Meteor. Res. 2017, 31, 1085–1095. [Google Scholar] [CrossRef]
  23. Yang, J.; Zhao, J.H.; Zheng, Z.H.; Xiong, K.G.; Shen, B.Z. Estimating the prediction errors of dynamical climate model on the basis of prophase key factors in North China. Chin. J. Atmos. Sci. 2012, 36, 11–22. [Google Scholar]
  24. Jiang, L.L.; Yu, H. A research on the prediction of typhoon extreme precipitation based on dynamic similitude methods. J. Trop. Meteor. 2019, 35, 353–364. [Google Scholar]
  25. Peng, J.B.; Buhe, C.L.; Zheng, F.; Chen, H.; Lang, X.M.; Zhan, Y.L.; Lin, Z.H.; Zhang, Q.Y.; Lin, R.; Li, C.; et al. Seasonal Outlook of China for Summer 2019. Bull. Chin. Acad. Sci. 2019, 34, 693–699. [Google Scholar]
  26. Liu, D.L.; Wang, L.J. Analysis on the structural characteristics of an early spring cold vortex event in northeastern China and the formation mechanism of vortex precipitation. Trans. Atmos. Sci. 2022, 45, 456–468. [Google Scholar]
  27. Gao, J.; Gao, H. Relationship between summer precipitation over northeastern China and sea surface temperature in the southeastern Pacific and the possible underlying mechanisms. Chin. J. Atmos. Sci. 2015, 39, 967–977. [Google Scholar]
  28. Sun, W.Y. Subseasonal-to-seasonal variation of East Asian summer monsoon and its impact on rainfall in North China. Chin. Acad. Meteorol. Sci. 2022. [Google Scholar]
  29. Chen, Y.W.; Gong, Y.F.; Jiang, R. Variation Characteristics of the Vertical Structure of the south China sea summer monsoon and its influence on precipition in eastern China. J. Trop. Meteorol. 2022, 38, 290–300. [Google Scholar]
  30. Liu, S.; Li, D.Q.; Sai, H.; Tian, L. The physical mechanism and strong precipitation in Northeast China analysis during typhoon “Lionrock” merging into extratropical cyclone process. Plateau Meteorol. 2019, 38, 804–816. [Google Scholar]
  31. Fang, Y.H.; Chen, K.Q.; Chen, H.S. The Remote Responses of Early Summer Cold Vortex Precipitation in Northeastern China Compared with the Previous Sea Surface Temperatures. Atmos. Res. 2018, 214, 399–409. [Google Scholar] [CrossRef]
  32. Fang, Y.H.; Lin, Y.T.; Ren, H.L.; Zhao, C.Y.; Zhou, F.; Li, Q.; Gu, C.L. Possible Relationships Between the Interannual Anomalies of the South-North Positions of the Northeastern China Cold Vortexes and the Sea Surface Temperatures (SSTs) during the Early Summer Periods. Front. Earth Sci. 2020, 8. [Google Scholar] [CrossRef]
  33. Gao, H.; Gao, J. Increased influences of the SST along the Kuroshio in previous winter on the summer precipitation in northeastern China. Acta Oceanol. Sin. 2014, 36, 27–33. [Google Scholar]
  34. Chen, Y.; Zhou, R.; Wu, H. Features of the Western Pacific subtropical high during the warm and cool periods of Nino 1+2 area and its influence on the east Asian monsoon. Chin. J. Atmos. Sci. 2002, 373–386. [Google Scholar]
  35. Yu, Y.; Fang, Y.H.; Zhao, C.; Lin, Y.; Lin, Y.; Gong, Z.; Li, Y. Modulation of Pacific Sea Surface Temperature on Two Types of Tropical Cyclone Tracks Affecting Northeast China. Front. Earth Sci. 2022. [CrossRef]
  36. Chen, G.Y.; Zhao, Z.G. Assessment methods of short range climate prediction and their operational application. Q. J. Appl. Meteorol. 1998, 51–58. [Google Scholar]
  37. Tian, W.W.; Wu, S.L.; Wang, N. The impact of PS method on operational climate forecast. J. Appl. Meteorol. Sci. 2010, 21, 379–384. [Google Scholar]
  38. Xiong, K.G.; Feng, G.L.; Huang, J.P.; Chou, J.F. Analogue dynamical prediction of monsoon precipitation in Northeast China based on dynamic and optimal configuration of multiple predictors. Acta Meteor. Sin. 2012, 70, 213–221. [Google Scholar] [CrossRef]
  39. Zhao, J.H.; Yang, J.; Gong, Z.Q.; Feng, G.L. Analysis of and discussion about dynamic–statistical climate prediction for summer rainfall of 2013 in China. Adv. Met. S. T. 2015, 5, 24–28. [Google Scholar]
  40. Liu, Y.; Fan, K. Prediction of spring precipitation in China using a downscaling approach. Meteorol. Atmos. Phys. 2012, 118, 79–93. [Google Scholar] [CrossRef]
  41. Liu, Y.; Fan, K. An application of hybrid downscaling model to forecast summer precipitation at stations in China. Atmos. Res. 2014, 143, 17–30. [Google Scholar] [CrossRef]
Figure 1. Prediction scores (PS) of different models initialized in different months, the three objective methods, and the operational products released by the NCC (National Climate Center) and SRCC (Shenyang Regional Climate Center).
Atmosphere 14 00668 g001
Figure 2. Flood-season precipitation forecast by (a) the dynamic–analogue correction method and (b) hybrid downscaling method. The Y-axis is the PS score.
Atmosphere 14 00668 g002
Figure 3. PS scores of June precipitation forecasts from different schemes.
Atmosphere 14 00668 g003
Figure 4. PS scores of July precipitation forecasts from different schemes.
Atmosphere 14 00668 g004
Figure 5. PS scores of August precipitation forecasts from different schemes.
Atmosphere 14 00668 g005
Figure 6. The PS scores of the precipitation prediction by the dynamic–analogue correction method ((a): June; (c): July; (e): August) and the hybrid downscaling method ((b): June; (d): July; (f): August).
Atmosphere 14 00668 g006
Figure 7. Forecast accuracy of southern NCV using the (a) North Atlantic SST tripole (NAT) and (b) tropical Atlantic SST.
Atmosphere 14 00668 g007
Figure 8. Forecast accuracy of northern NCV using the (a) northwest Pacific north–south anti-phase SST and (b) southeast Pacific SST.
Atmosphere 14 00668 g008
Figure 9. Forecast accuracy of southerly wind over Northeast China in (a) July and (b) August using the China offshore SST.
Atmosphere 14 00668 g009
Figure 10. Forecast accuracy of the WPSH ridge line using the (a,b) Kuroshio SSTs and (c,d) the Nino 1+2 SST. (a,c) are for July. (b,d) are for August.
Atmosphere 14 00668 g010
Figure 11. Forecast accuracy of northward-moving typhoons using (a) the SST in the west-wind-drift zone and (b) the Nino 3 SST from July to September.
Atmosphere 14 00668 g011
Figure 12. The prediction accuracy of influencing factors of flood-season precipitation in Liaoning.
Atmosphere 14 00668 g012
Table 1. Improving rate of the PS score of the models initialized in different months.
Initialized in AprilInitialized in May
BCC_CSM seasonal model−3%−8%
NCEP seasonal model12%1%
ECMWF seasonal model14%11%
Disclaimer/Publisher’s Note: The statements, opinions and data contained in all publications are solely those of the individual author(s) and contributor(s) and not of MDPI and/or the editor(s). MDPI and/or the editor(s) disclaim responsibility for any injury to people or property resulting from any ideas, methods, instructions or products referred to in the content.

