

Soil Water Content at Planting Affects Determining Agricultural Drought for Rainfed Spring Wheat
1
College of Geography and Environmental Science, Northwest Normal University, Lanzhou 730070, China
2
Key Laboratory of Arid Climatic Change and Disaster Reduction of Gansu Province, Key Laboratory of Arid Climate Change and Disaster Reduction of CMA, Lanzhou Institute of Arid Meteorology, China Meteorological Administration, Lanzhou 730020, China
*
Authors to whom correspondence should be addressed.
Atmosphere 2023, 14(4), 665; https://doi.org/10.3390/atmos14040665
Submission received: 15 March 2023
/
Revised: 28 March 2023
/
Accepted: 30 March 2023
/
Published: 31 March 2023
(This article belongs to the Special Issue Agrometeorology, Agricultural Water Management and Impacts of Extreme Events)
Abstract
:Agricultural drought often refers to water deficit in soil caused by a shortage of precipitation during a specific period in crop growing season, thus leading to final crop production failure. However, soil water content during planting may be related to the final yield of crop. Therefore, the soil water content at planting could have a great impact on determining whether agricultural drought occurs during crop growth and development. In the current study, we used soil water content at planting at 0–50 cm depth, the spring wheat (Triticum aestivum L.) yield from 1987 to 2011, and precipitation from 1971 to 2011 at Dingxi, Gansu Province, China, intending to quantify the influence of soil water content at planting on determining agricultural drought for rainfed spring wheat. The response of spring wheat yield to growing season precipitation comprised two different linear relationships defined by whether the soil water content at planting was greater or less than 100 mm. With the identical amount of soil water content at planting and precipitation during main growth period, a higher soil water content at planting resulted in a greater spring wheat yield. Soil water content at planting was more effective than growing season precipitation for increasing spring wheat yield. According to the probability distributions of soil water content during planting and growing season precipitation, we concluded that 28.6% of the years studued involved agricultural drought for rainfed spring wheat in the Dingxi of Gansu province, China. This analysis, which quantified the relative importance of soil water content at planting (29.97 kg ha−1 per mm) and during growing season precipitation (12.21 kg ha−1 per mm) to determine yield and agricultural drought occurrence for spring wheat, suggests that improving the amount of soil water storage before crop planting is an important way to deal with agricultural drought.
1. Introduction
Drought is not only the costliest natural hazard in the world but also one of the most complex and least understood of all natural hazards [1,2]. The first economic sector to be affected by drought is agriculture, because of its dependence on water resources and soil moisture reserves during various stages of crop growth [3]. However, determining drought is a challenging task due to its creeping and recurring nature. The complexity is further increased by the difficulty in defining drought precisely [4].
The term of drought is evocative [5]. There are a number of different definitions of drought that exist in the world with widely diverse meanings and various purposes [6]. At present, three broad drought categories are commonly accepted: meteorological drought, hydrological drought, and agricultural drought [7]. Meteorological drought is defined simply in terms of the magnitude of precipitation shortfall during a specific period. The onset of hydrological drought is signified by the occurrence or persistence of meteorological drought, causing shortage of surface water in streams, lakes, reservoirs, or ground water supplies [8]. Agricultural drought links meteorological drought characteristics to agricultural impacts, associating precipitation shortages most immediately with higher evapotranspiration levels and soil moisture deficits [9]. Meteorological and hydrological drought are defined by physical and hydrometeorological parameters, respectively [10], whereas agricultural drought is based on the impacts of drought on agriculture and is related to crops’ biological parameters [11]. Generally, factors such as the amount of precipitation, streamflow, water level in lakes, and reservoirs are easy to be quantifiably monitored and recorded [12]. However, the impact of drought on agriculture is not instantaneous. Hence, agricultural drought is not easily quantified and, as a result, only limited efforts have been made in the quantitative analysis of agricultural drought [13]. The prime cause of drought is anomalies in the climate or weather that led to less precipitation than normal for meeting water demands in agriculture, industry, households, and hydro-power generation [14]. Therefore, agricultural drought is generally thought to be the physical manifestation of meteorological drought [15]. Hence, researchers usually focus on precipitation during crop-growing season to determine agricultural drought. Meanwhile, some statistical models and combinations, based on single precipitation or some other related climatic parameters during crop growing season, are commonly used to determine and predict agricultural drought [16,17].
The objective of agriculture production is to obtain a final crop yield that is as high as possible. Therefore, one of the common ways of determining agricultural drought is based on the deviation of a major crop yield in a specific region from its long-term mean [18]. In that case, we could conclude whether agricultural drought occurred or not through the final level of a specific crop yield in a research area. However, in many cases, drought indices based on precipitation or other climatic parameters during growing season predict final crop yield poorly [19]. Since the main basis for the identification of agricultural drought is crop yield, water budgets for crops and, thus, soil–plant units are at the heart of agricultural drought research [20]. However, weather conditions during crop growing season are not the only factors determining the water budget for crops. Soil water content plays a central role in the control of the terrestrial water cycle [21], and rates of transpiration, carbon assimilation, and biomass production are often limited by it during the crop-growing season [22]. However, the soil water during crop-growing season not only stems from precipitation during crop growing season but also from the precipitation before crop planting. Therefore, the soil water content at planting is one of the most important water supply resources for crop growth and development [23,24], and it could have great influence on crop final yield, especially for crops with a short growing season [25,26]. Therefore, soil water content at planting has a great influence on determining agricultural drought occurrence in certain specific areas.
Spring wheat is one of the most important crops grown in the semi-arid areas in the northwest of China, where crops are mainly rainfed, even though the amount of rainfall is limited and erratic. In this area, the growth, development, and final yield of spring wheat is greatly influenced by water supply and water is the main limiting factor for spring wheat growth and yield. Consequently, understanding the relationship between water and the final yield spring wheat is essential to determine agricultural drought occurrence, improve agriculture management techniques, and adopt feasible strategies to deal with drought in this area. Therefore, the objectives of this study were to: (1) quantify the influence of soil water content at planting on determining agricultural drought for spring wheat and (2) determine the probability of agricultural drought occurrence during spring wheat growing season in this area.
2. Materials and Methods
2.1. Study Site
This study was conducted from 1987 to 2011 at the Dingxi agro-meteorological experimental station, affiliated with the Chinese Meteorological Administration (CMA). The station is located in Dingxi, Gansu province, in the northwest of China (35°35′ N, 104°36′ W, 1898 m). The area has a typical semi-arid continental climate. The average annual precipitation is about 386 mm, 60% of which occurs from July to September. Only about 30% falls during spring wheat growing season (from March to June). The distribution of the rainfall during the spring wheat growing season is highly erratic, and the coefficient of variation is about 32.5% (Table 1). The soil type of the station is a typical loessial soil, predominantly sandy loam (60% sand), with low organic content, very high infiltration rates, and easy cultivation. The soil in the 0–50 cm layer has an average bulk density of 1.3 g cm−3, a field capacity of 0.251 cm3 cm−3, and a wilting point of 0.058 cm3 cm−3. Soil organic matter, total phosphorus, available nitrogen, and available phosphorus were 11.7 g kg−1, 3.44, 67.4, and 0.61 mg kg−1 at a 30 cm depth, respectively.
2.2. Field Experiment
The experimental layout at the station was a randomized complete block design with four replications. Plot size was 10 m × 25 m, with a north–south row direction. Spring wheat varieties ‘Weichun1’, ‘81139-2’, ‘Longchun20’, and ‘Dingxi New24’ were mainly utilized during the 1987–2011 period (Table 2). The maturity types of these wheat varieties were middle or middle-late. Spring wheat was typically sown in middle to late March. The average seeding rate was 206 kg ha−1, with 42 to 104 kg N ha−1 and farmyard manure of 15,000 to 35,000 kg ha−1 ensured that there was no fertilizer deficiency. Weeds were controlled by manually removing them from the plots before planting and during the jointing and flowering stages. Specific details about variety, seeding and fertilization rates, planting dates, and growth stages are given in Table 2 and Table 3.
At harvest, all the spring wheat plants in the experimental field were collected, and the actual grain yield were measured by square meter. Then, this value was multiplied by 10,000 to obtain the actual yield of one hectare. In 1986, 1990, 1991, and 2011, additional fertilizer was applied during the jointing stage for spring wheat at the Dingxi agro-meteorological experimental station, which had a significant impact on final spring wheat yield compared with other years. Therefore, we used the yield data from Dingxi Bureau of Statistics to revise the yield data at the Dingxi agro-meteorological experimental station by eliminating the impact of additional fertilizer on the final yield. Furthermore, due to genetic improvement of the crop varieties, an analysis of crop yield response in a long-term study generally involves changes to yield potential. To evaluate this possibility, the spring wheat yield data from 1987 to 2011 were used at Dingxi. With the liner regression significance levels obtained in our analyses of data from 1987 to 2011, no confidence was placed on the existence of a change in spring wheat yield potential. Hence, we did not make adjustments in yield for an increasing yield trend resulting from genetic improvements in our efforts to quantify the influence of soil water content at planting in order to determine agricultural drought occurrence.
Soil water content was measured on the day of planting by utilizing gravimetric sampling at 10 cm depth intervals in the 0–50 cm layer. Gravimetric soil water content at each depth was converted to volumetric water content by multiplying by the soil bulk density. The water content used in this study was the total water content in soil from 0 cm to 50 cm. Daily precipitation from 1971 to 2011 was measured at a weather station approximately 100 m from the plot area in Dingxi agro-meteorological experimental station. Monthly precipitation amounts were computed, and the amount of growing season precipitation was the sum of precipitation in March, April, May, and June each year.
2.3. Agricultural Drought and Meteorological Drought Occurrence Definition
Agricultural drought usually occurs when soil moisture availability to plants in a specific area has dropped to a level (threshold level) that is insufficient for crop development, growth, and maturation, and thus adversely affects the crop final yield [18]. However, the onset, duration, and severity of agricultural drought are very difficult to determine. In defining agricultural drought quantitatively, one method is commonly used, based on the deviation from the mean yield of a major crop in a study area. Therefore, percentage reduction from the long-term mean yield can be selected, and agricultural drought is considered to have occurred if the final crop yield is below the given threshold [13]. Based on previous study [13], we choose 70% of mean yield as the threshold, 1171.8 kg ha−1, which can be defined as agricultural drought occurrence for spring wheat in this study area. For comparison, meteorological drought occurrence was defined by precipitation below 70% of long-term average level.
2.4. Statistical Analysis
The relationships between precipitation during the main growing season and spring wheat yield were described by linear regression analyses through SPSS 20.0. For the combination of spring wheat yield and soil water content at planting and precipitation, a stepwise method of linear regression was adopted with a significance level at 0.05 in SPSS. The statistical characteristics of precipitation during spring wheat growing season from 1971–2011 were analyzed by using SPSS software. Normal distribution tests applying the Kolmogorov–Smirnov (K-S) method were analyzed using Orgin 9.0 software.
For the cluster analysis, precipitation during crop-growing season and the soil water content at crop planting are the main water resources for crop development, growth, and maturation in rainfed areas. Since the two above factors that limit crop yields are variable in different years, it is necessary to quantify their relationship, respectively. Using cluster analysis to obtain long-term crop yield data may be an effective means to identify temporal yield patterns. In the current study, in order to identify the most important factors influencing spring yield and then determining agricultural drought, a three-step procedure for cluster analysis was adopted. First, we assumed water supply factors determined spring wheat yield and grouped precipitation during spring wheat growing season and soil water content at planting into nine clusters. Second, we surveyed whether spring wheat yield at each cluster is fewer than two cases. Third, we tested whether the spring wheat yield at each cluster is significantly different to any other. The hierarchical cluster method was applied using SPSS to identify water supply factors year patterns in Dingxi, Gansu province, China. Spring wheat yield, soil water content at planting, and precipitation during the main growing season from 1987 to 2011 were used to classify clusters. Each cluster (group) can be divided into significant and non-significant levels. The least significant difference (LSD) method in a one-way ANOVA was applied to confirm each group as being significantly different from others. If there was any one group with fewer than two cases, or there was no significant difference between two groups, we grouped precipitation during the main growth period and soil water content at planting by repeating the three-step procedure in smaller cluster numbers until there was no group with fewer than two cases and no significant difference between any two groups.
3. Results
3.1. Determining Agricultural Drought Based on Growing Season Precipitation
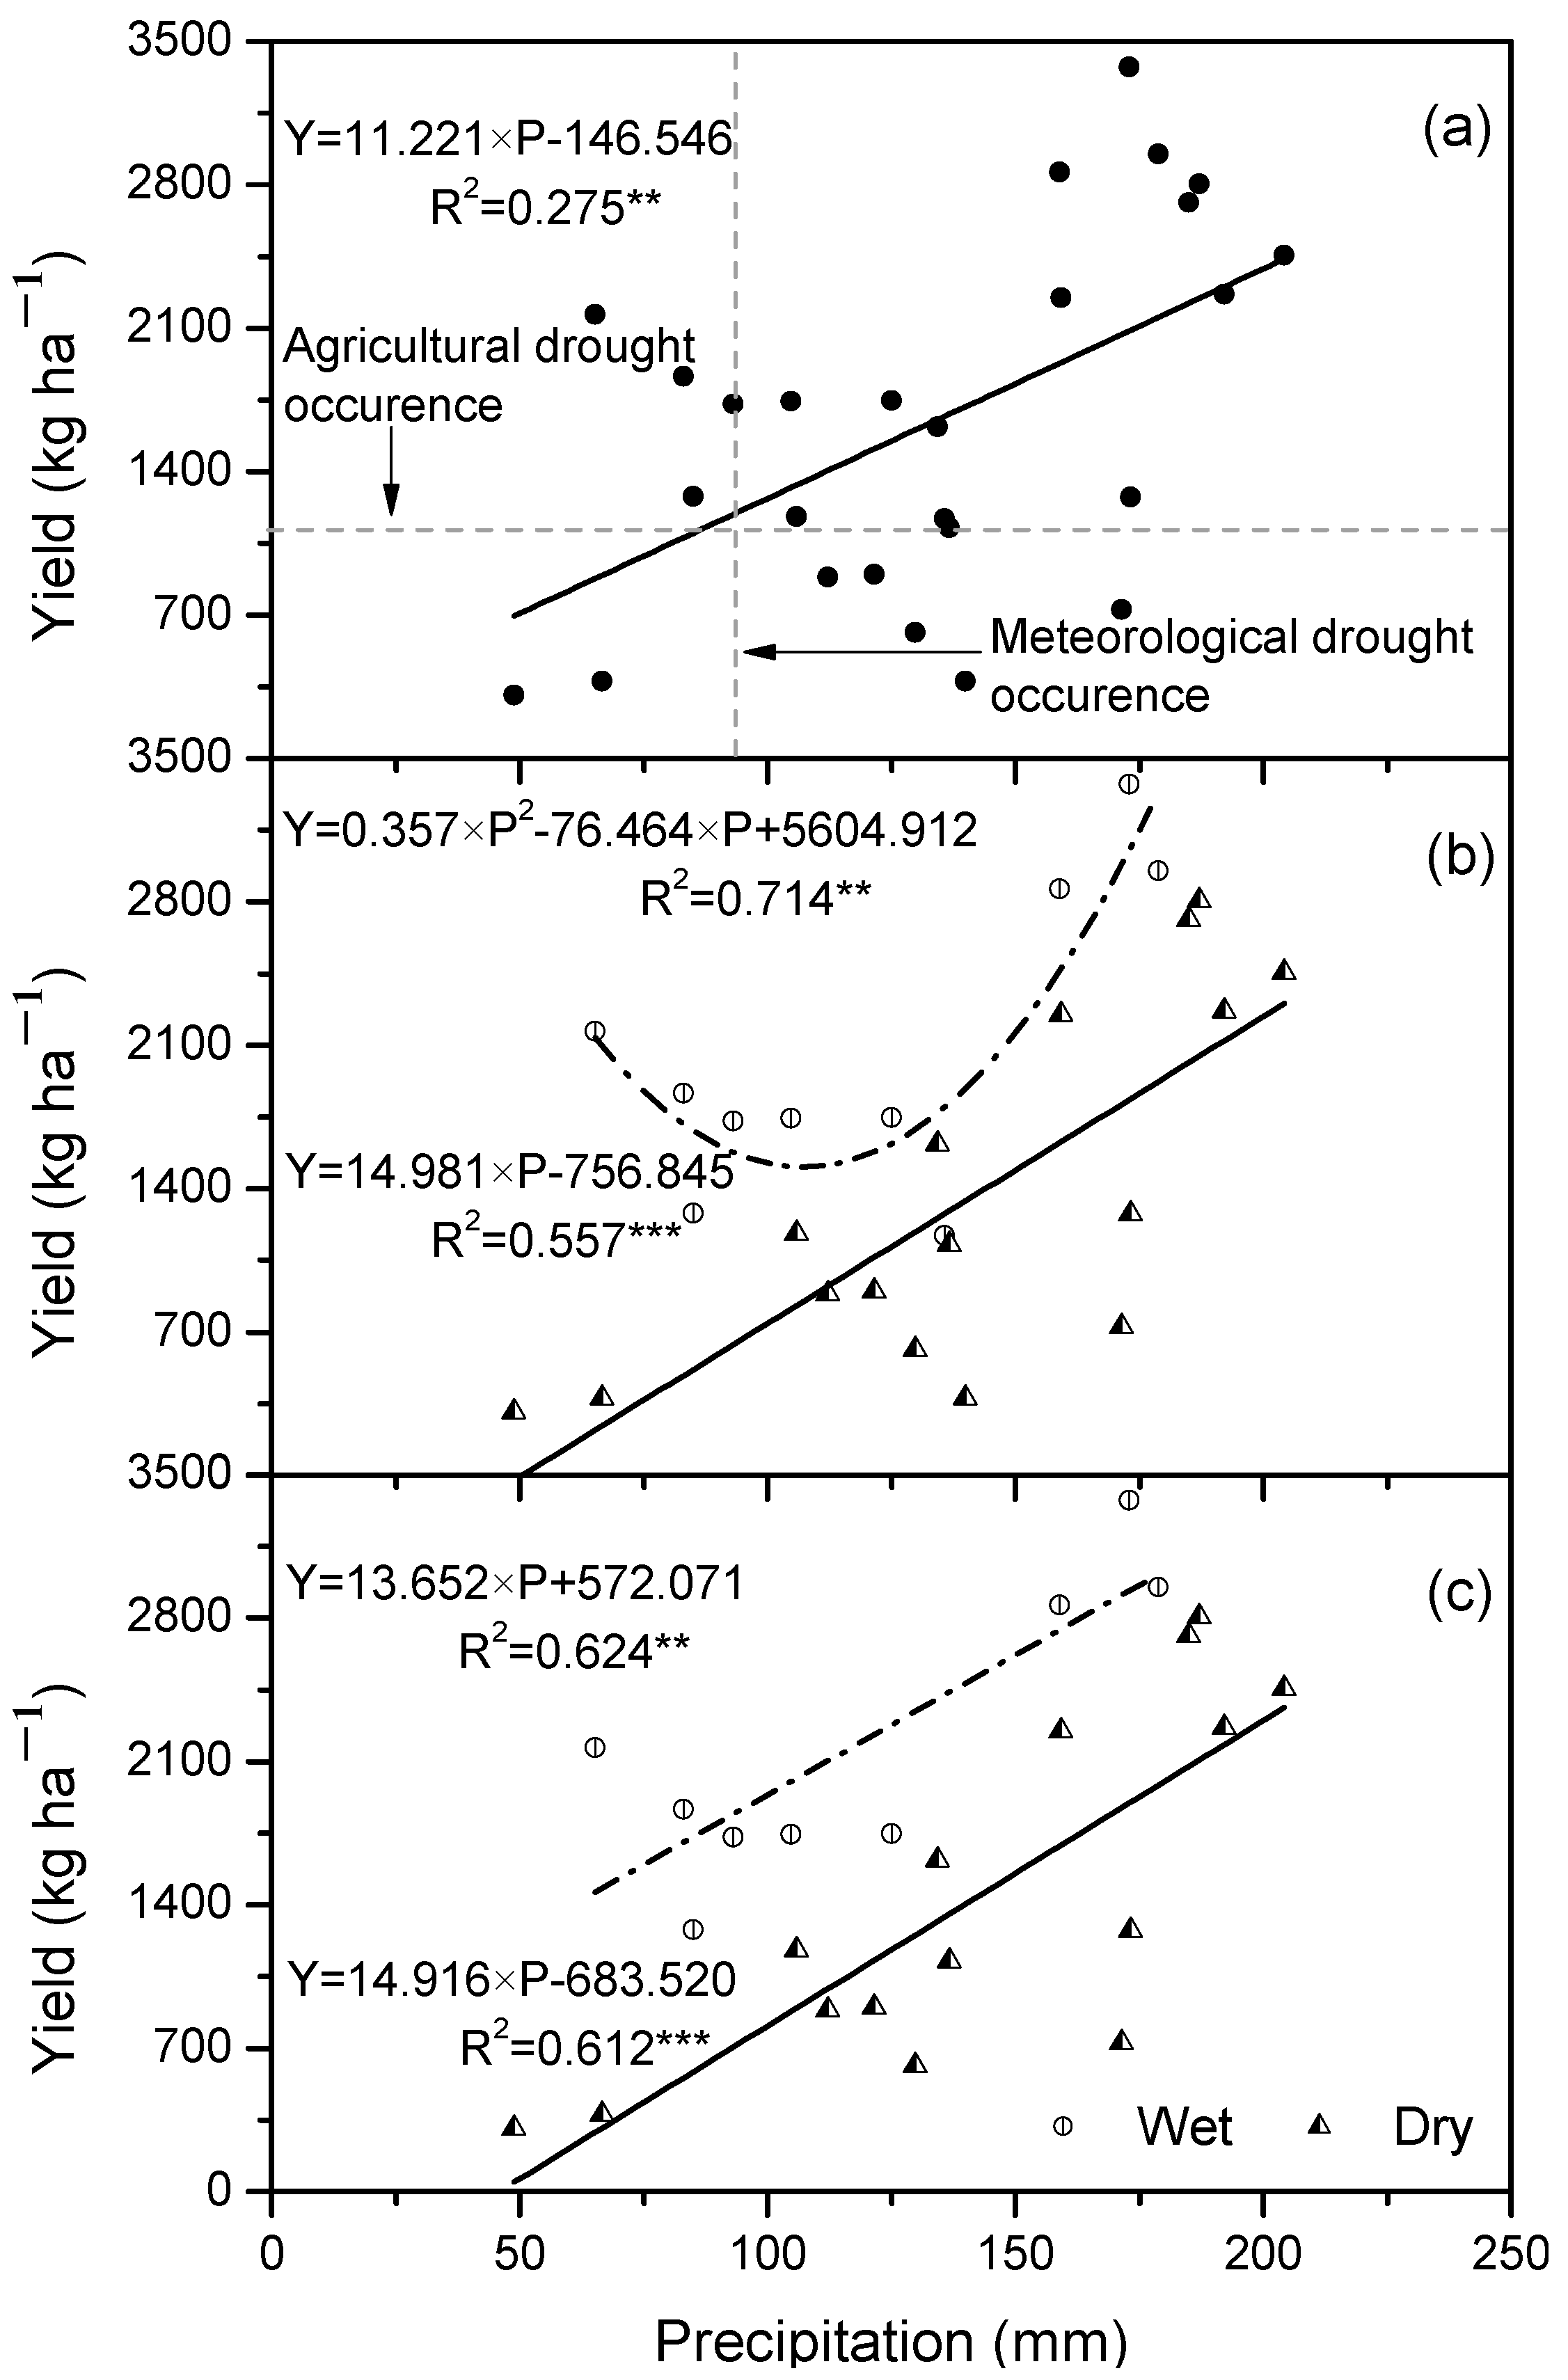
The amount of precipitation during a specific period is usually used to analyze drought occurrence in a research area. In the current study area, precipitation during the main growth period ranged widely from 48.9 to 204.2 mm, averaging 133.5 mm (Table 2). Similarly, spring wheat yield varied widely from 310 to 3373 kg ha−1 (Figure 1a). From the data presented in Figure 1a, we can observe inconsistent relationships between precipitation during the spring wheat growing season and the spring yield. In four years, namely 2004, 2008, 2009, and 2011, the precipitation were smaller than 70% of the multiplied average precipitation during the main spring wheat growing season value, 93.5 mm, which could be labeled as a meteorological drought occurrence but nevertheless obtained a higher spring wheat yield, greater than 70% of the average yield (1171.8 kg ha−1) of the agricultural drought occurrence trend. On the other hand, the years 1986, 1993, and 2010, which saw the three greatest spring yields, were associated with precipitations of 178.8, 172.9, and 159 mm, smaller than other four years (1990, 1991, 1998, and 2005), which saw more than 185 mm of precipitation. We found it difficult to determine spring wheat yield and agricultural drought occurrence using only one simple climatic parameter, namely precipitation during spring wheat growing season. However, after the inspection of the data points in Figure 1a, we found that two distinctly different responses to precipitation during the main spring wheat growing season existed in the data. All but three of the 12 points that were above the regression line in Figure 1a came from years when soil water content at planting was greater than 100 mm. Meanwhile, Figure 1b clearly shows that the data are separated into the two groups defined by soil water content at planting of greater than 100 mm and soil water content of less than 100 mm.
Spring wheat yield increased at a rate of 15.0 kg ha−1 as precipitation increased by 1 mm (p < 0.001) under the conditions when soil water content at planting was less than 100 mm. On the other hand, when soil water content at planting was greater than 100 mm, spring wheat yield changed against precipitation in the form of a quadratic curve (p < 0.01) or a “V” shape in the form of two lines. However, this was a fairly questionable relationship on account of the limited precipitation during the spring wheat main growth period being related to greater yield, such as 0 mm resulting in 5604.9 kg ha−1. We know that both an excess and a deficit of rainfall may result in reduced yields [27]. Hence, a negative relationship must exist in some periods between spring wheat yield and precipitation.
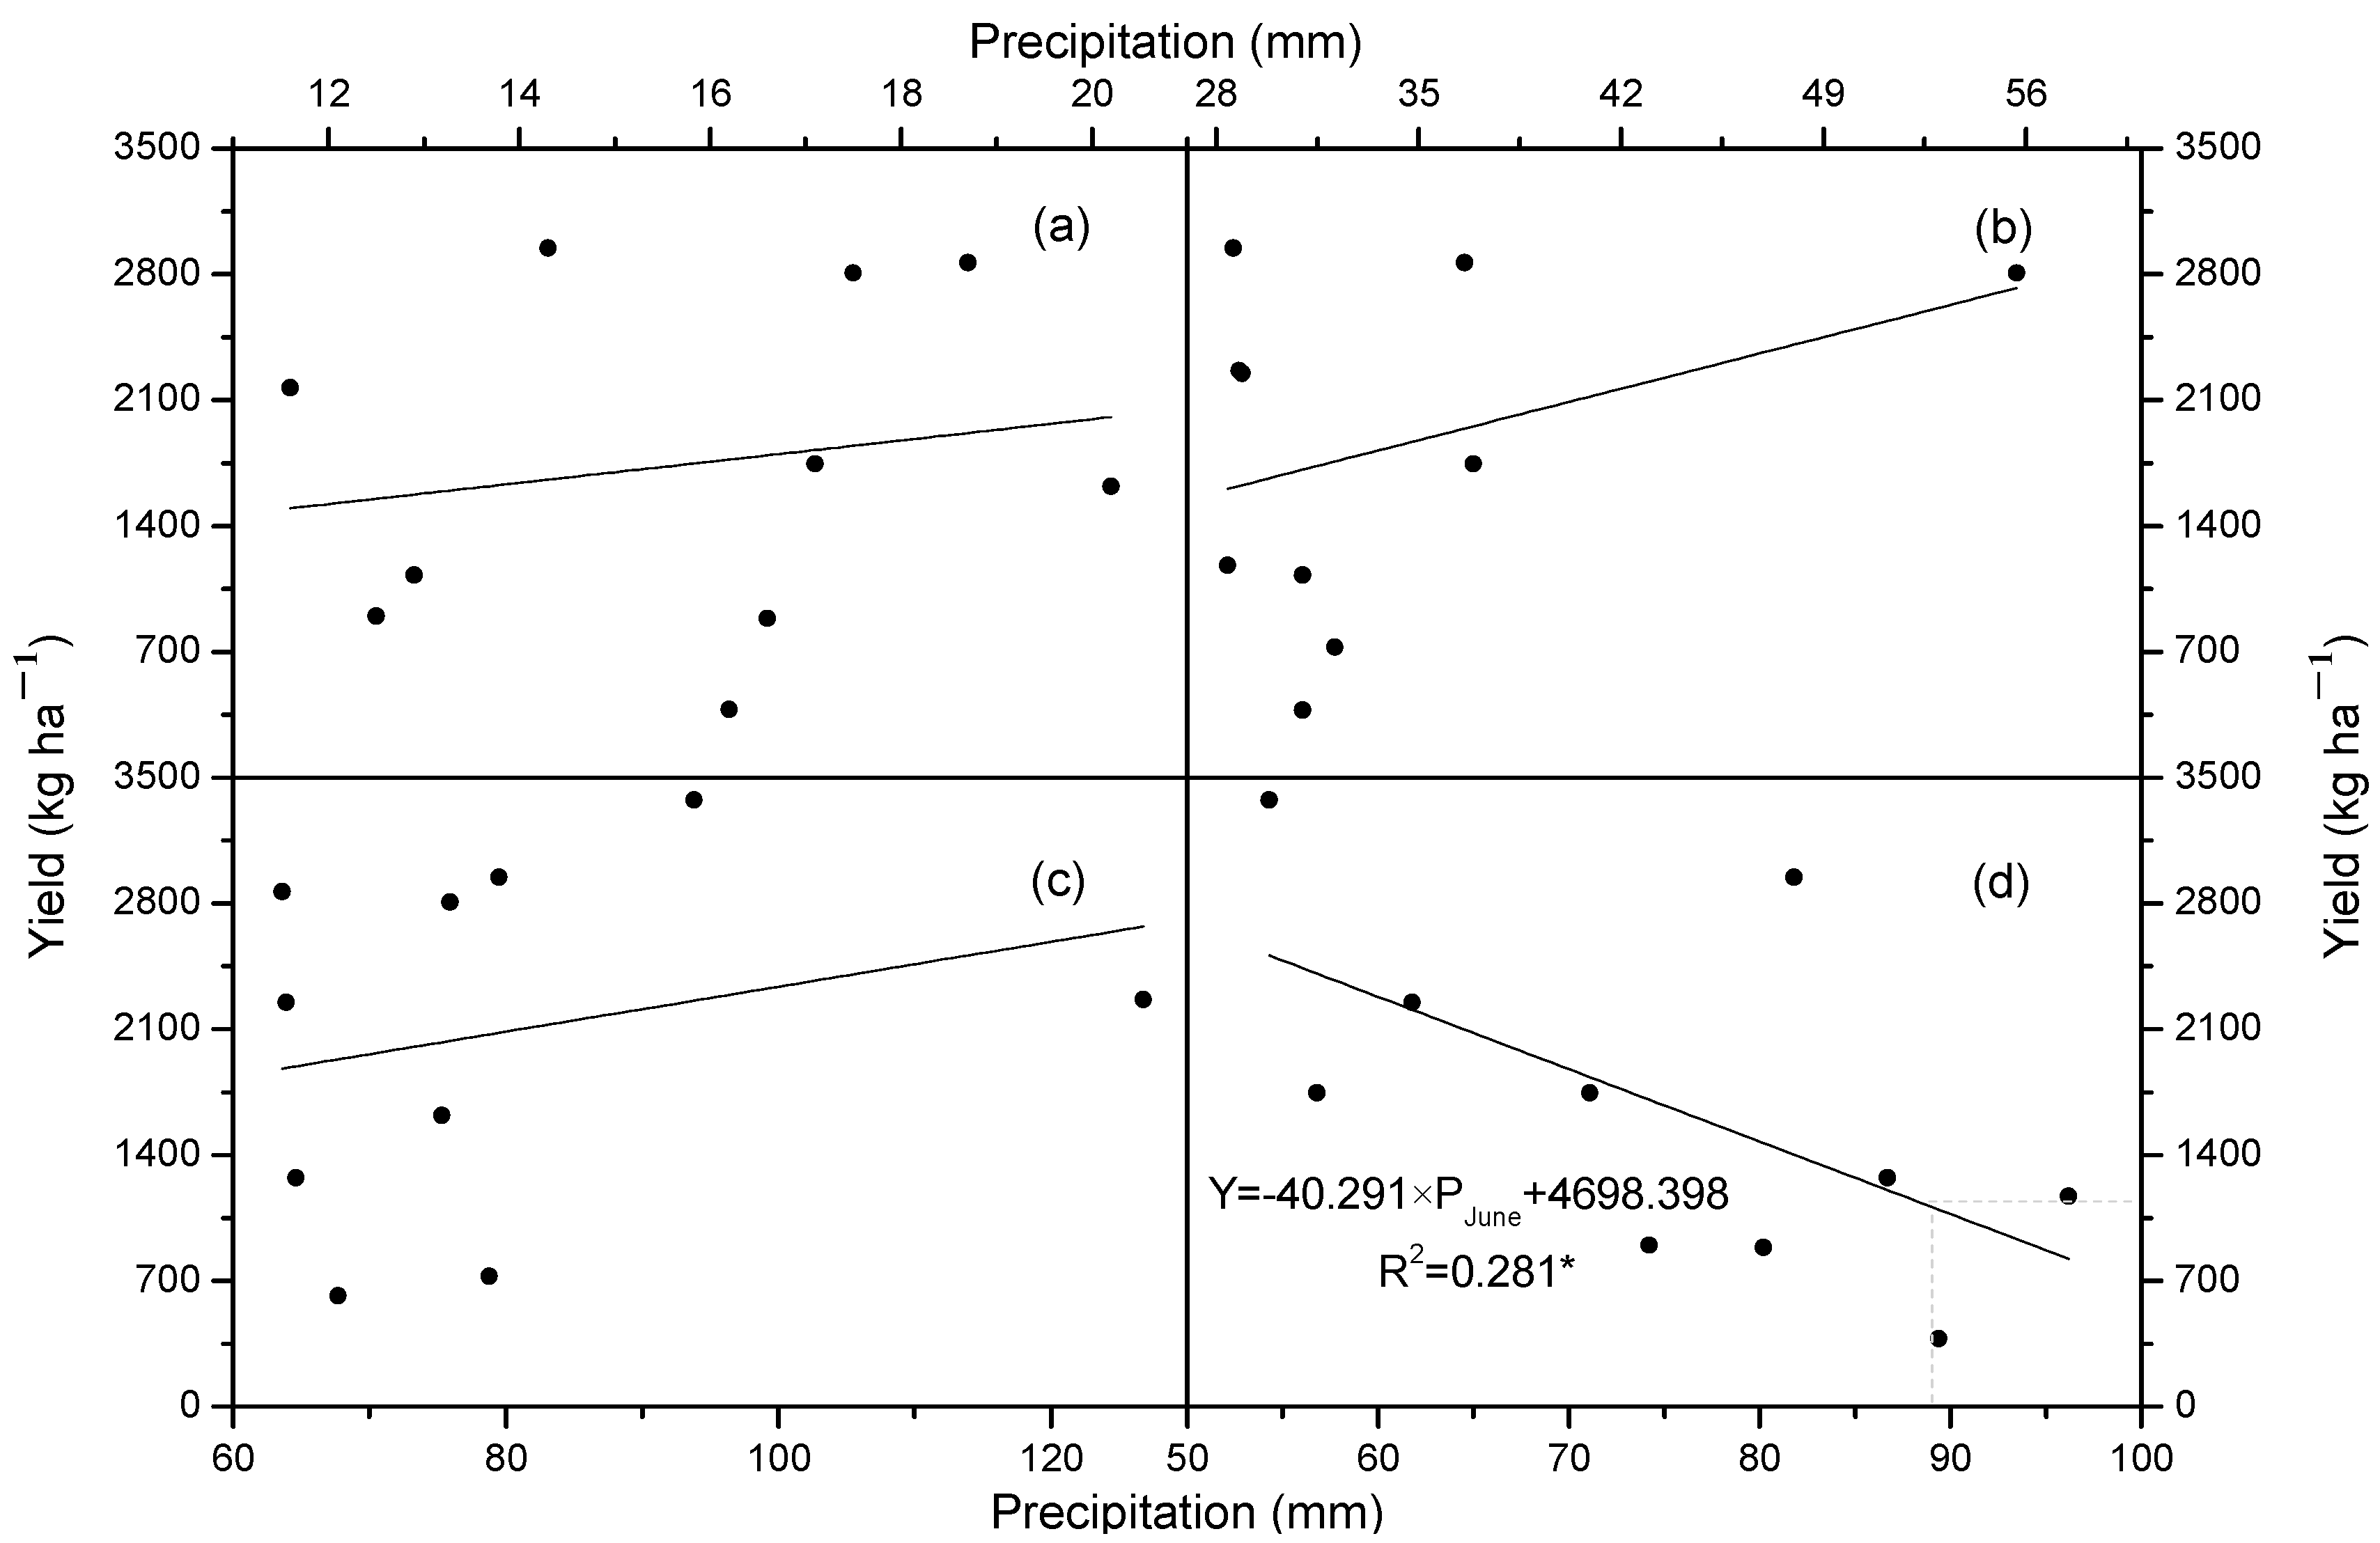
The relationship between spring wheat yields and the ten greatest amounts of precipitation in different months from March to June and above average monthly precipitation levels were analyzed (Figure 2). We found that positive relationships between yields and precipitation existed during all months except June. Spring wheat experiences heading and flowering period in June in the study area (Table 3), and a significant level of precipitation would result in lower caryopsis formation, thus decreasing wheat yield. When precipitation was greater than 88 mm, the yield was smaller than 1171.8 kg ha−1, which was considered to be agricultural drought occurrence by this study. If a greater amount of precipitation in June had an effect on spring wheat yield, we eliminated the relevant data when precipitation in June was greater than 88 mm. Then, two distinct groups of data were obtained with a linear relationship between yield and precipitation (Figure 1c, Table S1). The levels of the two responses were 13.7 and 14.9 kg ha−1, with X-axis offsets at −41.9 and 45.8 mm, separately. In dry soil water conditions, yields saw a greater increase per mm of precipitation than in wet soil water conditions at planting. The higher steeper slope for dry soil water conditions, due to a lack of less stored soil water content, suggesting that improving rainfall use efficiency was the best way to obtain more yield. Meanwhile, in dry soil water conditions, no yields were obtained, such as when the precipitation during spring wheat growth was below 45.8 mm, whereas 572.1 kg yield per hectare could be obtained with no precipitation during the spring wheat growing season when the soil water content at planting was greater than 100 mm. This indicates that there must be supply extra water for spring wheat growth during its growing season, or there would be no harvest when precipitation is very low with dry soil water conditions at planting.
3.2. Comparison of Soil Water Content at Planting and Precipitation during Spring Wheat Growing Season to Determine Agricultural Drought
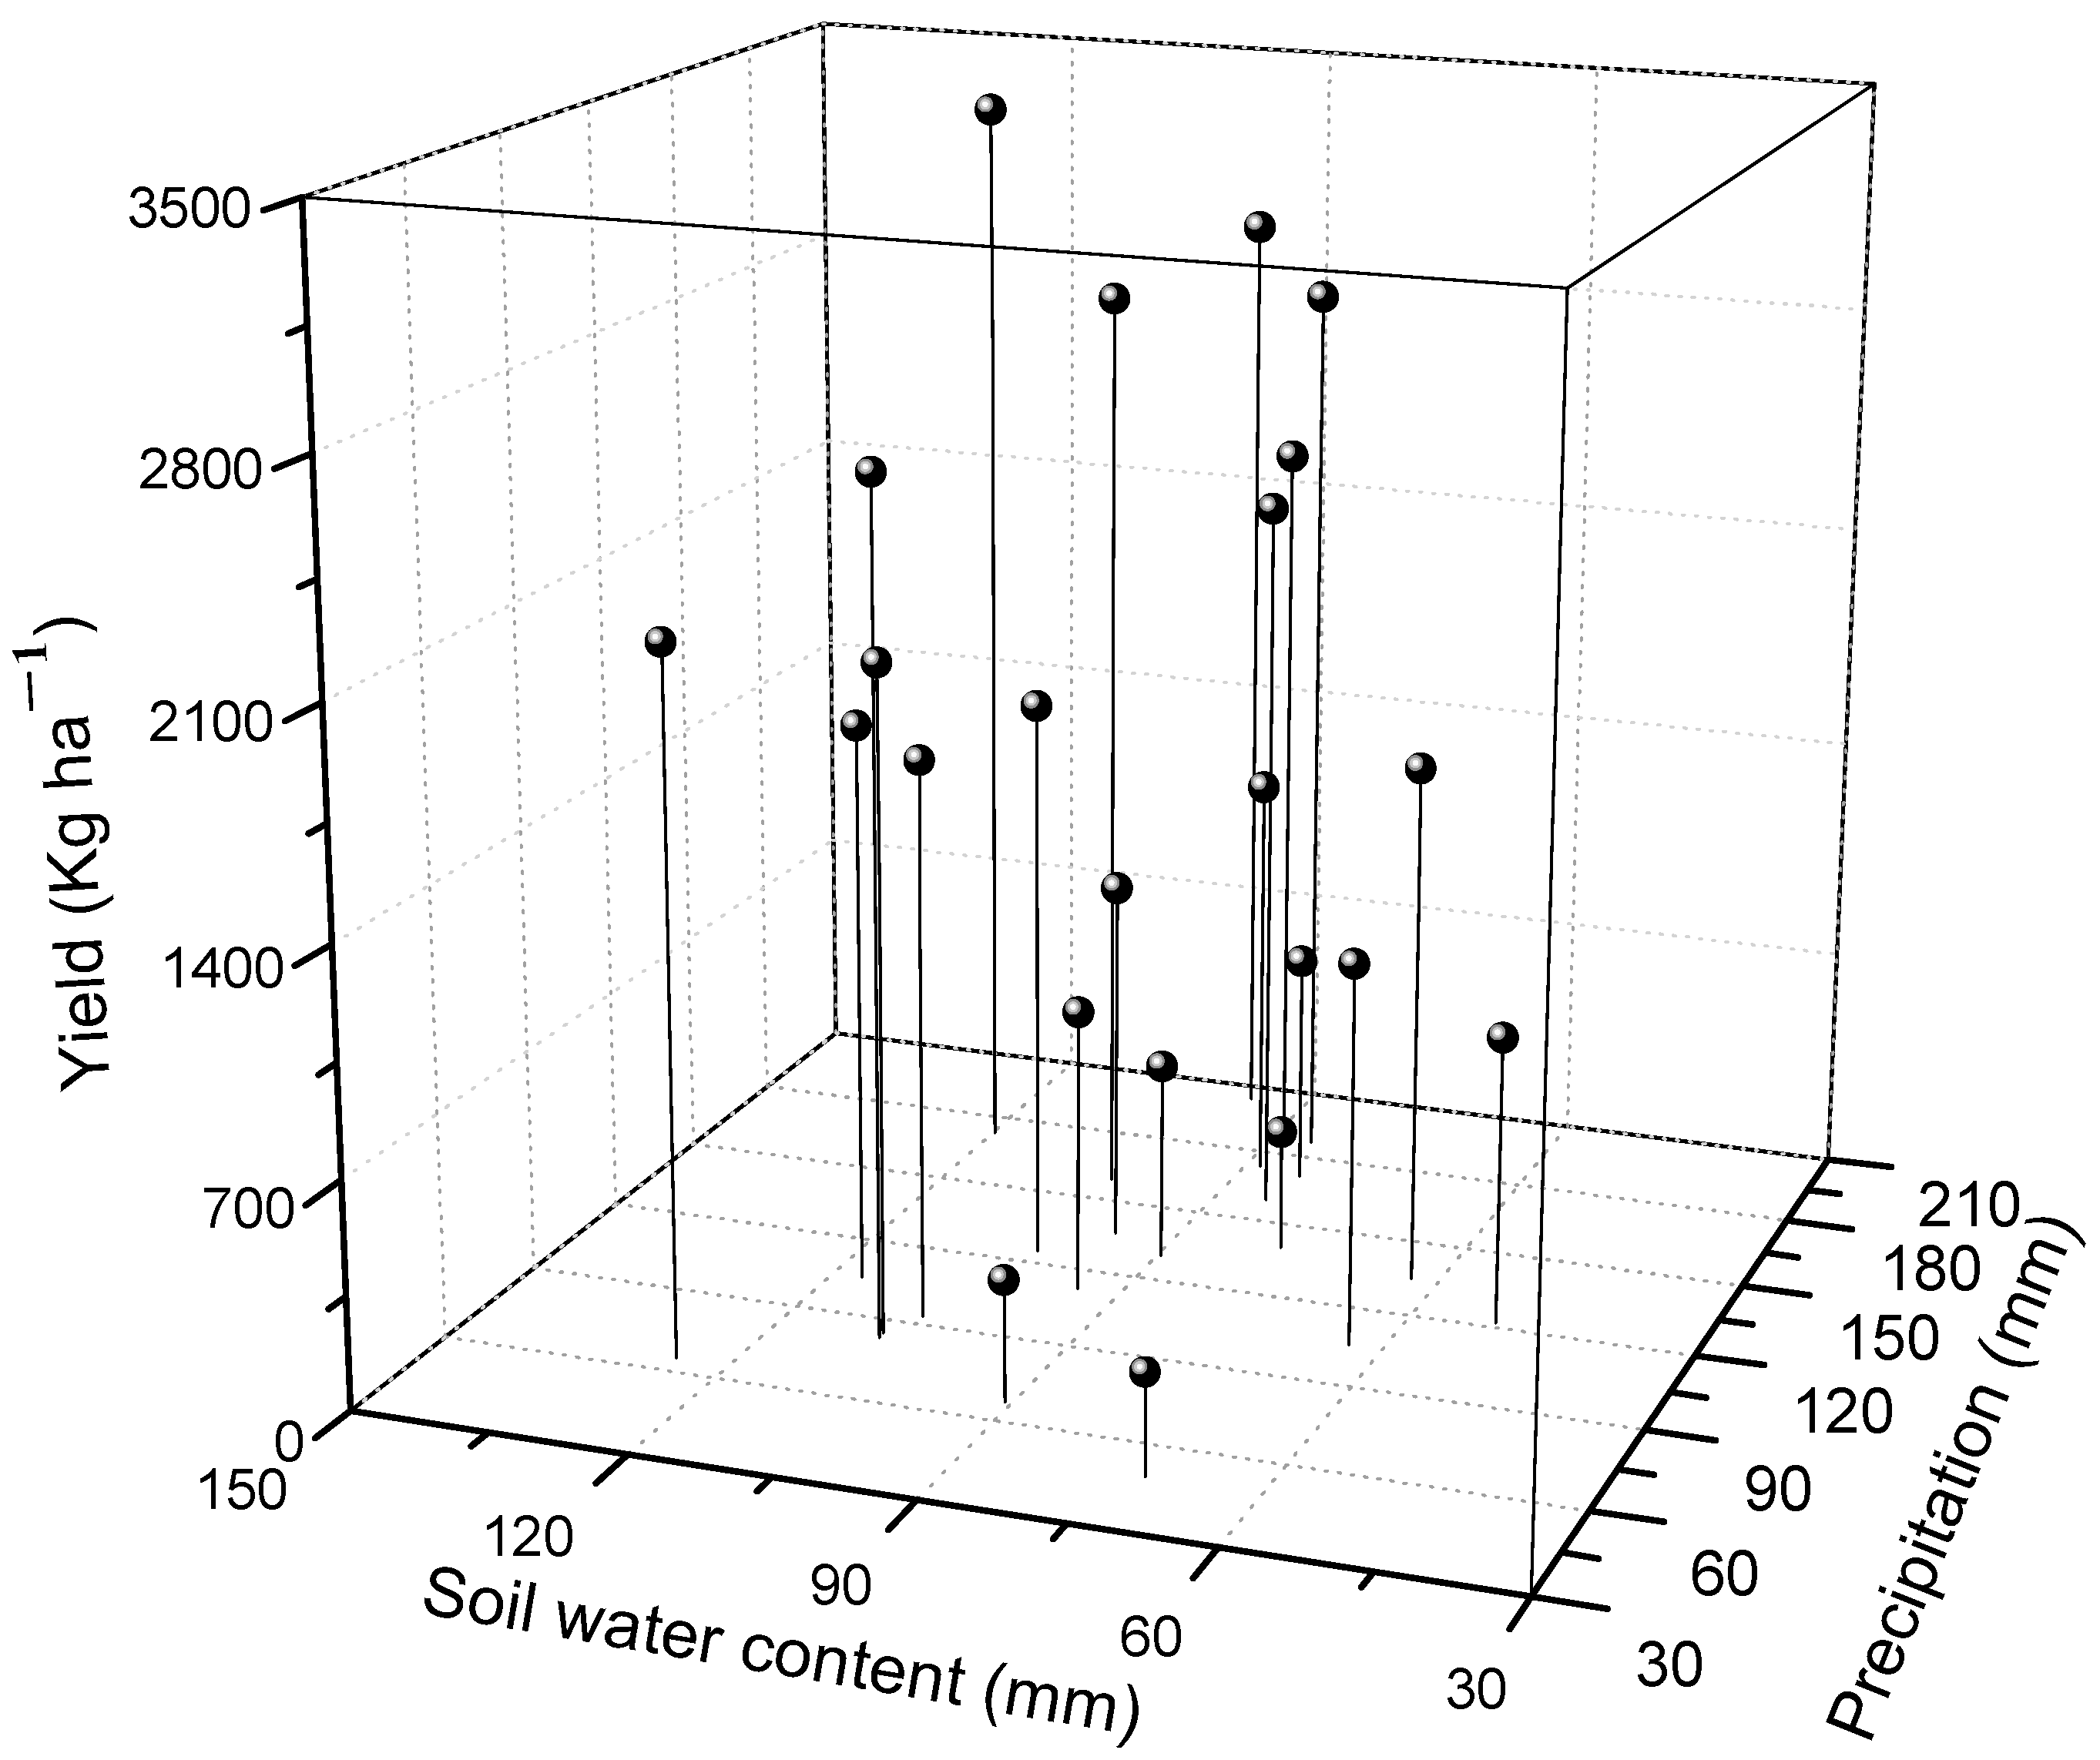
For rainfed farming systems, soil water content and precipitation are the two main water resources for spring wheat development and growth. We plotted precipitation, soil water content, and yield in one figure (Figure 3). Soil water content at planting varied from 51.2 to 235.0 mm in the 50 cm soil profile, as influenced by precipitation during several months before planting. With the change in soil water content and precipitation, the spring wheat yield ranged widely from 310 to 3373.7 kg ha−1. From the data presented in Figure 3, we found that high precipitation and high soil water content at planting resulted in high spring wheat yields, and low precipitation and low soil water content at planting obtained low spring wheat yields; however, for other combinations of water content and precipitation there appeared to be no obvious relationship between soil water content, precipitation, and spring wheat yield.
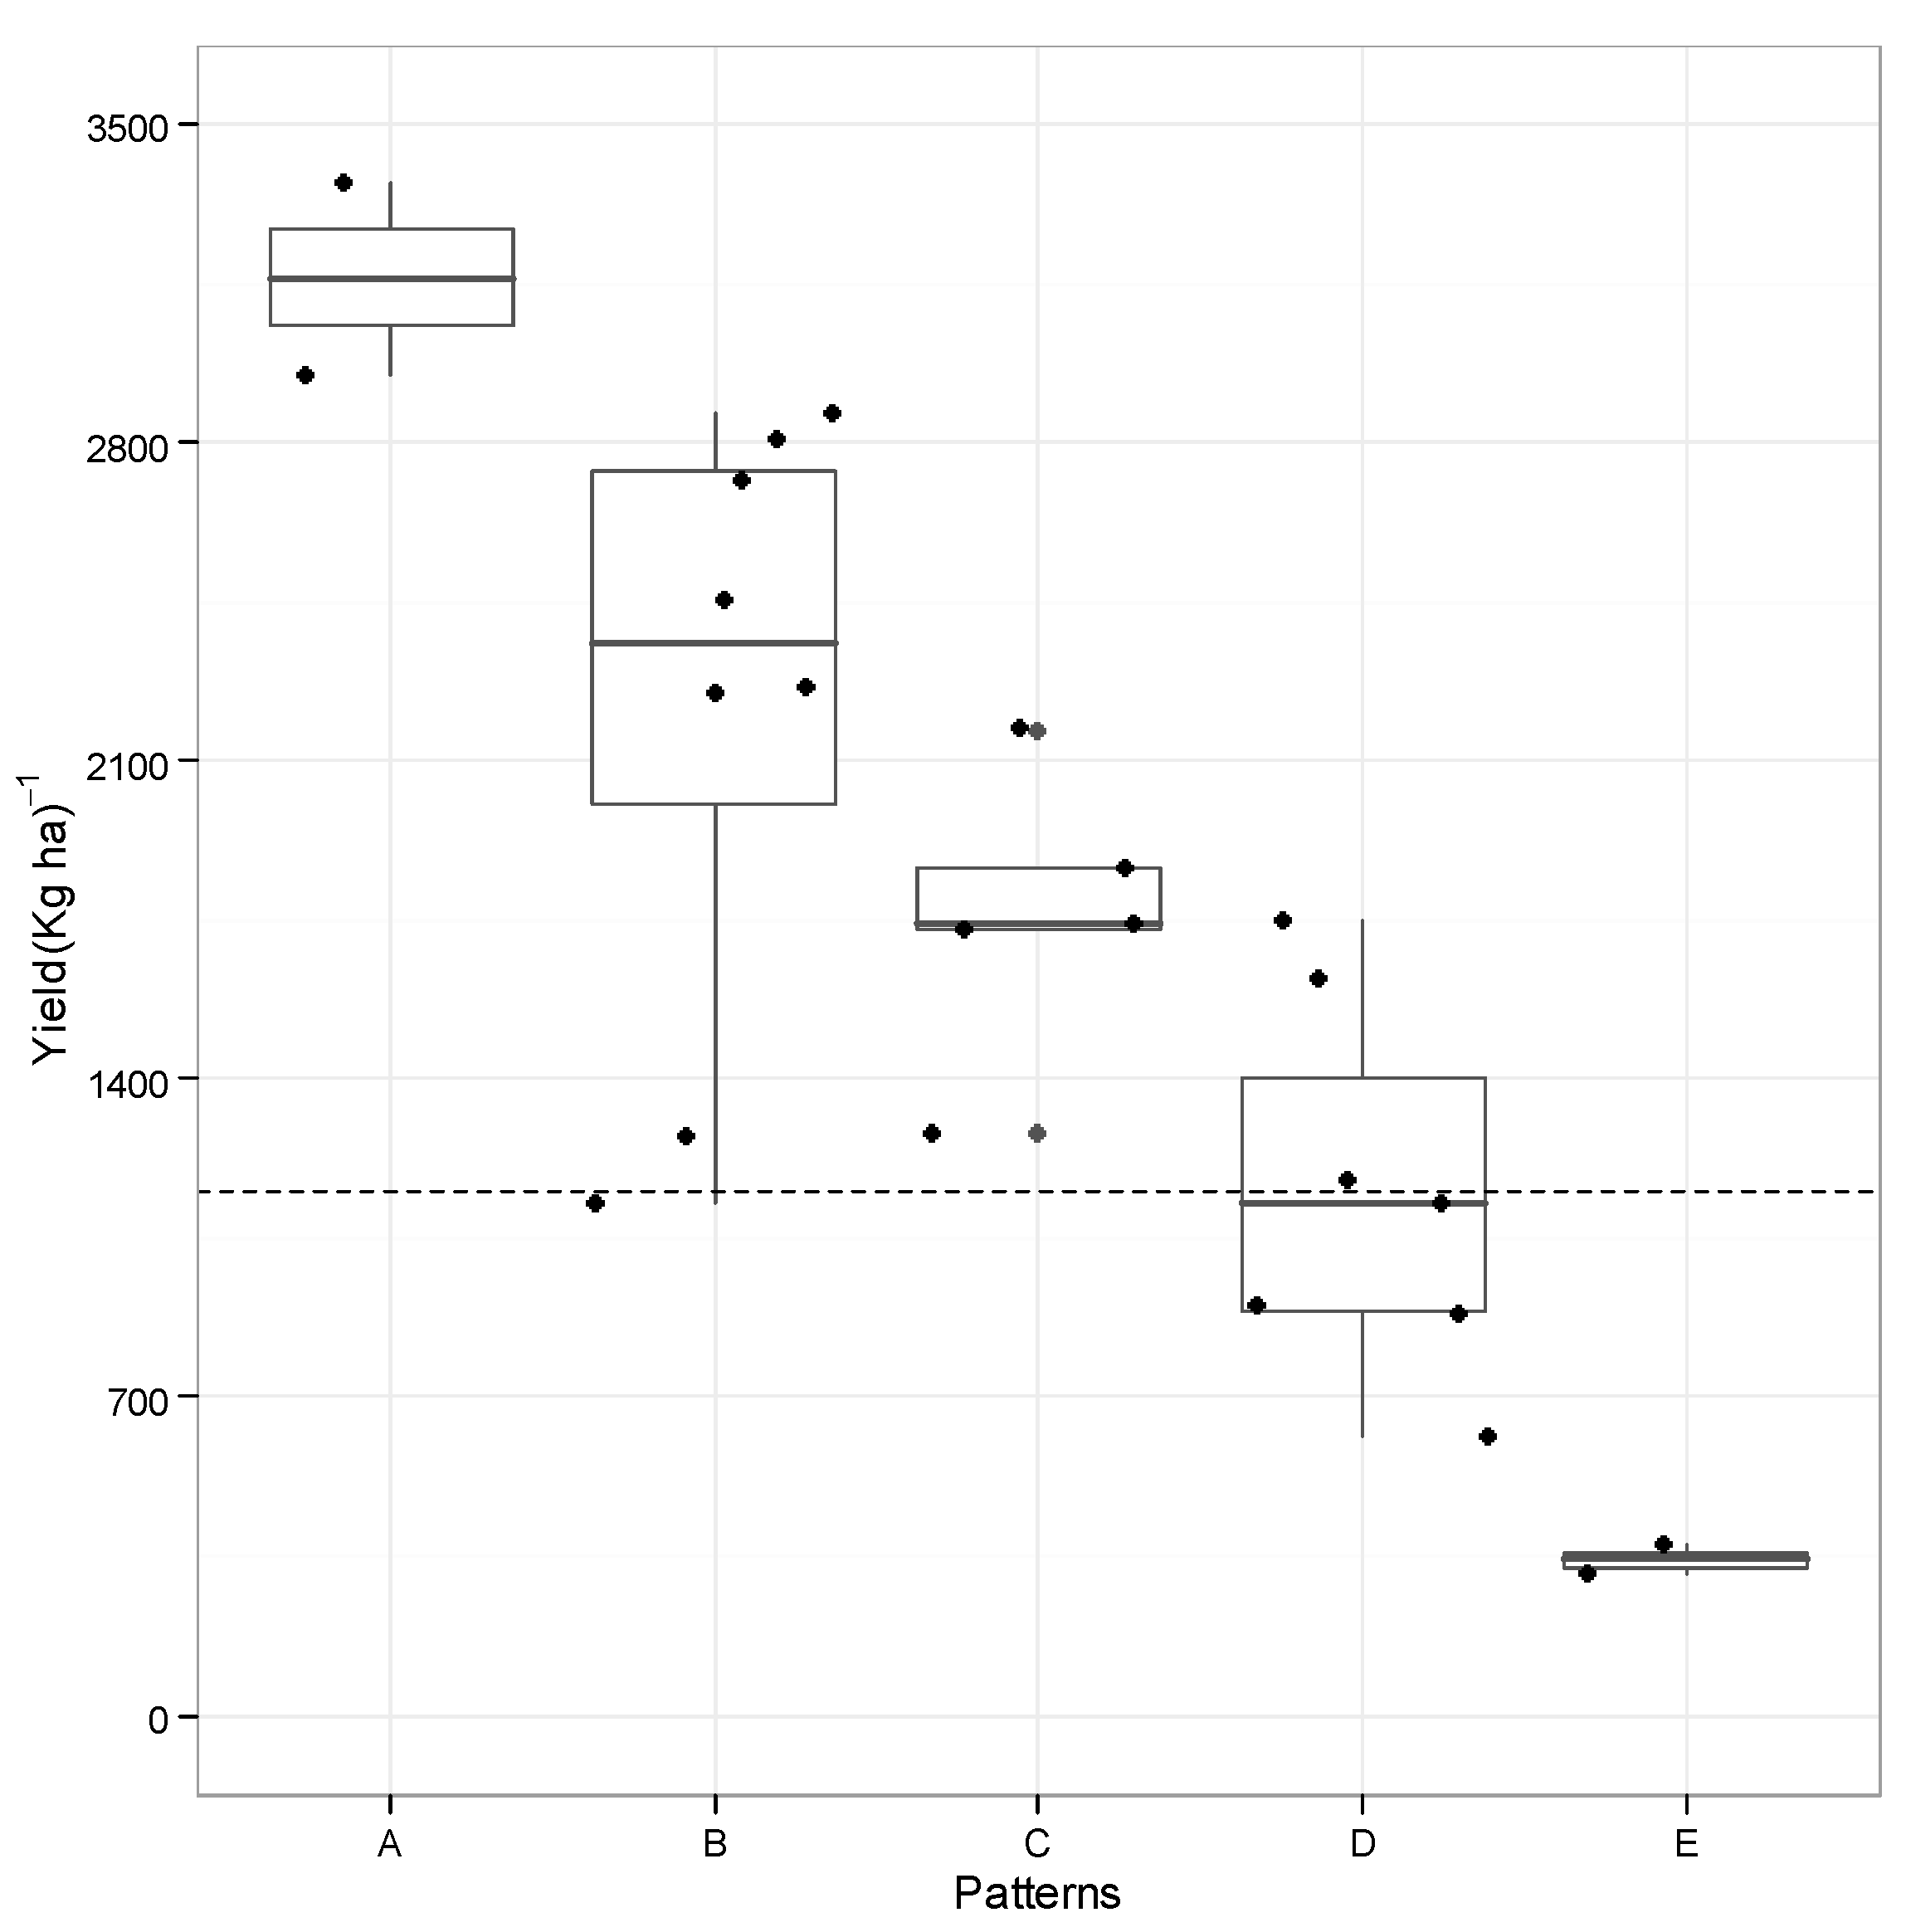
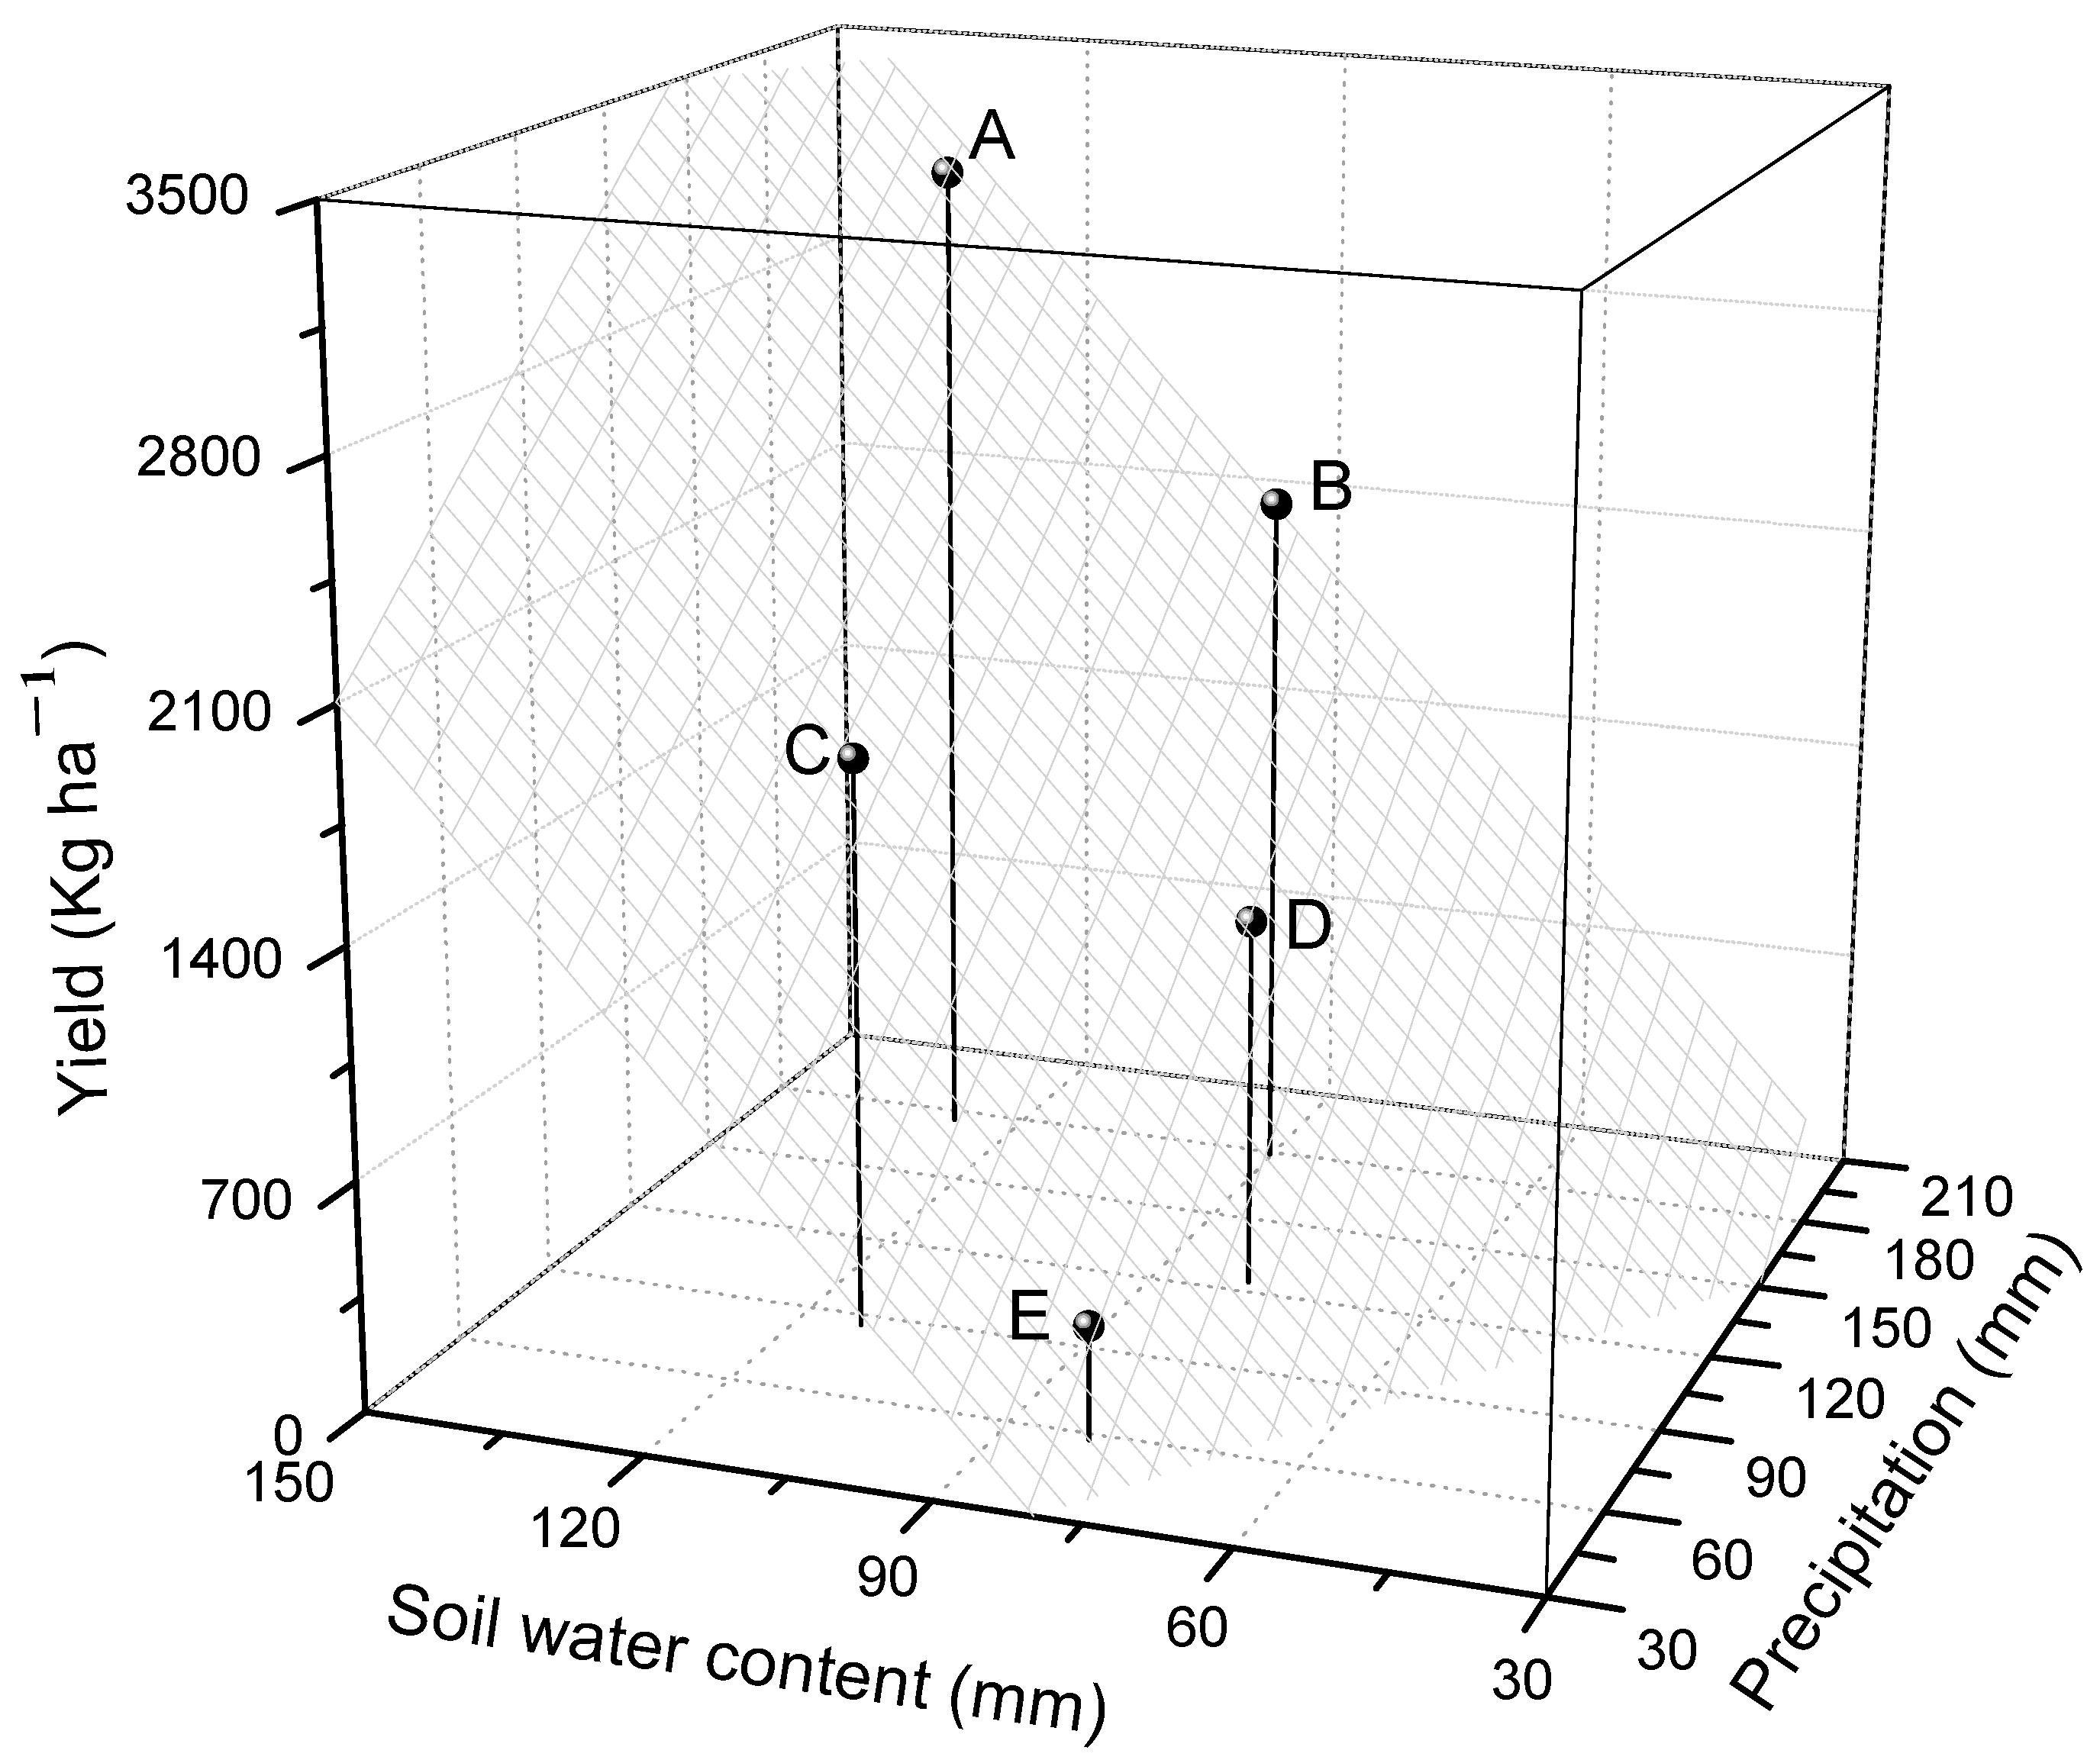
Cluster analysis was applied to spring wheat yield, soil water content, and precipitation. Five different patterns for spring wheat yield were identified (Figure 4). The average yield of each pattern was 3161.4, 2169.1, 1756.8, 1152.8, and 342.5 kg ha−1, respectively (Figure 4 and Table 4 and Table S1). As shown in Table 4, spring wheat yield decreased when precipitation decreased, except in pattern D. In the 1st quartile, 3rd quartile, and median (Table 4), pattern D was characterized by low soil water content at planting and medium precipitation during the spring wheat growing season, which resulted in a medium-low spring wheat yield. This pattern was called ‘the low soil water content at planting–medium precipitation during spring wheat growing season–medium low spring wheat yield (LM-ML)’. In contrast, pattern C had a high soil water content at planting and low precipitation during spring wheat growing season, which led to a medium spring wheat yield. The pattern was labeled as ‘high soil water content at planting–medium precipitation during spring wheat growing season–medium spring wheat yield (HLM)’. Pattern B had medium soil water content at planting and high precipitation during the spring wheat growing season, which contributed to a medium-high spring wheat yield, the medium soil water content at planting, high precipitation during spring wheat growing season, and medium high spring wheat yield (MH-MH). The highest spring wheat yield level was associated with the highest soil water content at planting and higher precipitation during spring wheat growing season, known as HHH. For the lowest yield level, the water conditions were characterized by the lowest soil water content at planting and the lowest precipitation levels during the spring wheat growing season, defined as the LLL pattern.
In a rainfed farming system, more water for crops obtained resulted in higher final crop yield; however, we that found pattern C had 199.7 mm water in total compared to 203.8 mm in pattern D, but the yield of pattern C was significantly higher than that of pattern D. Pattern D had a significantly higher precipitation than pattern C—123.7 versus 86.3 mm—but obtained a lower spring wheat yield. This was only due to pattern C having a higher soil water content at planting than pattern D (p < 0.05). The more water stored at spring wheat planting, the higher the yield obtained. If the soil water content at planting was smaller, the final yield of spring wheat was lower, despite high levels of precipitation during the spring wheat growing season. That indicates that agricultural drought can occur easily if the soil water content at planting is low.
Furthermore, we correlated soil water content, swc, and precipitation, P, to spring wheat yield, Y, by using the data of different climatic patterns and obtained a formula to forecast spring wheat yield and then determined agricultural drought occurrence (Equation (1), Figure 5):
Y = 29.9692 × swc + 12.211 × P − 2755.606, R2 = 0.996, p < 0.001, n = 5
In Equation (1), we found that the levels of soil water content and precipitation were different from each other. The level of soil water content was 29.9 kg ha−1 per mm, which was 2.86 times higher than precipitation at 12.2 kg ha−1 per mm. The levels of the two water supply factors indicated water use efficiency for soil water content and precipitation, respectively. Obviously, higher soil water storage at spring wheat planting resulted in higher yields than precipitation did. Moreover, examining the data from 1987 to 2011, the result was same (Equation (2)).
Y = 21.872 × swc + 11.380 × P − 1864.223, R2 = 0.565, p < 0.001, n = 24
From Equation (2), it can be seen that the level of soil water content is 1.92 times higher than that of precipitation. These results verified the result obtained above: the higher the soil water content at planting, the higher the spring wheat yield and the lower the risk of agricultural drought occurrence.
3.3. Calculating Probability of Agricultural Drought Occurrence Based on Soil Water Content and Precipitation
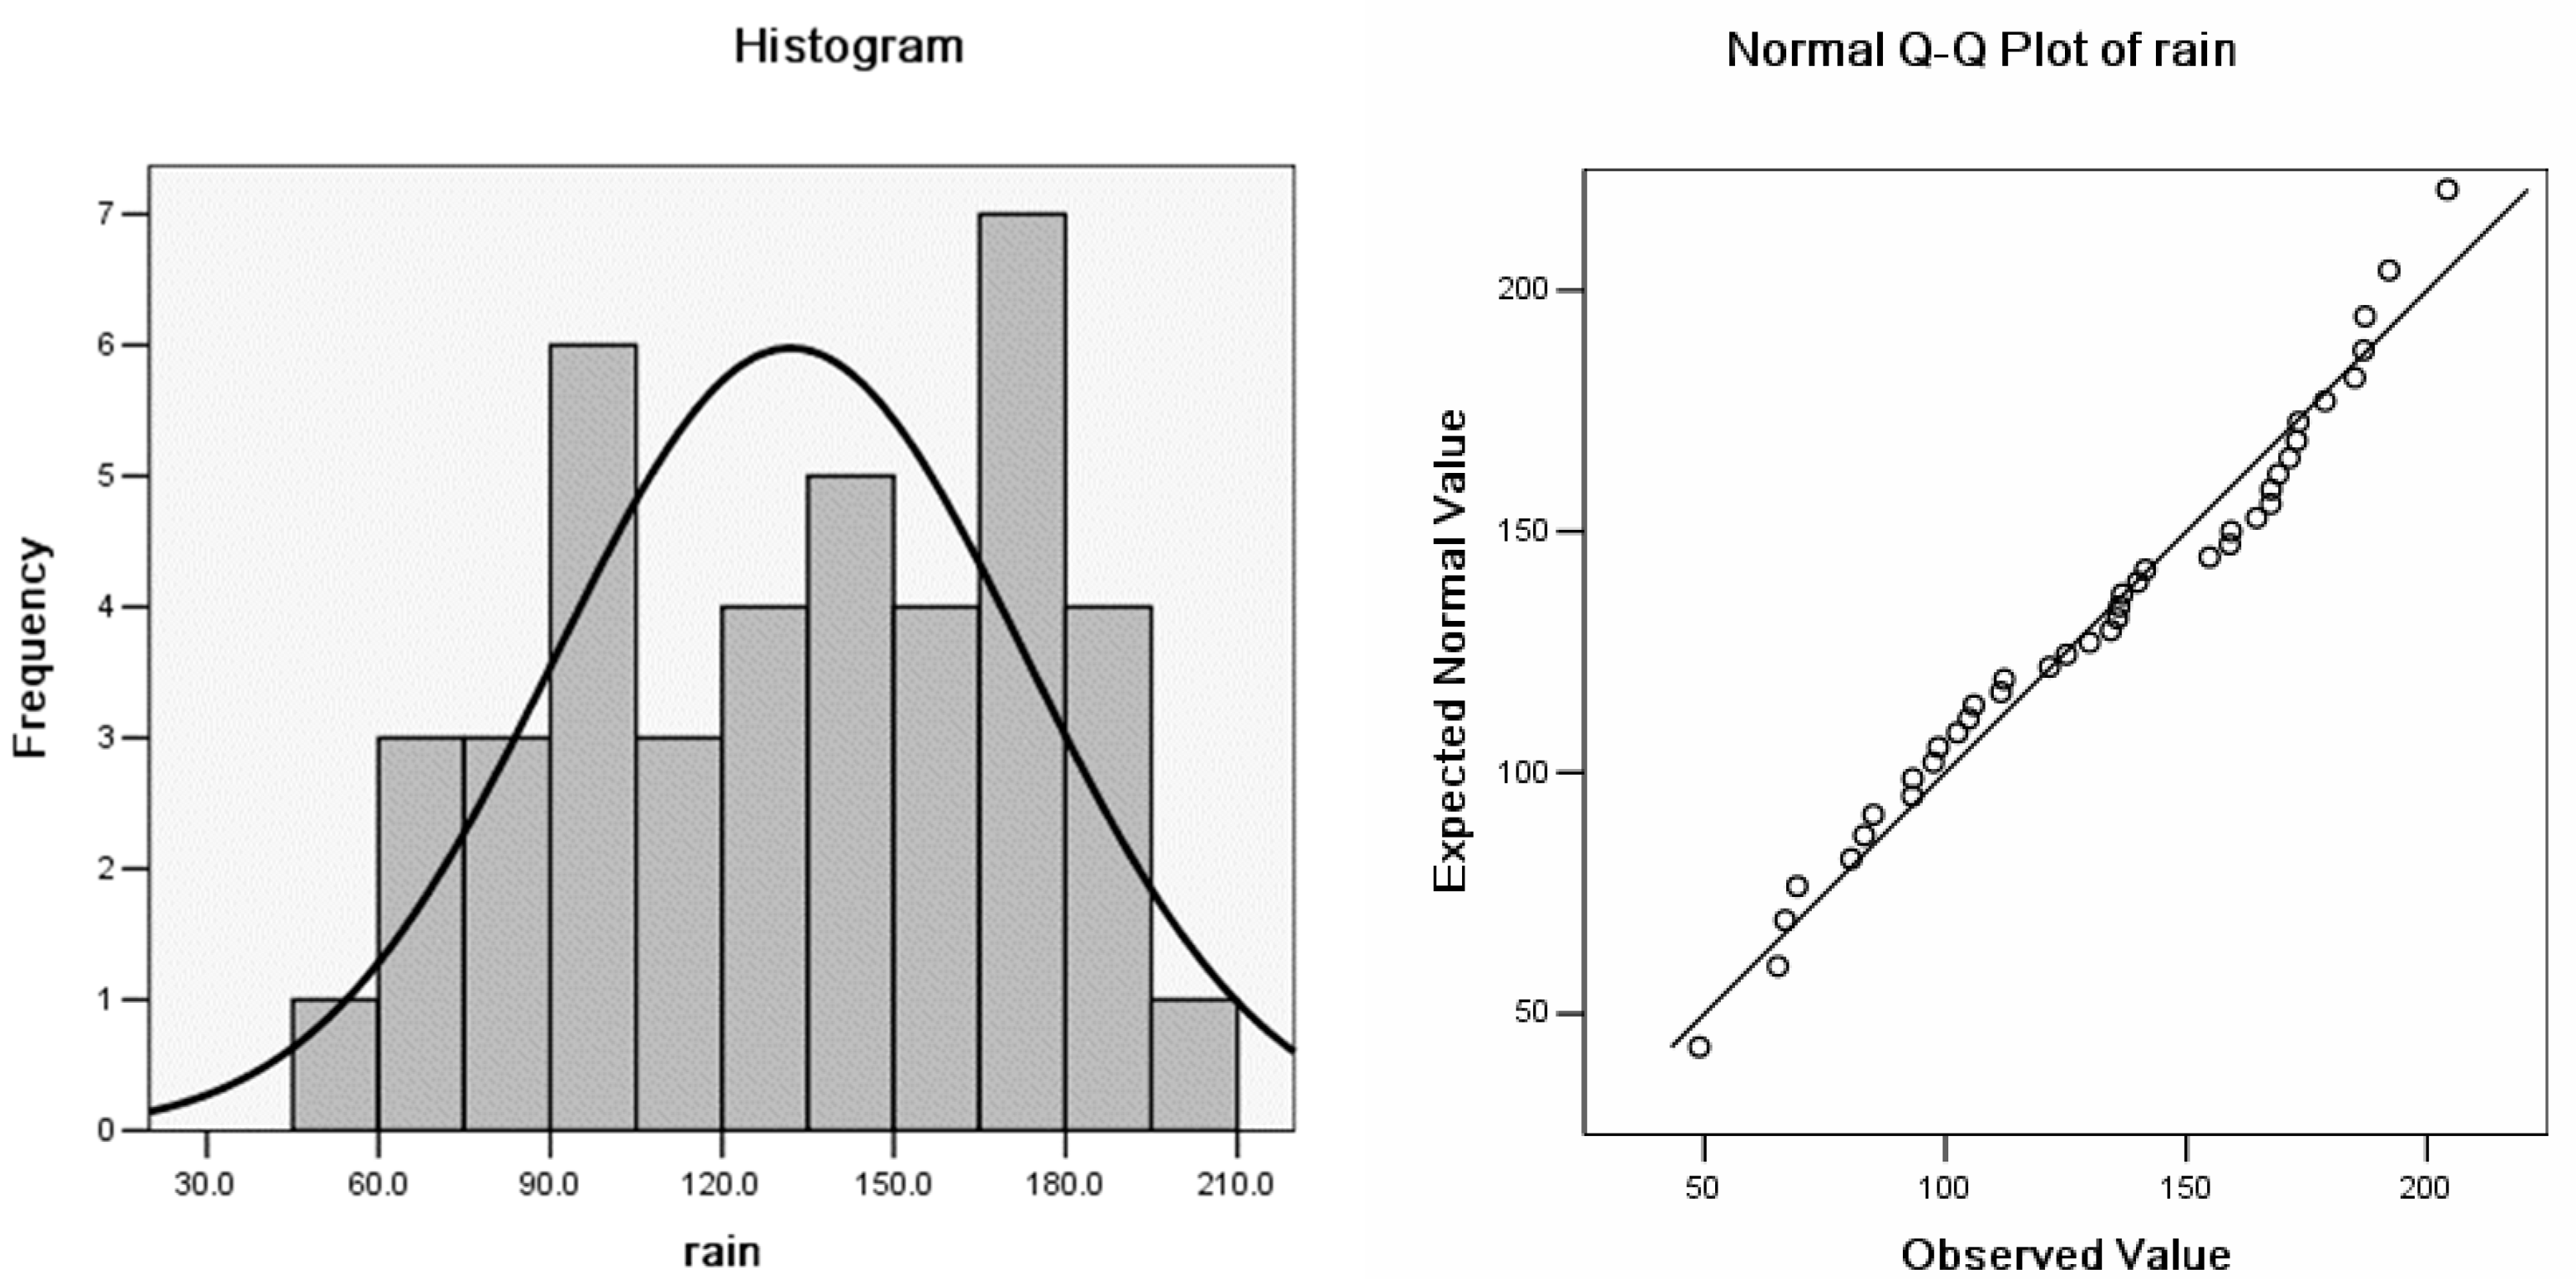
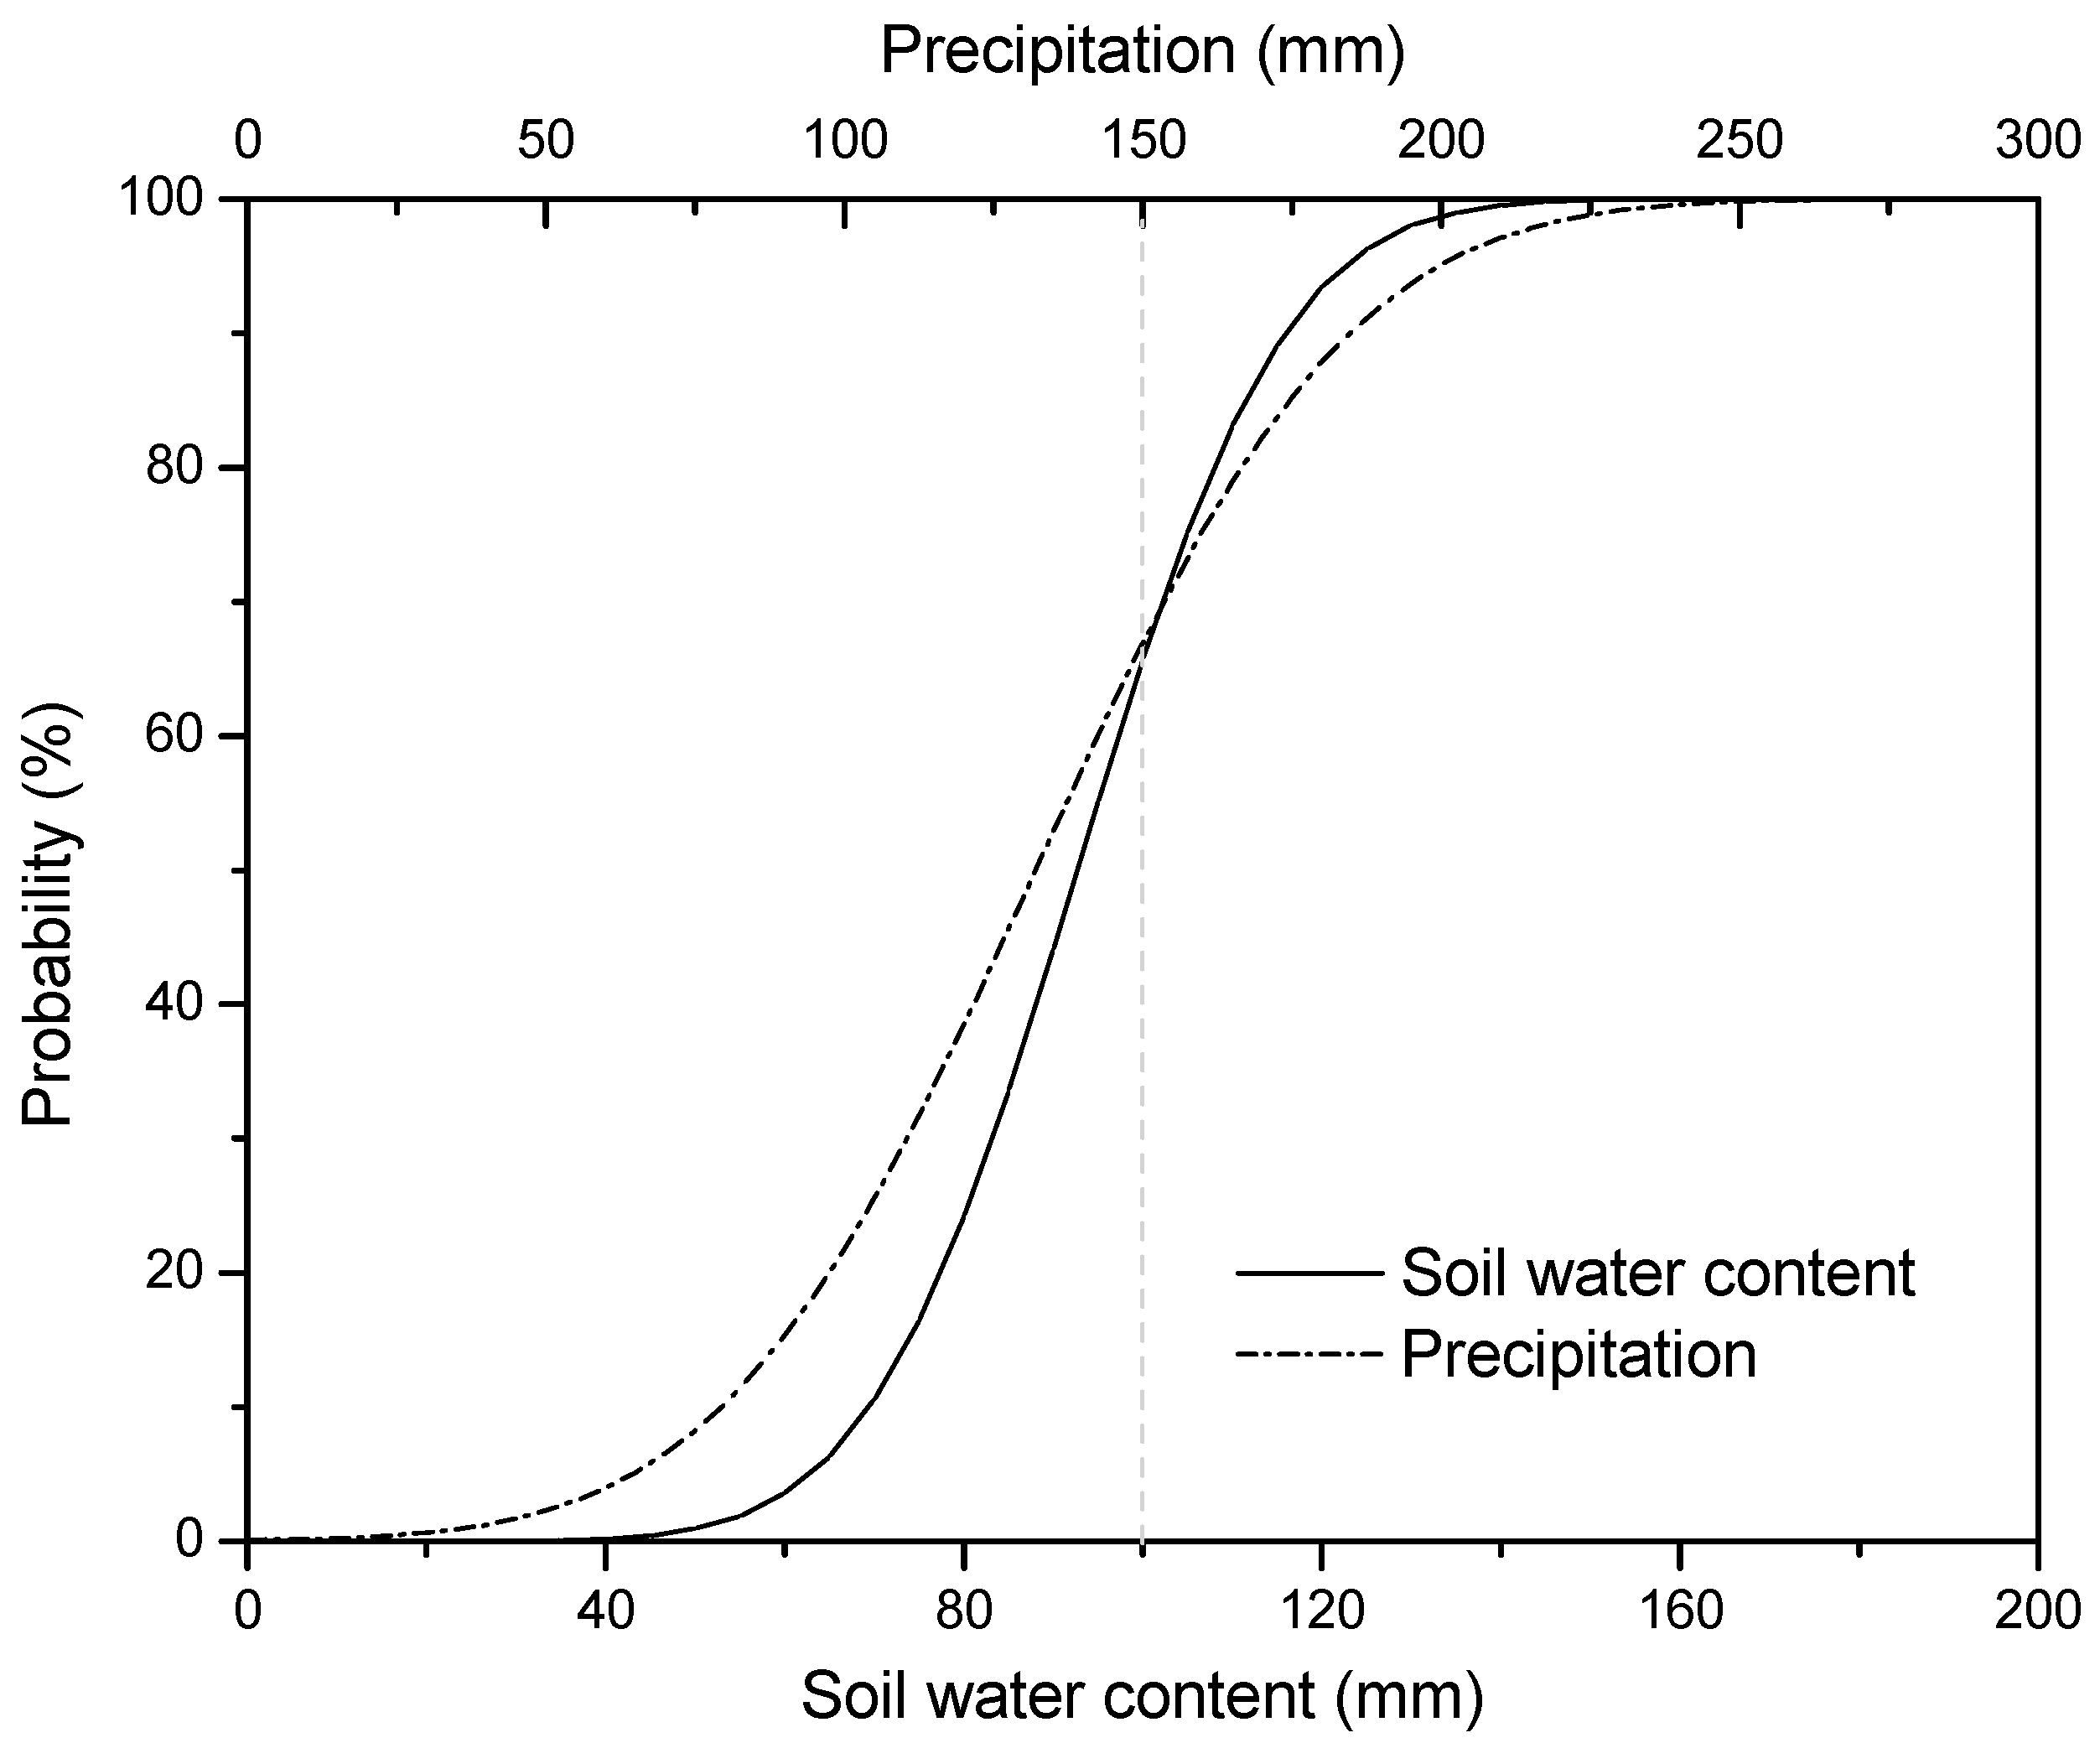
Both historical precipitation during the spring wheat growing season from 1971 to 2011 and soil water content at planting from 1987 to 2011 at Dingxi were distributed normally (Figure 6; the normal distribution of soil water content at planting was similar to precipitation, but this figure is not shown). Therefore, we constructed the probable distributions of precipitation during the spring wheat growing season and soil water content at planting based on normal distributions (Figure 7). This figure showed that soil water content was <81.3, 80.1, 113.4, 90.3, and 127.4 mm in 26.5, 24.3, 87.4, 44.7, and 97.3% of the seasons, respectively. On the other hand, for precipitation during the spring wheat growing period was <57.8, 123.7, 86.3, 178.9, and 175.9 mm in 3.5, 42.0, 13.2, 87.4, and 85.8% of the seasons, respectively. Therefore, the soil water in patterns A, B, C, D, and E, respectively, had sufficient precipitation during the spring wheat growing period to produce less than 3161.4, 2169.1, 1756.8, 1152.8, and 342.5 kg ha−1 spring wheat yield in 83.4, 39.1, 11.6, 10.2, and 0.9% of the seasons (Table 4). Meanwhile, the cumulative probability for each pattern level was calculated in Table 4. From the table, we concluded that if the soil water and precipitation was less than in patterns D and E, agricultural drought would certainly occur. This indicated at least 10.2% of the years in Dingxi would see agricultural drought. On the other hand, there would be no agricultural drought in 10.9% of the years (cumulative probability above pattern C level).
Furthermore, in Section 3.1, we obtained two relationships for the spring wheat yield response to precipitation during the spring wheat growing season. When soil water content at planting was greater than 100 mm, there was no drought, with more than 43.9 mm of precipitation during the spring wheat growing season (Figure 8). From Figure 7, the probability of soil water content at planting ≥ 100 mm was 34.3%, and the probability of precipitation during the spring wheat growing season ≥ 43.9 mm was 98.4%. Therefore, there were 33.7% of years with no drought, as soil water content at planting was more than 100 mm and precipitation during spring wheat growing season was greater than 43.9 mm. Similarly, we calculated the probability of the other three water conditions in Dingxi (Table 4). From Table 4, we found that pattern AA and BB revealed that 71.4% of years saw no agricultural drought. In contrast, 28.6% of years had agricultural drought in Dingxi, approximately one third, which indicates a very high agricultural drought risk.
4. Discussion
4.1. Soil Water Content at Planting Affects the Occurrence of Agricultural Drought
Although the ultimate water resource for crops use is from precipitation, agricultural drought is completely different from meteorological drought. In the current study, we found that the precipitation during the spring wheat growing season only explained a 27.5% variation of the spring wheat yield, resulting in the inaccurate determination of agricultural drought occurrence. The result was similar to that reported in other research areas regarding poor correlations between crop yield and accumulated daily precipitation or a combination of precipitation and other climatic parameter-based drought indices used during crop growing season, such as the percentage of normal precipitation, SPI, and PDSI, for instance [27,28,29,30]. Meteorological drought mainly focuses on the deviation of average precipitation in the long term, whereas the water transport process in the soil–plant unit is the most important part of agricultural drought evolution, and soil moisture is at the center of the spectrum of drought classifications and drought indicators [31,32]. Meanwhile, for growth, development, and yield formation, crops respond to soil moisture directly rather than precipitation, due to soil moisture memory [31]. Soil moisture contains the ‘memory’ of precipitation events, such as the wetness retained in the soil after a rainfall event [33]. On account of soil moisture memory, the meteorological drought indices based on single precipitation events or the combinations of several climatic parameters are inadequate for the reliable assessment of drought [34]. Effective drought conditions for plants are determined by soil moisture availability and not necessarily by precipitation scarcity. Hence, we should take into account the soil water content to determine agricultural drought precisely, not only meteorological factors.
Soil water content at planting and precipitation during the main spring wheat growing season are two main water supply factors for spring wheat growth, development, and yield formation. Traditionally, soil water content at planting has always been neglected for drought research [35]. However, it may have great influence on crop production and agricultural drought occurrence, especially in water-limited areas [36]. The data from the current research clearly showed that two different linear relationships defined the response of spring wheat yield to precipitation during the spring wheat growing season. The levels of the two relationships were different from each other, depending on soil water content at planting time. When soil water at planting was more than 100 mm, in this study, we found that the spring yield was always high with any amount of precipitation during the main spring wheat growing season. The more water stored in the soil early in the growing season has been shown to result in greater vegetative biomass for crops [37]. The greater biomass accumulation from emergence to vegetative stage results in greater leaf area index and leads to the greater collection of solar radiation and greater photosynthesis during flowering, milk-ripe, and mature stages [38]. Ultimately, this would generate greater crop yield development with even a small amount of precipitation during main crop growth period, especially for short and middle duration crops [25,39], for instance, spring wheat, as examined in the current study. Hence, with a significant amount of soil water stored at planting time, despite meteorological drought occurring during the spring wheat growing season, there would not be a significant decrease in final yield, which indicates a low risk of agricultural drought occurrence.
4.2. The Relative Importance of Soil Water Content at Planting and Growing Season Precipitation in Determining Spring Wheat Yield and Agricultural Drought Occurrence
Soil water content at planting is much more important for spring wheat yield and determining agricultural drought occurrence than growing season precipitation. In our current study, we found that spring wheat had higher soil water use efficiency at planting than precipitation use efficiency during the spring wheat growing season, which means that with the same increase in water, soil water content at planting would obtain a higher spring wheat yield than precipitation during the spring wheat growing season. This conclusion was also verified through cluster analysis. Patterns C and D display almost same total amount of water for spring wheat use, but pattern C had significantly higher soil water content at planting and obtained a 600 kg ha−1 higher yield than pattern D, although the latter had saw significantly higher precipitation during the spring wheat growing season than pattern C. The roots of spring wheat are not much deeper than those of winter wheat. Therefore, even though we only have the soil water data at planting time at a 50 cm depth, this still has a significant influence on the spring wheat yield and in determining agricultural drought occurrence. Our results reveal the same conclusions as Stone et al. [40]. Their results indicated that winter wheat has a higher water use efficiency of 98.15 kg ha−1 of soil water available in emergencies than the 82.98 kg ha−1 of in-season precipitation. Their water use efficiency is higher than that in our results because they used a 180 cm depth of available soil water and a longer growing season for winter wheat, which saw much more in-season precipitation. However, Schillinger [36] concluded that with each millimeter of water increase, spring wheat would increase by 14.3 kg ha−1 and 16.9 kg ha−1 for net over-winter soil water gain in May in the inland U.S. Pacific Northwest, which indicates that spring wheat makes less efficient use of stored soil water than it does for precipitation during growing season. The reason for their opposite conclusion than that of our study can mainly be attributes to the different climate types in the two works. Our research was carried out in a temperate zone with a continental monsoon climate, which is characterized by great amount of precipitation in summer and with high variations, whereas in the inland region of the U.S. Pacific Northwest, which is a typical Mediterranean-like climate zone, there is significant rainfall in the winter and limited precipitation in spring. Therefore, there is enough soil water for spring wheat growth at planting, and 2.7 times the soil water content at planting than the spring precipitation in the inland region of the U.S. Pacific Northwest. Hence, spring precipitation is a limited factor in our study but is the most important factor for spring wheat growth in other areas.
4.3. The Probability of Agricultural Drought Occurrence for Rainfed Spring Wheat
With high variations of precipitation during the spring wheat growing season and before the spring wheat growing season, it is important to class the different patterns of water supply to assess the risk of agricultural drought. We obtained the probability of agricultural drought occurrence regarding soil water content at planting of less than 100 mm and soil water content at planting of greater than 100 mm with different levels of precipitation, and 28.6% of years in the study area could be considered to have seen agricultural drought. However, in Table 4, the cumulative probability at less than pattern D level was only 11.1%, which indicates a low agricultural drought risk. The cumulative probability obtained from the cluster’s mean is lower than the linear mean; hence, other patterns of soil water content and precipitation, except D and E, display agricultural drought occurrence. Soil water content and precipitation have three main classes, respectively. Therefore, there are nine patterns of water supply for spring wheat growth. The other four patterns not included in this study were LH, HM, MM, and ML. Comparing the limits of soil water and precipitation for linear means, we concluded that the LH and HM had no agricultural drought occurrence, whereas for patterns MM and ML, agricultural drought still occurred. Due to the short term data collection or precipitation patterns in the current study area, the MM and ML are not typical patterns in this study.
5. Conclusions
Agricultural drought is different from meteorological drought. Soil water content at planting and precipitation during growing season are two different water supply resources for the growth and development of rainfed spring wheat. Soil water content at planting affected spring wheat final yield and, therefore, agricultural drought occurrence during the spring wheat growing season. However, compared with growing season precipitation, soil water content at planting was considered to be more important in determining spring wheat yield and agricultural drought occurrence. Our analysis suggest that storing water in soil before planting spring wheat as much as possible would help farmers in this area obtain higher spring wheat yields and deal with the possible occurrences of drought.
Supplementary Materials
The following supporting information can be downloaded at: https://www.mdpi.com/article/10.3390/atmos14040665/s1, Table S1: The regression equations between spring wheat yield and precipitation during the spring wheat growing season; Table S2: Mean values of spring wheat yield, soil water content at planting, and precipitation during the spring wheat growing season in five different climatic patterns.
Author Contributions
Conceptualization, K.Z., B.Z. and F.Z.; methodology, K.Z. and F.Z.; software, K.Z. and F.Z.; formal analysis, K.Z. and F.Z.; investigation, K.Z. and F.Z.; resources, K.Z.; data curation, K.Z. and F.Z.; writing—original draft preparation, K.Z.; writing—review and editing, B.Z. and F.Z.; visualization, K.Z.; supervision, B.Z. and F.Z.; project administration, K.Z.; funding acquisition, K.Z. and F.Z. All authors have read and agreed to the published version of the manuscript.
Funding
This research was jointly supported by the National Natural Science Foundation of China (42005097, 42175192, 41775107).
Institutional Review Board Statement
Not applicable.
Informed Consent Statement
Informed consent was obtained from all subjects involved in the study.
Data Availability Statement
Data are available upon request.
Conflicts of Interest
The authors declare no conflict of interest.
References
- Otkin, J.A.; Zhong, Y.F.; Hunt, E.D.; Christian, J.I.; Basara, J.B.; Nguyen, H.; Wheeler, M.C.; Ford, T.W.; Hoell, A.; Svoboda, M.; et al. Development of a Flash Drought Intensity Index. Atmosphere 2021, 12, 741. [Google Scholar] [CrossRef]
- Mo, K.C.; Lettenmaier, D.P. Prediction of Flash Droughts over the United States. J. Hydrometeorol. 2020, 21, 1793–1810. [Google Scholar] [CrossRef]
- Narasimhan, B.; Srinivasan, R. Development and Evaluation of Soil Moisture Deficit Index (SMDI) and Evapotranspiration Deficit Index (ETDI) for Agricultural Drought Monitoring. Agric. Forest. Meteorol. 2005, 133, 69–88. [Google Scholar] [CrossRef]
- Hu, C.; Xia, J.; She, D.X.; Li, L.C.; Song, Z.H.; Hong, S. A new framework for the identification of flash drought: Multivariable and probabilistic statistic perspectives Identification of flash drought. Int. J. Climatol. 2021, 41, 5862–5878. [Google Scholar] [CrossRef]
- Passioura, J. The drought environment: Physical, biological and agricultural perspectives. J. Exp. Bot. 2007, 58, 113–117. [Google Scholar] [CrossRef] [PubMed] [Green Version]
- Satoh, Y.; Shiogama, H.; Hanasaki, N.; Pokhrel, Y.; Boulange, J.; Burek, P.; Gosling, S.; Grillakis, M.; Koutroulis, A.; Müller Schmied, H.; et al. A quantitative evaluation of the issue of drought definition: A source of disagreement in future drought assessments. Environ. Res. Lett. 2021, 16, 104001. [Google Scholar] [CrossRef]
- Otkin, J.A.; Anderson, M.C.; Hain, C.; Svoboda, M.; Johnson, D.; Mueller, R.; Tadesse, T.; Wardlow, B.; Brown, J. Assessing the evolution of soil moisture and vegetation conditions during the 2012 United States flash drought. Agric. For. Meteorol. 2016, 218, 230–242. [Google Scholar] [CrossRef] [Green Version]
- Liu, Q.; Yang, Y.; Liang, L.; Jun, H.; Yan, D.; Wang, X.; Chunhui, L.; Sun, T. Thresholds for triggering the propagation of meteorological drought to hydrological drought in water-limited regions of China. Sci. Total Environ. 2023, 876, 162771. [Google Scholar] [CrossRef]
- Heim, R.R. A review of twentieth-century drought indices used in the United States. Bull. Am. Meteorol. Soc. 2002, 83, 1149–1165. [Google Scholar] [CrossRef] [Green Version]
- He, S.; Zhang, E.; Huo, J.; Yang, M. Characteristics of Propagation of Meteorological to Hydrological Drought for Lake Baiyangdian in a Changing Environment. Atmosphere 2022, 13, 1531. [Google Scholar] [CrossRef]
- Ramadas, M.; Govindaraju, R.S. Probabilistic assessment of agricultural droughts using graphical models. J. Hydrol. 2015, 526, 151–163. [Google Scholar] [CrossRef]
- Van Loon, A.; Stahl, K.; Di Baldassarre, G.; Clark, J.; Rangecroft, S.; Wanders, N.; Gleeson, T.; van Dijk, A.; Tallaksen, L.M.; Hannaford, J.; et al. Drought in a human-modified world: Reframing drought definitions, understanding, and analysis approaches. Hydrol. Earth Syst. Sci. 2016, 20, 3631–3650. [Google Scholar] [CrossRef] [Green Version]
- Kumar, V.; Panu, U.s. Predictive Assessment of Severity of Agricultural Droughts Based on Agro-Climatic Factors. J. Am. Water Resour. Assoc. 2007, 33, 1255–1264. [Google Scholar] [CrossRef]
- Hoell, A.; Parker, B.A.; Downey, M.; Umphlett, N.; Jencso, K.; Akyuz, F.A.; Peck, D.; Hadwen, T.; Fuchs, B.; Kluck, D.; et al. Lessons Learned from the 2017 Flash Drought across the US Northern Great Plains and Canadian Prairies. Bull. Am. Meteorol. Soc. 2020, 101, E2171–E2185. [Google Scholar] [CrossRef]
- Fawen, L.; Manjing, Z.; Yong, Z.; Jiang, R. Influence of irrigation and groundwater on the propagation of meteorological drought to agricultural drought. Agric. Water Manag. 2023, 277, 108099. [Google Scholar] [CrossRef]
- Edreira, J.I.R.; Guilpart, N.; Sadras, V.; Cassman, K.G.; van Ittersum, M.K.; Schils, R.L.M.; Grassini, P. Water productivity of rainfed maize and wheat: A local to global perspective. Agric. Forest. Meteorol. 2018, 259, 364–373. [Google Scholar] [CrossRef]
- Zhao, F.N.; Wang, R.Y.; Zhang, K.; Lei, J.; Yu, Q. Predicting spring wheat yields based on water use-yield production function in a semi-arid climate. Span. J. Agric. Res. 2019, 17, 1201. [Google Scholar] [CrossRef] [Green Version]
- Boken, V.; Haque, C. Predicting Drought Using Pattern Recognition. Ann. Arid. Zone 2007, 46, 133–144. [Google Scholar]
- Houmma, I.; Mansouri, L.; Gadal, S.; Garba, M.; Hadria, R. Modelling agricultural drought: A review of latest advances in big data technologies. Geomat. Nat. Hazards Risk 2022, 13, 2737–2776. [Google Scholar] [CrossRef]
- Zhang, K.; Zhang, B.; Zhao, F. Quantifying Agricultural Drought Severity for Spring Wheat Based on Response of Leaf Photosynthetic Features to Progressive Soil Drying. Atmosphere 2022, 13, 531. [Google Scholar] [CrossRef]
- Daly, E.; Porporato, A. A review of soil moisture dynamics: From rainfall infiltration to ecosystem response. Environ. Eng. Sci. 2005, 22, 9–24. [Google Scholar] [CrossRef]
- Porporato, A.; D’Odorico, P.; Laio, F.; Ridolfi, L.; Rodriguez-Iturbe, I. Ecohydrology of water-controlled ecosystems. Adv. Water Resour. 2002, 25, 1335–1348. [Google Scholar] [CrossRef]
- Nielsen, D.C.; Vigil, M.F.; Anderson, R.L.; Bowman, R.A.; Benjamin, J.G.; Halvorson, A.D. Cropping system influence on planting water content and yield of winter wheat. Agron. J. 2002, 94, 962–967. [Google Scholar] [CrossRef]
- Nielsen, D.C.; Vigil, M.F.; Benjamin, J.G. The variable response of dryland corn yield to soil water content at planting. Agric. Water Manag. 2009, 96, 330–336. [Google Scholar] [CrossRef]
- Lyon, D.J.; Boa, F.; Arkebauer, T.J. Water-Yield Relations of Several Spring-Planted Dryland Crops following Winter Wheat. J. Prod. Agric. 1995, 8, 281–286. [Google Scholar] [CrossRef]
- Schlegel, A.J.; Lamm, F.R.; Assefa, Y.; Stone, L.R. Dryland Corn and Grain Sorghum Yield Response to Available Soil Water at Planting. Agron. J. 2018, 110, 236–245. [Google Scholar] [CrossRef] [Green Version]
- Vicente-Serrano, S.M.; Begueria, S.; Lorenzo-Lacruz, J.; Camarero, J.J.; Lopez-Moreno, J.I.; Azorin-Molina, C.; Revuelto, J.; Moran-Tejeda, E.; Sanchez-Lorenzo, A. Performance of Drought Indices for Ecological, Agricultural, and Hydrological Applications. Earth Interact. 2012, 16, 1–27. [Google Scholar] [CrossRef] [Green Version]
- Quiring, S.M.; Papakryiakou, T.N. An evaluation of agricultural drought indices for the Canadian prairies. Agric. For. Meteorol. 2003, 118, 49–62. [Google Scholar] [CrossRef]
- Mkhabela, M.; Bullock, P.; Gervais, M.; Finlay, G.; Sapirstein, H. Assessing indicators of agricultural drought impacts on spring wheat yield and quality on the Canadian prairies. Agric. For. Meteorol. 2010, 150, 399–410. [Google Scholar] [CrossRef]
- Hasan, I.; Abdullah, R. Agricultural Drought Characteristics Analysis Using Copula. Water Resour. Manag. 2022, 36, 5915–5930. [Google Scholar] [CrossRef]
- Hogg, E.H.; Barr, A.G.; Black, T.A. A simple soil moisture index for representing multi-year drought impacts on aspen productivity in the western Canadian interior. Agric. For. Meteorol. 2013, 178, 173–182. [Google Scholar] [CrossRef] [Green Version]
- Wang, F.; Lai, H.; Li, Y.; Feng, K.; Zhang, Z.; Tian, Q.; Zhu, X.; Yang, H. Dynamic variation of meteorological drought and its relationships with agricultural drought across China. Agric. Water Manag. 2021, 261, 107301. [Google Scholar] [CrossRef]
- Champagne, C.; McNairn, H.; Berg, A.A. Monitoring agricultural soil moisture extremes in Canada using passive microwave remote sensing. Remote Sens. Environ. 2011, 115, 2434–2444. [Google Scholar] [CrossRef]
- Mpelasoka, F.; Hennessy, K.; Jones, R.; Bates, B. Comparison of suitable drought indices for climate change impacts assessment over Australia towards resource management. Int. J. Climatol. 2008, 28, 1283–1292. [Google Scholar] [CrossRef]
- Shorachi, M.; Kumar, V.; Steele-Dunne, S. Sentinel-1 SAR Backscatter Response to Agricultural Drought in The Netherlands. Remote Sens. 2022, 14, 2435. [Google Scholar] [CrossRef]
- Schillinger, W.F.; Schofstoll, S.E.; Alldredge, J.R. Available water and wheat grain yield relations in a Mediterranean climate. Field Crops Res. 2008, 109, 45–49. [Google Scholar] [CrossRef]
- Yang, M.; Wang, G.; Lazin, R.; Shen, X.; Anagnostou, E. Impact of planting time soil moisture on cereal crop yield in the Upper Blue Nile Basin: A novel insight towards agricultural water management. Agric. Water Manag. 2021, 243, 106430. [Google Scholar] [CrossRef]
- Nielsen, D.C.; Halvorson, A.D.; Vigil, M.F. Critical precipitation period for dryland maize production. Field Crops Res. 2010, 118, 259–263. [Google Scholar] [CrossRef]
- Li, B.; Zhang, X.; Morita, S.; Sekiya, N.; Araki, H.; Gu, H.; Han, J.; Lu, Y.; Liu, X. Are crop deep roots always beneficial for combating drought: A review of root structure and function, regulation and phenotyping. Agric. Water Manag. 2022, 271, 107781. [Google Scholar] [CrossRef]
- Stone, L.R.; Schlegel, A.J. Yield-water supply relationships of grain sorghum and winter wheat. Agron. J. 2006, 98, 1359–1366. [Google Scholar] [CrossRef]
Figure 1.
The relationship between spring wheat yield and precipitation during spring wheat growing season. (a) The relationship between yield and precipitation without taken soil conditions into consideration, (b) The different relationships between yield and precipitation with taken soil conditions into consideration, (c) The different liner relationships between yield and precipitation with taken soil conditions into consideration. Soil conditions was classified into two groups by the amount of soil water content at planting of greater or less than 100 mm. *** and ** indicate significance levels of 0.001 and 0.01. The ANOVA analysis of the regression equations under different soil conditions are shown in Table S1.

Figure 2.
Responses of spring wheat yield to the ten greatest records of precipitation from March to June. (a) March, (b) April, (c) May, (d) June. * indicates significant level at 0.05.
Figure 2.
Responses of spring wheat yield to the ten greatest records of precipitation from March to June. (a) March, (b) April, (c) May, (d) June. * indicates significant level at 0.05.

Figure 3.
Spring wheat yield associated with soil water content at planting and precipitation during the spring wheat growing season at Dingxi, Gansu Province, China.
Figure 3.
Spring wheat yield associated with soil water content at planting and precipitation during the spring wheat growing season at Dingxi, Gansu Province, China.

Figure 4.
Cluster analysis for spring wheat yield during the period 1987–2011 in Dingxi, Gansu Province, China. The ANOVA analysis of the spring wheat yield, soil water content at planting, and growing season precipitation for different climatic patterns is shown in Table S2.
Figure 4.
Cluster analysis for spring wheat yield during the period 1987–2011 in Dingxi, Gansu Province, China. The ANOVA analysis of the spring wheat yield, soil water content at planting, and growing season precipitation for different climatic patterns is shown in Table S2.

Figure 5.
Spring wheat yield as determined by soil water content at planting and precipitation during spring wheat growing season at Dingxi, Gansu Province, China. The ANOVA analysis of spring wheat yield, soil water content at planting, and growing season precipitation for different climatic patterns is shown in Table S2.

Figure 6.
The statistical characteristics of precipitation during the spring wheat growing season from 1971–2011.
Figure 6.
The statistical characteristics of precipitation during the spring wheat growing season from 1971–2011.

Figure 7.
Probability of soil water content at planting and precipitation during spring wheat growing season at Dingxi, Gansu province, China.
Figure 7.
Probability of soil water content at planting and precipitation during spring wheat growing season at Dingxi, Gansu province, China.

Figure 8.
Probability of a minimum yield of spring wheat based on 1960–2011 precipitation from March to June. Soil conditions was classified into two groups by the amount of soil water content at planting of greater or less than 100 mm.
Figure 8.
Probability of a minimum yield of spring wheat based on 1960–2011 precipitation from March to June. Soil conditions was classified into two groups by the amount of soil water content at planting of greater or less than 100 mm.


Table 1.
Statistics of soil water content at planting, precipitation during each month and main growth periods, and yields for spring wheat during the growth period from 1987 to 2011 (sample number n = 25).
Table 1.
Statistics of soil water content at planting, precipitation during each month and main growth periods, and yields for spring wheat during the growth period from 1987 to 2011 (sample number n = 25).
| Category | Maximum | Minimum | Average | Median | 1st Quartile | 3rd Quartile | Standard Deviation | Coefficient of Variation/% |
|---|---|---|---|---|---|---|---|---|
| Soil water content at planting | 135.0 | 51.2 | 94.3 | 93.2 | 84.5 | 106.8 | 19.6 | 20.8 |
| Precipitation during growth period/mm | 204.2 | 48.9 | 133.5 | 135.0 | 104.8 | 172.9 | 43.4 | 32.5 |
| Precipitation in March/mm | 26.3 | 0 | 10.7 | 9.9 | 5.9 | 16.2 | 6.4 | 59.4 |
| Precipitation in April/mm | 57.1 | 3.1 | 22.8 | 19.8 | 12.6 | 31.0 | 14.1 | 62.1 |
| Precipitation in May/mm | 126.8 | 8.1 | 47.6 | 49.5 | 19.4 | 49.5 | 32.0 | 67.3 |
| Precipitation in June/mm | 96.2 | 12.8 | 52.5 | 46.8 | 38 | 74.2 | 23.7 | 45.1 |
| Yield/(kg ha−1) | 3373.6 | 310 | 1674.0 | 1673.7 | 899.6 | 2455.6 | 902.0 | 53.6 |
Table 2.
Planting, harvesting, and fertilizing details for spring wheat at the Dingxi Experimental Station, 1987–2011.
Table 2.
Planting, harvesting, and fertilizing details for spring wheat at the Dingxi Experimental Station, 1987–2011.
| Year | Variety | Maturity | Seeding Rate (Seeds ha−1) | Fertilizer | |
|---|---|---|---|---|---|
| Farmyard Manure (kg ha−1) | (kg N ha−1) | ||||
| 1987–1991 | Weichun 1 | Middle-Late | 187.5–225.0 | 15,000–35,000 | 42.0–104.0 |
| 1992–1998, 2000 | 81139-2 | Middle-Late | |||
| 1999 | 92 Jian 46 | Middle | |||
| 2001 | Dingxi 35 | Middle | |||
| 2002, 2005–2006, 2008–2011 | Dingxi New 24 | Middle | |||
| 2003–2004 | Longchun 20 | Middle | |||
| 2007 | MY94-9 | Middle-Early | |||
Table 3.
Earliest and latest date of growth stage for spring wheat from 1987 to 2011.
| Growth Period | Sowing Time | Period of Emergence | Trefoil Stage | Jointing Stage | Booting Stage | Heading Period | Flowering Period | Milk-Ripe Stage | Mature Period |
|---|---|---|---|---|---|---|---|---|---|
| Earliest date | 3/12 | 4/6 | 4/22 | 5/16 | 5/26 | 6/3 | 6/8 | 6/24 | 7/6 |
| Latest date | 3/28 | 4/24 | 5/18 | 6/4 | 6/12 | 6/18 | 6/23 | 7/19 | 7/26 |
Table 4.
Mean values of spring wheat yield, soil water content at planting, and precipitation during spring wheat growing season according to a specific cluster. H, M, and L indicates high, middle, and low levels, respectively.
Table 4.
Mean values of spring wheat yield, soil water content at planting, and precipitation during spring wheat growing season according to a specific cluster. H, M, and L indicates high, middle, and low levels, respectively.
| Patterns | Soil Water Content (mm) | Precipitation (mm) | Yield (Kg ha−1) | Class | Cumulative Probability (%) Less | Cumulative Probability (%) More |
|---|---|---|---|---|---|---|
| Cluster mean | ||||||
| A (HHH) | 127.42 H | 175.85 H | 3161.433 H | Normal | 83.405 | 0.391 |
| B (MH-MH) | 90.275 M | 178.925 H | 2169.146 MH | Normal | 39.091 | 6.975 |
| C (HLM) | 113.396 H | 86.26 L | 1756.75 M | Normal | 11.561 | 10.941 |
| D (LM-ML) | 80.084 L | 123.671 M | 1152.824 ML | Drought | 10.212 | 43.919 |
| E (LLL) | 81.305 L | 57.8 L | 342.5 L | Drought | 0.932 | 70.912 |
| Linear mean | ||||||
| AA | ≥100 | ≥43.93 | ≥1171.52 | Normal | 33.73 | |
| BB | <100 | ≥124.4 | ≥1171.52 | Normal | 37.71 | |
| CC | ≥100 | <43.93 | <1171.52 | Drought | 0.54 | |
| DD | <100 | <124.4 | <1171.52 | Drought | 28.02 | |
Disclaimer/Publisher’s Note: The statements, opinions and data contained in all publications are solely those of the individual author(s) and contributor(s) and not of MDPI and/or the editor(s). MDPI and/or the editor(s) disclaim responsibility for any injury to people or property resulting from any ideas, methods, instructions or products referred to in the content. |
© 2023 by the authors. Licensee MDPI, Basel, Switzerland. This article is an open access article distributed under the terms and conditions of the Creative Commons Attribution (CC BY) license (https://creativecommons.org/licenses/by/4.0/).
Share and Cite
MDPI and ACS Style
Zhang, K.; Zhao, F.; Zhang, B. Soil Water Content at Planting Affects Determining Agricultural Drought for Rainfed Spring Wheat. Atmosphere 2023, 14, 665. https://doi.org/10.3390/atmos14040665
AMA Style
Zhang K, Zhao F, Zhang B. Soil Water Content at Planting Affects Determining Agricultural Drought for Rainfed Spring Wheat. Atmosphere. 2023; 14(4):665. https://doi.org/10.3390/atmos14040665
Chicago/Turabian StyleZhang, Kai, Funian Zhao, and Bo Zhang. 2023. "Soil Water Content at Planting Affects Determining Agricultural Drought for Rainfed Spring Wheat" Atmosphere 14, no. 4: 665. https://doi.org/10.3390/atmos14040665
Note that from the first issue of 2016, this journal uses article numbers instead of page numbers. See further details here.