Article

Analysis of the Outdoor Microclimate and the Effects on Greek Cultural Heritage Using the Heritage Microclimate Risk (HMR) and Predicted Risk of Damage (PRD) Indices: Present and Future Simulations

by
Efstathia Tringa
* and
Konstantia Tolika
Department of Meteorology and Climatology, School of Geology, Faculty of Sciences, Aristotle University of Thessaloniki, 54124 Thessaloniki, Greece
*
Author to whom correspondence should be addressed.
Atmosphere 2023, 14(4), 663; https://doi.org/10.3390/atmos14040663
Submission received: 22 February 2023 / Revised: 27 March 2023 / Accepted: 29 March 2023 / Published: 31 March 2023
(This article belongs to the Special Issue Urban Climate Mitigation Techniques and Technologies)

Abstract

:
This study aims to assess the impacts of climate change on the cultural heritage of two Greek areas for both the present time and the future. As the climate is constantly evolving, cultural heritage is continuously exposed to the risk of damage and deterioration. Therefore, museum directors and boards as well as the national ministries must be informed so that measures and practices are adapted to the new climatic conditions. Greece is a country with immense cultural wealth, both tangible and intangible, which stretches back four and a half thousand years. As a homeland of important historical and cultural resources, Greece is vulnerable to climate change. Two up-to-date indices were applied to two Greek areas with high cultural value: Thessaloniki and Delphi. In order to evaluate the suitability of the microclimate and to assess the damage risk, the Heritage Microclimate Risk (HMR) index and the Predicted Risk of Damage (PRD) index were used for two variables: temperature and relative humidity. The study was carried out for three different time periods, the period 1980–2000 (hereafter, the reference period) and the future periods 2039–2059 and 2079–2099. For the reference period, data from three different sources were incorporated in the study (observed, reanalysis, and model data). The simulated data were derived from the Regional Climate Model RegCM4 with a fine spatial resolution of 10 × 10 km. In addition, the emission scenario RCP4.5 was used for the model’s future simulations. The present and future ideal outdoor climate conditions for the monuments were also estimated and are presented in this work. Overall, the future estimations revealed that the ideal outdoor temperature conditions will be higher compared to the reference period, meaning that the monuments will have to adapt to new warmer climate conditions. In addition to the new temperature conditions to which the monuments will have to adapt, the study showed that the monuments will be exposed to “moderate-maximum” risk more often in the future.

1. Introduction

Cultural heritage refers to tangible and intangible assets that constitute the legacy of a society, which are inherited from past generations for the benefit of future ones [1]. Cultural heritage plays an important role in enhancing public education, shaping socio-cultural capital through community identity, and supporting economic growth and employment [2,3,4]. The preservation as well as the transmission of this nonrenewable heritage to future generations is our responsibility. According to the literature, damage to a cultural heritage site can mean the loss of irreplaceable cultural, social, and economic assets to local, national, and global communities [5]. Heritage assets have always been and will continue to be subjected to interactions with their environment such as weathering processes [6]. Climate change is an additional potential threat as it exacerbates the expected rates of decay and/or contributes to the appearance of new decay phenomena [7]. In addition to the negative impacts of climate change on production systems, its impact on cultural heritage includes the aggravation of physical, chemical, and biological mechanisms, changes in air and sea temperatures as well as humidity, sea level rise, flooding, extreme weather events, coastal erosion, etc. [4,8,9,10,11,12,13,14,15,16]. The United Nations Educational, Scientific and Cultural Organization World Heritage Convention [17] has recognized the effects of climate change as a significant threat to cultural heritage both in the present and in the future, stimulating a growing body of related research.
The Greek heritage on which this work focuses includes more than 21,000 monuments and archaeological sites, 18 of which have been recognized by UNESCO as World Heritage Sites. In addition to the high importance of the country’s cultural identity, Greek monuments attract a large percentage of tourists every year, strengthening one of the main economic sectors of Greece, tourism. While the country’s cultural heritage plays an important social and economic role, climate change poses serious threats to the protection and preservation of these non-renewable heritages and resources [4]. Under all the emission scenarios considered, global surface temperature will continue to increase, accompanied by an increase in the frequency and intensity of extreme heat waves, marine heat waves, heavy precipitation, droughts, etc. [18,19,20,21,22]. Future projections show that the Mediterranean region in which Greece is located is particularly vulnerable to climate change, mainly because of intense warming and drought, especially during the summer season [23,24]. More specifically for our country, results from numerous studies have shown that the Greek territory may suffer because of climate change over the 21st century [25]. Tolika et al. [26], using various regional climate models under three SRES emission scenarios, revealed that the temperature will increase in the study region and will be more intense during summer. Later, Zanis et al. [27], utilizing simulation from regional climate models under the A1B SRES emission scenario, indicated an annual increase in temperature, which was more intense at the end of the century. In addition, the hot days, tropical nights, (Abbreviations) and consecutive dry days will increase [22] alongside an increase in flooding and forest fires in urban areas [25]. The future projections of the regional climate model RegCM4 under the RCP4.5 scenario for the Greek area showed an increase in temperature of 2.0–3.0 °C until the middle of the 21st century, with a peak increase of 3.6 °C at the end of the 21st century [28].
The methods of assessment of cultural heritage and resources threatened by climate change are classified into qualitative (i.e., interviews, focus groups) and quantitative (i.e., field surveys, questionnaires, Geographic Information Systems (GIS), models, and simulations) [4]. In general, there are a large number of studies on the effects of climate change on cultural heritage following several research approaches. Some of them use spatial analysis methods and Geographic Information Systems (GIS) [29,30] and study the possible climatic effects on the cultural heritage in terms of floods, fires, etc. Other studies are directed toward the virtual modeling of buildings and the study of the microclimatic conditions of an indoor environment [31,32,33]. Moreover, energy consumption [34,35], economic and societal impacts [36], and people’s comfort and health are also studied [37,38]. Numerous studies apply indicators to assess the risk of the outdoor and indoor microclimate [39,40,41,42,43].
Thus, the awareness of the great importance of cultural monuments to the country both socially and economically, as well as the negative effects that climate change could potentially have on them, motivated our research. Therefore, recognizing the risk of climate to the cultural heritage, the main research questions of this study are: As the climate changes, is the cultural heritage of Greece at risk? If so, what are its effects in terms of the monuments? The main goal of this work is to evaluate the suitability of the outdoor microclimate and to assess the damage risk by applying two indices. We attempted to study the effects of the outdoor microclimate on the monuments in two Greek cultural areas for the present time and the future. The future ideal outdoor climatic conditions were estimated in order to provide useful information to the museum directors and boards for the development of efficient, updated methods and policies to address the potential climate change in the future. To achieve this objective the Heritage Microclimate Risk (HMR) index for assessing the level of risk of the microclimate and the Predicted Risk of Damage (PRD) index for assessing the risk of damage to the cultural heritage were applied. These indices, primarily developed by Fabbri and Bonora [42] for the indoor microclimate, are able to define the potential microclimate risk within a room, as well as the probability that these conditions can cause damage to the objects of value therein conserved (collections, paintings, etc.). The results of their study showed that the two indices can be adopted in the decision-making processes because they make it possible to understand and define the microclimatic conditions necessary to preserve the objects. In our work, we adapted the indices for the evaluation of outdoor climate conditions and applied them to two climate variables, temperature and relative humidity. Apart from the fact that this is the first time that the HMR index is being used for the Greek area and for the outdoor microclimate analysis, the main reasons for its selection are the following:
  • The database necessary for the calculation of the HMR value can be a monitoring campaign or a virtual simulation [42].
  • The HMR index can be applied to any climate parameter, while the ideal climate conditions can be determined from time series data.
  • In addition to the risk induced by the outdoor–indoor environmental parameters, it also includes the risk from the daily–hourly fluctuations of the microclimatic parameters.
In the next section of this study, the methodology for the HMR and PRD index computation is analyzed as well as the data that are being used. Moreover, the statistical characteristics and results of the indices are presented for the stations under study. Finally, the conclusions derived from the study as well as a literature discussion of them can be found in the last section of this research article.

2. Materials and Methods
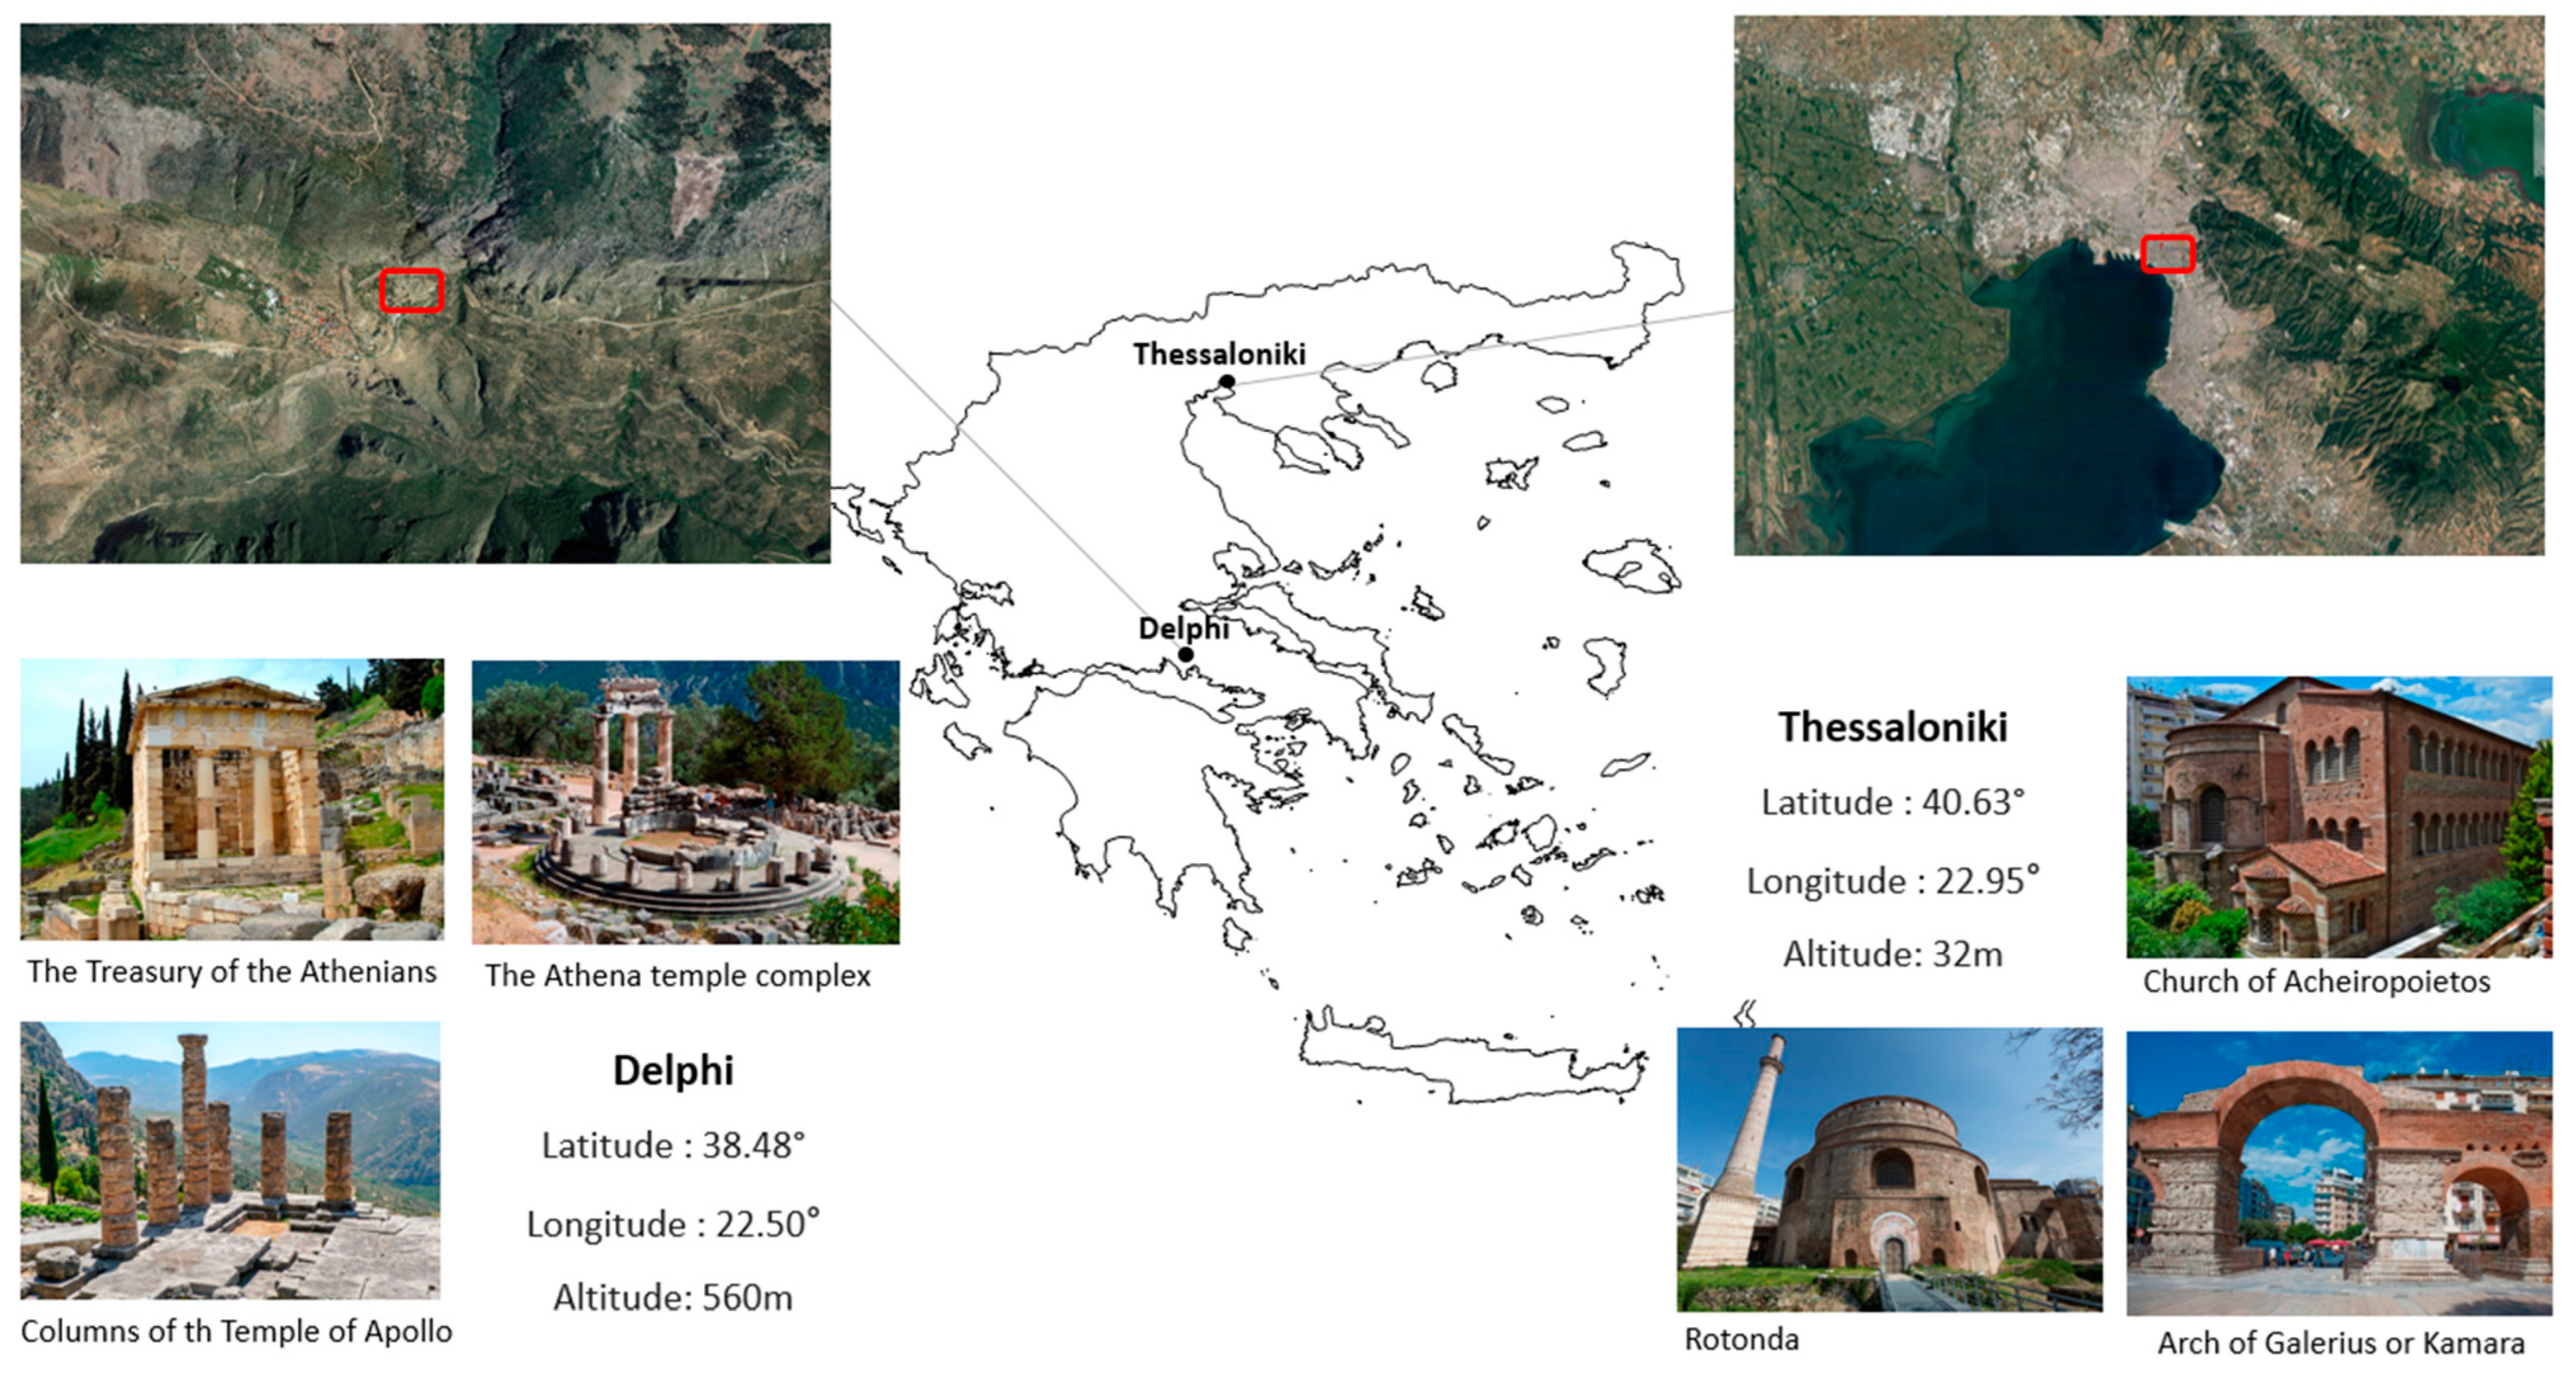
2.1. Study Area

The regions of Thessaloniki and Delphi were the case studies of the present work. The selection of the stations was based on their high cultural value. The city of Thessaloniki is located in northern Greece and placed along the northeast coast of Thermaikos gulf. The climate of the city is characterized by Mediterranean temperature conditions, with generally hot, dry summers and mild and wet winters. The average minimum (Tmin), mean (Tmean), and maximum (Tmax) temperature values for the period 1980–2000 were 12.3 °C, 16.3 °C, and 20.9 °C. The city of Thessaloniki is characterized by a rich heritage of Early Christian and Byzantine Art (Figure 1). For several centuries Thessaloniki was the second most important city of the Byzantine Empire, played an important role in Christianity during the Middle Ages, and was decorated with impressive buildings. Various architectural styles, such as the traditional Macedonian architecture or the neoclassical and eclectic styles up to the modern architecture of the interwar period, indicate the richness of the tradition of the city [44]. In 1988 UNESCO declared 15 of the ‘finest monuments’ of the city to be World Heritage Sites, representative samples of this period of its history.
Delphi, the second case study, lies between two towering rocks of Mt. Parnassus, known as the Phaidriades (Shining) Rocks, in the regional unit of Phocis in Central Greece, north of the Corinthian gulf (Figure 1). The area of Delphi is characterized by a continental climate because of its geographical location. The summers are warm and dry, and the winters are long and cold. The average minimum (Tmin), mean (Tmean), and maximum (Tmax) temperature values for the period 1980–2000 were 11.4 °C, 14.5 °C, and 17.5 °C. According to history, the Pan-Hellenic sanctuary of Delphi, where the oracle of Apollo spoke, was the site of the omphalos, the “navel of the world” (UNESCO). Delphi in the 6th century B.C. was indeed the religious center and symbol of unity of the ancient Greek world. Today it is a major archaeological site with well-preserved monuments. It was designated a UNESCO World Heritage site in 1987.

2.2. Data

In order to achieve a detailed assessment of the present and future temperature and relative humidity conditions in the case studies, hourly data derived from three sources were used, which primarily correlated. Regarding the period 1980–2000, observational data from the meteorological station of the Aristotle University of Thessaloniki (AUTH) for Thessaloniki’s region were used. Accordingly, the fifth-generation ECMWF reanalysis ERA5-Land data for Delphi’s region were used. ERA5-Land is a reanalysis dataset providing hourly high-resolution information of surface variables over several decades at ~9 km grid spacing. This reanalysis dataset was produced by replaying the land component of the ECMWF ERA5 climate reanalysis.
The present-day data archive is enriched with 3-hourly data from an up-to-date regional climate model that we are running in our department. The RCM RegCM4 (40) constitutes a hydrostatic, compressible model with a sigma-p vertical coordinate [45,46], which was developed by the National Center for Atmospheric Research (NCAR). The dynamical core of the model is similar to that of the hydrostatic version of the NCAR-PSU Mesoscale Model version 5 (MM5) [47]. The simulation was driven by the HadGEM2 general circulation model (GCM). Table 1 indicates the main physics parameterizations of the model according to Velikou et al. [28]. The spatial resolution of the model is 25 × 25 km; however, in this study, it was used with a dynamical downscaling to a finer resolution of 10 × 10 km providing detailed simulations of the climate parameters in Greece. This fine spatial analysis proved in the case of a sharply orographic country such as Greece to be far better and more efficient in simulating the climate [48]. To assess the impact of future climate changes on the cultural heritage of the two case studies, the future projections of the aforementioned regional climate model were used. As for the present day and for the future projections, the model was applied after its dynamical downscaling in order to provide future time series for the finer analysis of 10 × 10 km. An updated emission scenario RCP (Representative Concentration Pathway) (RCP4.5) was used for the model’s output. In RCP4.5 the future greenhouse gas emissions will rise until 2040 and then decline, thus characterizing this RCP as a “medium”.

2.3. Heritage Outdoor MicroClimate Risk (HMRout) Index

To evaluate the suitability of the microclimates and to assess the risk of damage that the monuments may suffer from the climatic conditions themselves, two new indices of preventive conservation of the cultural heritage were studied. The Heritage Microclimate Risk (HMR) index and the Predicted Risk of Damage (PRD) index were primarily introduced and applied to indoor climatic assessment by Fabbri and Bonora [42]. According to the literature [42], in cases where the cultural objects have adapted themselves to the historical microclimate, the minimum and maximum values (“higher” and “lower” thresholds) of the index are defined by the monitoring campaign or by virtual environmental simulation. The Heritage Microclimate Risk (HMR) index takes a value between: HMRlow = −1 (the risk condition relative to the “lower threshold”) and HMRhigh = +1 (the risk condition relative to the “higher threshold”) (Table 2). Thus, we can understand if the climatic conditions are risky because they tend toward low or high ideal climate conditions. The HMR is the product of the sum of two other indices: HMRenv (HMR-environmental) and HMRosc (HMR-oscillation).
The fact that the HMR index depends on the characteristics of the microclimate [1] motivated us to update and apply it to outdoor microclimate conditions. In this work, we considered that the cultural objects have adapted to the outdoor microclimate conditions, and we applied the indices in the evaluation of outdoor climate conditions. Therefore, the Heritage Microclimate Risk (HMR) index, hereafter, Heritage Outdoor Microclimate index HMRout, is defined as the outdoor microclimate risk of the cultural heritage and makes it possible to assess the risk related to the microclimate. In addition, in this study, the risk of the outdoor microclimate (HMRout index) was computed and analyzed on a seasonal scale for 21-year periods. The HMRout index was applied to the two climate variables, temperature and RH, which were calculated individually.
H M R = H M R e n v + H M R o s c 2
H M R o u t = H M R e n v . o u t + H M R f l u c . 2 ( Updated   index )
We considered that the objects have adapted to a range of climate conditions (hereafter, ideal climate conditions) where any change in them could cause deterioration of the heritage monuments [6,54]. Therefore, the “higher” and “lower” thresholds are the limits of the ideal climate conditions and are measured as follows:
H_HMRenv.out (higher threshold) is the maximum value from the outdoor data series (excluding the “scattered values” [1]. In this study, H_HMRenv.out is identified as the maximum value from the average seasonal temperature or RH.
L_HMRenv.out (lower threshold) is the minimum value from the outdoor data series (excluding the “scattered values” [1]. In this study, L_HMRenv.out is the minimum value from the average seasonal temperature or RH.
H_HMRenv.out and L_HMRenv.out are the limits of the outdoor ideal climate conditions.
HMRenv.out.data is defined as:
H M R e n v . o u t . d a t a = M e n v . o u t . d a t a N
HMRfluc is defined as:
H M R f l u c = 1 × H Δ f l u c H M R f l u c . d a t a H Δ f l u c L Δ f l u c × 2
H_Δfluc is the maximum value of hourly fluctuation from the outdoor data series (excluding the “scattered values” [1] In this study H_Δfluc is the maximum value from the average seasonal hourly fluctuation of temperature or RH.
L_Δfluc is the minimum value of hourly fluctuation from the outdoor data series (excluding the “scattered values” [1]. In this study L_Δfluc is the minimum value from the average seasonal hourly fluctuation of temperature or RH.
HMRfluc data is defined as:
H M R f l u c . d a t a = Δ Μ f l u c . d a t a N
ΔΜfluc.data is defined as:
Δ Μ f l u c . d a t a = k = 1 n j = 1 24 X d a y , k , h o u r j X d a y , k , h o u r ( j + 1 )
According to Fabbri and Bonora [42] if HMRenv > 0, then the sign of the HMR index will be “+”, while if HMRenv < 0, the sign will be “−“, considering HMRenv as the predominant cause of risk between HMRenv (HMRenv.out) and HMRosc (HMRfluc).

2.4. Predicted Risk of Damage (PRD) Index

The PRD index is defined as a forecast of the risk of damage, and it assesses the probability of damage caused by the microclimatic conditions [42]. It depends on the microclimate, on the HMR, and on the type of material. The diverse materials (inorganic, organic, etc.) have different behaviors and are exposed to different risks. In this study, the PRD index was applied to inorganic materials because most monuments in the Greek area are made of stone and marble. According to the literature [42] the values of “a” and “b” were determined on an empirical basis from the standards reported by UNI 10829 [55] and EN 15757 [56], and they differ by the type of material (inorganic, organic, etc.).
P R D = 1 0.95 × e ( a × H M R 4 b H M R 2 ) ( % )
P R D = 1 0.95 × e ( a × H M R o u t 4 b H M R o u t 2 ) ( Updated   index )

3. Results

3.1. Correlation of Model-Observational and Model-Reanalysis Data

Initially, aiming to assess the ability of the model data to simulate the present climate conditions (temperature and RH), the model outputs with the available data (observational data for Thessaloniki (AUTH) and reanalysis data for Delphi (ERA5)) were compared. For that purpose, four criteria were selected: the mean biases of the two meteorological parameters, the standard deviation differences, the median, and the percentiles (25th and 75th) of all datasets. Table 3 and Table 4 show the results for the reference period 1980–2000 and for the two case studies. All the differences (biases) were calculated as (Model-Observed (Reanalysis)).
The mean biases of the average seasonal temperature indicated that the model underestimated (negative differences) the average seasonal temperature for spring, summer, and autumn for both case studies (Thessaloniki and Delphi). In contrast, for the winter period, the model overestimated the average seasonal temperature in both case studies, simulating a “warmer” winter than it actually is. More specifically, the differences for winter, spring, summer, and autumn were 0.7 °C, −2.5 °C, −2.2 °C, and −0.6 °C, respectively, for Thessaloniki. The largest difference was found for spring and the smallest one for the autumn period, which highlighted a lower and higher simulation skill, respectively, for the two periods. In Delphi, the simulated temperature overestimated the reanalysis by 0.7 °C for winter, and it underestimated it by −1.3 °C, −1.0 °C, and −1.7 °C for spring, summer, and autumn. Additionally, the standard deviation differences revealed that the examined model can simulate quite efficiently the temperature variability (in all stations and seasons). Overall, when the model overestimated the standard deviation then the simulated time series presented a larger variability than the observational/reanalysis ones. Thus, the standard deviation differences showed that the simulated time series presented a larger variability than the observational ones for winter and summer and a smaller variability for spring and autumn for Thessaloniki. A larger divergence of simulated data from the mean value (larger variability) was observed for winter, while a smaller one (smaller variability) was observed for spring and autumn for Delphi. Additionally, the simulated and reanalysis time series showed a similar variability (zero difference) for summer.
Moreover, the median and 25th and 75th percentiles were investigated. In detail, the differences of the median for the periods of winter, spring, summer, and autumn were 1.0 °C, −2.3 °C, −2.2 °C, and −0.8 °C in Thessaloniki. The model overestimated the median for winter and underestimated it for the other seasons. Accordingly, the interquartile range differences were 3.5 °C, −1.7 °C, 1.4 °C, −2.3 °C. The above findings outlined a greater model dispersion for the winter and summer (positive differences) and a smaller one for spring and autumn (negative differences). In Delphi the differences of the median for winter, spring, summer, and autumn were 1.1 °C, −1.1 °C, −0.8 °C, −0.3 °C, while the differences of the interquartile range were −0.9 °C, −2.1 °C, −0.9 °C, −2.4 °C, respectively. In this case, the model indicated a lower dispersion for all the seasons. In summary, the model showed a warm bias of mean seasonal temperature for winter and a cold bias for the other seasons, but the variability was almost the same for both case studies.
In the case of RH, the mean biases showed that the model overestimated (positive differences) the average seasonal RH in all seasons, simulating a more humid climate in both examined areas. The actual differences found for winter, spring, summer, and autumn were 16.0%, 16.0%, 8.0%, and 14.0% in Thessaloniki and 10.0%, 16.0%, 11.0% and 16.0%, respectively, in Delphi. The smallest differences were found for the summer period in Thessaloniki and for the winter and summer in Delphi, showing a better simulation skill of the model. Moreover, the standard deviation differences for the periods of winter, spring, summer, and autumn were −4.0%, −4.8%, −0.7%, −1.0% in Thessaloniki and −0.6%, −1.7%, −0.3% and −0.7% in Delphi, respectively. It was found that the model underestimated the variability of the time series for all seasons and both case studies. Therefore, the simulated time series presented smaller stdev values than the observational or reanalysis ones and thus a smaller divergence from the mean value.
Additionally, a generic overestimation of the median was observed for all the seasons and for both case studies. The comparison of the results revealed that the model performed better (smaller differences) regarding the median for the summer (6.4%) than for winter, spring, and autumn (15.4%, 16.0%, and 14.8%) for Thessaloniki. In Delphi, the model was found more efficient (smaller differences) in reproducing the median of winter (11.3%) than the median of spring, summer, and autumn (15.4%, 13.0%, and 14.2%). Moreover, the analysis of the 25th and 75th percentiles showed that the interquartile range differences for winter, spring, summer, and autumn were −3.7%, −3.8%, 9.4%, and −2.2%, respectively, in Thessaloniki. The model’s data seemed to present a smaller dispersion for winter, spring, and autumn (positive differences) and the largest dispersion for summer. Finally, in the case of Delphi, the model data had a lower dispersion in all seasons (−7.1%, −13.6%, −6.6%, and −18.2%), meaning that in a possible future overestimation or underestimation, the interquartile range will be smaller than the potential real ones.

3.2. Cultural Heritage’s Ideal Climate Conditions

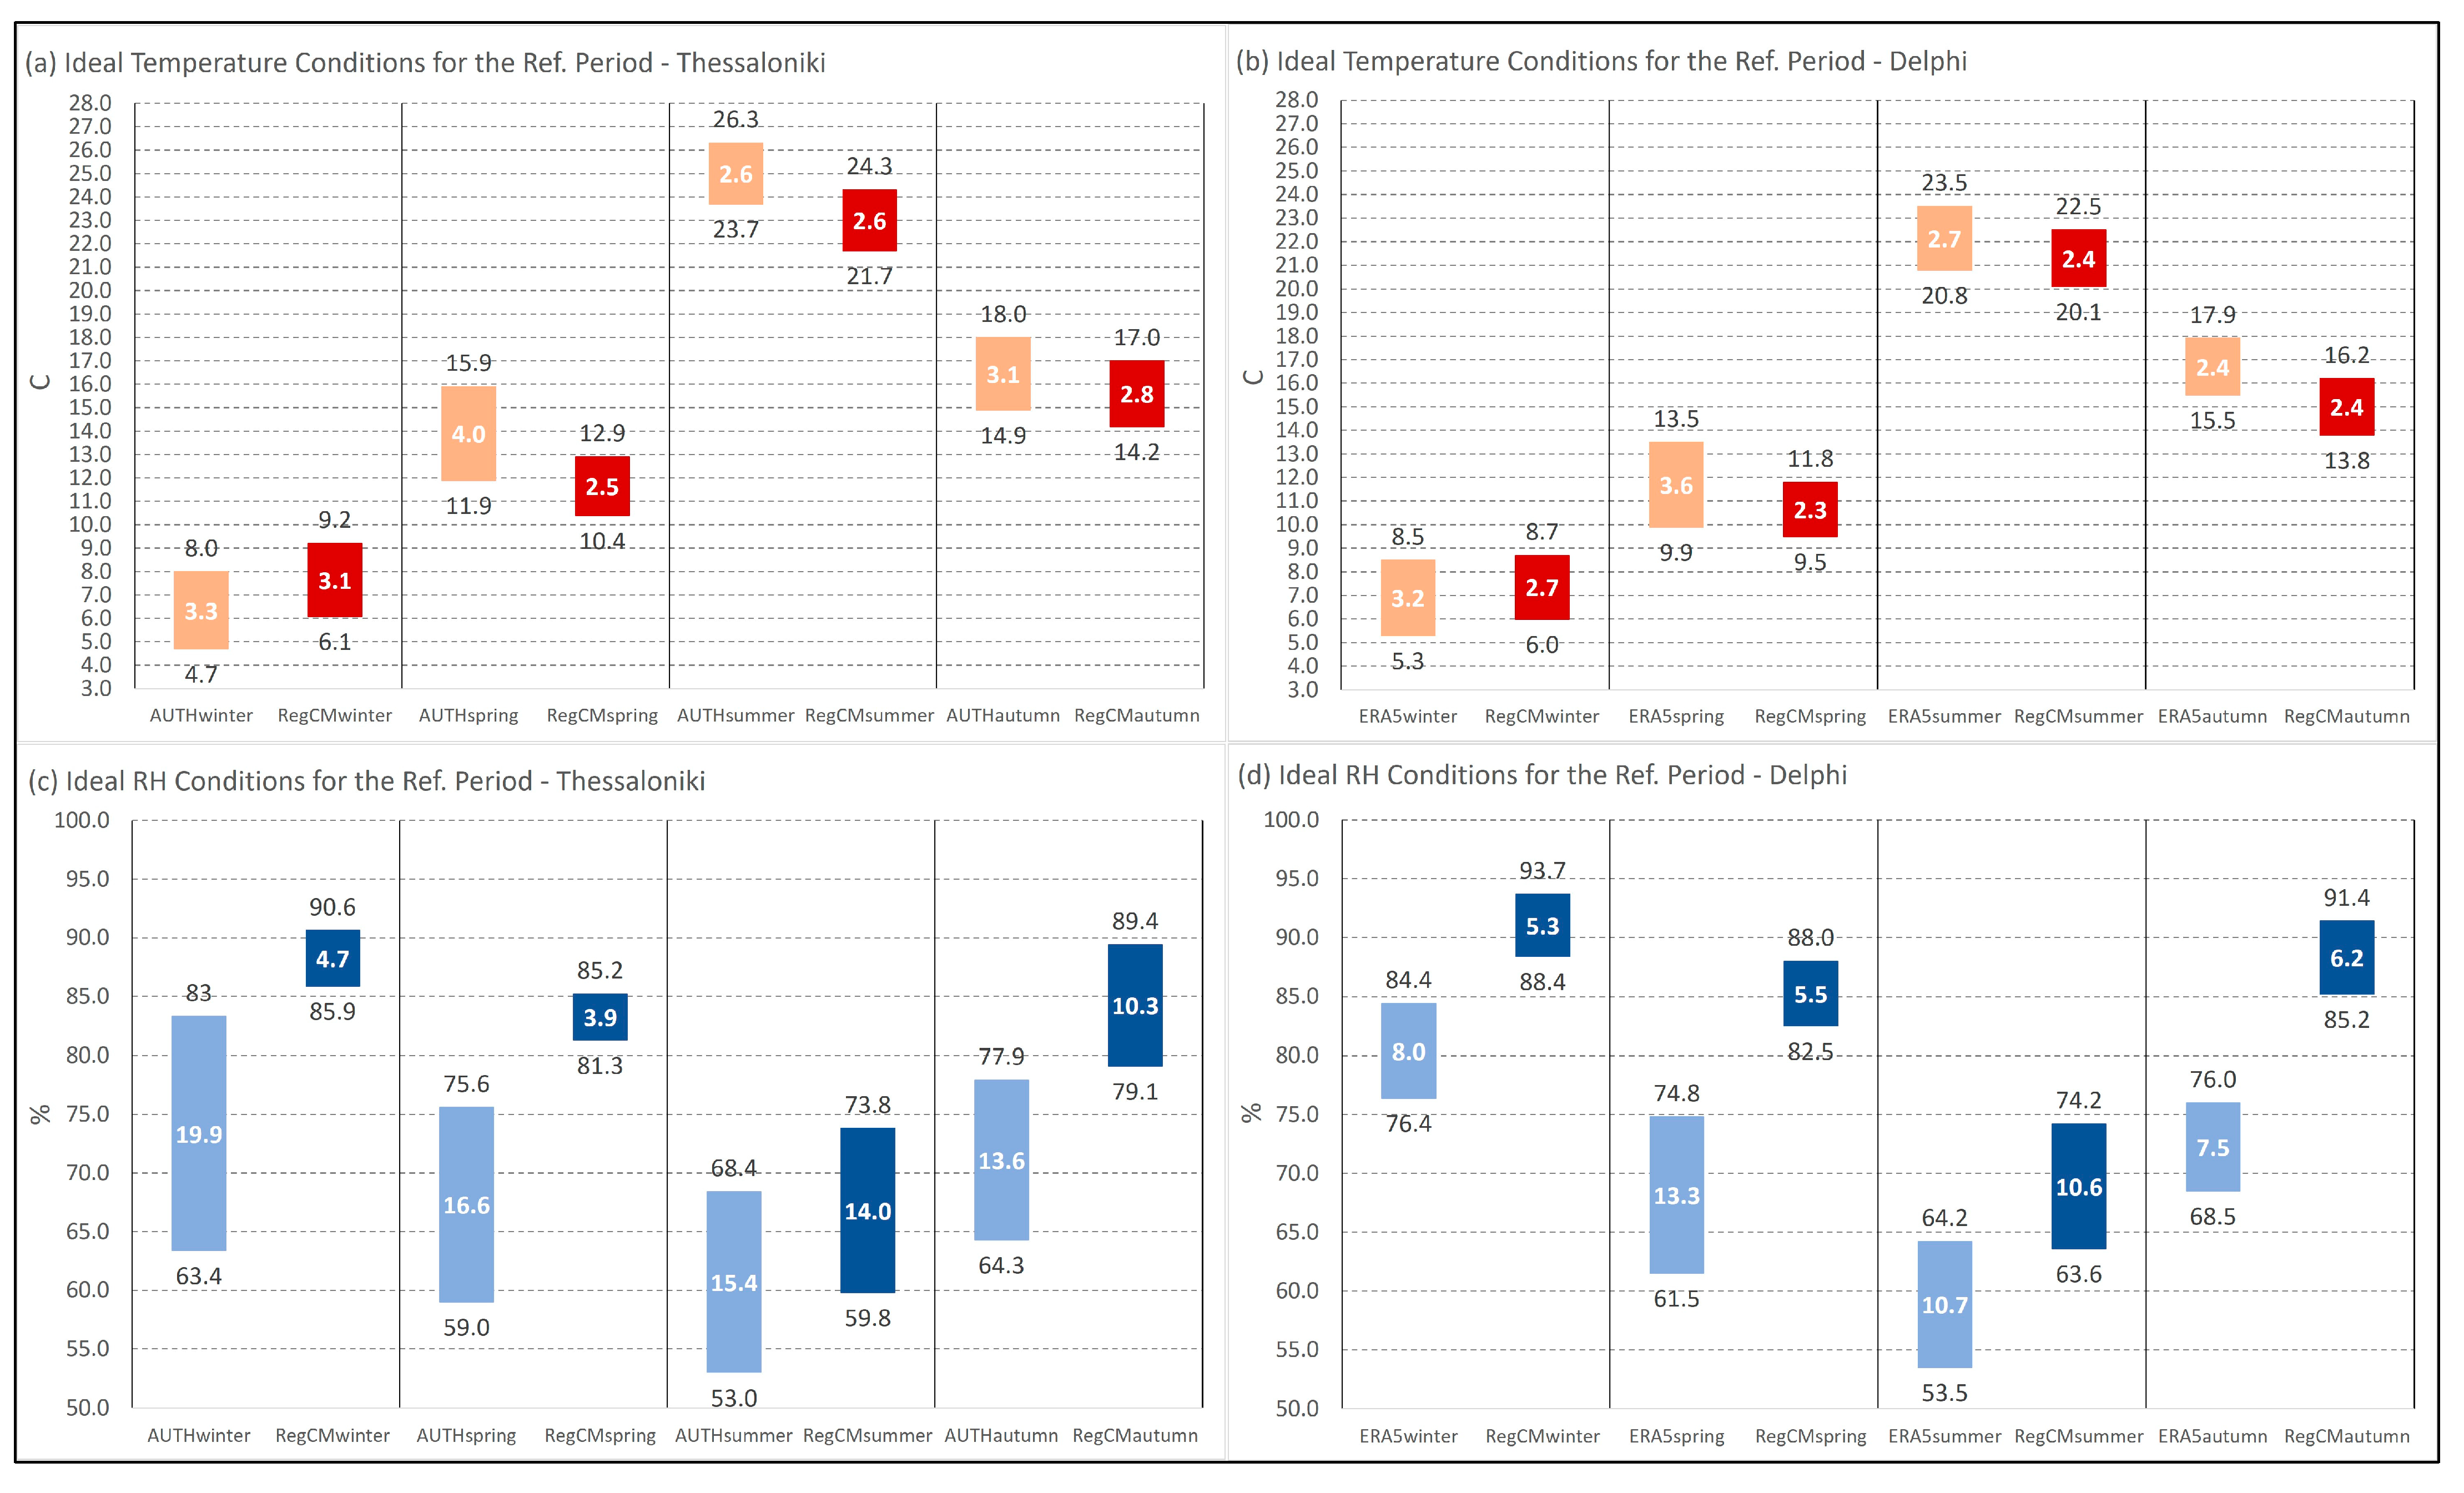
3.2.1. The Ideal Climate Conditions during the Reference Period—Correlation between Model-Observed Data and Model-Reanalysis Data

As mentioned in the previous section, the HMRout index consists of two individual indices, the HMRenv.out and the HMRfluc indices. According to Fabri and Bonora, [42] the HMRenv.out index is the predominant cause of risk between the HMRenv.out and the HMRfluc indices. For this reason, separate diagrams (Figure 2) were created presenting L_HMRenv.out and H_HMRenv.out. L_HMRenv.out and H_HMRenv.out represent the minimum and maximum values from the reference period (1980–2000) and they reflect the ideal climate conditions for the monuments. In order to evaluate if the examined model was skillful in reproducing these ideal conditions over the two case studies, L_HMRenv.out and H_HMRenv.out and the range between them were analyzed and compared for observational, reanalysis, and model data.
The results showed that in the case of temperature, the model overestimated both L_HMRenv.out and H_HMRenv.out for the winter period, simulating warmer ideal conditions than they actually were in both case studies. Conversely, it underestimated them for the periods of spring, summer, and autumn. Specifically, in Thessaloniki, the actual differences of L_HMRenv.out and H_HMRenv.out between model and observational data during spring, summer, and autumn were −1.5 °C, −2.0 °C and −0.7 °C and −3.0 °C, −2.0 °C, −1.0 °C, respectively. The previous simulation of a “warmer” winter (Table 3) resulted in a warm bias for ideal temperature conditions, simulating a higher L_HMRenv.out and H_HMRenv.out for both case studies with differences of 1.4 °C and 1.2 °C, respectively. Consequently, the model indicated a higher skill in reproducing L_HMRenv.out and H_HMRenv.out for autumn than for winter, spring, and summer. In Delphi, the biases of L_HMRenv.out for spring, summer, and autumn were −1.5 °C, −2.0 °C, and −0.7 °C. Respectively, the H_HMRenv.out biases were −3.0 °C, −2.0 °C, and −1.0 °C for the three aforementioned seasons. In the case of winter, the differences in ideal temperature conditions were 0.7 °C and 0.2 °C. The model presented a better skill in simulating L_HMRenv.out in spring and H_HMRenv.out in winter than in other seasons. Additionally, the biases of the range of ideal temperature conditions (L_HMRenv.out and H_HMRenv.out) during winter, spring, summer, and autumn were −0.2 °C, −1.5 °C, 0.0 °C, and −0.3 °C in Thessaloniki and −0.5 °C, −1.3 °C, −0.3 °C, and 0.0°C in Delphi. It was observed that the calculated range of L_HMRenv.out and H_HMRenv.out between the model and observational or reanalysis data was very similar (small differences). In spring, the model showed the lowest skill in reproducing the range of ideal climate temperature conditions for both regions. It should be noted that for spring the range between L_HMRenv.out and H_HMRenv.out was the largest compared to the other seasons and was not well simulated by the model.
Similarly, for RH (Figure 2c,d) the model in general overestimated (positive differences) both L_HMRenv.out and H_HMRenv.out, presenting larger RH values. It showed a lower skill in simulating the ideal RH conditions than the ideal temperature conditions. The largest differences of L_HMRenv.out and H_HMRenv.out between model and observational data were observed during the winter (22.5% L_HMRenv.out) and (7.3% H_HMRenv.out) and spring (22.3% and 9.6%). The smallest differences were observed during the summer (6.8% and 5.4%). In Delphi, the largest biases of L_HMRenv.out and H_HMRenv.out were observed in spring (21.0% and 13.2%) and autumn with differences of 16.7% and 15.4%, respectively. Smaller biases were found for the other two seasons. Additionally, it should be noted that the season with the highest ideal RH conditions was winter and the lowest was summer in both case studies. Thus, Thessaloniki and Delphi are characterized by mild, wet winters and hot, dry summers, which are conducive to fires. Regarding the biases of the range of ideal RH conditions (L_HMRenv.out and H_HMRenv.out), the smallest differences were found in summer and autumn. In detail, during winter, spring, summer, and autumn the calculated differences were −15.2%, −12.7%, −1.4%, and −3.3% in Thessaloniki and −2.7%, −7.8%, −0.1%, and −1.3%, respectively, in Delphi. In general, we should highlight that the model better simulated the range in the case of Delphi than in the case of Thessaloniki. However, the model showed a higher skill in reproducing the range of ideal RH conditions for summer for both regions.

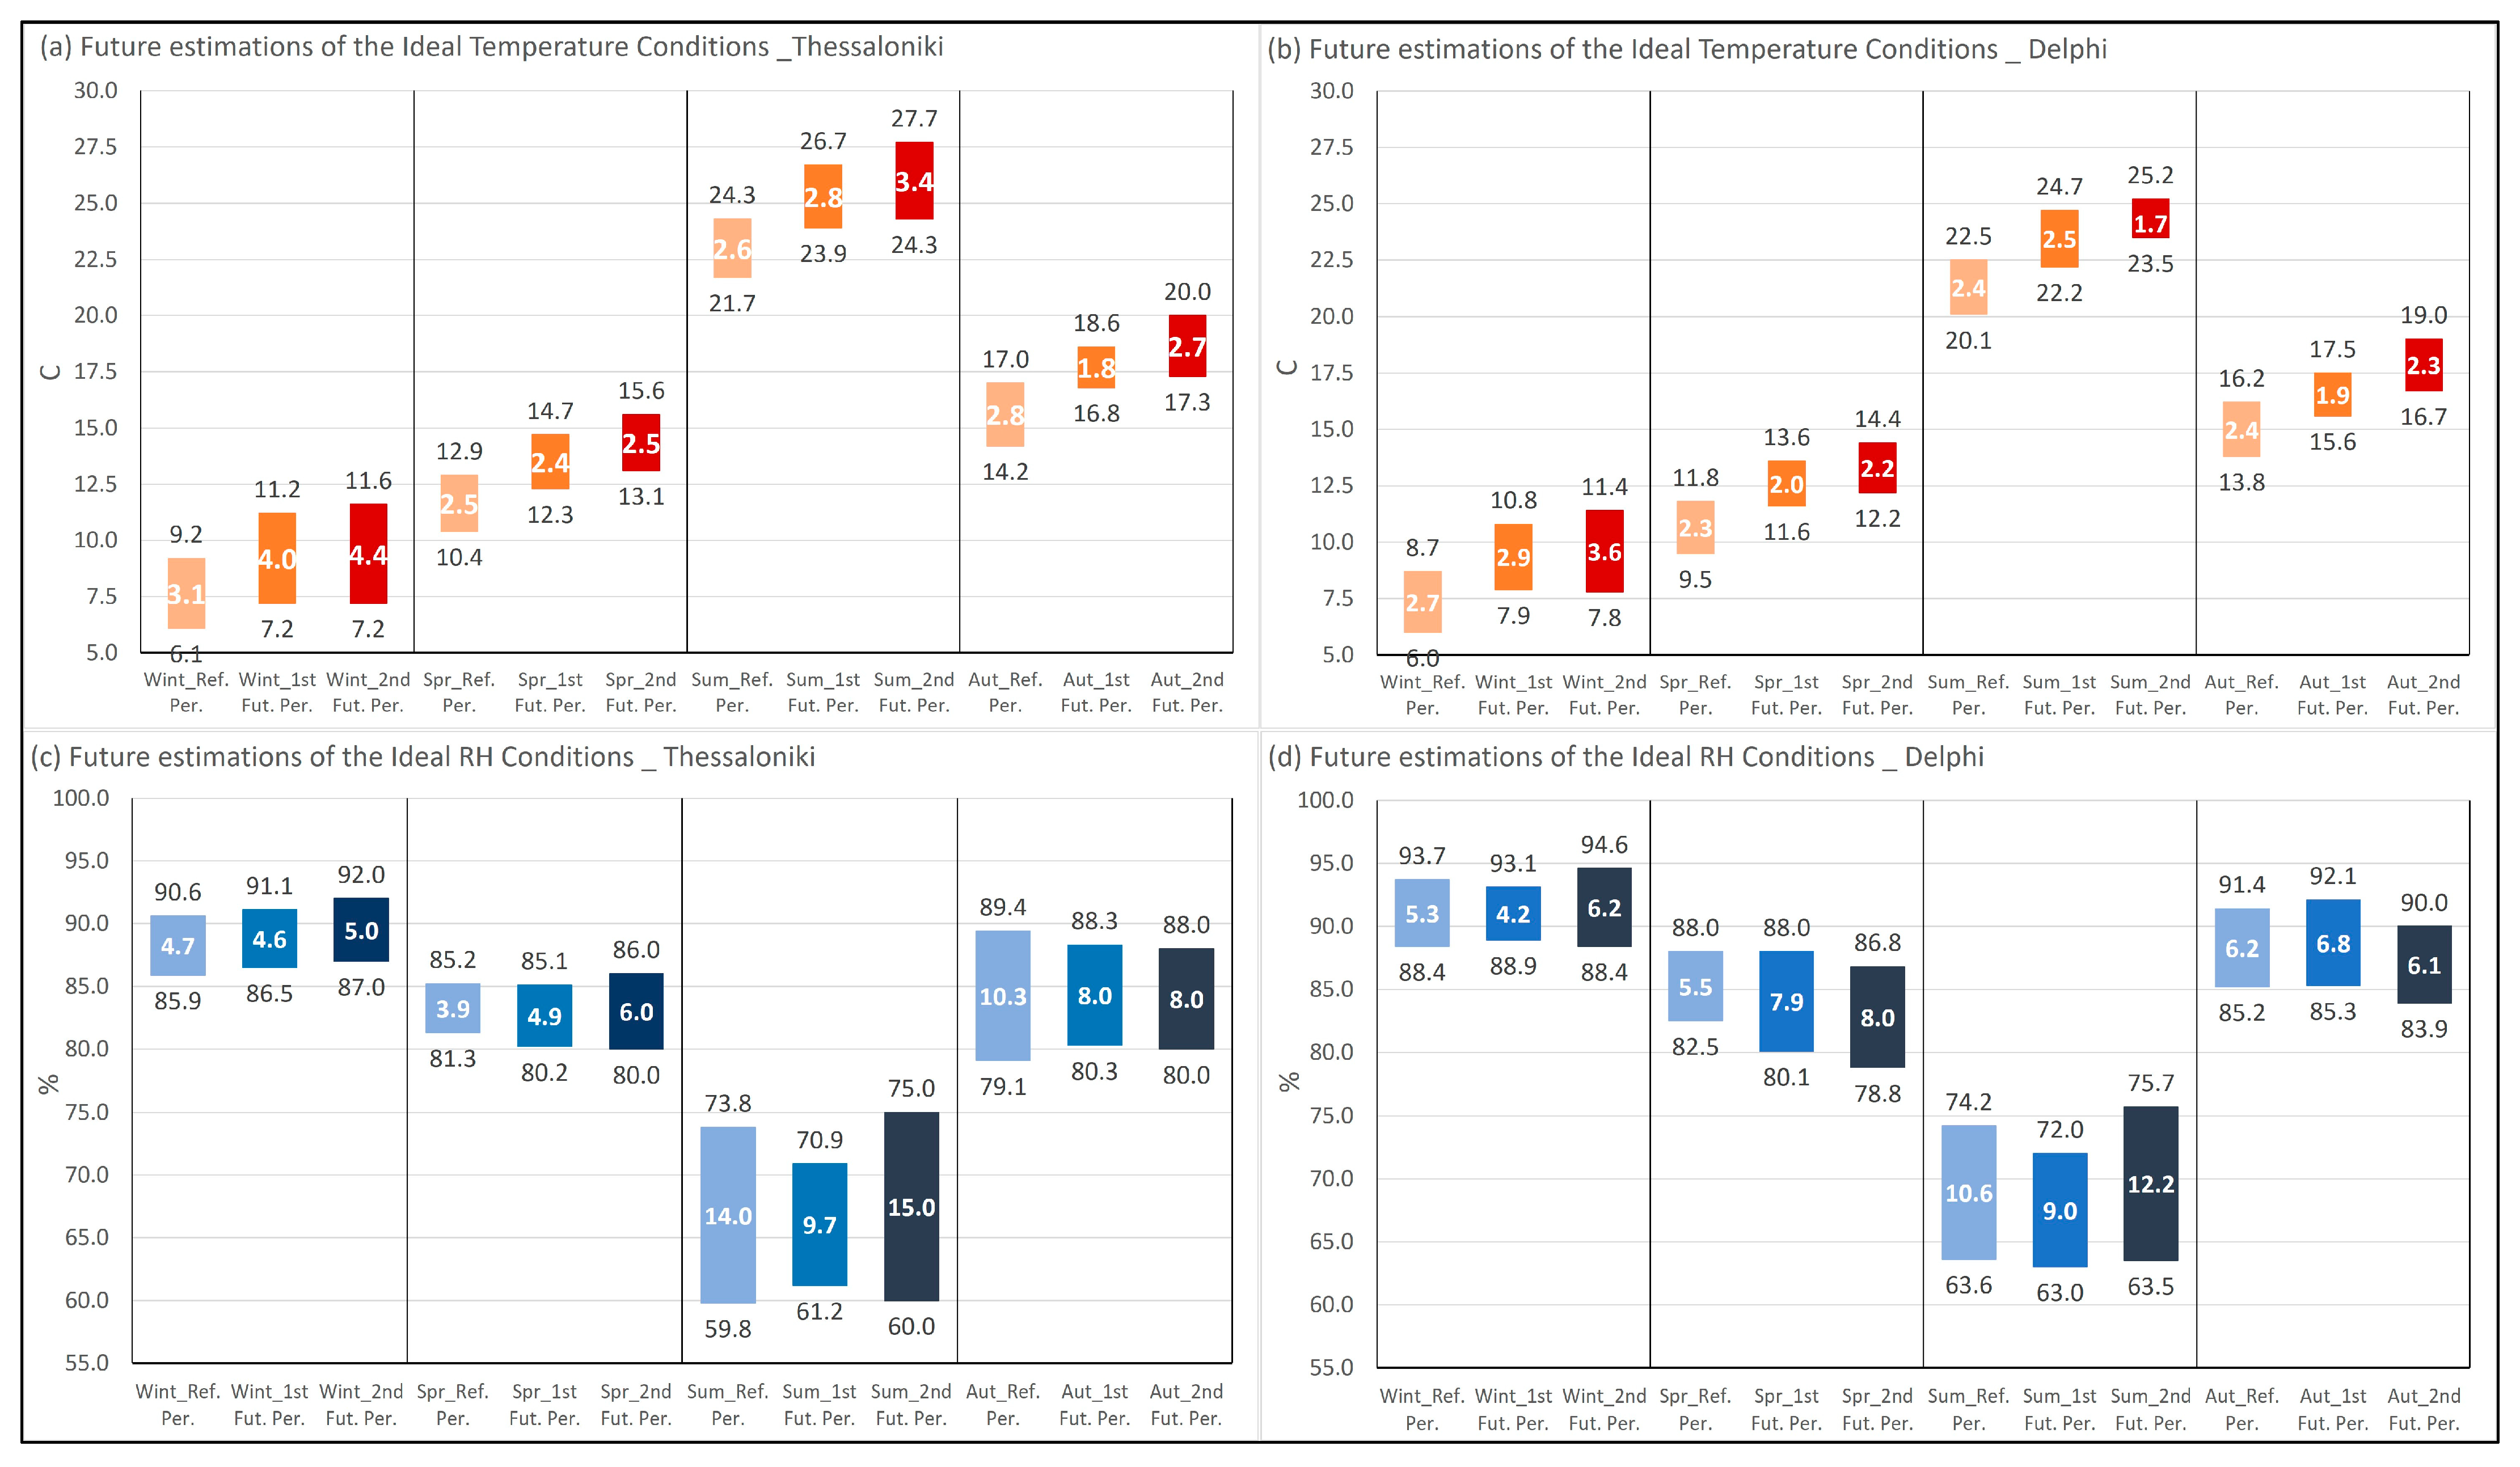
3.2.2. Future Estimations of Ideal Temperature and RH Conditions

As mentioned above, one of the main objectives of the present analysis was the study of the potential changes in the ideal climate conditions over the two domains of interest until the end of the 21st century. Thus, after the assessment of the present-day ideal thermo-hygrometric conditions, an equivalent attempt was made to determine the potential future changes in the ideal climate for the examined cultural heritage monuments, since any change in climatic parameters could dramatically increase the risk of damage [6]. The estimations of the model’s future projections were computed and analyzed and are illustrated in Figure 3 for both L_HMRenv.out and H_HMRenv.out and for two future periods (in comparison to the model’s reference period findings).
Regarding temperature, it was found that the ideal conditions are expected to change for all the seasons in the future. L_HMRenv.out and H_HMRenv.out will be higher compared to the reference period for both Thessaloniki and Delphi (Figure 3a,b). This means that the monuments will have to adapt to new, warmer climate conditions. The model future projections indicated that L_HMRenv.out is expected to increase by an average of 2.0 °C during the period 2039–2059 and by an average of 2.5 °C during the period 2079–2099 for both study regions. Additionally, H_HMRenv.out will be on average 2.0 °C and 2.6 °C higher for the two future periods for both case studies. In general, the potential simulated increase will be more intense in the 1st future period (compared to the reference one) than in the 2nd future period (in comparison to the 1st future one). This could be attributed to the fact that the emissions in RCP4.5, which was used for the model’s output, peaked around 2040 and then declined.
More specifically, in winter the model showed that L_HMRenv.out and H_HMRenv.out will be 1.1 °C and 2.0 °C higher during the 1st future period compared to the reference period in Thessaloniki (Figure 3a). During the 2nd future period H_HMRenv.out will increase by 2.4 °C. It should be noted that no change was observed for L_HMRenv.out between the 1st and 2nd future periods. An increase in L_HMRenv.out and H_HMRenv.out was also observed in spring, summer, and autumn. In general, the model underestimated the ideal temperature conditions of observational and reanalysis data (Figure 2a), but it predicted a significant increase compared to the model’s reference period. During summer, an increase of 2.2 °C and 2.4 °C is expected to occur for L_HMRenv.out and H_HMRenv.out (1st future period) and an increase of 2.6 °C and 3.4 °C (2nd future period), respectively. Regarding the range of the ideal temperature conditions, the model estimated an average increase of 1 °C by the end of the 2nd future period for winter and summer in Thessaloniki. In Delphi, the model projected that both indices will increase by 1.9 °C and 2.1 °C during the 1st future period and 1.8 °C and 2.7 °C during the 2nd future period in winter (Figure 3b). It was observed that during the last 20 years of the 21st century, L_HMRenv.out will not change significantly compared to the period 2039–2059. However, H_HMRenv.out continued to increase, resulting to a larger range between ideal temperature conditions. For summer the results showed that L_HMRenv.out and H_HMRenv.out are expected to increase by 2.1 °C and 2.2 °C during the 1st future period and by 3.4 °C and 2.7 °C during the 2nd future period. Contrary to the other seasons, a decrease (of −0.7 °C) in the range of ideal summer temperature conditions was found during the period 2079–2099.
On the other hand, the future estimations of the ideal RH conditions did not present any significant change overall. It was observed that L_HMRenv.out and H_HMRenv.out are expected to increase or decrease depending on the season and region. Similar to the reference period, the highest future L_HMRenv.out and H_HMRenv.out values were found in winter, while summer was the season with the lowest L_HMRenv.out and H_HMRenv.out values. Regarding the future RH range, the largest one was found during the summer months for both domains of interest. In winter the model showed that L_HMRenv.out and H_HMRenv.out will be 0.6% and 0.5% higher during the 1st future period and 1.1% and 1.4% higher during the 2nd future period in Thessaloniki (Figure 3c). The model simulated an increase of 1.4% and a decrease of 2.9% in the ideal RH conditions for the summer (period 2039–2059). This resulted in a decrease in the range by 4.3% compared to the reference period. During the 2nd future period L_HMRenv.out and H_HMRenv.out will be 0.2% and 1.2% higher in comparison to the 1st future period. A similar change in future ideal summer RH conditions was also observed in Delphi. L_HMRenv.out and H_HMRenv.out will be lower during the period of 2039–2059 (−0.6% and −2.2%). On the other hand, L_HMRenv.out will be −0.1% lower and H_HMRenv.out 1.5% higher compared to the equivalent present time values. In conclusion, the ideal temperature conditions are expected to change in the future, posing new adaptation challenges to the monuments. On the other hand, no particular change was observed for the future ideal RH conditions.

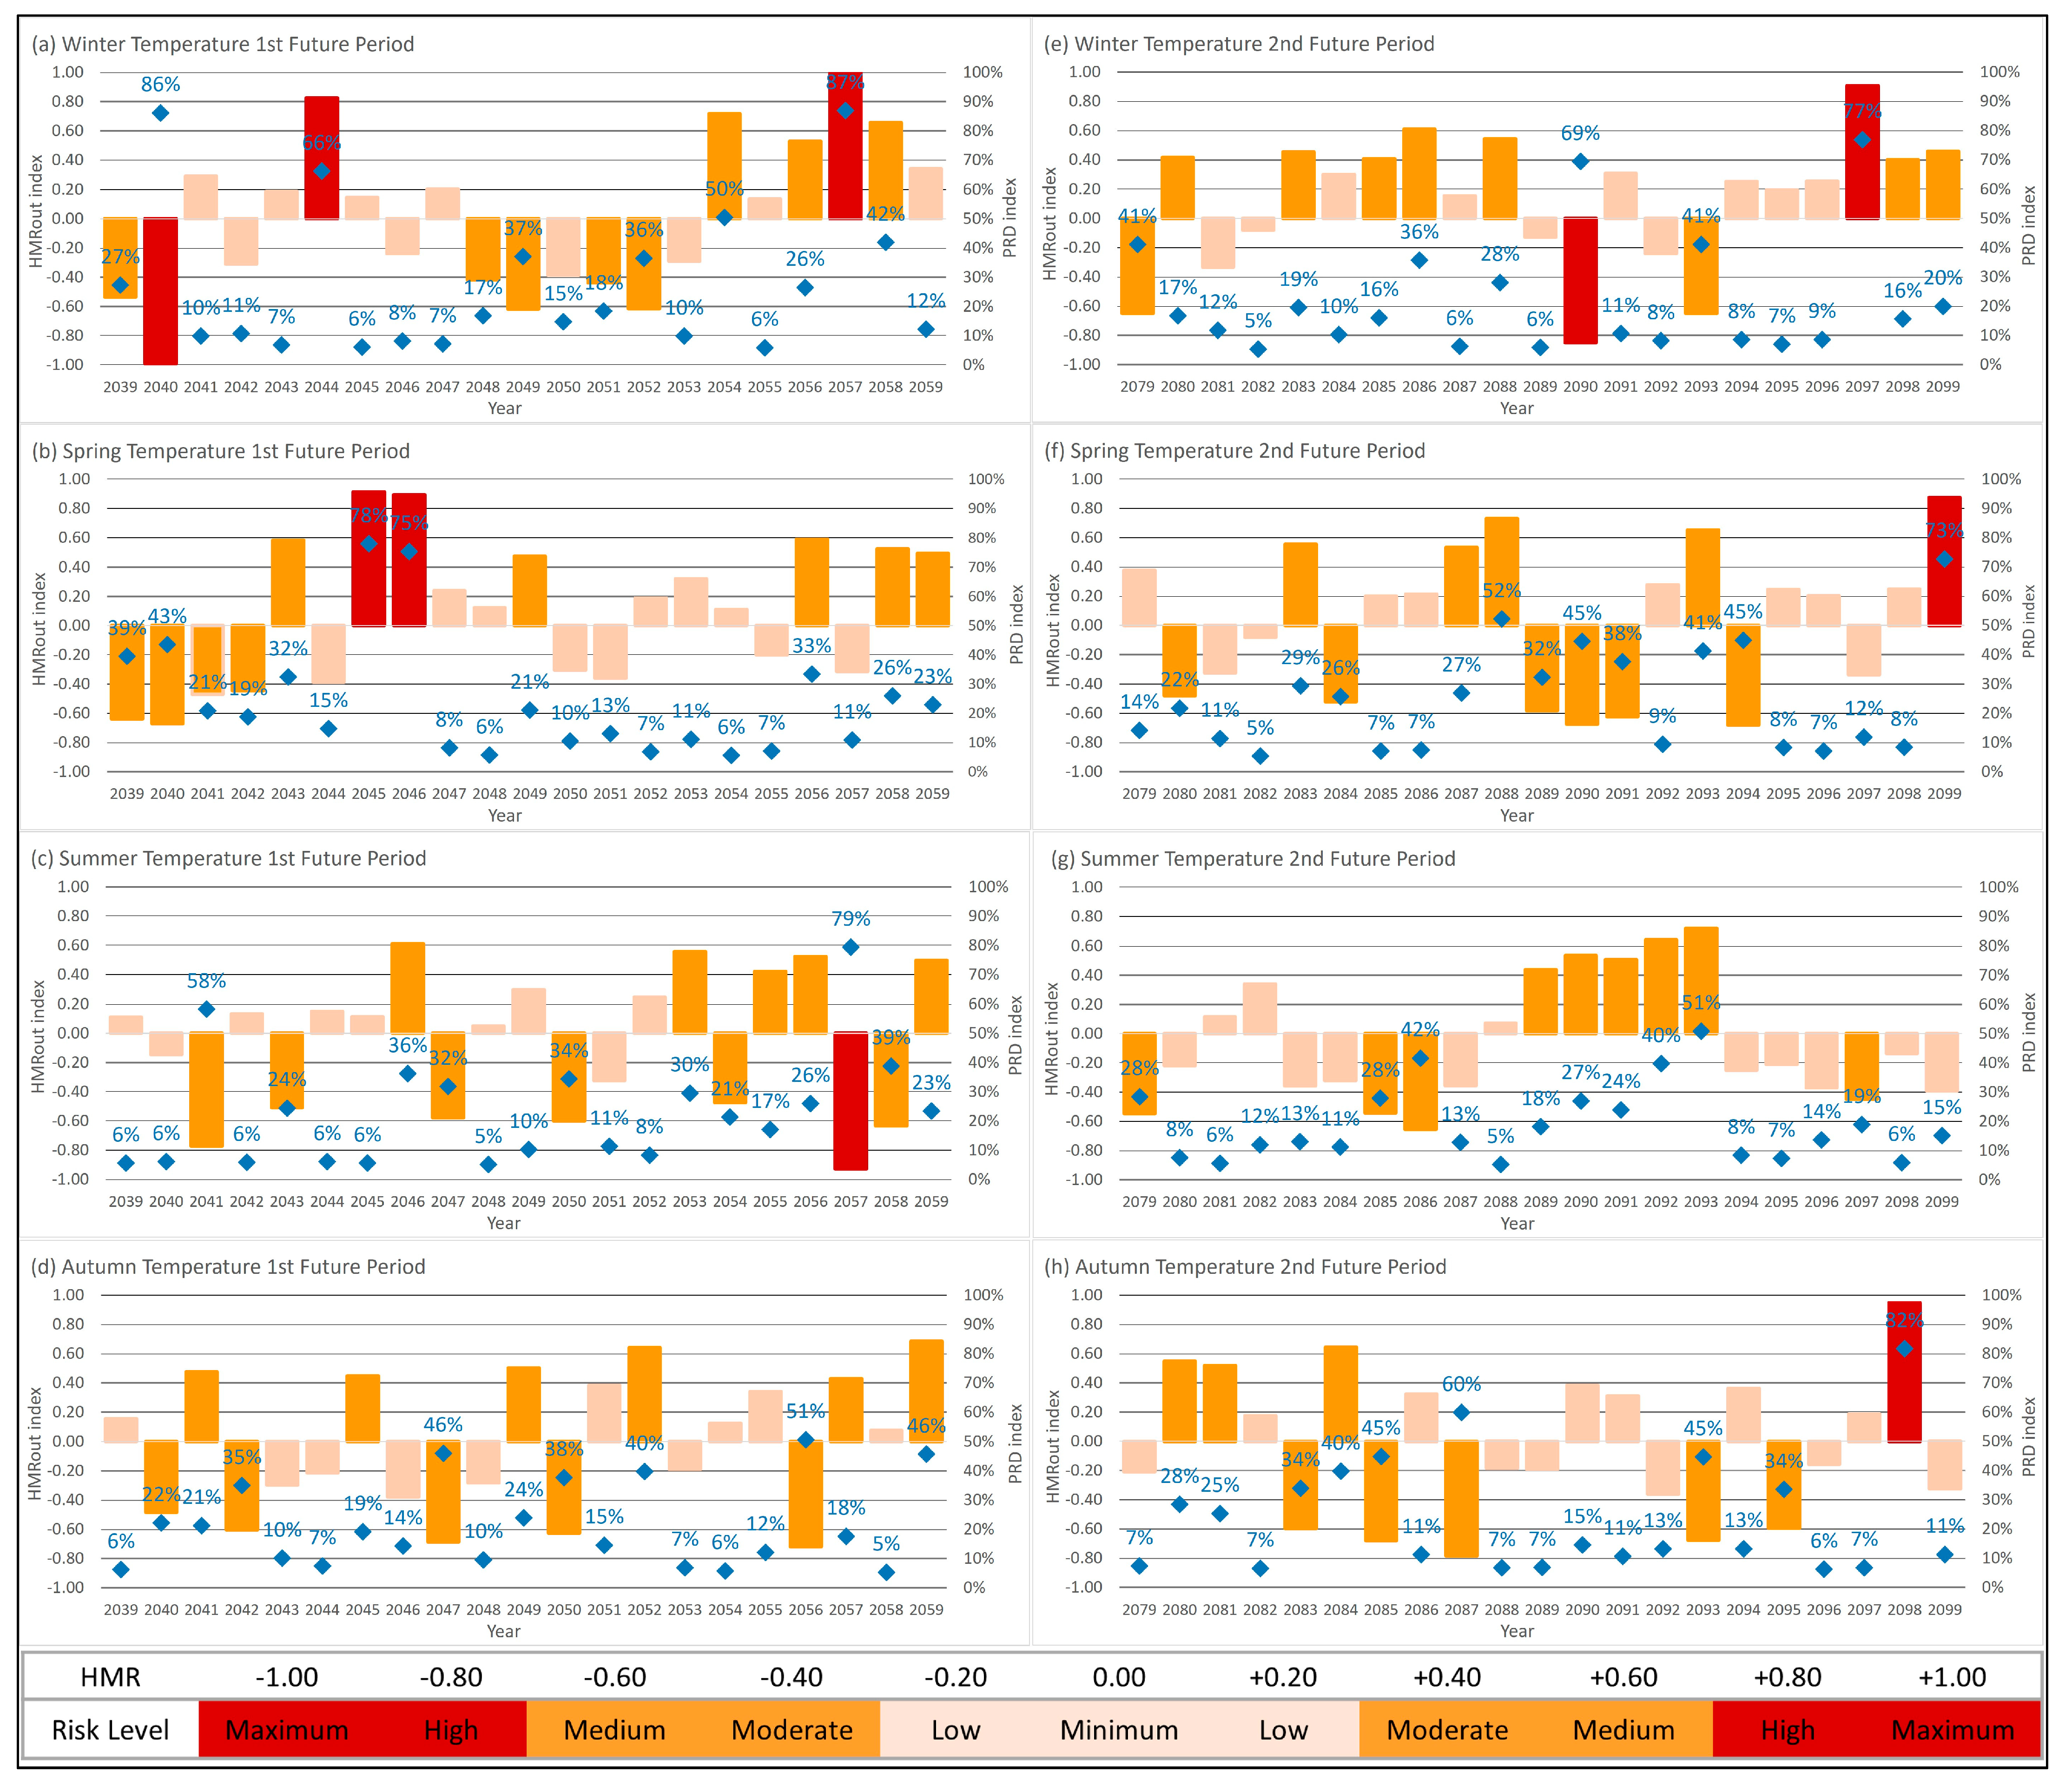
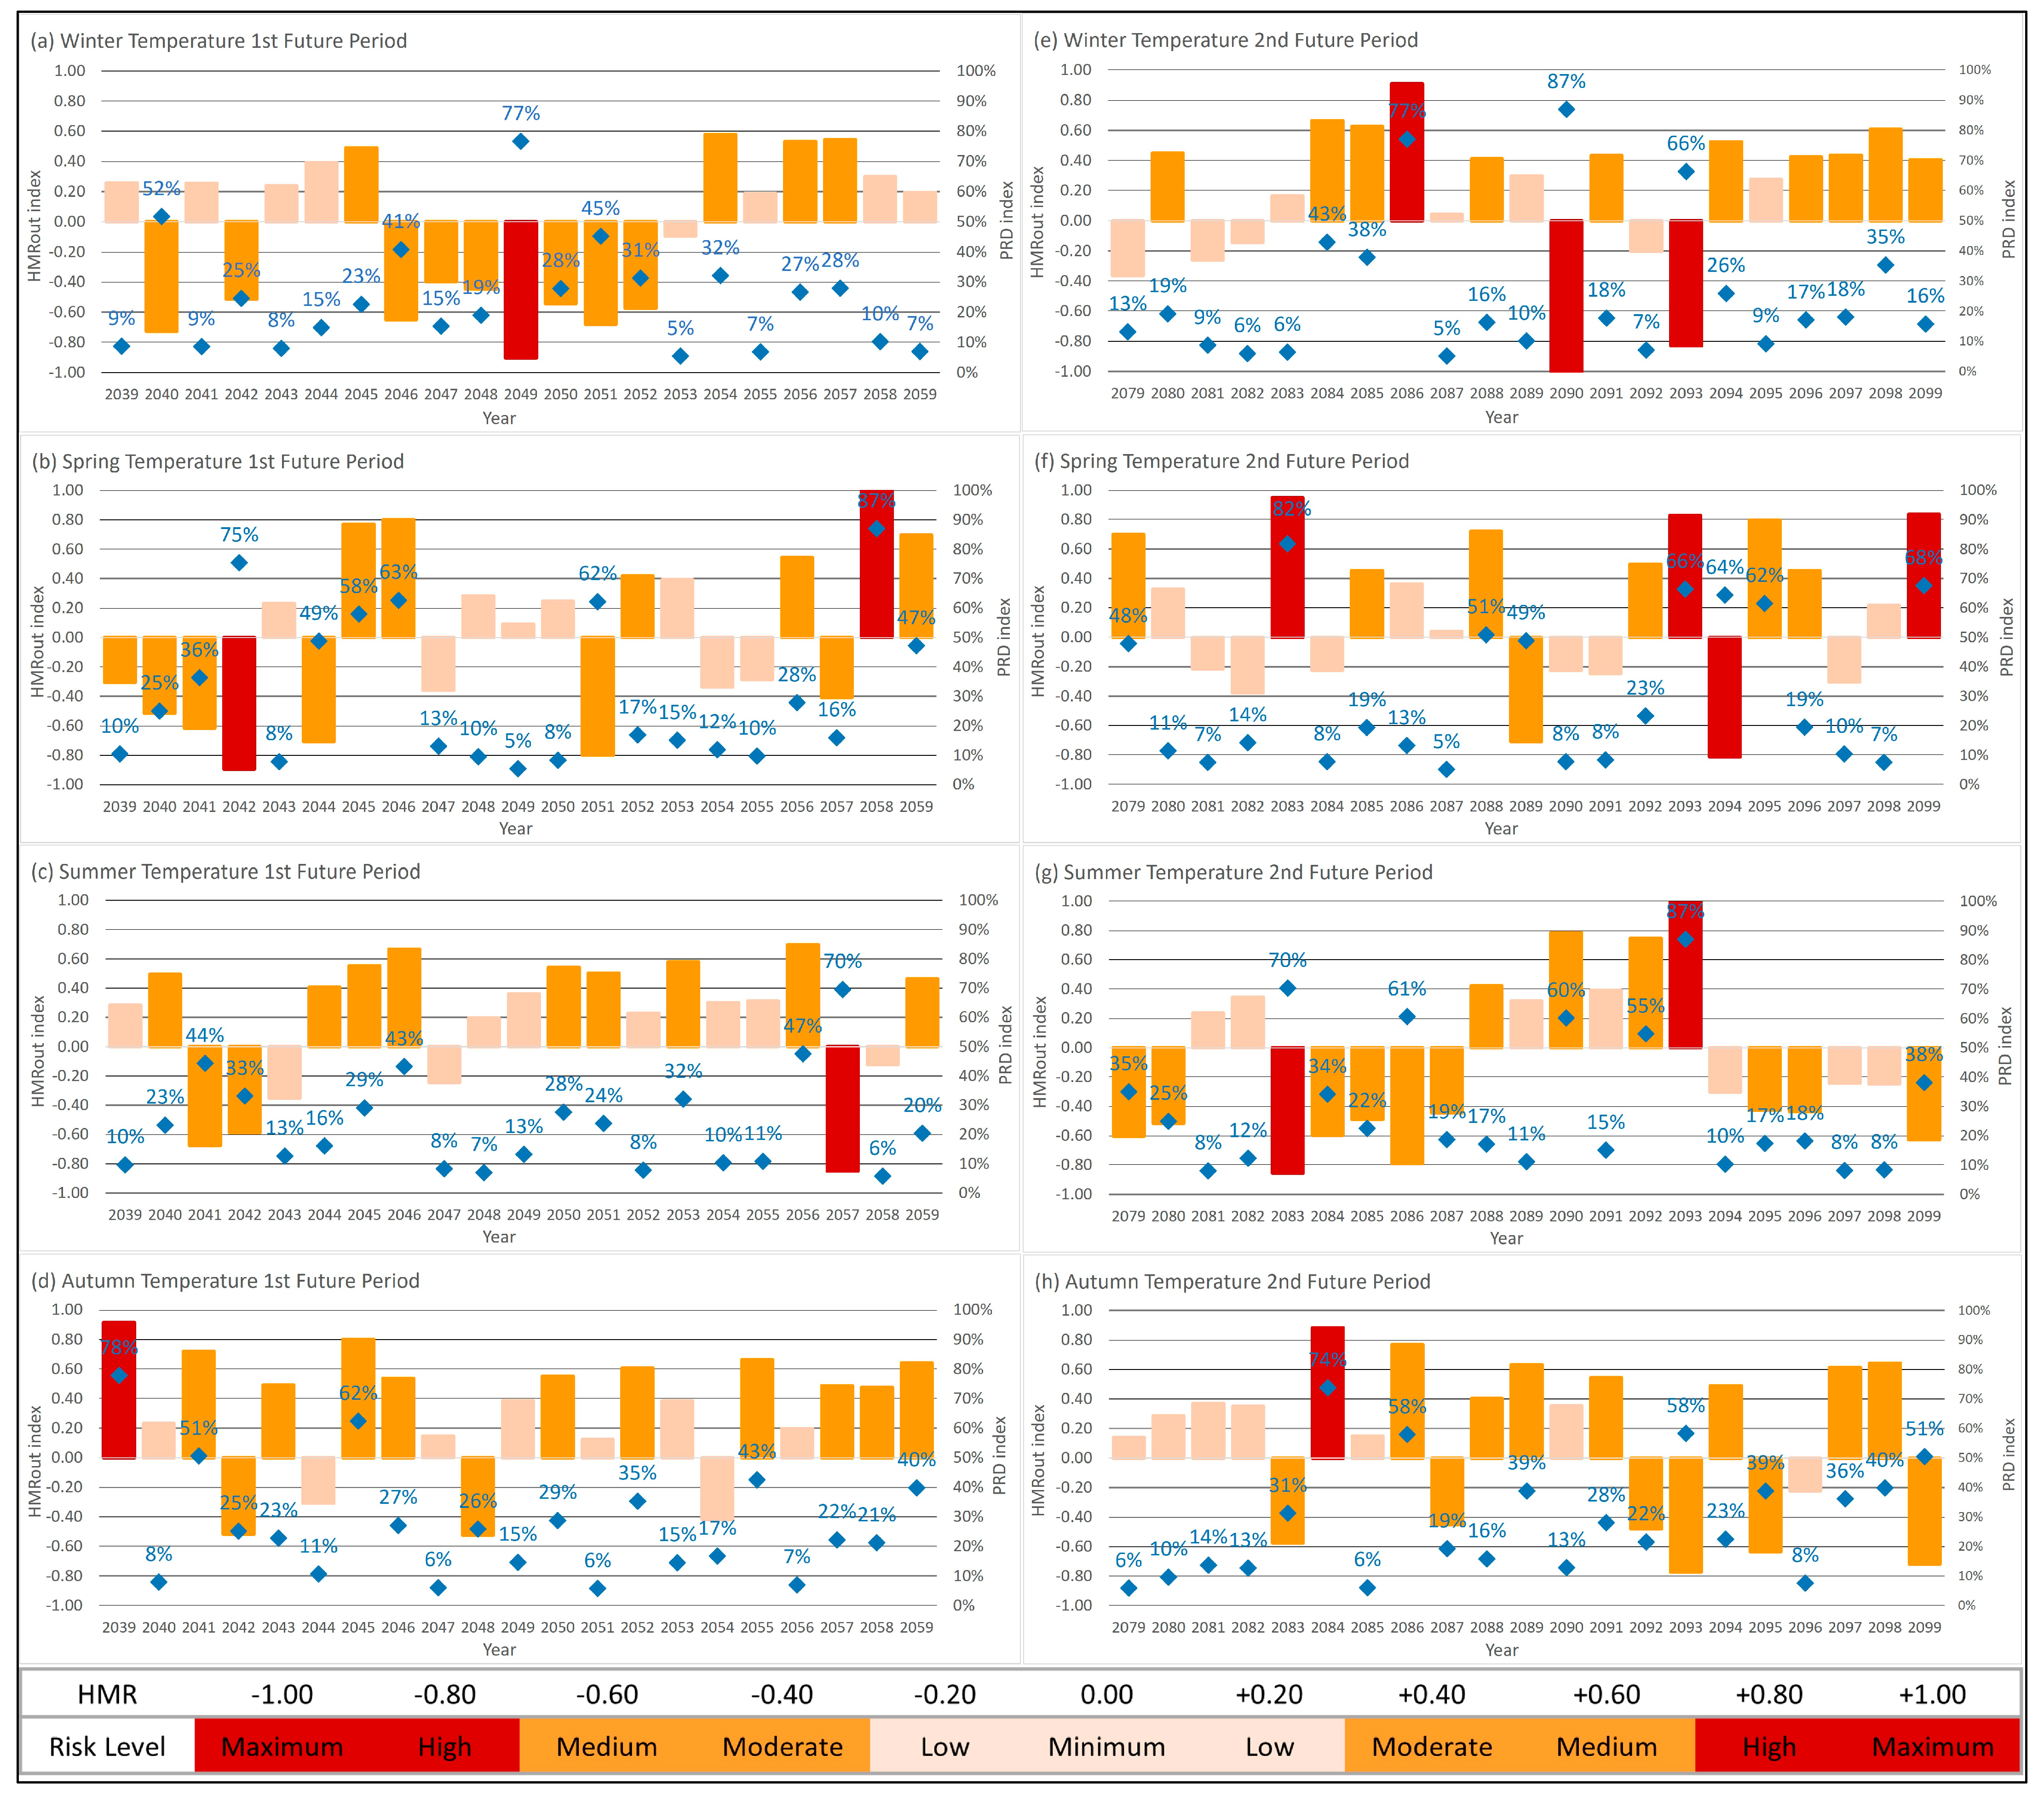
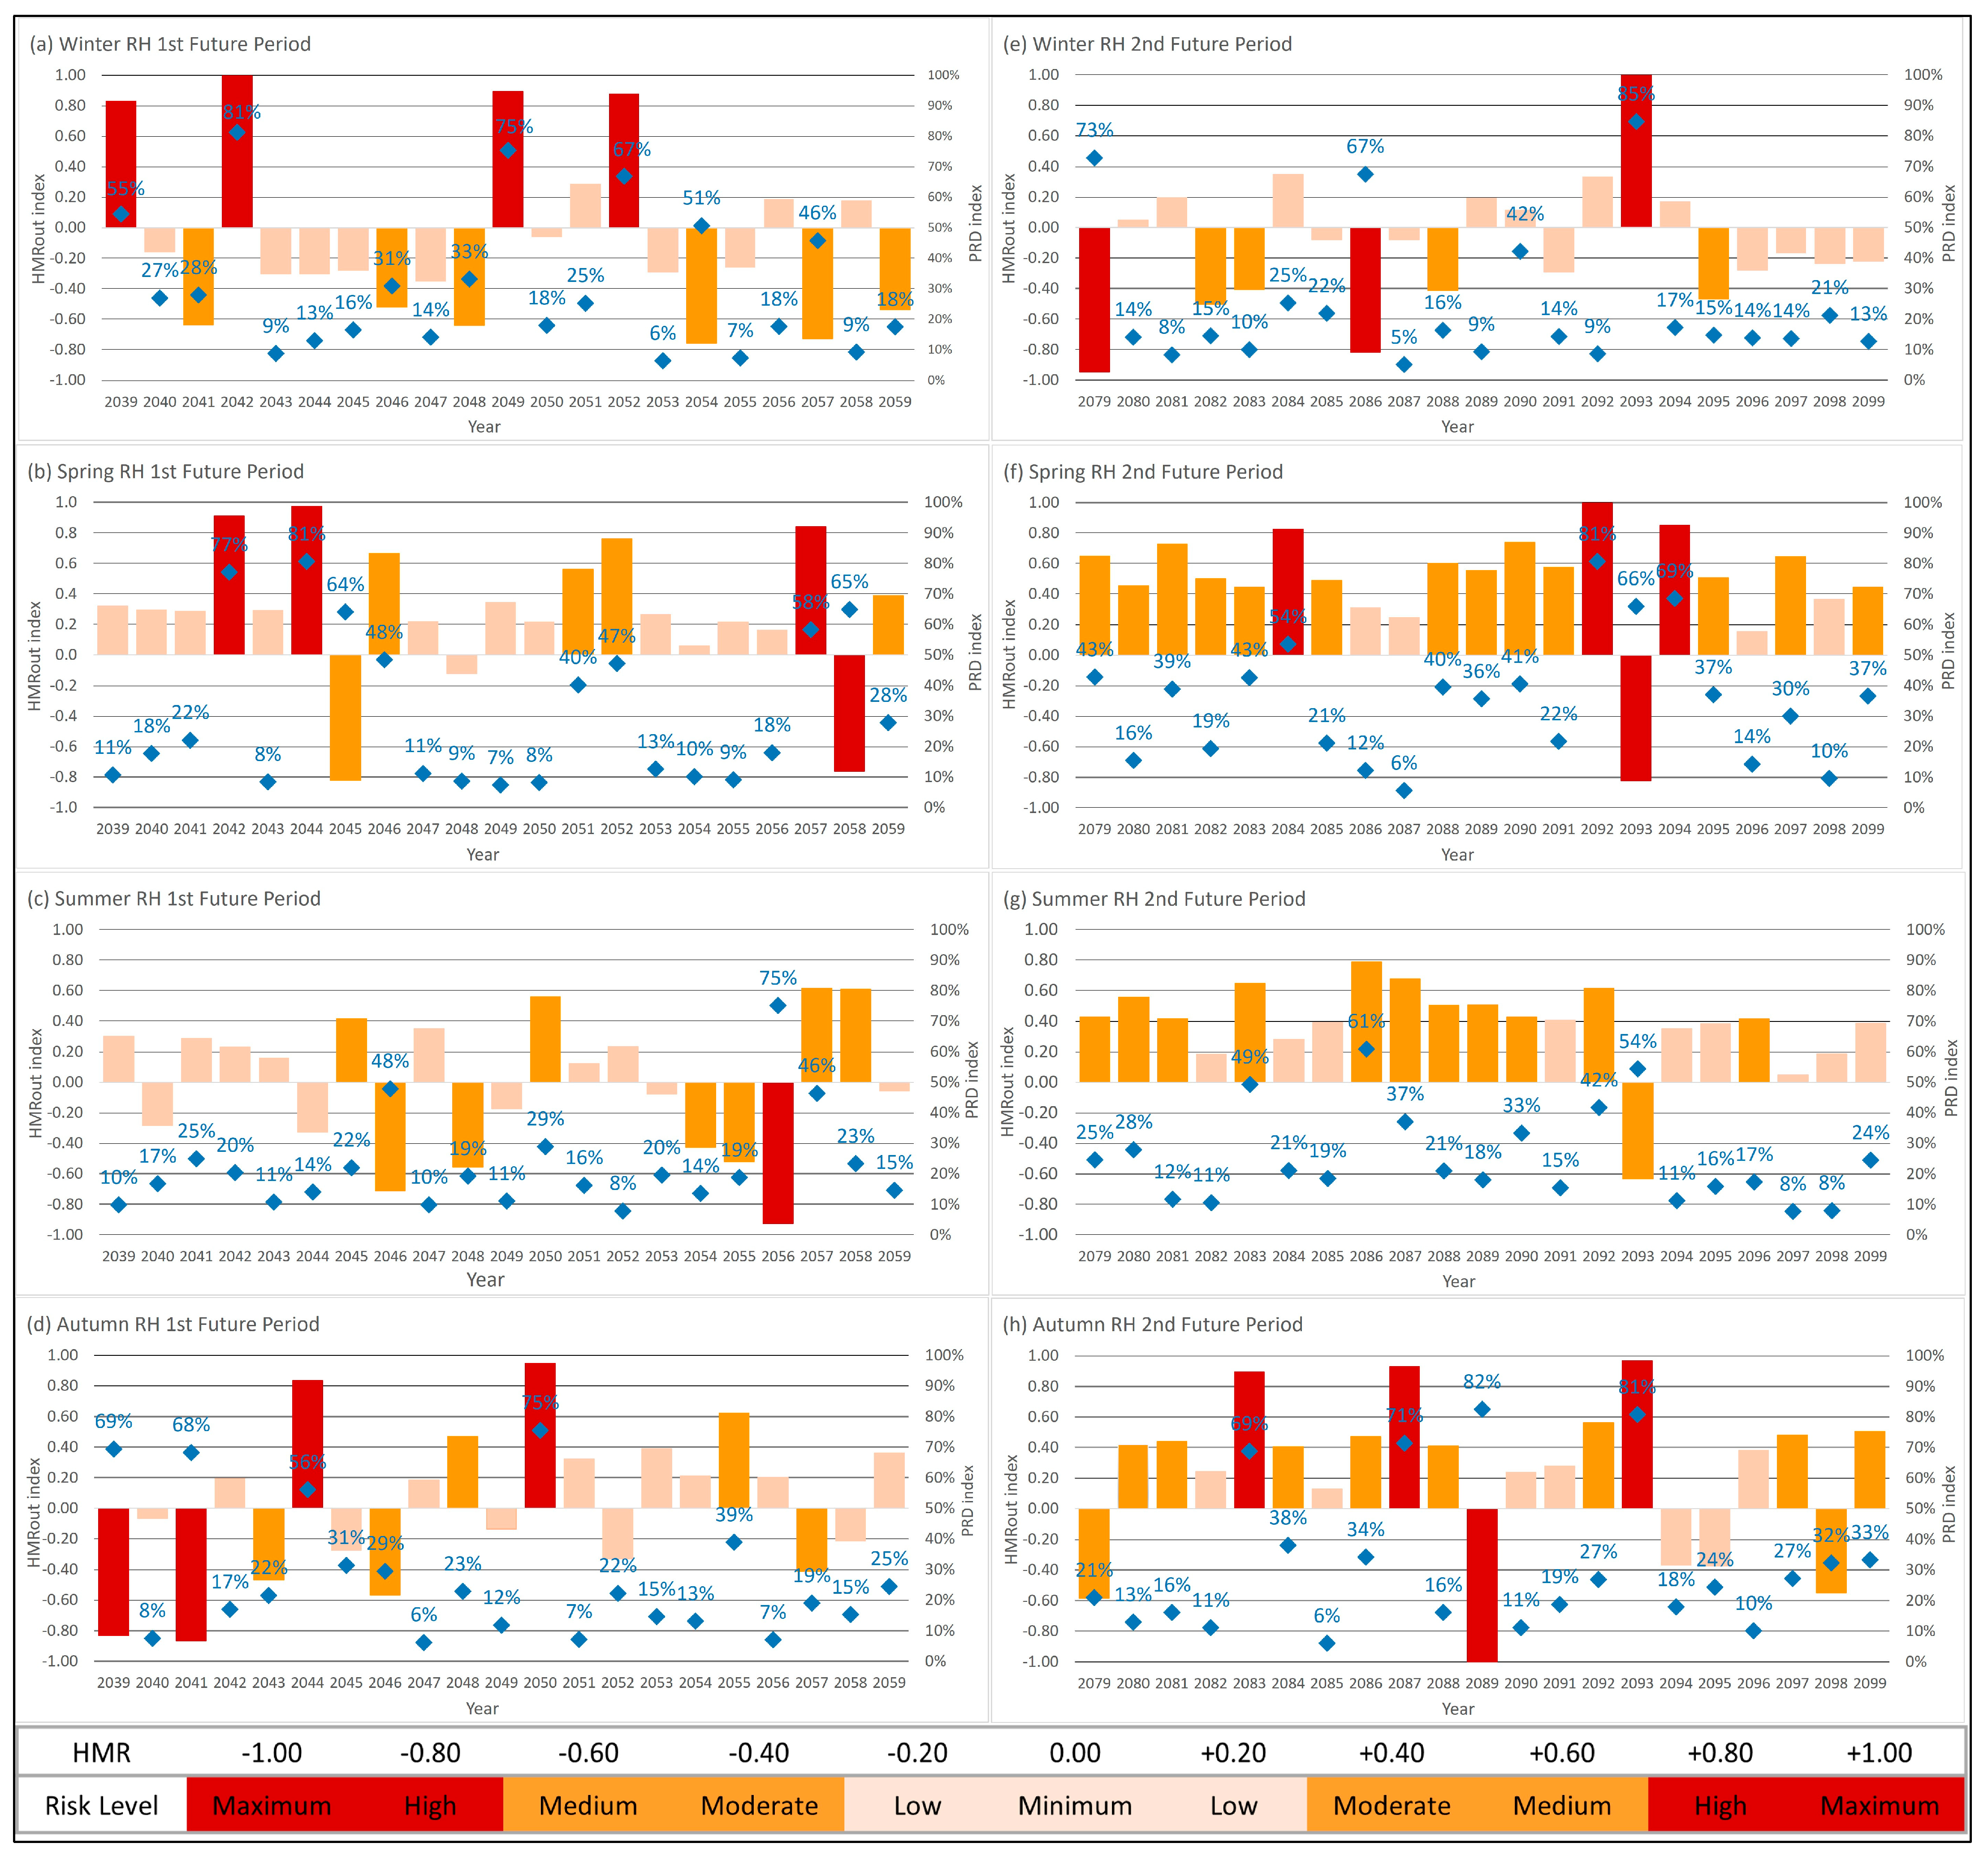
3.3. Seasonal Analysis of HMRout and PRD Index for the Two Future Periods 2039–2059 and 2079–2099

From the aforementioned findings, it was evident that the future ideal temperature conditions will increase, posing new adaptation challenges to the structural monuments under a much warmer climate. In this section, the future risk of the microclimate (HMRout) index and the Predicted Risk of Damage (PRD) index to heritage were computed and analyzed on a seasonal scale. Figure 4 and Figure 5 depict the seasonal analysis of the HMRout index and PRD index for temperature for both future periods and case studies. The classification of the HMRout index regarding the risk level was primarily introduced by Fabbri and Bonora [42] and considers not only extreme risk conditions (minimum and maximum) but also intermediate risk conditions (low, moderate, medium, and high). The PRD index was applied to inorganic materials in the present study because of the fact that most of the monuments in the Greek area are made of stone (usually limestone) and marble [57,58]. The results showed that the Predicted Risk of Damage (PRD) for inorganic materials was directly dependent on the HMRout index, meaning that when the HMRout index reaches its maximum value, the risk of damage reaches 100%. The number of years (in %) where the HMRout index took a value >0.4 or >−0.4 were also estimated by calculating the difference as (Reference period—1st future period (2nd future period)) (not shown).
Regarding temperature, the HMRout index is expected to be often (11.6%) >0.4 or <−0.4 (orange and red color) in the future, defining a moderate to maximum risk for the heritage [42] in both case studies. These findings revealed that in addition to an increase in future ideal temperature conditions, an increase in “moderate-maximum” risk years is also expected. In Thessaloniki, the HMRout index will take a value between “moderate-maximum” risk more often during winter, spring, summer, and autumn, with values of 14.3%, 21.4%, 9.5%, and 4.8% (for both future periods). The most intense increase in the “moderate-maximum” years was observed in spring when the HMRout index will be higher (lower) to 0.4 (−0.4), 19% more often during the 1st future period and 23.8% during the 2nd one. On the other hand, the least intense increase in the “moderate-maximum” years was observed in autumn (9.5%—1st future period, 0.0%—2nd future period). In addition, the number of years (%) where the HMRout index took a value between “moderate-medium” risk ((>0.4 and ≤0.8) or (<−0.4 and ≥−0.8)) and the number of years with “high-maximum” risk ((>0.8 and ≤1.00) or (<−0.8 and ≥−1.00)) were estimated separately. During the spring (the season with the higher rise of the “moderate-maximum” risk years), the results showed that the number of years with “moderate-medium” risk will increase (23.8%—1st future period and 28.6%—2nd future period) while the number of years with “high-maximum” risk will decrease (4.8%—1st future period and 9.5%—2nd future period). This means that the risk will not reach “high-maximum” values for spring in the future. Nevertheless, the highest increase in the “high-maximum” years was observed in winter during the 1st future period (14.3%—1st future period and 4.8%—2nd future period). It was observed that the rise of “high-maximum” years was smaller in the 2nd future period. This is probably explained by the fact that the emissions in RCP4.5, which was used for the model’s output, peaked around 2040, and then they declined. In general, the future estimations showed that the number of years characterized by “moderate-maximum” risk were expected to increase because of the increase in the “moderate-medium” years and not because of the “high-maximum” years (except the winter) in Thessaloniki.
Accordingly, for Delphi, the future estimations indicated that the HMRout index will take a value >0.4 or <−0.4, 9.5% more often during the 1st future period and 10.7% more often during the 2nd one. More specifically, the number of years characterized by “moderate-maximum” risk will increase by 28.6%, 11.9%, and 4.8%, respectively, during winter, spring, and summer and will decrease by 4.8% during autumn, for both future periods. Winter results (the season with the higher increase in the “moderate-maximum” years) also revealed that the number of years with both “moderate-medium” and “high-maximum” risk will increase by 23.8% and 4.8%, respectively, during the 1st future period. An increase of 14.3% is expected for the 2nd future period for both “moderate-medium” and “high-maximum” risk years as well. Spring future estimations showed that the “moderate-medium” and “high-maximum” risk years will increase by 9.5% and 4.8%, respectively, during the 1st future period. During the 2nd future period, the HMRout index will take a value between “moderate-maximum” risk 4.8% less often, while it is expected to take a value between “high-maximum” risk 14.3% more often than the reference period. In general, it was observed that the number of years with “moderate-medium” risk will be greater than the “high-maximum” risk years during the 1st future period, while the “high-maximum” risk years will prevail in the 2nd future period, indicating more extreme climatic conditions. In contrast, no significant change in the frequency of occurrence of the “moderate-maximum” years was found for summer and autumn.
Regarding the relative humidity (Figure A1 and Figure A2), the results were differentiated. In general, the HMRout index will have 6.0% less “moderate-maximum” risk in the future for both regions. In Thessaloniki, the number of years with “moderate-maximum” risk will decrease in general for both future periods, in spring (21.4%), summer (9.5%), and autumn (9.5%). Conversely, future winters will be characterized by an increase of 9.5% in the “moderate-maximum” risk years. More specifically, the years with “moderate-medium” risk and the years with “high-maximum” risk are expected to increase by 4.8% for both two future periods. However, during the summer the years of “moderate-medium” risk will decrease, while the years of “high-maximum” risk will increase by 9.5% in the 2nd future period. This means that while the number of years at risk will decrease, there will be an increase in the number of years with extreme values (“high-maximum” risk).
In Delphi, the results indicated that in the future, the number of years characterized by “moderate-maximum” risk will increase during the spring (7.1%) and summer (4.8%) and will decrease during the winter (26.2%) and autumn (2.4%) for both future periods. During the 1st future period, the HMRout range is expected to be lower, while during the 2nd future period, the “moderate-maximum” risk years will have a higher frequency of occurrence, reaching 28.5% for spring. Furthermore, it is interesting that in some seasons the “moderate-medium” risk years will decrease, while the “high-maximum” risk years will increase. In detail, the HMRout index will take a value >0.8 (<−0.8) more often during winter (7.1%), spring (4.8%), and autumn (19.0%) for both future periods. A decrease in “high-maximum” risk years is expected for the summer.

4. Discussion

Without a doubt, significant concern regarding the impact of climate change on cultural heritage [17,59] has increased during the past decade. Thus, numerous researchers have approached the subject multi-perceptively. According to the most recent IPCC report [21], especially in Europe, the temperature will increase at a rate exceeding global mean temperature changes. Therefore, an adaptation of cultural heritage to climate change is necessary to mitigate the effects of climate change [60]. Kapsomenakis et al. [61], studying the threats of climate change for 244 UNESCO cultural and natural heritage sites in the Mediterranean region, showed that the majority of heritage sites were categorized as vulnerable with an increasing threat rate from man-driven global warming and extreme events. Previously, Ravankhah et al. [62], in their study on the impacts of climate change on the historic center of Rethymno in Greece, underlined that for cultural heritage risk assessment and management, there is a significant need to define both past and future risks due to climate change. Additionally, Nastou and Zerefos [63] investigated the impacts of climate change on the Greek theater of Dionysus and highlighted the need for awareness in the adaptation to the current weather conditions, resilience, and devotion to the sustainability of the heritage for its transmission to the next generations. Management practices will have to evolve, and long-term strategies will have to be developed to manage cultural heritage in a changing climate [64]. However, crisis management lags in prevention and adaptation, with a weak provision for monitoring and feedback in Greece [65]. This gap motivated the present study to apply the HMRout and PRD indices to two Greek areas with rich cultural heritage: Thessaloniki and Delphi. Although the aforementioned indices were primarily proposed and applied to indoor microclimates [42,43], this work highlights that they can also be applied to outdoor microclimates.
Assessment of the model’s ability to simulate the present climate conditions indicated that the model underestimated the average seasonal temperature for spring, summer, and autumn and overestimated it for winter, simulating a “warmer” winter than it actually is. This led to the assumption that the low temperatures are not as extreme as they actually are, and therefore, the environmental risk to monuments due to low temperatures is likely to be underestimated. These results partially agreed with the findings of Velikou et al. [28], who found a significant underestimation of the average temperature in central and northern Greece. The investigation of the sensitivity of the RegCM4 model to the Mediterranean region revealed that these underestimations and overestimations could be attributed to the model’s physics parameterizations (Table 1). For example, Velikou et al. [28] indicated that changes in the planetary boundary layer scheme and the use of a mixed convective precipitation scheme can satisfactorily reproduce the temperature by reducing winter and summer warm biases over the European region. In addition, the simulated times series showed a larger variability than the observational ones for winter and summer in the case of Thessaloniki and for the winter in Delphi. This meant a larger divergence of simulated data from the mean value and therefore more extreme values than those of the observational/reanalysis time series. In the case of RH, the model overestimated the average seasonal RH in all the seasons, simulating a more humid climate in both examined areas. Therefore, in an eventual assessment of the risk due to humidity, it would probably overestimate it. These results were in agreement with the findings of Anwar et al. [66], who used the same model for the African region and found a positive RH bias for all seasons. In addition, the simulated time series showed fewer extreme values than those of the observational/reanalysis ones.
However, the significant underestimation of the range of the ideal RH conditions for winter and spring (mainly for Thessaloniki), contrary to the smaller summer differences, indicated a strong seasonal variability and could lead to a negative impact on the materials of the cultural heritage assets, accompanied by temperature, precipitation, and wind changes [60]. Thus, a detailed investigation of the future climate conditions is essential for the preservation of the monuments. The increase in the future ideal temperature conditions (>2.0 °C) in both examined regions underlines the need for adaptation measures to this new future warmer climate. Moreover, the increase in the future ideal temperature and RH conditions due to changes in the microclimate characteristics (the exceedance of low and high thresholds indicating the ideal conditions) may generate expansions, which can cause serious stress and cracks in the monuments [67]. Nevertheless, in Europe porous stone monuments will experience less frost damage [68]. In addition, the higher future values of RH combined with a temperature increase could significantly affect the chemical composition of particular materials of cultural heritage samples [69]. However, potential future drier summer periods seem likely to increase structural problems from desiccated soils and salt weathering of porous stone [68].
Finally, the results of the future HMRout and PRD index values showed that when the heritage outdoor microclimate risk (HMRout) tended to the maximum risk, the Predicted Risk of Damage (PRD) for inorganic materials increased. In addition to the new temperature conditions to which the monuments have to adapt, an increase in “moderate-maximum” risk years (approximately 12%) is also expected for both case studies, indicating that the average seasonal temperature will often be close to the extreme values (L_HMRenv.out and H_HMRenv.out). Trying to interpret the HMRout index, our findings indicated an increase in the number of years at risk because of the change in average seasonal temperature (HMRenv.out) and its fluctuation (HMRfluc). Thus, this could potentially result in an additional increase in the occurrence of thermoclastism events. Thermoclastism occurs because of the expansion and contraction of the surface mineral grains caused by the potential seasonal fluctuations as well as the changes in the air temperature and direct insolation [70]. This was reinforced by the findings of several other studies pointing out that the risk of thermoclastism is projected to increase in the Mediterranean region because of climate change [64,67], notably for the widely used marble [71]. Regarding RH, the HMRout results showed that even though, in general, the years of “moderate-maximum” risk will decrease (−6%), there are cases where the number of years with “moderate-medium” risk will decrease, while the “high-maximum” risk years will increase (summer—Thessaloniki; winter, spring, and autumn—Delphi), indicating an increase in years with extreme values (“high-maximum” risk). Since the Mediterranean region is expected to become even drier in the future, a reduction in the risk of biological degradation is also expected, as environmental conditions influence the composition and activity of biotic communities, with the type of substrate playing a secondary role [72].

5. Conclusions

In the present research, the impacts of climate change on two Greek regions were investigated for the present (1980–2000) and two future periods (2039–2059 and 2079–2099). In order to evaluate the suitability of the microclimate and assess the damage risk, two up-to-date indices (HMR and PRD) were applied to evaluate the suitability of the microclimate and to assess the potential damage risk to cultural objects. In addition, the current and future ideal outdoor climate conditions for the monuments were estimated and presented in detail in this work. The RCM, RegCM4 model with a fine spatial resolution of 10 × 10 km and an emission scenario RCP4.5 were used for the future climatic simulations.
Overall, the main output of this study is that the future ideal temperature conditions will be higher compared to the reference period for both Thessaloniki and Delphi, posing new challenges for monument adaptation. In addition to the new temperature conditions to which the monuments will have to adapt, the study indicates that the monuments will be exposed to “moderate-maximum” risk more often in the future. However, no significant change is predicted for future ideal RH conditions, while the HMRout results showed that in general, the years of “moderate-maximum” risk will decrease. The results derived from the present study can be used to provide useful information to the museum directors and boards for the development of efficient, updated methods and policies to address the potential climate change in the future.
We further intend to focus on other Greek areas with rich cultural heritage and offer useful information for the Heritage Microclimate Risk due to present and future climate conditions. The next step of this work consists of the application of the HMR index for other climate parameters, e.g., precipitation, in order to have an overall assessment of the effects of climate change on the cultural heritage of these regions.

Author Contributions

Both E.T. and K.T. contributed equally to the study conception and design, material preparation, data collection, and analysis. All authors have read and agreed to the published version of the manuscript.

Funding

The research work was supported by the Hellenic Foundation for Research and Innovation (HFRI) under the 3rd Call for HFRI PhD Fellowships (Fellowship Number: 6527).

Institutional Review Board Statement

Not applicable.

Informed Consent Statement

Not applicable.

Data Availability Statement

The ERA5 dataset is available online at https://cds.climate.copernicus.eu/ (accessed on 2 February 2023). The dataset derived from Aristotle University of Thessaloniki (AUTH) is available on request from the corresponding author.

Conflicts of Interest

The authors declare no conflict of interest.

Abbreviations

AUTHAristotle University of Thessaloniki
TTemperature
RHRelative Humidity
HMRoutHeritage Microclimate Risk for the outdoor environment
HMRenvHMR-environmental
HMRflucHMR-fluctuations
Menv.out.dataThe sum of the data for the study period from each variable considered (e.g., temperature and relative humidity)
NThe total of the time series data for each variable considered
H_HMRenv.outThe maximum value from the time series data
L_HMRenv.outThe minimum value from the time series data
HMRfluc.dataHMR-fluctuation data
ΔMfluc.dataΔΜ fluctuation data. The sum of the hourly fluctuation data from the time series data
Δfluc.highΔ fluctuation high. The maximum value of hourly fluctuation from the time series
Δfluc.lowΔ fluctuation low. The minimum value of hourly fluctuation from the time series
XThe considered variable (e.g., temperature)
KThe number of days of the monitoring campaign, from the first day to the last day n
JThe daily hours, from 0:00 to 24:00
PRDPredicted Risk of Damage
WinterDecember, January, February
SpringMarch, April, May
SummerJune, July, August
AutumnSeptember, October, November
Hot daysThe number of days where the maximum temperature is greater than 35 °C
Tropical nightsThe number of days where the minimum temperature is greater than 20 °C
Dry daysThe number of consecutive days where precipitation is lower than 1 mm

Appendix A

Figure A1. Seasonal analysis of the HMRout index (bars) and PRD index (rhombus symbol) for the RH for the 1st future period—2039–2099 (left panels) and for the 2nd future period—2079–2099 (right panel) for Thessaloniki.
Atmosphere 14 00663 g0a1
Figure A2. Seasonal analysis of the HMRout index (bars) and PRD index (rhombus symbol) for the RH for the 1st future period—2039–2099 (left panels) and for the 2nd future period—2079–2099 (right panel) for Delphi.
Atmosphere 14 00663 g0a2

References

  1. Nijkamp, P. Economic Valuation of Cultural Heritage. In The Economics of Uniqueness: Investing in Historic City Cores and Cultural Heritage Assets for Sustainable Development; Licciardi, G., Amirtahmasebi, R., Eds.; World Bank: Washington, DC, USA, 2012; pp. 75–103. ISBN 978-0-8213-9650-6. [Google Scholar]
  2. Scotti, R.; Cadoni, M. A Historical Analysis of Traditional Common Forest Planning and Management in Seneghe, Sardinia—Lessons for Sustainable Development. For. Ecol. Manag. 2007, 249, 116–124. [Google Scholar] [CrossRef]
  3. Brabec, E.; Chilton, E. Toward an Ecology of Cultural Heritage. Chang. Over Time 2015, 5, 266–285. [Google Scholar] [CrossRef] [Green Version]
  4. Fatorić, S.; Seekamp, E. Are Cultural Heritage and Resources Threatened by Climate Change? A Systematic Literature Review. Clim. Chang. 2017, 142, 227–254. [Google Scholar] [CrossRef]
  5. Hambrecht, G.; Rockman, M. International Approaches to Climate Change and Cultural Heritage. Am. Antiq. 2017, 82, 627–641. [Google Scholar] [CrossRef] [Green Version]
  6. Sesana, E.; Gagnon, A.S.; Ciantelli, C.; Cassar, J.; Hughes, J.J. Climate Change Impacts on Cultural Heritage: A Literature Review. WIREs Clim. Chang. 2021, 12, e710. [Google Scholar] [CrossRef]
  7. Bertolin, C. Preservation of Cultural Heritage and Resources Threatened by Climate Change. Geosciences 2019, 9, 250. [Google Scholar] [CrossRef] [Green Version]
  8. Daire, M.-Y.; Lopez-Romero, E.; Proust, J.-N.; Regnauld, H.; Pian, S.; Shi, B. Coastal Changes and Cultural Heritage (1): Assessment of the Vulnerability of the Coastal Heritage in Western France. J. Isl. Coast. Archaeol. 2012, 7, 168–182. [Google Scholar] [CrossRef] [Green Version]
  9. Gomez-Heras, M.; McCabe, S. Weathering of Stone-Built Heritage: A Lens through Which to Read the Anthropocene. Anthropocene 2015, 11, 1–13. [Google Scholar] [CrossRef] [Green Version]
  10. Leissner, J.; Kilian, R.; Kotova, L.; Jacob, D.; Mikolajewicz, U.; Broström, T.; Ashley-Smith, J.; Schellen, H.L.; Martens, M.; van Schijndel, J.; et al. Climate for Culture: Assessing the Impact of Climate Change on the Future Indoor Climate in Historic Buildings Using Simulations. Herit. Sci. 2015, 3, 38. [Google Scholar] [CrossRef] [Green Version]
  11. Liu, F.; Zhang, Y.; Feng, Z.; Hou, G.; Zhou, Q.; Zhang, H. The Impacts of Climate Change on the Neolithic Cultures of Gansu-Qinghai Region during the Late Holocene Megathermal. J. Geogr. Sci. 2010, 20, 417–430. [Google Scholar] [CrossRef] [Green Version]
  12. Reeder-Myers, L.A. Cultural Heritage at Risk in the Twenty-First Century: A Vulnerability Assessment of Coastal Archaeological Sites in the United States. J. Isl. Coast. Archaeol. 2015, 10, 436–445. [Google Scholar] [CrossRef]
  13. Ronco, P.; Bullo, M.; Torresan, S.; Critto, A.; Olschewski, R.; Zappa, M.; Marcomini, A. KULTURisk Regional Risk Assessment Methodology for Water-Related Natural Hazards—Part 2: Application to the Zurich Case Study. Hydrol. Earth Syst. Sci. 2015, 19, 1561–1576. [Google Scholar] [CrossRef] [Green Version]
  14. Wang, J.-J. Flood Risk Maps to Cultural Heritage: Measures and Process. J. Cult. Herit. 2015, 16, 210–220. [Google Scholar] [CrossRef]
  15. Elahi, E.; Khalid, Z.; Tauni, M.Z.; Zhang, H.; Lirong, X. Extreme Weather Events Risk to Crop-Production and the Adaptation of Innovative Management Strategies to Mitigate the Risk: A Retrospective Survey of Rural Punjab, Pakistan. Technovation 2022, 117, 102255. [Google Scholar] [CrossRef]
  16. Arora, N.K. Impact of Climate Change on Agriculture Production and Its Sustainable Solutions. Environ. Sustain. 2019, 2, 95–96. [Google Scholar] [CrossRef] [Green Version]
  17. UNESCO World Heritage Centre. Policy Document on the Impacts of Climate Change on World Heritage Properties; UNESCO: London, UK, 2008. [Google Scholar]
  18. Spinoni, J.; Vogt, J.V.; Naumann, G.; Barbosa, P.; Dosio, A. Will Drought Events Become More Frequent and Severe in Europe? Future Drought Events on Europe. Int. J. Clim. 2018, 38, 1718–1736. [Google Scholar] [CrossRef] [Green Version]
  19. Petrie, M.D.; Bradford, J.B.; Lauenroth, W.K.; Schlaepfer, D.R.; Andrews, C.M.; Bell, D.M. Non-Analog Increases to Air, Surface, and Belowground Temperature Extreme Events Due to Climate Change. Clim. Chang. 2020, 163, 2233–2256. [Google Scholar] [CrossRef]
  20. Vogel, J.; Paton, E.; Aich, V.; Bronstert, A. Increasing Compound Warm Spells and Droughts in the Mediterranean Basin. Weather Clim. Extrem. 2021, 32, 100312. [Google Scholar] [CrossRef]
  21. IPCC. IPCC Sixth Assessment Report: Climate Change 2022: Impacts, Adaptation and Vulnerability, Working Group II Contribution; IPCC: Geneva, Switzerland, 2022. [Google Scholar]
  22. Georgoulias, A.K.; Akritidis, D.; Kalisoras, A.; Kapsomenakis, J.; Melas, D.; Zerefos, C.S.; Zanis, P. Climate Change Projections for Greece in the 21st Century from High-Resolution EURO-CORDEX RCM Simulations. Atmos. Res. 2022, 271, 106049. [Google Scholar] [CrossRef]
  23. Tolika, K.; Anagnostopoulou, C.; Maheras, P.; Vafiadis, M. Simulation of Future Changes in Extreme Rainfall and Temperature Conditions over the Greek Area: A Comparison of Two Statistical Downscaling Approaches. Glob. Planet. Chang. 2008, 63, 132–151. [Google Scholar] [CrossRef]
  24. Barcikowska, M.J.; Kapnick, S.B.; Krishnamurty, L.; Russo, S.; Cherchi, A.; Folland, C.K. Changes in the Future Summer Mediterranean Climate: Contribution of Teleconnections and Local Factors. Earth Syst. Dynam. 2020, 11, 161–181. [Google Scholar] [CrossRef] [Green Version]
  25. Giannakopoulos, C.; Kostopoulou, E.; Varotsos, K.V.; Tziotziou, K.; Plitharas, A. An Integrated Assessment of Climate Change Impacts for Greece in the near Future. Reg. Env. Chang. 2011, 11, 829–843. [Google Scholar] [CrossRef] [Green Version]
  26. Tolika, K.; Zanis, P.; Anagnostopoulou, C. Regional Climate Change Scenarios for Greece: Future Temperature and Precipitation Projections Form Ensembles of RCMs. Glob. NEST J. 2012, 14, 407–421. [Google Scholar] [CrossRef]
  27. Zanis, P.; Katragkou, E.; Ntogras, C.; Marougianni, G.; Tsikerdekis, A.; Feidas, H.; Anadranistakis, E.; Melas, D. Transient High-Resolution Regional Climate Simulation for Greece over the Period 1960-2100: Evaluation and Future Projections. Clim. Res. 2015, 64, 123–140. [Google Scholar] [CrossRef] [Green Version]
  28. Velikou, K.; Tolika, K.; Anagnostopoulou, C.; Zanis, P. Sensitivity Analysis of RegCM4 Model: Present Time Simulations over the Mediterranean. Appl. Clim. 2019, 136, 1185–1208. [Google Scholar] [CrossRef]
  29. Holden, L.D.; Silcock, D.M.; Arrowsmith, C.A.; Al Hassani, M. Laser Scanning for the Documentation and Management of Heritage Sites within the Emirate of Fujairah, United Arab Emirates. Arab. Arch. Epig. 2015, 26, 55–67. [Google Scholar] [CrossRef]
  30. Wu, P.-S.; Hsieh, C.-M.; Hsu, M.-F. Using Heritage Risk Maps as an Approach for Estimating the Climate Impact to Cultural Heritage Materials in the Island of Taiwan. In Digital Heritage. Progress in Cultural Heritage: Documentation, Preservation, and Protection; Ioannides, M., Magnenat-Thalmann, N., Fink, E., Žarnić, R., Yen, A.-Y., Quak, E., Eds.; Lecture Notes in Computer Science; Springer: Berlin/Heidelberg, Germany, 2014; Volume 8740, pp. 300–309. ISBN 978-3-319-13694-3. [Google Scholar]
  31. Ferdyn-Grygierek, J. Indoor Environment Quality in the Museum Building and Its Effect on Heating and Cooling Demand. Energy Build. 2014, 85, 32–44. [Google Scholar] [CrossRef]
  32. Christensen, J.E.; Kollias, C.G. Hygrothermal Evaluation of a Museum Storage Building Based on Actual Measurements and Simulations. Energy Procedia 2015, 78, 651–656. [Google Scholar] [CrossRef] [Green Version]
  33. Bonora, A.; Fabbri, K.; Pretelli, M. Widespread Difficulties and Applications in the Monitoring of Historical Buildings: The Case of the Realm of Venaria Reale. Heritage 2020, 3, 128–139. [Google Scholar] [CrossRef] [Green Version]
  34. Michalak, P. The Simple Hourly Method of EN ISO 13790 Standard in Matlab/Simulink: A Comparative Study for the Climatic Conditions of Poland. Energy 2014, 75, 568–578. [Google Scholar] [CrossRef]
  35. Coelho, G.B.A.; Entradas Silva, H.; Henriques, F.M.A. Impact of Climate Change in Cultural Heritage: From Energy Consumption to Artefacts’ Conservation and Building Rehabilitation. Energy Build. 2020, 224, 110250. [Google Scholar] [CrossRef]
  36. Alexandrakis, G.; Manasakis, C.; Kampanis, N.A. Economic and Societal Impacts on Cultural Heritage Sites, Resulting from Natural Effects and Climate Change. Heritage 2019, 2, 279–305. [Google Scholar] [CrossRef] [Green Version]
  37. Pigliautile, I.; Pisello, A.L. A New Wearable Monitoring System for Investigating Pedestrians’ Environmental Conditions: Development of the Experimental Tool and Start-up Findings. Sci. Total Environ. 2018, 630, 690–706. [Google Scholar] [CrossRef] [PubMed]
  38. Pioppi, B.; Pigliautile, I.; Piselli, C.; Pisello, A.L. Cultural Heritage Microclimate Change: Human-Centric Approach to Experimentally Investigate Intra-Urban Overheating and Numerically Assess Foreseen Future Scenarios Impact. Sci. Total Environ. 2020, 703, 134448. [Google Scholar] [CrossRef] [PubMed]
  39. Corgnati, S.P.; Fabi, V.; Filippi, M. A Methodology for Microclimatic Quality Evaluation in Museums: Application to a Temporary Exhibit. Build. Environ. 2009, 44, 1253–1260. [Google Scholar] [CrossRef]
  40. Andretta, M.; Coppola, F.; Modelli, A.; Santopuoli, N.; Seccia, L. Proposal for a New Environmental Risk Assessment Methodology in Cultural Heritage Protection. J. Cult. Herit. 2017, 23, 22–32. [Google Scholar] [CrossRef]
  41. Silva, H.E.; Henriques, F.M.A.; Henriques, T.A.S.; Coelho, G. A Sequential Process to Assess and Optimize the Indoor Climate in Museums. Build. Environ. 2016, 104, 21–34. [Google Scholar] [CrossRef]
  42. Fabbri, K.; Bonora, A. Two New Indices for Preventive Conservation of the Cultural Heritage: Predicted Risk of Damage and Heritage Microclimate Risk. J. Cult. Herit. 2021, 47, 208–217. [Google Scholar] [CrossRef]
  43. Boeri, A.; Longo, D.; Fabbri, K.; Pretelli, M.; Bonora, A.; Boulanger, S. Library Indoor Microclimate Monitoring with and without Heating System. A Bologna University Library Case Study. J. Cult. Herit. 2022, 53, 143–153. [Google Scholar] [CrossRef]
  44. Vyzantiadou, M.M.; Selevista, M. Protection of Cultural Heritage in Thessaloniki: A Review of Designation Actions. Heritage 2019, 2, 717–731. [Google Scholar] [CrossRef] [Green Version]
  45. Giorgi, F.; Coppola, E.; Solmon, F.; Mariotti, L.; Sylla, M.; Bi, X.; Elguindi, N.; Diro, G.; Nair, V.; Giuliani, G.; et al. RegCM4: Model Description and Preliminary Tests over Multiple CORDEX Domains. Clim. Res. 2012, 52, 7–29. [Google Scholar] [CrossRef] [Green Version]
  46. Giorgi, F.; Marinucci, M.R.; Bates, G.T. Development of a Second-Generation Regional Climate Model (RegCM2). Part I: Boundary-Layer and Radiative Transfer Processes. Mon. Weather Rev. 1993, 121, 2794–2813. [Google Scholar] [CrossRef]
  47. Grell, G.; Dudhia, J.; Stauffer, D. A Description of the Fifth-Generation Penn State/NCAR Mesoscale Model (MM5); UCAR/NCAR: Boulder, CO, USA, 1994; p. 5124. [Google Scholar]
  48. Tolika, K.; Anagnostopoulou, C.; Velikou, K.; Vagenas, C. A Comparison of the Updated Very High Resolution Model RegCM3_10km with the Previous Version RegCM3_25km over the Complex Terrain of Greece: Present and Future Projections. Appl. Clim. 2016, 126, 715–726. [Google Scholar] [CrossRef]
  49. Grell, G.A. Prognostic Evaluation of Assumptions Used by Cumulus Parameterizations. Mon. Weather Rev. 1993, 121, 764–787. [Google Scholar] [CrossRef]
  50. Frich, P.; Alexander, L.; Della-Marta, P.; Gleason, B.; Haylock, M.; Klein Tank, A.; Peterson, T. Observed Coherent Changes in Climatic Extremes during the Second Half of the Twentieth Century. Clim. Res. 2002, 19, 193–212. [Google Scholar] [CrossRef] [Green Version]
  51. Grenier, H.; Bretherton, C.S. A Moist PBL Parameterization for Large-Scale Models and Its Application to Subtropical Cloud-Topped Marine Boundary Layers. Mon. Weather Rev. 2001, 129, 357–377. [Google Scholar] [CrossRef]
  52. Zeng, X.; Zhao, M.; Dickinson, R.E. Intercomparison of Bulk Aerodynamic Algorithms for the Computation of Sea Surface Fluxes Using TOGA COARE and TAO Data. J. Clim. 1998, 11, 2628–2644. [Google Scholar] [CrossRef]
  53. Komkoua Mbienda, A.J.; Tchawoua, C.; Vondou, D.A.; Choumbou, P.; Kenfack Sadem, C.; Dey, S. Sensitivity Experiments of RegCM4 Simulations to Different Convective Schemes over Central Africa: Sensitivity Experiments Of RegCM4 Over Central Africa. Int. J. Climatol. 2017, 37, 328–342. [Google Scholar] [CrossRef]
  54. Carroll, P.; Aarrevaara, E. Review of Potential Risk Factors of Cultural Heritage Sites and Initial Modelling for Adaptation to Climate Change. Geosciences 2018, 8, 322. [Google Scholar] [CrossRef]
  55. UNI 10829; Works of Art of Historical Importance. Ambient Conditions for the Conservation. Measurement and Analysis. Ente Nazionale Italiano di Unificazione (UNI): Milano, Italy, 1999.
  56. EN 15757 Standard; Conservation of Cultural Heritage—Specifications for Temperature and Relative Humidity to Limit Climate-Induced Mechanical Damage. iTeh Standards: Newark, DE, USA, 2010.
  57. Anagnostidis, K.; Economou-Amilli, A.; Roussomoustakaki, M. Epilithic and chasmolithic microflora (Cyanophyta, Bacillariophyta) from marbles of the Parthenon (Acropolis-Athens, Greece). Nova Hedwigia 1983, 38, 227–287. [Google Scholar]
  58. de Vals, M.; Gastineau, R.; Perrier, A.; Rubi, R.; Moretti, I. The Stones of the Sanctuary of Delphi—Northern Shore of the Corinth Gulf—Greece. BSGF Earth Sci. Bull. 2020, 191, 11. [Google Scholar] [CrossRef]
  59. UNESCO World Heritage Centre. Climate Change and World Heritage. Report on Predicting and Managing the Impacts of Climate Change on World Heritage and Strategy to Assist States Parties to Implement Appropriate Management Responses; UNESCO: London, UK, 2007. [Google Scholar]
  60. Sesana, E.; Gagnon, A.; Bertolin, C.; Hughes, J. Adapting Cultural Heritage to Climate Change Risks: Perspectives of Cultural Heritage Experts in Europe. Geosciences 2018, 8, 305. [Google Scholar] [CrossRef] [Green Version]
  61. Kapsomenakis, J.; Douvis, C.; Poupkou, A.; Zerefos, S.; Solomos, S.; Stavraka, T.; Melis, N.S.; Kyriakidis, E.; Kremlis, G.; Zerefos, C. Climate Change Threats to Cultural and Natural Heritage UNESCO Sites in the Mediterranean. Env. Dev. Sustain. 2022. [Google Scholar] [CrossRef]
  62. Ravankhah, M.; de Wit, R.; Argyriou, A.V.; Chliaoutakis, A.; Revez, M.J.; Birkmann, J.; Žuvela-Aloise, M.; Sarris, A.; Tzigounaki, A.; Giapitsoglou, K. Integrated Assessment of Natural Hazards, Including Climate Change’s Influences, for Cultural Heritage Sites: The Case of the Historic Centre of Rethymno in Greece. Int. J. Disaster Risk Sci. 2019, 10, 343–361. [Google Scholar] [CrossRef] [Green Version]
  63. Nastou, M.P.; Zerefos, S. Impacts of Climate Change on Cultural Heritage; The Case of the Greek Theatre of Dionysus. IOP Conf. Ser. Earth Environ. Sci. 2021, 899, 012020. [Google Scholar] [CrossRef]
  64. Sabbioni, C.; Brimblecombe, P.; Cassar, M. The Atlas of Climate Change Impact on European Cultural Heritage: Scientific Analysis and Management Strategies; Anthem Press: London, UK, 2010. [Google Scholar]
  65. Asprogerakas, E.; Gourgiotis, A.; Pantazis, P.; Samarina, A.; Konsoula, P.; Stavridou, K. The Gap of Cultural Heritage Protection with Climate Change Adaptation in the Context of Spatial Planning. The Case of Greece. IOP Conf. Ser. Earth Environ. Sci. 2021, 899, 012022. [Google Scholar] [CrossRef]
  66. Anwar, S.A.; Zakey, A.S.; Robaa, S.M.; Abdel Wahab, M.M. The Influence of Two Land-Surface Hydrology Schemes on the Regional Climate of Africa Using the RegCM4 Model. Appl. Clim. 2019, 136, 1535–1548. [Google Scholar] [CrossRef]
  67. Camuffo, D. Microclimate for Cultural Heritage: Measurement, Risk Assessment, Conservation, Restoration, and Maintenance of Indoor and Outdoor Monuments, 3rd ed.; Elsevier: Amsterdam, The Netherlands; Cambridge, MA, USA, 2019; ISBN 978-0-444-64106-9. [Google Scholar]
  68. Brimblecombe, P.; Grossi, C.M.; Harris, I. Climate Change Critical to Cultural Heritage. In Survival and Sustainability; Gökçekus, H., Türker, U., LaMoreaux, J.W., Eds.; Springer: Berlin/Heidelberg, Germany, 2010; pp. 195–205. ISBN 978-3-540-95990-8. [Google Scholar]
  69. Radulescu, C.; Stihi, C.; Ion, R.M.; Dulama, I.D.; Stanescu, S.G.; Stirbescu, R.M.; Teodorescu, S.; Gurgu, I.V.; Let, D.D.; Olteanu, L.; et al. Seasonal Variability in the Composition of Particulate Matter and the Microclimate in Cultural Heritage Areas. Atmosphere 2019, 10, 595. [Google Scholar] [CrossRef] [Green Version]
  70. Yaldiz, E. Climate Effects on Monumental Buildings. In Proceedings of the Balwois Conference, Ohrid, Republic of Macedonia, 25–29 May 2010. [Google Scholar]
  71. Sabbioni, C.; Cassar, M.; Brimblecombe, P.; Vulnerability of Cultural Heritage to Climate Change. Pollut. Atmos. 2009. Available online: https://www.coe.int/t/dg4/majorhazards/activites/2009/ravello15-16may09/Ravello_APCAT2008_44_Sabbioni-Jan09_EN.pdf (accessed on 21 February 2023).
  72. Viles, H.A. Implications of Future Climate Change for Stone Deterioration. SP 2002, 205, 407–418. [Google Scholar] [CrossRef]
Figure 1. Geographical distribution of the stations under study. The geographical coordinates and altitude are provided for each station. The pictures below and to the right show some of the important monuments of Thessaloniki, and the pictures below and to the left show monuments from the archaeological site of Delphi.
Atmosphere 14 00663 g001
Figure 2. L_HMRenv.out (bottom value in the bar) and H_HMRenv.out (top value in the bar) of the observational, reanalysis, and model data for the reference period (1980–2000) and for the two case studies (Thessaloniki—left panel, Delphi—right panel).
Atmosphere 14 00663 g002
Figure 3. L_HMRenv.out (bottom value in the bar) and H_HMRenv.out (top value in the bar) of the model data for the reference period and for the two future periods (2039–2059 and 2079–2099) for the two case studies (Thessaloniki—left panel, Delphi—right panel).
Atmosphere 14 00663 g003
Figure 4. Seasonal analysis of the HMRout index (bars) and PRD index (rhombus symbol) for the temperature for the 1st future period—2039–2099 (left panels) and for the 2nd future period—2079–2099 (right panels) for Thessaloniki.
Atmosphere 14 00663 g004
Figure 5. Seasonal analysis of the HMRout index (bars) and PRD index (rhombus symbols) for the temperature for the 1st future period—2039–2099 (left panels) and for the 2nd future period—2079–2099 (right panels) for Delphi.
Atmosphere 14 00663 g005
Table 1. Physics parameterizations of the RegCM4 model.
Physics Parameterizations
Cumulus Convection Scheme [49]
Convective Closure Scheme [50]
Planetary Boundary Layer Scheme [51]
Ocean Flux Scheme [52]
Land Surface Model [53]
Table 2. The risk level of the Heritage Microclimate Risk index.
HMR−1.00−0.80−0.60−0.40−0.200.00+0.20+0.40+0.60+0.80+1.00
Risk LevelMaximumHighMediumModerateLowMinimumLowModerateMediumHighMaximum
Table 3. Mean seasonal differences and mean standard deviation differences of temperature (model (RegCM)-observational (AUTH) data and model (RegCM)-reanalysis (ERA5) data) for the reference period (1980–2000) and for the two case studies (Thessaloniki—left, Delphi—right). Below are the median, 25th, and 75th percentiles of the observational, reanalysis, and model data for the reference period (1980–2000) and for the two case studies (Thessaloniki—left, Delphi—right).
ThessalonikiDelphi
WinterSpringSummerAutumnWinterSpringSummerAutumn
Diff.0.7−2.5−2.2−0.60.7−1.3−1.0−1.7
Stdev Diff.0.2−0.20.1−0.10.1−0.20.0−0.1
RegCMAUTHRegCMAUTHRegCMAUTHRegCMAUTHRegCMERA5RegCMERA5RegCMERA5RegCMERA5
25th5.17.39.511.020.423.512.912.75.64.28.58.619.019.612.811.9
Median7.96.912.114.423.125.316.016.87.96.810.811.921.422.115.315.6
75th10.39.014.617.825.226.918.820.99.79.213.215.423.324.817.619.1
Table 4. Mean seasonal differences and mean standard deviation differences of RH (model (RegCM)-observational (AUTH) data and model (RegCM)-reanalysis (ERA5) data) for the reference period (1980–2000) and for the two case studies (Thessaloniki—left, Delphi—right). Below are the median, 25th, and 75th percentiles of the observational, reanalysis, and model data for the reference period (1980–2000) and for the two case studies (Thessaloniki—left, Delphi—right).
ThessalonikiDelphi
WinterSpringSummerAutumnWinterSpringSummerAutumn
Diff.16.016.08.014.010.016.011.016.0
Stdev Diff.−4.0−4.8−0.7−1.0−0.6−1.7−0.3−0.7
RegCMAUTHRegCMAUTHRegCMAUTHRegCMAUTHRegCMERA5RegCMERA5RegCMERA5RegCMERA5
25th80.762.375.658.256.454.377.061.484.470.778.154.959.244.280.959.2
Median89.974.584.068.067.961.586.471.693.982.686.571.168.955.989.174.9
75th98.783.891.477.879.768.294.781.396.890.294.584.979.370.990.186.6
Disclaimer/Publisher’s Note: The statements, opinions and data contained in all publications are solely those of the individual author(s) and contributor(s) and not of MDPI and/or the editor(s). MDPI and/or the editor(s) disclaim responsibility for any injury to people or property resulting from any ideas, methods, instructions or products referred to in the content.

