Article

Impact of Water-Based Coating Substitution on VOCs Emission Characteristics for the Surface-Coating Industries and Policy Effectiveness: A Case Study in Jiangsu Province, China

1
Jiangsu Key Laboratory of Environmental Engineering, Jiangsu Academy of Environmental Science, Nanjing 210036, China
2
CNOOC Changzhou Paint and Coatings Research Institute, Changzhou 213000, China
3
State Key Laboratory of Pollution Control & Resource Reuse and School of the Environment, Nanjing University, Nanjing 210023, China
4
School of Geography and Marine Science, Nanjing University, Nanjing 210023, China
*
Author to whom correspondence should be addressed.
Atmosphere 2023, 14(4), 662; https://doi.org/10.3390/atmos14040662
Submission received: 1 March 2023 / Revised: 22 March 2023 / Accepted: 23 March 2023 / Published: 31 March 2023
(This article belongs to the Special Issue Atmospheric Pollutants: Characteristics, Sources and Transport)

Abstract

:
As solvent-based coatings are gradually phasing out in China, the volatile organic compounds (VOCs) emission characteristics of surface-coating industries have changed rapidly. Sector-based field measurements were conducted to build VOCs emission factors and source profiles of surface-coating industries in Jiangsu Province. A VOCs emission inventory was developed, and the projections for 2020 to 2030 were set. It was found that VOCs content in water-based coatings is 50.8% of solvent-based coatings on average. VOCs emission factors of solvent-based coatings ranged from 0.40 to 0.51 kg kg−1, while those of water-based coatings ranged from 0.14 to 0.24 kg kg−1. Compared to solvent-based coatings, the proportion of aromatics emitted from water-based coatings was 44.2% lower, while the proportion of oxygenated VOCs (OVOCs) was 11.6% higher. The results showed that VOCs emissions were about 134 Gg in Jiangsu Province in 2020, of which the solvent-based coating sources contributed 79.6% of the total. Aromatics were the main species contributing 52.9% of VOCs emissions and 85.9% of ozone formation potential (OFP). According to emission prediction results of four scenarios, the emission reduction of implementing low-content VOCs coating substitution is 8.7% higher than that of adopting the best available end-of-pipe treatment measures by 2030.

1. Introduction

As a typical economically developed region in China, the Yangzi River Delta (YRD) region is facing serious air pollution issues, characterized by high concentrations of fine particle matter (PM2.5) and ozone (O3) [1,2]. In order to improve air quality and protect human health, a series of control measures have been implemented in recent years [3]. PM2.5 concentration has been decreasing rapidly. However, the YRD region is still facing severe winter haze pollution due mainly to secondary aerosols [4], along with increased O3 concentrations in summer [5]. Studies have shown that there is an increasing proportion of secondary organic aerosols (SOAs) formed by volatile organic compounds (VOCs) [6,7]. Moreover, according to previous studies, O3 formation in most regions of the YRD is sensitive to VOCs [8,9]. Therefore, VOCs are the crucial precursor for controlling both secondary aerosols and O3 in the YRD region.
Industrial coating processes are recognized as important VOCs sources in the YRD region. In recent years, control measures have been applied to reduce VOCs emissions, including the implementation of end-of-pipe treatment, as well as the use of coatings with low VOCs content [10]. Thus, the VOCs emission characteristics of surface-coating industries have changed rapidly. An accurate depiction of VOCs emission characteristics is essential for the formulation of air pollution control strategies. Several studies have been conducted to estimate VOCs emissions from surface-coating industries [11,12,13]. However, most of the previous emission inventories were established using emission factors based on Chinese standard limits due to the lack of measured data. The influence of coating types was not considered as well [14]. In addition, VOCs consist of numerous species with various reactivities, and understanding the chemical compositions from different sectors is essential for air pollution control [15]. Although there have been several studies of VOCs source profiles in coating industries, most of them focused on solvent-based coatings, and water-based coatings were seldom covered [11,16,17].
Jiangsu Province has the largest VOCs emission from surface-coating industries in the YRD region [12]. Different types of coating enterprises are well distributed, making it the most representative region to study VOCs emission characteristics of the surface-coating industries. In order to identify VOCs emission characteristics and to develop priority control measures to reduce ambient O3, air samples of different coating types from surface-coating industries were collected and measured in this work. Sector-based emission factors and source profiles of VOCs were established, and a local VOCs emission inventory of surface-coating industries was developed using the emission factor method. The OFP of VOCs emissions from different sources and species were also estimated. Four scenarios were set to estimate VOCs emissions from coating industries under different policies for the target years of 2025 and 2030. The results would be helpful for developing strategies to control VOCs emissions as well as further improve air quality by reducing VOCs related to O3 formations.

2. Materials and Methods

2.1. Measurement

Local measurements of VOCs emission factors were conducted in 5 kinds of coating industries in Jiangsu province, which are wood furniture coating, auto coating, construction machinery coating, container coating, and shipbuilding. The sources were further sub-categorized by different coating types, including solvent-based and water-based coatings.
Representative samples of industrial coatings were collected according to the market investigation and statistical data about the consumption of different coatings obtained from the China Coatings Industry Annual [18]. A total of 280 air samples of various coatings were collected from 98 factories in Jiangsu province, including 186 solvent-based coatings and 94 water-based coatings. Table 1 summarizes the number of samples collected for each sector or process. All samples were collected from production lines. VOCs content in solvent-based and water-based coatings were analyzed according to the Paint and Varnishes-Determination of Volatile Organic Compound (VOC) Content-Difference Method (GB/T 23985) and the Paint and Varnishes-Determination of Volatile Organic Compound (VOC) Content-Gas-Chromatographic Method (GB/T 23986), respectively.
In order to obtain VOCs speciation and build source profiles, 66 organized and unorganized samples were collected by 6L SUMMA canisters, as shown in Table 1. The samples were collected from 15 factories in Jiangsu province, including 2 furniture manufacturing factories, 4 auto manufacturing factories, 2 shipbuilding factories, 3 container manufacturing factories, and 3 construction machinery manufacturing factories. To make the sampling work more efficient, some of the factories had both water-based coating lines and solvent-based coating lines. Both organized and unorganized samples were collected for each coating line. Prior to sampling, all canisters were cleaned at least five times by repeatedly filling and evacuating ultra-pure nitrogen (N2, 99.999%). Air samples were collected into the vacuumed canisters through a stainless -steel line equipped with a filter (filled with glass wool and anhydrous sodium sulfate) installed at the head of the inlet. The organized emission samples were uniformly sampled at the chimney of the exhaust funnel, and the sampling time was about 10 min. The unorganized emission samples were uniformly sampled in the coating workshop. The height was about 1.5 m, and the sampling time was about 1 h. A pressure gauge was used to check the pressure in the canister to ensure the completion of sample collections. The sampling time was controlled by the restrictor valve to ensure the representativeness of the samples. The source samples were analyzed following US EPA methods TO-15 [19]. Samples in SUMMA canisters were firstly pre-diluted in a preconcentrator (Model 7100, Entech Instruments Inc., California, CA, USA), and then analyzed by a gas chromatography-mass selective detector (GC-MSD, 5973N, Agilent Technologies, Santa Clara, CA, USA) or flame ionization detector (FID) to characterize the C2–C12 VOCs components. The C2–C3 hydrocarbons were separated with an HP-PLOT/Q polystyrene-divinylbenzene column (15 m × 0.32 mm × 20.0 μm) and quantified using an FID. The C4–C12 hydrocarbons were separated with a DB-1 Dimethylpolysiloxane column (60 m × 0.32 μm × 1.0 μm) and quantified using an MS. The carrier gas was high-purity helium, and the carrier gas flow rate was 2 mL/min. The ion source temperature for the MS was 250 °C, and the ionization method was electron impacting. The profiles for VOCs consisted of 107 species, including 29 alkanes, 13 alkenes and alkynes, 17 aromatics, 10 OVOCs, 35 halocarbons, and 3 other organic compounds. The concentrations from different plants were weighted-averaged and further normalized into mass percentages.

2.2. Emission Inventory

Industrial paints are mostly used for automobile, furniture, ship, machine, plastic, fabric, and other metallic surface coatings in China. The VOCs emissions of each sub-sector were calculated using the emission factor method, following Equation (1):
En = EFn × An × (1 − ηn),
where En is emission, referring to total VOCs emission for the nth emission source. EFn is an emission factor, referring to the percentage of VOCs content of raw and auxiliary material of the nth source. An is the activity rate, referring to the consumption of raw and auxiliary material of the nth source, and ηn is the removal rate, referring to the exhaust control efficiency of the nth source.
Based on the measurement results in this study, emission factors for furniture manufacturing, auto manufacturing, shipbuilding, container manufacturing, and construction machinery manufacturing were updated first. We assumed that VOCs from organic raw and auxiliary materials are discharged into the atmosphere completely, and emission factors were defined as the VOCs content in each type of paint. Apart from the emission factors built in this study, emission factors from plastic and fabric surface coatings were obtained from the domestic emission inventory guidebook of China [20] and published literature [16]. Activity data were mainly obtained through field surveys. Information about 5042 large- and medium-sized industrial coating sources, including control technologies, solvent type, and consumption, was obtained in this study.

2.3. Source Profiles and OFP Analysis

VOCs source profiles of 5 kinds of coating industries were localized according to the measurements in this study and refined into 2 coating types. The OFP was estimated to characterize the regional O3 formation contributions from different VOCs species and sources. The OFP of individual VOCs species is calculated by the product of its emission amount and its maximum incremental reactivity (MIR) value [8], following Equation (2):
OFPi = mi × MIRi,
where OFPi is the ozone formation potential, referring to the O3 quality generated by the emission of ith VOCs species, and mi is the emission amount of the ith VOCs species. MIRi is the maximum incremental reactivity, referring to the maximum incremental reactivity (MIR) of the ith VOCs species, which were obtained from previous studies [15,21].

3. Results

3.1. Emission Characteristics

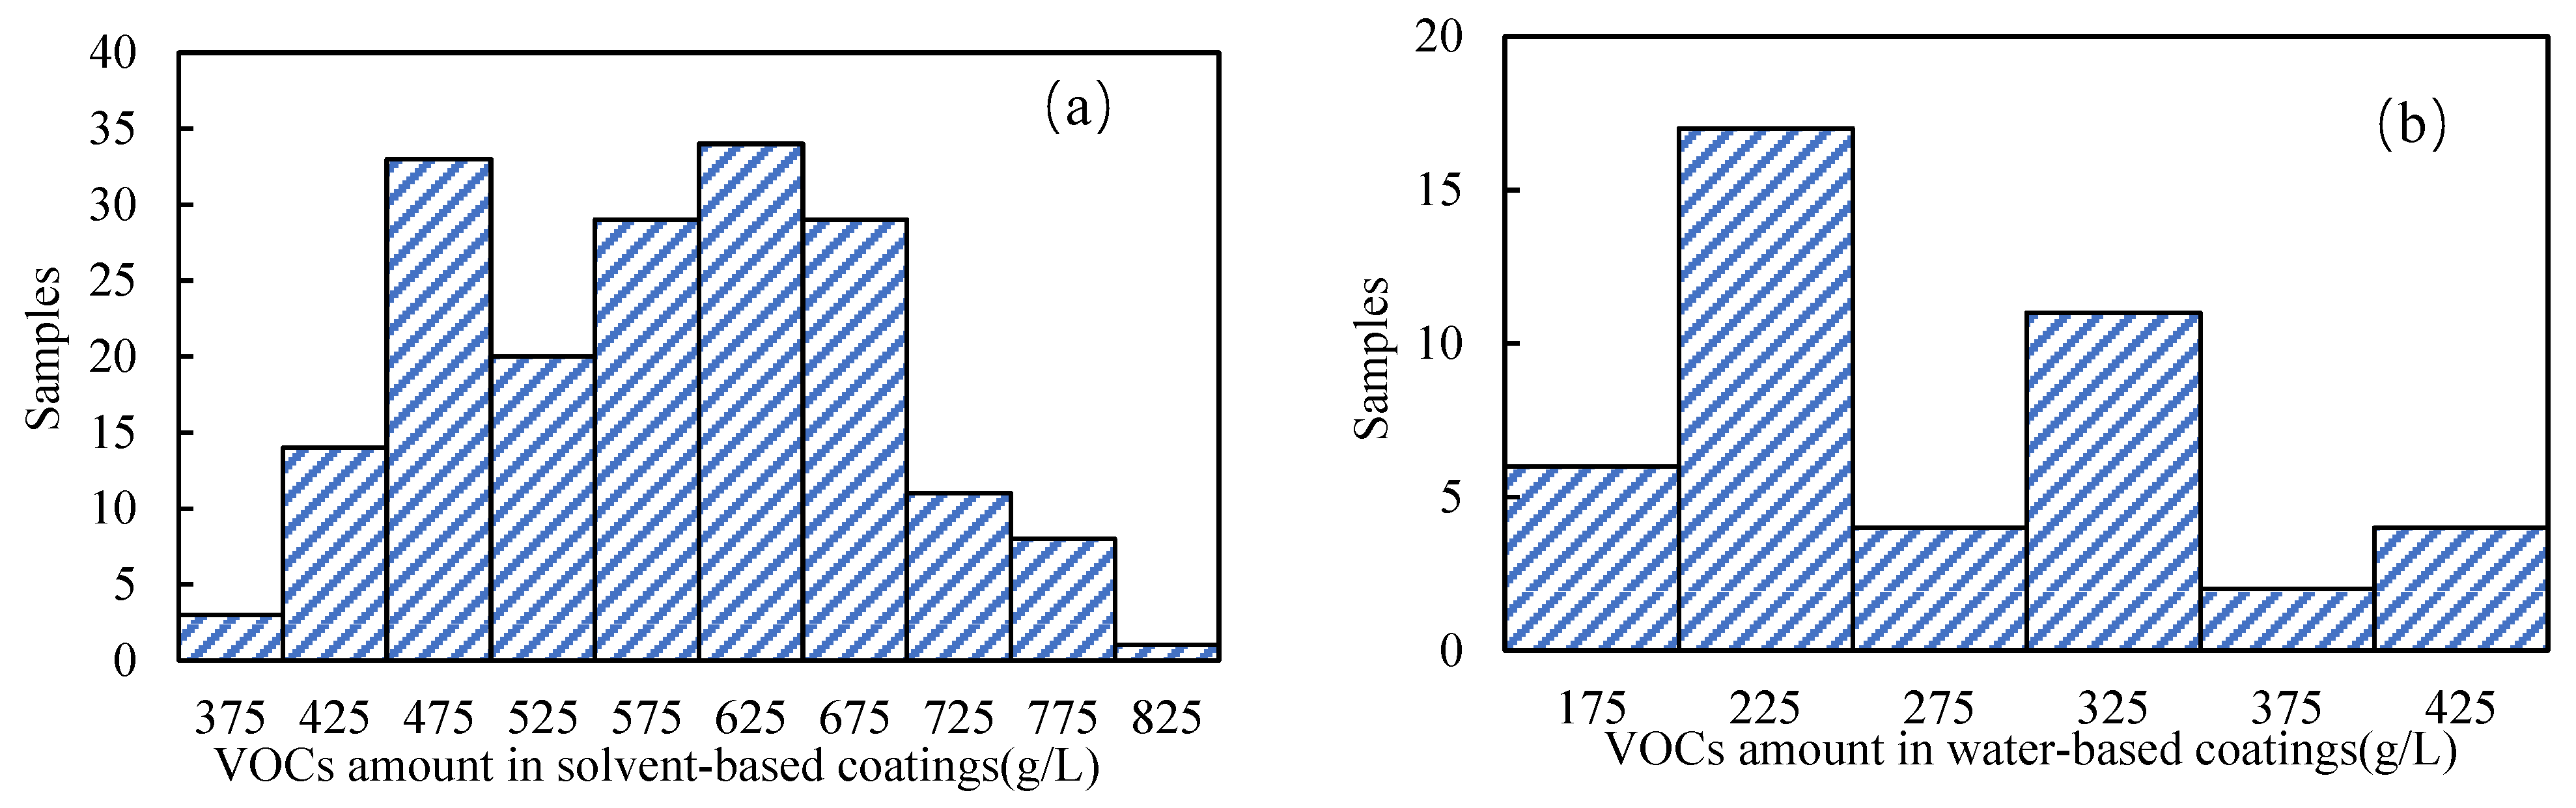
3.1.1. VOCs Emission Factors

The organic solvents used in the coating industry include coatings, thinners, curing agents, cleaning agents, and adhesives. VOCs emissions are mainly generated during the preparation, storage, and use of solvents in the coating process. According to the VOCs content testing results (Table 2 and Figure 1), the VOCs contents of solvent-based coatings ranged from 356 g L−1 to 838 g L−1, with an average of 581 g L−1. The VOCs content for 79.7% of solvent-based coating samples was at a range of 450 and 750 g L−1. The solvent-based coatings in the furniture manufacturing industry had the highest VOCs content, with an average of 606 g L−1, while coatings in the container manufacturing industry had a relatively low-VOCs content, with an average of 484 g L−1. The VOCs contents for the water-based coatings ranged from 155 to 468 g L−1, with an average of 295 g L−1. A total of 86.4% of water-based coating samples were at a range of 150 and 350 g L−1. The coatings in the construction machinery manufacturing industry had the highest VOCs content, with an average of 293 g L−1, while coatings in the container manufacturing industry had a relatively low VOCs content, with an average of 208 g L−1. According to the compulsory standards issued in China [22,23,24,25], 58.5% and 70.2% of the samples from solvent-based coatings and water-based coatings exceeded the VOCs content limits, respectively.
Based upon field survey and source sampling, five localized uncontrolled emission factors from the consumption of raw material and product were newly built. Sector-specific emission factors are listed in Table 2. The emission factors of solvent-based coatings varied at a relatively narrow range from 0.40 to 0.51 kg kg−1. The furniture machinery industry was characterized by the highest emission factor for solvent-based coatings. The emission factors for water-based coatings in the five industries ranged from 0.14 to 0.24 kg kg−1. The auto manufacturing industry was characterized by the lowest emission factor for water-based coatings.

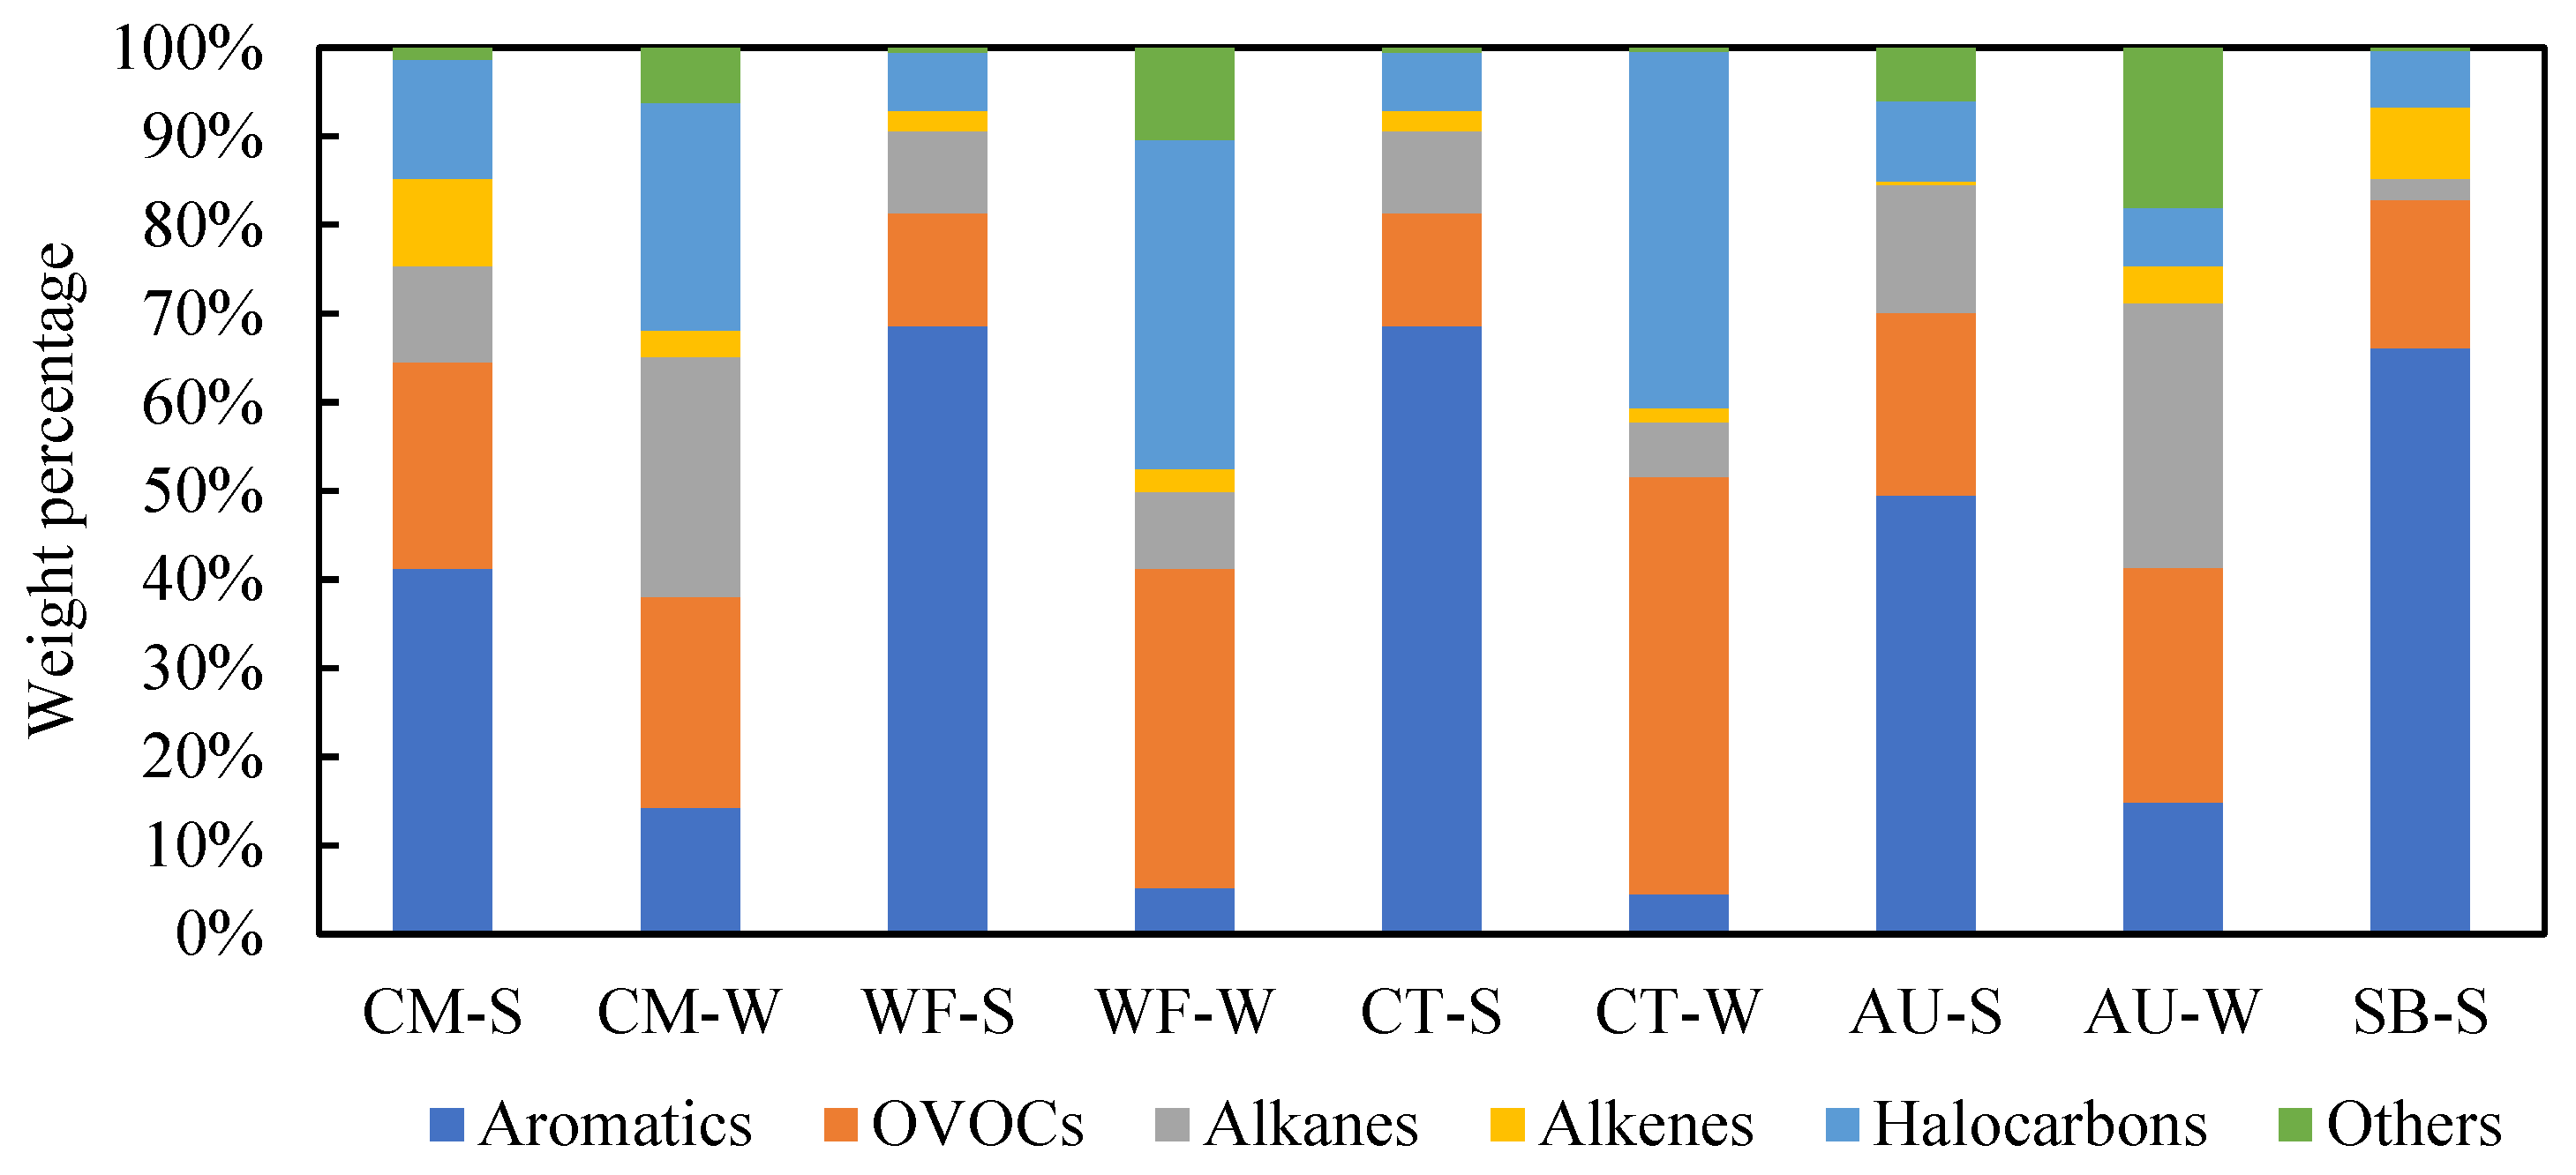
3.1.2. Sector-Based VOCs Source Profiles and OFP

VOCs species in the surface-coating industries differed from each other due to the complex coating types. Figure 2 illustrates the chemical compositions of VOCs in five industrial coating sectors. The source profiles showed that the aromatics in the five industries accounted for 41.2–61.6%, followed by OVOCs accounting for 12.7–26.5% for solvent-based coatings. OVOCs (23.8–47.0%) were the largest group for water-based coatings in general, followed by halocarbons (6.6–40.3%) and alkanes (6.2–29.8%). The proportion of aromatics emitted from water-based coatings was 44.2% lower than those from solvent-based coatings, while the proportion of OVOCs was 11.6% higher than the solvent-based coatings.
In terms of solvent-based coatings, the proportions of aromatics in the shipbuilding (66.1%) and furniture (68.6%) manufacturing industries were much higher than those in the engineering machinery industry (41.4%) and auto-painting industry (49.5%). In terms of water-based coatings, the proportions of aromatics were below 15% in five industrial coating sectors, while the proportions of OVOCs were between 23.8% and 47.0%. As halocarbons were used as solvents and cleaning agents in the coating process, the halocarbons contributed 9.1% and 24.5% for solvent-based coatings and water-based coatings, respectively.
Table 3 shows the emission characteristics of speciated VOCs from different kinds of industrial coating sources and their comparison with other studies. Compared with previous studies, which were sampled during 2013–2017 [11,16], the proportion of aromatics for solvent-based coatings in shipbuilding, metal products, and auto manufacturing has decreased by 16.4–26.0%. With the development of coating technology, esters, ketones, and other substances in solvent-based coatings have replaced benzene homologues as better substitutes, resulting in a significant reduction in the emission of aromatics. However, the chemical compositions for furniture manufacturing were basically the same as before.
Table 4 lists the proportions of the main VOCs species and chemical groups contributing to VOCs emissions and OFP for both solvent-based coatings and water-based coatings. The top 10 species with regard to VOCs mass concentration in water-based coatings and solvent-based coatings accounted for 73.6% and 58.6% of the total emissions, respectively. Seven of the top 10 species in solvent-based coatings were classified as benzene homologues, and m/p-xylene was the top specie which accounted for 19.7%. The top 6 species in water-based coatings were classified as halocarbons and OVOCs. The compositional difference for water-based coatings was fairly large compared with solvent-based coatings.
In terms of solvent-based coatings, aromatics accounted for the majority of total OFP (87.1%). Aromatics, alkenes, and OVOCs were identified as the main contributors, accounting for 54.0%, 20.3%, and 12.8% of the total OFP in water-based coatings, respectively. The top 10 OFP-contributing species in water-based coatings and solvent-based coatings accounted for 88.7% and 64.9% of the total OFP, respectively. Among them, eight of the top ten species in solvent-based coatings were classified as benzene homologues, and m/p-xylene accounted for 36.0% of the total OFP, which was much higher than other species.

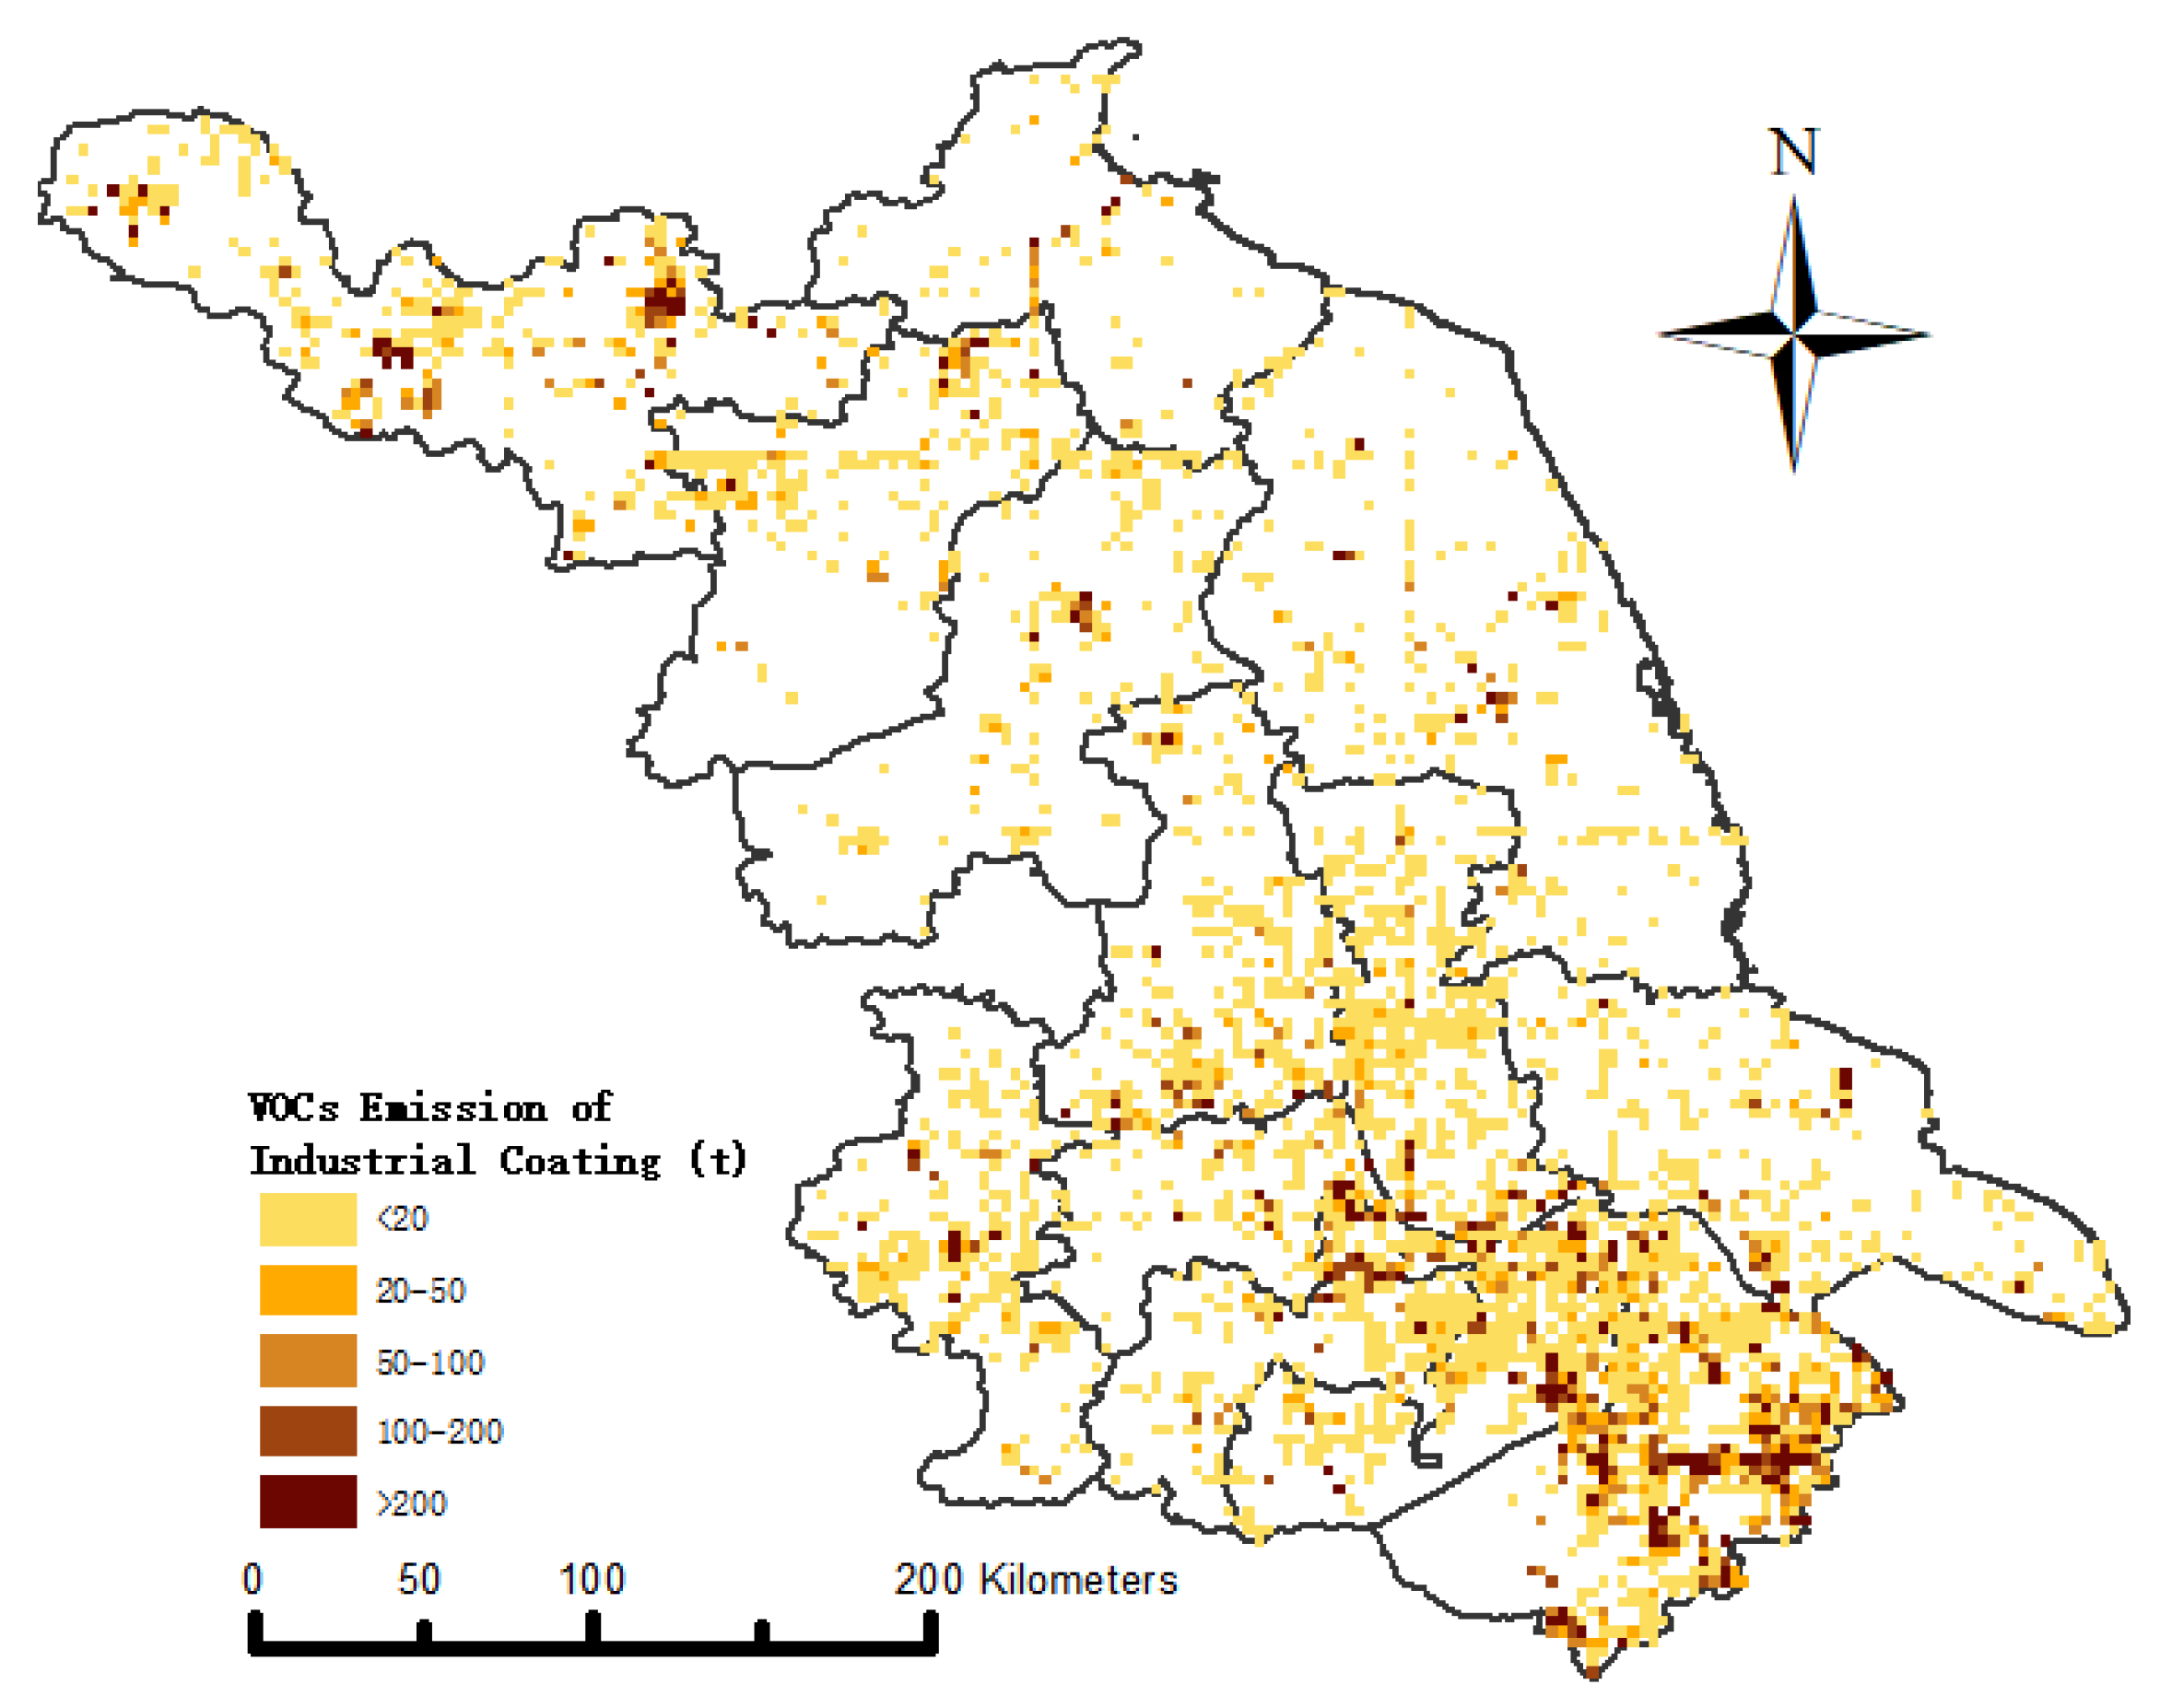
3.2. Emission Inventory

3.2.1. Source Contributions

Table 5 shows the paint consumption and emission contributions from industrial sector sources. The emissions were mainly affected by the types and consumption of the coatings. The substitution ratios of water-based coatings were below 40% in most coating processes, except for the container manufacturing industry, which reached 92%. The solvent-based coatings contributed 74% of Jiangsu’s total industrial coating consumption in 2020. The total VOCs emissions from the industrial coating process in Jiangsu Province for the year 2020 were about 134 Gg, in which the solvent-based coating sources contributed the majority of total VOCs emissions (79.6%).
The highest VOCs emissions came from the shipbuilding and electronic product manufacturing industries, which contributed 17.3% and 16.6%, respectively. For plastic parts and shipbuilding manufacturing, the water-based coating technology was not yet mature, with the substitution proportion being about 5–7%, resulting in high VOCs emissions. The contribution of the container manufacturing was significantly lower than other industries, accounting for only 5%. The auto manufacturing industry had almost fully used water-based coatings, while solvent-based coatings still accounted for more than 80% of coatings in the auto parts manufacturing industry. The construction machinery manufacturing industry mainly adopts high-solid or water-based coatings as an alternative, accounting for about 20%. Emissions emitted from the auto and construction machinery manufacturing industries both contributed 14.3% of the total VOCs emissions.
Emissions from industrial coating sources were allocated based on their geographical coordinates (Figure 3). From the perspective of regional distribution, VOCs emissions from the industrial coating industry were concentrated in five cities in southern Jiangsu (Nanjing, Suzhou, Zhenjiang, Changzhou, and Wuxi) and Xuzhou, accounting for 77% of the province’s emissions. Suzhou has the highest VOCs emissions, accounting for 35% of the total emissions.
The uncertainty of VOCs emission inventories was due mainly to insufficient representativeness and the lack of activity data, emission factors, and source profiles. The activity-level data used in this study were mainly obtained from a large number of sample surveys. Since the VOCs emission factor was a complex coefficient, this study focused mainly on the actually measured results from typical enterprises. However, due to the differences in coating technologies, production processes, and types of used solvents, emission factors varied among plants even under the same sector. The removal efficiency of treatment facilities was also characterized by great uncertainty, which has a certain impact on emission estimation.

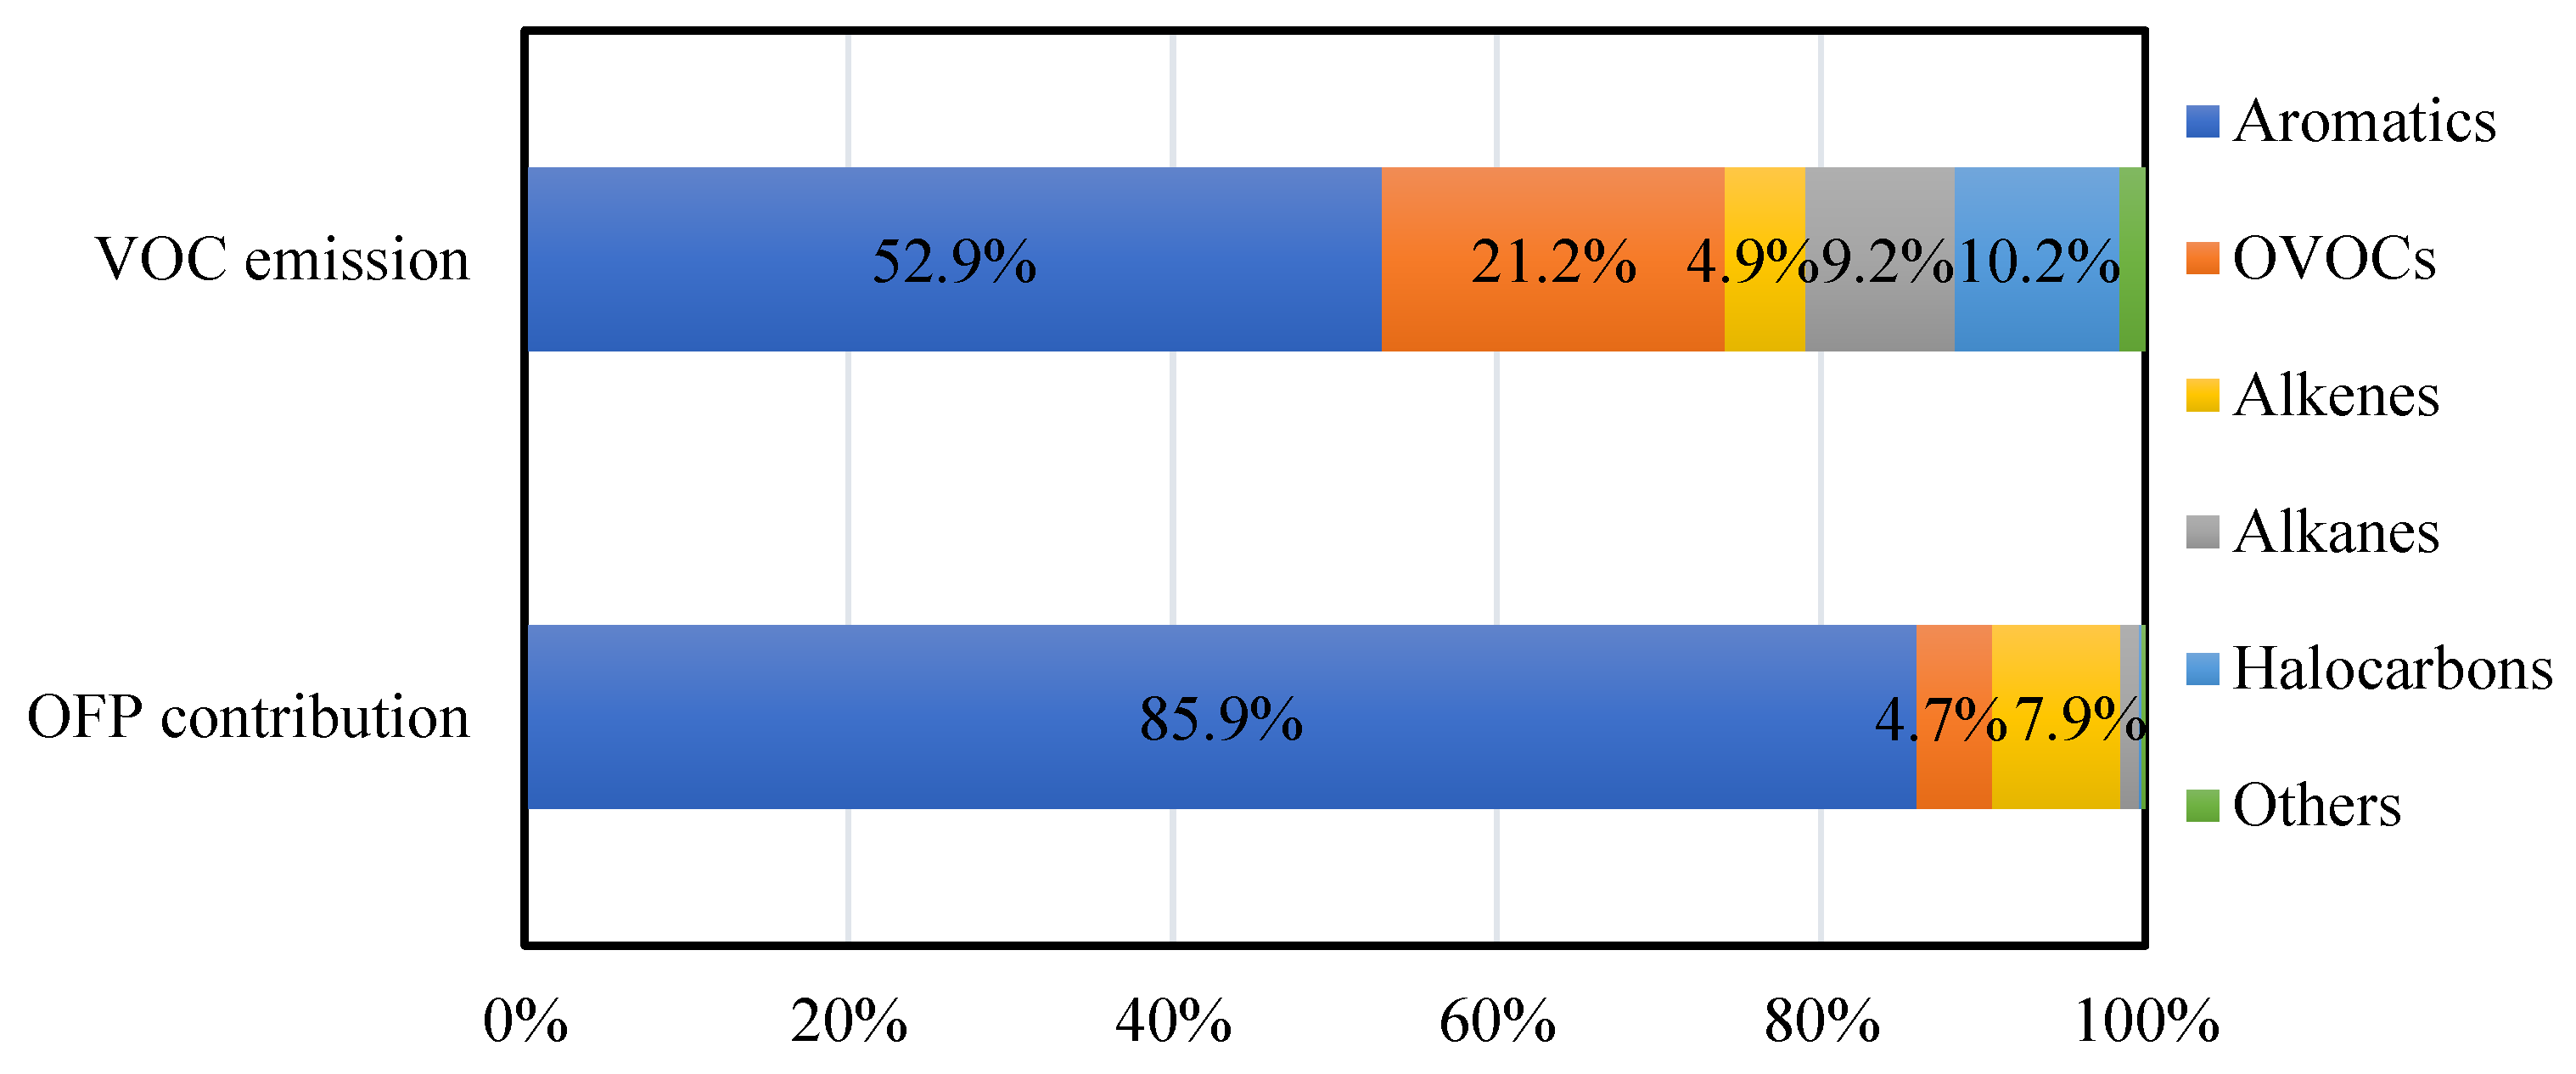
3.2.2. Characteristics of VOCs Species and OFP

Figure 4 illustrates the speciated VOCs emissions and their OFP from industrial surface-coating sources in Jiangsu province for the year 2020. Aromatics contributed 52.9% of the total VOCs emissions. OVOCs, alkanes and alkenes accounted for 21.2%, 9.2%, and 4.9%, respectively. M/p-xylene (17.5%), ethyl benzene (6.8%), ethyl acetate (6.6%), o-xylene (6.0%), and 1,2,4-trimethylbenzene (5.3%) were the top 5 contributing species. OFP-based contributions of VOCs groups were different from their emission-based contributions. Aromatics contributed 85.9% of the total OFP, which were much higher than their corresponding emission-based contributions. OVOCs and alkenes accounted for 7.9% and 4.7%, respectively. M/p-xylene (35.5%), 1,2,4-trimethylbenzene (18.9%), 1,2,3-trimethylbenzene (9.2%), o-xylene (8.0%), and 1,3,5-trimethylbenzene (3.6%) were the top five contributing species in OFP.

3.3. Scenarios of Emission Reduction

3.3.1. Scenario Settings

Combined with future economic development, as well as the implementation of policies and upgrade of control technologies, four scenarios (scenarios A, B, C, and D) were set up to predict VOCs emissions of the surface-coating industry for the years 2025 and 2030, respectively. Scenario A was a benchmark scenario considering the development of socio-economic and pollution control policies being maintained at the current level. Scenario B was a coating substitution scenario, where the substitution of low-VOCs content coatings (such as water-based coatings and solvent-free coatings) increased dramatically, while the development of end-of-pipe treatment technologies was constant. Scenario C was an end-of-pipe treatment scenario, where the best available control technologies were assumed to be implemented, while the substitution of low-VOCs content coatings was constant. Scenario D was a scenario considering maximum emission reduction potential, where every source made great efforts to control VOCs emissions, including coating substitution combined with end-of-pipe treatment measures. These four scenarios are described in detail in Table 6. The numbers for 2025 were set by the historical statistical data and the Pollution Control Plan [26] published in Jiangsu province, and the numbers for 2030 were set by the linear extrapolation of 2020 and 2025. All the parameter values were set based on the control technology economic and technical feasibility analysis results.

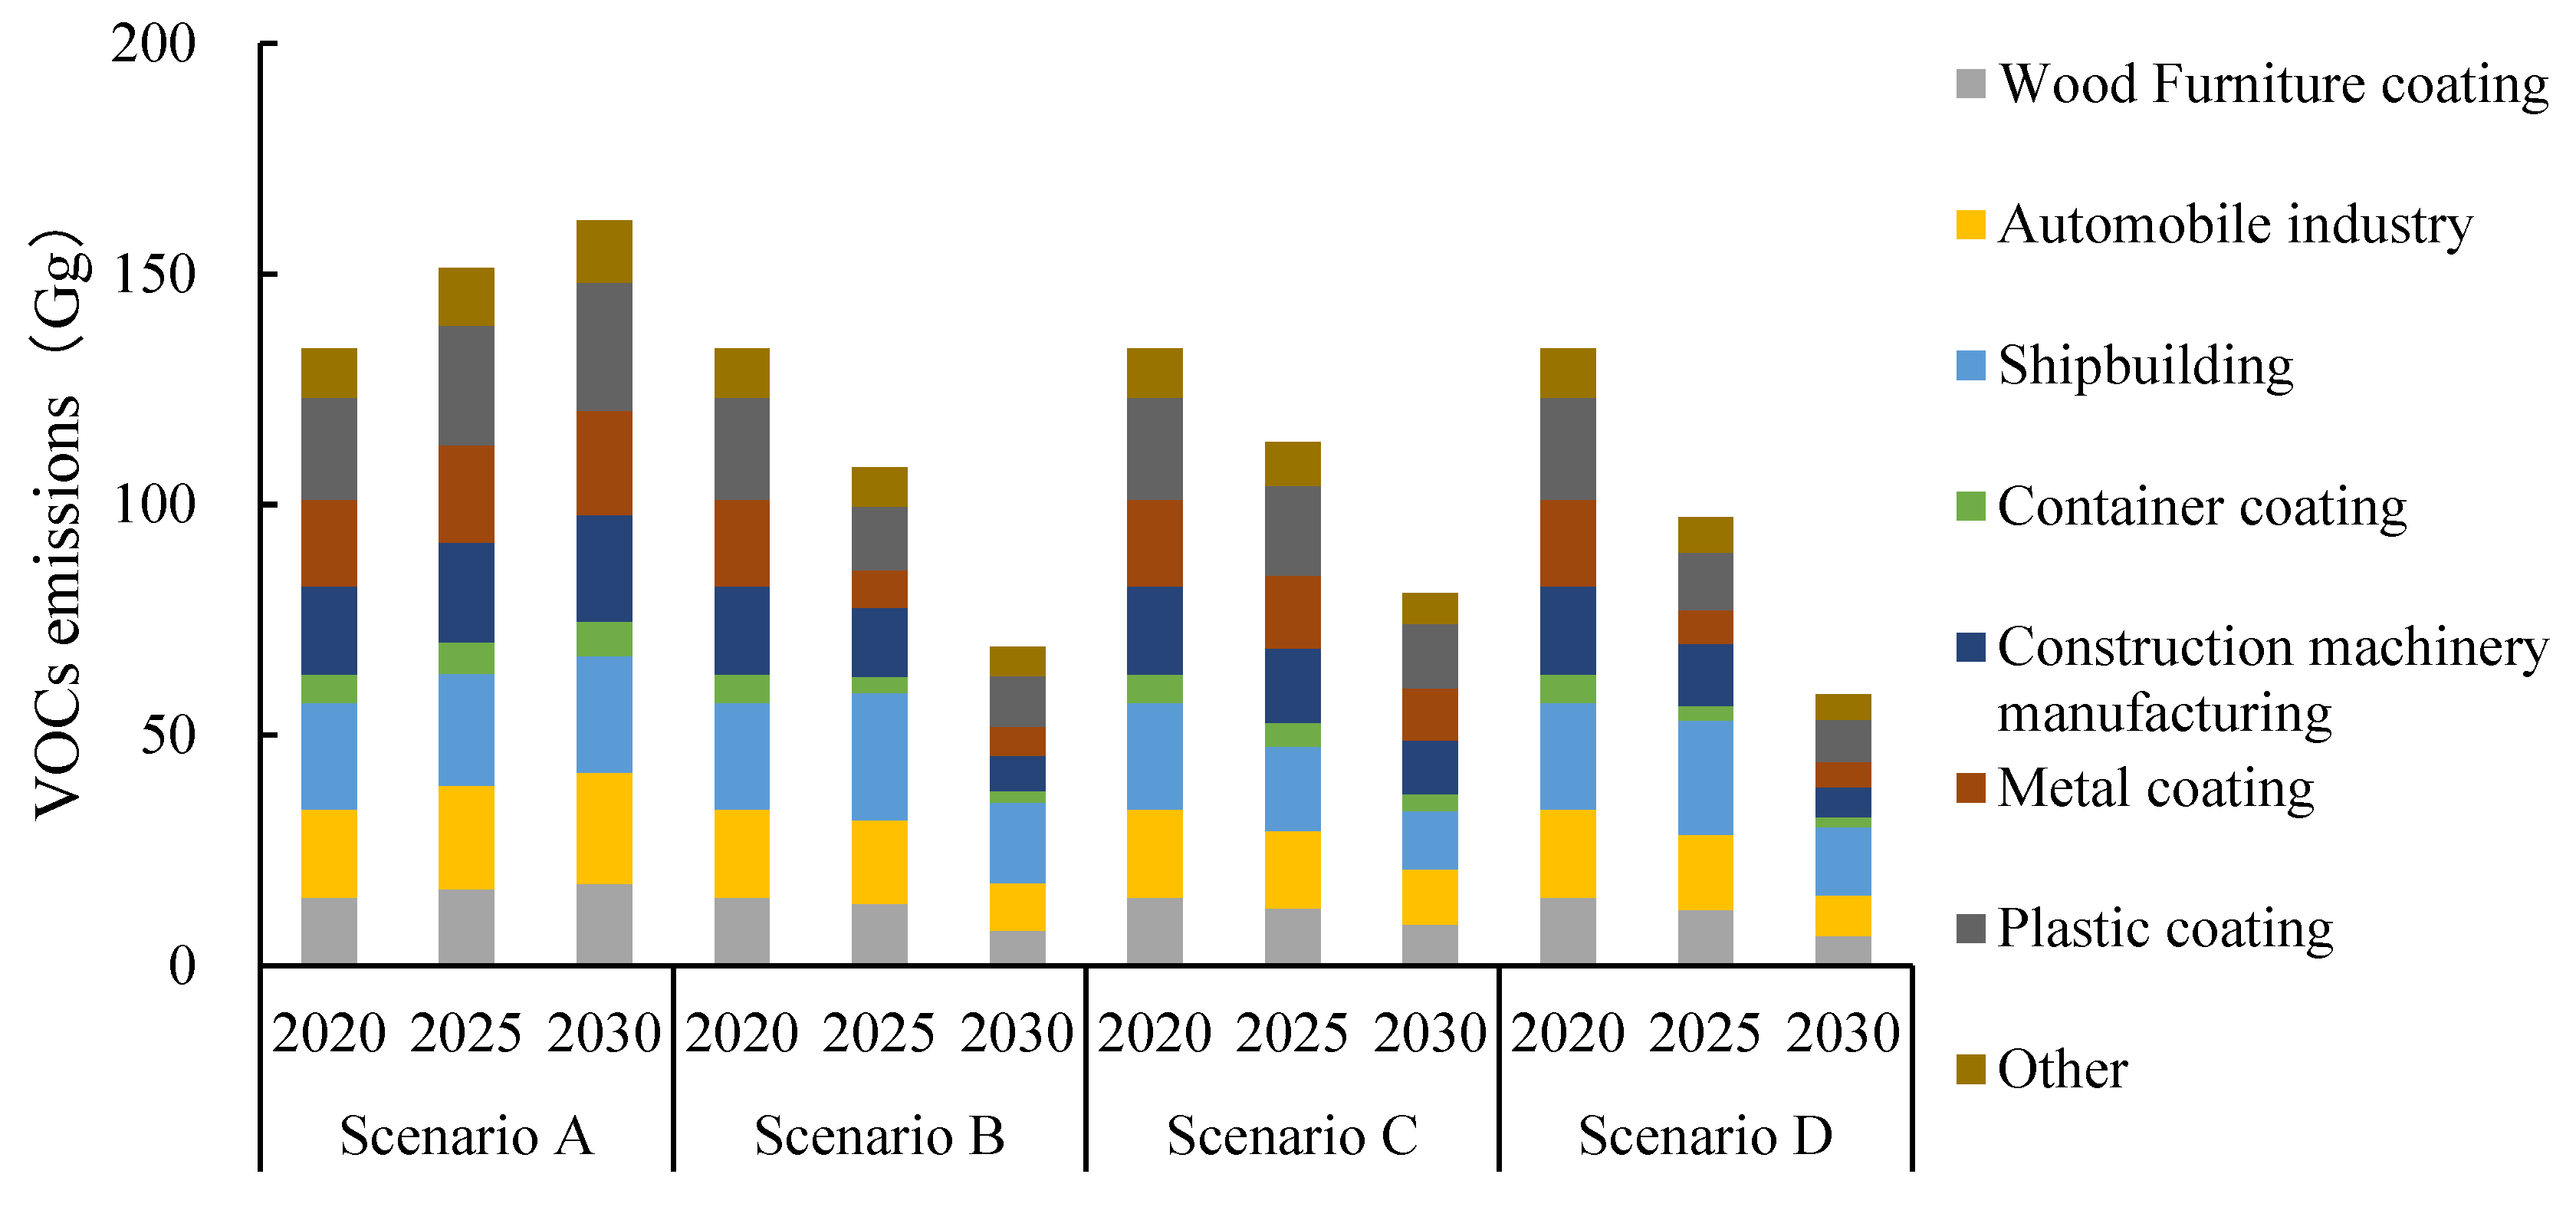
3.3.2. Scenario Predictions

Figure 5 shows the prediction results of emission reduction. The Ministry of Ecology and Environment of the PRC has issued a series of compulsory product quality standards since 2020, specifying the VOCs content limits for different kinds of coatings. After the implementation of such standards, the VOCs content in various kinds of coatings decreased by about 9–30%. By 2030, the substitution rate of low-VOCs content coatings was estimated to be greatly increased, while the emission reduction potential of end-of-pipe treatment technology would be gradually exhausted. For the benchmark scenario, as the socio-economic developed rapidly, the VOCs emission increased by 17.3 Gg and 27.6 Gg by 2025 and 2030, respectively. For scenario B, the substitution of low-VOCs content coatings could reach 35% in 2025 and 70% in 2030. The VOCs emission reduction amount could reach 25.9 Gg (19.4%) and 64.8 Gg (48.4%), respectively. For scenario C, the VOCs removal efficiency would exceed 40% in 2025 and 80% in 2030, and the amount of emission reduction would reach 20.5 Gg (15.3%) and 53.2 Gg (39.7%), respectively. The emission reduction rate of scenario B would be 4.0% and 8.7% higher than scenario C by 2025 and 2030, respectively. In terms of scenario D, the maximum emission reduction potential could reach 75.2 Gg, and the emission reduction proportion could reach 56.1% by 2030.

4. Conclusions

In order to investigate the impact of water-based coating substitution on VOCs emission characteristics for the surface-coating industries and policy effectiveness, this study conducted field measurements to build VOCs emission factors and source profiles of surface-coating industries in Jiangsu Province. The VOCs content in water-based coatings was 50.8% of solvent-based coatings on average. The emission factors of solvent-based coatings varied at a relatively narrow range from 0.40 to 0.51 kg kg−1, while the water-based coatings ranged from 0.14 to 0.24 kg kg−1. Compared to solvent-based coatings, the proportion of aromatics emitted from water-based coatings was 44.2% lower, and the proportion of oxygenated hydrocarbons was 11.6% higher. The compositional difference for the water-based coatings is fairly large compared with solvent-based coatings. The VOCs emission from the industrial coating industries in Jiangsu Province were about 134 Gg in 2020. By 2030, the emission reduction rate generated from adopting low-VOCs content coatings would be 4.0% and 8.7% higher than the rate from end-of-pipe treatment measures by 2025 and 2030, respectively. The maximum emission reduction from the industrial coatings could reach 75.2 Gg, and the reduction rate could reach 56.1% compared to 2020.

Author Contributions

Conceptualization, S.X. and Q.Z.; methodology, S.X. and J.J.; data curation, L.C. and Q.L.; formal analysis, Y.Y.; investigation, L.C.; resources, Y.Y.; writing—original draft preparation, Y.Y. and L.C.; writing—review and editing, S.X. and R.W. All authors have read and agreed to the published version of the manuscript.

Funding

This research was funded by Jiangsu Provincial Fund on PM2.5 and O3 pollution mitigation (No. 2019023), Ecological Environment Research Project of Jiangsu province (NO. 2022018, NO. 2022011).

Institutional Review Board Statement

Not applicable.

Informed Consent Statement

Not applicable.

Data Availability Statement

Data available on request from the authors.

Conflicts of Interest

The authors declare no conflict of interest.

References

  1. Zheng, J.J.; Jiang, P.; Qiao, W.; Zhu, Y.; Kennedy, E. Analysis of air pollution reduction and climate change mitigation in the industry sector of Yangtze River Delta in China. J. Clean. Prod. 2016, 114, 314–322. [Google Scholar] [CrossRef]
  2. Zhang, S.J.; Wu, Y.; Zhao, B.; Wu, X.M.; Shu, J.W.; Hao, J.M. City-specific vehicle emission control strategies to achieve stringent emission reduction targets in China’s Yangtze River Delta region. J. Environ. Sci. 2017, 51, 75–87. [Google Scholar] [CrossRef] [PubMed]
  3. Zhao, Q.; Bi, J.; Liu, Q.; Ling, Z.; Shen, G.; Chen, F.; Qiao, Y.; Li, C.; Ma, Z. Sources of volatile organic compounds and policy implications for regional ozone pollution control in an urban location of Nanjing, East China. Atmos. Chem. Phys. 2020, 20, 3905–3919. [Google Scholar] [CrossRef] [Green Version]
  4. Wang, T.Y.; Huang, X.; Wang, Z.L.; Liu, Y.L.; Zhou, D.R.; Ding, K.; Wang, H.Y.; Qi, X.M.; Ding, A.J. Secondary aerosol formation and its linkage with synoptic conditions during winter haze pollution over eastern China. Sci. Total Environ. 2020, 730, 138888. [Google Scholar] [CrossRef] [PubMed]
  5. Xu, Z.; Huang, X.; Nie, W.; Chi, X.G.; Xu, Z.; Zheng, L.; Zheng, L.F.; Sun, P.; Ding, A.J. Influence of synoptic condition and holiday effects on VOCs and ozone production in the Yangtze River Delta region, China. Atmos. Environ. 2017, 168, 112–124. [Google Scholar] [CrossRef]
  6. Wang, P.; Ying, Q.; Zhang, H.L.; Hu, J.L.; Lin, Y.C.; Mao, H.J. Source apportionment of secondary organic aerosol in China using a regional source-oriented chemical transport model and two emission inventories. Environ. Pollut. 2018, 237, 756–766. [Google Scholar] [CrossRef] [PubMed]
  7. Li, Z.; Zhou, R.; Li, Y.; Chen, M.; Wang, Y.; Huang, T.; Yi, Y.; Hou, Z.; Meng, J.; Yan, L. Characteristics and Sources of Organic Aerosol Markers in PM2.5. Aerosol Air Qual. Res. 2021, 21, 210180. [Google Scholar] [CrossRef]
  8. Ou, J.M.; Yuan, Z.B.; Zheng, J.Y.; Huang, Z.J.; Shao, M.; Li, Z.K.; Huang, X.B.; Guo, H.; Louie, P.K.K. Ambient ozone control in a photochemically active region: Short term despiking or long-term attainment? Environ. Sci. Technol. 2016, 50, 5720–5728. [Google Scholar] [CrossRef] [PubMed]
  9. Xu, J.W.; Huang, X.; Wang, N.; Li, Y.Y.; Ding, A.J. Understanding ozone pollution in the Yangtze River Delta of eastern China from the perspective of diurnal cycles. Sci. Total Environ. 2020, 752, 141928. [Google Scholar] [CrossRef] [PubMed]
  10. Wang, R.P.; Wang, X.Q.; Cheng, S.Y.; Cheng, L.; Cai, B.; Shen, Z.Y. Influence of end-of-pipe treatment on VOCs emission in industrial coating industries. China Environ. Sci. 2022, 42, 593–600. (In Chinese) [Google Scholar]
  11. Huang, C.; Chen, C.H.; Li, L.; Cheng, Z.; Wang, H.L.; Huang, H.Y.; Streets, D.G.; Wang, Y.J.; Zhang, G.F.; Chen, Y.R. Emission Inventory of Anthropogenic air Pollutants and VOC Species in the Yangtze River Delta Region, China. Atmos. Chem. Phys. 2011, 11, 4105–4120. [Google Scholar] [CrossRef] [Green Version]
  12. An, J.Y.; Huang, Y.W.; Huang, C.; Wang, X.; Yan, R.S.; Wang, Q.; Wang, H.L.; Jing, S.A.; Zhang, Y.; Liu, Y.M.; et al. Emission inventory of air pollutants and chemical speciation for specific anthropogenic sources based on local measurements in the Yangtze River Delta region, China. Atmos. Chem. Phys. 2021, 21, 2003–2025. [Google Scholar] [CrossRef]
  13. Li, L.; An, J.Y.; Huang, L.; Yan, R.S.; Huang, C.; Yarwood, G. Ozone source apportionment over the Yangtze River Delta region, China: Investigation of regional transport, sectoral contributions and seasonal differences. Atmos. Environ. 2019, 202, 269–280. [Google Scholar] [CrossRef]
  14. Cheng, K.; Hao, W.W.; Yi, P.; Zhang, Y.; Zhang, J.Y. Volatile Organic Compounds Emission from Chinese Wood Furniture Coating Industry: Activity-based Emission Factor, Speciation Profiles, and Provincial Emission Inventory. Aerosol Air Qual. Res. 2018, 18, 2813–2825. [Google Scholar] [CrossRef] [Green Version]
  15. Wu, R.R.; Xie, S.D. Spatial distribution of ozone formation in China derived from emissions of speciated volatile organic compounds. Environ. Sci. Technol. 2018, 52, 8146–8156. [Google Scholar] [CrossRef] [PubMed]
  16. Zhong, Z.M.; Sha, Q.E.; Zheng, J.Y.; Yuan, Z.B.; Gao, Z.J.; Ou, J.M.; Zheng, Z.Y.; Li, C.; Huang, Z.J. Sector-based VOCs emission factors and source profiles for the surface coating industry in the Pearl River Delta region of China. Sci. Total Environ. 2017, 583, 19–28. [Google Scholar] [CrossRef] [PubMed]
  17. Zheng, C.; Shen, J.; Zhang, Y.; Huang, W.; Zhu, X.; Wu, X.; Chen, L.; Gao, X.; Cen, K. Quantitative assessment of industrial VOC emissions in China: Historical trend, spatial distribution, uncertainties, and projection. Atmos. Environ. 2017, 150, 116–125. [Google Scholar] [CrossRef]
  18. Liu, J. China Coating Industrial Annual 2021; China Paint Industry Association: Beijing, China, 2022; pp. 207–208. [Google Scholar]
  19. United States Environmental Protection Agency (US EPA). Compendium Method TO-15 Determination of Volatile Organic Compounds (VOCs) in Air Collected in Specially-Prepared Canisters and Analyzed by GC/MS. 1999. Available online: https://19january2017snapshot.epa.gov/homeland-security-research/epa-air-method-toxic-organics-15-15-determination-volatile-organic_.html (accessed on 1 August 2018).
  20. He, K.B. (Ed.) Guidebook of Air Pollutant Emission Inventory Development for Chinese Cities; Ministry of Environmental Protection (MEP), P.R. of China: Beijing, China, 2018; pp. 141–142. (In Chinese)
  21. Carter, W.P.L. Development of the SAPRC-07 chemical mechanism. Atmos. Environ. 2010, 44, 5324–5335. [Google Scholar] [CrossRef]
  22. GB 38469; Limit of Harmful Substances of Marine Coatings. Ministry of Industry and Information Technology, P.R. of China: Beijing, China, 2019.
  23. GB 18581; Limit of Harmful Substances of Woodware Coating. Ministry of Industry and Information Technology, P.R. of China: Beijing, China, 2020.
  24. GB 24409; Limit of Harmful Substances of Vehicle Coatings. Ministry of Industry and Information Technology, P.R. of China: Beijing, China, 2020.
  25. GB 30981; Limit of Harmful Substances of Industrial Protective Coatings. Ministry of Industry and Information Technology, P.R. of China: Beijing, China, 2020.
  26. Jiangsu Provincial Department of Ecological Environment. Implementation Plan to Deeply Combat Heavy Polluted Weather Elimination, Ozone Pollution Prevention and Control, and Diesel Truck Pollution Control for Jiangsu Province; Jiangsu Provincial Department of Ecological Environment: Nanjing, China, 2023. [Google Scholar]
Figure 1. Distribution of VOCs content in solvent-based (a) and water-based (b) coating samples.
Atmosphere 14 00662 g001
Figure 2. VOCs chemical compositions of nine industrial coating sub-sectors (note: CM: construction machinery coating; WF: wood furniture coating; CT: container coating; AU: automobile coating; SB: shipbuilding coating; -S: solvent-based; -W: water-based).
Atmosphere 14 00662 g002
Figure 3. Spatial distributions of VOCs emissions for the surface-coating industries from point sources in Jiangsu Province for the year of 2020.
Atmosphere 14 00662 g003
Figure 4. Speciated characteristics of VOCs emissions and OFP of the surface-coating industries in Jiangsu for the year of 2020.
Atmosphere 14 00662 g004
Figure 5. VOCs emissions of the surface-coating industries under different reduction scenarios from 2020 to 2030.
Atmosphere 14 00662 g005
Table 1. Number of samples collected at different source sectors for the localization of VOCs emission factors and source profiles.
SourcesSub-SectorsNO. of Samples for VOCs Content TestingNO. of Samples for Source Profiles Establishing
Furniture manufacturingSolvent-based905
Water-based204
Auto manufacturingSolvent-based3012
Water-based116
ShipbuildingSolvent-based139
Water-based176
Container manufacturingSolvent-based292
Water-based3012
Construction machinery manufacturingSolvent-based245
Water-based165
Total28066
Table 2. The measured VOCs content and the localized uncontrolled VOCs emission factors for different kinds of industrial coating sources.
SourcesSub-SectorsVOCs Content (g L−1)Emission Factor (kg kg−1)
RangeAveraged
Furniture manufacturingSolvent-based378~757606 ± 65.90.51
Water-based155~372243 ± 52.10.20
Auto manufacturingSolvent-based438~838590 ± 132.60.49
Water-based248~468393 ± 65.60.14
ShipbuildingSolvent-based321~685532 ± 101.10.45
Water-based78~343223 ± 65.00.19
Container manufacturingSolvent-based245~589484 ± 80.50.40
Water-based47~345208 ± 84.40.17
Construction machinery manufacturingSolvent-based426~723532 ± 95.90.44
Water-based156~435293 ± 90.60.24
Table 3. VOCs chemical compositions of industrial coating sources and their comparison with other studies.
SourcesReferencesAromatics (%)OVOCs (%)Alkanes (%)Alkenes (%)Others (%)
Automobile manufacturing[16] a66.331.72.00.00.0
[12] b69.715.111.71.22.2
This study c49.520.514.40.415.1
Shipbuilding[16]92.26.50.70.00.7
[12]70.722.71.20.35.1
This study66.116.72.38.06.7
Furniture manufacturing[16]64.727.55.90.02.0
[12]87.10.07.70.74.5
This study68.612.79.32.27.1
Construction machinery manufacturing[16]62.120.913.02.02.0
[12]76.510.32.93.46.9
This study41.223.310.99.914.7
a Zhong et al., (2017). Sampling period: from 2012 to 2016; b An et al., (2021). Sampling period: from 2013 to 2017; c This study. Sampling period: from 2021 to 2022.
Table 4. The proportions of main VOCs species and chemical groups contributing to VOCs emissions and OFP for solvent-based coatings and water-based coatings.
EmissionsOFP
VOCs SpeciesContributionsVOCs SpeciesContributions
Solvent-based coatingsM/p-xylene19.7% ± 0.165M/p-xylene36.0% ± 0.165
Ethylbenzene7.7% ± 0.0451,2,4-Trimethylbenzene19.2% ± 0.045
Ethyl acetate7.3% ± 0.0391,2,3-Trimethylbenzene9.6% ± 0.039
Ortho-xylene6.6% ± 0.054Ortho-xylene7.9% ± 0.054
1,2,4-Trimethylbenzene5.9% ± 0.0391,3,5-Trimethylbenzene3.5% ± 0.039
N-propylbenzene5.4% ± 0.066Ethylbenzene3.4% ± 0.066
Methylbenzene4.9% ± 0.039Propene3.2% ± 0.039
Propanone4.5% ± 0.029Methyl methacrylate2.2% ± 0.029
1,2,3-Trimethylbenzene3.3% ± 0.031Methylbenzene2.0% ± 0.031
Isopropanol3.1% ± 0.027N-propylbenzene1.7% ± 0.027
Total alkanes9.7% ± 0.039Total alkanes0.8% ± 0.039
Total alkenes5.0% ± 0.037Total alkenes7.8% ± 0.037
Total aromatics55.4% ± 0.113Total aromatics87.1% ± 0.113
Total OVOCs18.6% ± 0.042Total OVOCs4.1% ± 0.042
Others11.3% ± 0.049Others0.1% ± 0.049
Water-based coatingsPropanone9.9% ± 0.0321,2,4-Trimethylbenzene20.3% ± 0.013
Dichloromethane8.9% ± 0.059M/p-xylene8.4% ± 0.010
Dichloroethane8.5% ± 0.096Ortho-xylene6.8% ± 0.013
Isopropanol7.0% ± 0.0391,3,5-Trimethylbenzene5.7% ± 0.002
2-Butanone6.5% ± 0.042Ethene4.7% ± 0.009
Alcohol5.2% ± 0.0541,2,3-Trimethylbenzene4.3% ± 0.003
Propane4.2% ± 0.028Propene4.2% ± 0.003
Isopentane2.9% ± 0.0192-Butanone3.7% ± 0.042
Ethane2.9% ± 0.028Tetrahydrofuran3.6% ± 0.021
Isobutane2.6% ± 0.0111-Butene3.1% ± 0.001
Total alkanes21.1% ± 0.106Total alkanes7.5% ± 0.106
Total alkenes3.1% ± 0.009Total alkenes20.3% ± 0.009
Total aromatics11.2% ± 0.049Total aromatics54.0% ± 0.049
Total OVOCs30.2% ± 0.091Total OVOCs12.8% ± 0.091
Others34.5% ± 0.197Others4.0% ± 0.197
Table 5. The proportion of paint consumption and VOCs emissions of surface-coating industries in Jiangsu province in 2020.
SourcesProportion of Paint Consumption (%)Emission Inventory
Solvent-BasedWater-BasedOtherEmissions aPercentage
Furniture manufacturing78121014.711.0%
Auto manufacturing6331619.214.3%
Shipbuilding935223.217.3%
Container manufacturing89206.14.6%
Machinery manufacturing80101019.114.3%
Metal products8281018.714.0%
Electronic equipment857822.216.6%
Textiles955010.78.0%
Total74197133.9100.0%
a The unit for the emissions is Gg.
Table 6. The technology penetration of four scenarios in surface-coating industries for the years 2025 and 2030.
Control TechnologiesField2020Scenario AScenario BScenario CScenario D
20252030202520302025203020252030
Substitution of Coatings with low VOCs contentSubstitution proportion (%) in technically mature fields (furniture manufacturing, construction machinery manufacturing, etc.)22%30%50%40%80%30%50%40%80%
Substitution proportion (%) in technically immature fields (plastic parts spraying, shipbuilding, etc.)5%10%15%20%40%10%15%20%40%
Application of end-pipe treatment technologyApplication proportion (%) of simple and low-efficiency treatment technology80%60%30%60%30%40%15%40%15%
Application proportion (%) of high-efficiency treatment technology (enterprises outside the substitution)15%25%50%25%50%40%75%40%75%
Disclaimer/Publisher’s Note: The statements, opinions and data contained in all publications are solely those of the individual author(s) and contributor(s) and not of MDPI and/or the editor(s). MDPI and/or the editor(s) disclaim responsibility for any injury to people or property resulting from any ideas, methods, instructions or products referred to in the content.

