Article

Size-Segregated Characteristics of Organic Carbon (OC) and Elemental Carbon (EC) in Marine Aerosol in the Northeastern South China Sea

1
School of Economics and Management, Taiyuan University of Technology, Taiyuan 030024, China
2
State Key Laboratory of Organic Geochemistry and Guangdong Provincial Key Laboratory of Environmental Protection and Resources Utilization, Guangzhou Institute of Geochemistry, Chinese Academy of Sciences (CAS), Guangzhou 510640, China
3
College of Ecology and Environment, Xinjiang University, Urumqi 830017, China
4
South China Sea Institute of Oceanology, Chinese Academy of Sciences, Guangzhou 510301, China
5
Chinese Academy of Sciences (CAS) Center for Excellence in Deep Earth Science, Guangzhou 510640, China
6
Guangdong-Hong Kong-Macao Joint Laboratory for Environmental Pollution and Control, Guangzhou Institute of Geochemistry, Chinese Academy of Sciences (CAS), Guangzhou 510640, China
7
School of Industry and Information Technology of Shanxi Province, Jinzhong 030600, China
*
Author to whom correspondence should be addressed.
Atmosphere 2023, 14(4), 661; https://doi.org/10.3390/atmos14040661
Submission received: 16 February 2023 / Revised: 24 March 2023 / Accepted: 30 March 2023 / Published: 31 March 2023
(This article belongs to the Section Aerosols)

Abstract

:
Organic carbon (OC) and elemental carbon (EC) size-segregated characteristics were analyzed at the junction of sea and land (JSL) and the marine aerosol during the navigation along the northeastern South China Sea (NSCS), including the shallow ocean (NSCS-SO) and the remote ocean (NSCS-RO), from 3 to 20 March 2016. More than 90% of the OC and EC were concentrated in fine particles, and the OC and EC mean concentrations were 10.1 ± 0.63 and 3.44 ± 0.82, 2.67 ± 1.27 and 0.72 ± 0.36, and 1.41 ± 0.50 and 0.40 ± 0.28 μg m−3 in PM3.0 at the JSL, NSCS-SO, and NSCS-RO, respectively. Approximately 75–83% of OC and 84–98% of EC were found in PM1.5. Three sampling sites showed similar OC mass size distributions that had a dominant peak in the 0.49–0.95 μm size range. The mass mean diameters (MMDs) of OC were 0.65 ± 0.15 and 0.59 ± 0.16 μm at the NSCS-SO and NSCS-RO, respectively, followed by 0.53 ± 0.25 μm in fine particles at the JSL. Similar characteristics were found for EC MMDs. Each particle-size bin had OC concentrations that were higher than the EC values of all three sites, and the OC/EC mass ratios were generally more than 2.0. The mean secondary organic carbon (SOC) concentrations in PM1.5 were as follows: JSL (5.42 ± 1.35 μg m−3) > NSCS-SO (1.08 ± 1.02 μg m−3) > NSCS-RO (0.38 ± 0.25 μg m−3), indicating that the contribution of secondary carbonaceous aerosols to organic carbon is relatively low in the remote ocean region.

1. Introduction

Atmospheric aerosols have a significant impact on atmospheric visibility, atmospheric chemical processes, climate change and human health [1]. Carbonaceous aerosols are a key factor in triggering air pollution and climate change [2]. They are an important component of atmospheric particles, and account for about 20–50% of the fine particles in the atmosphere [3]. Carbonaceous aerosols are chemically divided into elemental carbon (EC) and organic carbon (OC) [4]. OC is a mixture of organic compounds, including aromatic, aliphatic, acids, and other organic compounds, some of which are carcinogenic and cause great harm to human health increasing morbidity and mortality [5]. At the same time, organic compounds have strong reactivity and oxidation, which are the basis of atmospheric photochemical reactions. EC is a combination of particles that resemble graphite and serves as a reaction interface for physical and chemical processes in the atmosphere [2]. Additionally, EC has a strong absorption of visible light and infrared light, which is considered to be one of the main substances that cause global warming and have an impact on atmospheric visibility [6]. While OC is not just emitted from primary emissions but can also be formed by secondary organic aerosol (SOA) generation, such as generated by gaseous precursors through atmospheric photochemical reactions [7], EC is a major pollutant that is directly emitted from combustion processes such as biomass burning and fossil fuel combustion [8]. Contini et al. [9] summarized the recent advances in the characterization of carbonaceous aerosols in the atmosphere.
In recent decades, the research on carbonaceous aerosols has mainly focused on concentration characteristics [5,8,10,11], particle mass size distribution [2,12,13,14,15], light absorption properties [16], and source apportionment [17,18]. Among these, knowledge of the particle mass size distribution is useful for comprehending the origin, growth, and removal mechanisms of carbonaceous aerosols. For example, the OC and EC size distributions showed obvious spatiotemporal distribution difference among urban and rural sites in four seasons, and the Beijing-Tianjin-Hebei region has the largest peaks of OC and EC in the fine particles during winter [2]. OC and EC in particles emitted from ships were concentrated in fine particles with an aerodynamic diameter (Dp) of less than 1.1 μm [12]. The major contribution of the carbonaceous compounds is found in the sub-micron mode in the Mediterranean coastal zone [19]. In the marine boundary layer of the Eastern Mediterranean, OC and EC presented high concentrations for coarse particles in spring, which was related to the occurrence of dust events [20].
Marine aerosols are not only influenced by natural sources, such as sea salt, marine halogens, and dimethyl sulfide, but also anthropogenic emissions [21], such as ship emissions, as well as aerosols from terrestrial sources by long-range transport [22,23]. Carbonaceous fractions in TSP over the western South China Sea (SCS) mainly originated from biomass burning [24]. In the offshore islands close to the northwest coast of the Taiwan Strait, OC in marine fine particles was always higher than EC, and the OC/EC mass ratios were larger than 2, suggesting that PM2.5 may be aged particles [25].
Despite these findings, there are few measurements of size-segregated carbonaceous aerosols over the northern South China Sea. To study this issue, we designed a marine cruise over the northern South China Sea. This study measured the size-segregated particulate OC and EC in the northern South China Sea, aiming to determine the OC and EC concentration and elucidate the OC and EC mass size distribution.

2. Materials and Methods

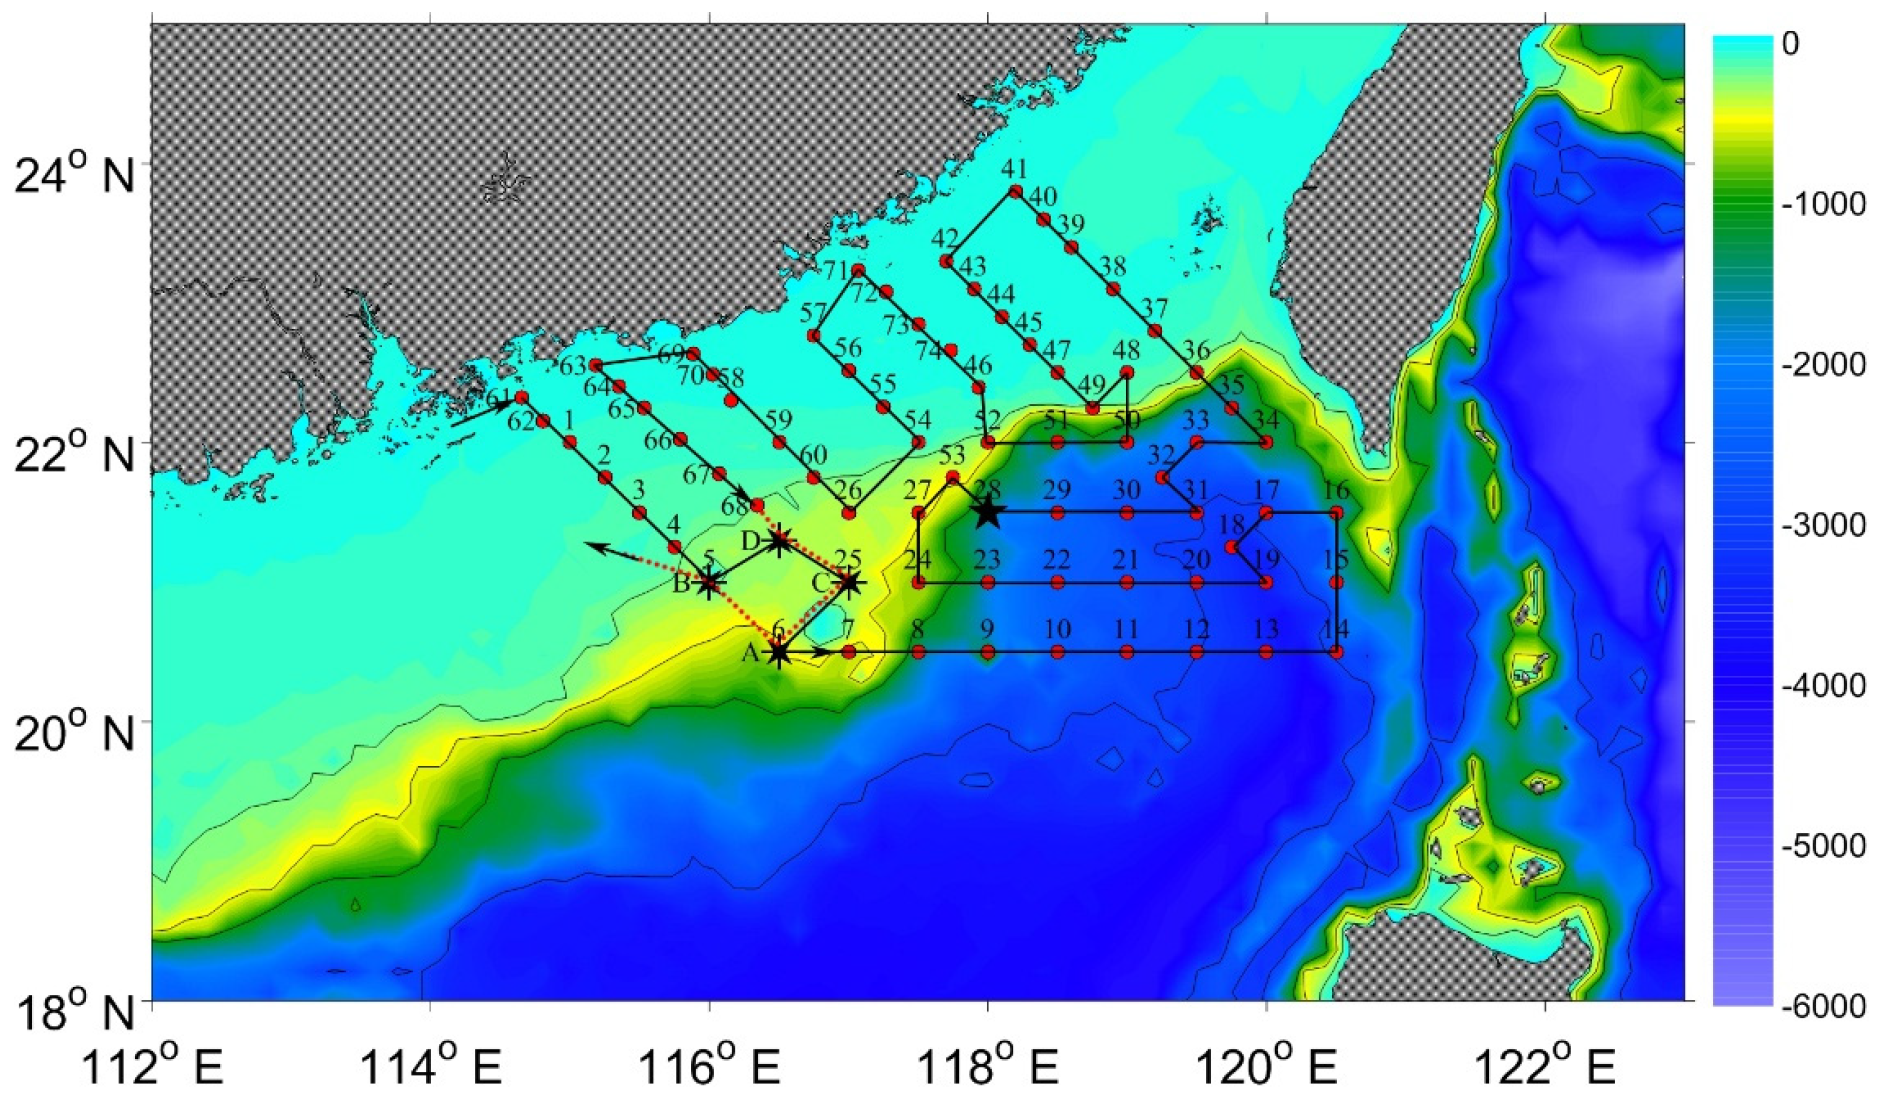
2.1. Sample Collection

The field study was carried out on a cruise campaign during 3–20 March 2016, in the northeastern South China Sea. On the upper deck of the research vessel (R/V) Shiyan III (~10 m above the sea surface), a size-selective inlet high volume cascade impactor-equipped Andersen PM10 sampler (Model SA235, Andersen Instruments Inc., New York, NY, USA) was placed for collecting atmospheric particles. The sampler was operated at a flow rate of 1.13 m3 min−1. To avoid pollution from the research vessel exhaust, sampling was conducted during navigation, and the sampling duration was about 15~20 h for each sample. A total of 12 sets of size-segregated particulate samples (<0.49, 0.49–0.95, 0.95–1.5, 1.5–3.0, 3.0–7.2, and 7.2–10.0 μm) were collected. Among them, three sets of samples were collected at the entrance to the sea, that is, the junction of sea and land (JSL), and the other nine sets of samples were collected during the navigation along the northeastern South China Sea (NSCS). Among them, five sets of samples were collected during navigation in the shallow ocean (NSCS-SO) and four sets of samples were collected during navigation in the remote ocean (NSCS-RO). JSL is close to the Pearl River Delta (PRD) region, and there are many ships around, so it could be affected by urban and ship emissions. NSCS-RO is located in the deep-sea area, mainly marine aerosols. Although there are few biological activities, it might also be affected by long-distance transmission. Compared with deep-sea area, NSCS-SO area is rich in marine biological activities. In addition, NSCS-SO could be affected by urban areas(Figure 1).
The sampling filters were quartz fiber filters, and the filters with an area of 20.54 cm × 25.4 cm were used to collect particles with Dp < 0.49 μm, and the other five filters with an area of 13.2 cm × 14.8 cm were used to collect particles with other particle size segments. The filters were preheated at 500 °C for 4h before sampling. Foam plugs and diffusion denuders were not used because of the difficulties involved in applying them. The sampled filters were wrapped in aluminum foil sand stored at −10 °C prior to laboratory analysis. Prior to being weighed, the filters were balanced for 24 h in a chamber with a fixed temperature and relative humidity (T = 25 °C, RH = 50%).

2.2. Sample Analysis

A DRI Model 2015 multi-wavelength thermal/optical carbon analyzer with the IMPROVE_A protocol (Desert Research Institute, Reno, NV, USA) was used to measure the OC and EC. An area of 0.8 cm in diameter in each filter sample is used for measurement [16]. Three EC fragments (EC1, EC2, and EC3 at 580, 740, and 840 °C, respectively, in a 2% O2 and 98% He atmosphere) and four OC fragments (OC1, OC2, OC3, and OC4 at 140, 280, 480, and 580 °C, respectively, in a He atmosphere) were produced. The detailed OC/EC analysis procedures have been described elsewhere [26].

2.3. Method of Calculation

Estimated secondary organic carbon (SOC) was calculated using the EC tracer method built by Turpin [27] and developed by Castro [28]. This was applied to estimate SOC concentration in this paper, and the formula is as follows.
SOC = OCEC × (OC/EC) min
In the formula, the (OC/EC) min means the minimum OC/EC ratio.

3. Results and Discussion

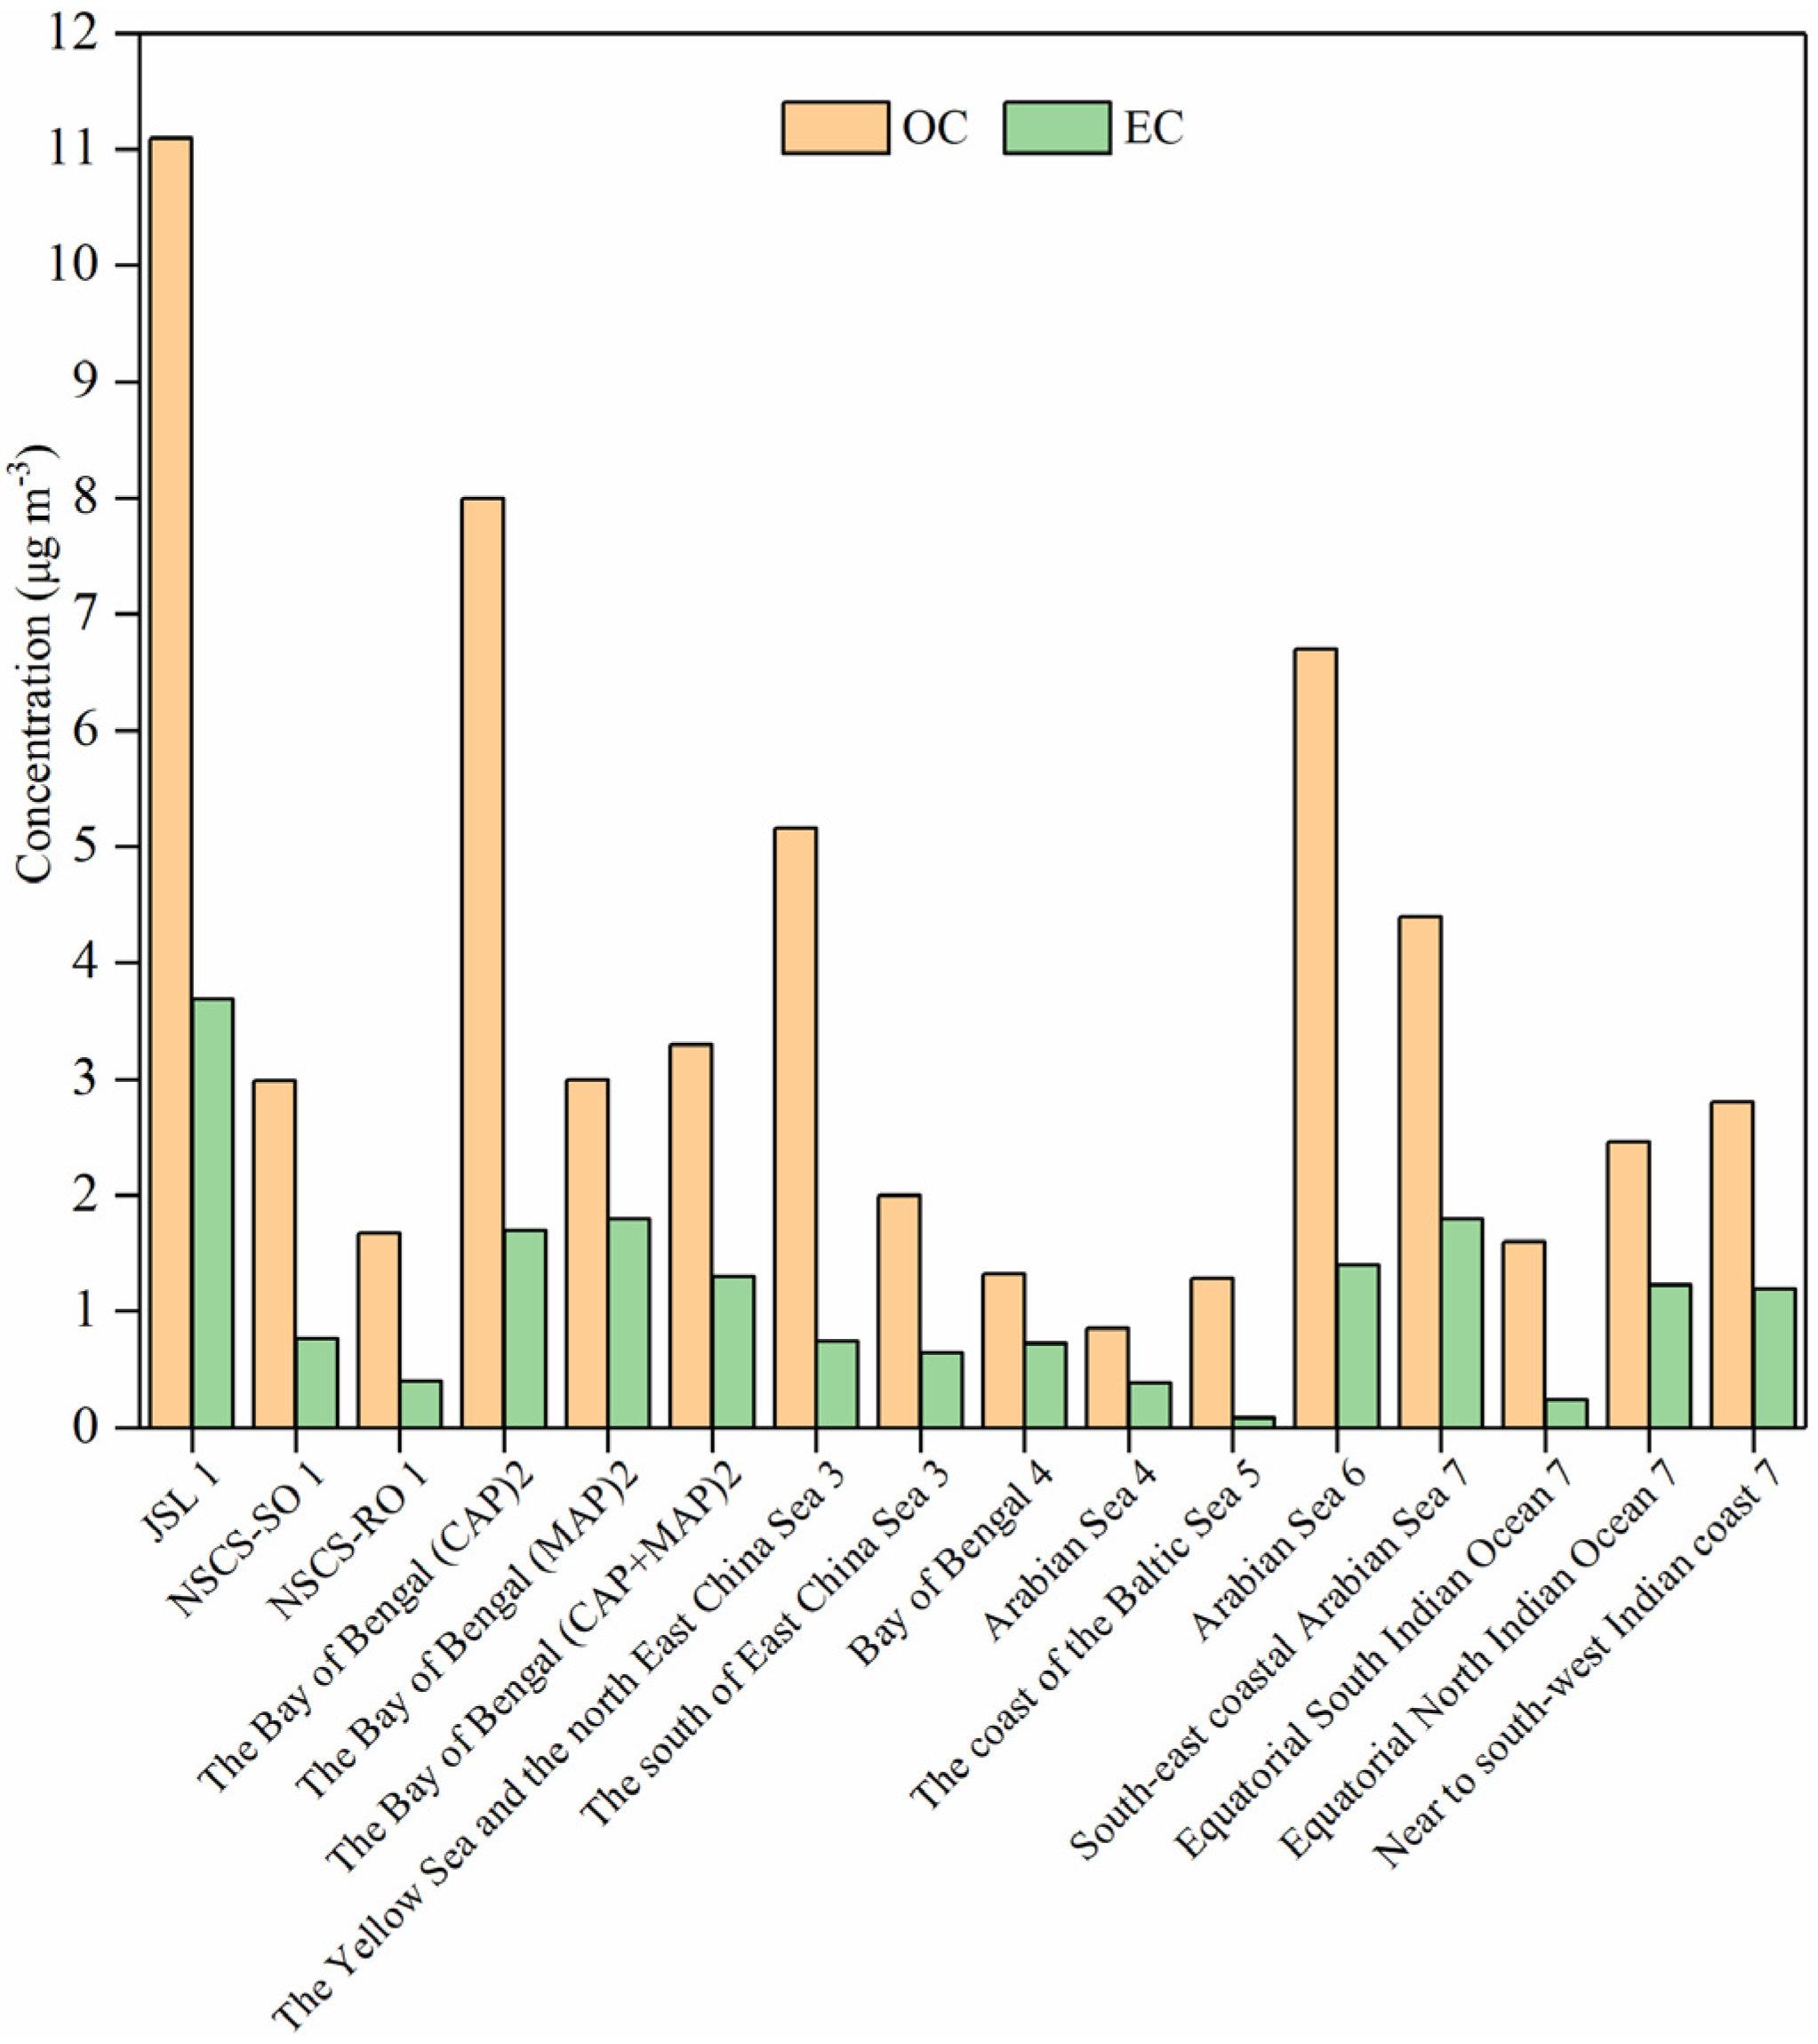
3.1. The Concentrations of OC and EC in PM10

For the purpose of separating PM10 into fine and coarse particles, a cutoff size of 3.0 μm was used. The concentrations of PM3.0, PM3.0–10, and PM10 were obtained by adding the concentrations of particles with sizes less than 3.0 μm, between 3.0 and 10 μm, and less than 10.0 μm, respectively. Significant variations in OC and EC concentrations were observed during the sampling period. The OC and EC mass concentrations in PM10 varied from 0.85 to 11.8 μg m−3 and from 0.05 to 4.71 μg m−3, respectively.
Overall, at the three sampling sites, both the OC and EC concentrations in PM10 were as follows: JSL (11.1 ± 0.79 and 3.69 ± 0.89 μg m−3) > NSCS-SO (2.99 ± 1.34 and 0.77 ± 0.40 μg m−3) > NSCS-RO (1.68 ± 0.56 and 0.40 ± 0.29 μg m−3) (Table 1). In comparison to other sites, the mean concentrations of OC and EC at the JSL were 4–9 times higher. The reason might be that the JSL is greatly affected by the PRD region and surrounding ships and fishing boats. In the PRD region, carbonaceous aerosols are the main chemical substances of fine particles, accounting for about 23~47% [3,29]. Moreover, the NSCS-RO is located in the remote ocean which is less affected by the urban area and biological activities because the living environment in the deep sea is relatively harsh. This might be the reason for the low concentration of carbonaceous aerosols.
Figure 2 shows comparisons of OC and EC concentrations measured in other locations. The concentrations of OC and EC over the NSCS-SO were comparable to those over the Bay of Bengal wherein samples were impacted by the continental air parcel and marine air parcel (OC: 3.3 ± 2.2 μg m−3; EC: 1.3 ± 0.5 μg m−3) [30], the equatorial North Indian Ocean (OC: 2.46 ± 0.54 μg m−3; EC: 1.23 ± 0.31 μg m−3), and the south-west Indian coast (OC: 2.8 ± 0.89 μg m−3; EC: 1.2 ± 0.33 μg m−3) [31]. The OC and EC concentrations over the NSCS-RO were comparable to those over the south of the East China Sea (OC: 2.00 μg m−3; EC: 0.65 μg m−3) [32], and the South Indian Ocean (OC: 1.6 ± 0.33 μg m−3; EC: 0.24 ± 0.07 μg m−3) [31]. Noticeably, the OC and EC concentrations at the JSL were significantly higher than those observed over other ocean areas. Interestingly, these concentrations were consistent with the previous study reported by Yu et al. [33] that the OC and EC concentrations in fine particles ranged from 5.89 to 18.66 (mean of 13.19) and from 1.08 to 3.17 (mean of 2.28) μg m−3, respectively, in Guangzhou, the central city of the Pearl River Delta. That is further confirmed that this sampling site is greatly affected by the PRD urban agglomeration. It is reported that carbonaceous aerosols are one of the dominant chemical components in fine particles in the PRD region, and their proportions in fine particles have actually been rising recently [3,34].

3.2. Characteristics of OC and EC in Size-Segregated Particles

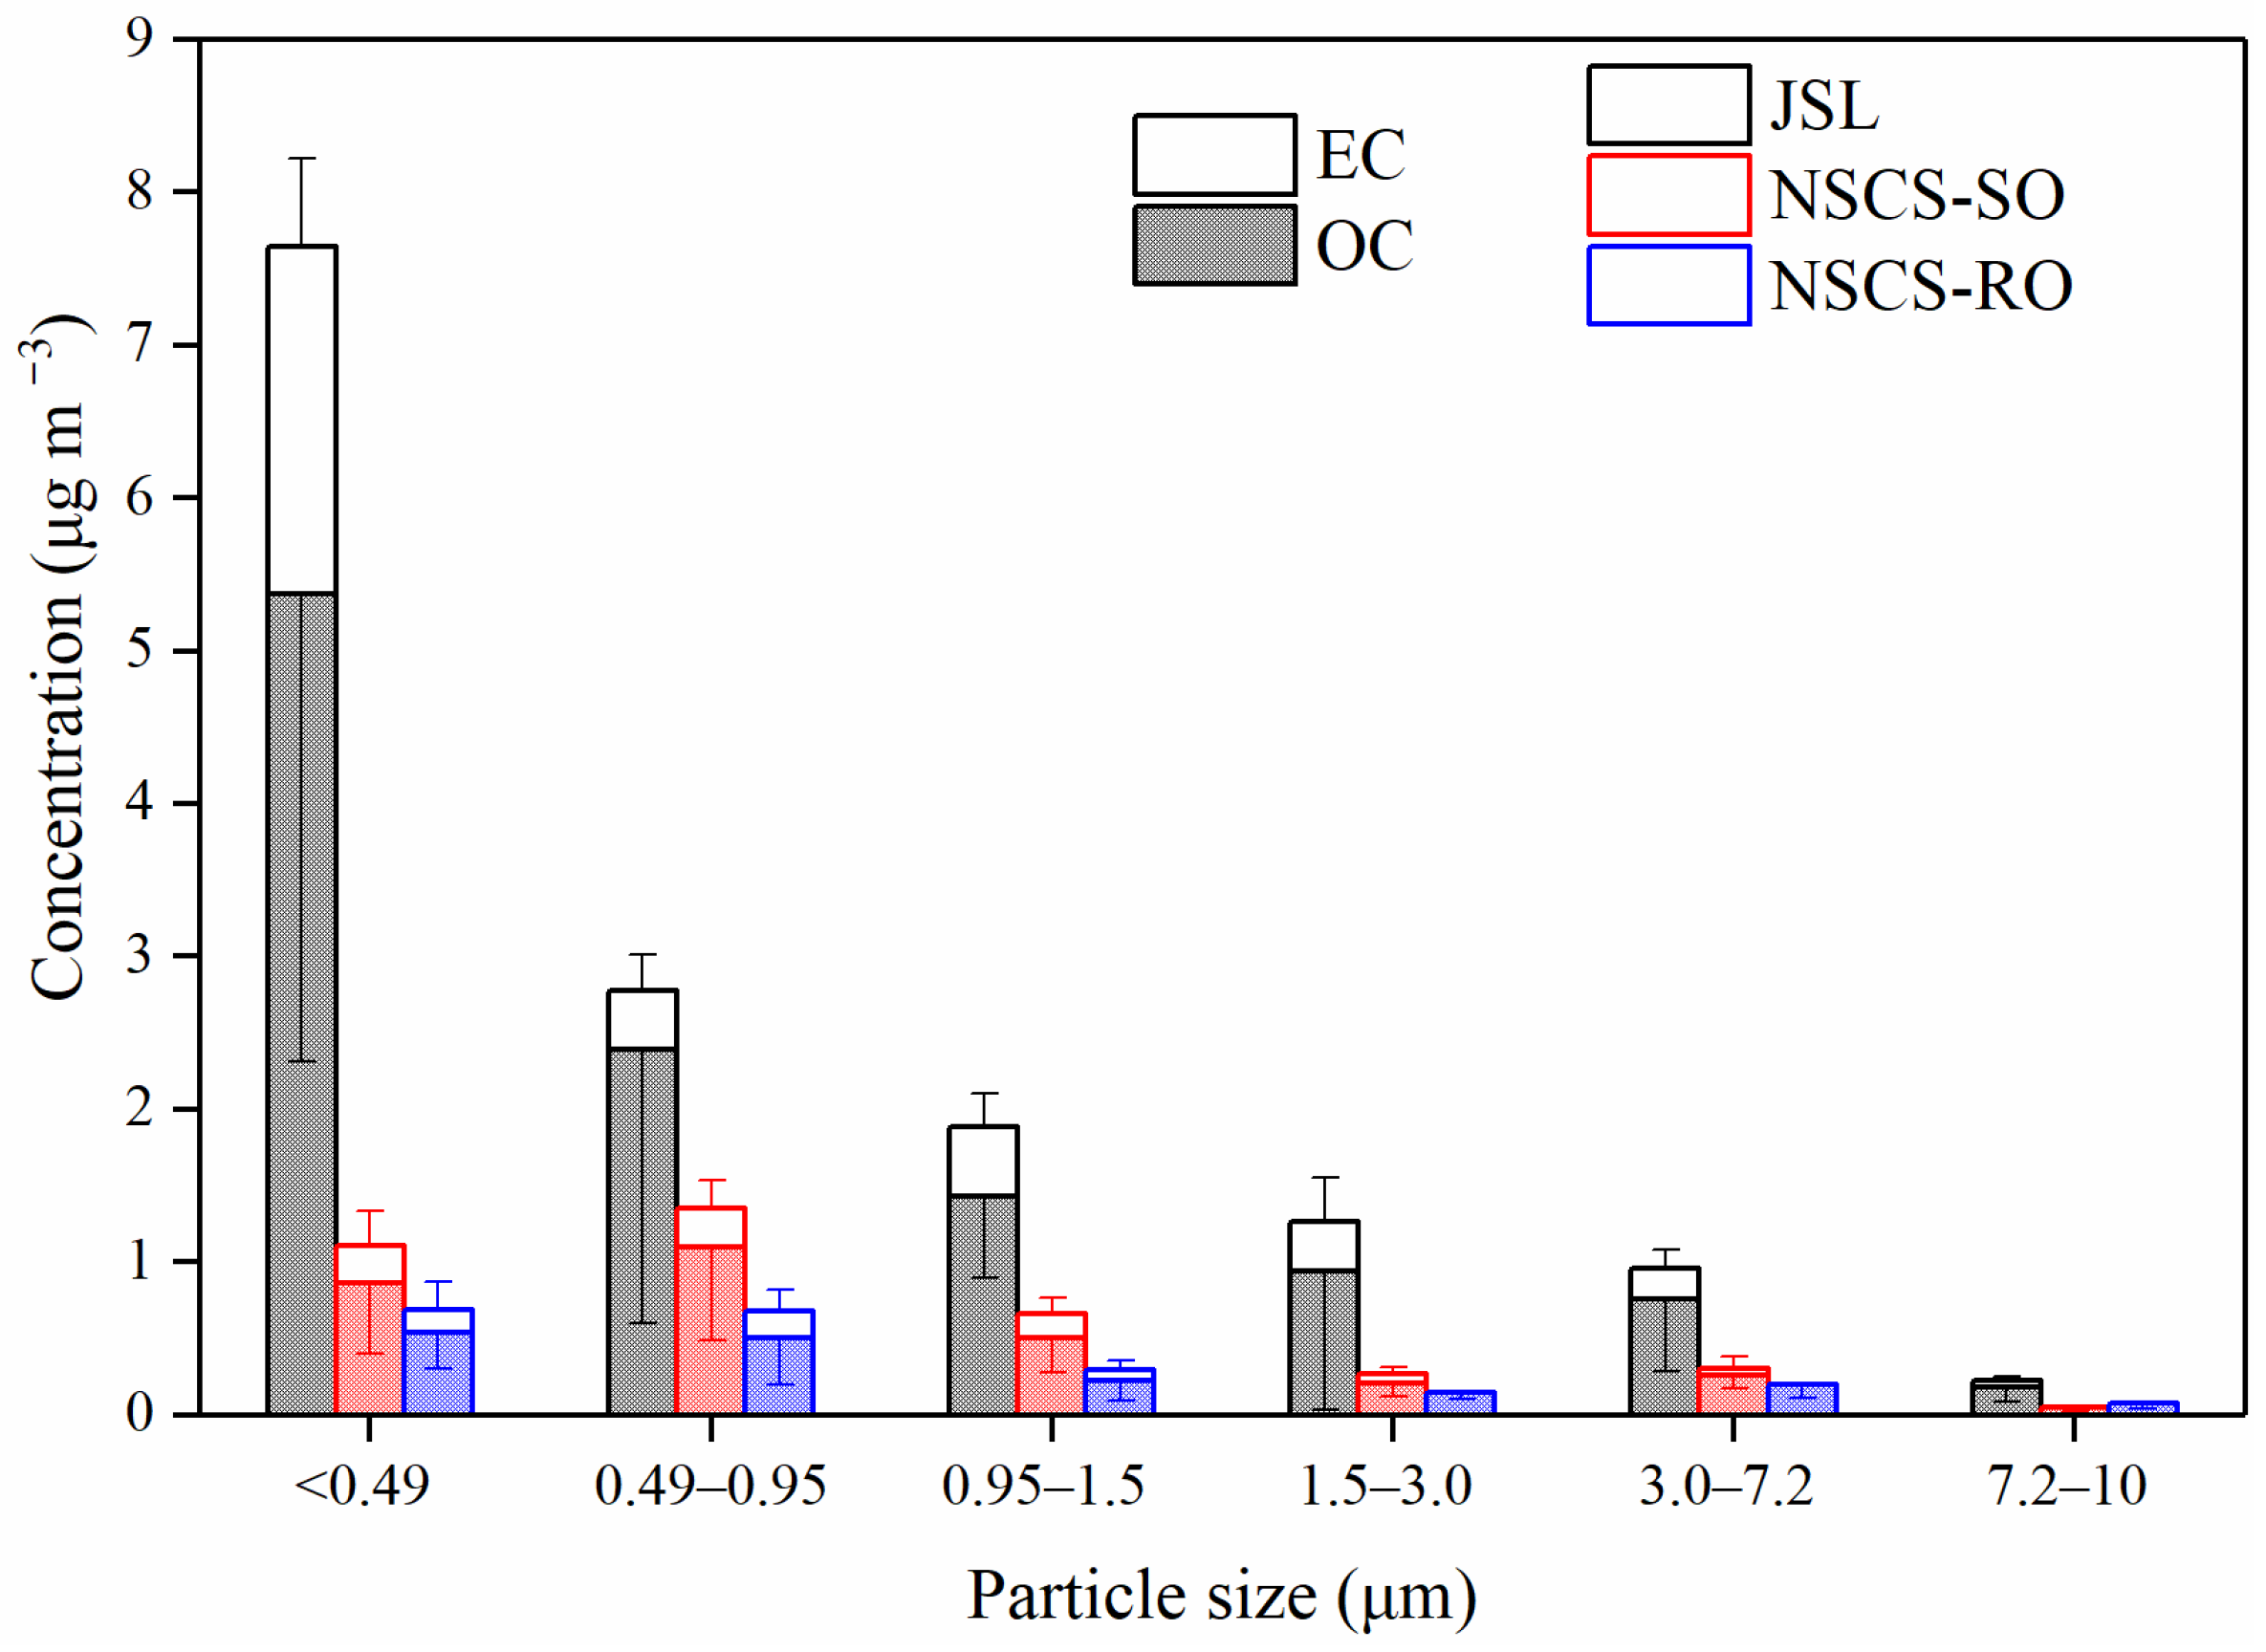
3.2.1. OC and EC Concentrations at Different Particle-Size Bins

The OC and EC concentrations in fine and coarse particles at the three sampling sites are presented in Table 1. The OC mean concentrations were 10.1 ± 0.63 and 0.94 ± 0.57, 2.67 ± 1.27 and 0.31 ± 0.09, and 1.41 ± 0.50 and 0.27 ± 0.11 μg m−3 in PM3.0 and in PM3.0–10 at the JSL, NSCS-SO, and NSCS-RO, respectively, while the EC mean concentrations were 3.44 ± 0.82 and 0.25 ± 0.15, 0.72 ± 0.36 and 0.04 ± 0.08, and 0.40 ± 0.28 and 0.0049 ± 0.0097 μg m−3 in PM3.0 and in PM3.0–10 at the JSL, NSCS-SO, and NSCS-RO, respectively. The OC and EC were mainly concentrated in fine particles at all three sampling sites, and more than 90% of the OC and EC were concentrated in fine particles.
The concentrations and proportions of OC and EC at various particle-size bins are displayed in Figure 3 and Figure 4, respectively. Notably, the OC and EC concentrations at the JSL were larger than the other two sites in each particle size segment, which was consistent with the above result. Overall, at the three sampling sites, both OC and EC presented similar trends in that the concentrations decreased with the increase in particle sizes. In particular, approximately 75–83% of OC and 84–98% of EC were concentrated in the particles with Dp < 1.5 μm. These results were consistent with the previous study in marine aerosol [38]. The percentages of OC and EC in the coarse particles were low. Therefore, compared with coarse particles, carbonaceous aerosols possibly play a more significant role in the formation of fine particles. Compared to the other sampling locations, the JSL demonstrated considerably higher OC and EC proportions (48% and 62%, respectively) in particles with Dp less than 0.49 μm, while the other particle-size bins at the JSL had lower OC and EC fractions than those at the other sampling sites. For instance, only 29% OC and 33% EC existed in the particles with Dp less than 0.49 μm at the NSCS-SO, but 37% OC and 33% EC in particles with Dp in the range of 0.49–0.95 μm, compared to the JSL which had 48% OC and 62% EC in particles with Dp < 0.49 μm and only 22% OC and 10% EC in particles with Dp in the range of 0.49–0.95 μm. This result showed that in the area greatly affected by anthropogenic sources, OC and EC were richer in smaller size particles (Dp < 0.49 μm). The carbonaceous aerosols in the Guangzhou urban area had higher concentrations on smaller particles with Dp < 0.49 µm [39], while diesel fuel vessels had relatively smaller proportions in particles with Dp less than 0.43 µm [12]; therefore, compared with the impact of ships, the JSL was more affected by the PRD urban agglomeration.

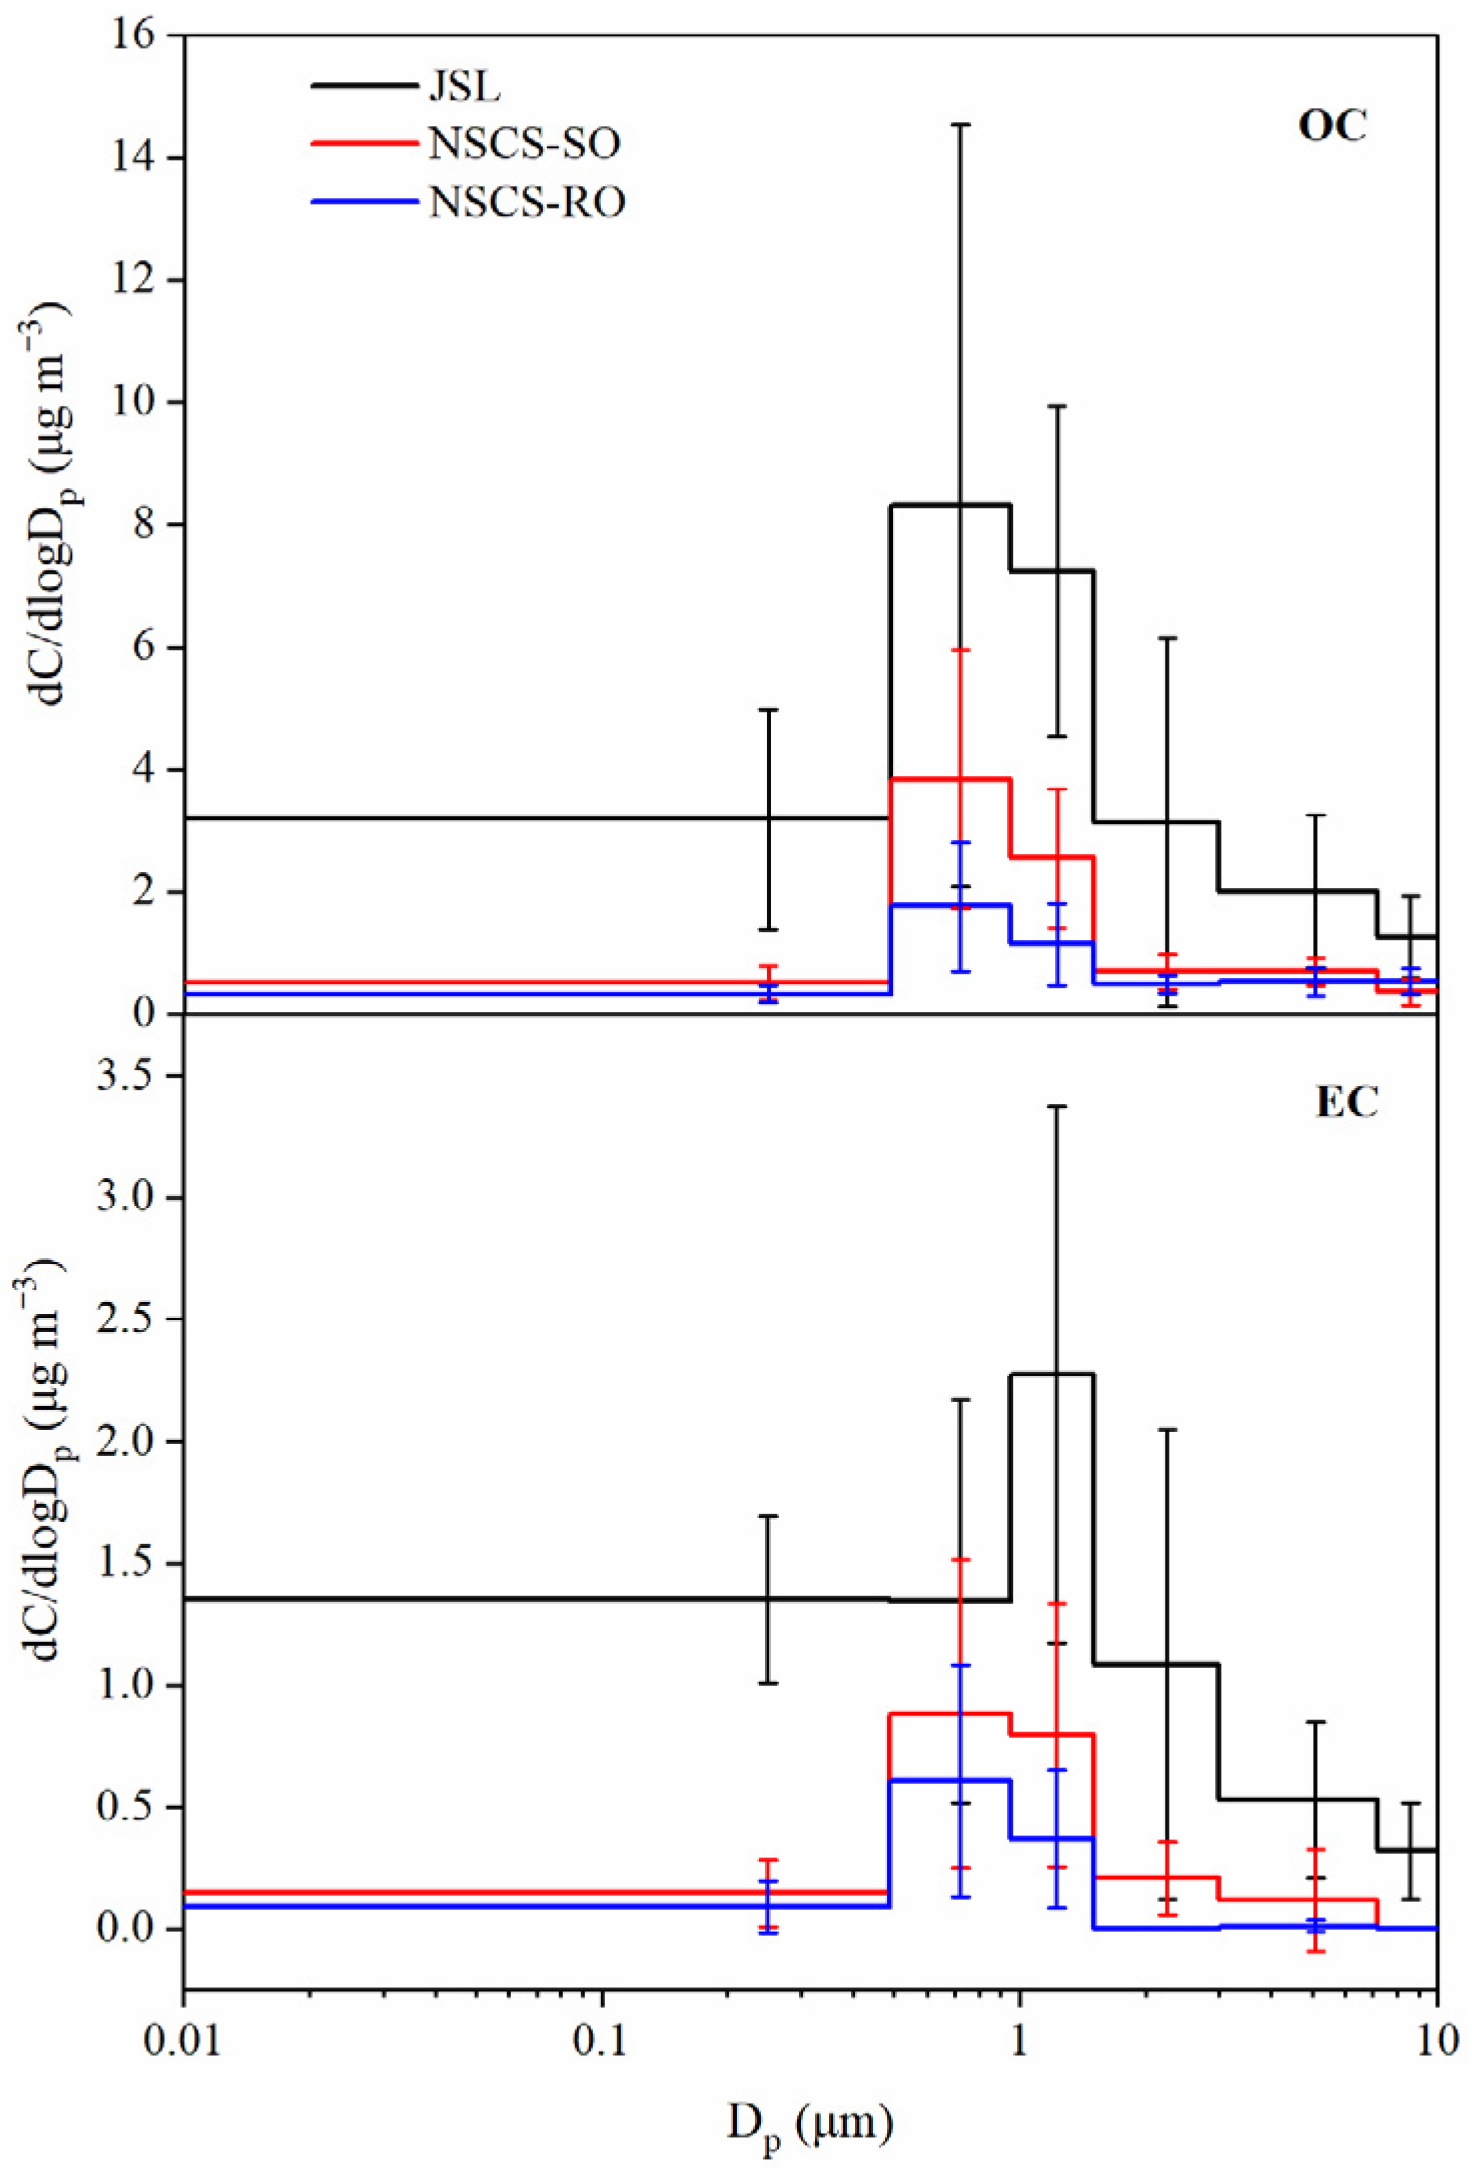
3.2.2. OC and EC Mass Size Distribution

OC and EC mass size distributions as a function of Dp are shown in Figure 5. The OC mass size distributions were similar at three sampling sites that exhibited a major peak in the 0.49–0.95 μm size range. The EC mass size distributions at the NSCS-SO and NSCS-RO were characterized by a major peak at the 0.49–0.95 μm size range, which was slightly shifted to 0.95–1.5 μm at the JSL. Interestingly, both the OC and EC exhibited a minor peak in the 3–7.2 μm size range (coarse mode) at the NSCS-RO. This result may be due to the adsorption of water molecules on the surface of particles or the increase in the coating thickness of particles during long-range transport [40,41].
Mass mean diameter (MMD) is used to divide the diameters into two equal halves from the minimum to the maximum [42]. In this study, we calculated the MMDs of OC and EC using an equation described in the previous study [43]. Table 2 shows the MMDs of the whole range of impactor particle sizes (total), and fine and coarse particles. Due to the low concentrations of OC and EC, the MMD deviations in coarse particles were large. Therefore, only the MMDs of the OC and EC in fine and total particles were discussed. The MMDs of OC were 0.53 ± 0.25 μm in fine particles and 0.59 ± 0.30 μm in total particles at the JSL, which were smaller than those at the NSCS-SO (fine particles: 0.65 ± 0.15 μm; total particles: 0.72 ± 0.15 μm) and NSCS-RO (fine particles: 0.59 ± 0.16 μm; total particles: 0.73 ± 0.12 μm). Similar characteristics were found for EC MMDs in that the MMDs were 0.37 ± 0.03 μm in fine particles and 0.40 ± 0.05 μm in total particles at JSL, which were smaller than those at the NSCS-SO (fine particles: 0.72 ± 0.17 μm; total particles: 0.70 ± 0.18 μm) and NSCS-RO (fine particles: 0.65 ± 0.22 μm; total particles: 0.65 ± 0.21 μm). These results suggested that the carbonaceous aerosol sources at the JSL were different from these of the NSCS-SO and NSCS-RO. The increased repartitioning and hygroscopic development of OC and EC during long-range transport might be factors in the higher MMDs of OC and EC [2].

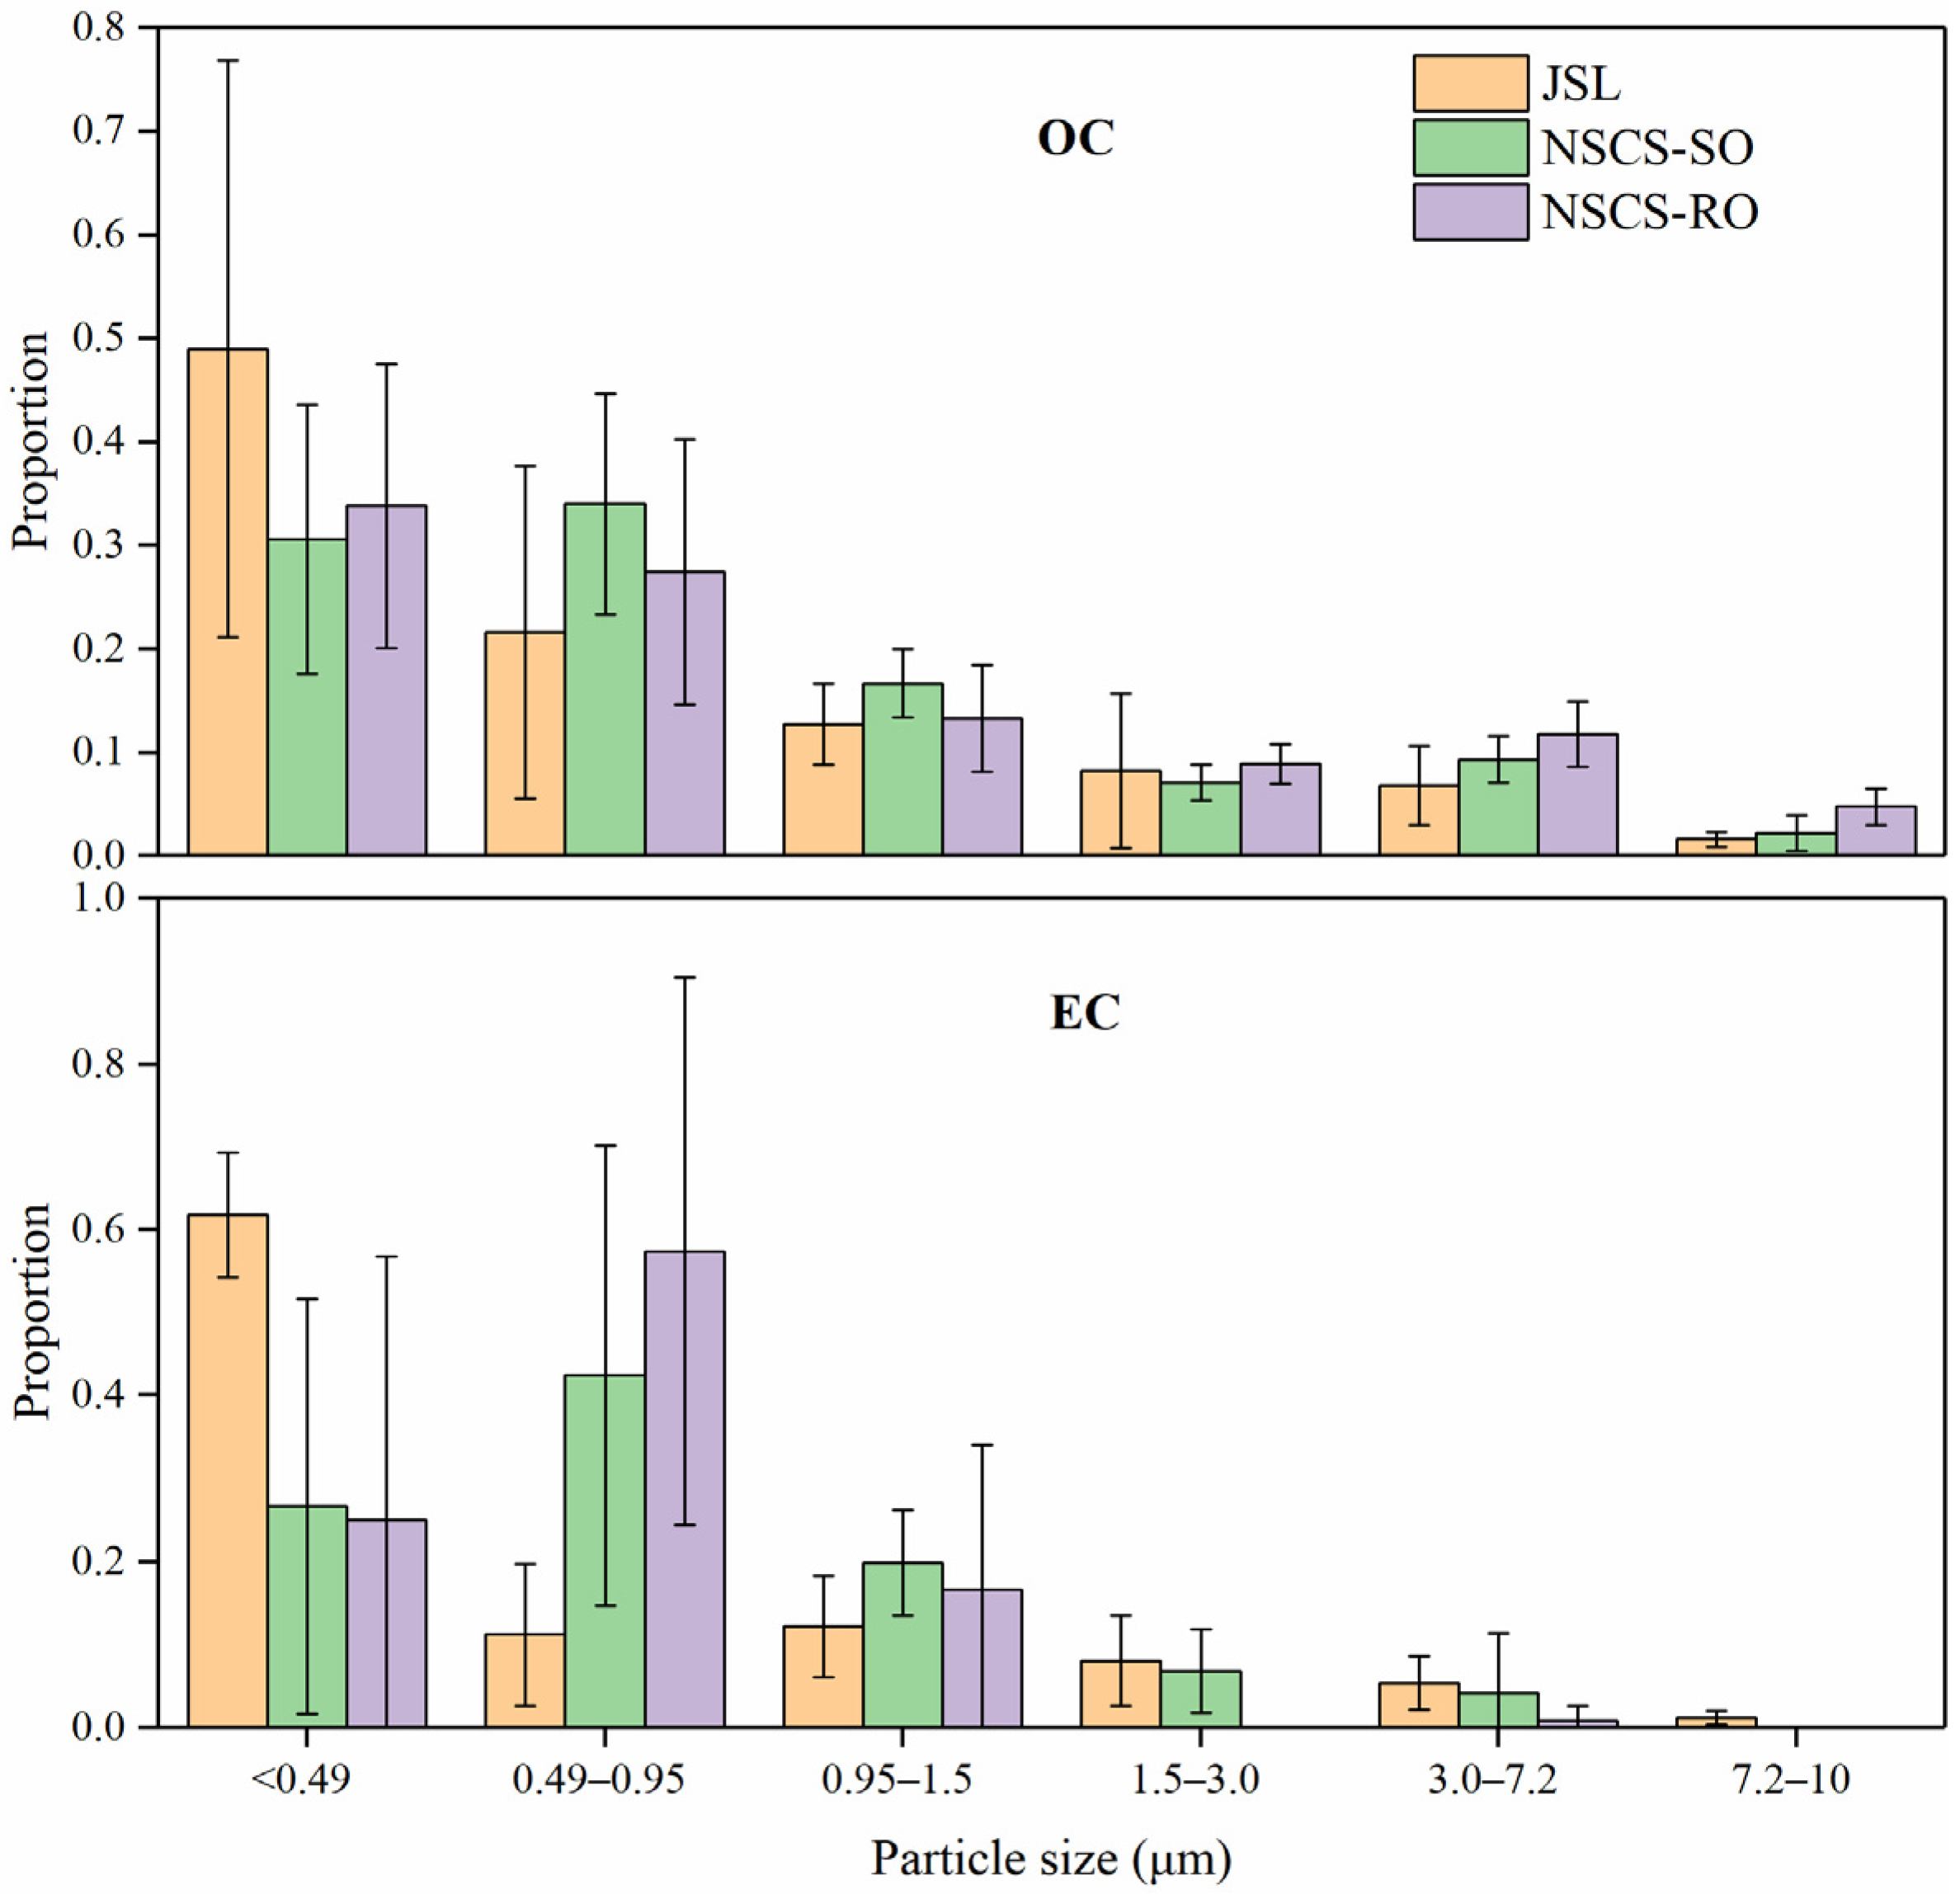
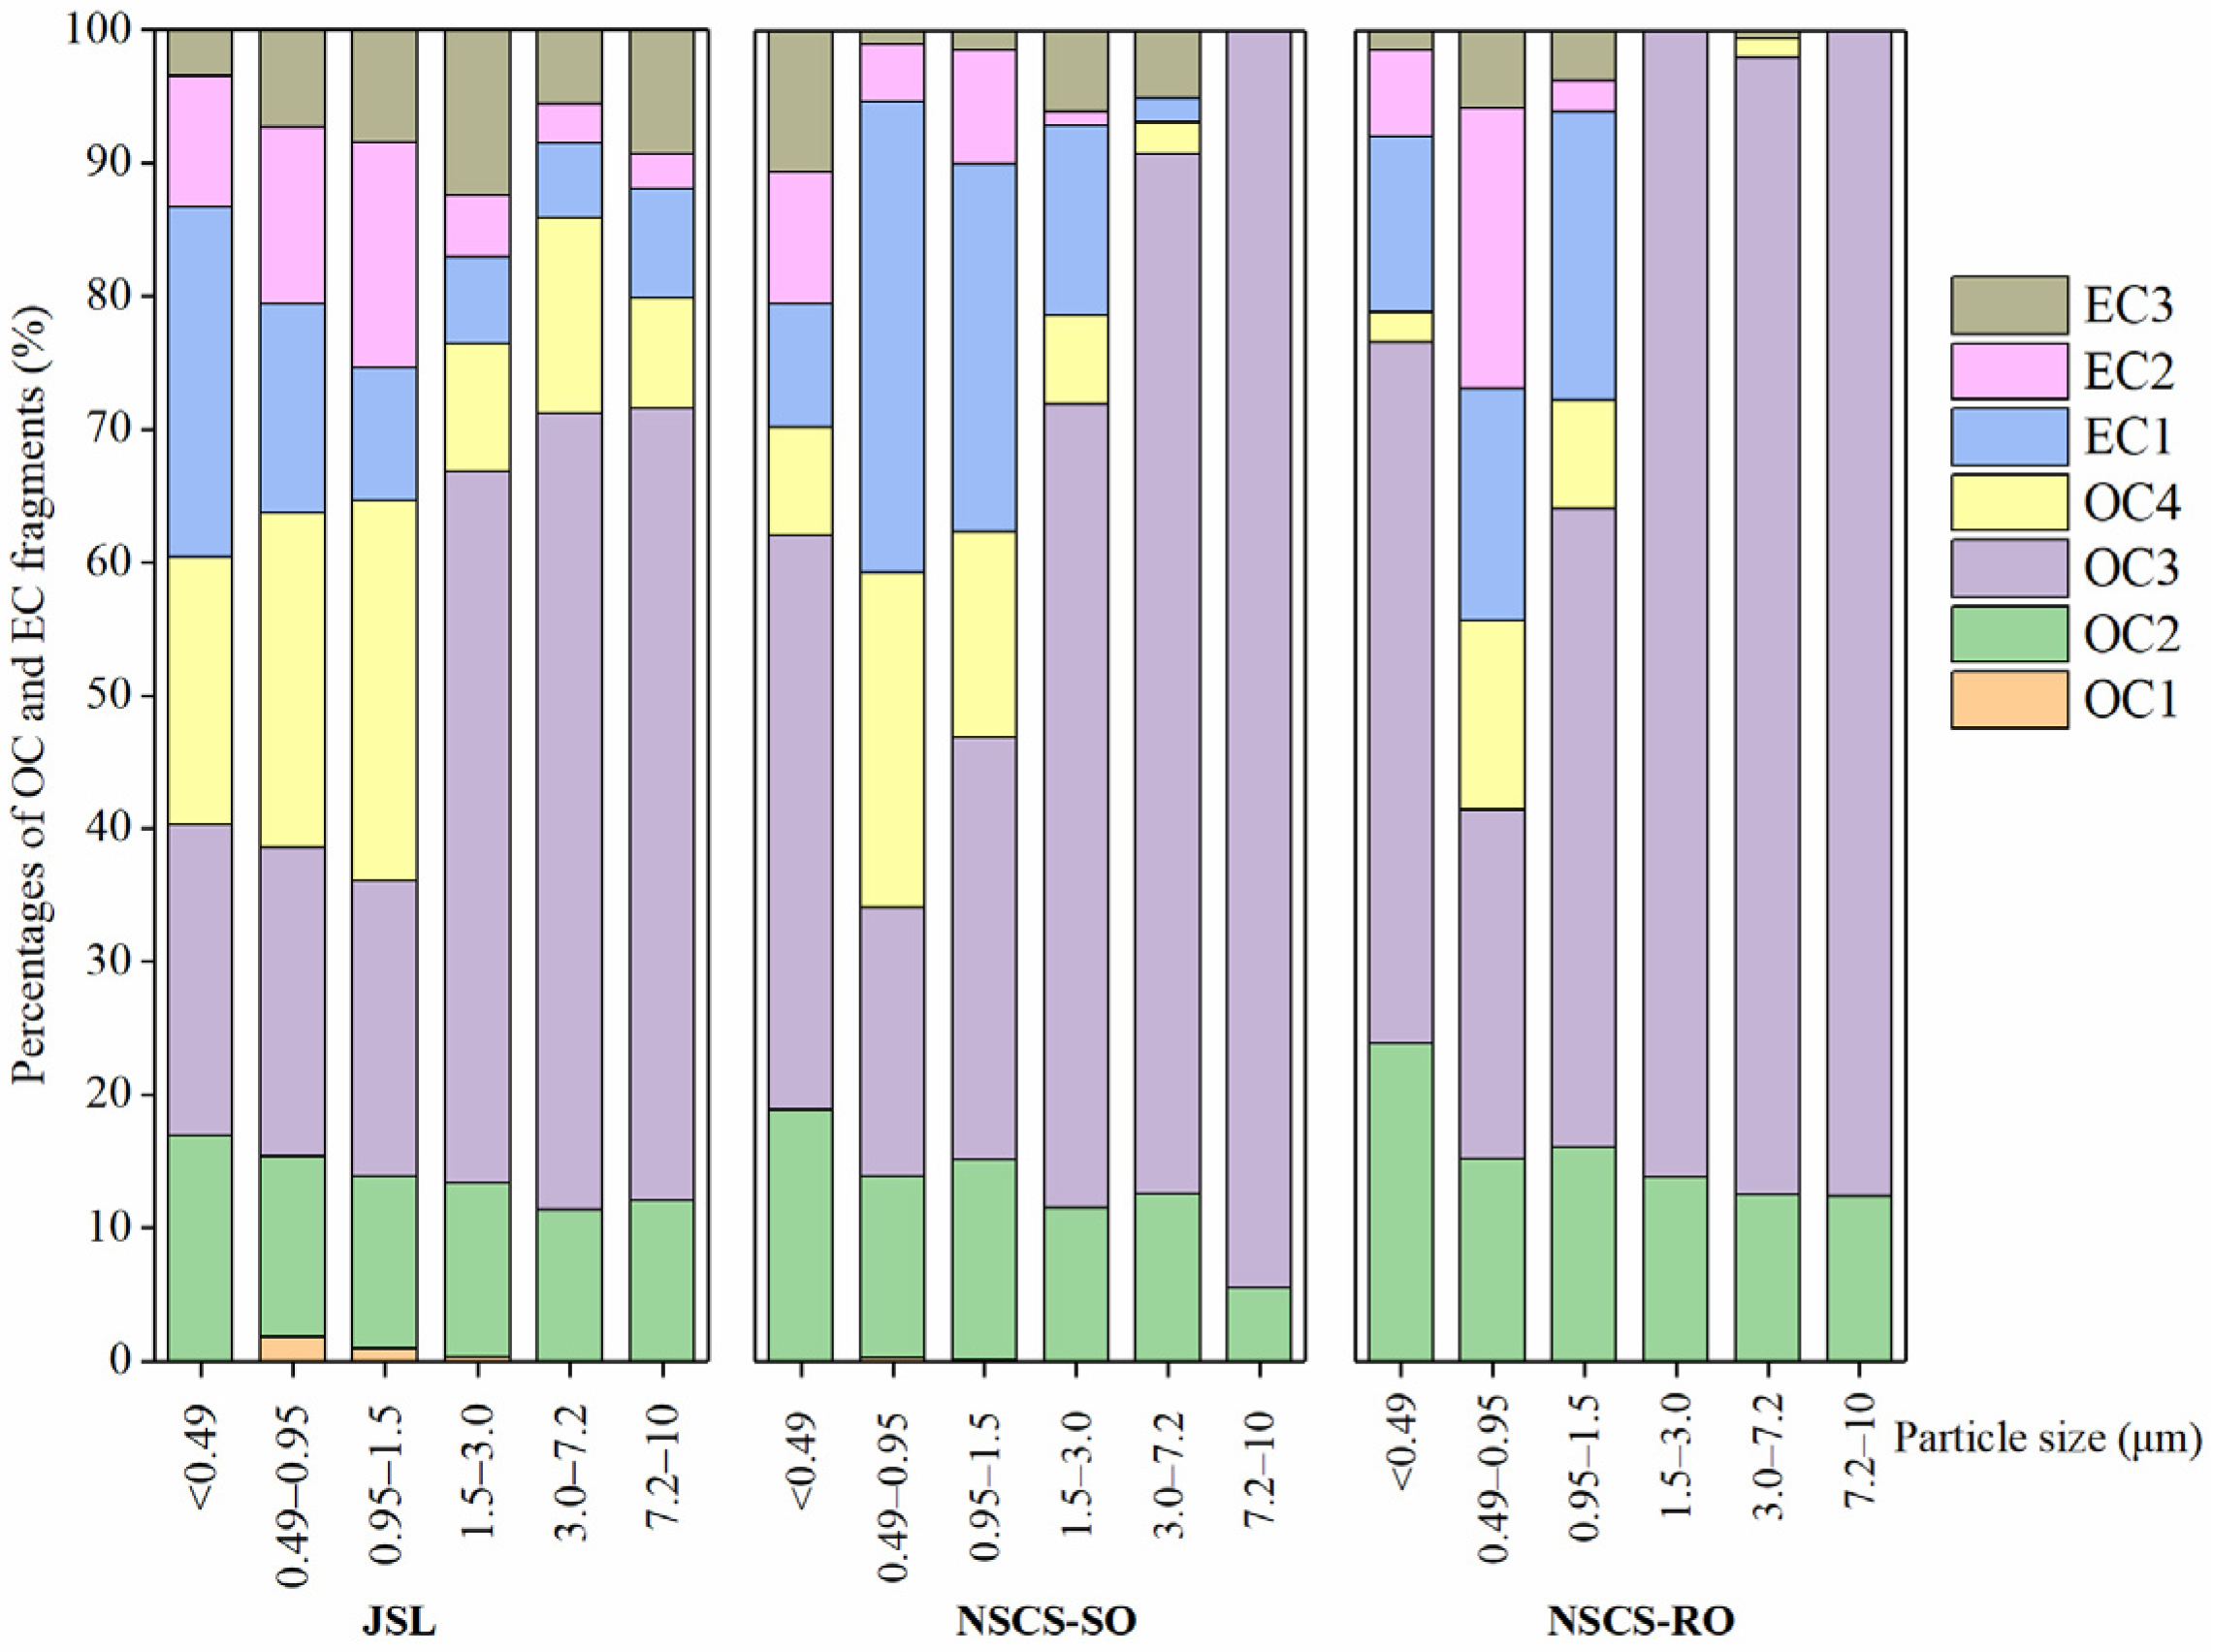
3.2.3. OC and EC Fragments in Size-Segregated Particles

OC fragments (OC1, OC2, OC3, and OC4) and EC fragments (EC1, EC2, and EC3) are helpful to understand the formation processes of carbonaceous aerosols [12]. Generally, EC1 was classified as char EC, EC2 + EC3 was identified as soot EC, OC1 + OC2 was recognized as volatile organic compounds, and OC3 + OC4 was classified as refractory organic compounds [44]. Figure 6 shows the OC and EC fragments’ proportions in each particle-size bin. Overall, OC2, OC3, and OC4 were the main OC fragments, while EC1 and EC2 were the dominant EC fragments at the three sampling sites. Moreover, the proportions of OC1 in each particle size segment were negligible. The reason might be that volatile organic compounds are easily reacted and evolved in the atmosphere [45].
Due to the low concentrations of EC in the 1.5–7.2 μm size range particles, we only discuss the OC and EC fragments in the fine particles (<1.5 μm) below. Overall, the EC fragments in different size of particles had varying proportions at the three sampling sites, while the OC fragments’ (OC2, OC3, and OC4) proportions did not significantly differ among the particle-size bins at the JSL, and the proportions had obvious particle size distribution characteristics at NSCS-SO and the NSCS-RO. Specifically, the highest proportions of OC2 (mean of 22%) and OC3 (mean of 48%) were observed in particles with Dp of less than 0.49 µm and the lowest proportions (mean of 15% for OC2 and 23% for OC3) observed in the 0.49–0.95 μm particle size segment at the NSCS-SO and NSCS-RO, while the proportion of OC4 presented the opposite particle size distribution characteristic, that is, the lowest proportion (mean of 5.0%) was found in the <0.49 μm segment and the highest proportion (mean of 20%) in the 0.49–0.95 μm particle size segment. These results indirectly proved that the sources of carbonaceous aerosols at the NSCS-SO and NSCS-RO were different from that at the JSL.

3.3. The Relationship between OC and EC

The correlation analysis between OC and EC is helpful to understand and evaluate the source emissions of carbonaceous aerosols and the formation of SOC [38]. In this study, a strong regression relationship existed between OC and EC in PM0.49 (R2 = 0.86) and PM1.5–3.0 (R2 = 0.82) reflecting that OC and EC may have similar origins. A medium correlation was found between OC and EC in PM0.49–0.95 (R2 = 0.55), PM0.95–1.5 (R2 = 0.74), PM3.0–7.2 (R2 = 0.61), and PM7.2–10 (R2 = 0.51), indicating varying contributions from complex sources of OC and EC in these particle-size bins.
The concentrations of OC were higher than EC in each particle-size bin at three sites (Figure 3), and the OC/EC mass ratios were generally larger than 2.0, with the mean value ranging from 2.4 to 6.1 in each individual particle-size bin, indicating that the SOC could be formed in the atmosphere. For better comparison, this study only analyzed the OC/EC ratios in the particles with Dp < 1.5 μm (Table 1) because the low EC concentration in this range results in exceptionally large OC/EC ratios. Overall, the OC/EC ratios in the particle-size bin of <0.49 μm were the lowest, while in the particle-size bin of 0.49–0.95 μm, they were the highest. The OC/EC ratio at the NSCS-RO in each particle-size bin was the lowest, followed by the JSL and NSCS-SO.
According to the method of SOC calculation shown in Section 2.3, the mean SOC estimated concentrations and the SOC/OC ratios are shown in Table 3. Overall, the concentration of SOC in PM1.5 ranged from 0.18 to 6.56 μg m−3 with the mean concentration of 2.31 ± 2.33 μg m−3, which was lower than those in Taiyuan in PM2.5 (17.2 ± 18.9) [46] and at Tuoji island in the Bohai Sea in PM1.0 (4.79 ± 3.62 μg m−3) [38]. At the three sampling sites, both the mean SOC concentrations and the ratios of SOC/OC in PM1.5 were as follows: JSL (5.42 ± 1.35 μg m−3 and 58.4 ± 9.72%) > NSCS-SO (1.08 ± 1.02 μg m−3 and 35.7 ± 25.4%) > NSCS-RO (0.38 ± 0.25 μg m−3 and 25.9 ± 16.5%), which indicate that the contribution of secondary carbonaceous aerosols to organic carbon is relatively low in the remote ocean region. Interestingly, at the three sampling points, the ratio of SOC/OC showed a maximum in particles with Dp in the range of 0.95–1.5 μm, suggesting that SOC has the largest contribution in the 0.49–0.95 μm particle size range. Moreover, the SOC concentrations decreased with the increase in particle sizes at JSL, while they were highest in the particles with Dp in the range of 0.49–0.95 μm and lowest in the particles with Dp in the range of 0.95–1.5 μm both at the NSCS-SO and NSCS-RO.

4. Conclusions

Size-segregated characteristics of OC and EC in the northeastern South China Sea are investigated in this study. Up to 90% of the OC and EC were concentrated in fine particles. Both OC and EC presented similar trends in that the concentrations decreased with the increase in particle sizes. The OC mass size distributions at the three sampling sites were comparable and presented a dominant peak in the 0.49–0.95 μm size range. Both OC MMDs and EC MMDs in fine particles at the NSCS-SO and NSCS-RO were higher than that at the JSL. The mean SOC concentrations and SOC/OC ratios in PM1.5 varied at the three sampling sites in the following order: JSL > NSCS-SO > NSCS-RO. The SOC/OC ratios showed a maximum in particles with the 0.95–1.5 μm size range. These results will be helpful for understanding the characteristics of the size distribution of carbonaceous aerosols in the northeastern South China.

Author Contributions

Conceptualization, F.L. and L.P.; methodology, F.L. and L.P.; formal analysis, F.L. and M.S.; investigation, F.L. and S.D.; writing—original draft preparation, F.L.; writing—review and editing, F.L. and L.P.; supervision, X.B.; project administration, X.B.; funding acquisition, L.P. All authors have read and agreed to the published version of the manuscript.

Funding

This research was funded by the National Natural Science Foundation of China (No. 42105102).

Institutional Review Board Statement

Not applicable.

Informed Consent Statement

Not applicable.

Data Availability Statement

The datasets are available from the corresponding author upon reasonable request.

Acknowledgments

The authors are grateful to the captain and the crews of R/V Shiyan III for their kind help during the investigation and sampling.

Conflicts of Interest

The authors declare no conflict of interest.

References

  1. Poschl, U. Atmospheric aerosols: Composition, transformation, climate and health effects. Angew. Chem. Int. Ed. 2005, 44, 7520–7540. [Google Scholar] [CrossRef] [PubMed]
  2. Guo, Y. Characteristics of size-segregated carbonaceous aerosols in the Beijing-Tianjin-Hebei region. Environ. Sci. Pollut. Res. 2016, 23, 13918–13930. [Google Scholar] [CrossRef] [PubMed]
  3. Tao, J.; Zhang, L.; Cao, J.; Zhang, R. A review of current knowledge concerning PM2.5 chemical composition, aerosol optical properties and their relationships across China. Atmos. Chem. Phys. 2017, 17, 9485–9518. [Google Scholar] [CrossRef] [Green Version]
  4. Chung, S.H.; Seinfeld, J.H. Global distribution and climate forcing of carbonaceous aerosols. J. Geophys. Res. Atmos. 2002, 107, D19. [Google Scholar] [CrossRef] [Green Version]
  5. Zhao, P.; Dong, F.; Yang, Y.; He, D.; Zhao, X.; Zhang, W.; Yao, Q.; Liu, H. Characteristics of carbonaceous aerosol in the region of Beijing, Tianjin, and Hebei, China. Atmos. Environ. 2013, 71, 389–398. [Google Scholar] [CrossRef]
  6. Wang, L.; Zhou, X.; Ma, Y.; Cao, Z.; Wu, R.; Wang, W. Carbonaceous aerosols over China-review of observations, emissions, and climate forcing. Environ. Sci. Pollut. R. 2016, 23, 1671–1680. [Google Scholar] [CrossRef]
  7. Daellenbach, K.R.; Stefenelli, G.; Bozzetti, C.; Vlachou, A.; Fermo, P.; Gonzalez, R.; Piazzalunga, A.; Colombi, C.; Canonaco, F.; Hueglin, C.; et al. Long-term chemical analysis and organic aerosol source apportionment at nine sites in central Europe: Source identification and uncertainty assessment. Atmos. Chem. Phys. 2017, 17, 13265–13282. [Google Scholar] [CrossRef] [Green Version]
  8. Wang, H.; Zhang, L.; Yao, X.; Cheng, I.; Dabek-Zlotorzynska, E. Identification of decadal trends and associated causes for organic and elemental carbon in PM2.5 at Canadian urban sites. Environ. Int. 2022, 159, 107031. [Google Scholar] [CrossRef]
  9. Contini, D.; Vecchi, R.; Viana, M. Carbonaceous Aerosols in the Atmosphere. Atmosphere 2018, 9, 181. [Google Scholar] [CrossRef] [Green Version]
  10. Bhowmik, H.S.; Naresh, S.; Bhattu, D.; Rastogi, N.; Prevot, A.S.H.; Tripathi, S.N. Temporal and spatial variability of carbonaceous species (EC; OC; WSOC and SOA) in PM2.5 aerosol over five sites of Indo-Gangetic Plain. Atmos. Pollut. Res. 2021, 12, 375–390. [Google Scholar] [CrossRef]
  11. Ye, Z.; Li, Q.; Ma, S.; Zhou, Q.; Gu, Y.; Su, Y.; Chen, Y.; Chen, H.; Wang, J.; Ge, X. Summertime Day-Night Differences of PM2.5 Components (Inorganic Ions, OC, EC, WSOC, WSON, HULIS, and PAHs) in Changzhou, China. Atmosphere 2017, 8, 189. [Google Scholar] [CrossRef] [Green Version]
  12. Zhang, F.; Guo, H.; Chen, Y.; Matthias, V.; Zhang, Y.; Yang, X.; Chen, J. Size-segregated characteristics of organic carbon (OC), elemental carbon (EC) and organic matter in particulate matter (PM) emitted from different types of ships in China. Atmos. Chem. Phys. 2020, 20, 1549–1564. [Google Scholar] [CrossRef] [Green Version]
  13. Massabo, D.; Prati, P.; Canepa, E.; Bastianini, M.; Van Eijk, A.M.J.; Missamou, T.; Piazzola, J. Characterization of carbonaceous aerosols over the Northern Adriatic Sea in the JERICO-NEXT project framework. Atmos. Environ. 2020, 228, 117449. [Google Scholar] [CrossRef]
  14. Cesari, D.; Merico, E.; Dinoi, A.; Gambaro, A.; Morabito, E.; Gregoris, E.; Barbaro, E.; Feltracco, M.; Alebic-Juretic, A.; Odorcoc, D.; et al. An inter-comparison of size segregated carbonaceous aerosol collected by low-volume impactor in the port-cities of Venice (Italy) and Rijeka (Croatia). Atmos. Pollut. Res. 2020, 11, 1705–1714. [Google Scholar] [CrossRef]
  15. Bardouki, H.; Liakakou, H.; Economou, C.; Sciare, J.; Smolik, J.; Zdimal, V.; Eleftheriadis, K.; Lazaridis, M.; Dye, C.; Mihalopoulos, N. Chemical composition of size-resolved atmospheric aerosols in the eastern Mediterranean during summer and winter. Atmos. Environ. 2003, 37, 195–208. [Google Scholar] [CrossRef]
  16. Li, S.; Zhu, M.; Yang, W.; Tang, M.; Huang, X.; Yu, Y.; Fang, H.; Yu, X.; Yu, Q.; Fu, X.; et al. Filter-based measurement of light absorption by brown carbon in PM2.5 in a megacity in South China. Sci. Total. Environ. 2018, 633, 1360–1369. [Google Scholar] [CrossRef] [PubMed]
  17. Wang, F.; Feng, T.; Guo, Z.; Li, Y.; Lin, T.; Rose, N.L. Sources and dry deposition of carbonaceous aerosols over the coastal East China Sea: Implications for anthropogenic pollutant pathways and deposition. Environ. Pollut. 2019, 245, 771–779. [Google Scholar] [CrossRef]
  18. Eleftheriadis, K.; Colbeck, I.; Housiadas, C.; Lazaridis, M.; Mihalopoulos, N.; Mitsakou, C.; Smolík, J.; Ždímal, V. Size distribution, composition and origin of the submicron aerosol in the marine boundary layer during the eastern Mediterranean “SUB-AERO” experiment. Atmos. Environ. 2006, 40, 6245–6260. [Google Scholar] [CrossRef]
  19. Piazzola, J.; Sellegri, K.; Bourcier, L.; Mallet, M.; Tedeschi, G.; Missamou, T. Physicochemical characteristics of aerosols measured in the spring time in the Mediterranean coastal zone. Atmos. Environ. 2012, 54, 545–556. [Google Scholar] [CrossRef]
  20. Bougiatioti, A.; Zarmpas, P.; Koulouri, E.; Antoniou, M.; Theodosi, C.; Kouvarakis, G.; Saarikoski, G.; Makela, T.; Hillamo, R.; Mihalopoulos, N. Organic, elemental and water-soluble organic carbon in size segregated aerosols, in the marine boundary layer of the Eastern Mediterranean. Atmos. Environ. 2013, 64, 251–262. [Google Scholar]
  21. Parent, P.; Laffon, C.; Trillaud, V.; Grauby, O.; Ferry, D.; Limoges, A.; Missamou, T.; Piazzola, J. Physicochemical Characterization of Aerosols in the Coastal Zone: Evidence of Persistent Carbon Soot in the Marine Atmospheric Boundary Layer (MABL) Background. Atmosphere 2023, 14, 291. [Google Scholar] [CrossRef]
  22. Sun, H.; Sun, J.; Zhu, C.; Yu, L.; Lou, Y.; Li, R.; Lin, Z. Chemical characterizations and sources of PM2.5 over the offshore Eastern China sea: Water soluble ions, stable isotopic compositions, and metal elements. Atmos. Pollut. Res. 2022, 13, 101410. [Google Scholar] [CrossRef]
  23. Song, S.-K.; Shon, Z.-H.; Bae, M.-S.; Cho, S.-B.; Moon, S.-H.; Kim, H.-S.; Son, Y.B.; Lee, C. Effects of natural and anthropogenic emissions on the composition and toxicity of aerosols in the marine atmosphere. Sci. Total. Environ. 2022, 806, 150928. [Google Scholar] [CrossRef] [PubMed]
  24. Song, J.; Zhao, Y.; Zhang, Y.; Fu, P.; Zheng, L.; Yuan, Q.; Wang, S.; Huang, X.; Xu, W.; Cao, Z.; et al. Influence of biomass burning on atmospheric aerosols over the western South China Sea: Insights from ions, carbonaceous fractions and stable carbon isotope ratios. Environ. Pollut. 2018, 242, 1800–1809. [Google Scholar] [CrossRef]
  25. Chang, C.-C.; Yuan, C.; Li, T.-C.; Su, Y.-L.; Tong, C.; Wu, S.-P. Chemical characteristics, source apportionment, and regional transport of marine fine particles toward offshore islands near the coastline of northwestern Taiwan Strait. Environ. Sci. Pollut. R. 2018, 25, 32332–32345. [Google Scholar] [CrossRef] [PubMed] [Green Version]
  26. Chen, L.W.A.; Chow, J.C.; Wang, X.L.; Robles, J.A.; Sumlin, B.J.; Lowenthal, D.H.; Zimmermann, R.; Watson, J.G. Multi-wavelength optical measurement to enhance thermal/optical analysis for carbonaceous aerosol. Atmos. Meas. Tech. 2015, 8, 451–461. [Google Scholar] [CrossRef] [Green Version]
  27. Turpin, B.J.; Huntzicker, J.J. Identification of secondary organic aerosol episodes and quantitation of primary and secondary organic aerosol concentrations during SCAQS. Atmos. Environ. 1995, 29, 3527–3544. [Google Scholar] [CrossRef]
  28. Castro, L.M.; Pio, C.A.; Harrison, R.M.; Smith, D.J.T. Carbonaceous aerosol in urban and rural European atmospheres: Estimation of secondary organic carbon concentrations. Atmos. Environ. 1999, 33, 2771–2781. [Google Scholar] [CrossRef]
  29. Tao, J.; Shen, Z.; Zhu, C.; Yue, J.; Cao, J.; Liu, S.; Zhu, L.; Zhang, R. Seasonal variations and chemical characteristics of sub-micrometer particles (PM1) in Guangzhou, China. Atmos. Res. 2012, 118, 222–231. [Google Scholar] [CrossRef]
  30. Nayak, G.; Kumar, A.; Bikkina, S.; Tiwari, S.; Sheteye, S.S.; Sudheer, A.K. Carbonaceous aerosols and their light absorption properties over the Bay of Bengal during continental outflow. Environ. Sci. Proc. Imp. 2022, 24, 72–88. [Google Scholar] [CrossRef]
  31. Yu, H.; Guo, T.; Wu, Z.; Lin, T.; Hu, L.; Guo, Z. Distribution and gas-particle partitioning of polycyclic aromatic hydrocarbons over the East China Sea and Yellow Sea in spring: Role of atmospheric transport transition. Sci. Total. Environ. 2021, 762, 143071. [Google Scholar] [CrossRef] [PubMed]
  32. Budhavant, K.; Bikkina, S.; Andersson, A.; Asmi, E.; Backman, J.; Kesti, J.; Zahid, H.; Satheesh, S.K.; Gustafsson, O. Anthropogenic fine aerosols dominate the wintertime regime over the northern Indian Ocean. Tellus B 2018, 70, 1–15. [Google Scholar] [CrossRef] [Green Version]
  33. Milukaite, A.; Kvietkus, K.; Rimselyte, I. Organic and elemental carbon in coastal aerosol of the Baltic Sea. Lith. J. Phys. 2007, 47, 203–210. [Google Scholar] [CrossRef] [Green Version]
  34. Bikkina, P.; Sarma, V.V.S.S.; Kawamura, K.; Bikkina, S.; Kunwar, B.; Sherin, C.K. Chemical characterization of wintertime aerosols over the Arabian Sea: Impact of marine sources and long-range transport. Atmos. Environ. 2020, 239, 11774. [Google Scholar] [CrossRef]
  35. Aswini, A.R.; Hegde, P.; Aryasree, S.; Girach, I.A.; Nair, P.R. Continental outflow of anthropogenic aerosols over Arabian Sea and Indian Ocean during wintertime: ICARB-2018 campaign. Sci. Total. Environ. 2020, 712, 135214. [Google Scholar] [CrossRef]
  36. Yu, X.; Yu, Q.; Zhu, M.; Tang, M.; Li, S.; Yang, W.; Zhang, Y.; Deng, W.; Li, G.; Yu, Y.; et al. Water soluble organic nitrogen (WSON) in ambient fine particles over a megacity in south China: Spatiotemporal variations and source apportionment. J. Geophys. Res. Atmos. 2017, 122, 13045–13060. [Google Scholar] [CrossRef]
  37. Huang, J.; Zhang, Z.; Tao, J.; Zhang, L.; Nie, F.; Fei, L. Source apportionment of carbonaceous aerosols using hourly data and implications for reducing PM2.5 in the Pearl River Delta region of South China. Environ. Res. 2022, 210, 112960. [Google Scholar] [CrossRef]
  38. Zhang, J.; Yang, L.; Mellouki, A.; Wen, L.; Yang, Y.; Gao, Y.; Jiang, P.; Li, Y.; Wang, W. Chemical characteristics and influence of continental outflow on PM1.0, PM2.5 and PM10 measured at Tuoji island in the Bohai Sea. Sci. Total. Environ. 2016, 573, 699–706. [Google Scholar] [CrossRef]
  39. Zhang, G.; Bi, X.; Chan, L.Y.; Wang, X.; Sheng, G.; Fu, J. Size-segregated chemical characteristics of aerosol during haze in an urban area of the Pearl River Delta region, China. Urban Clim. 2013, 4, 74–84. [Google Scholar] [CrossRef]
  40. Boreddy, S.K.R.; Hegde, P.; Aswini, A.R.; Aryasree, S. Chemical Characteristics, Size Distributions, Molecular Composition, and Brown Carbon in South Asian Outflow to the Indian Ocean. Earth Space Sci. 2021, 8, e2020EA001615. [Google Scholar]
  41. Kompalli, S.K.; Babu, S.N.S.; Satheesh, S.K.; Moorthy, K.K.; Das, T.; Boopathy, R.; Liu, D.; Darbyshire, E.; Allan, J.D.; Brooks, J.; et al. Seasonal contrast in size distributions and mixing state of black carbon and its association with PM1.0 chemical composition from the eastern coast of India. Atmos. Chem. Phys. 2020, 20, 3965–3985. [Google Scholar] [CrossRef] [Green Version]
  42. Bi, X.; Sheng, G.; Peng, P.; Chen, Y.; Fu, J. Size distribution of n-alkanes and polycyclic aromatic hydrocarbons (PAHs) in urban and rural atmospheres of Guangzhou, China. Atmos. Environ. 2005, 39, 477–487. [Google Scholar] [CrossRef]
  43. Kavouras, I.G.; Stephanou, E.G. Particle size distribution of organic primary and secondary aerosol constituents in urban, background marine, and forest atmosphere. J. Geophys. Res. Atmos. 2002, 107, AAC 7-1–AAC 7-12. [Google Scholar] [CrossRef] [Green Version]
  44. Han, Y.; Chen, Y.; Ahmad, S.; Feng, Y.; Zhang, F.; Song, W.; Cao, F.; Zhang, Y.; Yang, X.; Li, J.; et al. High time- and size-resolved measurements of PM and chemical composition from coal combustion: Implications for the EC formation process. Environ. Sci. Technol. 2018, 52, 6676–6685. [Google Scholar] [CrossRef]
  45. Li, A.; Wen, T.; Hua, W.; Yang, Y.; Meng, Z.; Hu, B.; Xin, J. Characterization and size distribution of carbonaceous aerosols at mountain dinghu. Huanjing Kexue 2020, 41, 3908–3917. [Google Scholar]
  46. He, Q.; Guo, W.; Zhang, G.; Yan, Y.; Chen, L. Characteristics and Seasonal Variations of Carbonaceous Species in PM2.5 in Taiyuan, China. Atmosphere 2015, 6, 850–862. [Google Scholar] [CrossRef] [Green Version]
Figure 1. The map of navigational route.
Atmosphere 14 00661 g001
Figure 2. Comparison of average concentrations of OC and EC in ocean aerosol from different sampling locations (1 this study; 2 Nayak et al., 2022 [30]; 3 Yu et al., 2022 [32]; 4 Budhavant et al., 2018 [35]; 5 Milukaite et al., 2007 [36]; 6 Bikkina et al., 2020 [37]; 7 Aswini et al., 2020 [31]).
Atmosphere 14 00661 g002
Figure 3. The concentrations of OC and EC in each particle size bin (the upper error bar represents the standard deviation of EC, and the lower error bar represents the standard deviation of OC).
Atmosphere 14 00661 g003
Figure 4. The relative abundance of OC and EC in each size fraction (the error bar represents the standard deviation).
Atmosphere 14 00661 g004
Figure 5. Mass size distribution of OC and EC as a function of the particle diameter (Dp).
Atmosphere 14 00661 g005
Figure 6. Percentages of OC and EC fragments in different particle-size bins.
Atmosphere 14 00661 g006
Table 1. OC and EC concentration (μg m−3) and the ratio of OC/EC in fine and coarse particles.
Particle Size (μm)JSLNSCS-SONSCS-RO
Mean ± SDMean ± SDMean ± SD
OCPM3.010.1 ± 0.632.67 ± 1.271.41 ± 0.50
PM3.0–100.94 ± 0.570.31 ± 0.090.27 ± 0.11
PM1011.1 ± 0.792.99 ± 1.341.68 ± 0.56
ECPM3.03.44 ± 0.820.72 ± 0.360.40 ± 0.28
PM3.0–100.25 ± 0.150.04 ± 0.080.005 ± 0.010
PM103.69 ± 0.890.77 ± 0.400.40 ± 0.29
OC/EC<0.492.51 ± 1.462.72 ± 1.162.40 ± 0.10
0.49–0.956.14 ± 5.194.91 ± 2.723.17 ± 1.44
0.95–1.53.53 ± 1.234.99 ± 3.462.83 ± 1.32
Table 2. MMDs (μm) of the whole range of impactor particle sizes (total), fine and coarse particles.
SiteFine (PM3.0)Coarse (PM3.0–10)Total (PM10)
MeanSDMeanSDMeanSD
OCJSL0.530.255.620.080.590.30
NSCS-SO0.650.155.580.350.720.15
NSCS-RO0.590.165.930.200.730.12
ECJSL0.370.035.570.030.400.05
NSCS-SO0.720.174.401.210.700.18
NSCS-RO0.650.223.531.050.650.21
Table 3. Levels of second organic carbon (SOC) estimated from minimum OC/EC ratios.
Sampling SitesParticle Size (μm)(OC/EC) minSOCSOC/OC (%)
(μg m−3)
JSL<0.492.23.26± 3.2847.6 ± 41.4
0.49–0.951.71.73 ± 1.5950.2 ± 44.7
0.95–1.50.90.43 ± 0.4030.7 ± 27.3
PM1.5-5.42 ± 1.3558.4 ± 9.72
NSCS-SO<0.491.90.36 ± 0.4525.8 ± 27.7
0.49–0.951.80.65 ± 0.6249.9 ± 33.1
0.95–1.51.80.21 ± 0.2145.1 ± 35.8
PM1.5-1.08 ± 1.0235.7 ± 25.4
NSCS-RO<0.491.40.18 ± 0.0224.8± 3.26
0.49–0.951.70.19 ± 0.2459.8 ± 34.5
0.95–1.51.80.12 ± 0.1459.1 ± 34.6
PM1.5-0.50 ± 0.0733.7 ± 6.57
Disclaimer/Publisher’s Note: The statements, opinions and data contained in all publications are solely those of the individual author(s) and contributor(s) and not of MDPI and/or the editor(s). MDPI and/or the editor(s) disclaim responsibility for any injury to people or property resulting from any ideas, methods, instructions or products referred to in the content.

