Article

Use of Association Algorithms in Air Quality Monitoring

by
Paulo Henrique Soares
1,2,*,
Johny Paulo Monteiro
3,*,
Fernando José Gaioto
4,
Luciano Ogiboski
1 and
Cid Marcos Gonçalves Andrade
2
1
Departamento de Informática, Universidade Tecnológica Federal do Paraná, Guarapuava 85053-525, PR, Brazil
2
Departamento de Engenharia Química, Universidade Estadual de Maringá, Maringá 87020-900, PR, Brazil
3
Laboratório de Materiais, Macromoléculas e Compósitos (LaMMAC), Universidade Tecnológica Federal do Paraná, Apucarana 86812-460, PR, Brazil
4
Centro de Engenharias e Ciências Exatas, Universidade Estadual do Oeste do Paraná, Foz do Iguaçu 85870-650, PR, Brazil
*
Authors to whom correspondence should be addressed.
Atmosphere 2023, 14(4), 648; https://doi.org/10.3390/atmos14040648
Submission received: 17 February 2023 / Revised: 9 March 2023 / Accepted: 16 March 2023 / Published: 30 March 2023
(This article belongs to the Special Issue Carbon Emission and Transport: Measurement and Simulation)

Abstract

:
Over the years, there has been a gradual increase in the emission of pollutants, and it is imperative to establish mechanisms to monitor air quality. In addition to carbon dioxide (CO2), particulate matter (PM) is considered one of the main types of air pollution. However, there is a wide variety of pollutants, and high investment is required to carry out detailed air quality monitoring. We present the third version of a previously proposed air quality monitoring platform based on CO2 concentration measurements. In this new version, a specific sensor for PM measurements and an artificial intelligence algorithm were added. The added algorithm traced associations between measurements of CO2 and PM concentrations. Thus, the measurement of a pollutant can be used for estimating the concentration of another. This can contribute to the development of a simpler and cheaper monitoring system. The acquisition of CO2 and PM concentrations was carried out daily over a period of one month. Pollutant measurements were taken in three strategic locations in a Brazilian city. It was possible to determine a correlation between pollutant concentrations for the monitored locations. Thus, it would be possible to efficiently estimate the PM concentration based on the measured CO2 concentration.

1. Introduction

The growing number of motor vehicles and industrial activities in recent years has significantly increased the emission of toxic agents into the atmosphere. Thus, most pollution occurs in cities and cities are subjected to poorer air quality. Pollution causes people to have more significant contact with substances that are harmful to their health [1]. Thus, monitoring air quality has become vital, especially in places with the highest concentration of people. Several studies have proposed air quality monitoring systems in recent years. The popularization of programmable microcontrollers, such as Arduino, and low-cost sensors compatible with this technology have helped popularize those devices. Most projects follow the logic of connecting different types of environmental sensors with Arduino. Then these devices are fixed in the locations of interest to measure the pollutant concentrations. The results are available on displays or via the internet [2,3,4,5]. The use of pollutant sensors adapted to operate on a mobile basis has also been reported. The devices were fixed to cars, buses, and people’s bodies to estimate the amount of pollution a citizen is subjected to when transiting a large urban center [6,7,8].
Some reported monitoring systems are more technologically sophisticated. They demonstrate the implementation of data analysis capabilities using artificial intelligence algorithms to establish patterns and predict future values. A linear regression algorithm has been widely used when the objective is to scan a database and estimate the future curve of pollutants [9]. On the other hand, association algorithms have efficiently established associations or correlations in the data [10].
The use of an association algorithm has been carried out by the Apriori tool. The Apriori algorithm is well-known in data mining operations to obtain association rules. It uses the depth search technique and generates a grouping of numerous items known as standardized candidate items. These candidate items are associated with the object used as a parameter. Patterns considered infrequent are automatically excluded. The entire database is evaluated, and frequent item sets are obtained from candidate item sets [11]. Apriori has been widely used in commercial applications to predict user interest in new products based on already purchased products [11]. It has been used in monitoring systems to make predictions of the concentration of pollutants in a given city using measurements taken in other cities with similar characteristics [10].
Among the various pollutants monitored by proposed devices, particulate matter (PM) is considered one of the most dangerous because it is easily inhaled. PM can reach deep into the respiratory system and cause severe damage to health, such as respiratory and cardiovascular diseases [12,13]. PM is a group of pollutants formed by dust, smoke, and all types of solid or liquid material that remain suspended in the air due to their small size. PM emitting sources are categorized as natural and anthropogenic. The primary natural sources are volcanoes, dust from air displacement, forest fires, and marine aerosol.
On the other hand, the primary anthropogenic PM sources are burning fossil fuels, thermoelectric plant usage, and industrial activities [14]. PM is classified according to particle size. The two main types are PM2.5 and PM10, where the particles have mean aerodynamic diameters of less than 2.5 μm and within the 2.5–10 μm range, respectively. PM2.5 is the most harmful to humans because it remains suspended longer (due to its tiny size) and is more easily inhaled [15]. According to World Health Organization (WHO) data, PM, especially PM2.5, is responsible for 4.2 million annual deaths. Research indicates that particulates can cause heart and neurological problems as well as respiratory health problems, such as asthma, bronchitis, respiratory failure, and lung cancer, among many others [15].
It is a complex and costly task to quantify the concentration of all air pollutants simultaneously. Typically, specific equipment and techniques are used to monitor each substance. Air quality is usually determined using only the CO2 concentration measurement to reduce costs. CO2 is considered an excellent indicator, and when the concentration of CO2 in an environment is high, then the other pollutants (such as sulfur dioxide, nitrogen dioxide, and PM) are also usually at high levels [16,17]. This behavior is plausible because CO2 pollution shares the same anthropogenic sources of production of these other gases (mainly fossil fuel burning and industrial activities). However, this approach only qualitatively estimates air quality, it does not allow for determining the concentration of other pollutants or even knowing which toxic agents are effectively present. CO2-based air quality measurement prevents more detailed studies from being carried out that could lead to decision-making or policy establishment to constrain any specific pollutant’s alarming increase (above acceptable levels). For PM, the WHO strongly recommends avoiding environments with atmospheric levels above 25 μg/m3.
Our group has already acquired know-how in building air quality monitoring platforms based on CO2 measurement and using artificial intelligence tools [17,18,19,20,21,22,23]. Here we present significant advances on the previously proposed platform. PM sensors were added to the CO2 sensors of the previous design. Furthermore, an association algorithm was implemented in the data analysis module to expand the use of artificial intelligence. The algorithm’s function was to determine correlations between CO2 and PM concentrations. The platform’s new features were tested and evaluated by measuring CO2 and PM in a Brazilian city, and it was possible to determine a relationship between the pollutants. It was demonstrated that it would be possible to obtain quantitative data about the concentration of the two contaminants by only measuring one. Additionally, the platform can expand the number of correlated pollutants.

2. Materials and Methods

2.1. History and Evolution of the Monitoring System Architecture

The first version (2018) aimed to perform CO2 monitoring and provide data mining tools using artificial intelligence for a more accurate air quality analysis. Then the sensor network did more than measure the concentration of the pollutant gas: it found profiles of the variation in CO2 concentration. This tool facilitates the work of researchers and engineers in the environmental area with advanced data analysis. The CO2 sensor used was the MG811 (Winsen Electronics), which can detect values between 350 and 10,000 ppm. Several MG811 sensors were used at different points interconnected by an Xbee PRO 60 mW. This wireless module carried the electrical signals between the sensor “nodes” of the network until reaching a central sensor node. The electrical data stored in the central sensor were converted into numerical values of CO2 concentration using an Arduino Uno R3 microcontroller. A Raspberry Pi was coupled to the central sensor, and a local database was installed. Thus, data was temporarily and locally stored for synchronization to a main server via the Internet. In case of a lack of internet signal, data from the central sensor node were synchronized in the future. Finally, data stored in the main server’s MySQL database were analyzed using artificial intelligence techniques to generate relevant information about air quality. In this case, classification algorithms were used to determine the times when the pollution indices were inadequate through a query module [17].
The second version (2021) brought an architecture change to increase the versatility of the monitoring platform and allow reliable CO2 measurements from any location. Data loss during transmission between “node” sensors was an issue in the first version. This often occurred due to physical barriers (buildings and vegetation) in the monitoring location. The data loss was mitigated through the use of standalone MG811 sensors. Each measurement point in the network could measure, convert electrical signals, store, and send data to the central server via a 4G internet signal or wireless network when they were active. Then the same data analyses using artificial intelligence tools were performed. Using autonomous sensors solved the data loss problem and expanded the range of locations where the monitoring platform worked [24].
In this third version, CO2 is still the main object of the measurements since it is considered a good indicator of air quality [22]. However, a new sensor for measuring PM and more data analysis features have been incorporated into the platform. In the data analysis module, an association algorithm called Apriori was added. It can trace associations between the concentrations of toxic agents measured by the monitoring system. Thus, the association between CO2 concentration and PM was determined. Each autonomous measurement point in the network had the MG811 (for CO2 measurement) and PMS5003 (Generic, for PM measurement) sensors. The PMS5003 sensor can individually measure PM10 and PM2.5 particulate matter. The sensor is already calibrated at the factory. It operates with a supply voltage of 5 V, and can monitor particulate concentrations in the 0–10,000 μg/m3 range, with an error of 10% [19]. The MG811 and PMS5003 sensors were connected to an Arduino microcontroller. It was responsible for transforming the electrical signals from the sensors into concentrations of CO2 and PM in the units of ppm and μg/m3, respectively.
The Arduino was connected to a Raspberry Pi minicomputer, where a local database (MySQL) was installed to store the data locally. The set (MG811 and PMS5003 sensors, Arduino microcontroller, Raspberry minicomputer, and a battery) formed the autonomous sensor node of the network and was placed at each point that delineated the monitored area. This architecture allows you to take measurements in virtually any type of environment. Using the Python language, an algorithm was implemented in each autonomous sensor node to check if there was an active Internet connection (4G or wireless network) for real-time data replication to the main server’s MySQL. However, if the environment did not have internet access, the data was stored on a memory card in the Raspberry Pi, allowing for future synchronization. At the end of the process, all concentrations were stored in a single main server’s MySQL that offered data analysis and results consultation modules to generate knowledge and assist decision-making. The main server has robust computational resources for future query and data analysis processes. Figure 1 summarizes the monitoring platform’s operating cycle.

2.2. Data Analysis and Query Modules

The MG811 and PMS5003 sensors measured CO2 and PM concentrations, respectively. These concentrations were stored in a database table, and metadata, such as date, time, and sensor node identifier, were also recorded. The metadata acquisition allows individualizing the measurements of each sensor node to carry out more specific queries and enables more dynamic analysis of these records. The query module developed in this project can be divided into two subsystems: one to query the history of the records and another to perform predictive analysis using artificial intelligence (classification and query algorithms). The system responsible for enabling queries of the history of the records provides an interface with some filter options. The user can view CO2 and PM concentrations by date, time, location, and more. Figure 2 shows one of the query screens in the query interface, which displays the concentration of PM10 and CO2 filtered for a specific date.
The consultation system is entirely web-based and can be accessed from any browser. Data from the monitoring platform can be accessed from anywhere, even using a cell phone or tablet connected to the Internet. Simple queries only designate the concentration of pollutants at specific dates and times. The air quality assessment must be completely manual. However, as the number of records stored in the database increases, much valuable information may not be noticed by users because the human brain cannot find patterns in large masses of data. In situations like this, artificial intelligence can be an essential tool. Several machine learning algorithms can determine patterns and assist in massive data analysis [20].
Previous versions of the monitoring platform already had the C4.5 classification algorithm implemented. This algorithm must be trained with a large amount of data to learn existing patterns. Thus, the C4.5 was trained with the CO2 and PM measurements in the database. Therefore, the algorithm can predict the dates and times when the air quality is inadequate [21]. In addition, a new machine learning algorithm has been added to this new platform. It is known as the association algorithm. Its objective was to trace a relationship between variables [22]. The Apriori tool uses an association algorithm on the data. It allows for estimating PM levels from CO2 concentration measurements. These artificial intelligence-based analyses were also accessed in the query module.

2.3. Experimental Set-Up

Field tests were carried out at Maringá, Brazil, to evaluate the efficacy of the proposed monitoring system. The city has approximately 350,000 inhabitants and is popularly known as the “green city” due to its large expanses of native vegetation in parks and woods. Despite this, Maringá has one of the highest rates of cars per inhabitant, which contributes significantly to reducing air quality [18].
The project had three sensor nodes distributed at strategic points in the city. The methodology used to select the monitoring sites was based mainly on the high flow of vehicles. Sensor node 1 was located in the city center, where the number of vehicles is consistently high. Sensor node 2 was responsible for monitoring the city entrance, as large traffic jams of cars and trucks were recorded at specific times. Finally, sensor node 3 was inserted on a highway near Maringá, where vehicle movement is more evenly distributed throughout the day. Sensor node 3 did not have an internet signal as it was far from 4G signal towers or domestic wireless networks. No sensor was positioned in a location that would receive direct contact with the smoke emitted by vehicles, which could compromise the accuracy of the measurements. The main objective was to measure the concentration of pollutants distributed in the air.
Each sensor node was placed inside a waterproof plastic case. The battery (ActPower) that powered the sensors had 12 V, 1.3 A, and could keep the equipment working for 10 days. The sensor nodes performed CO2 and PM concentration measurements every 10 s from 05:00 to 21:00 for 30 days. The data was immediately recorded in the local database and synchronized to the main server when the Internet signal was active.

3. Results

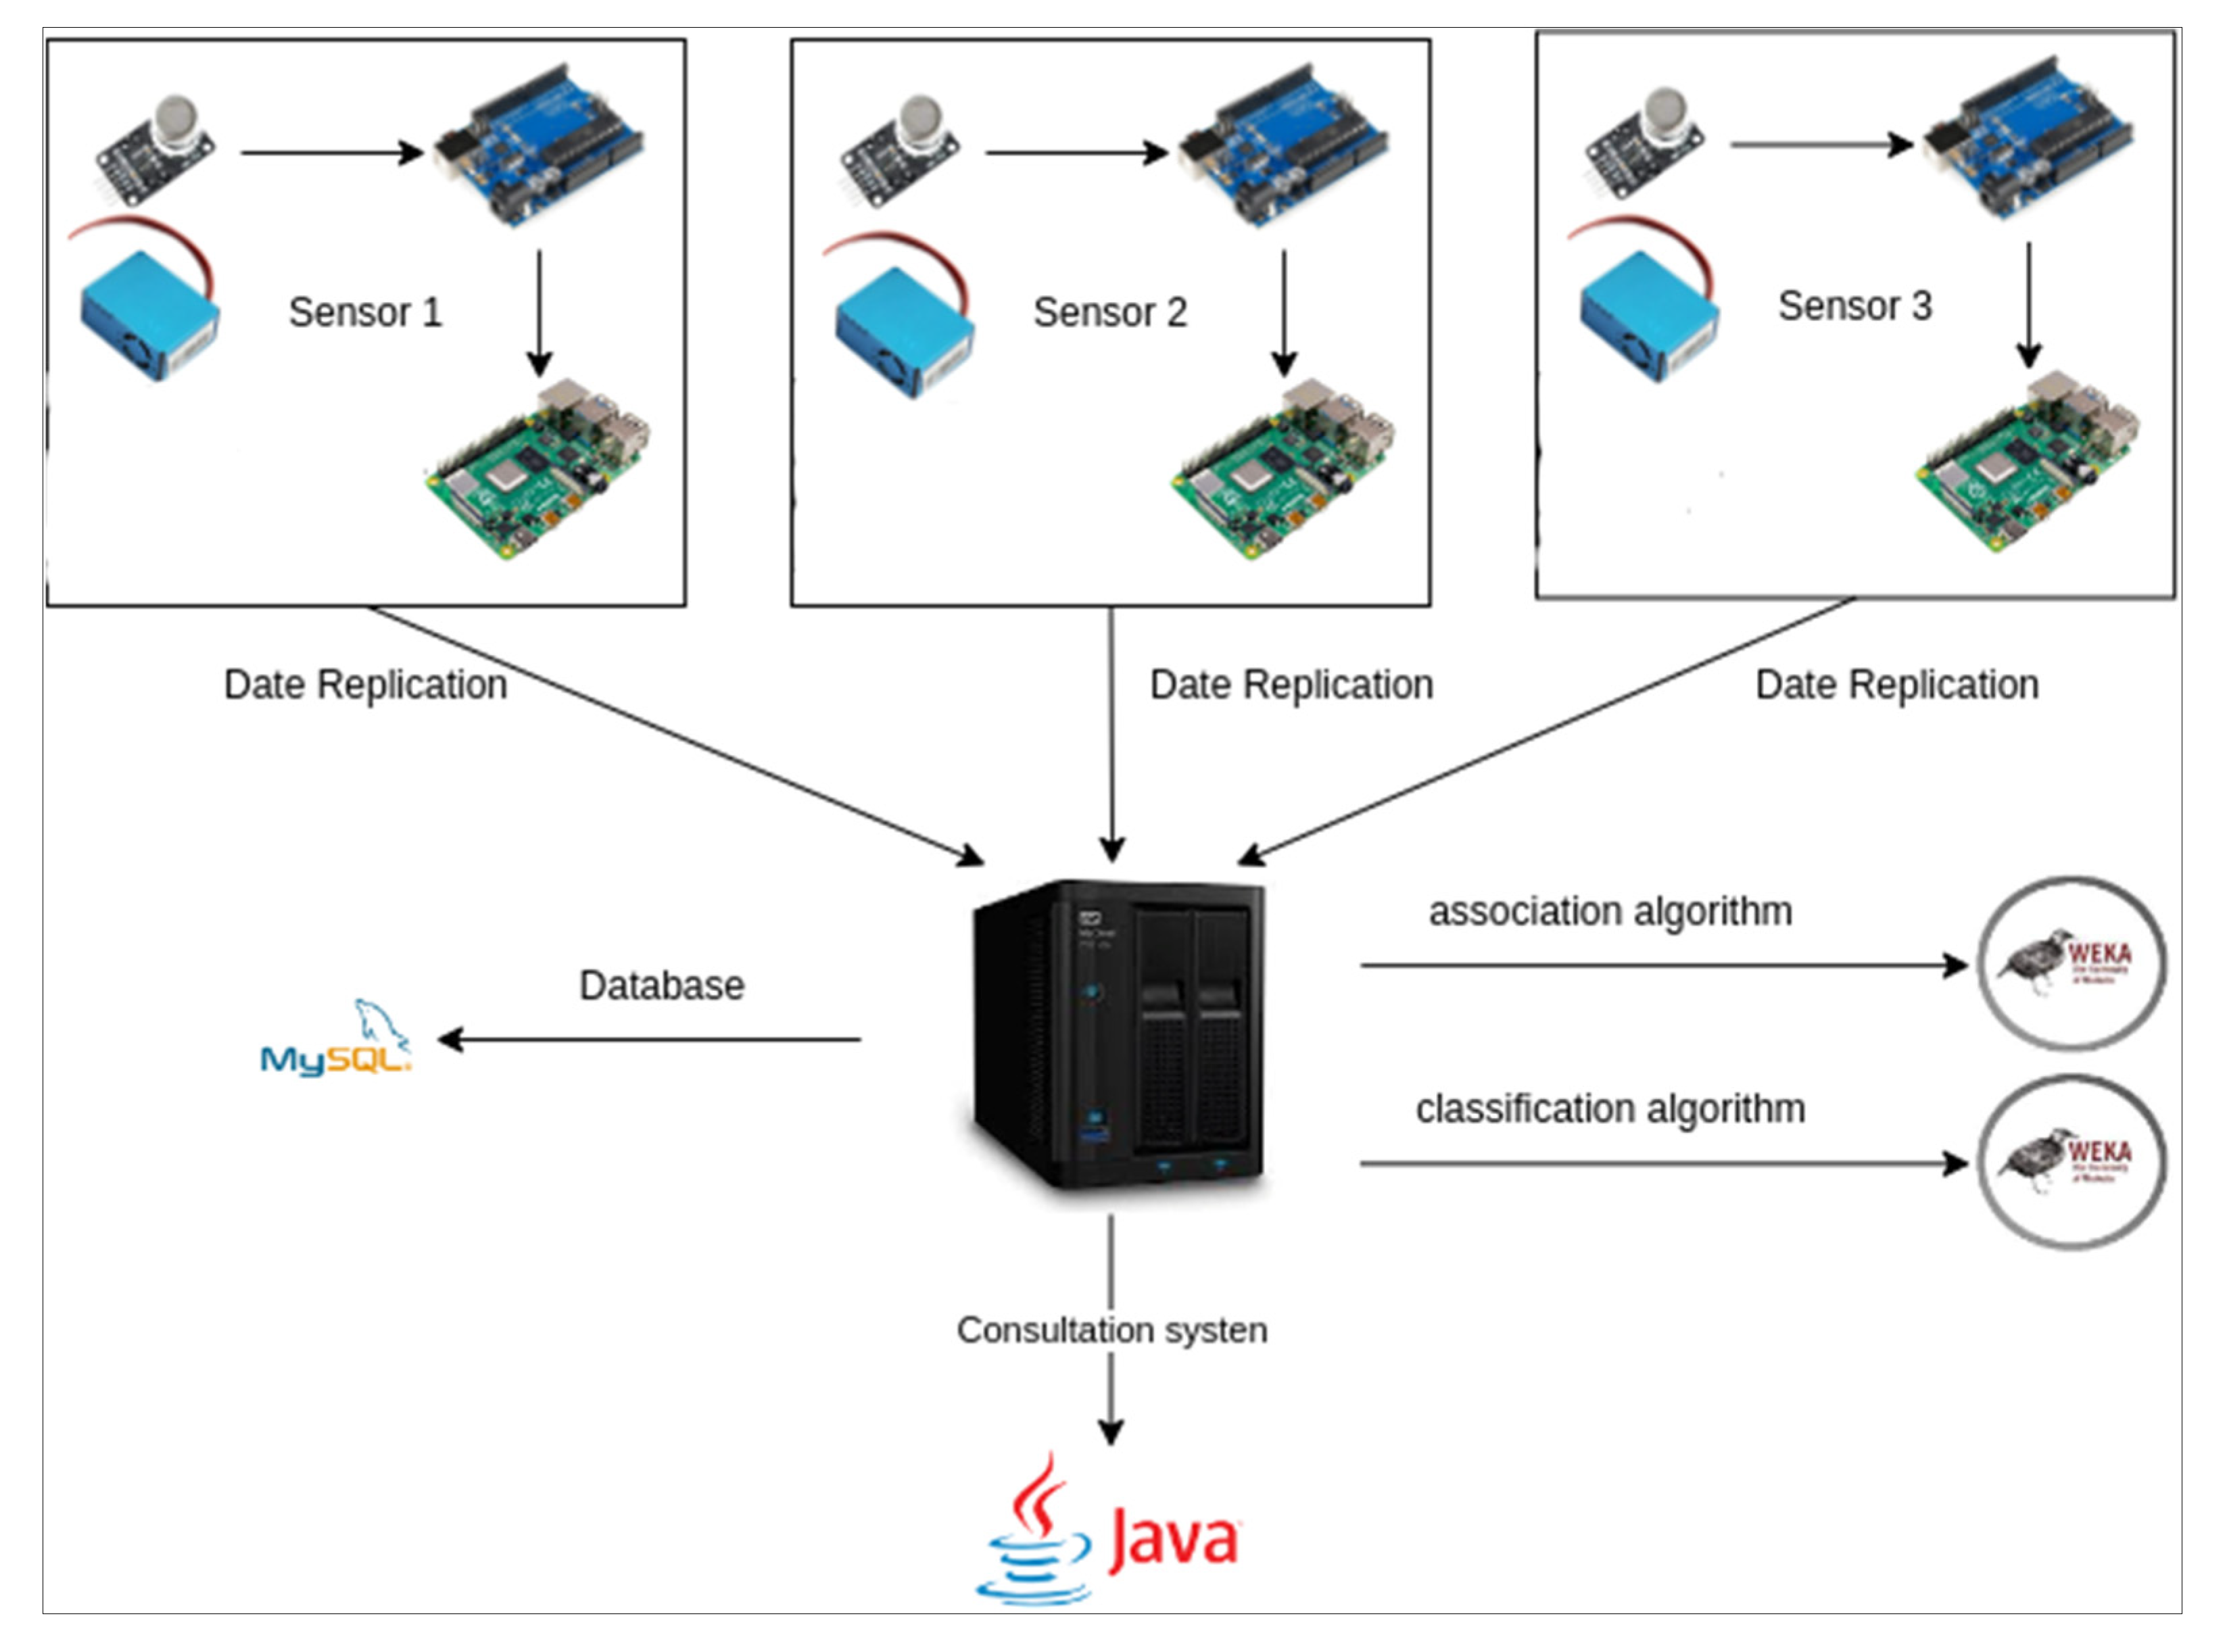
The monitoring system allowed CO2 and PM (PM10 and PM2.5) concentrations to be measured. A daily average of 6120 records were acquired, and a total of 171,360 by the end of the fourth week. The disk space occupied by the MySQL database was approximately 23 MB.
Data analysis modules (C4.5 and association algorithms) and queries were implemented on the main server to work on the collected data. The query module has several interfaces that allow the user to access information in several different ways and has a tool that allowed the generation of tables to illustrate a specific moment concerning the concentration of pollutants. For example, Table 1 displays the maximum and minimum values of CO2, PM10, and PM2.5 during the 4-week monitoring period. The date and time of the records are also displayed.
The WHO recommends that the PM concentration be less than 25 μg/m3, especially of PM2.5, which has more harmful effects on health. For CO2, problems for the human organism are observed at concentrations above 600 ppm. Furthermore, the high concentration of CO2 indicates the presence of dangerous concentrations of other pollutants in the air [19].
The data in Table 1 show that the city entrance (sensor node 2) showed the highest peak concentrations of CO2, PM10, and PM2.5 as being 817 ppm, 26.4 μg/m3, and 28.7 μg/m3, respectively. In general, concentration peaks for pollutants in all locations always occurred around 18:00. On the other hand, the lowest levels of air pollution were recorded around 05:00 at sensor node 3 (highway).
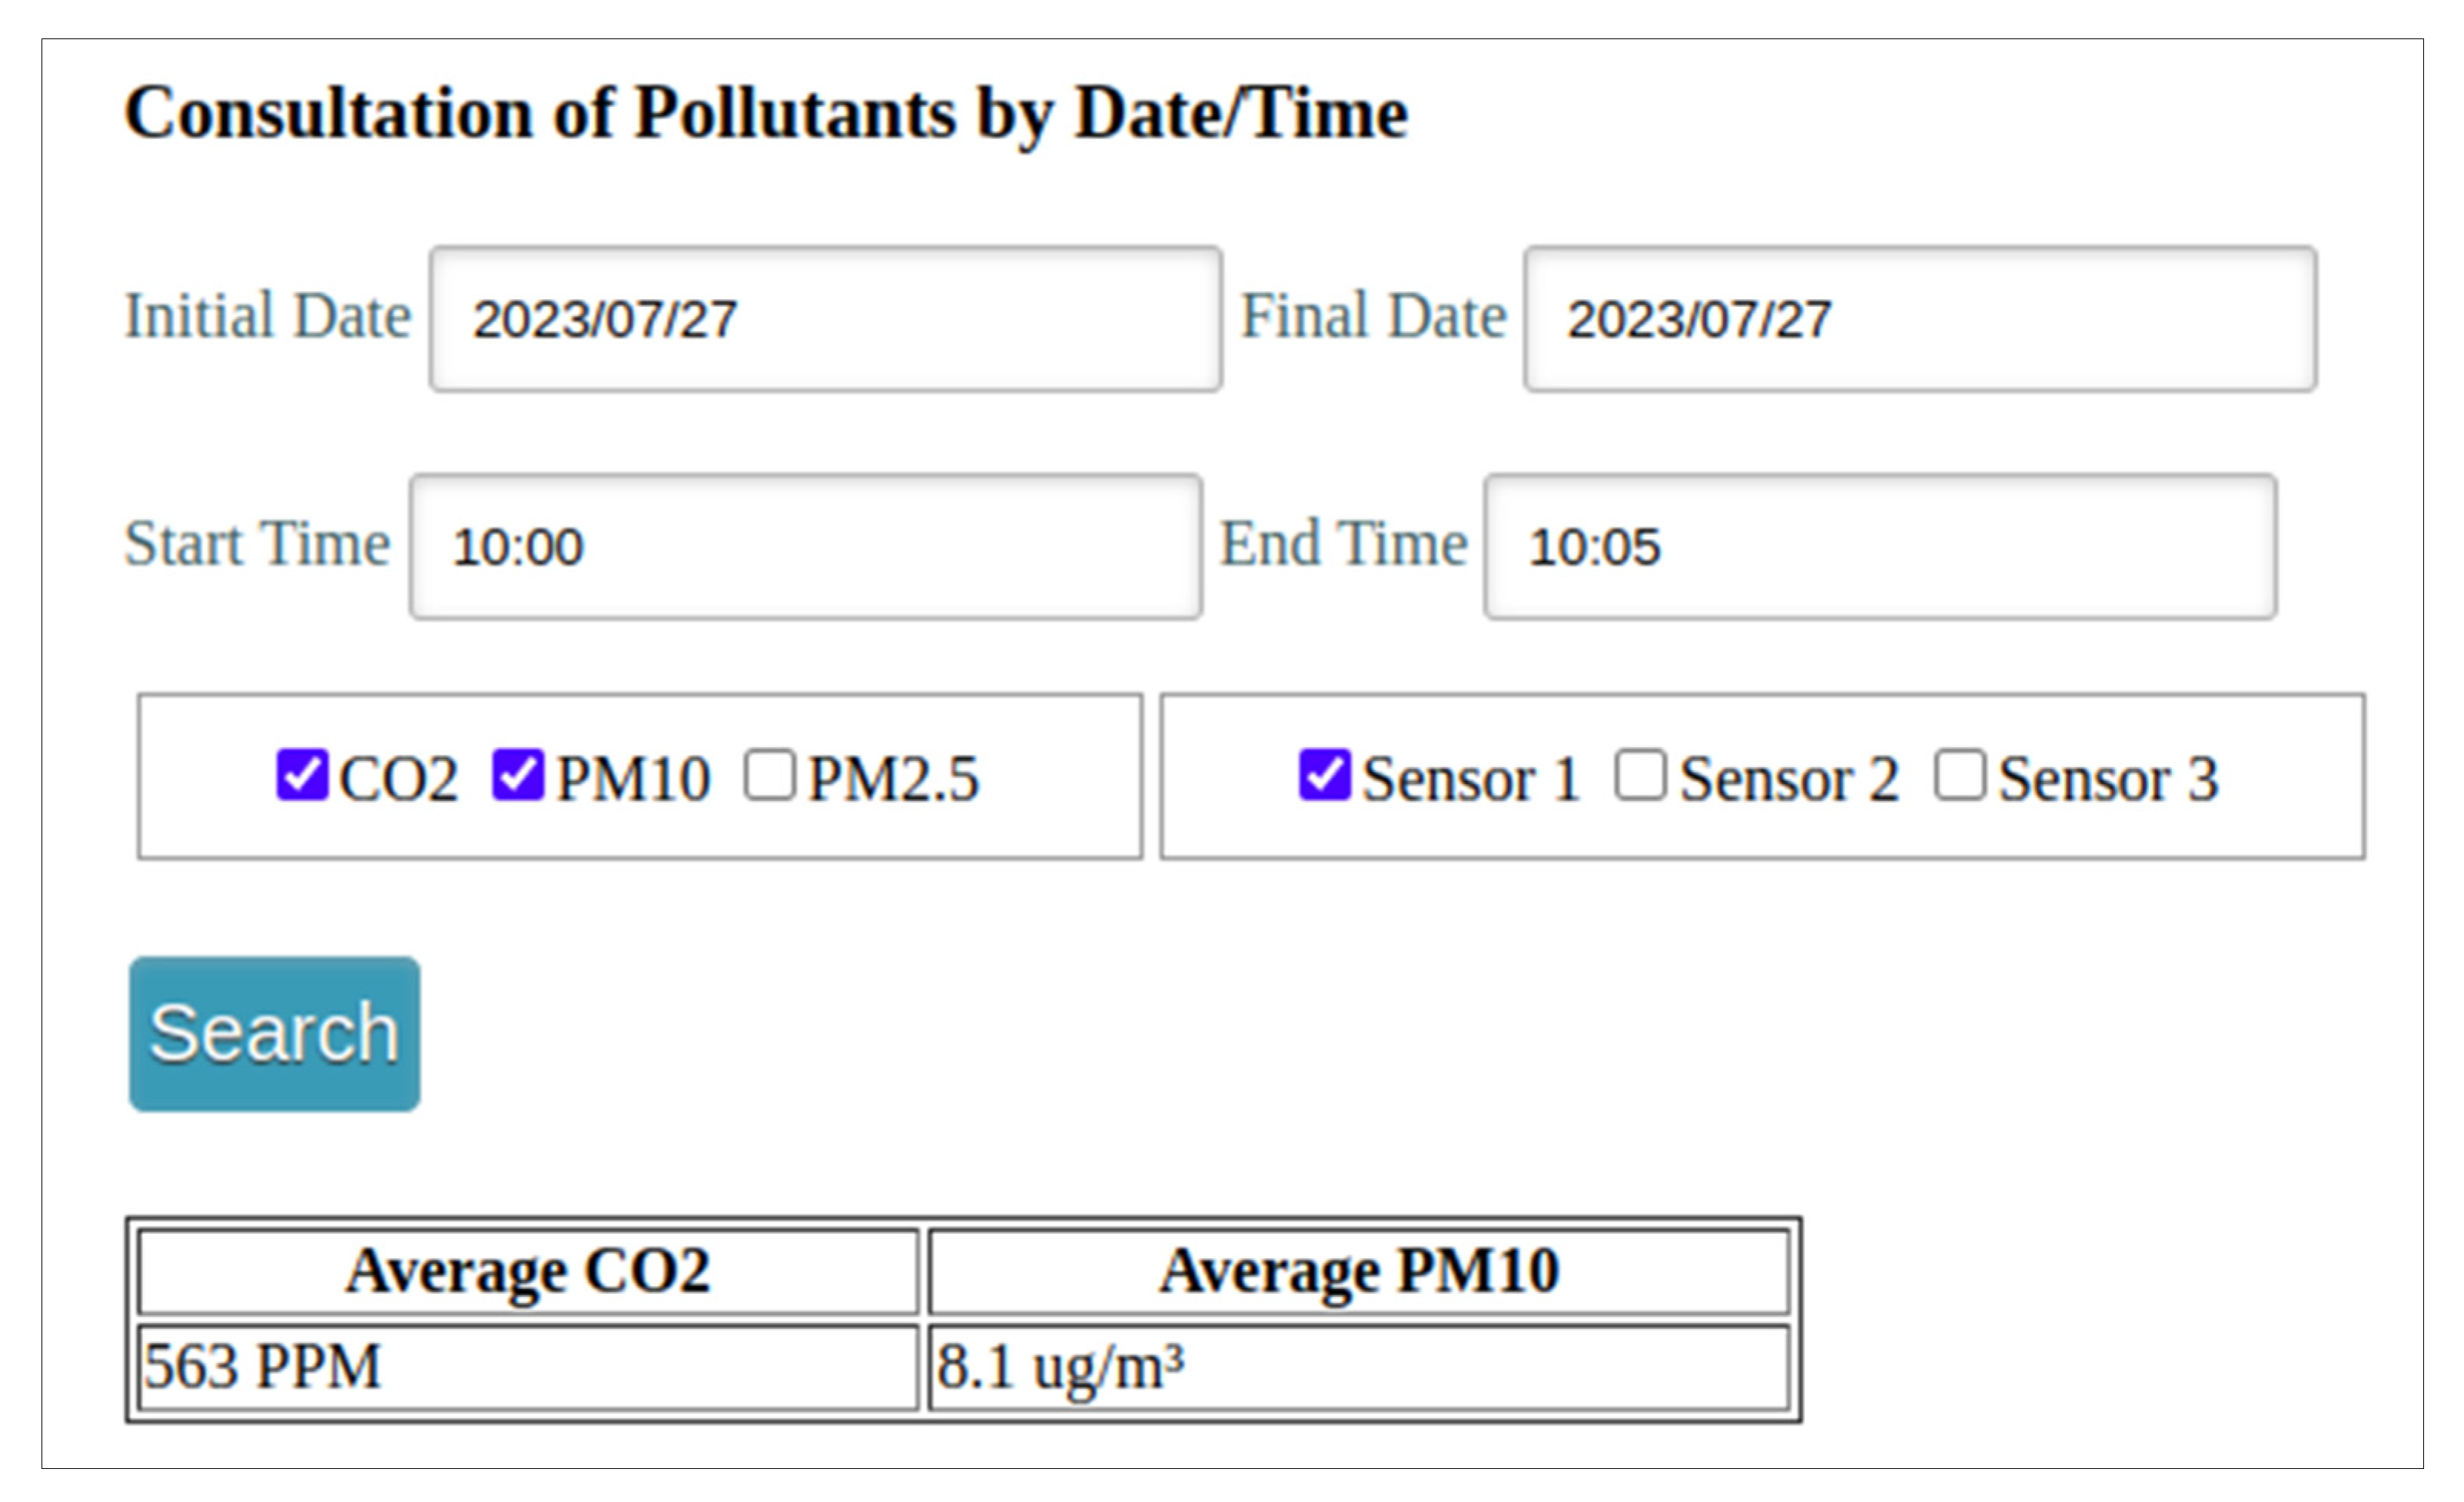
The query module also has a tool for generating graphs, allowing users to analyze the variation in pollutant concentrations over a period in detail. The user informs the period, and the system dynamically generates a graph describing the average CO2 and PM concentrations curve.
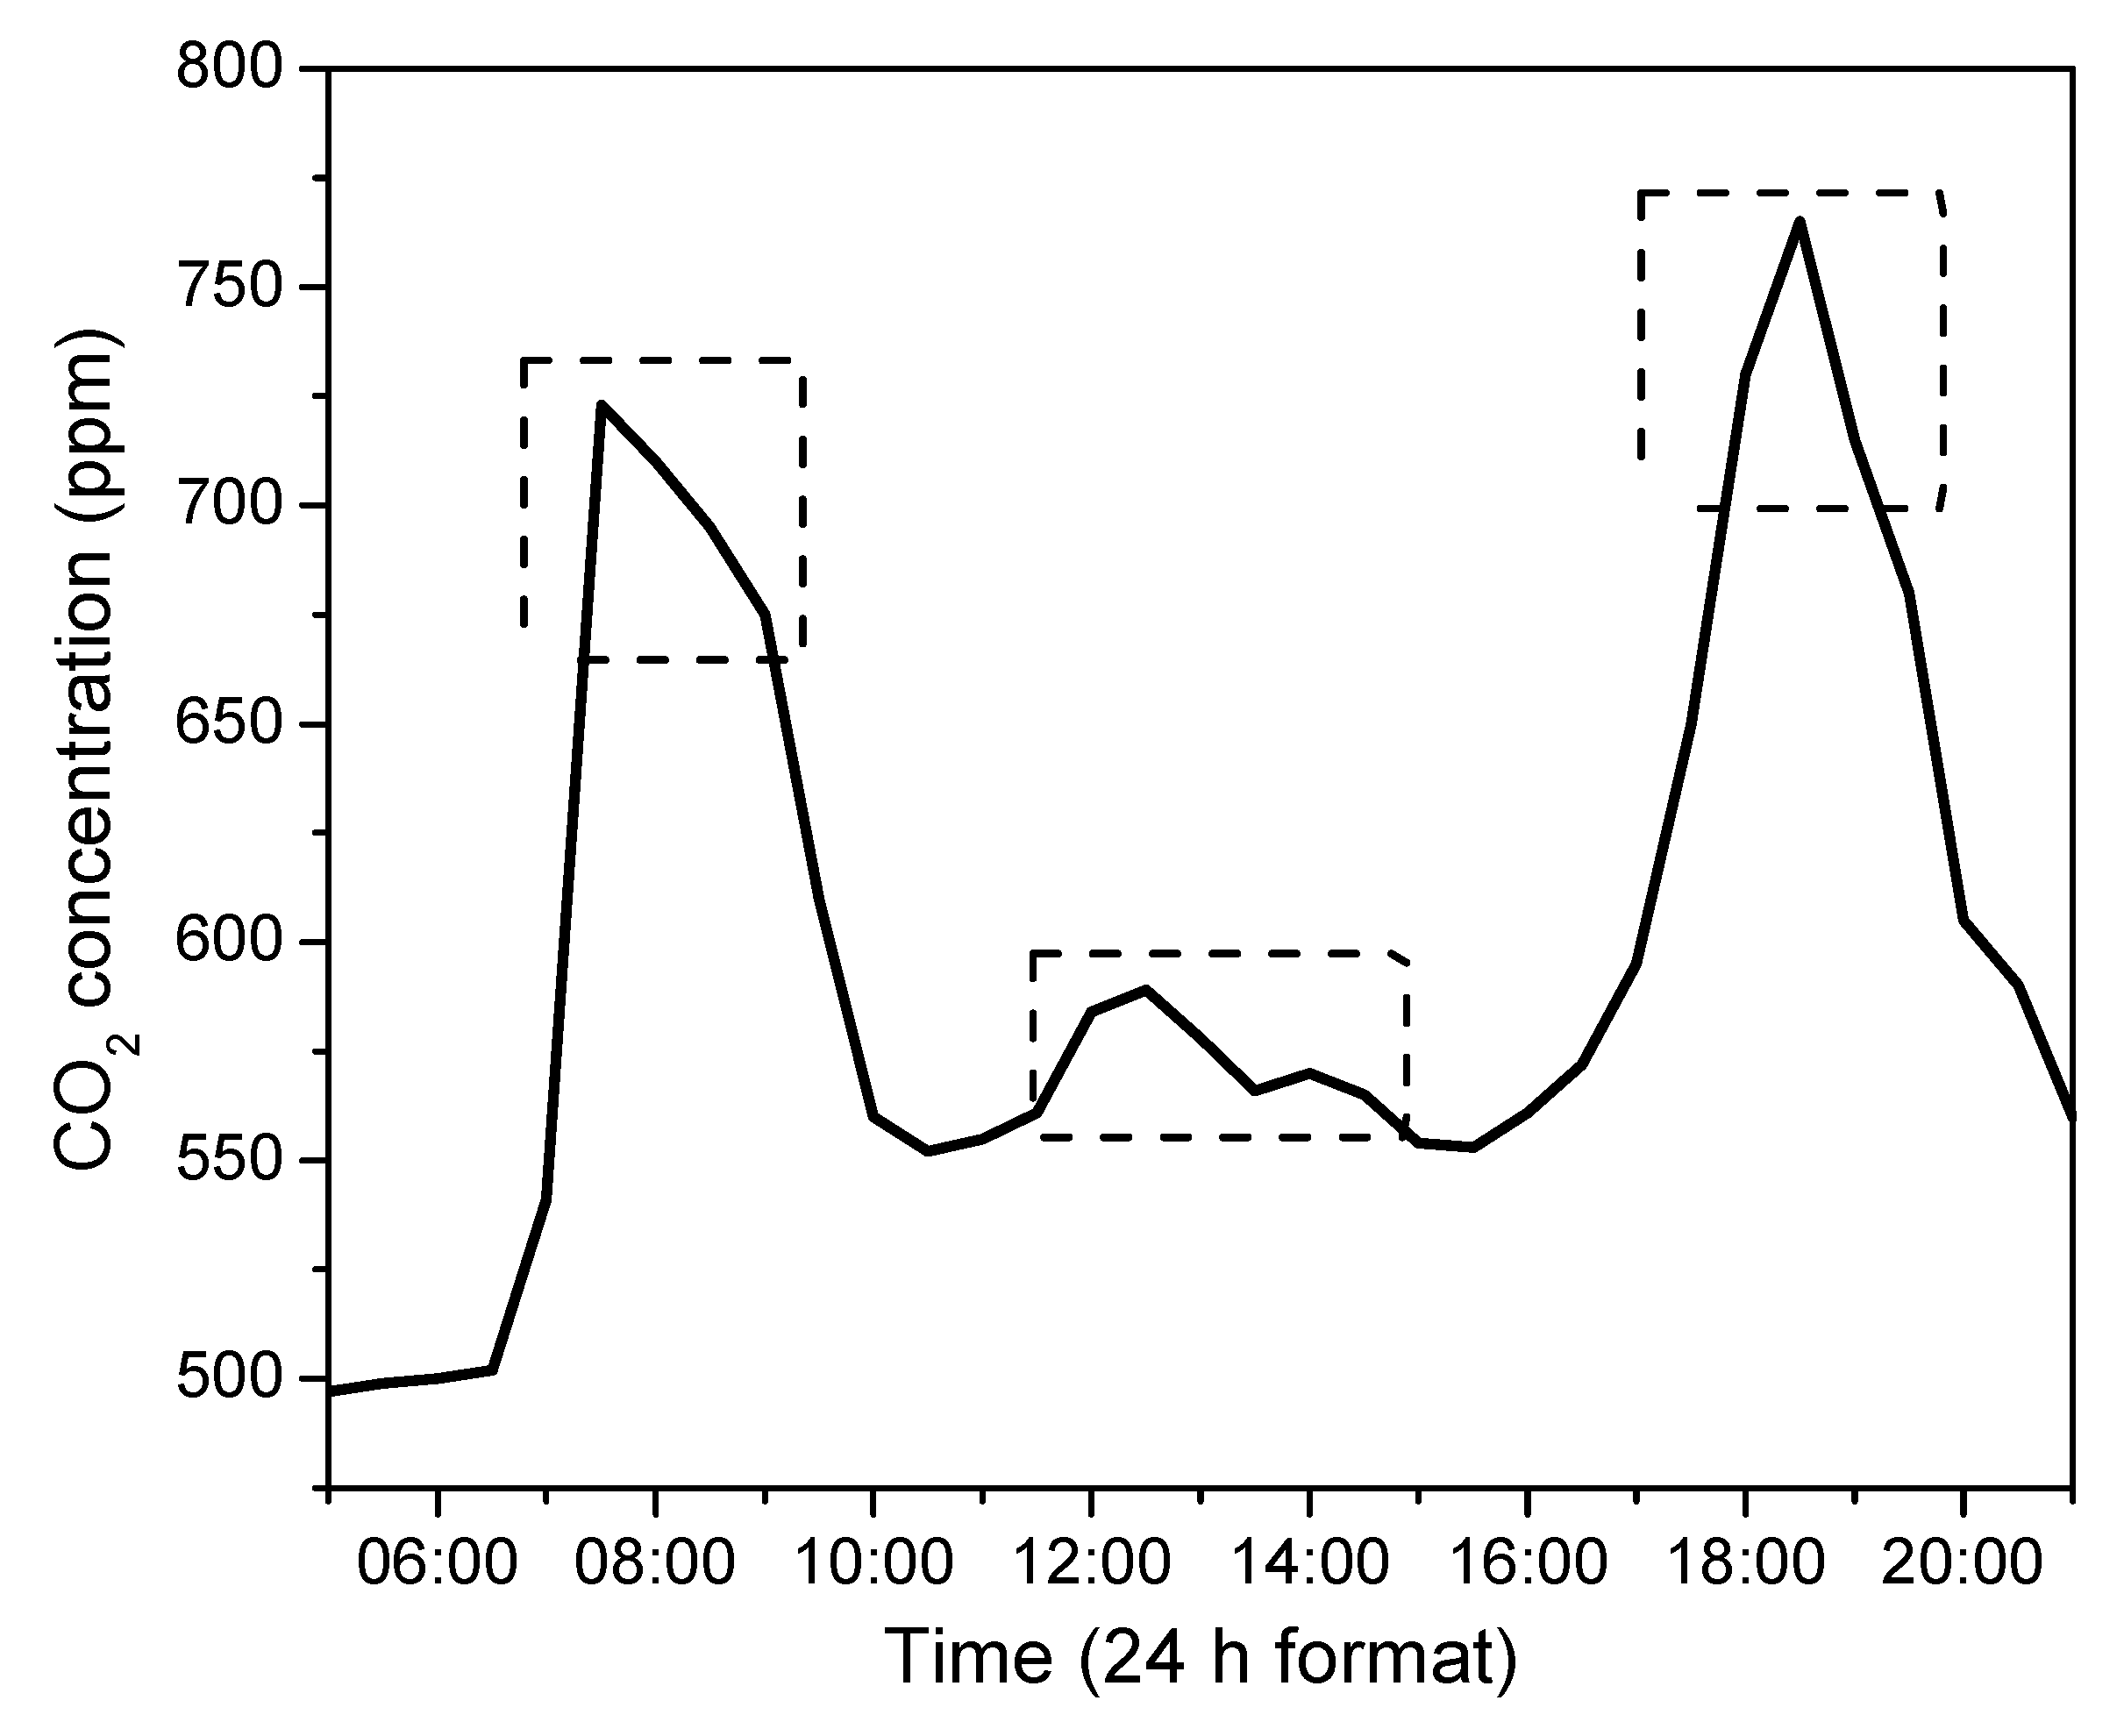
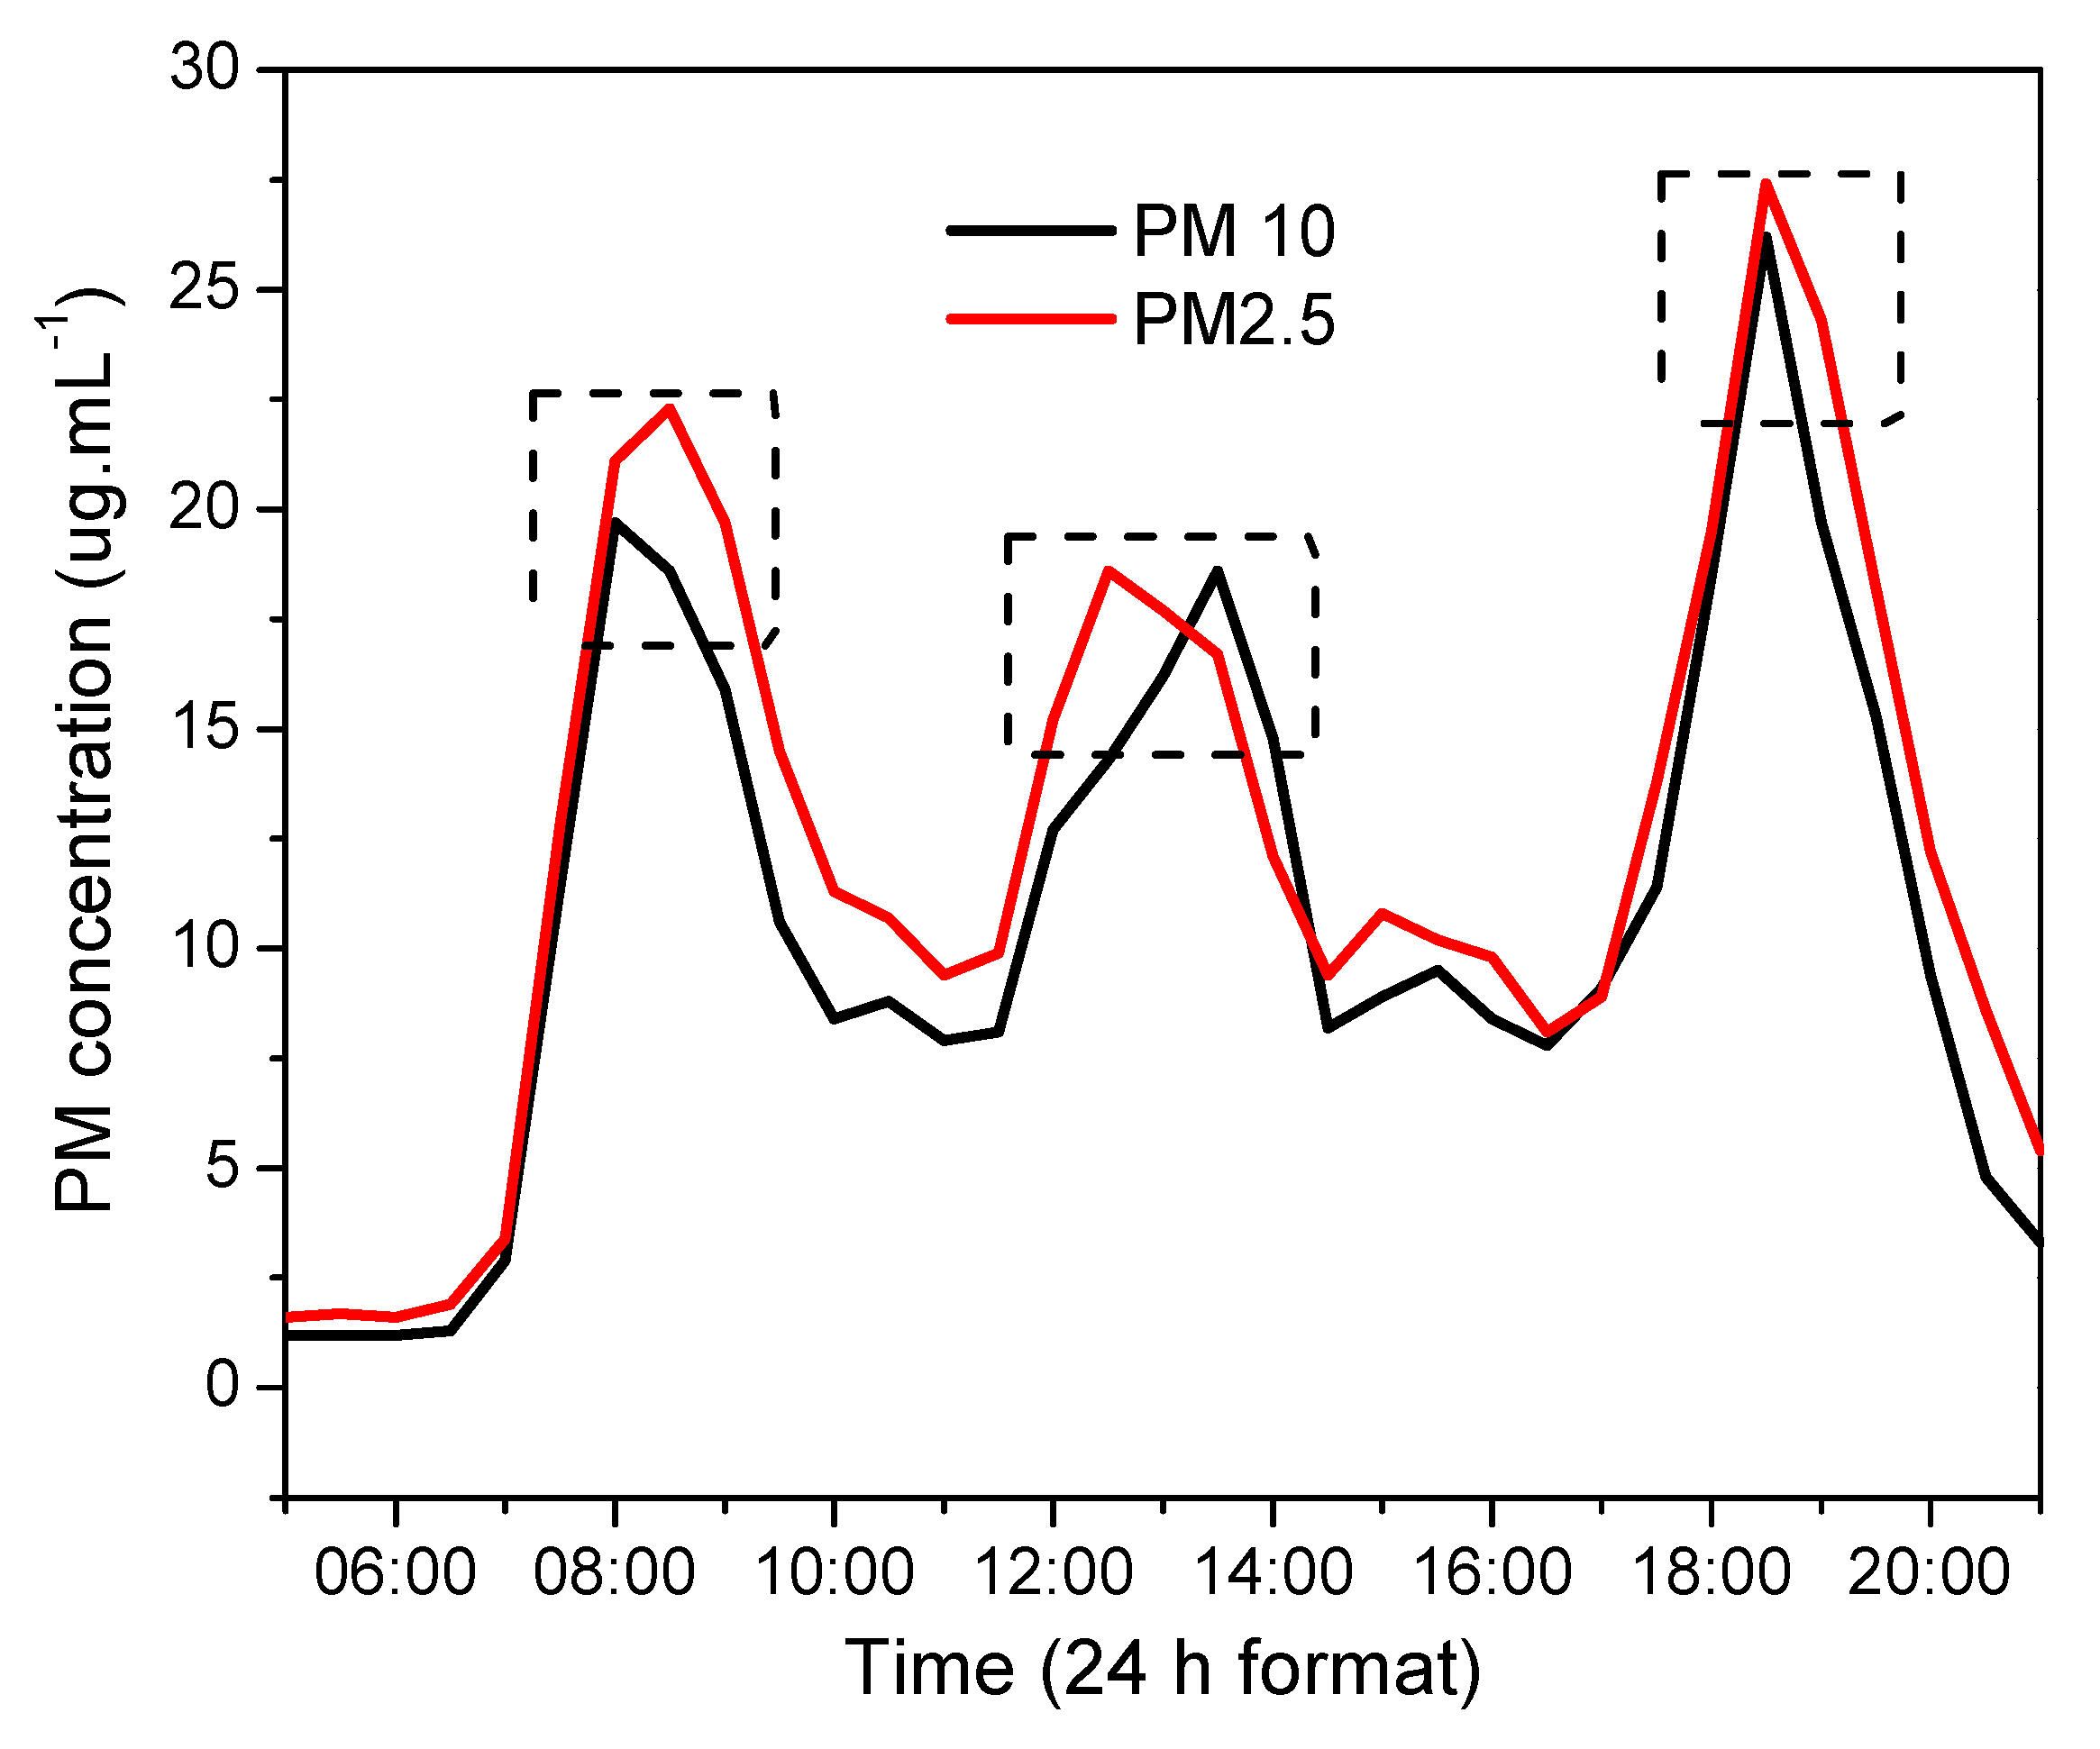
 Figure 3 and Figure 4 show the average variation in CO2 and PM (PM10 and PM2.5) concentration, respectively, measured by the sensors during the 4-week monitoring period. The query can also be performed for an individual sensor node.
Figure 3 and Figure 4 show CO2 and PM concentrations considerably increasing in some periods of the day (in three periods, as highlighted in the figures). Visually, the curves do not allow precise determination of when the air quality was compromised (CO2 and PM concentrations above 600 ppm and 25 μg/m3, respectively). So the data analysis module used the C4.5 algorithm to do this work. Figure 5 shows a decision tree generated by the query module as a result of data analysis by algorithm C4.5. The tree points out when air quality is compromised, that is, the concentrations of CO2 and PM are high. Three periods of the day that presented poor air quality were observed for the city center (07:16–09:11, 11:32–13:54, and 18:02–19:49) and city entrance (07:18–09:32, 12:07–13:16, and 17:57–19:25). On the highway, poor air quality was observed in only two periods: 07:42–08:58 and 18:13–19:24.
The records stored in the database over the 4 weeks were divided into two groups. The first set (75% of the records) was used to train the C4.5 algorithm, and the second (25% remaining) was used to test. The percentage of correct answers was 78.2%, that is 22.8% of the data was outside the pattern found.
The monitoring platform also used the association algorithm known as Apriori. The reason for using this algorithm is to check if there is a relationship between CO2 and PM concentrations. In practice, the system should determine whether, when CO2 is at high levels (above 600 ppm), PM2.5 and PM10 also exceed safe limits (25 μg/m3). For this analysis, 75% of the data was also used for training the algorithm and 25% for testing. The result is shown in Table 2.
The data in Table 2 show that 81.4% (for PM10) and 86.8% (for PM2.5) of the times when the CO2 concentration was within the safe levels, the PMs were also within the appropriate limit. On the other hand, when CO2 exceeded 600 ppm, PM10, and PM2.5 also exceeded 25 μg/m3 77.5% and 71.9% of the time, respectively.

4. Discussion

The concentrations of pollutants in the air mainly occur due to vehicles’ movement. Air quality decreases as the number of vehicles increases. The highest concentration peaks for CO2, PM10, and PM2.5 (Table 1) were observed for sensor node 2, located at the entrance to the city. At this point, large and frequent traffic jams are recorded, which explains the poor air quality in this region. Furthermore, concentration peaks were noticed for all sensor nodes at specific times. They were observed in the early morning (7:00–9:00) and in the late afternoon (18:00–19:00). The vehicle flow increases considerably in all parts of the city and on the highway in these periods due to people commuting between home and work (and vice versa). The monitoring system records corroborated this. Likewise, the lowest levels of pollutants in the air were observed in the early morning (around 5 am), before working hours. This time coincides with significantly reduced vehicular traffic (mainly on highways) as the population still rests in their homes.
The curves in Figure 3 and Figure 4 show the profile of the pollutant concentration variation throughout the day. It was noted that the monitored pollutants are more concentrated always in the same times of the day. This profile was observed to be the same for all monitored locations. These periods of higher incidence of pollutants coincide precisely with when people travel from home to work and vice versa (at the beginning of the working day, lunchtime, and the end of the day). The increase in pollutant levels was always lower at lunchtime, as many people have their meals at work or in nearby places (they do not use a vehicle). It is important to note that measurements taken on weekends were not considered as they would distort the average values due to the typical low flow of vehicles throughout the weekend.
Algorithm C4.5 was used to determine the pattern of times when the air quality became inadequate because the visual analysis of the curves in Figure 3 and Figure 4 does not allow doing this precisely. The C4.5 classification algorithm works very well for situations like this because it can generate a decision tree with the patterns found in a mass of data. The decision tree illustrated in Figure 5 showed that, by default, in the city center and at the entrance to the city, the air quality is too poor precisely in the three periods of the day with the highest vehicle flow. More specifically, it determined that during the time ranges 07:06–09:11, 11:32–13:54, and 18:02–19:49 it is not recommended for humans to be downtown. At the entrance to the city, pollution rates are alarming between 07:18–09:32, 12:07–13:16, and 17:57–19:25. Finally, on the monitored road, in the intervals between 07:42–08:58 and 18:13–19:24, the highest concentration of pollutants was verified. The alarming worsening of air quality expected for lunchtime was not observed for the highway as it is a region outside the city. The margin of error for the decision trees was 22.8%.
Regarding Table 2, some very relevant information was found because of the association algorithm action. For the monitored environments, there is a significant relationship between the increase in CO2 concentration and PM. In 77.5% and 71.9% of the times that the CO2 concentration exceeded 600 ppm, PM10, and PM2.5 were also above the ideal limit. It is important to emphasize that it is impossible to state that the cause of the increase in PM concentration is the high concentration of CO2. In any case, the result is plausible since the sources of CO2 and PM are essentially the same (vehicle flow). Artificial intelligence algorithms do not determine cause or effect; they only find patterns between variables that allow for predicting the behavior of a variable based on the value of another [17].
The results of the classification and association algorithms were within an acceptable margin of error. However, the relationship between CO2 and PM decreased on rainy days, which increased the error percentage. Rainwater accelerates the PM’s decanting process and reduces its concentration in the air [24]. On the other hand, no significant change was observed in the CO2 concentration profile under the same conditions. In this way, relative humidity measurements can contribute to a better analysis of the behavior and correlations of air pollutants.

5. Conclusions

This work demonstrated the improvements implemented in an air quality monitoring platform that has been developed since 2018. The first novelty allowed the measurement of PM10 and PM2.5 levels in the air, in addition to the CO2 concentration measurement previously implemented. The platform showed the versatility to monitor different environment types as it was used in urban areas and on the highway, which did not have an Internet signal. The query system was also efficient. It could quickly display all the information and historical data of the measurements performed by the sensors. The C4.5 classification algorithm was adapted to generate a decision tree containing the times when, by default, the levels of CO2, PM10, and PM2.5 were inadequate. The new artificial intelligence algorithm, by the Apriori tool, was added to the platform. It determined the association between CO2 and PM concentrations at the monitored sites. It was shown that 77.5% and 71.9% of the time when the CO2 concentration was at unsafe levels, the PM10 and PM2.5 were also at elevated concentrations. However, it should be noted that on rainy days the association between pollutants decreases. Humidity has a more significant influence on PM10 and PM2.5 than on CO2. Thus, including a humidity sensor would be interesting for better correlation analysis. Finally, it was possible to prove that CO2 is a good indicator of air quality, making it possible to trace an association with PM. The monitoring platform was effective and efficient and can be a handy tool for researchers and engineers in the environmental area. However, the project will continue to be improved to present new possibilities and more complete analyzes of air quality.

Author Contributions

Conceptualization, supervision, and project administration, C.M.G.A.; methodology, software, validation, formal analysis, investigation, and resources, P.H.S.; data curation and writing-original draft preparation, J.P.M.; Writing-review and editing, F.J.G. and L.O.; Funding acquisition, C.M.G.A. All authors have read and agreed to the published version of the manuscript.

Funding

This research was funded by Conselho Nacional de Desenvolvimento Científico (CNPq), funding number 305290/2020-7 (J.P.M.), and CAPES.

Acknowledgments

The authors thanks to Universidade Estadual de Maringá, Universidade Tecnológica Federal do Paraná, CAPES, and CNPq.

Conflicts of Interest

The authors declare no conflict of interest.

References

  1. Kulshreshtha, N.; Kumar, S.; Vaishya, R.C. Assessment of trace metal concentration in the ambient air of the Prayagraj City during Diwali festival-a case study. Environ. Monit. Assess 2021, 19, 149. [Google Scholar] [CrossRef] [PubMed]
  2. Setsirichok, D.; Piroonratana, T.; Wongseree, W. Classification of complete blood count and haemoglobin typing data by a C4.5 decision tree, a naïve Bayes classifier and a multilayer perceptron for thalassaemia screening. Biomed. Signal Process. Control 2012, 7, 202–212. [Google Scholar] [CrossRef]
  3. Wang, S.; Liu, W.; Wei, L. Construction of Data Mining Analysis Model in English Teaching Based on Apriori Association Rule Algorithm. Math. Probl. Eng. 2022, 2022, 6875207. [Google Scholar] [CrossRef]
  4. Pang-Ning, T.; Steinbach, M.; Karpatne, A. Introduction to Data Mining; Pearson: London, UK, 2018. [Google Scholar]
  5. Wilkinson, J.L.; Hooda, P.S.; Swinden, J.; Barker, J.; Barton, S. Spatial distribution of organic contaminants in three rivers of Southern England bound to suspended particulate material and dissolved in water. Sci. Total Environ. 2017, 594, 487–497. [Google Scholar] [CrossRef] [PubMed]
  6. Agrawaal, H.; Jones, C.; Thompson, J.E. Personal Exposure Estimates via Portable and Wireless Sensing and Reporting of Particulate Pollution. Int. J. Environ. Res. Public Health 2020, 17, 843. [Google Scholar] [CrossRef] [Green Version]
  7. Karami, M.; McMorrow, G.V.; Wang, L. Continuous monitoring of indoor environmental quality using an Arduino-based data acquisition system. J. Build. Eng. 2018, 19, 412–419. [Google Scholar] [CrossRef]
  8. Ho, S.C.; Wang, Y.C. A Low-cost, Portable, and Wireless Environmental Pollution Exposure Detection Device with a Simple Arduino-based System. Sens. Mater. 2019, 31, 2263. [Google Scholar] [CrossRef]
  9. Mbarndouka, J.T.; Noubé, M.K.; Bodo, B.; Siaka, Y.F.T.; Nducol, N.; Signing, V.R.F.; Mogue, F.R.T. Low-cost air quality monitoring system design and comparative analysis with a conventional method. Int. J. Energy Environ. Eng. 2021, 12, 873–884. [Google Scholar]
  10. Qin, S.; Liu, F.; Wang, C.; Song, Y.; Qu, J. Spatial-temporal analysis and projection of extreme particulate matter (PM10 and PM2.5) levels using association rules: A case study of the Jing-Jin-Ji region, China. Atmos. Environ. 2015, 120, 339–350. [Google Scholar] [CrossRef]
  11. Guo, Y.; Wang, M.; Li, X. Application of an improved Apriori algorithm in a mobile e-commerce recommendation system. Ind. Manag. Data Syst. 2017, 117, 287–303. [Google Scholar] [CrossRef]
  12. Garg, A.; Gupta, N.C. Short-term variability on particulate and gaseous emissions induced by fireworks during Diwali celebrations for two successive years in outdoor air of an urban area in Delhi, India. SN Appl. Sci. 2020, 2, 2092. [Google Scholar] [CrossRef]
  13. Füri, P.; Hofmann, W.; Jókay, Á.; Balásházy, I.; Moustafa, M.; Czitrovszky, B.; Kudela, G.; Farkas, Á. Comparison of airway deposition distributions of particles in healthy and diseased workers in an Egyptian industrial site. Inhal. Toxicol. 2017, 29, 147–159. [Google Scholar] [CrossRef]
  14. Jacobson, M.Z. Air Pollution and Global Warming: History, Science, and Solutions, 2nd ed.; Cambridge University Press: New York, NY, USA, 2012. [Google Scholar]
  15. Loxham, M.; Nieuwenhuijsen, M. Health effects of particulate matter air pollution in underground railway systems—A critical review of the evidence. Part. Fibre Toxicol. 2019, 16, 12. [Google Scholar] [CrossRef] [Green Version]
  16. Grant, R. Why Is a Carbon Dioxide Monitor a Good Investment? Critical Environment Technologies Canada Inc. (CETCI): Delta, BC, Canada, 2010; Volume 1, pp. 1–5. [Google Scholar]
  17. Soares, P.H.; Monteiro, J.P.; Freitas, H.F.; Sakiyama, R.B.; Andrade, C.M. Platform for monitoring and analysis of air quality in environments with large circulation of people. Environ. Prog. Sustain. Energy 2018, 37, 2050–2057. [Google Scholar] [CrossRef]
  18. Soares, P.; Monteiro, J.; Freitas, H.; Ogiboski, L.; Vieira, F.; Andrade, C. Monitoring and Analysis of Outdoor Carbon Dioxide Concentration by Autonomous Sensors. Atmosphere 2022, 13, 358. [Google Scholar] [CrossRef]
  19. Satish, U.; Mendell, M. Is CO2 an Indoor Pollutant? Direct Effects of Low-to-Moderate CO2 Concentrations on Human Decision-Making Performance. Environ. Health Perspect. 2012, 120, 1671–1677. [Google Scholar] [CrossRef] [Green Version]
  20. Xie, M.; Ding, L.; Xia, Y.; Guo, J.; Pan, J.; Wang, H. Does artificial intelligence affect the pattern of skill demand? Evidence from Chinese manufacturing firms. Econ. Model. 2021, 96, 295–309. [Google Scholar] [CrossRef]
  21. Listyarini, S.; Warlina, L.; Sambas, A. Air Quality Monitoring System in South Tangerang Based on Arduino Uno: From Analysis to Implementation. IOP Int. Conf. Sci. Mater. Sci. Eng. 2020, 1115, 012046. [Google Scholar] [CrossRef]
  22. Rumantri, R.; Khakim, M.Y.N.; Iskandar, I. Design and Characterization of Low-Cost Sensors for Air Quality Monitoring System. J. Pendidik. IPA Indones. 2018, 7, 347–354. [Google Scholar]
  23. Singh, R.; Singh, K.; Singhal, S. Physics experiments using arduino: Determination of the air quality index. Phys. Educ. 2022, 57, 025013. [Google Scholar] [CrossRef]
  24. Fadzly, M.K.; Yiling, M.F.R.; Amarul, T.; Effendi, M.S.M. Smart Air Quality Monitoring System Using Arduino Mega. IOP Conf. Ser. Mater. Sci. Eng. 2020, 864, 012215. [Google Scholar] [CrossRef]
Figure 1. Measurement flow for the architecture of the CO2 and PM monitoring platform.
Atmosphere 14 00648 g001
Figure 2. The query module interface screen of the CO2 and PM monitoring system for showing query versatility through the application of filters.
Atmosphere 14 00648 g002
Figure 3. CO2 average concentrations (from 5:00 to 21:00) considering records from all sensors over the 4-week period. Weekend data were not considered.
Atmosphere 14 00648 g003
Figure 4. PM2.5 and PM10 average concentrations (from 5:00 to 21:00) considering records from all sensors over the 4-week period. Weekend data were not considered.
Atmosphere 14 00648 g004
Figure 5. The decision tree generated in the machine learning process (using the C4.5 algorithm) shows patterns when the air quality is inadequate in each monitored location.
Atmosphere 14 00648 g005
Table 1. The lowest and highest CO2, PM2.5, and PM10 concentration values were obtained in the three monitored locations during the 4-week period.
LocalSensor NodeLowest ValuesHighest Values
CO2
Downtown1506 ppm
24/07/2022—05:01
773 ppm
29/07/2022—18:26
City entrance2502 ppm
07/08/2022—05:12
817 ppm
18/07/2022—18:21
Highway3432 ppm
31/07/2021—05:03
708 ppm
04/08/2022—08:24
PM2.5
Downtown11.9 μg/m3
17/07/2022—05:32
19.6 μg/m3
26/07/2021—18:08
City entrance21.2 μg/m3
31/07/2021—05:01
28.7 μg/m3
11/07/2021—18:43
Highway30.9 μg/m3
25/07/2021—05:26
23.1 μg/m3
04/08/2021—18:01
PM10
Downtown11.1 μg/m3
31/07/2022—05:17
17.8 μg/m3
03/08/2021—18:27
City entrance20.3 μg/m3
31/07/2021—05:09
26.4 μg/m3
19/07/2021—18:07
Highway30.7 μg/m3
17/07/2021—05:02
21.3 μg/m3
23/07/2021—17:32
Table 2. Correlation between CO2 and PM concentrations in pollutants boundary conditions. The data were generated from the query module, and results from the Priori association algorithm performance on the data collected over the 4 weeks.
CO2 Conditions PM10 Occurrence Percentual (%) PM2.5 Occurrence Percentual (%)
<25 μg/m3 ≥25 μg/m3 <25 μg/m3 ≥25 μg/m3
<600 ppm81.418.686.813.2
>600 ppm22.577.528.171.9
Disclaimer/Publisher’s Note: The statements, opinions and data contained in all publications are solely those of the individual author(s) and contributor(s) and not of MDPI and/or the editor(s). MDPI and/or the editor(s) disclaim responsibility for any injury to people or property resulting from any ideas, methods, instructions or products referred to in the content.

