Article

Sources Causing Long-Term and Seasonal Changes in Combustion-Derived Particulate Matter in the Urban Air of Sapporo, Japan, from 1990 to 2002

by
Kazuichi Hayakawa
1,*,
Shigekatsu Sakai
2 and
Tomoko Akutagawa
2
1
Institute of Nature and Environmental Technology, Kanazawa University, Kakuma-machi, Kanazawa 920-1192, Ishikawa, Japan
2
Research Institute of Energy, Environmental and Geology, Hokkaido Research Organization, Kita 19 Nishi 11, Kita-Ku, Sapporo 060-0819, Hokkaido, Japan
*
Author to whom correspondence should be addressed.
Atmosphere 2023, 14(4), 646; https://doi.org/10.3390/atmos14040646
Submission received: 26 February 2023 / Revised: 21 March 2023 / Accepted: 27 March 2023 / Published: 29 March 2023
(This article belongs to the Special Issue Feature Papers in Air Quality)

Abstract

:
Fifty-one samples were collected seasonally to estimate the amounts of total suspended particulate (TSP) in Sapporo, Japan, from 1990 to 2002. The atmospheric concentration of combustion-derived particulate (Pc) was calculated based on the NP method using 1-nitropyrene and pyrene. The atmospheric TSP and Pc concentration ranges were between 31–121 µg m−3 of air (Mean ± standard deviation (SD) = 58.2 ± 20.2 µg m−3) and 31–121 µg m−3 (Mean ± SD = 8.2 ± 6.0 µg m−3), respectively. First-order linear regression equations suggested that the Pc fraction decreased faster than TSP. The highest and lowest Pc concentrations were observed in winter and summer, respectively, whereas the highest and lowest TSP concentrations were observed in spring and winter, respectively. The largest and smallest Pc/TSP concentration ratios were observed in winter (0.324) and summer (0.075), respectively. The seasonal fractions of high-temperature combustion-derived particulate (Ph) in Pc ranged from 0.56 (winter) to 0.75 (summer), suggesting that the contribution of vehicle emissions to Pc was always larger than those of coal and biomass combustion. The sources of long-term and seasonal change in Pc were elucidated by analyzing organic source markers. Atmospheric concentrations of polycyclic aromatic hydrocarbons (PAHs), nitropolycyclic aromatic hydrocarbons (NPAHs) and hopanes showed long-term and seasonal changes similar to those of Pc, although biomarkers of biomass and coal combustion, such as levoglucosan, mannosan, and galactosan were not as strongly correlated. These results suggest that the change in the Pc concentration was mainly affected by vehicle emissions rather than by coal and biomass combustion or secondary pollutant formation. The decrease in the Pc over the study period was mainly a result of the Japanese particulate matter/NOx regulations on vehicle exhaust.

1. Introduction

Air pollution kills millions of people every year. Among airborne pollutants, research has focused on particulate matter (PM), in particular the fine particulates (having a diameter ≤ 2.5 μm; PM2.5), because of its relationship to respiratory and cardiovascular diseases [1]. PM2.5 contains numerous carcinogens and mutagens such as polycyclic aromatic hydrocarbons (PAHs), e.g., benzo[a]pyrene (BaP), and nitropolycyclic aromatic hydrocarbons (NPAHs), e.g., 1-nitropyrene (1-NP) and dinitropyrenes. However, among the 16 priority PAHs determined by the United States Environmental Protection Agency (US EPA), BaP contributes only 11% to the total cancer risk. The other PAHs of the USEPA PAHs and NPAHs, respectively, contribute 72% and 17%. Moreover, 47% of the direct-acting mutagenicity of PM extracts cannot be attributed to eight of the commonly quantified NPAHs, as the toxic equivalent is only known for a limited number of NPAHs [2,3]. On the other hand, several oxygenated PAHs, such as the hydroxy PAHs, quinoid PAHs, and hydroxy NPAHs, have demonstrated endocrine-disrupting activity, reactive oxygen species overproduction activity, and indirect-acting mutagenicity [4,5,6]. The biological activities of PAHs with polar functional groups are higher than those of their parent PAHs [7]. These reports indicate that PM contains many unknown hazardous chemical substances.
In addition to the materials emitted from combustion, PM contains substances generated from plants and animals. However, separating PM into combustion and noncombustion-derived fractions is challenging. The classification of PM into combustion and noncombustion-derived fractions and the knowledge of their sources can significantly facilitate the research on unknown toxic chemicals. Currently, for source analysis, several methods are used, such as receptor models, including chemical mass balance (CMB) and positive matrix factor Analysis (PMF), principal component analysis (PCA) method, and diagnostic PAHs ratio method [8,9,10,11]. However, to use receptor models and the PCA method, it is impossible to obtain emission information of vehicles and around the sampling site at that time. The diagnostic PAHs ratio method has problems, such as the inability to calculate the source contribution ratio to PAHs; the main source often differs depending on the type of PAH pair used. Moreover, this method cannot be applicable to combustion-derived particulate and NPAHs [12]. Recently, our group developed a method (the NP method) to quantify the combustion-derived fractions (Pc) and noncombustion-derived fractions (Pn) in PM. We further divided Pc into high-temperature combustion-derived particulate (Ph) and low-temperature combustion-derived particulate (Pl). Major sources of Ph and Pl are vehicles and coal and biomass combustion. The main idea for this method is that the formation of NPAHs relative to PAHs will increase relative to combustion temperature, as the formation of nitrogen oxides and the subsequent nitration of PAHs depends on the combustion temperature. The NP method can be used for PM generated at any place and time because it only requires pyrene (Pyr) and 1-nitropyrene (1-NP) measurements [12,13].
Herein, atmospheric samples were collected every season to determine the total suspended particulate (TSP) in Sapporo from 1990 to 2002. During this period, several important countermeasures were enacted to deal with air pollution in Japan, such as restrictions on vehicle emissions of PM and NOx gases, progress on vehicle engine performance and fuel quality [7] and the ban on spiked tires in snowy regions [14]. In addition, winter heating mostly switched from coal heating to kerosene or electric heating in Sapporo by the beginning of the 1990s. It is important to clarify how these measures have improved urban air pollution in Japan. This study was conducted to elucidate the factors causing long-term and seasonal changes in TSP and Pc. TSP was divided into Pc and Pn, and Pc was further classified into Ph and Pl using the NP method. The study also examined the contributions of vehicles as well as coal and biomass combustion to Pc by analyzing organic source markers.

2. Materials and Methods

2.1. Sampling

TSP samples were collected in Sapporo (the capital city of Hokkaido, Japan, population = 1,970,000). The average annual, August, and January temperatures were 9.2 °C, 22.3 °C, and −3.2 °C, respectively, and the month with the greatest average snowfall (97 cm) was February [15]. A high-volume air sampler was placed on the roof of the three-story building of the Research Institute of Energy, Environment and Geology, Hokkaido Research Organization, which is located in a residential area approximately 2 km northwest of downtown Sapporo. The 24-h TSP was collected once a week using a quartz fiber filter at an airflow rate of 1.0–1.5 m3 min−1 from the spring of 1990 to the autumn of 2002. Filters of 1432 days were obtained during the period. After sampling, filters were stored in a freezer (−20 °C) until analysis. Filters (of 12 to 13 TSP samples) were grouped based on the four seasons of the year, winter (December of the preceding year to February), spring (March to May), summer (June to August), and autumn (September to November). In total, 51 seasonal TSP samples were obtained over the monitoring period.

2.2. Quantification of Organic Compound Markers

One-eighth of the filters used to collect the TSP samples in each season of the year were cut and placed in a 500-mL glass flask containing dichloromethane (400 mL). The samples were sonicated for 15 min. The extract was filtered twice through three sheets of cellulose fiber filters (Advantec, Tokyo, Japan, No. 5C). The filtrate was evaporated until less than 1 mL remained. Then dichloromethane was added to increase the total volume to 25 mL. An aliquot of the solution was used in the analysis of the chemical compounds described below.
Nine PAHs, fluoranthene (Flu), Pyr, benz[a]anthracene, chrysene, benzo[b]fluoranthene, benzo[k]fluoranthene, BaP, benzo[ghi]perylene, and coronene, were quantified according to USEPA methods using a high-performance liquid chromatograph (HPLC) equipped with a fluorescence detector [16]. Deuterated Pyr (Pyr-d10) and deuterated BaP (BaP-d12) were used as internal standards. A reversed-phase column (Inertsil ODS-P, internal diameter (ID) × length = 4.6 × 250 mm, GL Sciences Inc., Tokyo, Japan) was used as the analytical column. Compounds were separated using a mobile phase gradient of an acetonitrile–water mixture at a flow rate of 1 mL/min. The excitation and emission wavelengths of the fluorescence detector were optimized for each particular PAH.
Four NPAHs, 1-NP, 1,3-, 1,6, and 1,8-dinitropyrenes, were quantified using an HPLC equipped with a reducer column packed with Pt/Rh-coated particles and a chemiluminescence detector, using 2-fluoro-7-nitrofluorene as an internal standard. Reverse phase columns (Cosmosil 5C18-MS-II, 4.6 (ID) × (250 + 150) mm, Nacalai Tesque, Kyoto, Japan) were used as the analytical columns, and the mobile phase was a mixture of an acetonitrile–imidazole buffer. Further, an acetonitrile solution containing bis(2,4,6-trichlorophenyl)-oxalate and hydrogen peroxide was used as the chemiluminescence reagent solution at a flow rate of 1 mL/min [17,18,19].
17α(H)21β(H)-30-norhopane, 17α(H)21β(H)hopane, and 17α(H)-22,29,30-trisnorhopane were quantified using gas chromatography–mass spectrometry (GC–MS, GC: Agilent 7890B, MS: Agilent 5977B, Agilent Technologies Inc., Hachioji-shi, Japan). A DB-5MS capillary column was used as the analytical column (length × ID = 30 m × 0.25 mm, film thickness = 0.25 µm, Agilent Technologies Inc.). Three sugars, i.e., levoglucosan, mannosan, and galactosan, as well as pinonic acid, were quantified by GC–MS coupled with a solvent extraction–silylation method. The analytical conditions are adopted from previous studies [20,21,22] with small modifications. Samples used for the analysis of three hopanes were obtained from other TSP samples collected at the same site over the same period.

2.3. Calculation of Source Contributions Using the NP Method

In the NP method, TSP in the urban atmosphere is divided into Pc and Pn. During the combustion process of organic matter, both the formation of nitrogen oxides in the flame gas and the subsequent formation of NPAHs from the parent PAHs are temperature dependent [23,24]. This causes an increase in the NPAH to parent PAH concentration ratios with the increase in the combustion temperature. High combustion temperatures occur in vehicle (diesel and gasoline) engines (2700 °C–3000 °C), which are significantly higher than those used in coal combustion stoves (1100 °C–1200 °C) and wood combustion stoves (500 °C–600 °C) [12]. Depending on these differences, Pc was further divided into Ph and Pl.
When the proportion of Ph in Pc and Pc in P in the atmosphere are x (0 < x < 1) and y (0 < y < 1), respectively, Equations (1)–(3) can be written as follows:
[1-NP] = [1-NPh][Pc]x + [1-NPl][Pc](1 − x)
[Pyr] = [Pyrh][Pc]x + [Pyrl][Pc](1 − x)
y = [Pc]/([Pc] + [Pn])
During the sampling period, petroleum and coal were the largest primary energy sources in Japan [25]. In Sapporo, most petroleum was used in transportation (viz. vehicles), whereas coal was used in power plants, factories, and household heating. We previously obtained the concentrations of 1-NP and Pyr in PM emitted from vehicles and coal boilers/stoves, which were common during the study period [12,13]. As a result, the following equations are available.
[1-NPh]/[Pyrh] = 0.425
[1-NPl]/[Pyrl] = 0.0013
Therefore, vehicle emissions and coal combustion were, respectively, regarded as high-temperature and low-temperature combustion sources. x, y and [Pc] can be obtained by Equations (1)–(3) with values from (4) and (5).

3. Results and Discussion

3.1. Relationship between the TSP and Pc Concentrations

Atmospheric concentrations of TSP and Pc calculated by the NP method were between 31–121 µg m−3 and 2–27.2 µg m−3, respectively, and the Pc/TSP ratios were 0.043–0.495 from spring 1990 to autumn 2002 (Table 1). Figure 1 shows the seasonal TSP concentrations from spring 1990 to autumn 2002 as well as the annual mean concentrations from 1991 to 2002. Figure 2 shows the Pc concentrations during the same period as the TSP samples. The first-order regression equations of TSP and Pc were Y = −2.600X + 5248 (R2 = 0.401) and Y = −0.673X + 1353 (R2 = 0.921), respectively. Both had negative slopes, suggesting that TSP and Pc concentrations decreased over the study period. However, Pn did not show a similar tendency to that of Pc. For example, the annual mean concentrations of Pc and Pn were 14.0 and 8.0 µg m−3, respectively, in 1991 and 3.8 and 8.3 µg m−3, respectively, in 2002. These results indicate that the long-term change in the TSP concentration can be mainly attributed to the change in the Pc concentration.
The seasonal changes in the TSP and Pc concentrations differed (Table 2). The highest and lowest TSP concentrations were obtained in spring and winter, respectively, whereas the highest and lowest Pc concentrations were obtained in winter and summer, respectively. However, an almost constant Pn concentration was obtained in all seasons except in winter, where the concentration was 32% lower than the annual concentration. Thus, the largest and smallest fractions of Pc in TSP (Pc/TSP) were obtained in the winter (0.324) and summer (0.075), respectively. The relative standard deviation (RSD = SD/Mean) of the annual mean Pc concentration (0.732) was almost two times larger than that of TSP (0.374). These results indicate that the seasonal change in the TSP concentration was also mainly attributed to Pc.

3.2. Factors Affecting the Pc Concentration

The factors involved in the long-term and seasonal changes in the Pc concentration were studied. As described in Section 2.3, Ph and Pl, which are emitted from vehicles and coal/biomass combustion, respectively, were calculated using the NP method. Herein, the fractions of Ph in Pc of the 51 TSP samples were calculated based on Pyr and 1-NP concentrations. The largest and smallest seasonal mean fractions of Ph in Pc were obtained in the summer (0.75) and in the winter (0.56), respectively (Figure 3), suggesting that the contribution of vehicles to Pc was always larger than those of coal and biomass combustion in Sapporo. This is despite the increase in heating from coal and firewood combustion in the winter and the increase in post-harvest biomass combustion in the autumn.
In Japanese cities, the main sources of PAHs and NPAHs are vehicle emissions as well as coal and biomass combustion. Among these primary sources, vehicles emit larger amounts of NPAHs and hopanes [22,26]. Biomass combustion emits several sugars, such as levoglucosan, mannosan, and galactosan, whereas coal combustion emits much smaller amounts. Several organic acids, such as pinonic acid, also form in the atmosphere [27]. Therefore, PAHs, NPAHs, and hopanes are markers of Ph; levoglucosan, mannosan, galactosan, and PAHs are markers of Pl; and pinonic acid is a marker of Pn.
Figure 4 shows that the atmospheric concentrations of the total six PAHs (T-PAH), four NPAHs (T-NPAH), and three hopanes (T-Hopane) decreased over the study period, showing the same seasonal change (high in winter and low in summer) as that of Pc in Sapporo. Figure 5 shows that the atmospheric concentrations of levoglucosan, mannosan, and galactosan also decreased in the same period. However, they show different decreasing rates. The relative slope, i.e., the slope of equation/average concentration, of the first-order linear regression equation was calculated for each marker compound. Relative slopes of T-PAH, T-NPAH, and T-Hopane are within a range of −0.131/year to −0.099/year, which is steeper than that of Pc (−0.082/year). However, the relative slopes of levoglucosan, mannosan, and galactosan are in a range of −0.036 to −0.040/year, which is less steep than that of Pc (Table 3). The pinonic acid concentration, whose relative slope (0.007/year in Table 3) is close to zero, did not show such a long-term change (Figure 5). Moreover, the correlation coefficients between the T-PAH, T-NPAH, and T-Hopane concentrations and the Pc concentration are in the range of 0.8898–0.9433, which are significantly larger than the other chemicals (Table 4).
The total atmospheric concentrations of T-PAH, T-NPAH, and T-Hopane were significantly lower than that of Pc (≤1% of Pc), and the three sugars and the pinonic acid exhibited low total concentrations similar to that of T-PAH. Despite the very small fractions of these compounds in Ph, their strong correlations with Pc indicate that vehicles were a main contributor to the long-term decrease in the Pc concentration in Sapporo. However, the contribution of coal and biomass combustion to this decrease was not as strong as that of vehicles. Since the 1990s, the Japanese government has started to gradually strengthen the PM/NOx emission regulations for new vehicles. For PM emissions from heavy-duty diesel vehicles, the regulation value in 1999 was reduced to 36% of the 1994 level. The NOx regulation value was tightened several times since 1974. It was reduced to 52% in 1989 and 33% in 1999 [28]. This countermeasure decreased the urban atmospheric concentrations of NPAHs and PAHs by approximately 1/10 over a decade [29]. Thus, the decrease in Pc in Sapporo can be mainly attributed to the PM/NOx emission regulations for new vehicles, which are reflected in the significant decrease in atmospheric concentrations of T-PAH and T-NPAH (Figure 4). Several decades ago, in the colder regions of Japan, numerous vehicles were equipped with spiked tires in winter and early spring, which significantly increased the PM concentration in the urban atmosphere in spring. The atmospheric TSP concentration was higher than 100 µg m−3 in Sapporo in the winters from 1990–1992 and decreased quickly to 80 µg m−3 or less over three years from 1993 to 1996 despite the high Pc concentrations (Figure 1). This can be attributed to the regulation of spiked tires, which was started by the Sapporo city government in 1989 [14]. After the ordinance came into effect, the percentage of vehicles with spiked tires in Sapporo city decreased from 48.6% in 1990 to 2.4% in 1993.
All the combustion source markers exhibited the same seasonal changes as that of Pc, i.e., the highest and lowest concentrations are observed in winter and summer, respectively (Figure 4 and Figure 5). There are several factors for this. First, the largest and smallest fractions of Pl in Pc were observed in the winter (44%) and the summer (25%), respectively (Figure 3). Moreover, the highest Pc concentration is observed in the winter (Table 2). These results indicate an increase in the Pl emitted from fuel combustion for winter heating. The combustion temperatures of firewood and kerosene used as fuels for heating are equal to or lower than that of coal heating (1100 °C–1200 °C). This suggests that firewood and kerosene combustion for heating emits Pl that contains significantly smaller (NPAH)/(PAH) ratios than those from coal combustion for heating [12]. Second, the fuel consumption in vehicles worsens in winter. This increases the Ph emissions. Furthermore, PM tends to stay on the ground surface in the winter due to the formation of an atmospheric inversion layer [26]. These anthropogenic and meteorological factors caused long-term and seasonal changes in Ph and Pl, which might be then reflected in Pc.
This study has clarified that the suppression of PM and NOx emissions from vehicles drastically reduced the atmospheric concentrations of Pyr, 1-NP, and hopanes emitted from vehicles in Sapporo in the 1990s. However, the emissions from sources with low combustion temperatures have not decreased as quickly. In the future, technological development will be essential for them [30].

4. Conclusions

Atmospheric TSP samples were collected in Sapporo, Japan, every season from 1990 to 2002. Pc in TSP and Ph in Pc was determined by the NP method, and the sources of long-term and seasonal changes in Ph and Pc were elucidated by analyzing organic source markers.
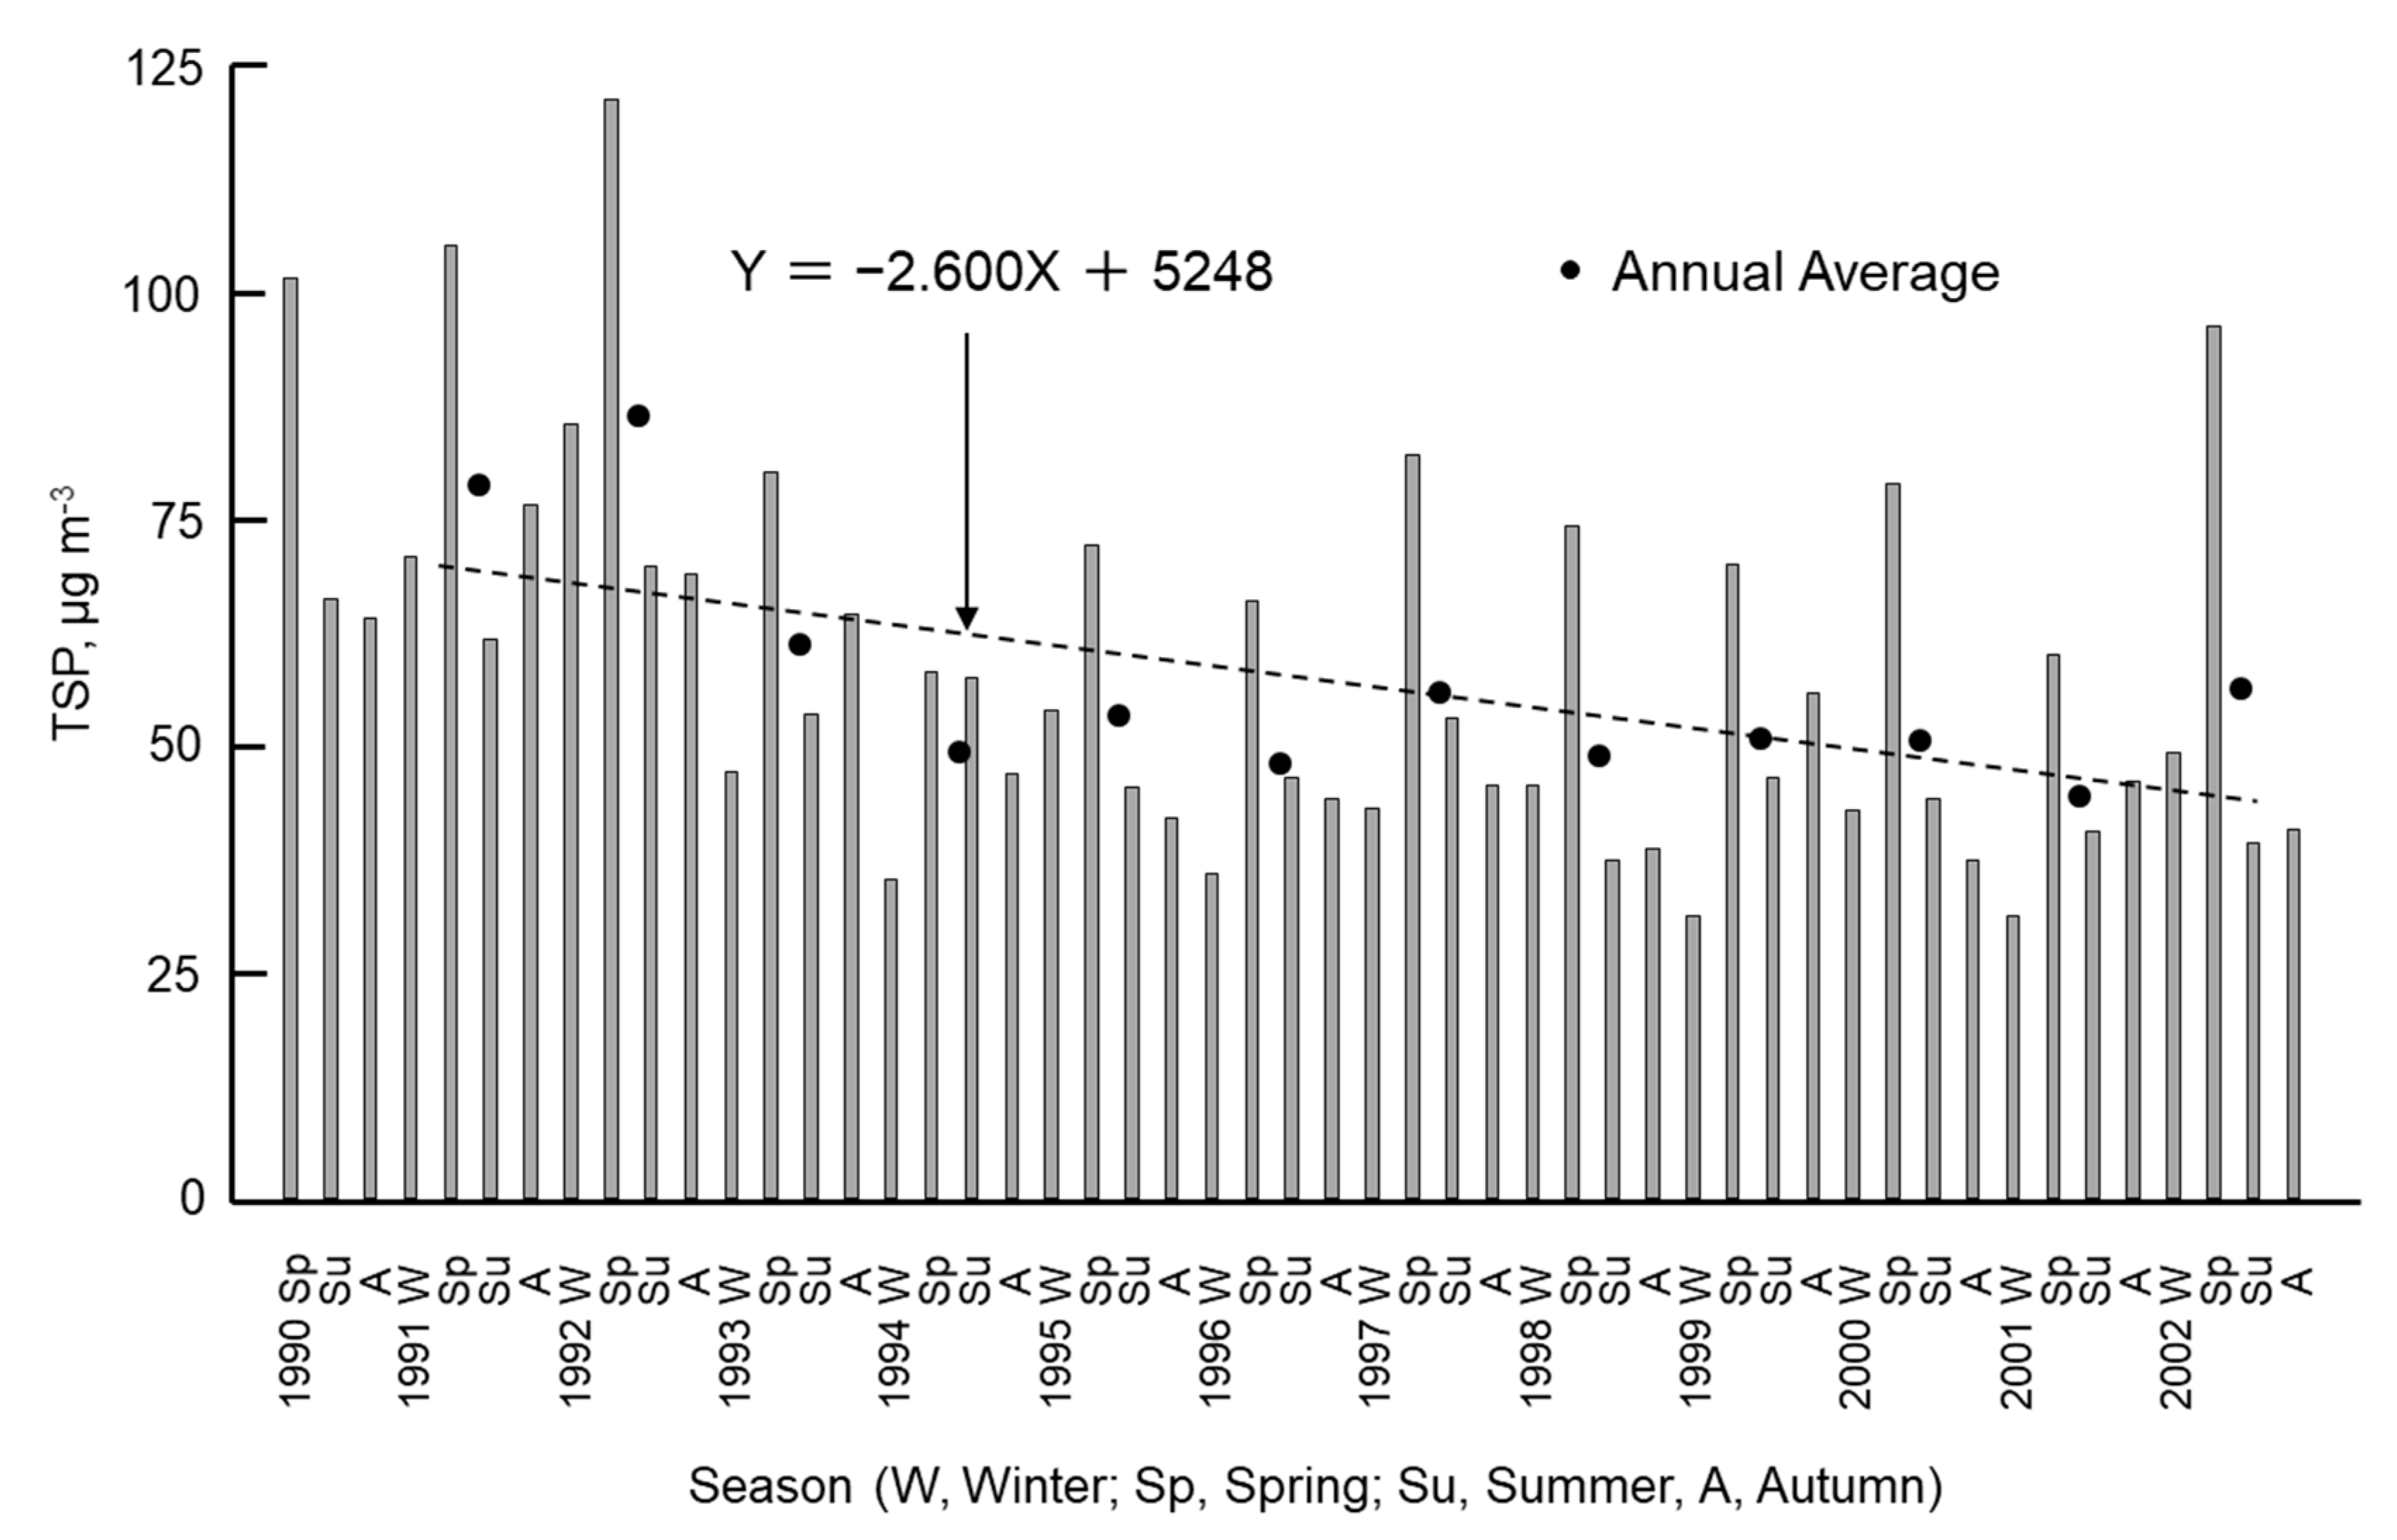
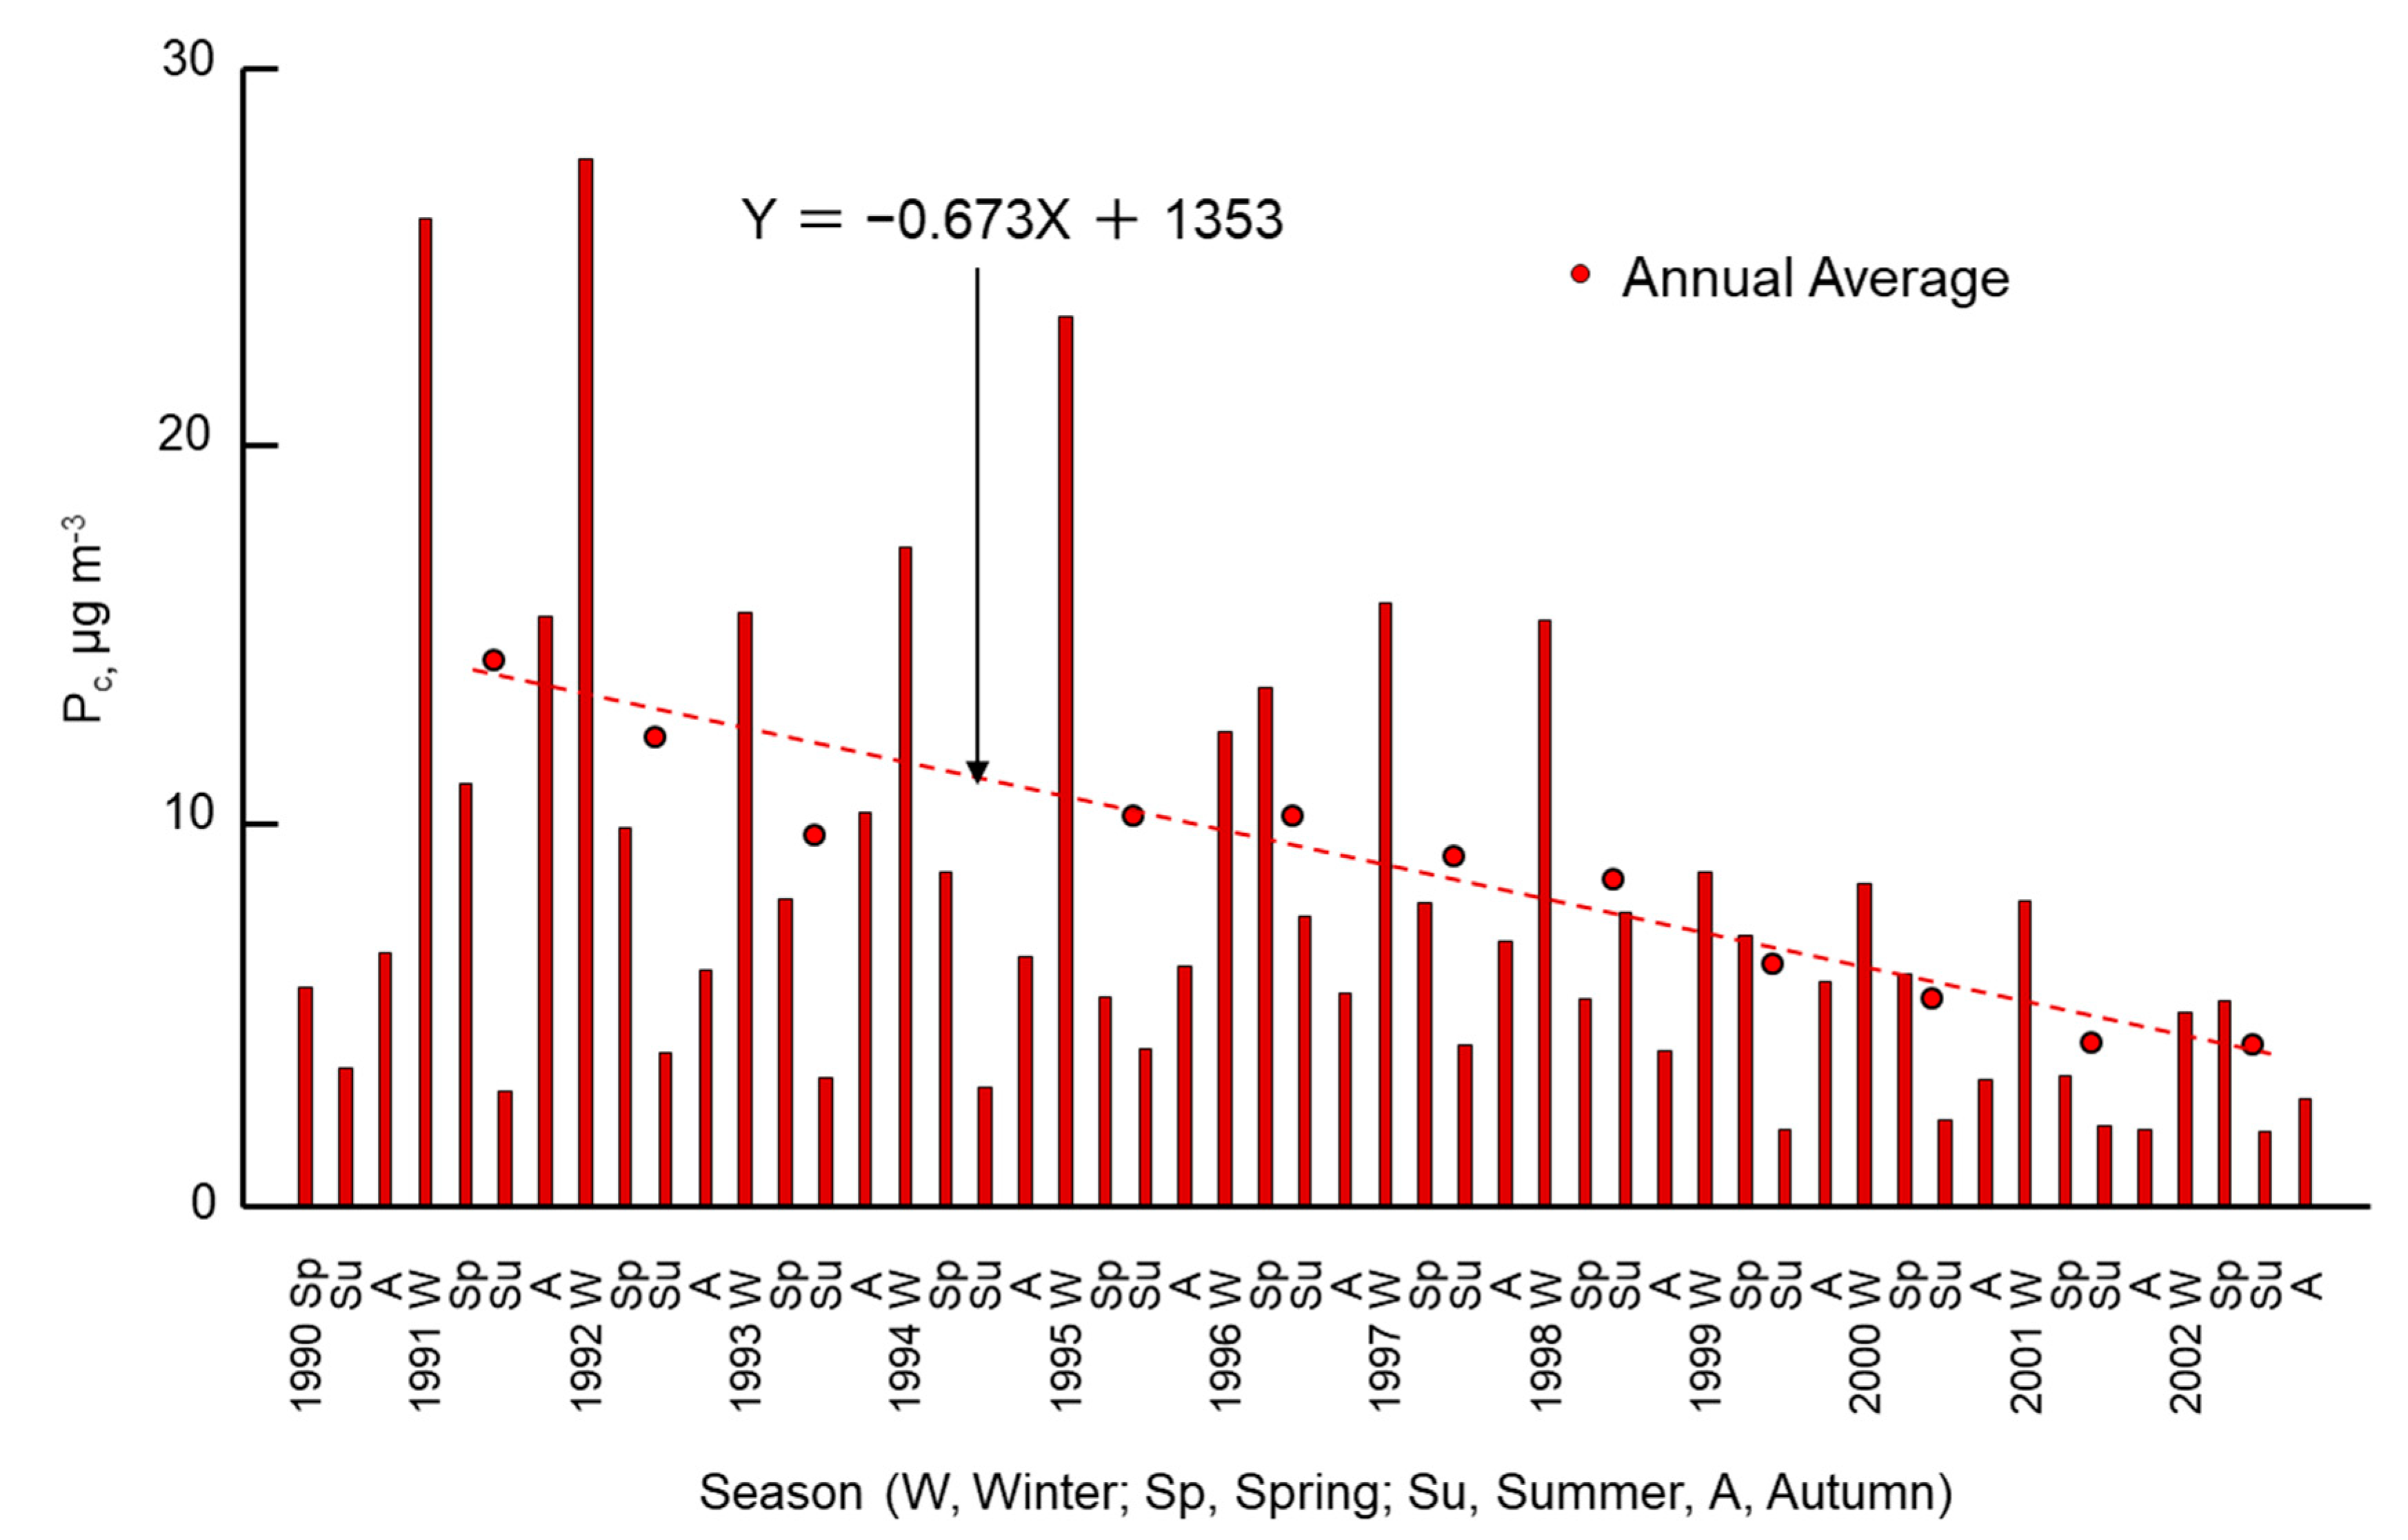
  • The atmospheric TSP and Pc concentrations ranged from 31 to 121 µg m−3 (Mean ± SD = 58.2 ± 20.2 µg m−3) and from 31 to 121 µg m−3 (Mean ± SD = 8.2 ± 6.0 µg m−3), respectively. The rate of decrease for the latter was steeper than that of the former.
  • The Pc concentration exhibited a seasonal change (highest in the winter and lowest in the summer) and was different from that of TSP (highest in spring and lowest in winter). The largest and smallest Pc/TSP concentration ratios were observed in winter (0.324) and summer (0.075), respectively.
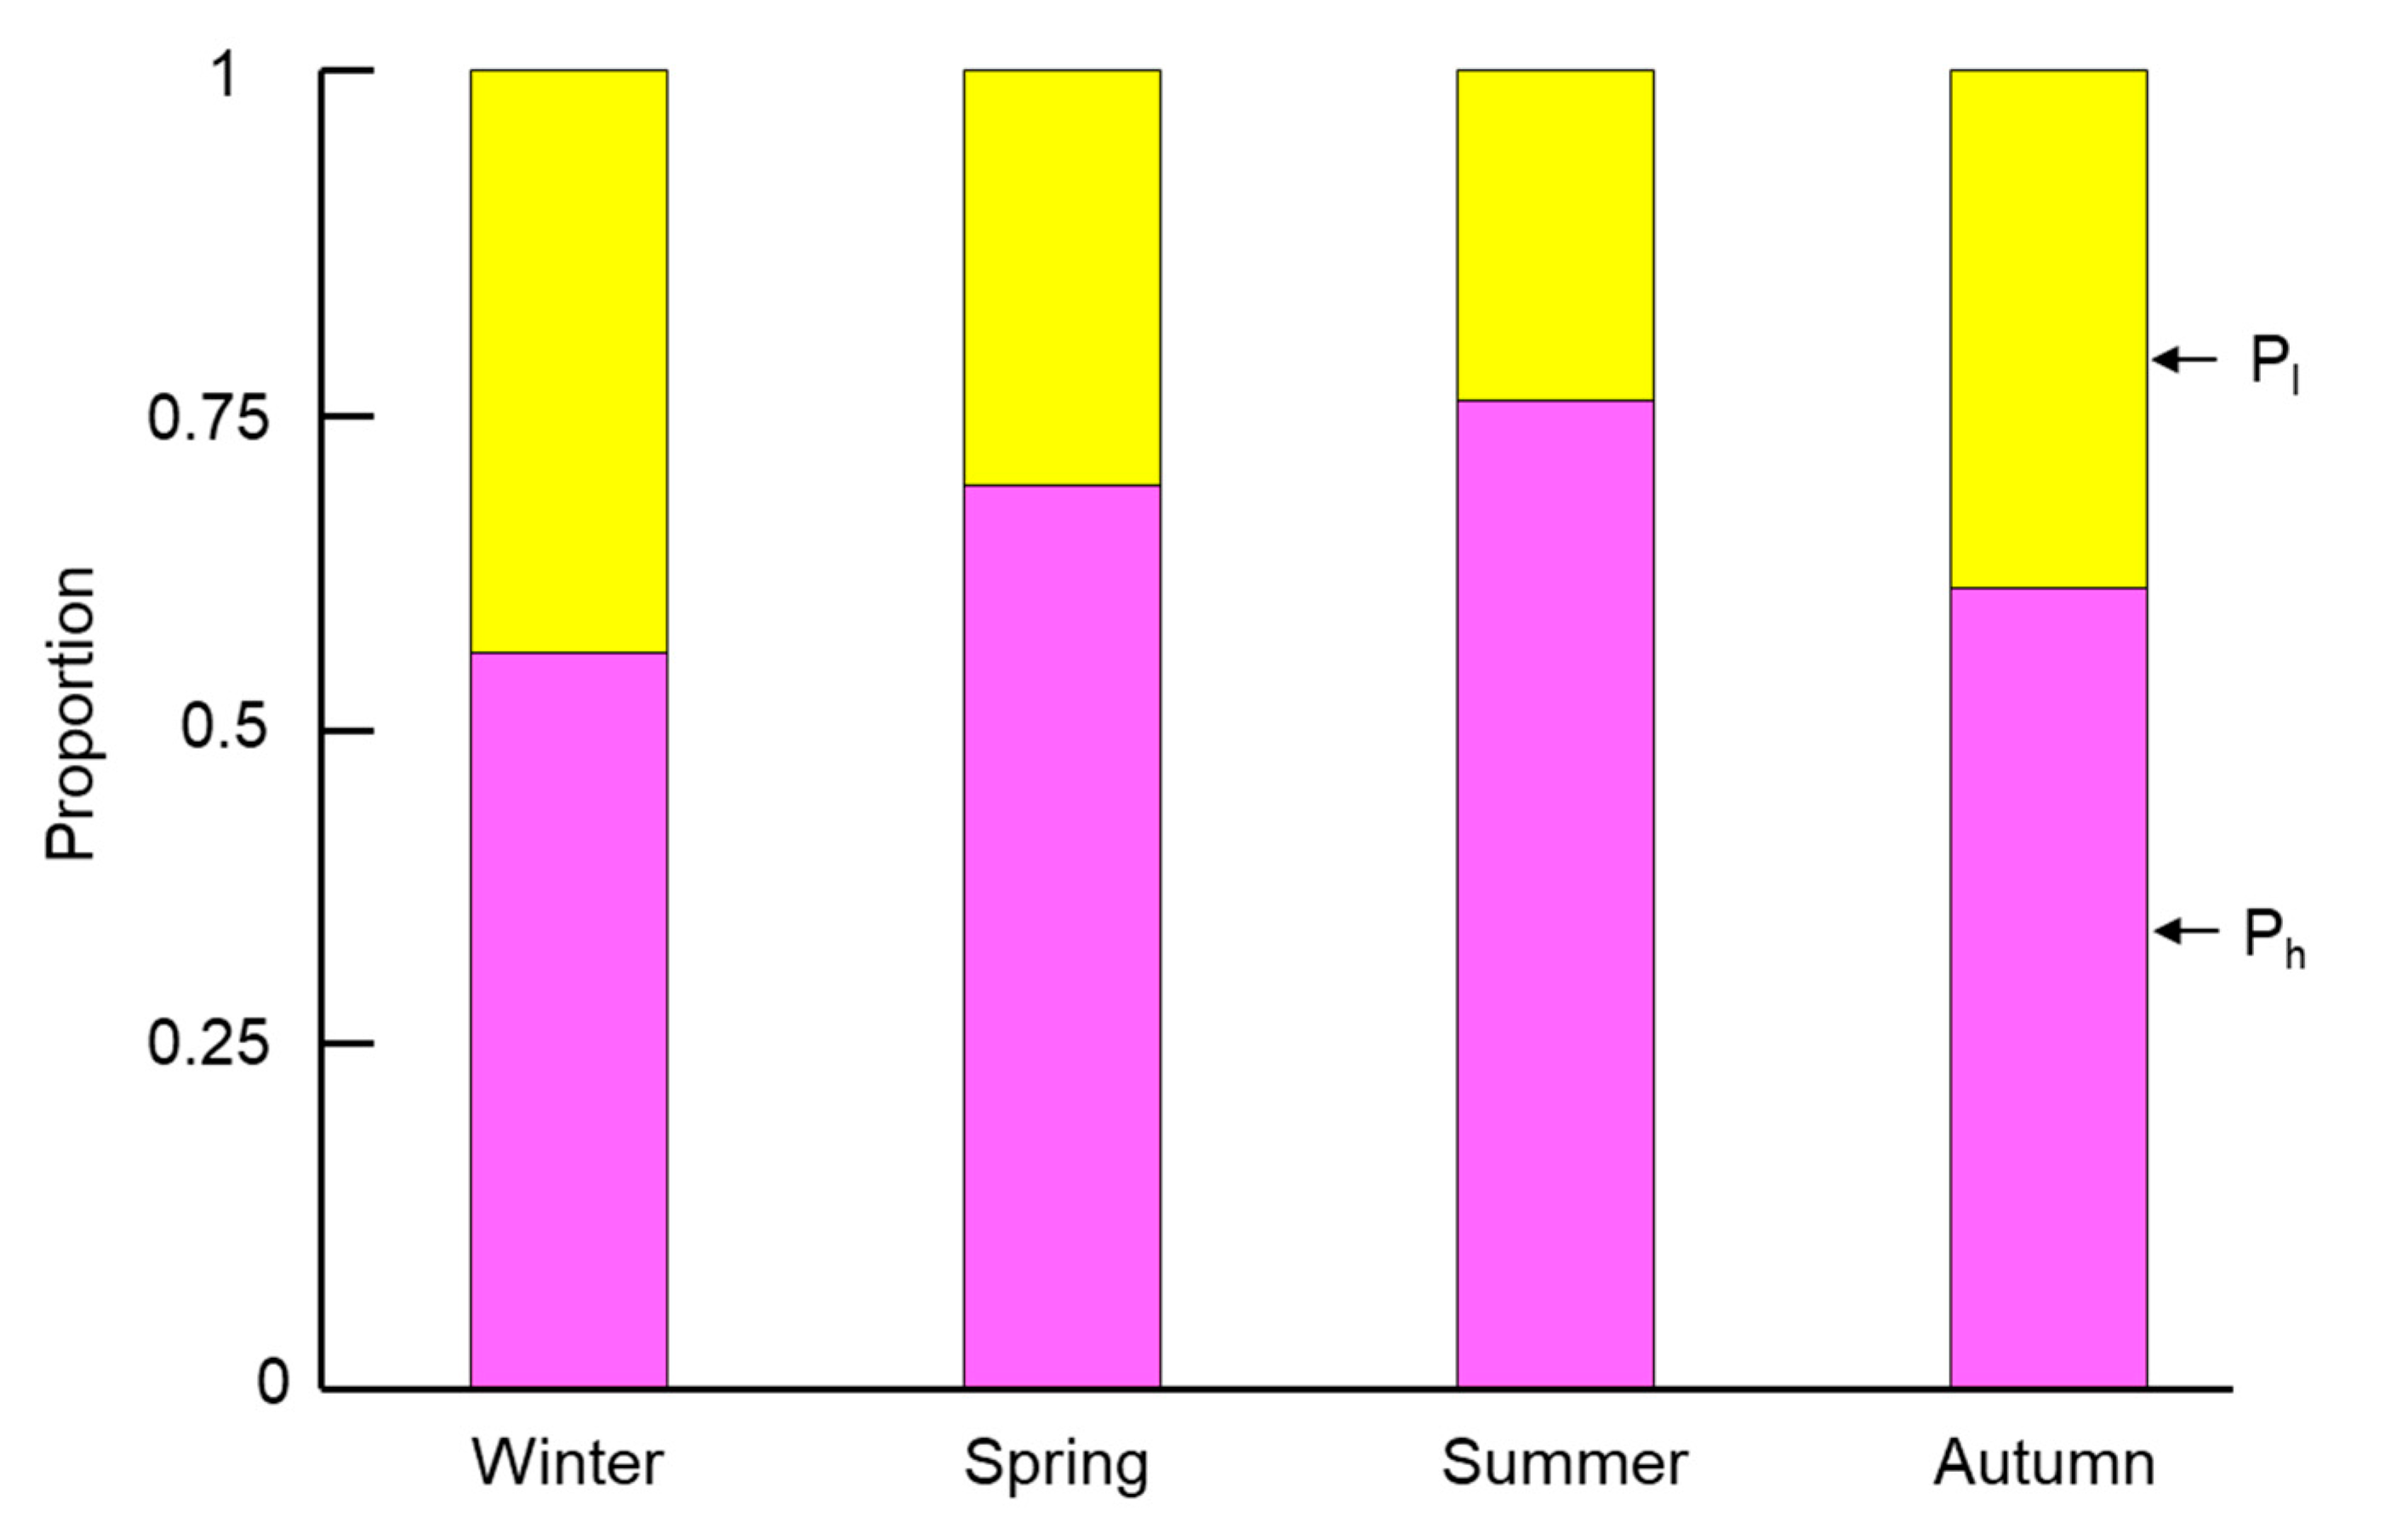
  • The seasonal fraction of Ph in Pc was in a range between 0.56 (winter)–0.75 (summer), suggesting that the contribution of vehicles to Pc was always larger than that of coal and biomass combustion.
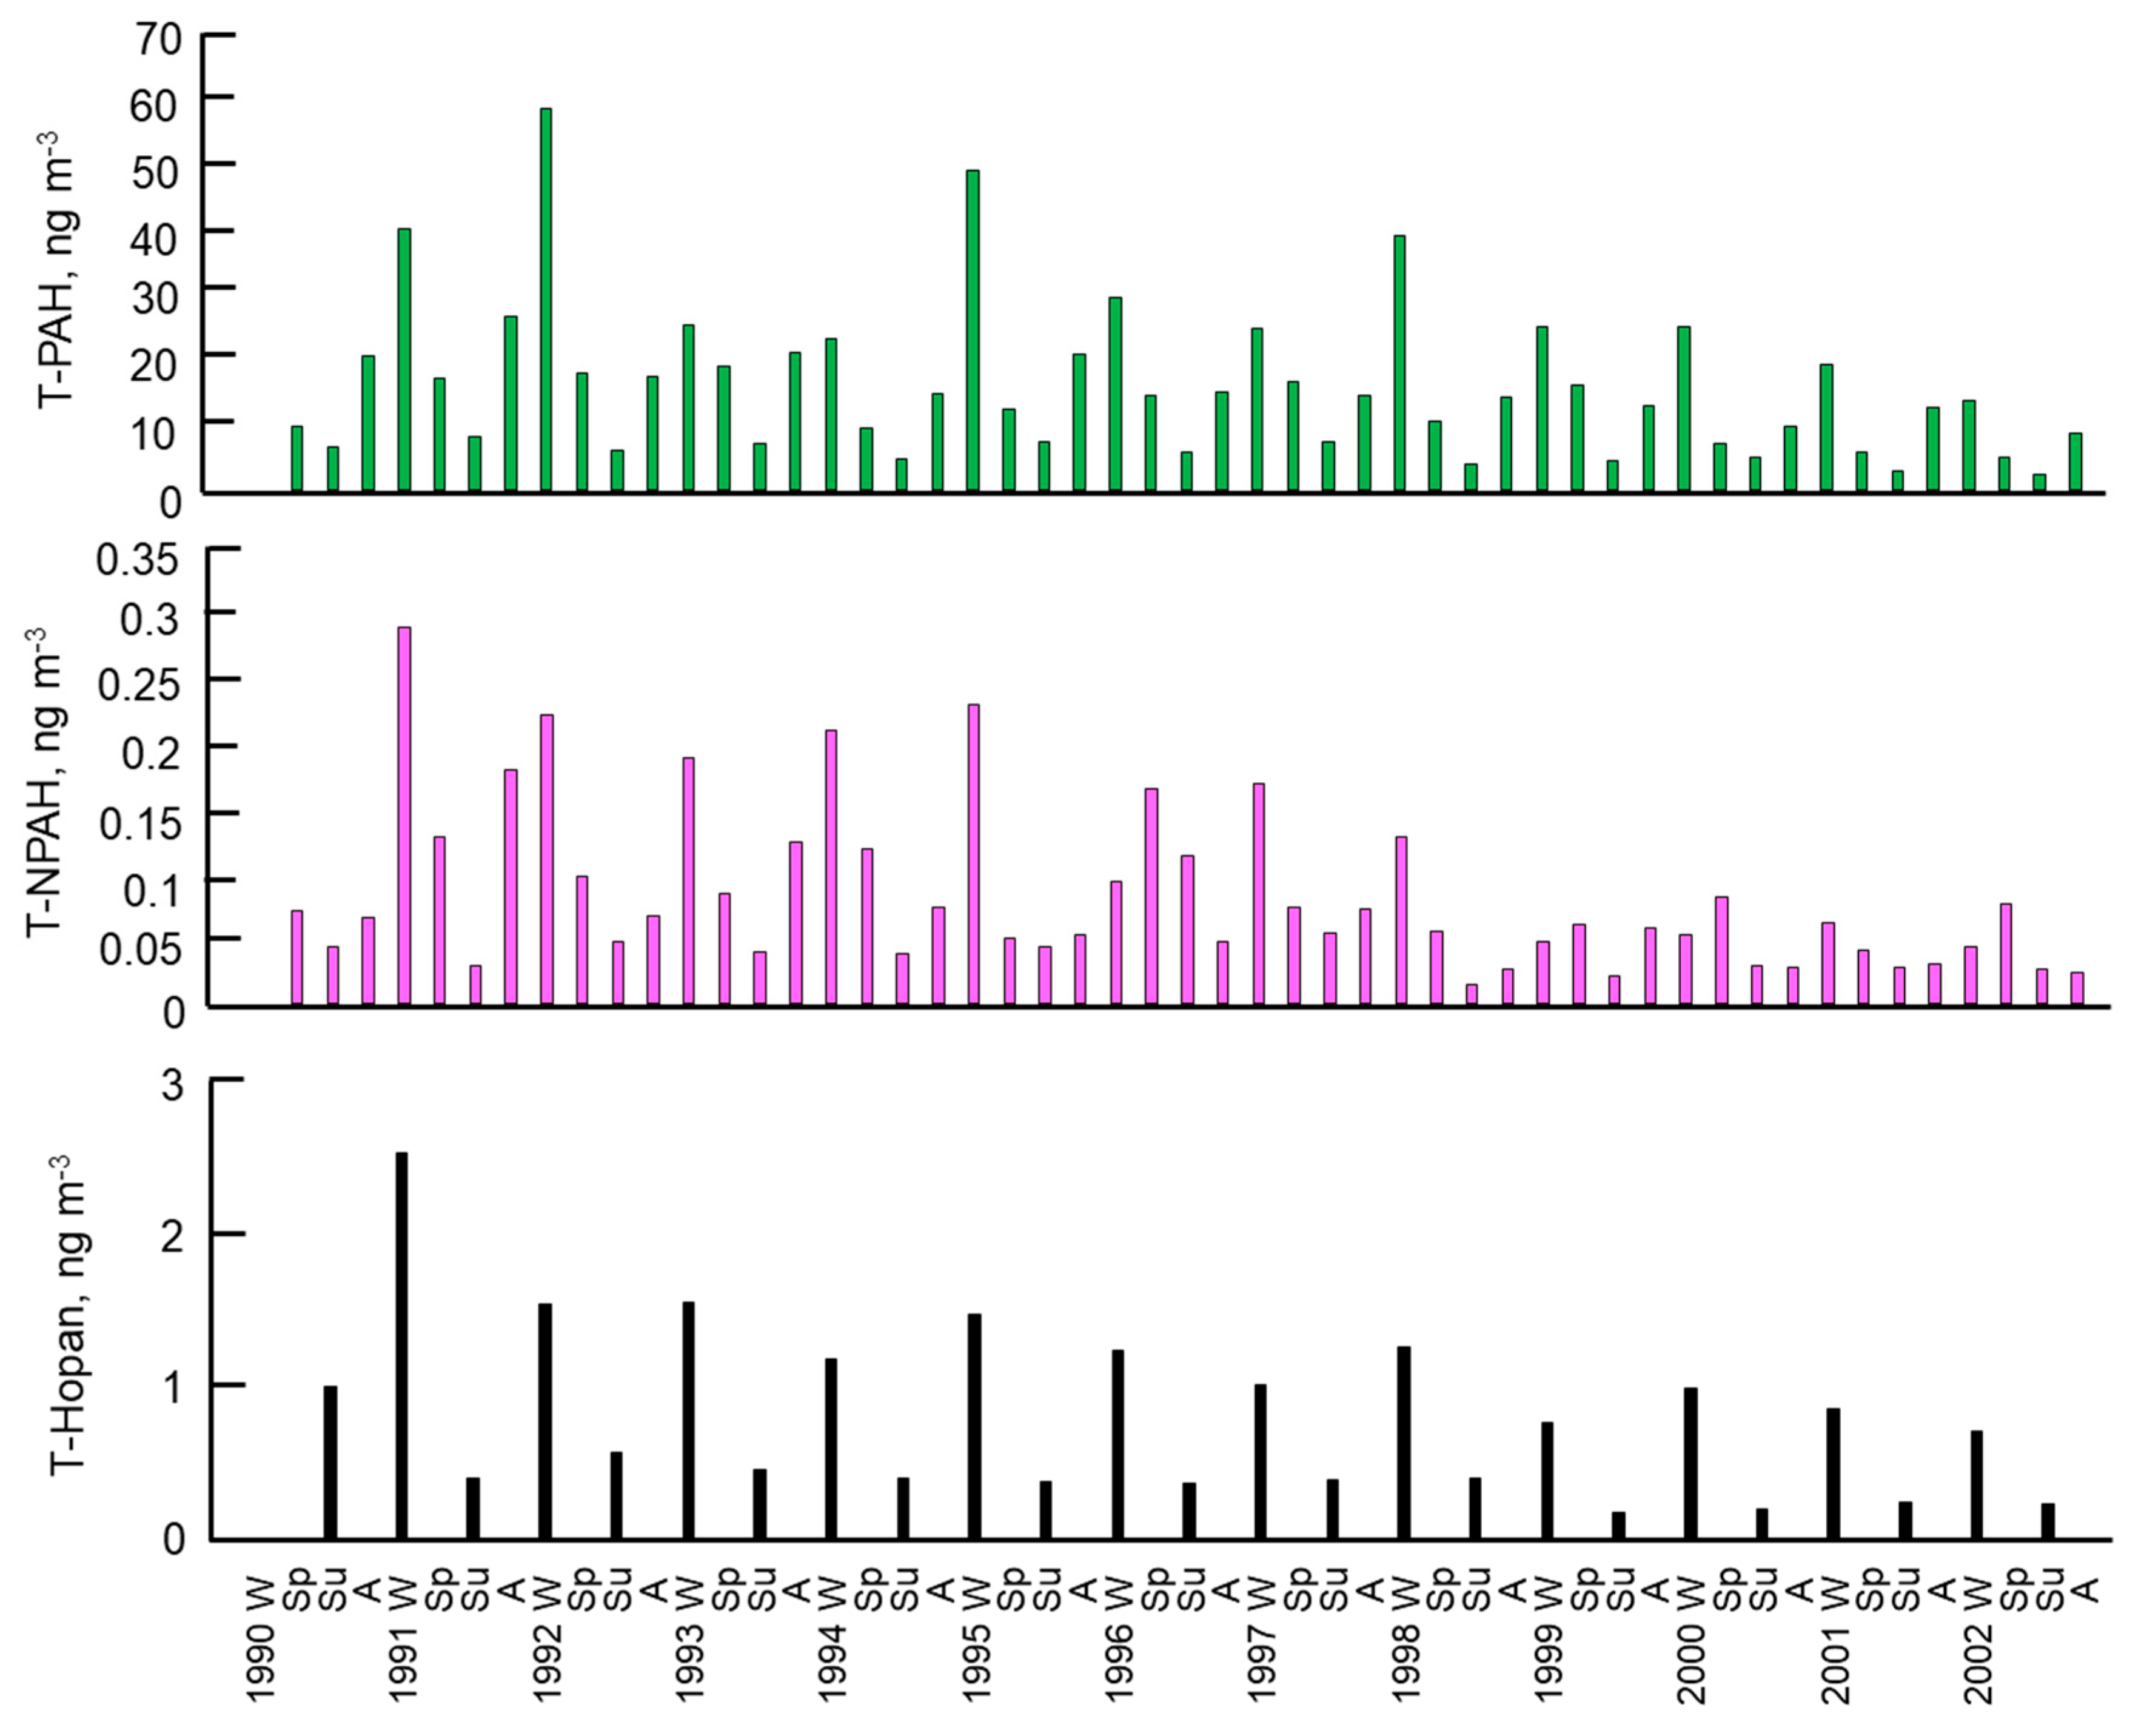
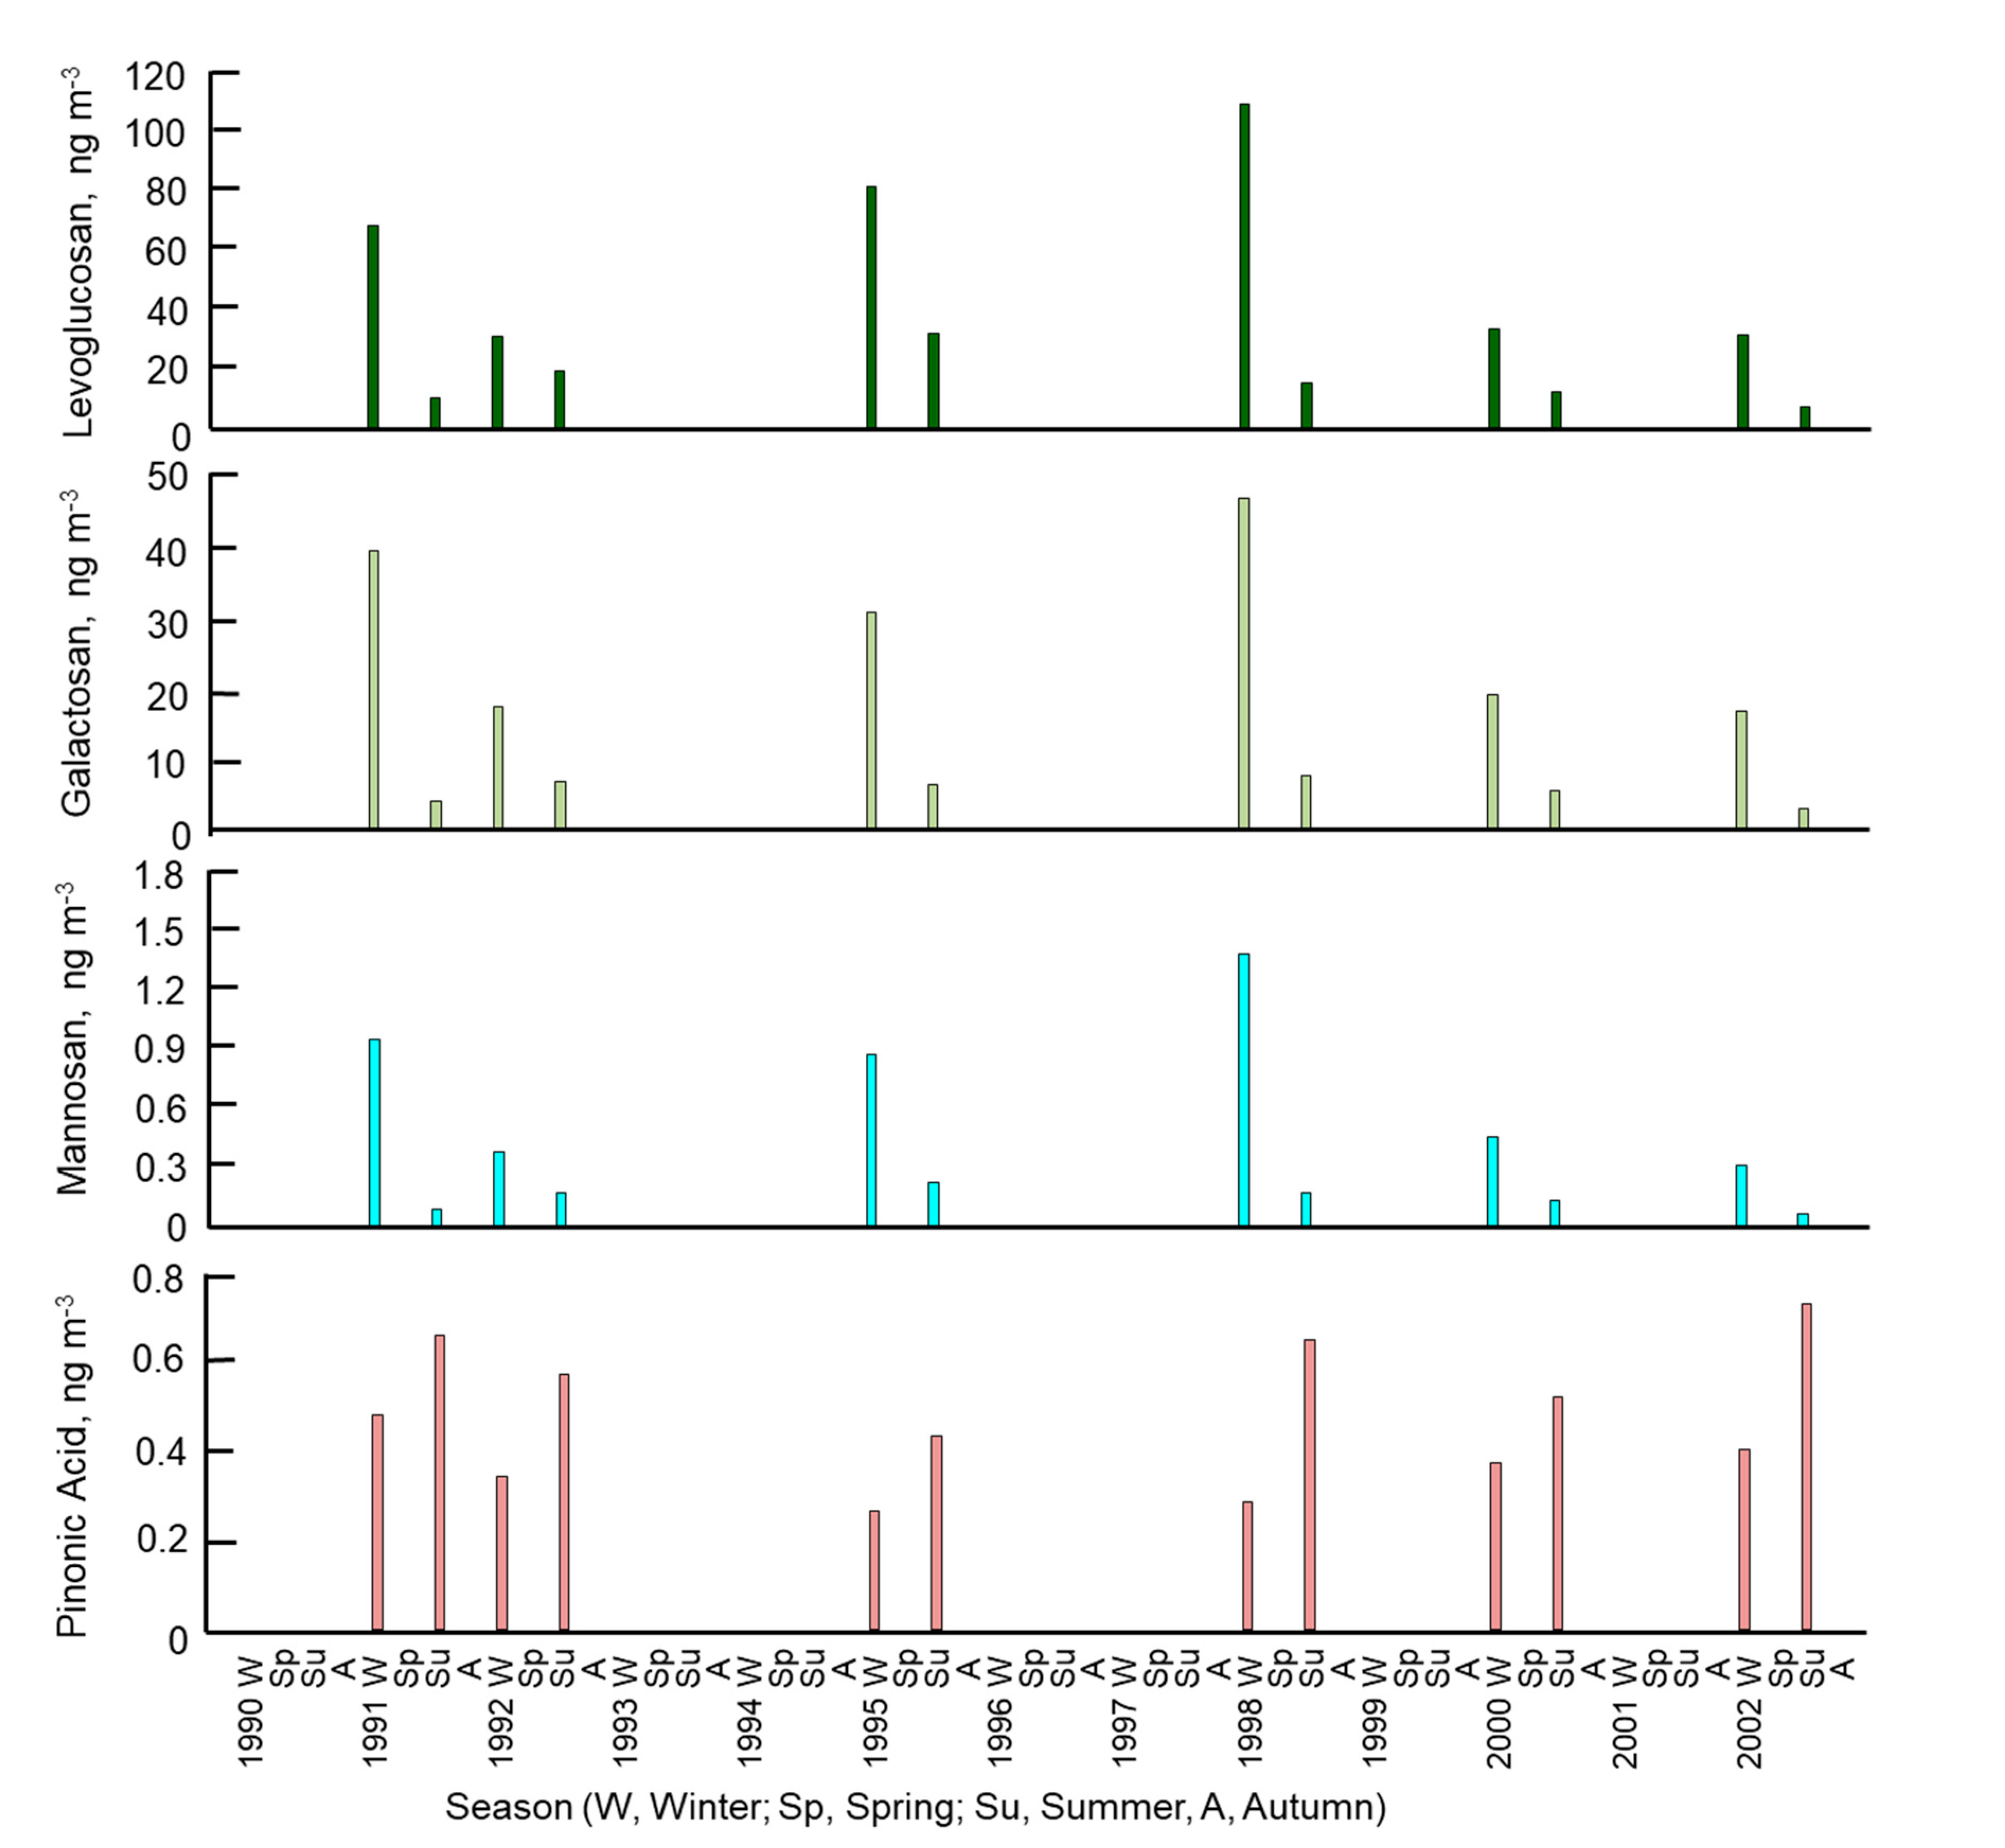
  • The atmospheric concentrations of PAHs, NPAHs, and hopanes, which are markers of vehicle emissions, exhibited long-term and seasonal changes similar to Pc with large correlation coefficients (0.9433–0.8898). However, the atmospheric concentrations of levoglucosan, mannosan, and galactosan, which are markers of emissions from coal and biomass combustion, exhibited weaker correlation coefficients with Pc (0.7271–0.2667). Further, the atmospheric concentrations of pinonic acid, which is a marker of the secondary pollutant formation, did not show a similar change to Pc. These results suggest that the change in the Pc concentration was mainly caused by vehicles rather than by coal and biomass combustion and secondary pollutant formation.
  • The significant decrease in the Pc concentration over the study period is mainly attributed to the Japanese PM/NOx regulations against vehicle exhaust gases.

Author Contributions

Project planning and supervision: K.H.; sampling: S.S. and T.A.; analyses of PAHs and NPAHs: S.S.; analyses of other organic compounds: K.H. and T.A.; writing—review: K.H.; English editing: Scholars Editing. All authors have read and agreed to the published version of the manuscript.

Funding

This research was financially supported in part by a Grant in Aid for Scientific Research (No. 19H03882-03 and No. 22K19686-03) from the Japan Society for the Promotion of Science.

Institutional Review Board Statement

Not applicable.

Informed Consent Statement

Not applicable.

Data Availability Statement

The data presented in this study are available in this article.

Acknowledgments

We would like to thank F. Ikemori for his supplying standard chemicals for G C–MS analyses with effective suggestions. We express our gratitude to all researchers belonging to the Environmental and Geological Research Department, Hokkaido Research Organization and Kanazawa University, who supported air sampling and chemical analysis. We would like to thank MARUZEN-YUSHODO Co., Ltd. (https://kw.maruzen.co.jp/kousei-honyaku/) for the first English language editing and G. E. Nagato, professor of Shimane University, Japan, for the final English language check.

Conflicts of Interest

The authors declare no conflict of interest.

References

  1. Hayakawa, K.; Nakamura, A.; Terai, N.; Kizu, R.; Ando, K. Nitroarene concentrations and direct-acting mutagenicities in diesel exhaust particulates fractionated by silica gel column chromatography. Chem. Pharm. Bull. 1997, 45, 18201–18822. [Google Scholar] [CrossRef] [Green Version]
  2. Kelly, J.; Ivatt, P.; Evans, M.; Kroll, J.; Hrdina, A.; Kohale, I.; White, F.; Engelward, B.; Selin, N. Global cancer risk from unregulated polycyclic aromatic hydrocarbons. GeoHealth 2021, 5, e2021GH000401. [Google Scholar] [CrossRef] [PubMed]
  3. Hayakawa, K.; Onoda, Y.; Tachikawa, C.; Hosoi, S.; Yoshita, M.; Chung, S.W.; Kizu, R.; Toriba, A.; Kameda, T.; Tang, N. Estrogenic/antiestrogenic activities of polycyclic aromatic hydrocarbons and their monohydroxylated derivatives by yeast two-hybrid assay. J. Health Sci. 2007, 53, 562–570. [Google Scholar] [CrossRef] [Green Version]
  4. Motoyama, Y.; Bekki, K.; Chung, S.-W.; Tang, N.; Kameda, T.; Toriba, A.; Taguchi, K.; Hayakawa, K. Oxidative stress more strongly induced by ortho- than para-quinoid polycyclic aromatic hydrocarbons in A549 cells. J. Health Sci. 2009, 55, 845–850. [Google Scholar] [CrossRef] [Green Version]
  5. Kameda, T.; Akiyama, A.; Yoshita, M.; Tachikawa, C.; Toriba, A.; Tang, H.; Hayakawa, K. Mutagenicities and endocrine-disrupting activities of 1-hydroxy-2-nitropyrene and 1-hydroxy-5-nitropyrene. J. Health Sci. 2011, 57, 372–377. [Google Scholar] [CrossRef] [Green Version]
  6. Idowu, O.; Semple, K.; Ramadass, K.; O’Connor, W.; Hansbro, P.; Thavamani, P. Beyond the obvious: Environmental health implications of polar polycyclic aromatic hydrocarbons. Environ. Int. 2019, 123, 543–557. [Google Scholar] [CrossRef] [PubMed]
  7. Hayakawa, K. Review: Environmental behaviors and toxicities of polycyclic aromatic hydrocarbons and nitropolycyclic aromatic hydrocarbons. Chem. Pharm. Bull. 2016, 64, 83–94. [Google Scholar] [CrossRef] [Green Version]
  8. Watson, J.G. Chemical Element Balance Receptor Model Methodology for Assessing the Sources of Fine and Total Suspended Particulate Matter in Portland, Oregon. Ph.D. Dissertation, Oregon Graduate Center, Beaverton, OR, USA, 1979. [Google Scholar]
  9. Paatero, P.; Tapper, U. Positive matrix factorization: A non-negative factor model with optimal utilization of error estimates of data values. Environmetrics 1994, 5, 111–126. [Google Scholar] [CrossRef]
  10. U.S. Environmental Protection Agency. Positive Matrix Factorization Model for Environmental Data Analyses. Available online: https://www.epa.gov/air-research/positive-matrix-factorization-model-environmental-data-analyses (accessed on 2 February 2023).
  11. Tobiszewski, M.; Namiesnik, J. Review: PAH diagnostic ratios for the identification of pollution emission sources. Environ. Pollut. 2012, 162, 110–119. [Google Scholar] [CrossRef] [PubMed]
  12. Hayakawa, K.; Tang, N.; Toriba, A.; Nagato, E.G. Calculating sources of combustion-derived particulates using 1-nitropyrene and pyrene as markers. Environ. Pollut. 2020, 265, 114730. [Google Scholar] [CrossRef]
  13. Hayakawa, K.; Tang, N.; Matsuki, A.; Inomata, Y.; Toriba, A.; Nagato, E.G. Calculating source contributions to urban atmospheric polycyclic aromatic hydrocarbons and nitropolycyclic aromatic hydrocarbons using 1-nitropyrene and pyrene: An application to an Asian dust event. Chemosphere 2021, 220, 130662. [Google Scholar] [CrossRef] [PubMed]
  14. Sapporo Regional Headquarters, Japan Meteorological Agency, Home Page. 2022. Available online: https://www.data.jma.go.jp/sapporo (accessed on 3 February 2023).
  15. Hokkaido, Ban of Spike Tires. Available online: https://www.pref.hokkaido.lg.jp/ks/jss/khz/contents/taiki/jyourei.html (accessed on 2 February 2023).
  16. Wise, S.; Sander, L.; Schantz, M. Analytical methods for determination of polycyclic aromatic hydrocarbons (PAHs)—A historical perspective on the 16 U.S. EPA priority pollutant PAHs. Polycycl. Aromat. Compd. 2015, 35, 187–247. [Google Scholar] [CrossRef]
  17. Hayakawa, K.; Kitamura, R.; Butoh, M.; Imaizumi, N.; Miyazaki, M. Determination of diamino- and aminopyrenes by high-performance liquid chromatography with chemiluminescence detection. Anal. Sci. 1991, 7, 573–577. [Google Scholar] [CrossRef] [Green Version]
  18. Hayakawa, K.; Murahashi, T.; Butoh, M.; Miyazaki, M. Determination of 1,3-, 1,6-, and 1,8-dinitropyrenes and 1-nitropyrene in urban air by high-performance liquid chromatography using chemiluminescence detection. Environ. Sci. Technol. 1995, 29, 928–932. [Google Scholar] [CrossRef] [PubMed]
  19. Tang, N.; Taga, R.; Hattori, T.; Toriba, A.; Kizu, R.; Hayakawa, K. Simultaneous determination of twenty-one mutagenic nitropolycyclic aromatic hydrocarbons by high-performance liquid chromatography with chemiluminescence detection. In Bioluminescence and Chemiluminescence, Progress and Perspectives, Proceedings of the 13th International Symposium, Yokohama, Japan, 2–6 August 2004; Tsuji, A., Maeda, M., Matsumoto, M., Kricka, L.J., Stanley, P.E., Eds.; World Science: London, UK, 2005; pp. 441–444. [Google Scholar]
  20. Kumagai, K.; Tago, H.; Saitoh, Y.; Kudo, S.; Iijima, A. Multicomponent analysis for organic markers in PM2.5 by silylated GC/MS method. J. Environ. Lab. Assoc. (Zenkoku-Kankyouken-Kaishi) 2017, 42, 53–58. (In Japanese) [Google Scholar]
  21. Ministry of the Environment (Japan). Manual for Measurement of Atmospheric Fine Particulate Matter (PM2.5) Components Technical Committee on Particulate. Available online: https://www.env.go.jp/air/osen/pm/ca/manual.html (accessed on 30 November 2022). (In Japanese)
  22. Ikemori, F.; Uranishi, K.; Sato, T.; Fujihara, M.; Hasegawa, H.; Sugata, S. Time-resolved characterization of organic compounds in PM2.5 collected at Oki Island, Japan affected by transboundary pollution of biomass and non-biomass burning from Northeast China. Sci. Total Environ. 2021, 750, 142183. [Google Scholar] [CrossRef] [PubMed]
  23. Westbald, C.; Levendis, Y.A.; Richer, H.; Howard, J.B.; Carlson, J. A study on toxic organic emission from batch combustion of styrene. Chemosphere 2002, 49, 395–412. [Google Scholar] [CrossRef] [PubMed]
  24. Zajemska, M.; Poskart, A.; Musial, D. The kinetics of nitrogen oxides formation in the flame gas. Econ. Environ. Stud. 2015, 15, 445–460. [Google Scholar]
  25. BP. Statistical Review of World Energy 2019, 68th Edition. 2020. Available online: https://www.bp.com/en/global/corporate/energy-economics/statistical-review-of-world-energy (accessed on 30 November 2022).
  26. Hayakawa, K.; Tang, N.; Nagato, E.G.; Toriba, A.; Sakai, S.; Kano, F.; Goto, S.; Endo, O.; Arashidani, K.; Kakimoto, H. Long Term Trends in Atmospheric Concentrations of Polycyclic Aromatic Hydrocarbons and Nitropolycyclic Aromatic Hydrocarbons: A Study of Japanese Cities from 1997 to 2014. Environ. Pollut. 2018, 233, 474–482. [Google Scholar] [CrossRef]
  27. Yan, C.; Zheng, M.; Sullivan, A.P.; Shen, G.; Chen, Y.; Wang, S.; Zhao, B.; Cai, S.; Desyaterik, Y.; Li, X.; et al. Residential coal combustion as a source of levoglucosan in China. Environ. Sci. Technol. 2018, 52, 1665–1674. [Google Scholar] [CrossRef]
  28. Ministry of Land, Infrastructure, Transport and Tourism, Japan. New Long-Term Regulation Against Vehicles. Available online: https://www.mlit.go.jp/kisha/kisha08/09/090325_.html (accessed on 22 February 2023).
  29. Hama, H.; Tokuda, T.; Izaki, A.; Ohno, T.; Watanabe, Y.; Kanda, T.; Tang, N.; Kameda, T.; Toriba, A.; Hayakawa, K. Variation in polycyclic aromatic hydrocarbons and nitropolycyclic aromatic hydrocarbons in airborne particulates collected in urban Kanazawa, Japan, in last 12 years. J. Jpn. Soc. Atmos. Environ. 2012, 47, 1–8. [Google Scholar] [CrossRef]
  30. Jia, L.; Cheng, P.; Yu, Y.; Chen, S.; Wang, C.; He, L.; Nie, H.; Wang, J.; Zhang, J.; Fan, B.; et al. Regeneration mechanisms of a novel high-performance biochar mercury adsorbent directionally modified by multimetal multilayer loading. J. Environ. Manag. 2023, 326, 116790. [Google Scholar] [CrossRef] [PubMed]
Figure 1. Atmospheric concentration of TSP in Sapporo from 1990 to 2002 by season.
Atmosphere 14 00646 g001
Figure 2. Atmospheric concentration of Pc in Sapporo from 1990 to 2002 by season.
Atmosphere 14 00646 g002
Figure 3. Fractions of Ph and Pl in atmospheric Pc in Sapporo over the four seasons. Symbols: Ph, emitted from the high-temperature combustion source (vehicles);, Pl, emitted from low-temperature combustion sources (coal and biomass combustion).
Atmosphere 14 00646 g003
Figure 4. Atmospheric T-PAH, T-NPAH, and T-Hopane concentrations in Sapporo from 1990 to 2002 by season. Abbreviation: T-PAH = fluoranthene + Pyr + benz[a]anthracene + chrysene + benzo[b]fluoranthene + benzo[k]fluoranthene + benzo[a]pyrene + benzo[ghi]perylene + coronene, T-NPAH = 1-NP + 1,3-dinitropyre + 1,6-dinitropyre + 1,8-dinitropyre, T-hopane = 17α(H)21β(H)-30-norhopane + 17α(H)21β(H)hopane + 17α(H)-22,29,30-trisnorhopane.
Atmosphere 14 00646 g004
Figure 5. Atmospheric levoglucosan, galactosan, mannosan, and pinonic acid concentrations in Sapporo from 1990 to 2002 by season.
Atmosphere 14 00646 g005
Table 1. Atmospheric concentrations of TSP and Pc in Sapporo (1990–2002).
YearSeasonTSP (μg m−3)Pc (μg m−3)Pc/TSP a
1990spring101.65.80.057
summer66.03.60.055
autumn64.16.70.104
1991winter70.826.10.369
spring105.211.20.106
summer61.83.00.049
autumn76.515.60.204
1992winter85.327.70.325
spring121.310.00.082
summer69.84.00.058
autumn68.86.20.091
1993winter47.015.70.335
spring80.08.10.101
summer53.53.40.335
autumn64.410.40.161
1994winter35.217.40.495
spring58.28.80.151
summer57.53.10.054
autumn46.86.60.141
1995winter53.823.50.438
spring72.25.50.076
summer45.44.10.091
autumn42.16.30.150
1996winter35.812.50.350
spring65.913.70.208
summer46.57.70.165
autumn44.15.60.127
1997winter43.016.00.371
spring81.98.00.098
summer53.14.30.083
autumn45.57.00.154
1998winter45.615.50.340
spring74.35.50.074
summer37.37.80.208
autumn38.64.10.106
1999winter31.28.80.282
spring69.97.10.102
summer46.42.00.043
autumn55.75.90.106
2000winter42.78.50.200
spring78.86.10.078
summer44.02.30.051
autumn37.33.30.089
2001winter31.18.10.260
spring59.93.40.057
summer40.42.10.053
autumn46.02.00.044
2002winter49.35.10.104
spring96.25.40.057
summer39.22.00.050
autumn40.72.80.069
a: Pc/TSP = y in Equation (3).
Table 2. Seasonal atmospheric concentrations of TSP, Pc, and Pn concentrations as well as Pc/TSP ratio in Sapporo.
SeasonTSP (μg m−3) aPc (μg m−3) aPn (μg m−3) aPc/TSP
Winter47.6 ± 16.215.4 ± 7.45.9 ± 3.60.324
Spring82.0 ± 18.97.6 ± 2.89.4 ± 4.10.093
Summer50.8 ± 10.43.8 ± 1.99.4 ± 3.10.075
Autumn51.6 ± 12.96.4 ± 3.510.8 ± 3.00.124
Annual58.2 ± 20.28.2 ± 6.08.7 ± 4.20.141
RSD b0.3470.7320.483
a: Mean ± SD standard deviation (SD), b: Relative SD = (Mean/SD).
Table 3. Parameters of the first-order linear regression equation for the source markers.
Organic ChemicalMajor SourceEquation (Unit of X)Relative Slope a
TSP Y = −2.600X + 5248 (µg m−3)−0.045/year
Pc Y = −0.673X + 1353 (µg m−3)−0.082/year
T-PAHVehicle/Coal combustion Y = −2.17X + 2194 (ng m−3)−0.131/year
T-NPAHVehicleY = −8.52X + 16545 (pg m−3)−0.099/year
T-HopaneVehicleY = −0.0889X + 178.3 (ng m−3)−0.123/year
LevoglucosanBiomass combustionY = −1.33X + 2713 (ng m−3)−0.036/year
GalactosanBiomass combustionY = −0.0650X + 131.5 (ng m−3)−0.039/year
MannosanBiomass combustionY = −0.191X + 358.8 (ng m−3)−0.040/year
Pinonic acidSecondary formationY = 0.0032X − 5.961 (ng m−3)0.007/year
a, Relative slope = slope of the equation/average concentration.
Table 4. Correlation coefficients (R) of the organic chemicals with Pc.
Organic ChemicalR with Pc
T-PAH0.8937
T-NPAH0.9433
T-Hopane0.8898
Levoglucosan0.6477
Galactosan0.7271
Mannosan0.2667
Pinonic acid−0.7648
Disclaimer/Publisher’s Note: The statements, opinions and data contained in all publications are solely those of the individual author(s) and contributor(s) and not of MDPI and/or the editor(s). MDPI and/or the editor(s) disclaim responsibility for any injury to people or property resulting from any ideas, methods, instructions or products referred to in the content.

