Article

Relationship between South China Sea Summer Monsoon and Western North Pacific Tropical Cyclones Linkages with the Interaction of Indo-Pacific Pattern

1
College of Ocean and Meteorology, Guangdong Ocean University, Zhanjiang 524088, China
2
China Meteorological Administration-Guangdong Ocean University (CMA-GDOU) Joint Laboratory for Marine Meteorology, Guangdong Ocean University, Zhanjiang 524088, China
3
South China Sea Institute of Marine Meteorology, Guangdong Ocean University, Zhanjiang 524088, China
*
Authors to whom correspondence should be addressed.
Atmosphere 2023, 14(4), 645; https://doi.org/10.3390/atmos14040645
Submission received: 10 February 2023 / Revised: 24 March 2023 / Accepted: 27 March 2023 / Published: 29 March 2023

Abstract

:
The South China Sea (SCS) summer monsoon (SCSSM) and Western North Pacific tropical cyclones (TCs) are both tropical systems that interact with each other on multiple scales. This study examines the differences in TCs activity characteristics between anomalous strong and weak SCSSM years, and explores the possible mechanisms behind these differences through the coupling relationship between tropical atmospheric circulation and oceanic surface conditions. Results show that the destructiveness of TCs over the Western North Pacific is stronger during weak SCSSM years than in strong years, whereas the opposite occurs for TCs over the SCS. The interaction between the tropical Indo-Pacific ocean and atmosphere plays a key role in the relationship between SCSSM intensity and TCs activity. In strong (weak) SCSSM years, the sea surface temperature anomaly (SSTA) in the tropical Pacific Ocean tends to correspond to a La Niña-like (El Niño-like) distribution, whereas the tropical Indian Ocean shows an Indian Ocean dipole-negative (positive) phase distribution. Moreover, Walker circulations in both the Indian and Pacific Oceans are coupled during these years, which creates a seesaw-like relationship in the conditions for TCs formation between the SCS and the Western Pacific Ocean. During weak SCSSM years, the formation and activity of TCs over the SCS are suppressed due to the weakened water vapor transport caused by abnormal easterly winds from the eastern Indian Ocean to the southern SCS. Meanwhile, the higher SSTA in the Western Pacific Ocean enhances the TCs activity. In strong SCSSM years, the enhanced monsoon drives a stronger monsoon trough, improving the convective environment over the SCS, whereas in contrast, the Western Pacific Ocean is covered by colder water, resulting in poorer conditions for TCs genesis.

1. Introduction

The South China Sea (SCS) is located at the center of the Asian–Australian monsoon system, connecting the East Asian, South Asian, and Western North Pacific monsoon regions. The South China Sea summer monsoon (SCSSM) is an important component of the Asian monsoon [1,2] and profoundly affects the climates of East and Southeast Asia [3]. The Western North Pacific (WNP) is the most active area for tropical cyclones (TCs) in the world, with approximately 30 TCs generated each year [4,5], of which approximately ten TCs are generated in, or active in the SCS [6]. The SCSSM and WNP TCs are parts of the tropical system, and the main weather systems causing significant rainfall processes along the coast of South China in the pre- and post-flood periods, respectively. They bring heavy precipitation to the coastal areas of South China and are profoundly related to their economic activities and agricultural production. In years of active monsoons, strong convection is frequent along the coast, often with strong and destructive weather processes, causing catastrophic impacts on society, the environment, and ecology. Understanding how these two tropical systems interact can improve the climate prediction of monsoons and TCs, which is important for disaster prevention and mitigation in coastal areas.
Previous studies have shown that approximately 70–80% of TCs are generated in monsoon troughs or are directly related to monsoon circulation [7,8], and the presence of thermodynamic and dynamic conditions in monsoon troughs that are favorable for tropical cyclone generation reveals an important relationship between monsoons and TCs. Numerous studies have shown that on interannual and seasonal scales, significant correlations exist between the frequency of TC occurrence in the WNP and the East Asian summer monsoon (EASM) [9,10,11], the Western North Pacific monsoon (WNPM) [12,13], and the South Asian monsoon (SAM) [14]. These monsoon systems influence the environment of TCs generation through monsoon troughs, subtropical high-level jet streams, and subtropical high or teleconnection wave trains, which in turn affect the frequency of TCs genesis [15,16]. On the interdecadal scale, TCs and monsoon troughs are also related [17,18,19]. Huangfu et al. [20] found that the weakening and westward extension of the Western Pacific monsoon trough after the late 1990s could explain the interdecadal decrease in the number of TCs generated over the WNP.
Recently, the interaction between the SCSSM and TCs over the SCS has received increasing attention. Huangfu et al. [21] and Hu et al. [22] found that the onset date and the withdrawal date of SCSSM are both correlated with the number of TCs over the WNP. Wang et al. [23] found that seasonal-scale monsoon characteristics largely determine the distribution of TCs over the SCS. Chen et al. [15] found that the onset of the SCSSM coincided with the onset of the typhoon season in the WNP and generalized the circulation pattern of the SCSSM before the season. Wang and Chen [24] found a significant relationship between SCSSM onset and landfalling TCs frequency in China. These suggest that interactions exist between SCSSM and TCs. However, one more question remains to be answered: how do TCs activities differ in different SCSSM intensity backgrounds, and by what mechanisms are they connected?
In this study, we reveal the different activity characteristics of TCs over WNP between the strong and weak SCSSM years. The remainder of this paper is organized as follows. Section 2 introduces the data and the methods used in this study. The different statistical characteristics and spatial patterns of the TCs in the strong and weak SCSSM anomalous backgrounds are illustrated in Section 3. Section 4 explains the mechanisms of the coupling relationship through tropical ocean–atmosphere interactions. At the end of the paper, a conclusion and a discussion are given in Section 5.

2. Data and Methods

2.1. Data

The atmospheric reanalysis data used in this study are from the ERA5 monthly averaged data of the European Centre for Medium-Range Weather Forecasts (ECMWF), including the U-component of wind, V-component of wind, vertical velocity, relative vorticity, total column water vapor (TCWV), with a 0.25° latitude × 0.25° longitude spatial resolution [25]. Sea surface temperature (SST) data were obtained from the Met Office Hadley Centre Sea Ice and Sea Surface Temperature dataset, HadISST1, with a 1° latitude × 1° longitude horizontal resolution [26]. To calculate the intensity of the SCSSM, a Monthly Outgoing Longwave Radiation (OLR) dataset from the National Oceanic and Atmospheric Administration (NOAA), with a 2.5° latitude × 2.5° longitude horizontal resolution [27,28,29], was utilized. All of the above monthly data cover the period 1979–2020 (42 years).
The best-track data used in this study were obtained from the Joint Typhoon Warning Center (JTWC), archived in the International Best Track Archive for Climate Stewardship (IBTrACS) v04r00 [30]. Our focus was on TCs that occurred during the TC season, which runs from May to December [23], and had intensities of at least 25 knots (kts), excluding non-TC systems. Hereafter, we refer to these TCs as WNPTC, which are generated over the WNP basin (105°–180° E, 0°–50° N).
For the purposes of this study, we also independently analyzed TCs that were active over the SCS region (5°–20° N, 105°–120° E) during their lifetimes, which we refer to as SCSTC. These were a subset of the WNPTC that we studied (Figure 1).

2.2. Methods

2.2.1. Indices for TCs Activity

In this study, the total cyclone power dissipation index (PDI) is utilized to examine the destructive potential of TCs [31]. For each TC season, the PDI is calculated as follows:
PDI = i = 1 N 0 τ i V m a x 3 d t
where V m a x is the maximum sustained surface wind speed every 6 h [32], τ i indicates the lifetime of each TC, and N is the TCs count in every TC season. The larger the PDI, the stronger the combined TC activity and the greater the destructiveness.
To examine the spatial pattern of the PDI, this study also calculates the regional PDI, which is defined in the same way as the PDI, except that the research area is gridded into 2° × 2° grid points, and the PDI within each grid point is calculated as the Regional PDI. The Regional PDI depends mainly on the intensity and track density of TCs entering the grid point [33].
To compare the maximum wind speeds during the lifetimes of TCs within different TC seasons, this work used the average Lifetime Maximum Intensity (LMI) [34] as follows:
LMI = 1 N i = 1 N V s m a x i
where V s m a x is the maximum sustained surface wind speed during the lifetime of each TC [34]. In addition, the research also counts the frequency of TCs genesis, average lifetime, and average generation location as indicators of TCs activity.

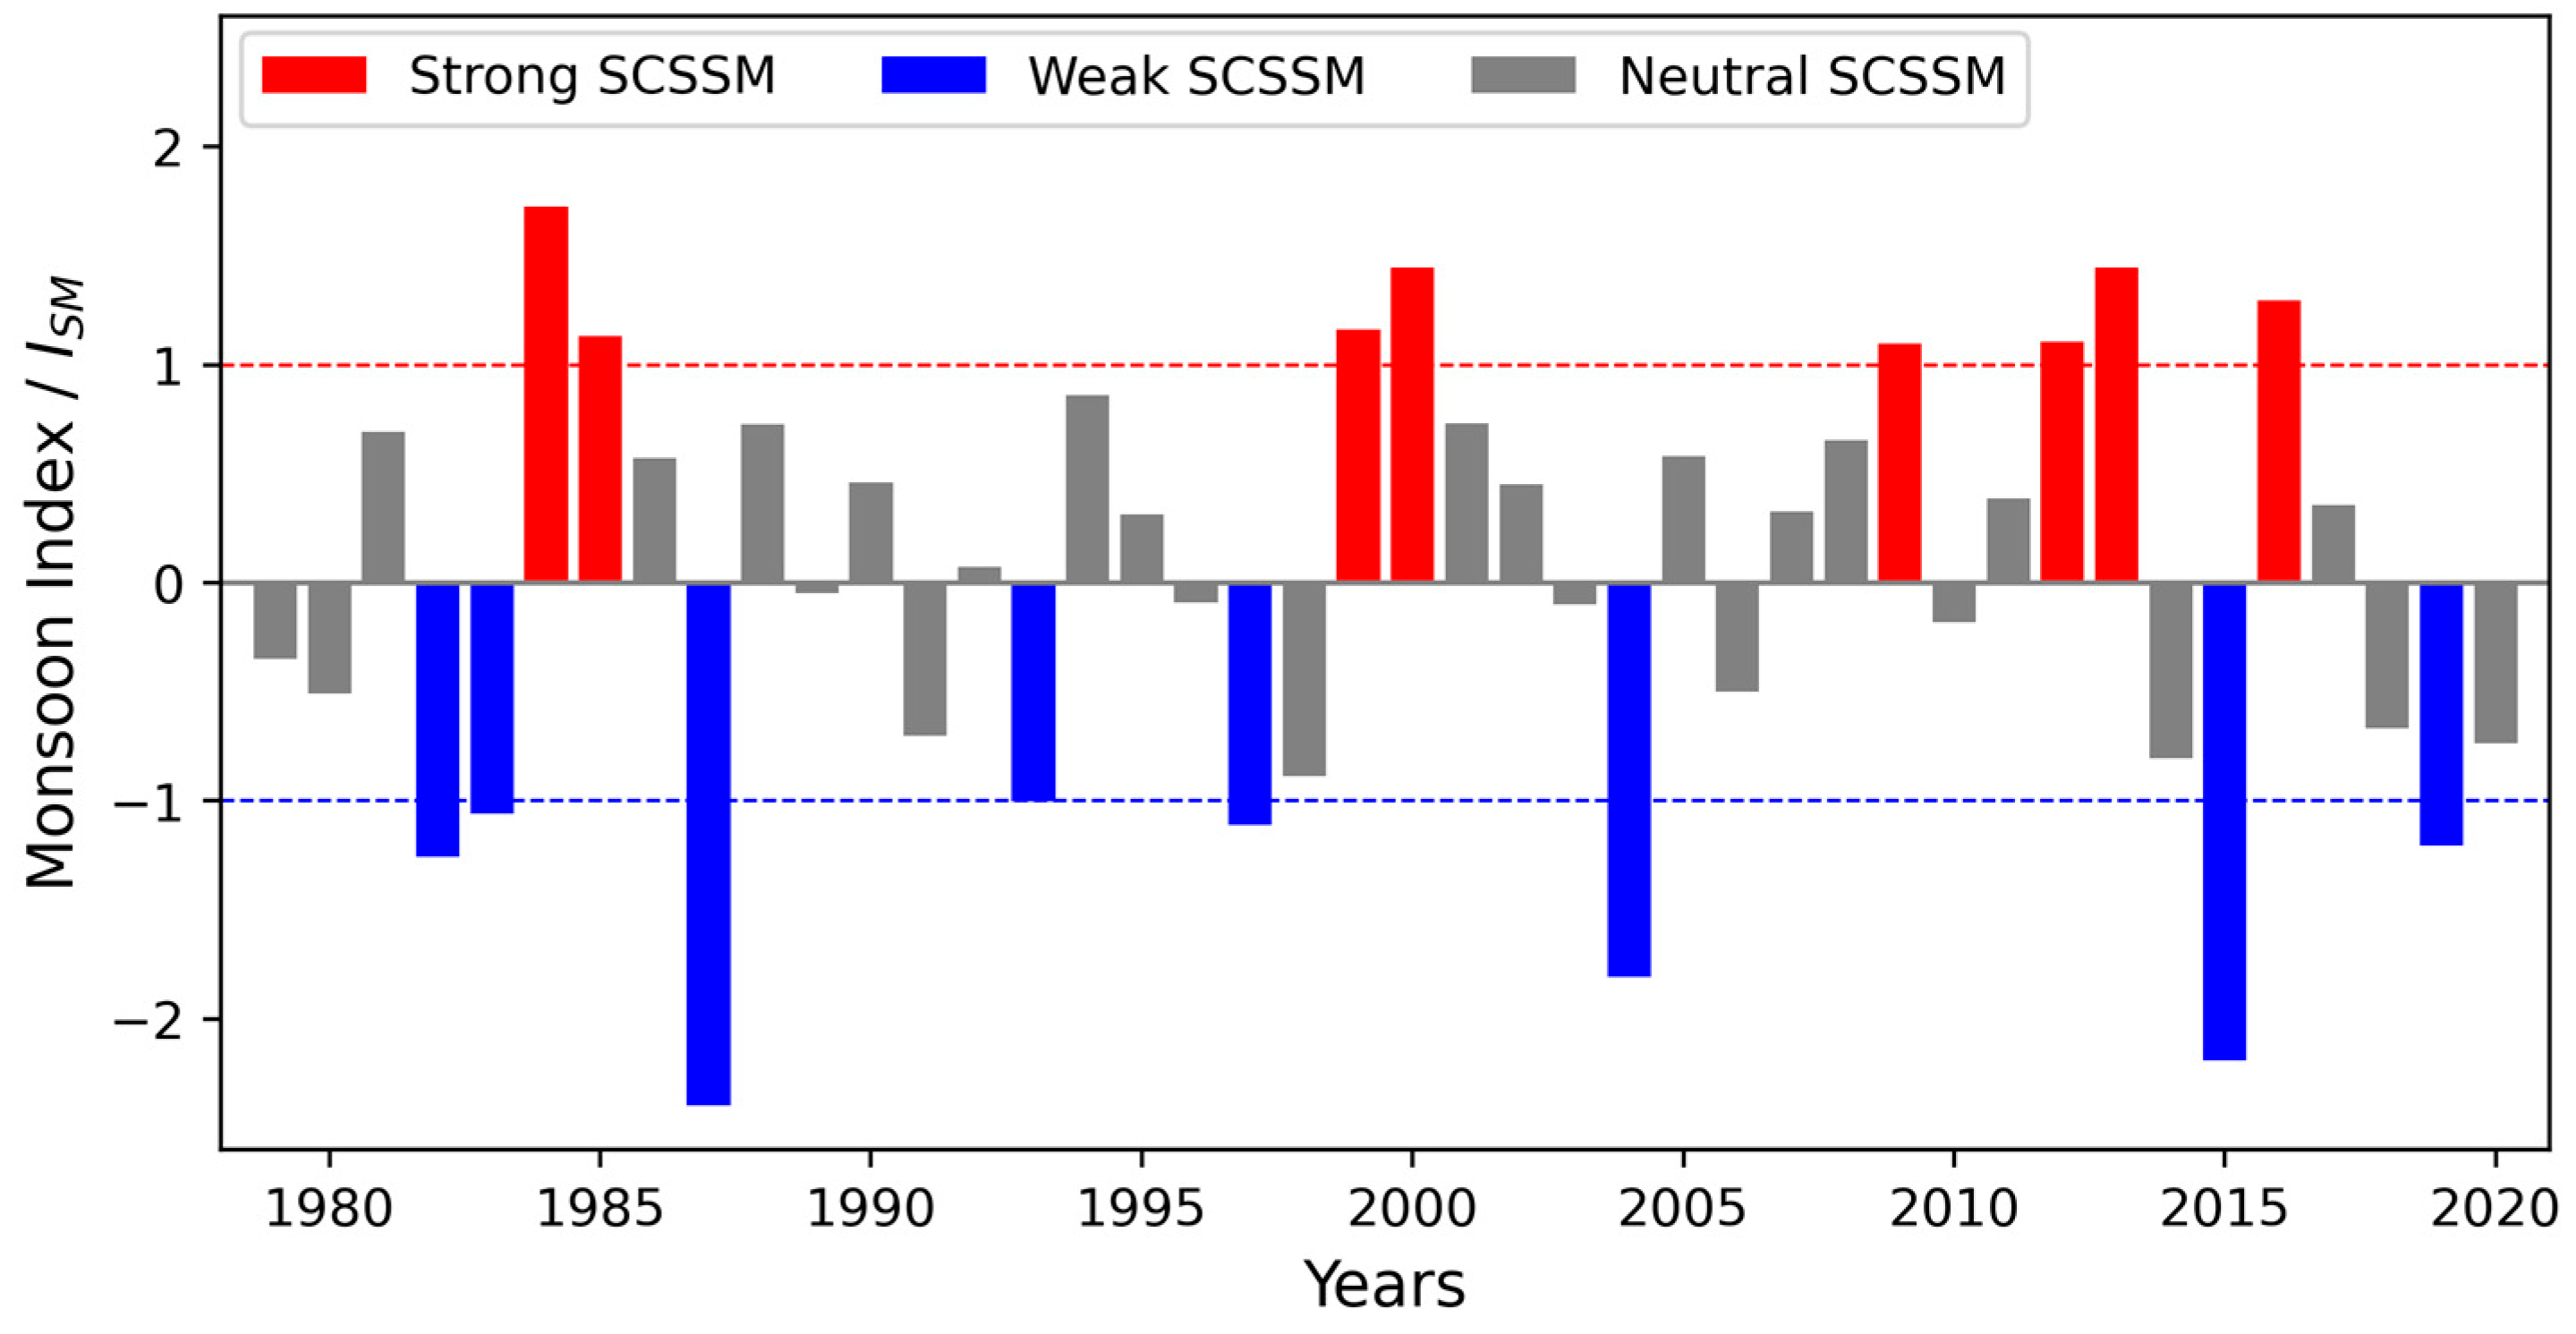
2.2.2. Criteria for SCSSM Intensity and Anomalous Years

Current studies of climate variability in the South China Sea lack a consensus method for defining summer monsoon intensity. Most of the existing methods are calculated from either dynamic (e.g., zonal wind difference, vorticity, or divergence) or thermodynamic elements (e.g., precipitation, equivalent potential temperature, or OLR) [35,36,37,38,39]. In this study, the SCSSM index refers to the definition of Wu and Liang [40]. By combining dynamic and thermodynamic parameters, the southwest wind, and the OLR, the intensity of SCSSM (ISM) is characterized as follows:
I S M I V s w + I O L R = V s w V s w ¯ δ V s w O L R O L R ¯ δ O L R
where I V s w is the standardized southwest wind index and I O L R is the standardized OLR index. Specifically, V s w = 1 2 u + v is a projection of the monthly average 850 hPa winds in the southwest direction over the SCS (Figure 1); OLR is the average OLR value over the month. V s w ¯ and O L R ¯ are multi-year means over the month, and δ V s w and δ O L R are the standard deviations of V s w and OLR, respectively. Physically, the intensity of the SCSSM can be indicated by the magnitude of the 850 hPa southwest wind and the intensity of convection. The stronger (weaker) the southwest wind, and the smaller (larger) the OLR value, indicating stronger (weaker) convection and stronger (weaker) SCSSM.
Based on the multi-year average monthly ISM seasonal circulation curve (Figure 2), the ISM from May to October is typically greater than zero. Therefore, to obtain the annual ISM, we calculated the average value of the monthly ISM from May to October for each year. This time period coincides with the months of onset and withdrawal of SCSSM identified in previous studies [2,41]. The resulting annual ISM was normalized and detrended, and used as a year-by-year time series of the SCSSM intensity index (Figure 3). In this study, a standard deviation of one is used as the criterion to identify years with anomalously strong or weak SCSSM activity. Based on this criterion, eight years were identified as anomalously strong (1984, 1985, 1999, 2000, 2009, 2012, 2013, and 2016), whereas eight years were identified as anomalously weak (1982, 1983, 1987, 1993, 1997, 2004, 2015, and 2019) during the period 1979–2020. The remaining years were categorized as neutral.
In addition, to filter out high-frequency variations in the spatial distribution, a spatial 9-point filter was applied [33].

3. Characteristics of TCs activity in SCSSM Anomalous Years

To investigate the differences in TCs activity during SCSSM anomalous years, we conducted composite analyses of the annual frequency, intensity, lifetime, destructive potential, and spatial patterns of TCs activity for the anomalously strong and weak years, respectively.

3.1. General Indicators

The statistical characteristics of the general indicators of WNPTC and SCSTC activity during the strong and weak SCSSM years, respectively, are shown in Table 1. The frequency of WNPTC during the TC season is not significantly different between the strong and weak years, which both deviated from the neutral years within 5%. However, the frequency of SCSTC in the weak years is only 8.75, which is 2.21 (~20.2%) less than the neutral years, and 2.75 (~23.9%) less than the strong years. The LMI is used to examine the intensity characteristics of the TCs. In both WNPTC and SCSTC, the LMI in the weak years is significantly higher than that in strong years, and the differences between them are 6.07 m/s (16.0%) and 5.16 m/s (14.6%) over WNP and SCS, respectively. During the SCSSM strong years, in both WNPTC and SCSTC, lifetimes are significantly shorter than neutral years, by 0.8 days (12.6%) and 0.4 days (7.3%), respectively. The weak years displayed significantly longer lifetimes, by 0.94 days (14.8%) and 1.2 days (21.8%), respectively. As expected, the differences in TCs lifetimes between the strong and weak years are significant at approximately 31% in both the WNP and SCS.
To characterize the destructive potential of TCs, we also examined the cyclone power dissipation index (PDI) in the two types of anomalous SCSSM years. For WNP, the PDI is lower in the strong years and higher in the weak years, with a significant difference of 38.4% between these two types. For SCS, we calculated the PDI of SCSTC in the entire WNP and in only the SCS, respectively. The results of both areas influenced by SCSSM are consistent, being stronger in the strong years and weaker in the weak years, although the differences are not significant.
The above results indicate that there are notable differences in TCs activity between anomalously strong and weak SCSSM years. TCs occur more frequently during strong SCSSM years, but have weaker maximum intensities and shorter lifetimes compared to weak SCSSM years. These findings hold true for both WNPTC and SCSTC, with the most significant differences observed in lifetimes. However, the destructive potentials of WNPTC and SCSTC exhibit opposite patterns in strong and weak SCSSM years. Specifically, the PDI is lower for WNPTC but higher for SCSTC during strong years, indicating that TCs activity is more concentrated in the SCS, whereas the opposite is true during weak years. Spatial pattern analysis is used to further explore the underlying reasons for these differences.

3.2. Spatial Patterns of TCs Activity

Firstly, we analyze the locations of TCs genesis and the range of their activity. As shown in Figure 4, during SCSSM strong years, TCs generally generate close to the East Asian continental coast, with the average location of cyclone genesis at 16.2° N, 135.8° E, and a higher frequency of TCs genesis over the SCS region, which confirms the findings in Section 3.1. On the other hand, during weak years, the latitudinal spread of TCs genesis widens, with the average genesis location shifting closer to the tropical Central Pacific at 13.4° N, 142.6° E, whereas fewer and weaker TCs generate around the East Asian coast. The average TCs genesis location shows a significant difference between the strong and weak years. Additionally, it is noticeable that the low latitude region, located east of 150° E and south of 15° N (green box), only generates 2.5 TCs per year during strong years, compared to 7.4 TCs per year in weak years, which represents a nearly threefold difference, indicating an unfavorable environment for TCs genesis in strong years, but a favorable one in weak years. Possible mechanisms will be described in Section 4.1.
To reveal spatial differences in TCs activity between the two types of SCSSM anomalous years, we calculated the TCs track density, average intensity (represented by the grid point average TCs maximum wind speed), and regional PDI for strong and weak years, respectively. The spatial distributions of the differences between them are shown in Figure 5. From the distribution of TCs track density differences (Figure 5a), it is evident that the TCs track densities along the Asian continental coast in strong SCSSM years are higher than those in weak years, especially in the northern SCS off the coast of Southern China, whereas those over the broad sea area east of the Philippines are significantly lower. The amount of TCs activity close to the continent responds to the SCSSM just opposite the broad sea area east of the Philippines. A similar pattern exists in the different distributions of TCs average intensity (Figure 5b), with TCs in the northern SCS being significantly stronger in the strong years, while being weaker over most areas of the WNP and southern Japan.
The regional PDI spatial pattern (Figure 5c) can be well summarized as an integrated result of track density and average intensity characteristics, which can effectively represent the destructive potential of TCs in different areas. In weak SCSSM years, TCs are generated close to the tropical Central Pacific, and there are more and stronger TCs activities in the east of 130° E, resulting in significantly higher regional PDI. After the development of these TCs over the warm-pool region, they hit the Philippine coast with violent intensities. However, since TCs moved into the SCS, owing to the weak SCSSM, deep convection is weaker than that in strong years, and cyclone intensity gradually weakened, resulting in low regional PDI in the SCS.
In strong SCSSM years, the conditions are reversed and the opposite occurs. In these years, the East Asian continent, especially the southern coast of China, is required to defend against TCs that generate and intensify near the shore.

4. Possible Mechanisms

4.1. Monsoon Trough

Previous studies have shown that the location of the Monsoon Trough (MT) has a controlling effect on the activity distribution of WNPTC [20,42,43]. Wu et al. [18] found that more TCs were generated in the WNP when the MT extended eastward. To verify the relationship between SCSSM intensity and monsoon trough pattern over the WNP, this study conducted a regression analysis on the 850 hPa circulation and OLR in WNP during the period from May to December based on the annual ISM. In both the strong and weak years, two MTs in the SCS and the Philippine Sea regions can be distinguished (as shown in Figure 6a,b). Compared to the weak years, the position of the SCS MT does not differ significantly in the strong years, but the intensity difference is remarkable, with stronger southwest winds and more intense convective activity. On the other hand, the intensity and pattern of the Philippine Sea MT undergo significant changes between the strong and weak years. In strong years, the Philippine Sea MT extends only to 140° E, with energy concentrated near the Philippine Islands due to the supplement of strong southwest moisture input from the SCS and the Western Pacific region, forming a block-shaped low OLR area. In the weak years of the SCSSM, the MT can extend eastward to nearly 155° E, at a lower latitude, with a more scattered distribution of low OLR values, and closer to the tropical central Pacific.
As shown in Figure 6, based on the range of MT activity and TC genesis, four sub-regions are divided in the WNP: Area I (i.e., SCS, 3°–25° N, 105°–120° E), Area II (15°–25° N, 120°–150° E), Area III (3°–15° N, 120°–150° E), and Area IV (3°–15° N, 150°–180° E). The positions of TC genesis are closely related to the position of MT, and the number of TC genesis in the four regions differs significantly between the strong and weak years. In the SCSSM strong years, the SCS is affected by a stronger MT, resulting in a significantly higher number of TCs being generated. The same happens in Area II, the northern part of the Philippine Sea, where the number of TCs in strong years is more than twice as much as that in weak years, which is related to the northward MT. Conversely, in weak years, TCs tend to be generated at a lower latitude, in Areas III and IV. Especially in Area IV, during the weak years, the anomalous eastward expansion of MT results in more TCs generation, in contrast to the strong years. These composited patterns are consistent with previous studies. The MT is a background field for the growth of synoptic-scale wave disturbances [44], and it provides an environment for the enhancement of convective activity and TCs genesis [18,19,20], and thus anomalous MT activities controlling the variation in the frequency of TC formation in different regions.

4.2. Subtropical High

Climatologically, the MT over the Western Pacific extends along the southwestern edge of the subtropical high, which is well coupled with multi-scale systems including ENSO [45,46,47]. Before discussing the larger-scale ocean–atmosphere system, we examine the distribution of the Western Pacific subtropical high (WPSH) in anomalous SCSSM years. The patterns of the WPSH during TC season in the anomalous SCSSM years are shown in Figure 7. The WPSH intensity in strong SCSSM years is weak, the ridge latitude is northward, and the westward extension of the ridge point is eastward, which is in obvious contrast to the strong WPSH in the weak years, making it a contributor to the difference in destructive potential. The difference in ridge latitude is the most significant during the peak of the monsoon (JJA) (Figure 7b). In strong years, the WPSH ridge is northward, whereas the SCS MT and the convection over the northern part of the Philippine Sea are strong, which favors TC genesis over the SCS and Area II. On the contrary, in the weak years, when the WPSH ridge is southward, the TC formation condition of Area II turns worse due to the suppression of convection by the WPSH, so it can well explain the difference of Area II between the strong and weak years.
The interannual variation of WPSH is modulated by tropical ocean and atmosphere interaction [48]. In order to understand the relationship between WPSH, SCSSM, and TCs activity, we need to turn our attention to a larger scale of the tropical Indo-Pacific Ocean.

4.3. Interaction of Tropical Indo-Pacific Ocean–Atmosphere System

The above analysis shows that the SCSSM intensity is coupled with the MT and the WPSH, which indicates that its interannual variability is not only a response to regional synoptic-scale changes. As a central system in the Asian–Australian monsoon region, the anomalies of the SCSSM are closely responsive to the large-scale tropical Indo-Pacific ocean–atmosphere system [49]. Studies have shown that there is a robust relationship between monsoon and sea surface temperature (SST) [23,50,51]. In terms of the SST anomaly (SSTA) during the TC season (May to December), the tropical Indo-Pacific Ocean shows tripolar distributions in anomalous SCSSM years (Figure 8), with a negative–positive–negative pattern in strong years and a positive–negative–positive pattern in weak years. In strong (weak) years, the Indian Ocean has an Indian Ocean Dipole (IOD) negative (positive) phase distribution, whereas the Central-Eastern Pacific Ocean has a La Niña-like (El Niño-like) pattern, and the Western Pacific warm-pool region is a large area of positive (negative) SSTA. This distribution further confirms the coupling relationship between the intensity of the SCSSM and Indo-Pacific pattern [52,53], such as El Niño-Southern Oscillation (ENSO) or IOD.
Numerous studies have described the activity of the WNPTC response to ENSO [23,54,55,56,57,58,59,60]: in El Niño years, there are more TCs in the eastern part of the WNP, and the TCs in El Niño years are stronger and longer-lived than in La Niña years. In addition to the influence of ENSO, the impact of the Indian Ocean mode on WNPTC has been emphasized in recent years. Zhan et al. [51] revealed that the influence of the East Indian Ocean SSTA on WNPTC has been significantly enhanced since the late 1970s. Zhou et al. [61] discovered a significant negative correlation between the number of TCs landfalling in China and the IOD. Liu et al. [62] proposed two joint modes of the Indo-Pacific SSTA, and the oscillations between them could reveal the interdecadal variation in the genesis frequency of WNPTC.
Furthermore, tropical Indo-Pacific SSTA exerts a critical influence on the WPSH [63]. Previous studies have highlighted the impact of tropical SSTA on WPSH and demonstrated that El Niño is a key source of its variability [48,63,64]. Additionally, some mechanisms related to the Indian Ocean and the Maritime Continent are also important contributors to the WPSH variability [65,66,67,68].
Therefore, through the action of WPSH, the tropical Indo-Pacific SSTA controls the spatial and temporal extent of TC activity and modulates the East Asian atmospheric circulation (including SCSSM), and plays a key role as a mediator in the strong relationship between the SCSSM and WNPTC.
As shown in Figure 9, the tripolar SSTA distribution leads to two anomalous Walker cells [69]. In strong (weak) SCSSM years, WPSH abnormally weakens (strengthens), and the Western Pacific is an anomalous ascending branch (descending branch) closely connected with the anomalous descending branches (ascending branches) over the Indian Ocean and Central-Eastern Pacific [66]. This means that in anomalous SCSSM years, the tropical Indo-Pacific air-sea systems are stably coupled. By combining the distributions of atmospheric circulation and related physical variables, the factors responsible for the differences in WNPTC activity in anomalous SCSSM years could be further understood.
In strong SCSSM years, anomalous eastward winds occur over the tropical Indian Ocean and anomalous westward winds occur over the tropical Pacific Ocean at the lower level, whereas the opposite is true at the upper level (Figure 10a,b), forming two Walker cells in their respective basins. They constitute a latitudinal wind anomalous convergence zone near the Western Pacific warm pool region (90–150° E), which also corresponds to the upward vertical motion anomalous zone (Figure 10c). This upward zone essentially controls the SCS to the Philippine Sea, which, together with the improved water vapor input from the SCSSM (Figure 10e), favors more TCs active in the region. Moreover, SCS is a zone of positive relative vorticity (Figure 10d), indicating active convection and enhanced monsoon trough, which also favors the generation and activity of the SCSTC. However, the opposite is true in the eastern part of WNP, with negative relative vorticity anomalies, anomalous downward vertical motion, and low water vapor, indicating that the dynamic and thermodynamic conditions are unfavorable for the generation of TCs in this region. Therefore, this pattern explains the seesaw relationship between the spatial activity characteristics of TCs over the SCS and the eastern part of WNP during the SCSSM anomaly years, as shown in Figure 5.

5. Conclusions and Discussion

5.1. Conclusions

In this study, we investigate differences in TCs activity indicators between strong and weak anomalous SCSSM years and explore potential mechanisms that explain these differences. Our analysis highlights the impact of the tropical Indo-Pacific ocean–atmosphere interaction on the relationship between SCSSM intensity and TCs activity. Here are the main points of the study:
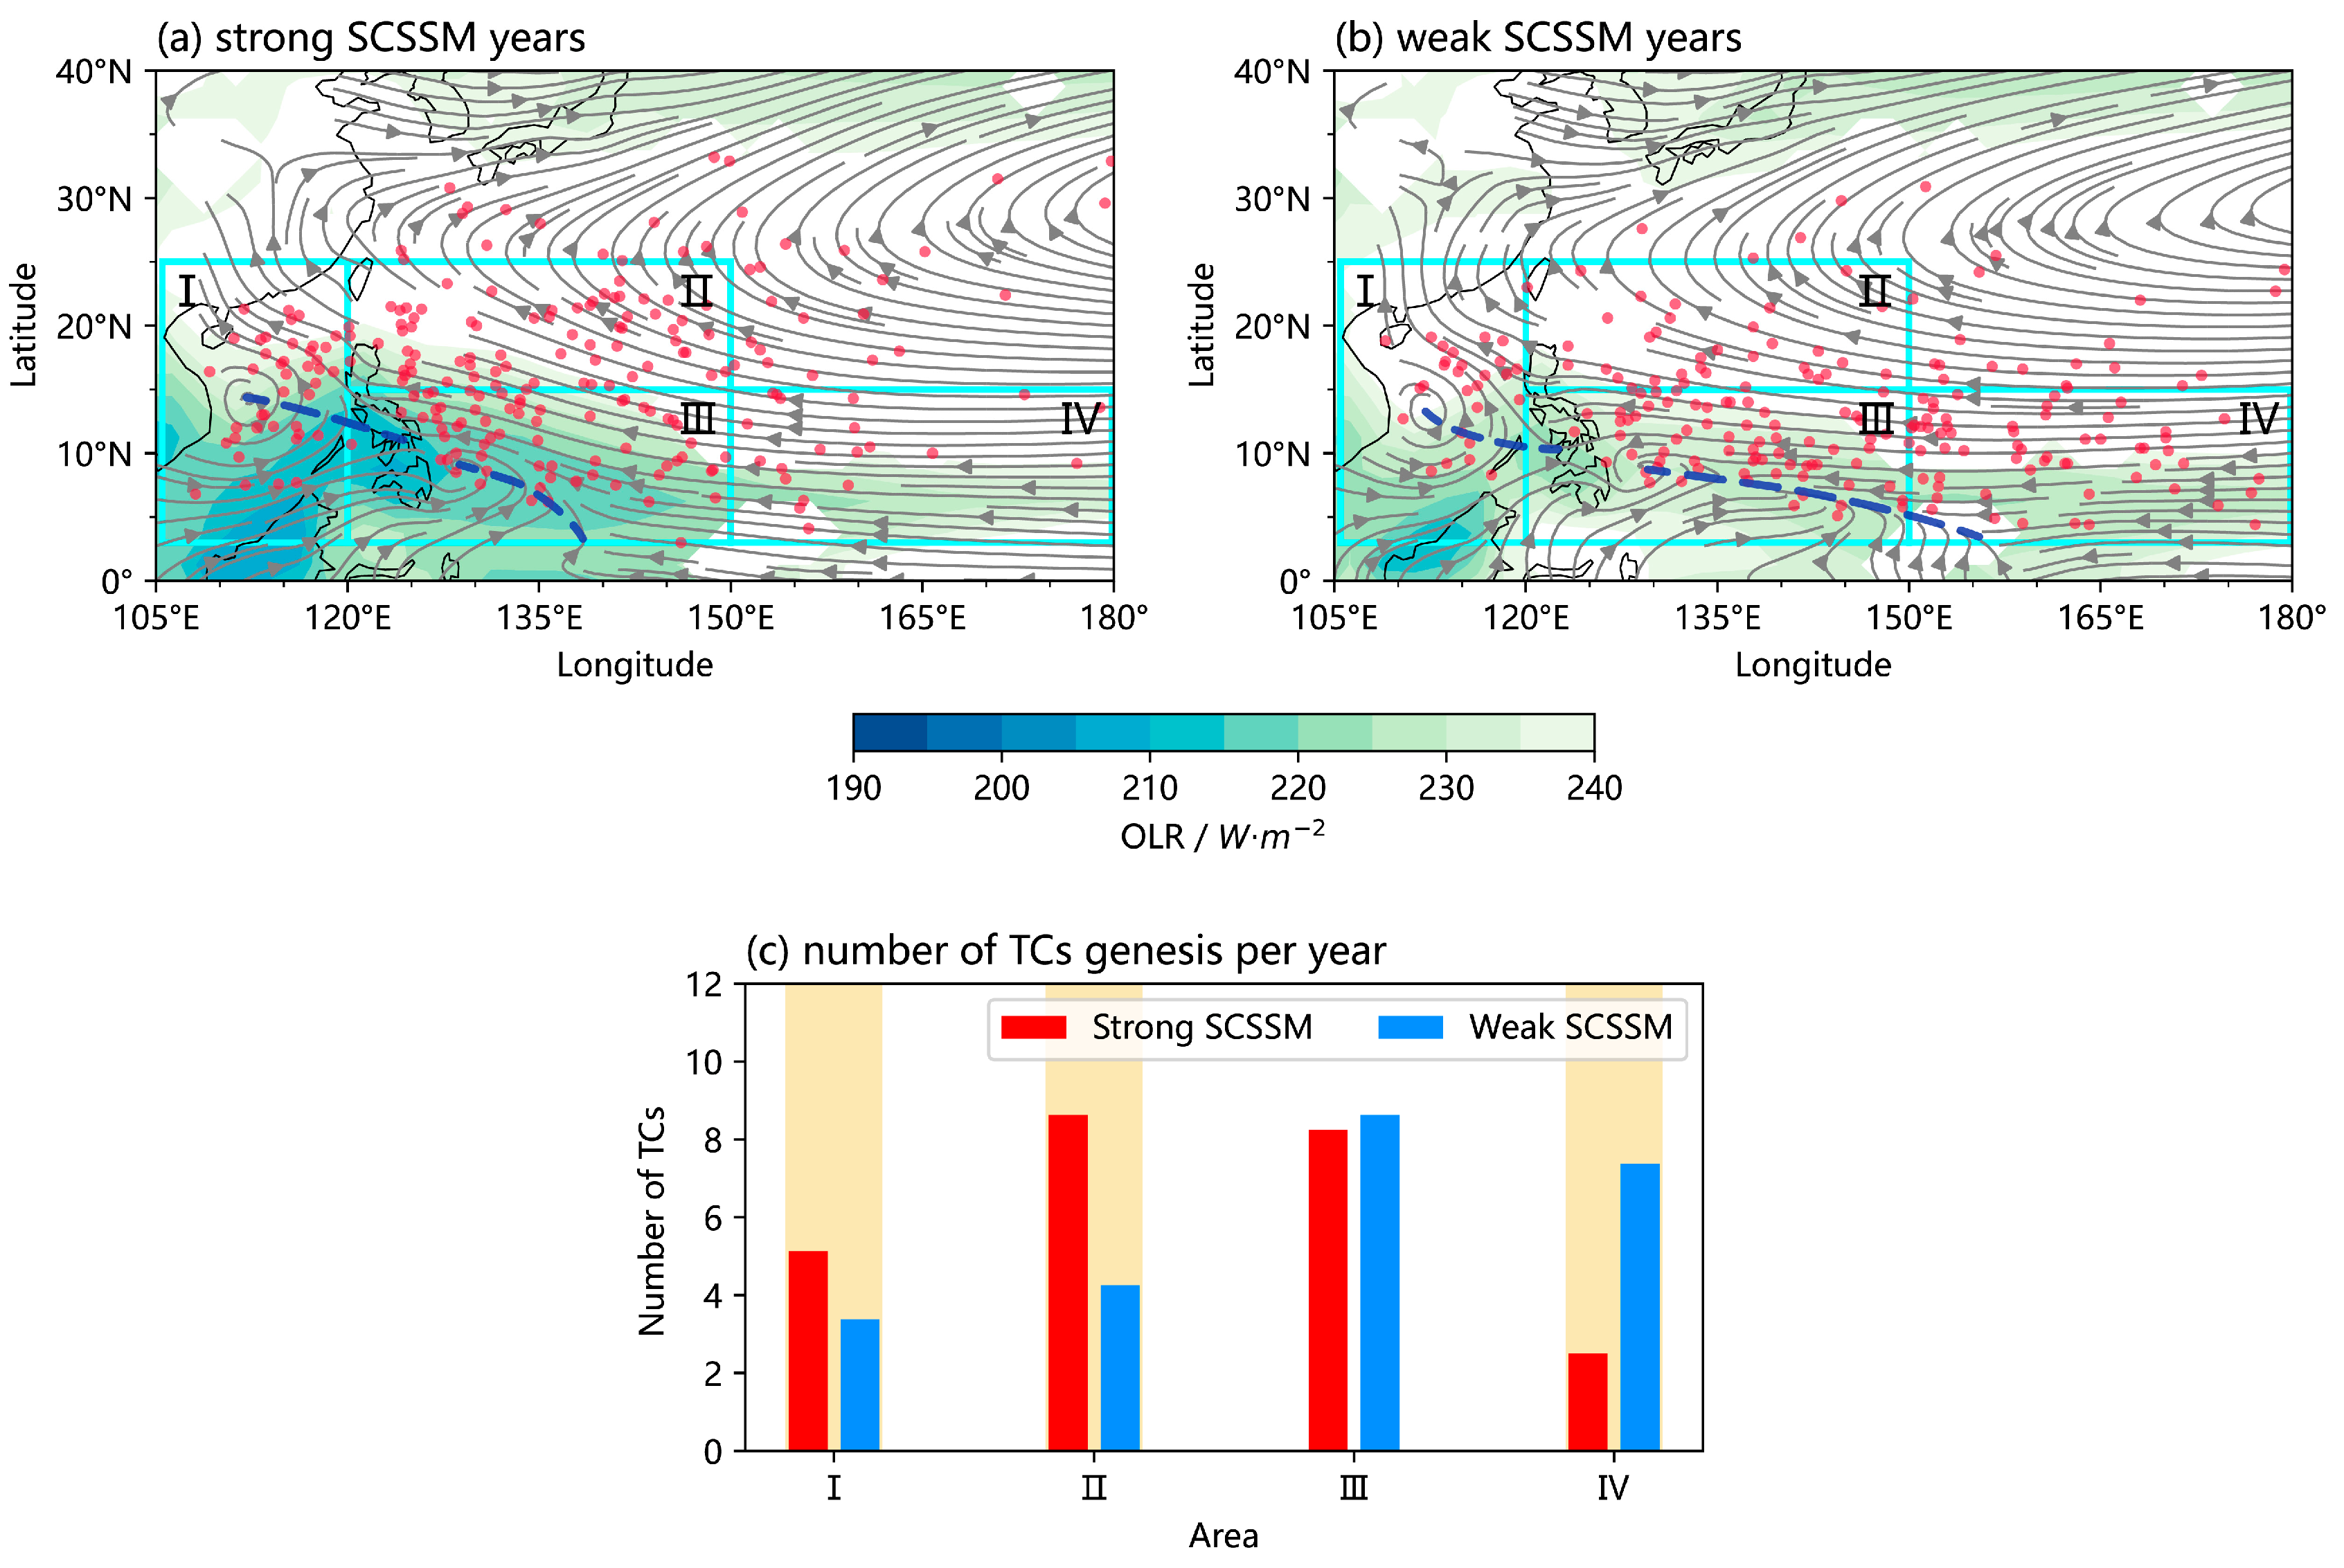
  • Anomalously strong (weak) SCSSM years are associated with weak (strong) maximum intensities and short (long) lifetimes of WNPTC. SCSTC are more (less) frequent during strong (weak) SCSSM years.
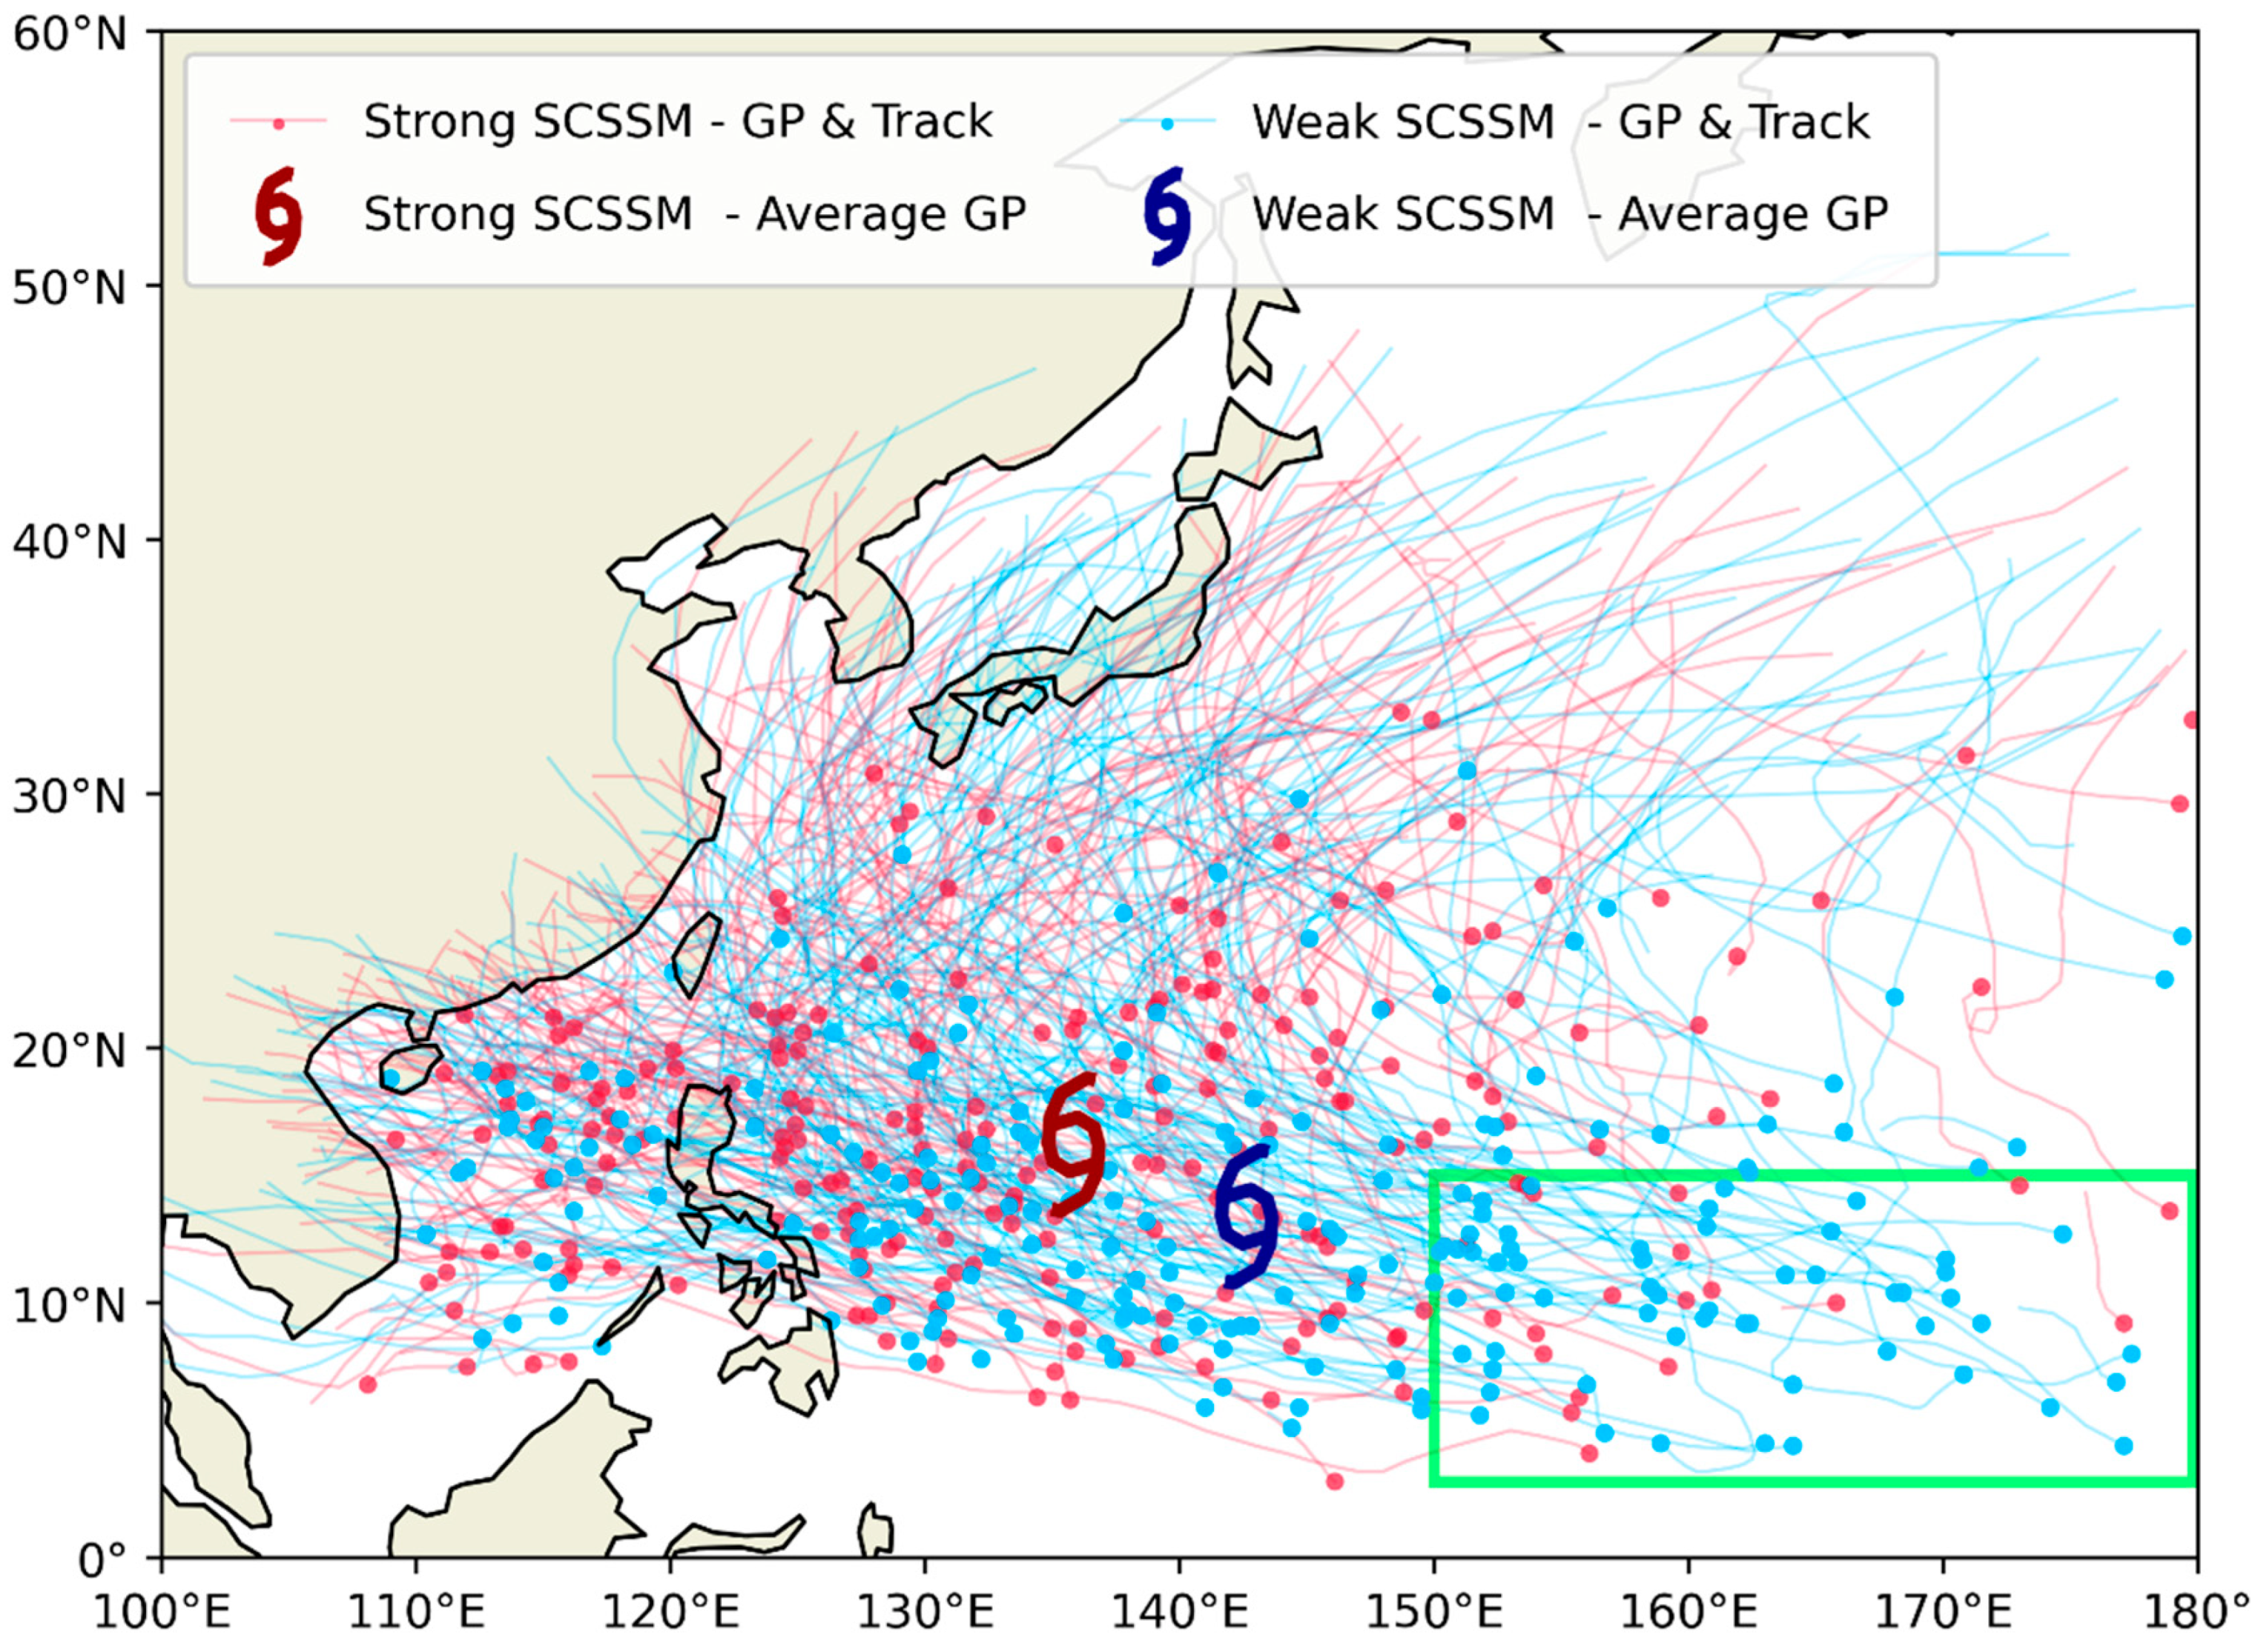
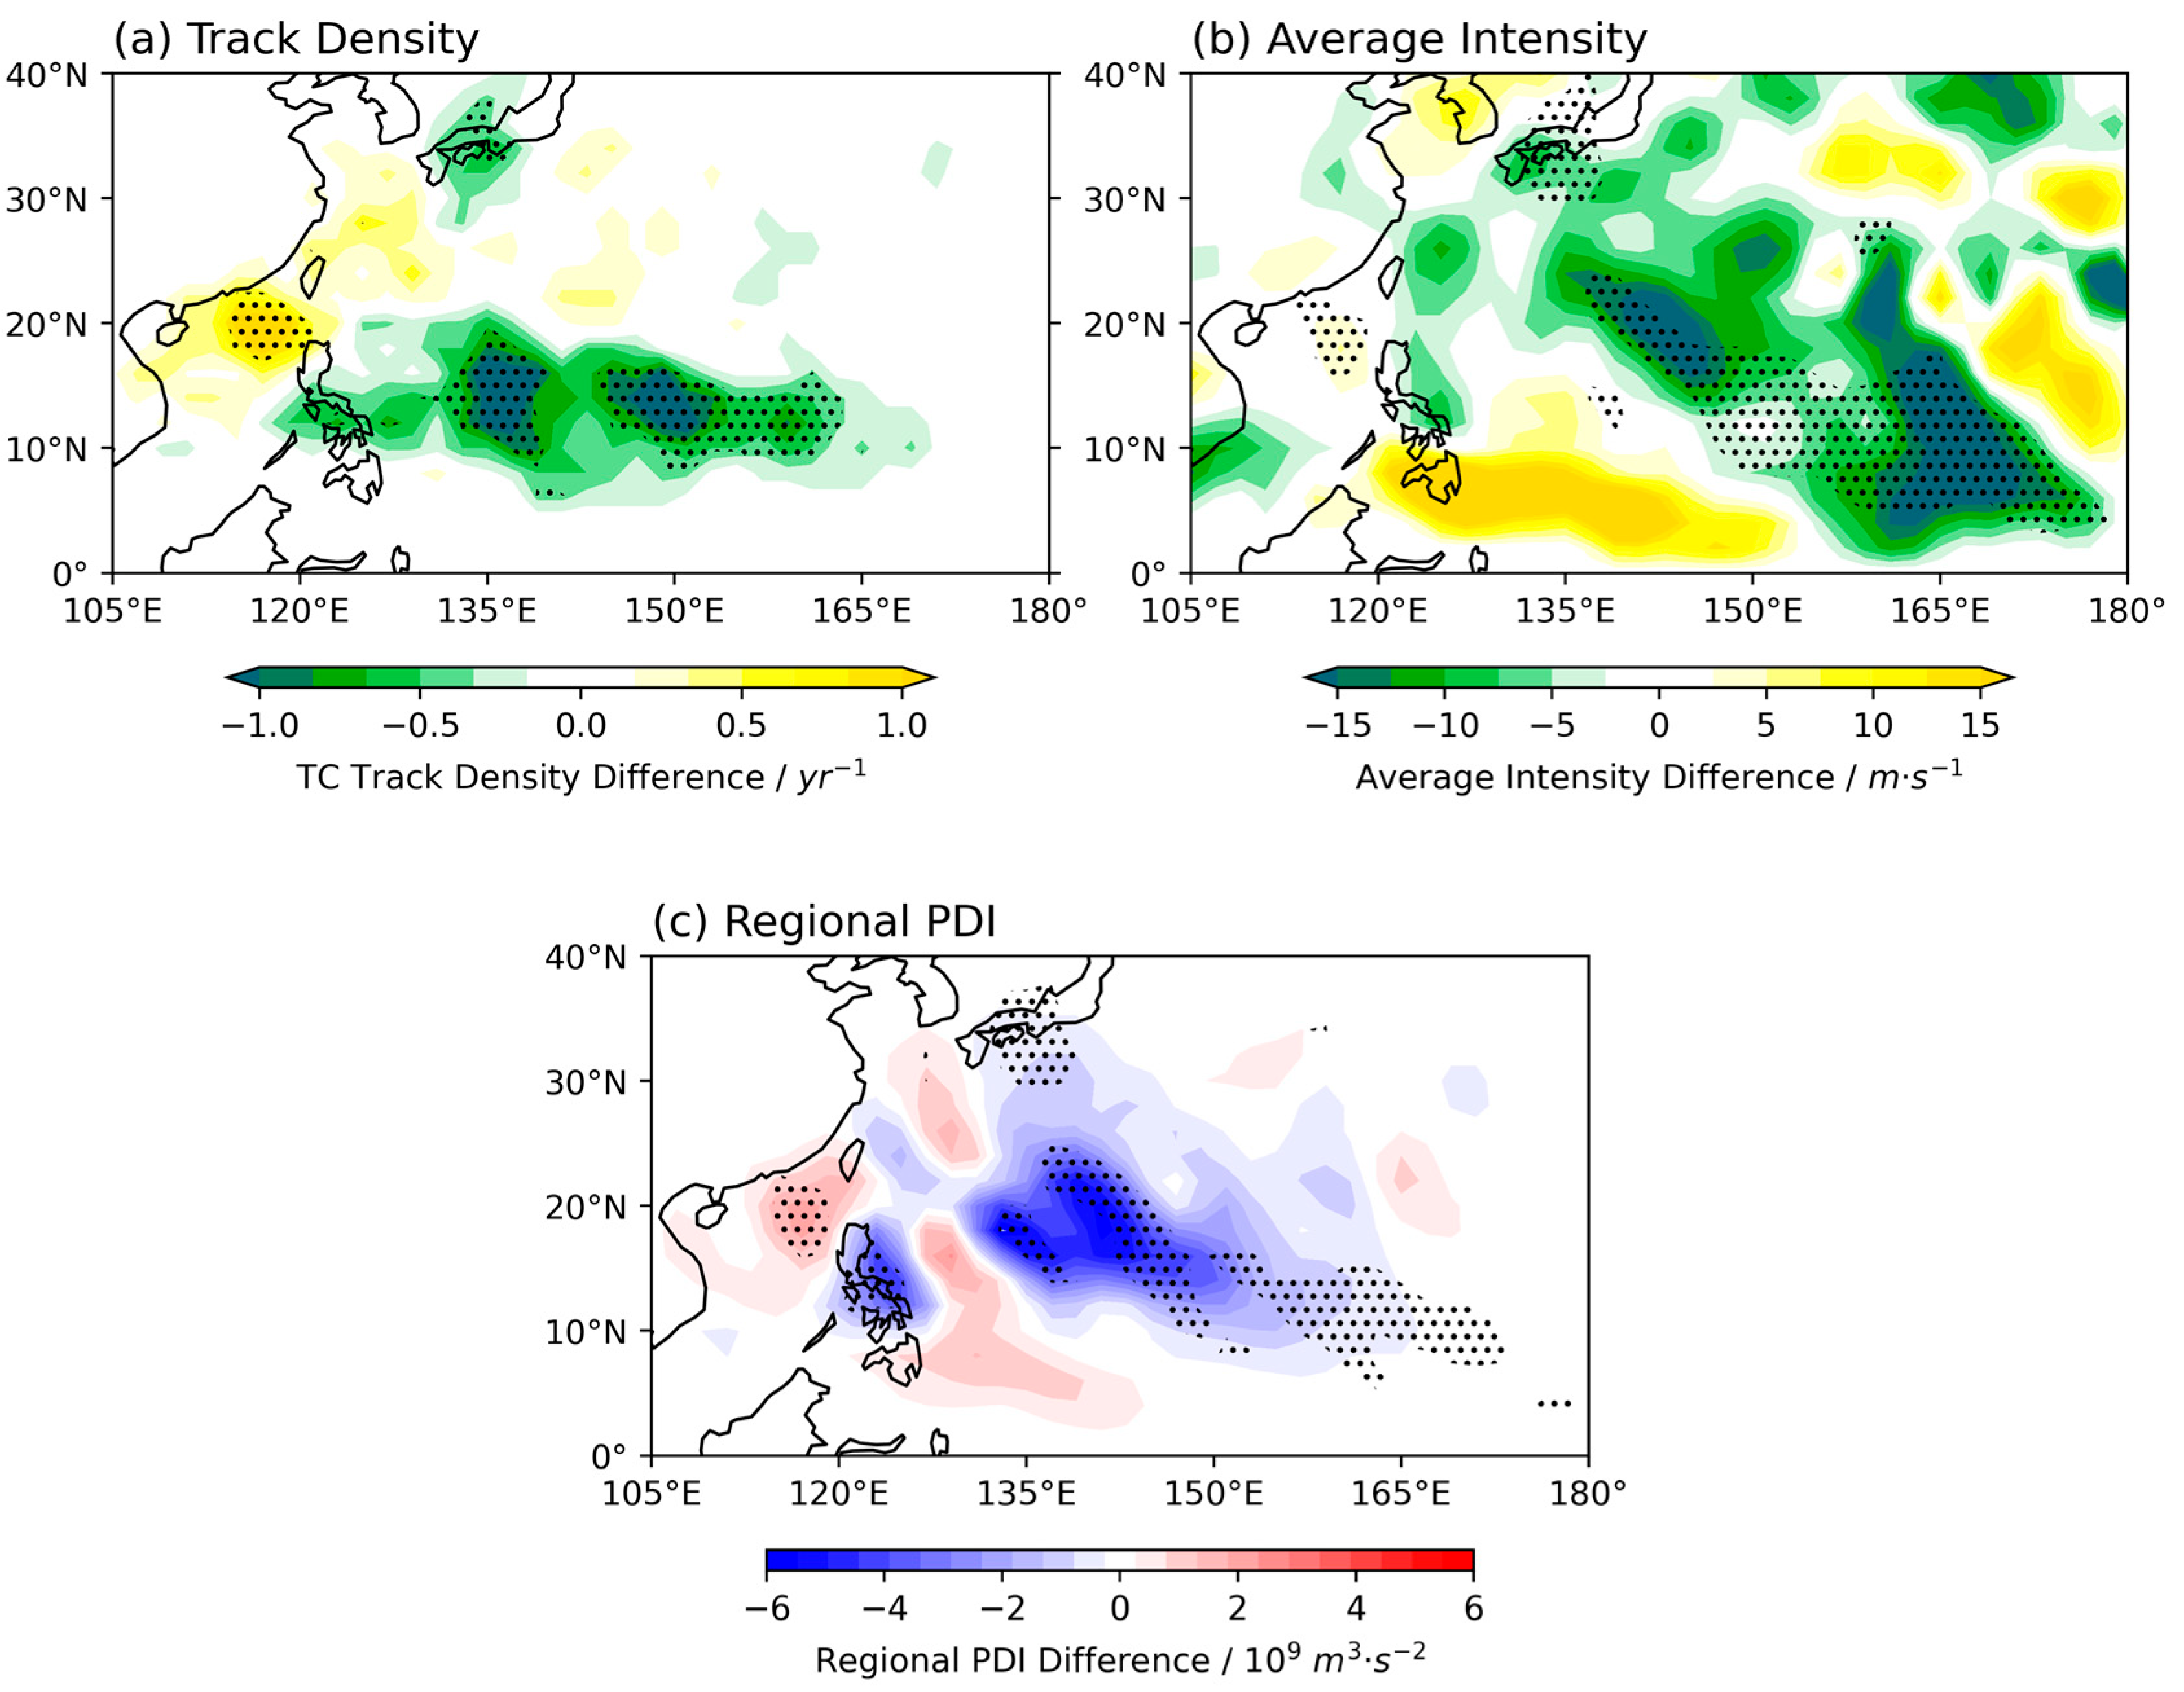
  • During strong years, TCs are more frequent and powerful along the coast of East Asia, especially in Southern China. In weak years, TCs tend to reach their lifetime maximum intensities in the Philippine Sea, but after moving to coastal areas, their intensities decay more rapidly, and the threat to the East Asian continent is not as significant as in strong years.
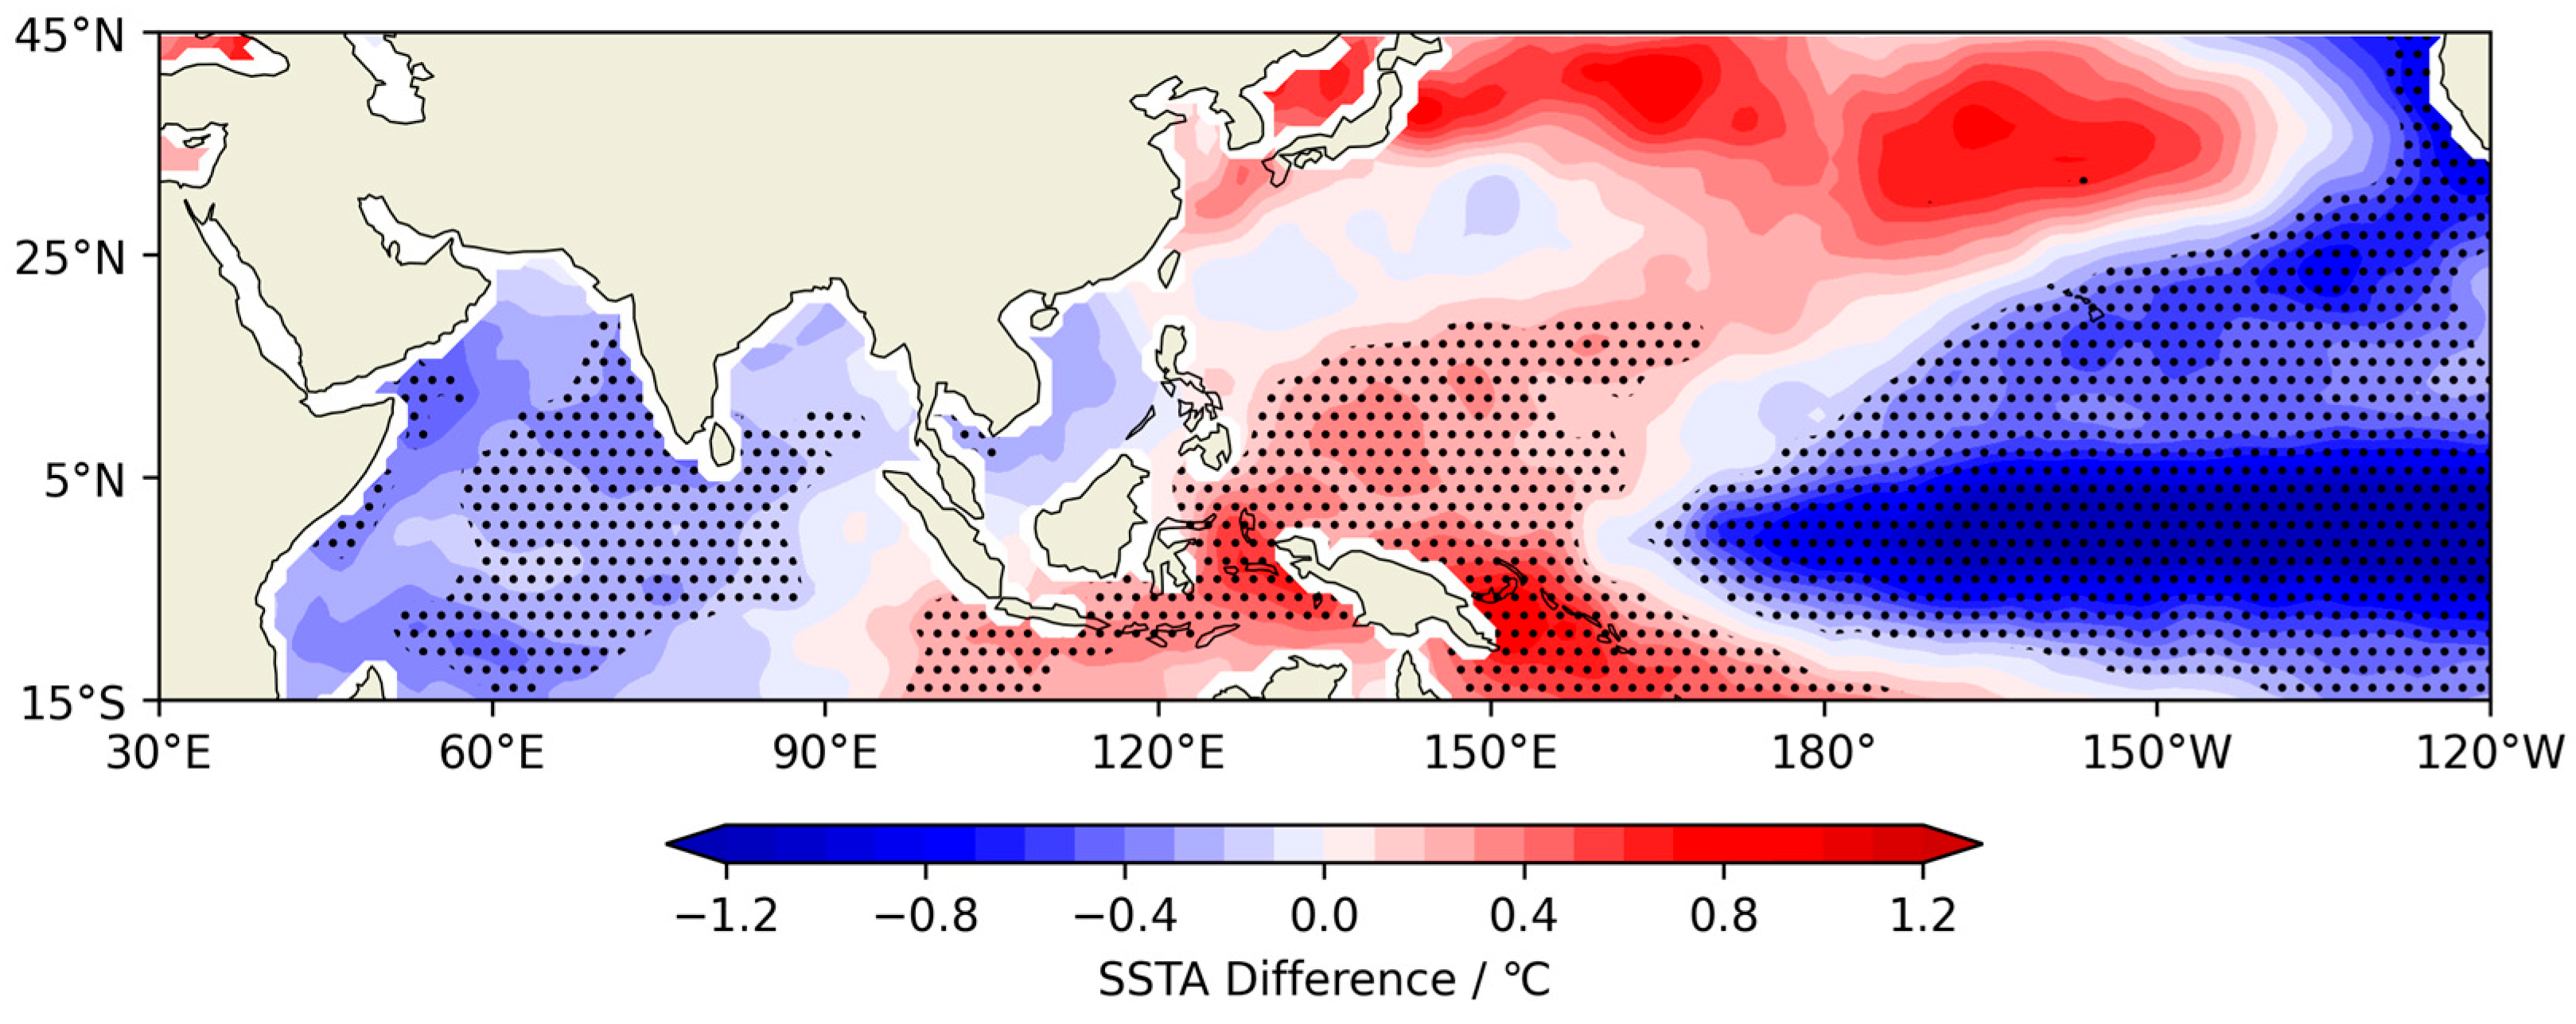
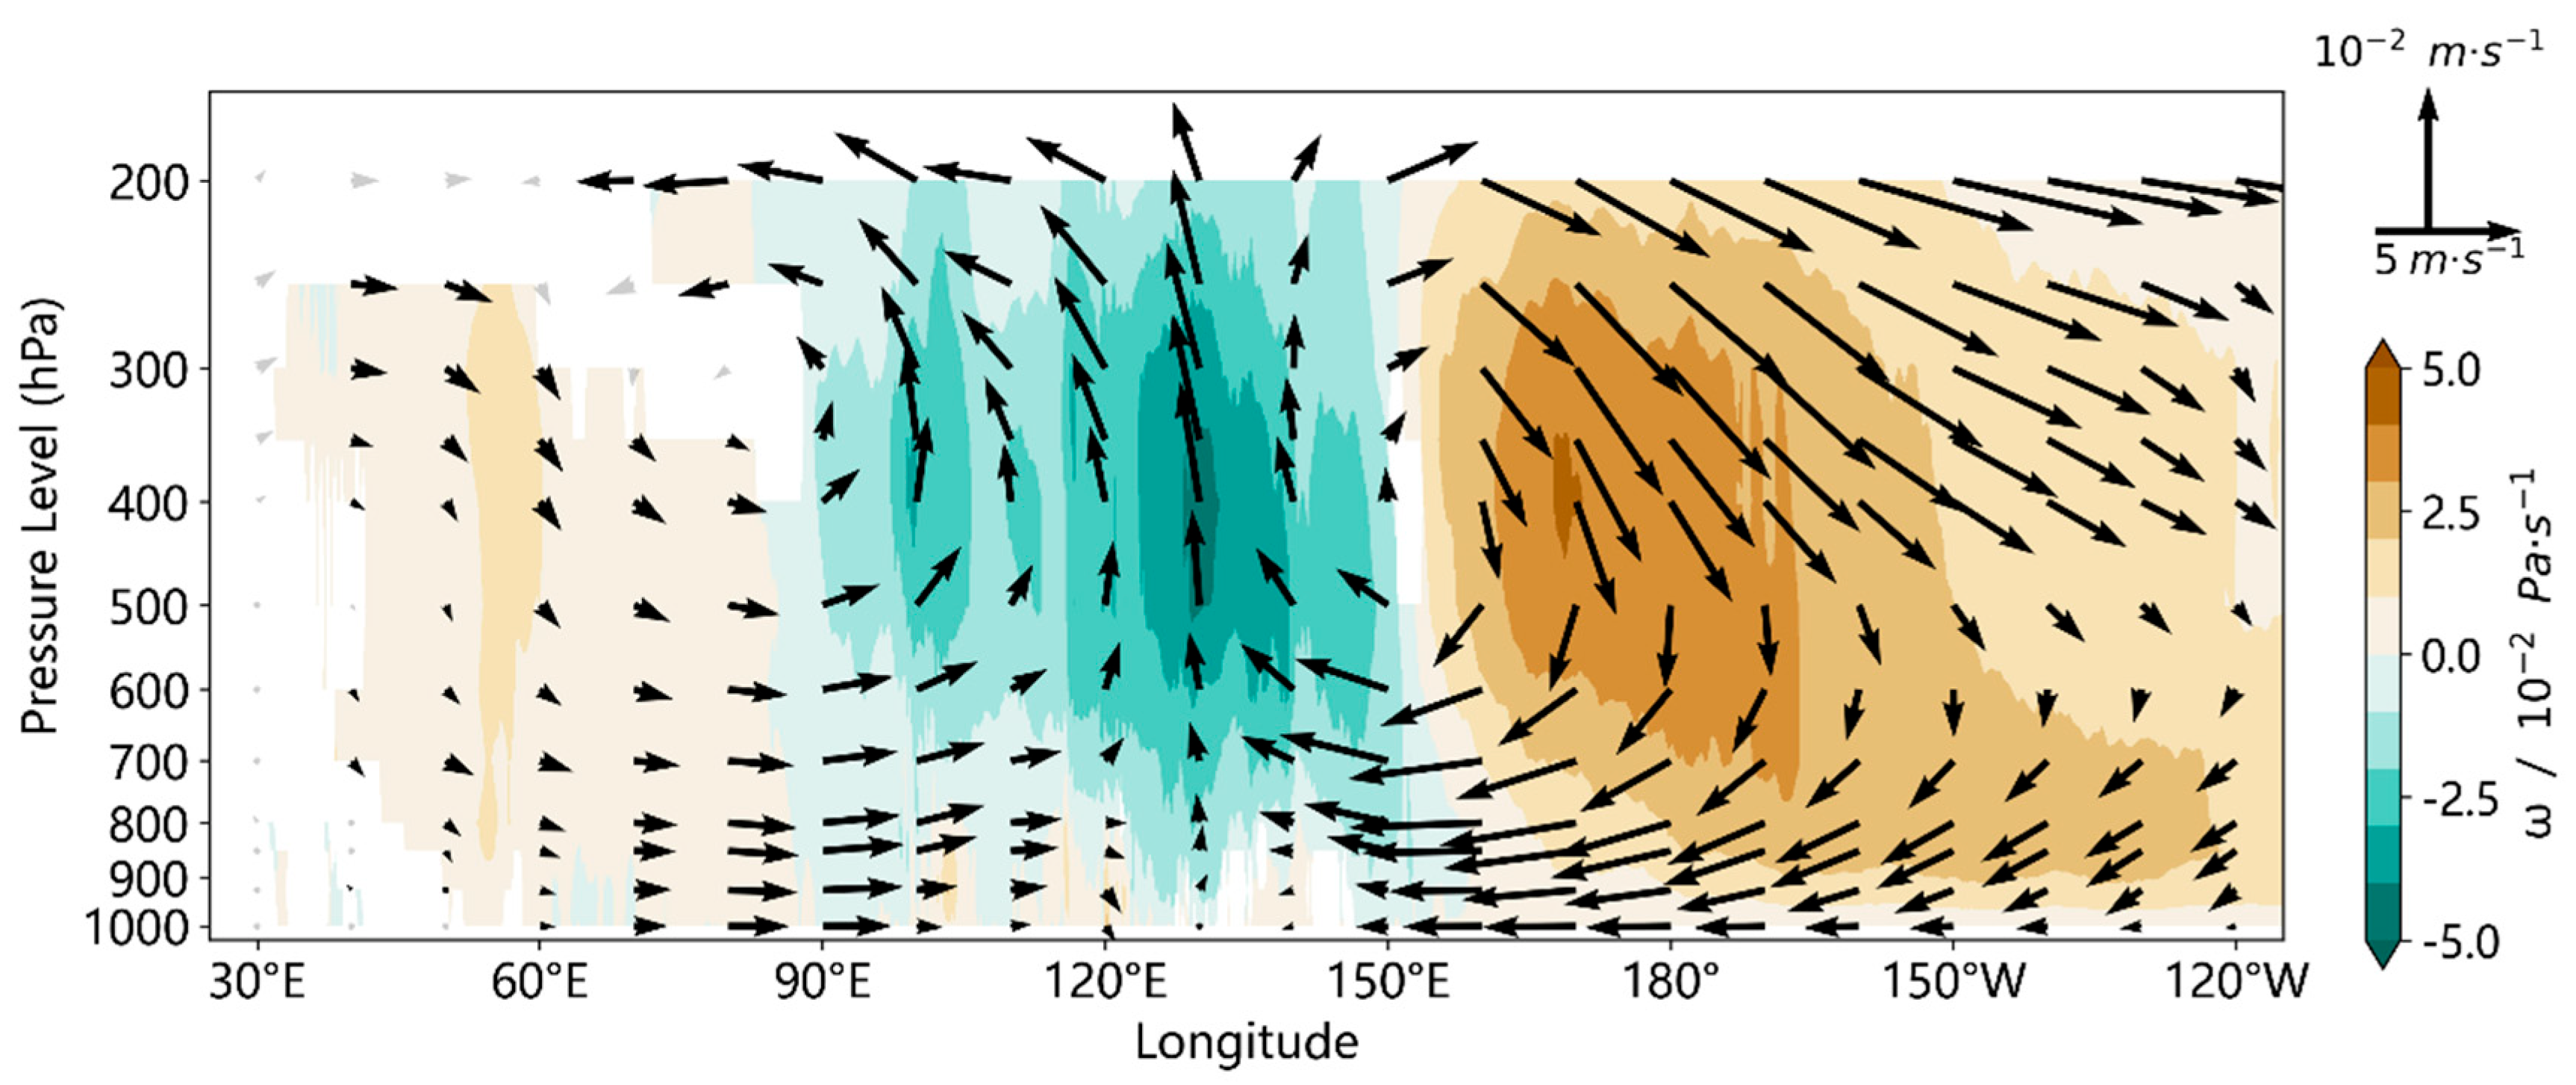
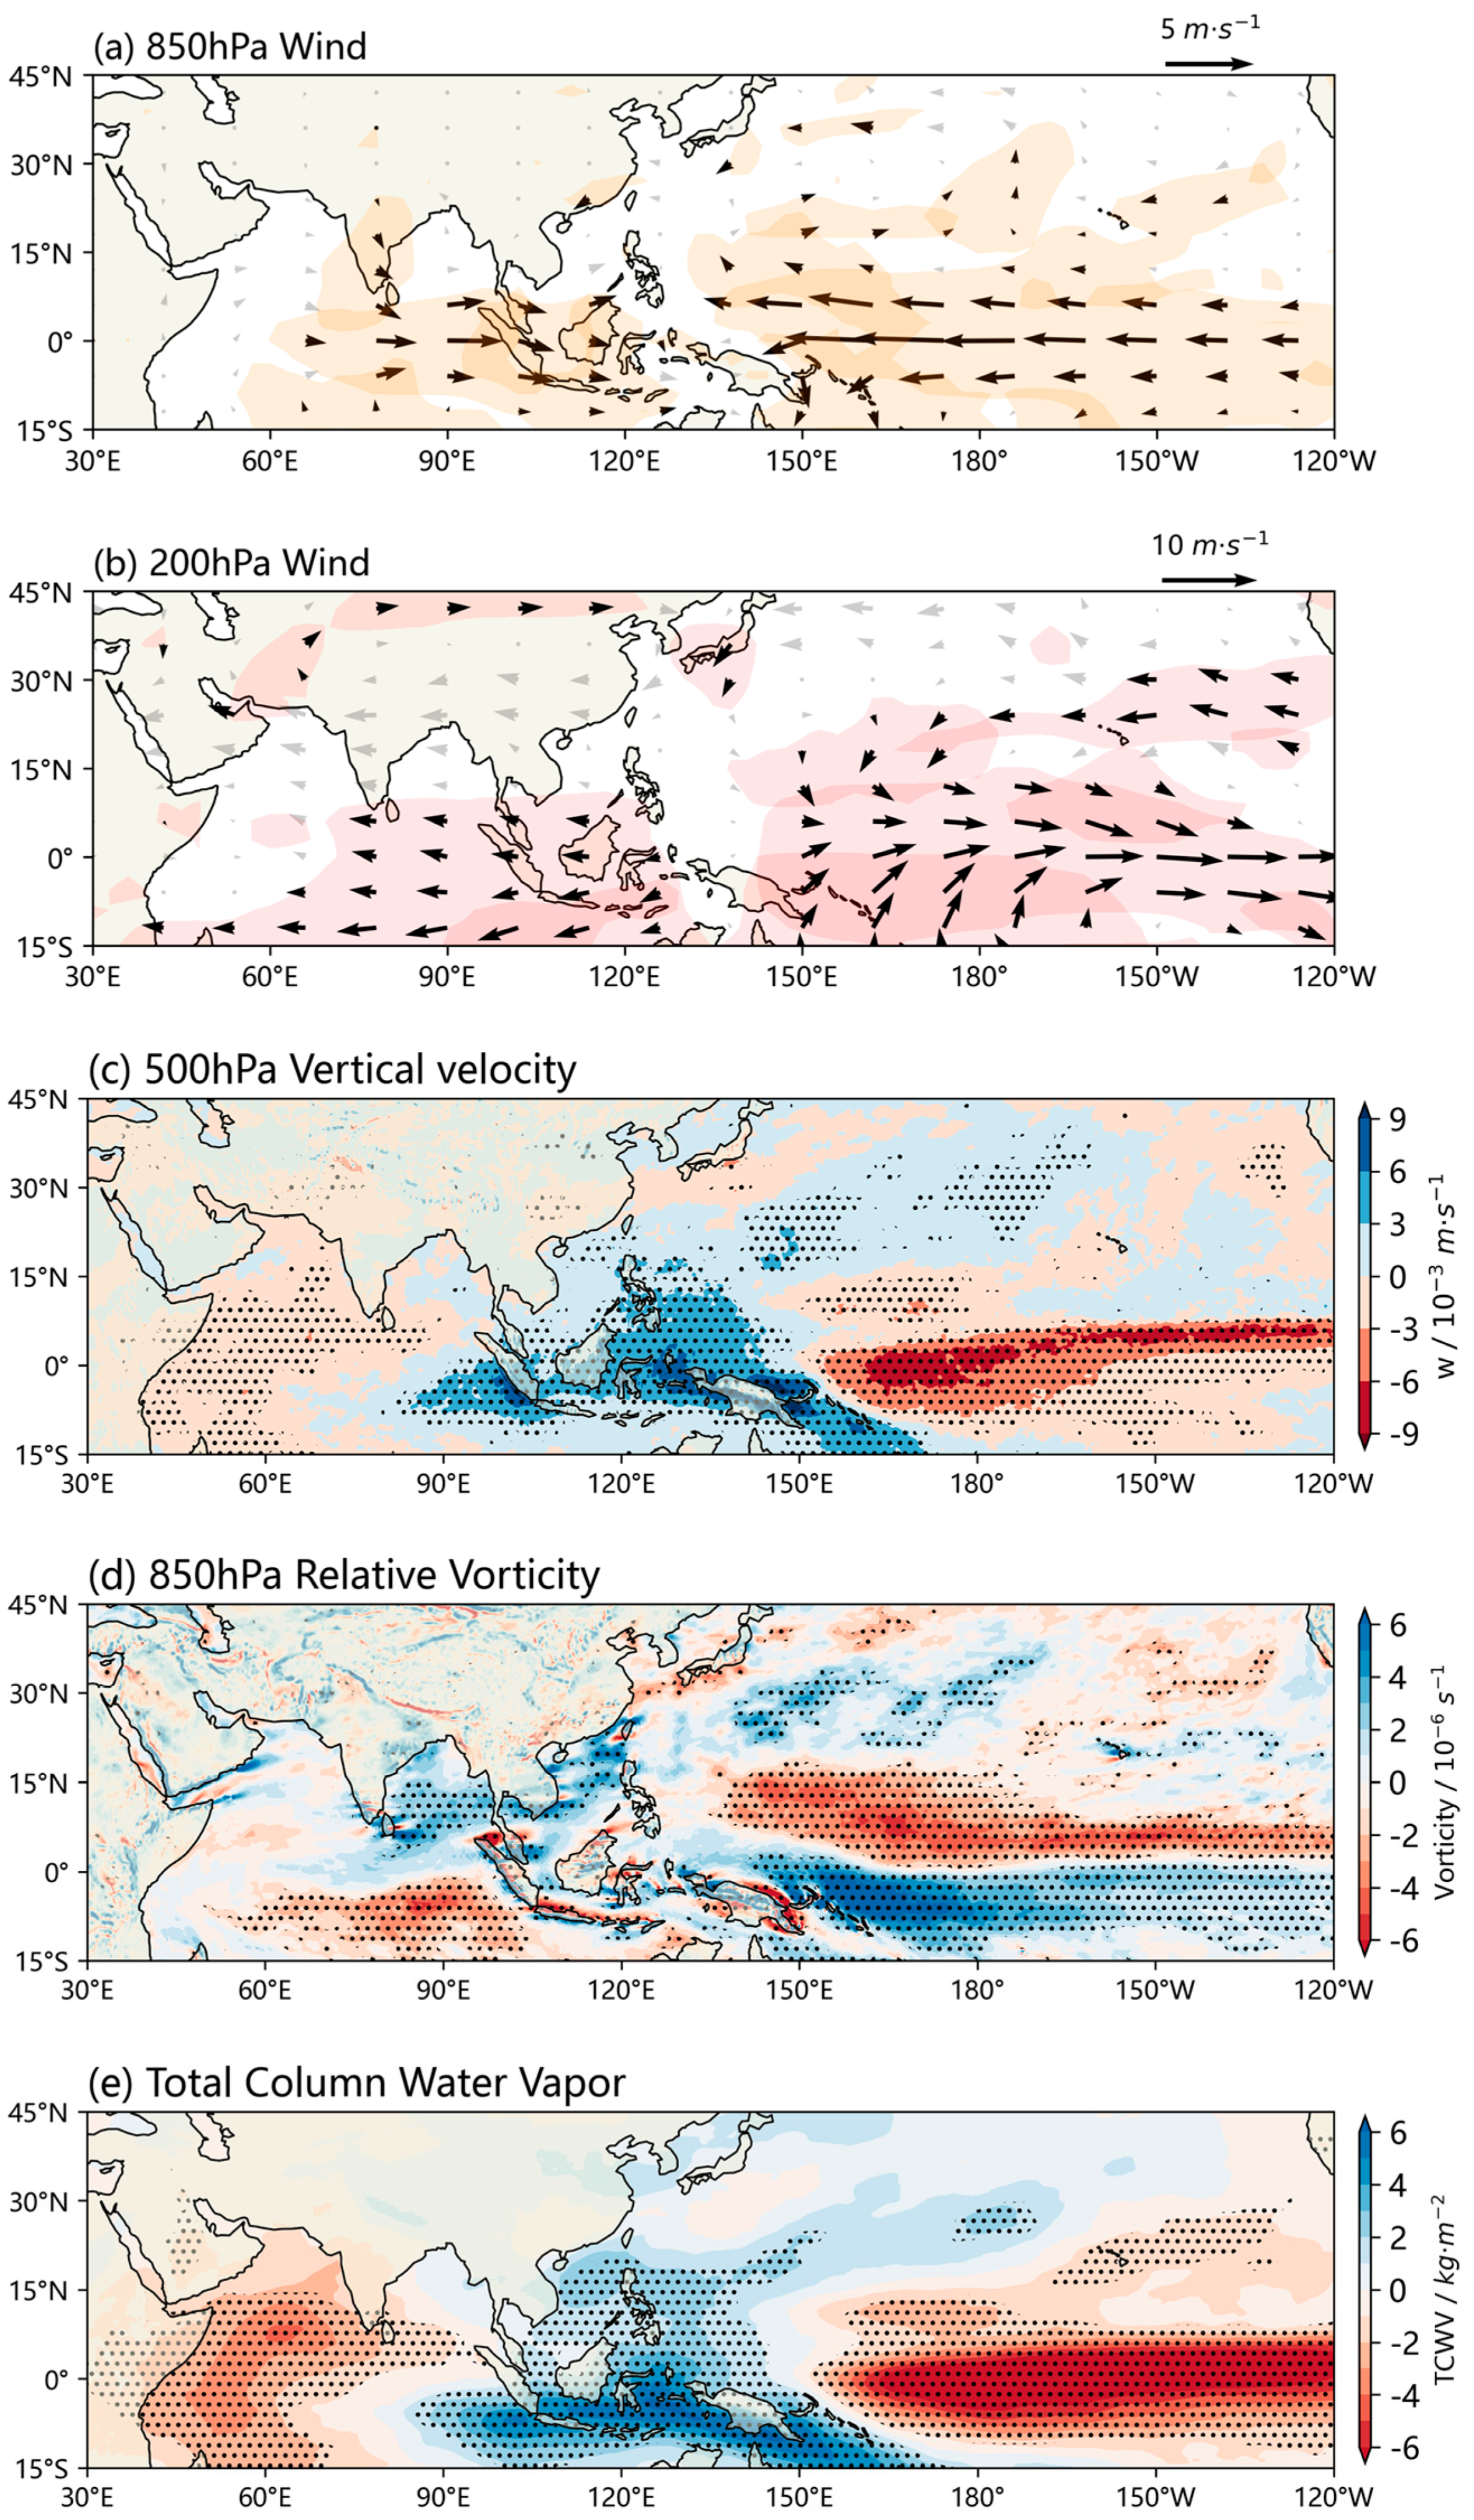
  • A coupled status exists between the SCSSM and the tropical Indo-Pacific Ocean. During anomalously strong (weak) SCSSM years, the tropical Pacific Ocean SSTA tends to correspond to a La Niña-like (El Niño-like) distribution, whereas the tropical Indian Ocean shows an IOD-negative (positive) phase distribution, indicating a coupled relationship between the SCSSM and the tropical Indo-Pacific Ocean. Moreover, the Walker circulations in both the Indian and Pacific Oceans are coupled during these anomalous years.
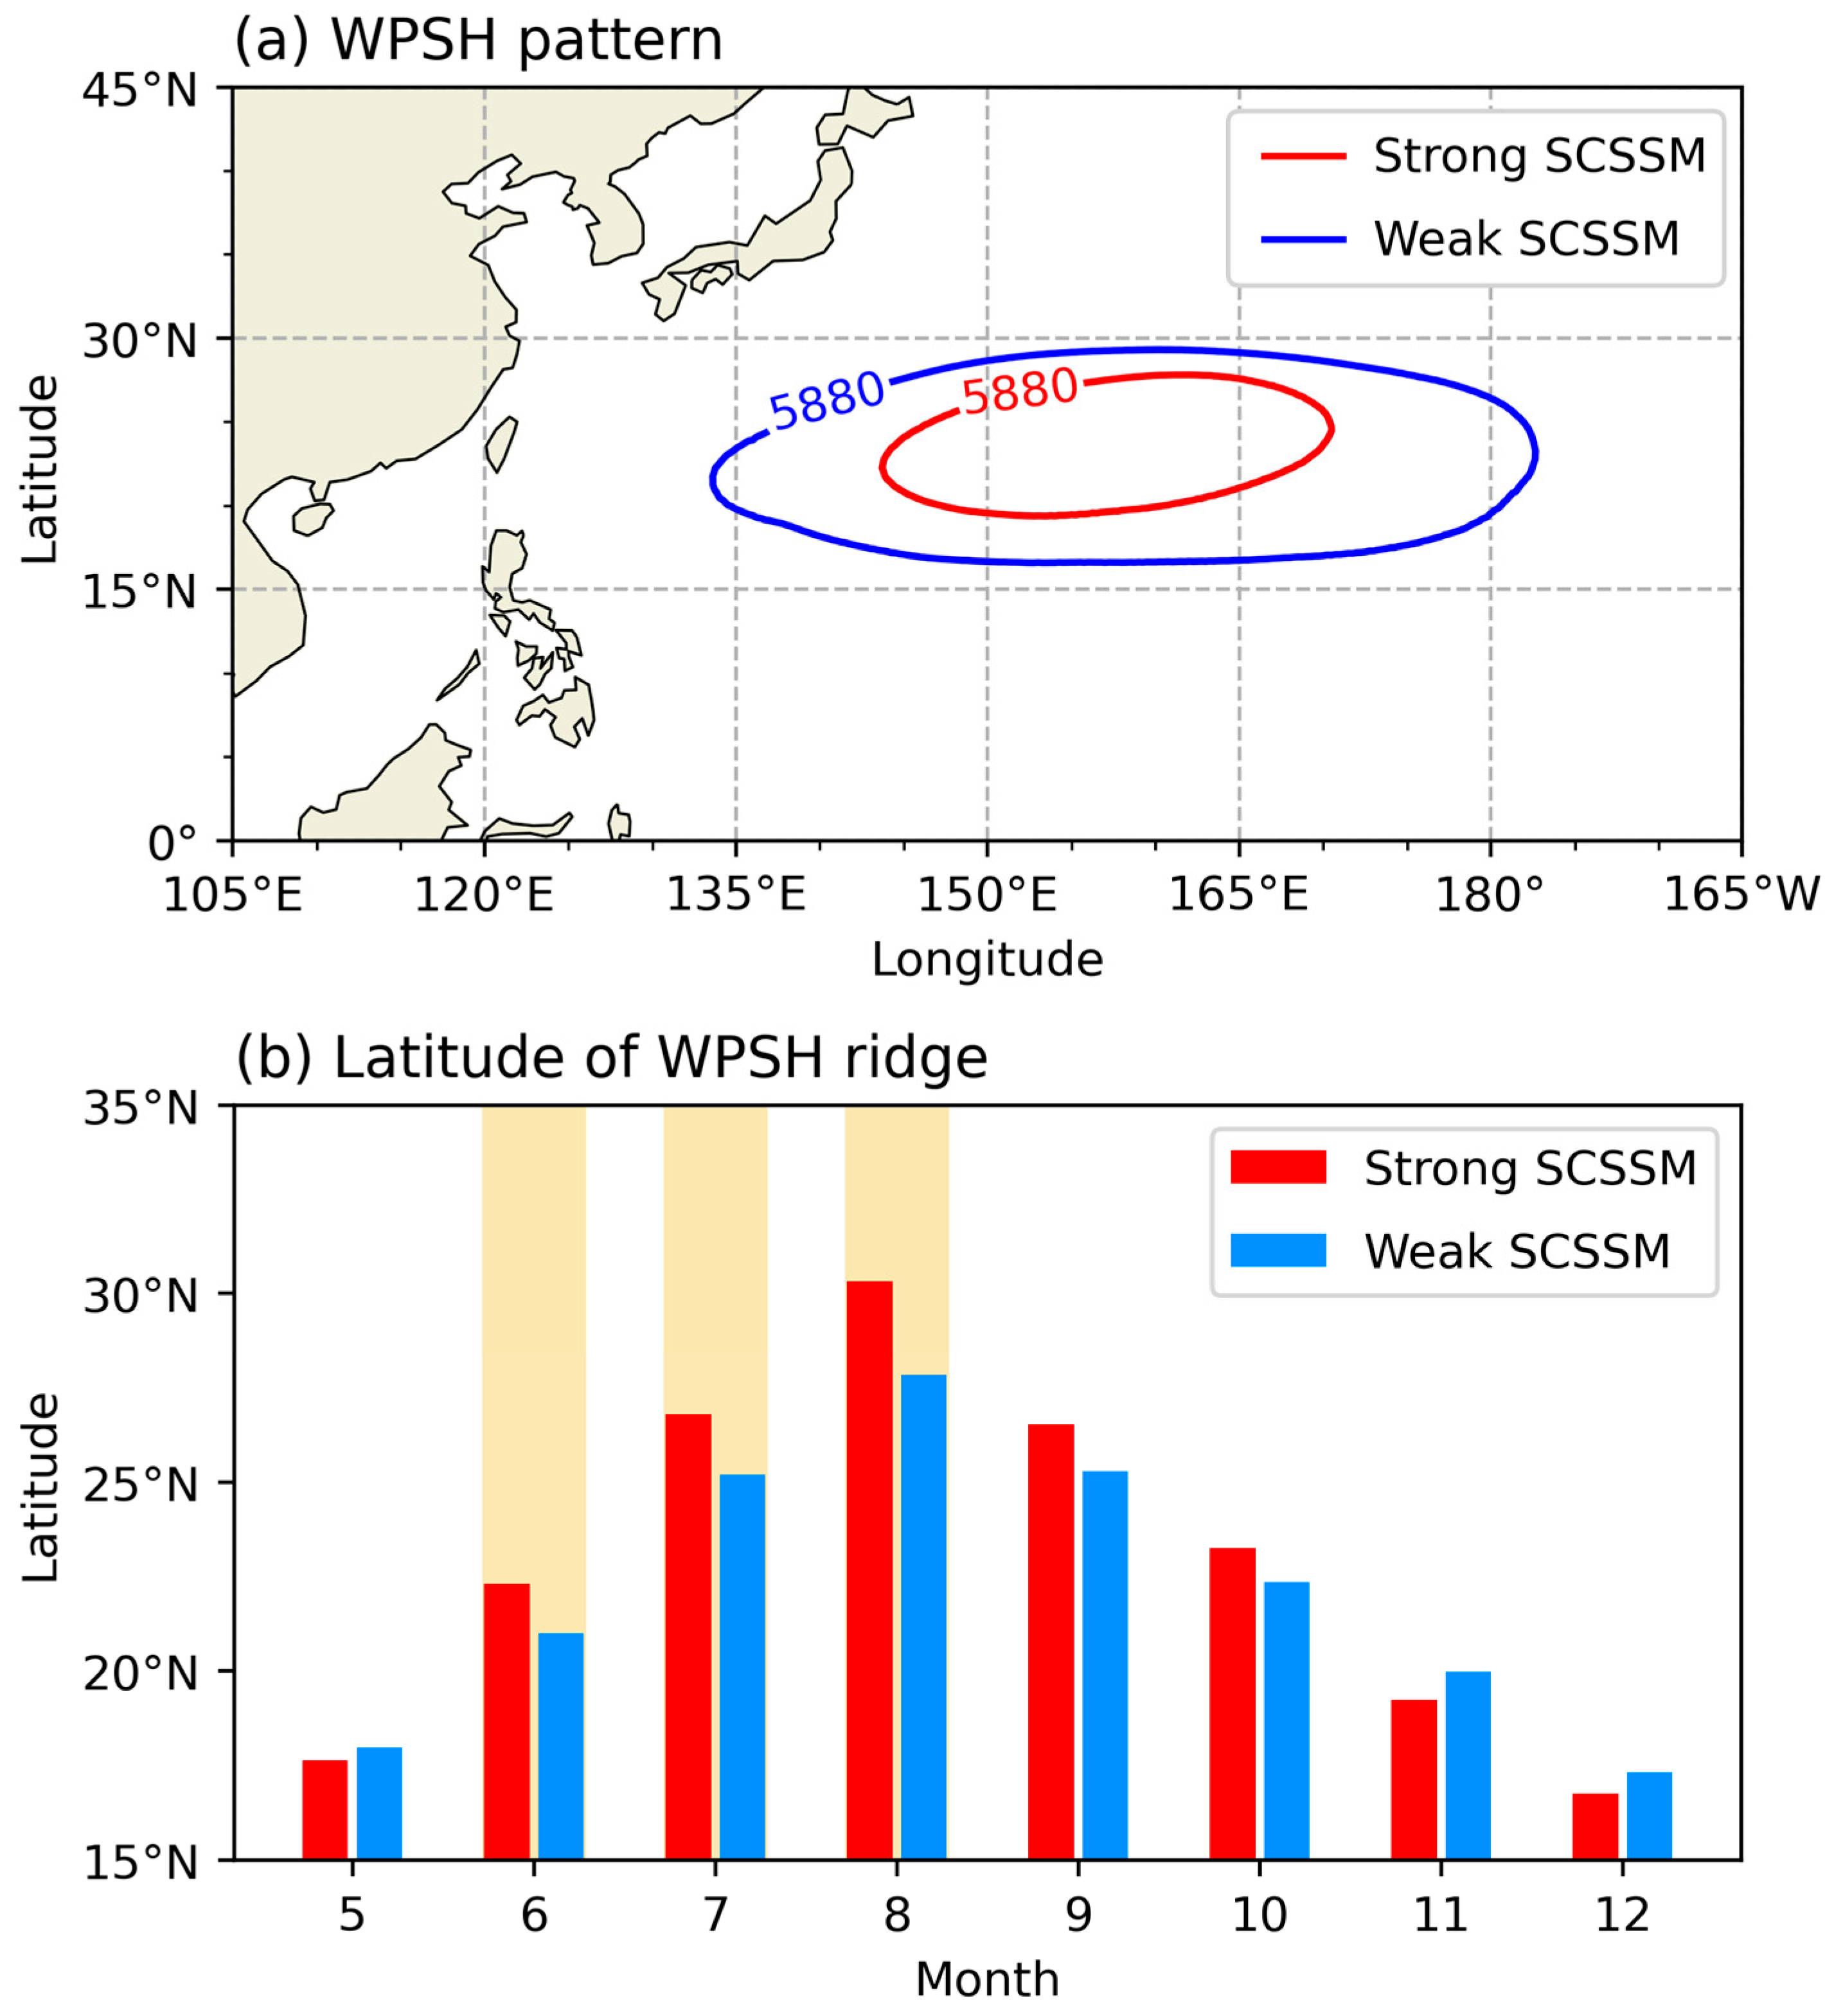
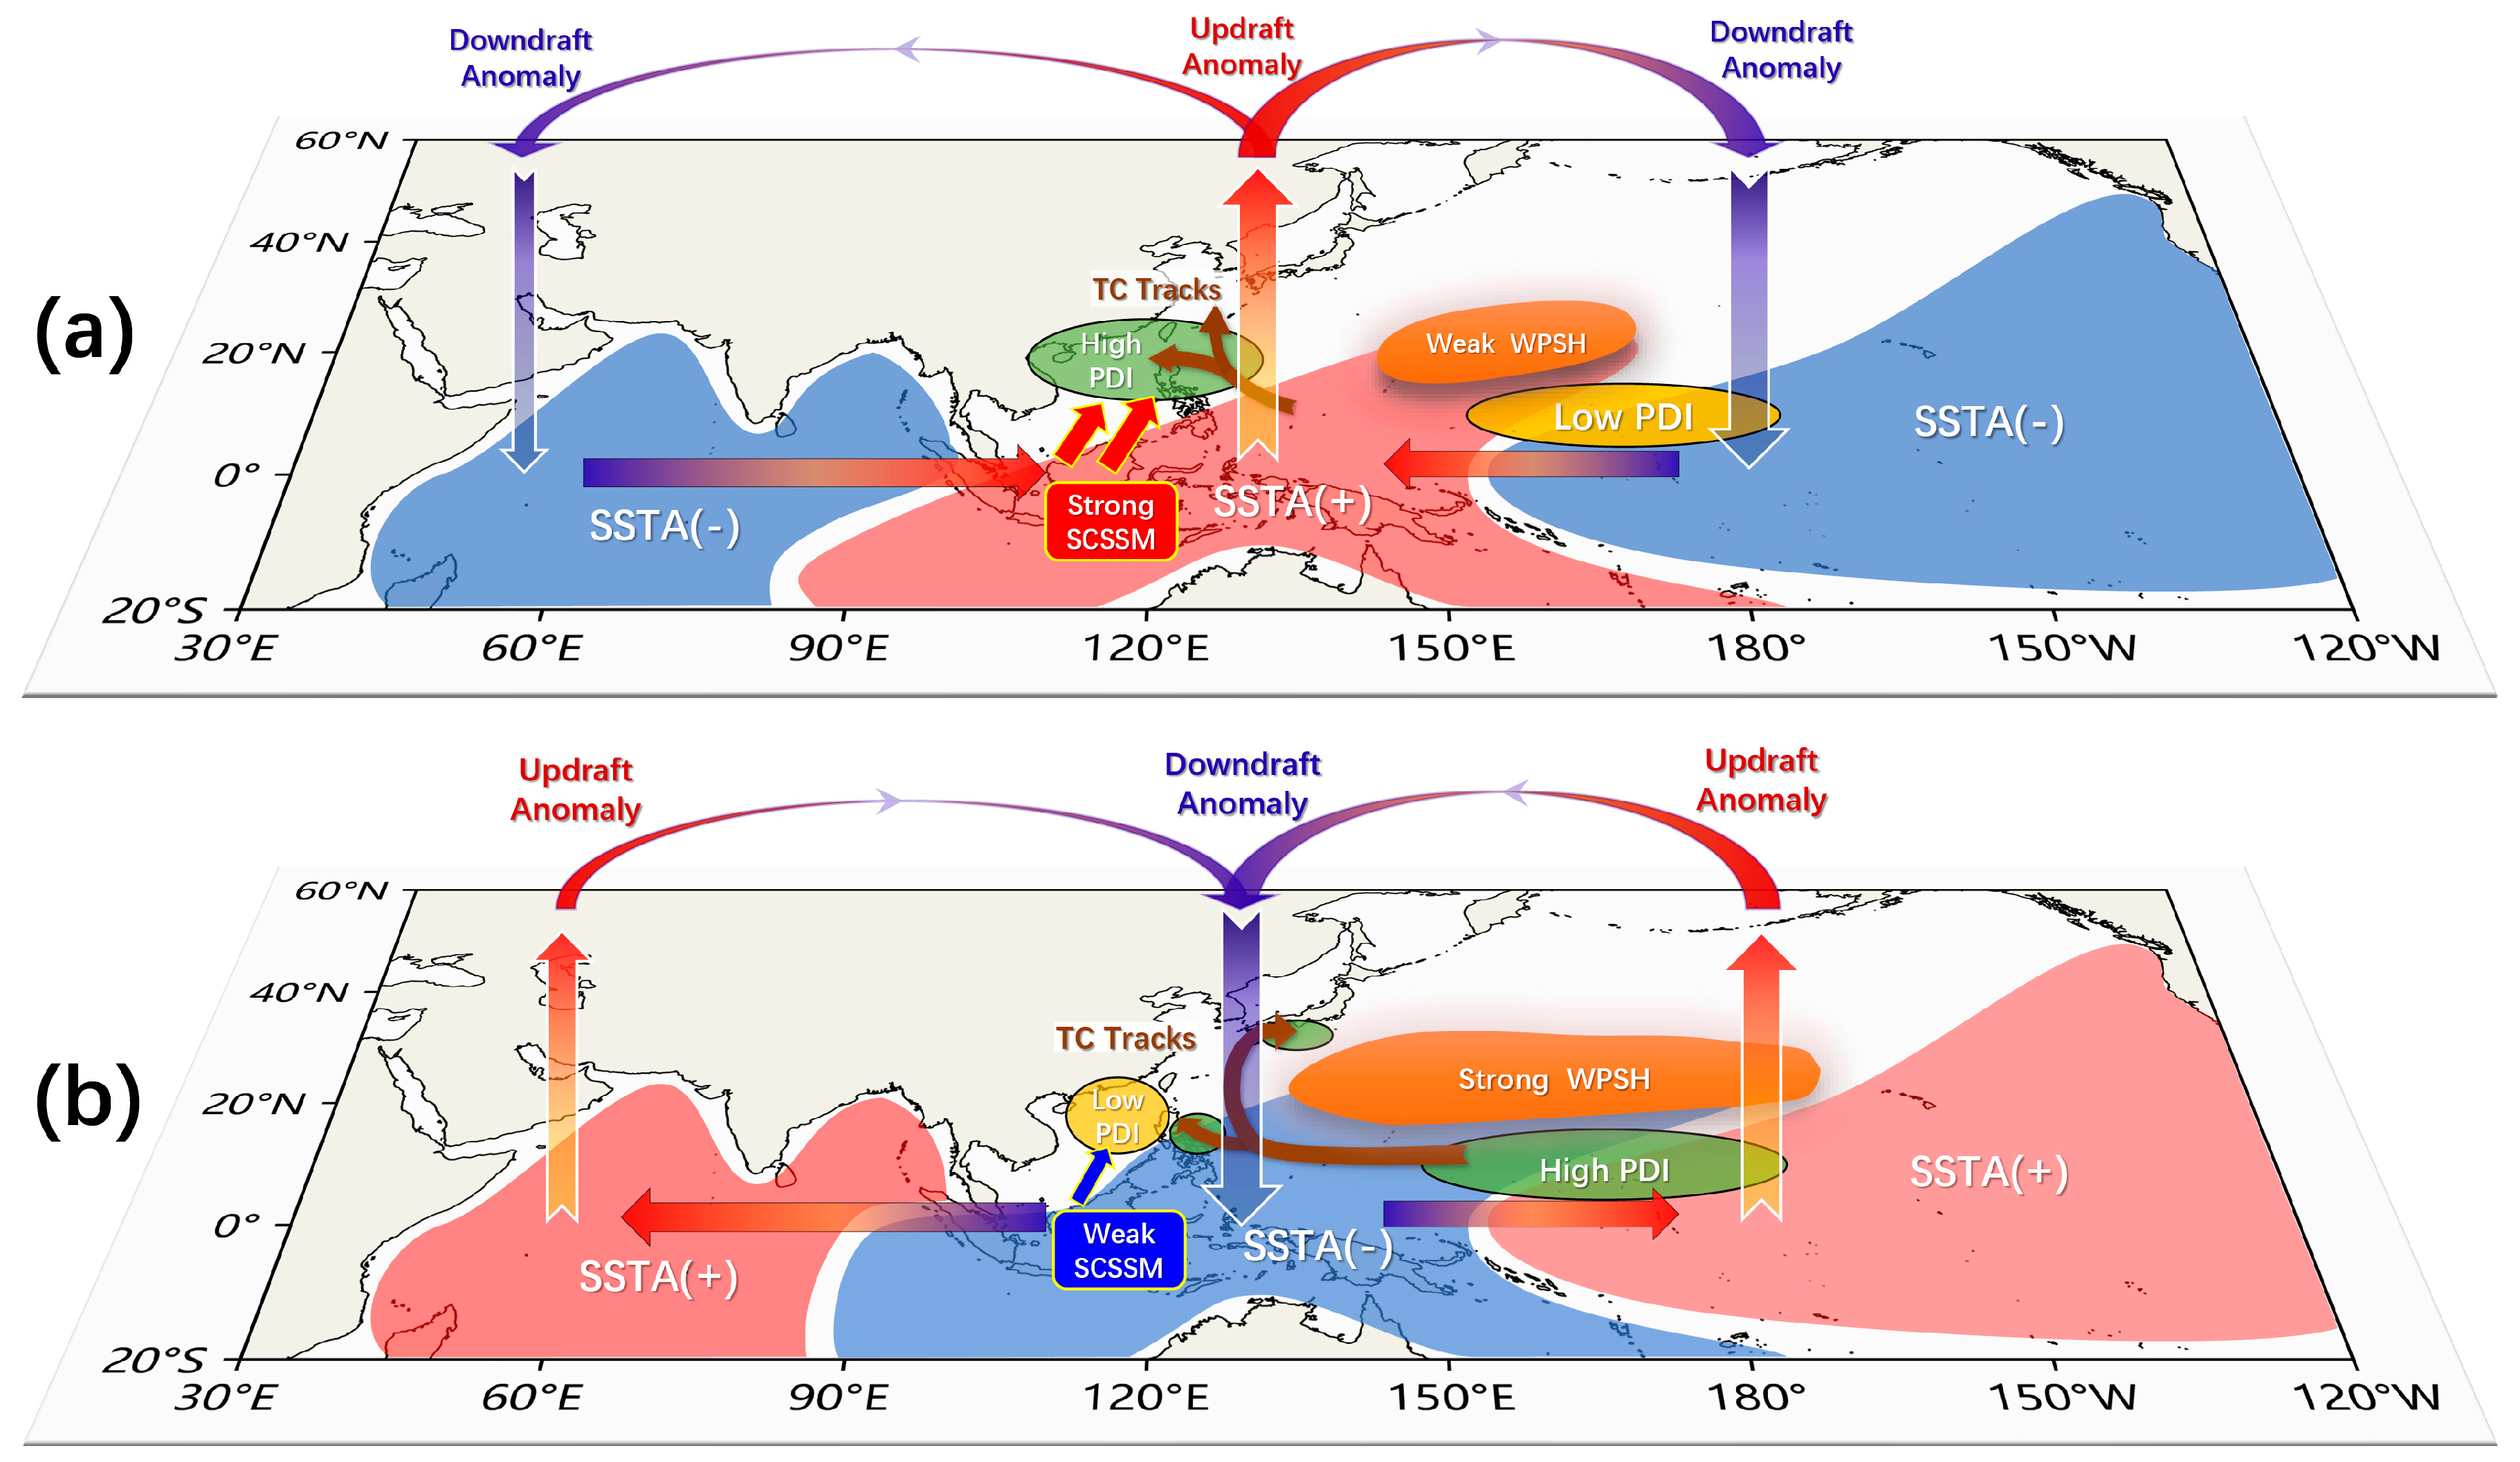
  • During weak SCSSM years (Figure 11b), the tropical anomalous wind field corresponding to the SSTA distribution leads to a latitudinal wind anomaly divergence zone over the Western Pacific Ocean. The Western Pacific Ocean is dominated by a strong subtropical high, and anomalous easterly winds in the eastern Indian Ocean weaken moisture transport and reduce convective activity over the SCS. These conditions are unfavorable for SCSTC genesis and activity. At the same time, the Pacific Ocean east of 150° E has a positive SSTA, and both dynamic and thermodynamic conditions are favorable for the generation and development of TCs, so a high PDI zone appears in this region.
  • During strong SCSSM years (Figure 11a), the enhanced summer monsoon drives the enhanced SCS monsoon trough, which directly improves the convective environment over here. The positive vorticity anomaly in this region is favorable to TCs activity with high PDI. In contrast, the eastern part of the warm-pool region is covered by cold water and has worse conditions for TCs genesis, thus presenting a low PDI.

5.2. Discussion

Although previous studies have investigated the impact of tropical oceans on WNPTC activity, there has been relatively little consideration of the role of the SCSSM. In this study, we have identified differences in WNPTC activity under different SCSSM intensity backgrounds, and have explained the relationship between the two through the coupled response of the Indo-Pacific SSTA pattern. This has improved our understanding of the influence of tropical ocean–atmosphere interactions, and emphasizes the crucial role of the SCSSM as an important signal amount. Although the Indo-Pacific system can explain the main co-variation between the SCSSM and WNPTC, the non-linearity of their connections makes it difficult to examine their direct relationship when controlling for Indo-Pacific SSTA effects. This is a limitation of our study, and we plan to validate the direct interaction between the two in a coupled ocean–atmosphere model in future research. With climate change causing uneven warming rates across ocean basins, it is possible that the relationship between SCSSM and TCs may also change [70]. Additionally, recent trends of TCs shifting towards land raise the question of whether the influence of the SCSSM on cyclones has increased [71]. These questions will be addressed in future research.

Author Contributions

Conceptualization, S.L.; methodology, S.L., J.X. and S.T.; formal analysis, S.L. and M.Z.; investigation, S.L.; writing—original draft, S.L.; writing—review & editing, S.L., J.X., S.T., M.Z. and Z.C.; visualization, S.L.; supervision, J.X. and S.T.; project administration, J.X. and Z.C. All authors have read and agreed to the published version of the manuscript.

Funding

This work is jointly supported by the National Key R&D Program of China (Grant No. 2019YFC1510002), the Major Program of the National Natural Science Foundation of China (Grant No. 72293604), and the Key Program of the National Natural Science Foundation of China (Grant No. 42130605).

Institutional Review Board Statement

Not applicable.

Informed Consent Statement

Not applicable.

Data Availability Statement

Data used in this study can be downloaded from the websites below: ERA5 reanalysis data: https://cds.climate.copernicus.eu/cdsapp#!/dataset/reanalysis-era5-pressure-levels-monthly-means (accessed on 15 March 2022); HadISST1: https://www.metoffice.gov.uk/hadobs/hadisst/data/download.html (accessed on 21 March 2022); Outgoing Longwave Radiation (OLR) Climate Data Record: https://www.ncei.noaa.gov/products/climate-data-records/outgoing-longwave-radiation-monthly (accessed on 25 March 2022); Best Track Archive for Climate Stewardship (IBTrACS): https://www.ncei.noaa.gov/products/international-best-track-archive?name=ib-v4-access (accessed on 7 March 2022).

Conflicts of Interest

The authors declare no conflict of interest.

References

  1. Kajikawa, Y.; Yasunari, T.; Wang, B. Decadal Change in Intraseasonal Variability over the South China Sea. Geophys. Res. Lett. 2009, 36, L06810. [Google Scholar] [CrossRef] [Green Version]
  2. Kajikawa, Y.; Wang, B. Interdecadal Change of the South China Sea Summer Monsoon Onset. J. Clim. 2012, 25, 3207–3218. [Google Scholar] [CrossRef]
  3. Zhong, Z.; Hu, Y. Impacts of Tropical Cyclones on the Regional Climate: An East Asian Summer Monsoon Case. Atmos. Sci. Lett. 2007, 8, 93–99. [Google Scholar] [CrossRef]
  4. Chan, J.C.L. Interannual and Interdecadal Variations of Tropical Cyclone Activity over the Western North Pacific. Meteorol. Atmos. Phys. 2005, 89, 143–152. [Google Scholar] [CrossRef]
  5. Matsuura, T.; Yumoto, M.; Iizuka, S. A Mechanism of Interdecadal Variability of Tropical Cyclone Activity over the Western North Pacific. Clim. Dyn. 2003, 21, 105–117. [Google Scholar] [CrossRef]
  6. Goh, A.Z.-C.; Chan, J.C.L. Interannual and Interdecadal Variations of Tropical Cyclone Activity in the South China Sea. Int. J. Climatol. 2010, 30, 827–843. [Google Scholar] [CrossRef]
  7. Molinari, J.; Vollaro, D. What Percentage of Western North Pacific Tropical Cyclones Form within the Monsoon Trough? Mon. Weather Rev. 2013, 141, 499–505. [Google Scholar] [CrossRef]
  8. Yoshida, R.; Ishikawa, H. Environmental Factors Contributing to Tropical Cyclone Genesis over the Western North Pacific. Mon. Weather Rev. 2013, 141, 451–467. [Google Scholar] [CrossRef]
  9. Choi, K.-S.; Cha, Y.; Kim, H.-D.; Kang, S.-D. Possible relationship between East Asian summer monsoon and western North Pacific tropical cyclone genesis frequency. Theor. Appl. Climatol. 2016, 124, 81–90. [Google Scholar] [CrossRef]
  10. Qian, H.; Yuping, G. Does the Asian Monsoon Modulate Tropical Cyclone Activity over the South China Sea? Chin. J. Oceanol. Limnol. 2012, 30, 960–965. [Google Scholar] [CrossRef]
  11. Chen, X.; Zhong, Z.; Hu, Y.; Zhong, S.; Lu, W.; Jiang, J. Role of Tropical Cyclones over the Western North Pacific in the East Asian Summer Monsoon System. Earth Planet. Phys. 2019, 3, 147–156. [Google Scholar] [CrossRef]
  12. Choi, J.-W.; Kim, B.-J.; Zhang, R.; Park, K.-J.; Kim, J.-Y.; Cha, Y.; Nam, J.-C. Possible Relation of the Western North Pacific Monsoon to the Tropical Cyclone Activity over Western North Pacific. Int. J. Climatol. 2016, 36, 3334–3345. [Google Scholar] [CrossRef] [Green Version]
  13. Weng, J.; Wang, L.; Luo, J.; Chen, B.; Peng, X.; Gan, Q. A Contrast of the Monsoon–Tropical Cyclone Relationship between the Western and Eastern North Pacific. Atmosphere 2022, 13, 1465. [Google Scholar] [CrossRef]
  14. Choi, J.-W.; Kim, H.-D. Relationship of the Southeast Asian Summer Monsoon and Mascarene High to the Tropical Cyclone Activity in the Western North Pacific. Int. J. Climatol. 2020, 40, 4067–4081. [Google Scholar] [CrossRef]
  15. Chen, T.-C.; Tsay, J.-D.; Matsumoto, J.; Alpert, J. Impact of the Summer Monsoon Westerlies on the South China Sea Tropical Cyclone Genesis in May. Weather Forecast 2017, 32, 23. [Google Scholar] [CrossRef]
  16. Gao, J.; Li, T. Factors Controlling Multiple Tropical Cyclone Events in the Western North Pacific. Mon. Weather Rev. 2011, 139, 885–894. [Google Scholar] [CrossRef] [Green Version]
  17. Chen, G.; Huang, R. Influence of Monsoon over the Warm Pool on Interannual Variation on Tropical Cyclone Activity over the Western North Pacific. Adv. Atmos. Sci. 2008, 25, 319–328. [Google Scholar] [CrossRef]
  18. Wu, L.; Wen, Z.; Huang, R.; Wu, R. Possible Linkage between the Monsoon Trough Variability and the Tropical Cyclone Activity over the Western North Pacific. Mon. Weather Rev. 2012, 140, 140–150. [Google Scholar] [CrossRef]
  19. Qi, L. Decadal Shift of the Interannual Relationship between Western North Pacific Tropical Cyclone Genesis Frequency and South China Sea Monsoon Trough around 1980s. Int. J. Climatol. 2022, 42, 4289–4299. [Google Scholar] [CrossRef]
  20. Huangfu, J.; Huang, R.; Chen, W.; Feng, T.; Wu, L. Interdecadal Variation of Tropical Cyclone Genesis and Its Relationship to the Monsoon Trough over the Western North Pacific. Int. J. Climatol. 2017, 37, 3587–3596. [Google Scholar] [CrossRef]
  21. Huangfu, J.; Huang, R.; Chen, W. Relationship between the South China Sea Summer Monsoon Onset and Tropical Cyclone Genesis over the Western North Pacific. Int. J. Climatol. 2017, 37, 5206–5210. [Google Scholar] [CrossRef]
  22. Hu, P.; Huangfu, J.; Chen, W.; Huang, R. Impacts of Early/Late South China Sea Summer Monsoon Withdrawal on Tropical Cyclone Genesis over the Western North Pacific. Clim. Dyn. 2020, 55, 1507–1520. [Google Scholar] [CrossRef]
  23. Wang, G.; Su, J.; Ding, Y.; Chen, D. Tropical Cyclone Genesis over the South China Sea. J. Mar. Syst. 2007, 68, 318–326. [Google Scholar] [CrossRef]
  24. Wang, L.; Chen, G. Relationship between South China Sea Summer Monsoon Onset and Landfalling Tropical Cyclone Frequency in China. Int. J. Climatol. 2018, 38, 3209–3214. [Google Scholar] [CrossRef]
  25. Hersbach, H.; Bell, B.; Berrisford, P.; Hirahara, S.; Horányi, A.; Muñoz-Sabater, J.; Nicolas, J.; Peubey, C.; Radu, R.; Schepers, D.; et al. The ERA5 Global Reanalysis. Q. J. R. Meteorol. Soc. 2020, 146, 1999–2049. [Google Scholar] [CrossRef]
  26. Rayner, N.A. Global Analyses of Sea Surface Temperature, Sea Ice, and Night Marine Air Temperature since the Late Nineteenth Century. J. Geophys. Res. 2003, 108, 4407. [Google Scholar] [CrossRef] [Green Version]
  27. Lee, H.-T.; Gruber, A.; Ellingson, R.G.; Laszlo, I. Development of the HIRS Outgoing Longwave Radiation Climate Dataset. J. Atmos. Ocean. Technol. 2007, 24, 2029–2047. [Google Scholar] [CrossRef] [Green Version]
  28. Ellingson, R.G.; Yanuk, D.J.; Lee, H.-T.; Gruber, A. A Technique for Estimating Outgoing Longwave Radiation from HIRS Radiance Observations. J. Atmos. Ocean. Technol. 1989, 6, 706–711. [Google Scholar] [CrossRef]
  29. Ellingson, R.G.; Lee, H.-T.; Yanuk, D.; Gruber, A. Validation of a Technique for Estimating Outgoing Longwave Radiation from HIRS Radiance Observations. J. Atmos. Ocean. Technol. 1994, 11, 357–365. [Google Scholar] [CrossRef]
  30. Knapp, K.R.; Kruk, M.C.; Levinson, D.H.; Diamond, H.J.; Neumann, C.J. The International Best Track Archive for Climate Stewardship (IBTrACS): Unifying Tropical Cyclone Data. Bull. Am. Meteorol. Soc. 2010, 91, 363–376. [Google Scholar] [CrossRef] [Green Version]
  31. Emanuel, K. Increasing Destructiveness of Tropical Cyclones over the Past 30 Years. Nature 2005, 436, 686–688. [Google Scholar] [CrossRef]
  32. Atkinson, G.D.; Holliday, C.R. Tropical Cyclone Minimum Sea Level Pressure/Maximum Sustained Wind Relationship for the Western North Pacific. Mon. Weather Rev. 1977, 105, 421–427. [Google Scholar] [CrossRef]
  33. Tu, S.; Xu, J.; Xu, F.; Liang, M.; Ji, Q.; Chen, S. Differences in the Destructiveness of Tropical Cyclones over the Western North Pacific between Slow- and Rapid-Transforming El Niño Years. Environ. Res. Lett. 2020, 15, 024014. [Google Scholar] [CrossRef]
  34. Song, J.; Klotzbach, P.J.; Tang, J.; Wang, Y. The Increasing Variability of Tropical Cyclone Lifetime Maximum Intensity. Sci. Rep. 2018, 8, 16641. [Google Scholar] [CrossRef] [Green Version]
  35. Murakami, T.; Matsumoto, J. Summer Monsoon over the Asian Continent and Western North Pacific. J. Meteorol. Soc. Jpn. Ser. II 1994, 72, 719–745. [Google Scholar] [CrossRef] [Green Version]
  36. Webster, P.J.; Yang, S. Monsoon and Enso: Selectively Interactive Systems. Q. J. R. Meteorol. Soc. 1992, 118, 877–926. [Google Scholar] [CrossRef]
  37. Li, C.; Liping, Z. Summer Monsoon Activities in the South China Sea and Its Impacts. Chin. J. Atmos. Sci. 1999, 23, 257–266. (In Chinese) [Google Scholar] [CrossRef]
  38. Wang, B. Definition of South China Sea Monsoon Onset and Commencement of the East Asia Summer Monsoon. J. Clim. 2004, 17, 699–710. [Google Scholar] [CrossRef] [Green Version]
  39. Wang, B.; Huang, F.; Wu, Z.; Yang, J.; Fu, X.; Kikuchi, K. Multi-Scale Climate Variability of the South China Sea Monsoon: A Review. Dyn. Atmos. Ocean. 2009, 47, 15–37. [Google Scholar] [CrossRef]
  40. Wu, S.; Liang, J. Intensity Index of South China Sea Monsoon and Its Variation Characteristics. J. Trop. Meteorol. 2002, 8, 1–9. [Google Scholar]
  41. Chen, W.; Hu, P.; Huangfu, J. Multi-scale climate variations and mechanisms of the onset and withdrawal of the South China Sea summer monsoon. Sci. China Earth Sci. 2022, 65, 1030–1046. [Google Scholar] [CrossRef]
  42. Molinari, J.; Vollaro, D. A Subtropical Cyclonic Gyre Associated with Interactions of the MJO and the Midlatitude Jet. Mon. Weather Rev. 2012, 140, 343–357. [Google Scholar] [CrossRef] [Green Version]
  43. Feng, T.; Chen, G.-H.; Huang, R.-H.; Shen, X.-Y. Large-Scale Circulation Patterns Favourable to Tropical Cyclogenesis over the Western North Pacific and Associated Barotropic Energy Conversions. Int. J. Climatol. 2014, 34, 216–227. [Google Scholar] [CrossRef]
  44. Lander, M.A. An Exploratory Analysis of the Relationship between Tropical Storm Formation in the Western North Pacific and ENSO. Mon. Weather Rev. 1994, 122, 636–651. [Google Scholar] [CrossRef]
  45. Lau, K.-M.; Li, M.-T. The Monsoon of East Asia and Its Global Associations—A Survey. Bull. Am. Meteorol. Soc. 1984, 65, 114–125. [Google Scholar] [CrossRef]
  46. Wang, B.; Wu, R. Peculiar Temporal Structure of the South China Sea Summer Monsoon. Adv. Atmos. Sci. 1997, 14, 177–194. [Google Scholar] [CrossRef]
  47. Wang, B.; Wu, R.; Fu, X. Pacific–East Asian Teleconnection: How Does ENSO Affect East Asian Climate? J. Clim. 2000, 13, 1517–1536. [Google Scholar] [CrossRef]
  48. He, C.; Zhou, T.; Wu, B. The Key Oceanic Regions Responsible for the Interannual Variability of the Western North Pacific Subtropical High and Associated Mechanisms. J. Meteorol. Res. 2015, 29, 562–575. [Google Scholar] [CrossRef]
  49. Xu, J.; Chan, J.C.L. The Role of the Asian–Australian Monsoon System in the Onset Time of El Niño Events. J. Clim. 2001, 14, 418–433. [Google Scholar] [CrossRef]
  50. Chang, C.-P.; Zhang, Y.; Li, T. Interannual and Interdecadal Variations of the East Asian Summer Monsoon and Tropical Pacific SSTs. Part II: Meridional Structure of the Monsoon. J. Clim. 2000, 13, 4326–4340. [Google Scholar] [CrossRef]
  51. Zhan, R.; Wang, Y.; Tao, L. Intensified Impact of East Indian Ocean SST Anomaly on Tropical Cyclone Genesis Frequency over the Western North Pacific. J. Clim. 2014, 27, 8724–8739. [Google Scholar] [CrossRef]
  52. Zhou, W.; Chan, J.C.L. ENSO and the South China Sea Summer Monsoon Onset. Int. J. Climatol. 2007, 27, 157–167. [Google Scholar] [CrossRef]
  53. Fan, Y.; Fan, K.; Xu, Z.; Li, S. ENSO–South China Sea Summer Monsoon Interaction Modulated by the Atlantic Multidecadal Oscillation. J. Clim. 2018, 31, 3061–3076. [Google Scholar] [CrossRef]
  54. Camargo, S.J.; Sobel, A.H. Western North Pacific Tropical Cyclone Intensity and ENSO. J. Clim. 2005, 18, 2996–3006. [Google Scholar] [CrossRef]
  55. Hu, F.; Li, T.; Liu, J.; Bi, M.; Peng, M. Decrease of Tropical Cyclone Genesis Frequency in the Western North Pacific since 1960s. Dyn. Atmos. Ocean. 2018, 81, 42–50. [Google Scholar] [CrossRef]
  56. Chen, T.-C.; Weng, S.-P.; Yamazaki, N.; Kiehne, S. Interannual Variation in the Tropical Cyclone Formation over the Western North Pacific. Mon. Weather Rev. 1998, 126, 1080–1090. [Google Scholar] [CrossRef]
  57. Camargo, S.J.; Emanuel, K.A.; Sobel, A.H. Use of a Genesis Potential Index to Diagnose ENSO Effects on Tropical Cyclone Genesis. J. Clim. 2007, 20, 4819–4834. [Google Scholar] [CrossRef]
  58. Wang, X.; Zhou, W.; Li, C.; Wang, D. Comparison of the Impact of Two Types of El Niño on Tropical Cyclone Genesis over the South China Sea. Int. J. Climatol. 2013, 34, 2651–2660. [Google Scholar] [CrossRef]
  59. Tao, L.; Lan, Y. Inter-Decadal Change of the Inter-Annual Relationship between the Frequency of Intense Tropical Cyclone over the Western North Pacific and ENSO. Int. J. Climatol. 2017, 37, 4880–4895. [Google Scholar] [CrossRef]
  60. Chan, J.C.L. Tropical Cyclone Activity over the Western North Pacific Associated with El Niño and La Niña Events. J. Clim. 2000, 13, 2960–2972. [Google Scholar] [CrossRef]
  61. Zhou, Q.; Wei, L.; Zhang, R. Influence of Indian Ocean Dipole on Tropical Cyclone Activity over Western North Pacific in Boreal Autumn. J. Ocean Univ. China 2019, 18, 795–802. [Google Scholar] [CrossRef]
  62. Liu, Y.; Huang, P.; Chen, G. Impacts of the Combined Modes of the Tropical Indo-Pacific Sea Surface Temperature Anomalies on the Tropical Cyclone Genesis over the Western North Pacific. Int. J. Climatol. 2019, 39, 2108–2119. [Google Scholar] [CrossRef]
  63. Wu, B.; Zhou, T. Oceanic Origin of the Interannual and Interdecadal Variability of the Summertime Western Pacific Subtropical High. Geophys. Res. Lett. 2008, 35, L13701. [Google Scholar] [CrossRef] [Green Version]
  64. Li, T.; Wang, B.; Wu, B.; Zhou, T.; Chang, C.-P.; Zhang, R. Theories on Formation of an Anomalous Anticyclone in Western North Pacific during El Niño: A Review. J. Meteorol. Res. 2017, 31, 987–1006. [Google Scholar] [CrossRef]
  65. Xie, S.-P.; Hu, K.; Hafner, J.; Tokinaga, H.; Du, Y.; Huang, G.; Sampe, T. Indian Ocean Capacitor Effect on Indo–Western Pacific Climate during the Summer Following El Niño. J. Clim. 2009, 22, 730–747. [Google Scholar] [CrossRef]
  66. Sui, C.-H.; Chung, P.-H.; Li, T. Interannual and Interdecadal Variability of the Summertime Western North Pacific Subtropical High. Geophys. Res. Lett. 2007, 34, L11701. [Google Scholar] [CrossRef] [Green Version]
  67. Terao, T.; Takuji, K. East-West SST Contrast over the Tropical Oceans and the Post El Niño Western North Pacific Summer Monsoon. Geophys. Res. Lett. 2005, 32, L15706. [Google Scholar] [CrossRef] [Green Version]
  68. Chen, M.; Yu, J.; Wang, X.; Jiang, W. The Changing Impact Mechanisms of a Diverse El Niño on the Western Pacific Subtropical High. Geophys. Res. Lett. 2019, 46, 953–962. [Google Scholar] [CrossRef] [Green Version]
  69. Lau, K.-M.; Yang, S. Walker Circulation. In Encyclopedia of Atmospheric Sciences; Elsevier Science Ltd.: Amsterdam, The Netherlands, 2003; pp. 2505–2510. [Google Scholar]
  70. Fosu, B.; He, J.; Liguori, G. Equatorial Pacific Warming Attenuated by SST Warming Patterns in the Tropical Atlantic and Indian Oceans. Geophys. Res. Lett. 2020, 47, e2020GL088231. [Google Scholar] [CrossRef]
  71. Wang, S.; Toumi, R. Recent Migration of Tropical Cyclones toward Coasts. Science 2021, 371, 514–517. [Google Scholar] [CrossRef]
Figure 1. Diagram of the Western North Pacific (WNP) basin (orange box, 0°–50° N, 105°–180° E) and the South China Sea (SCS) region (red box, 5°–20° N, 105°–120° E).
Atmosphere 14 00645 g001
Figure 2. Seasonal circulation curves of the SCSSM intensity index (ISM, black curve), southwest wind index (IVsw, orange curve), and the OLR index (IOLR, blue curve) for each month of the multi-year average. The boxes and whiskers are the monthly ISM of multi-year ranges.
Atmosphere 14 00645 g002
Figure 3. Time series of SCSSM intensity index (ISM) from 1979–2020. The red columns represent years with SCSSM activity exceeding one standard deviation, indicating anomalously strong years. The blue columns represent years with SCSSM activity below negative one standard deviation, indicating anomalously weak years.
Atmosphere 14 00645 g003
Figure 4. Genesis locations and activity ranges of TCs. Curves represent the TCs tracks, dots the TCs genesis locations, and cyclone symbols the TCs average genesis positions over WNP during TC season. The colors red and blue are used to distinguish between strong and weak SCSSM years, respectively. Within the green box, the number of TCs genesis per year in strong and weak SCSSM years differs by nearly three times.
Atmosphere 14 00645 g004
Figure 5. Nine-point-filtered spatial distribution differences (strong SCSSM years minus weak SCSSM years) of (a) TCs track density, (b) average intensity, and (c) regional PDI over WNP basin during TC season. Dots mark areas statistically significant at the 90% confidence level.
Atmosphere 14 00645 g005
Figure 6. An 850 hPa horizontal wind field (streamline) and OLR (shade) during TC season (May to December) in (a) SCSSM strong years and (b) SCSSM weak years, respectively, regressed against the annual ISM. The regression elements have statistical significance at the 90% confidence level. The MT is denoted by a purple, thick-dashed line. The solid red dots represent the locations of TC genesis. The blue boxes represent four sub-regions: Area I (i.e., SCS, 3°–25° N, 105°–120° E), Area II (15°–25° N, 120°–150° E), Area III (3°–15° N, 120°–150° E), and Area IV (3°–15° N, 150°–180° E). The bar charts (c) show the number of TCs genesis per year in each area during TC season, in which strong SCSSM years are in red and weak SCSSM years are in blue, with yellow shading indicating that the differences are significant at 90% confidence level.
Atmosphere 14 00645 g006
Figure 7. (a) The patterns (unit: gpm) and (b) the ridge latitudes of Western Pacific subtropical high (WPSH) at 500 hPa over the WNP basin during TC season (May to December), in which strong SCSSM years are in red and weak SCSSM years are in blue, with yellow shading in (b) indicating that the differences are significant at 90% confidence level.
Atmosphere 14 00645 g007
Figure 8. Distribution of SSTA differences (strong years minus weak years) in the tropical Indo-Pacific Ocean during TC season (May to December) in anomalous SCSSM years. Dots mark areas that are statistically significant at the 90% confidence level.
Atmosphere 14 00645 g008
Figure 9. Vertical section differences (strong years minus weak years) of equatorial (average of 5° S–5° N) vertical velocity (shade) and latitudinal circulation (arrow) over the tropical Indo-Pacific Ocean during TC season (May to December) in anomalous SCSSM years. Shaded areas are statistically significant at the 90% confidence level.
Atmosphere 14 00645 g009
Figure 10. Distribution differences (strong years minus weak years) of (a) 850 hPa wind (arrow, unit: m/s); (b) 200 hPa wind (arrow, unit: m/s); (c) 500 hPa vertical velocity (shade, unit: 10−3 m/s); (d) 850 hPa relative vorticity (shade, unit: 10−6 s−1); (e) total column water vapor (shade, unit: kg/m2) over the tropical Indo-Pacific Ocean during TC season (May to December) in SCSSM anomalous years. Shaded areas in (a,b) and dotted areas in (ce) are statistically significant at the 90% confidence level.
Atmosphere 14 00645 g010
Figure 11. Mechanism diagram of the tropical Indo-Pacific ocean–atmosphere system and TCs activity characteristics in (a) strong and (b) weak SCSSM years.
Atmosphere 14 00645 g011
Table 1. Statistical characteristics of indicators for TC activity in SCSSM anomalous years.
TypeIndexNeutral
SCSSM
Strong
SCSSM
Weak
SCSSM
Difference Percent (%)p-Values
WNPTCCount (N)27.5028.8826.508.20.16
LMI (m/s)39.2237.9243.99−16.0 *0.02
Lifetime (d)6.375.577.31−31.3 *<0.01
PDI (1011 m3/s2)7.486.719.28−38.4 *0.05
SCSTCCount (N)10.9611.508.7523.9 *0.04
LMI (m/s)35.3135.3040.46−14.6 *0.08
Lifetime (d)5.515.116.71−31.4 *0.02
PDI in WNP (1011 m3/s2)1.911.991.7611.20.67
PDI in SCS (1011 m3/s2)0.710.750.6119.30.32
Note: An asterisk (*) indicates statistical significance at the 90% confidence level.
Disclaimer/Publisher’s Note: The statements, opinions and data contained in all publications are solely those of the individual author(s) and contributor(s) and not of MDPI and/or the editor(s). MDPI and/or the editor(s) disclaim responsibility for any injury to people or property resulting from any ideas, methods, instructions or products referred to in the content.

