
Investigation of the Efficiency of Satellite-Derived LST Data for Mapping the Meteorological Parameters in Istanbul
Abstract
:1. Introduction
2. Materials and Methods
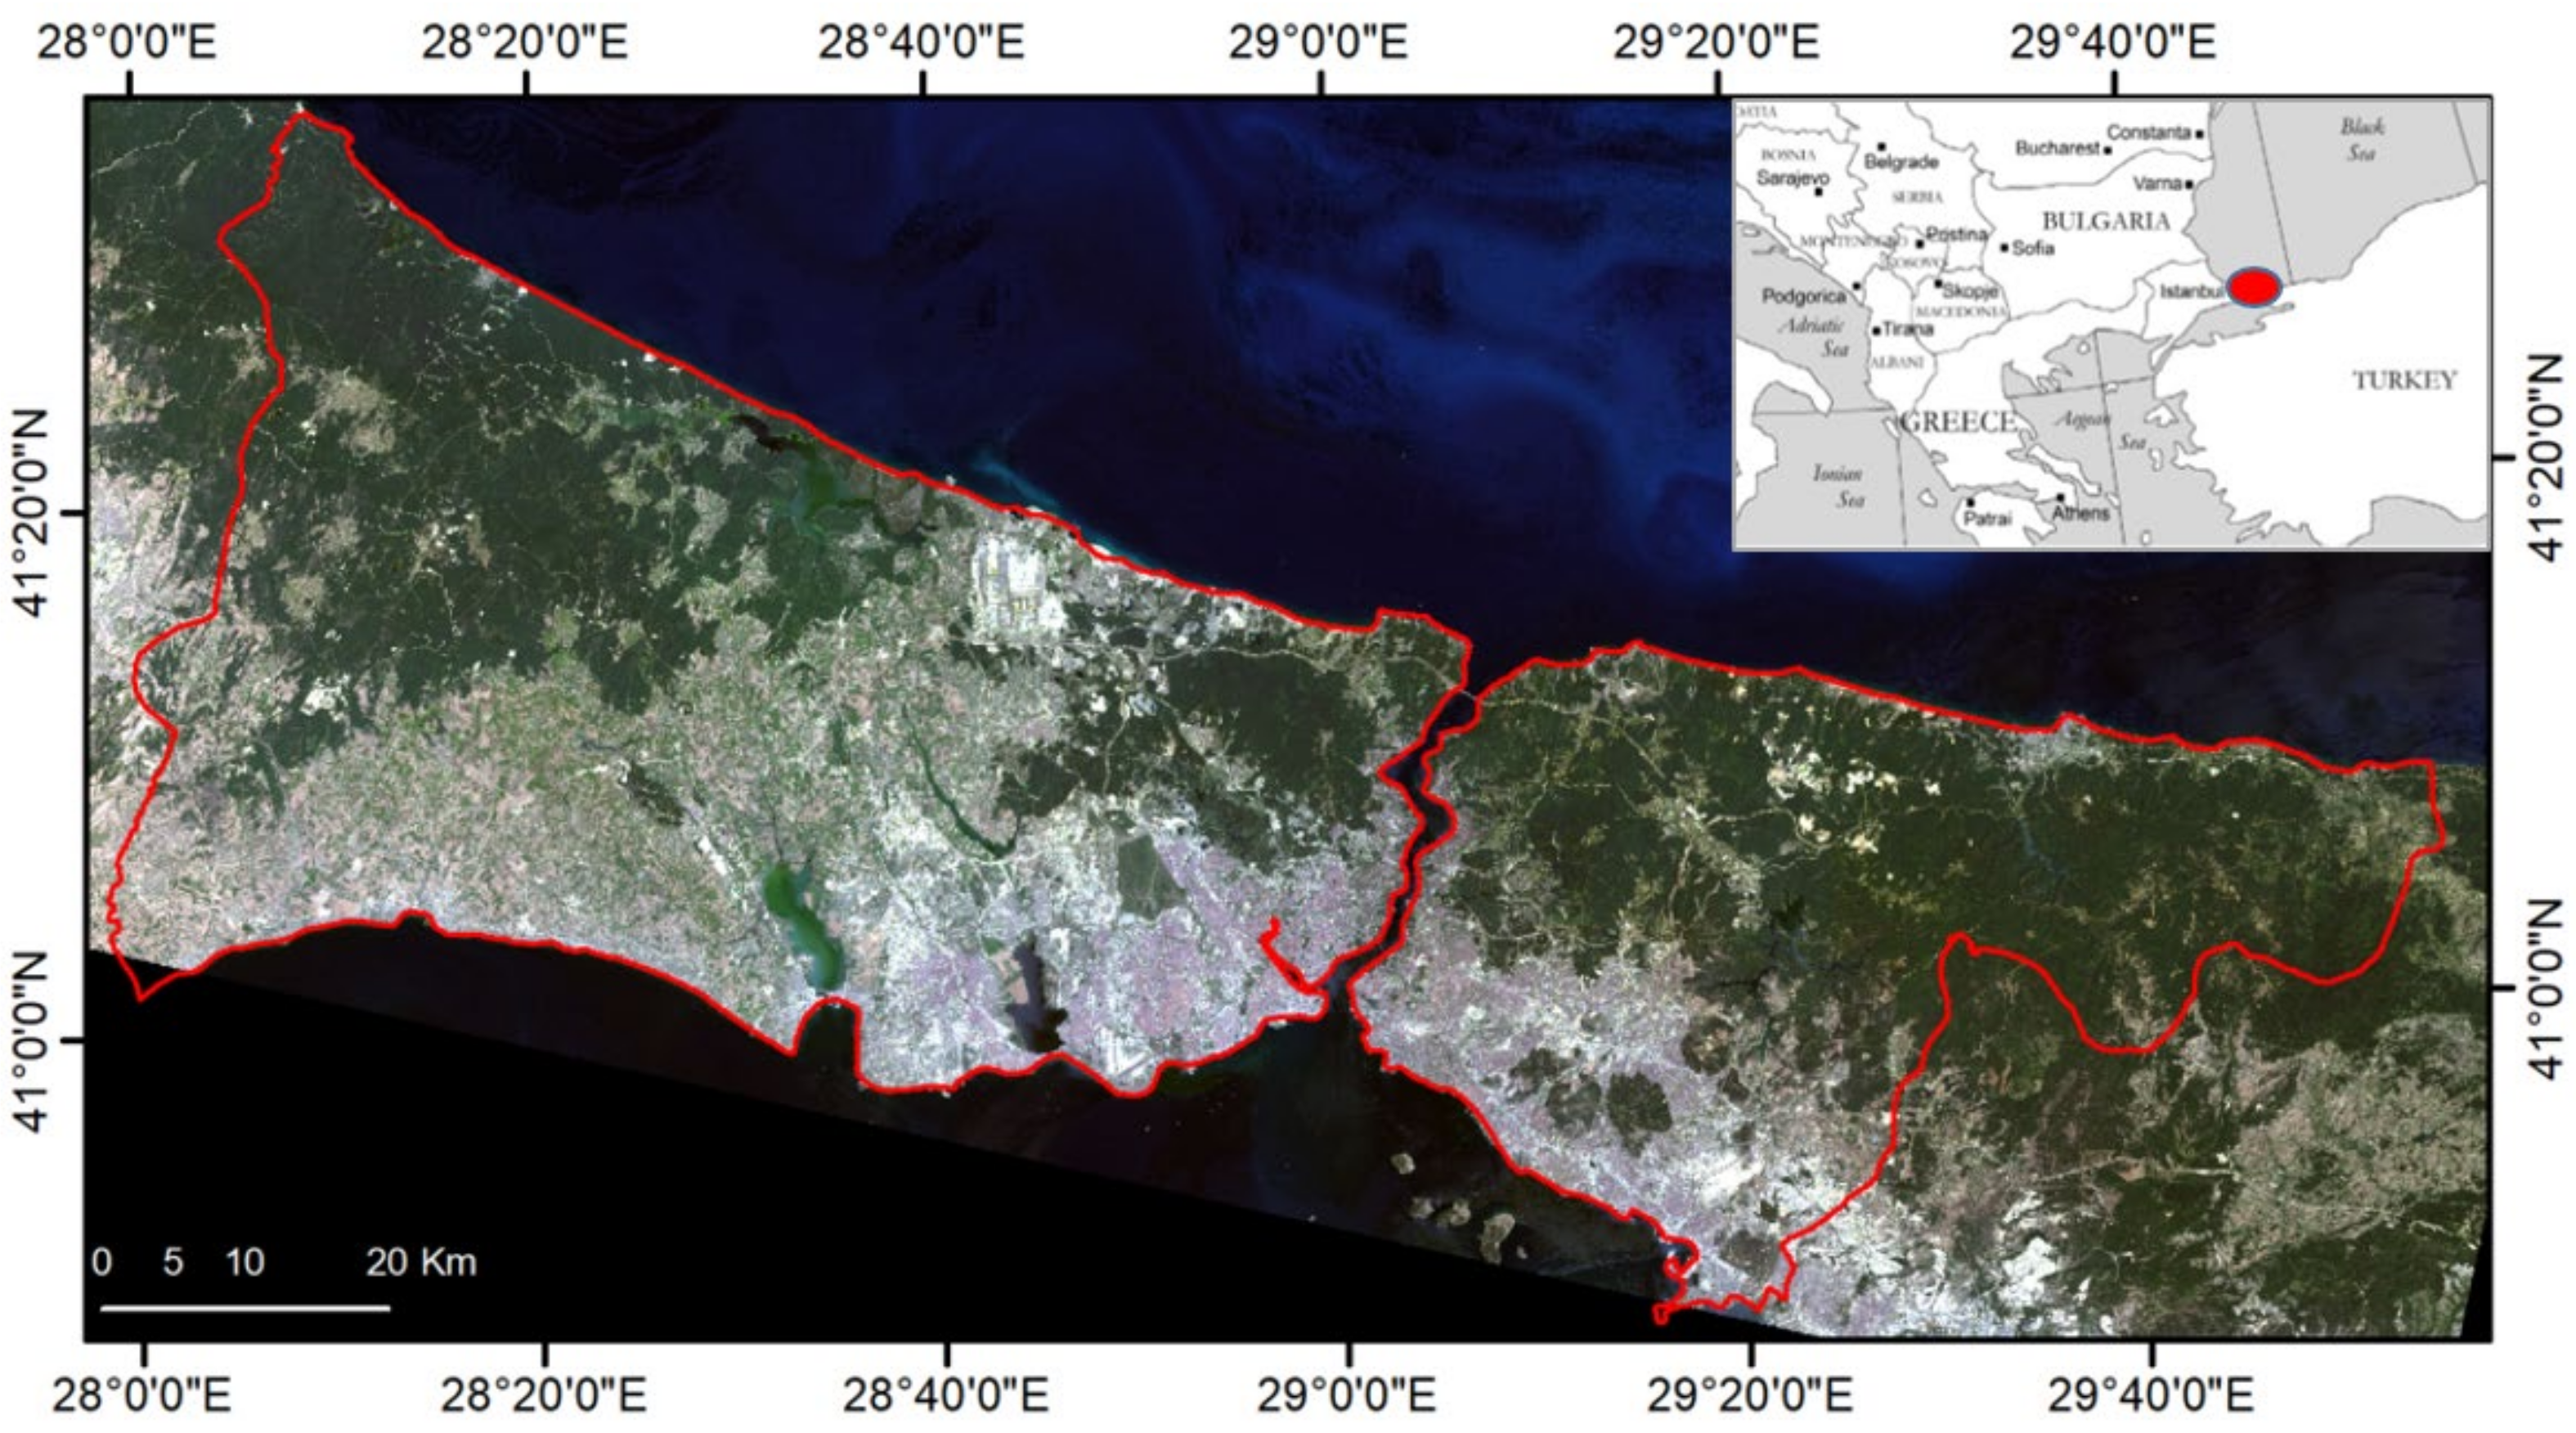
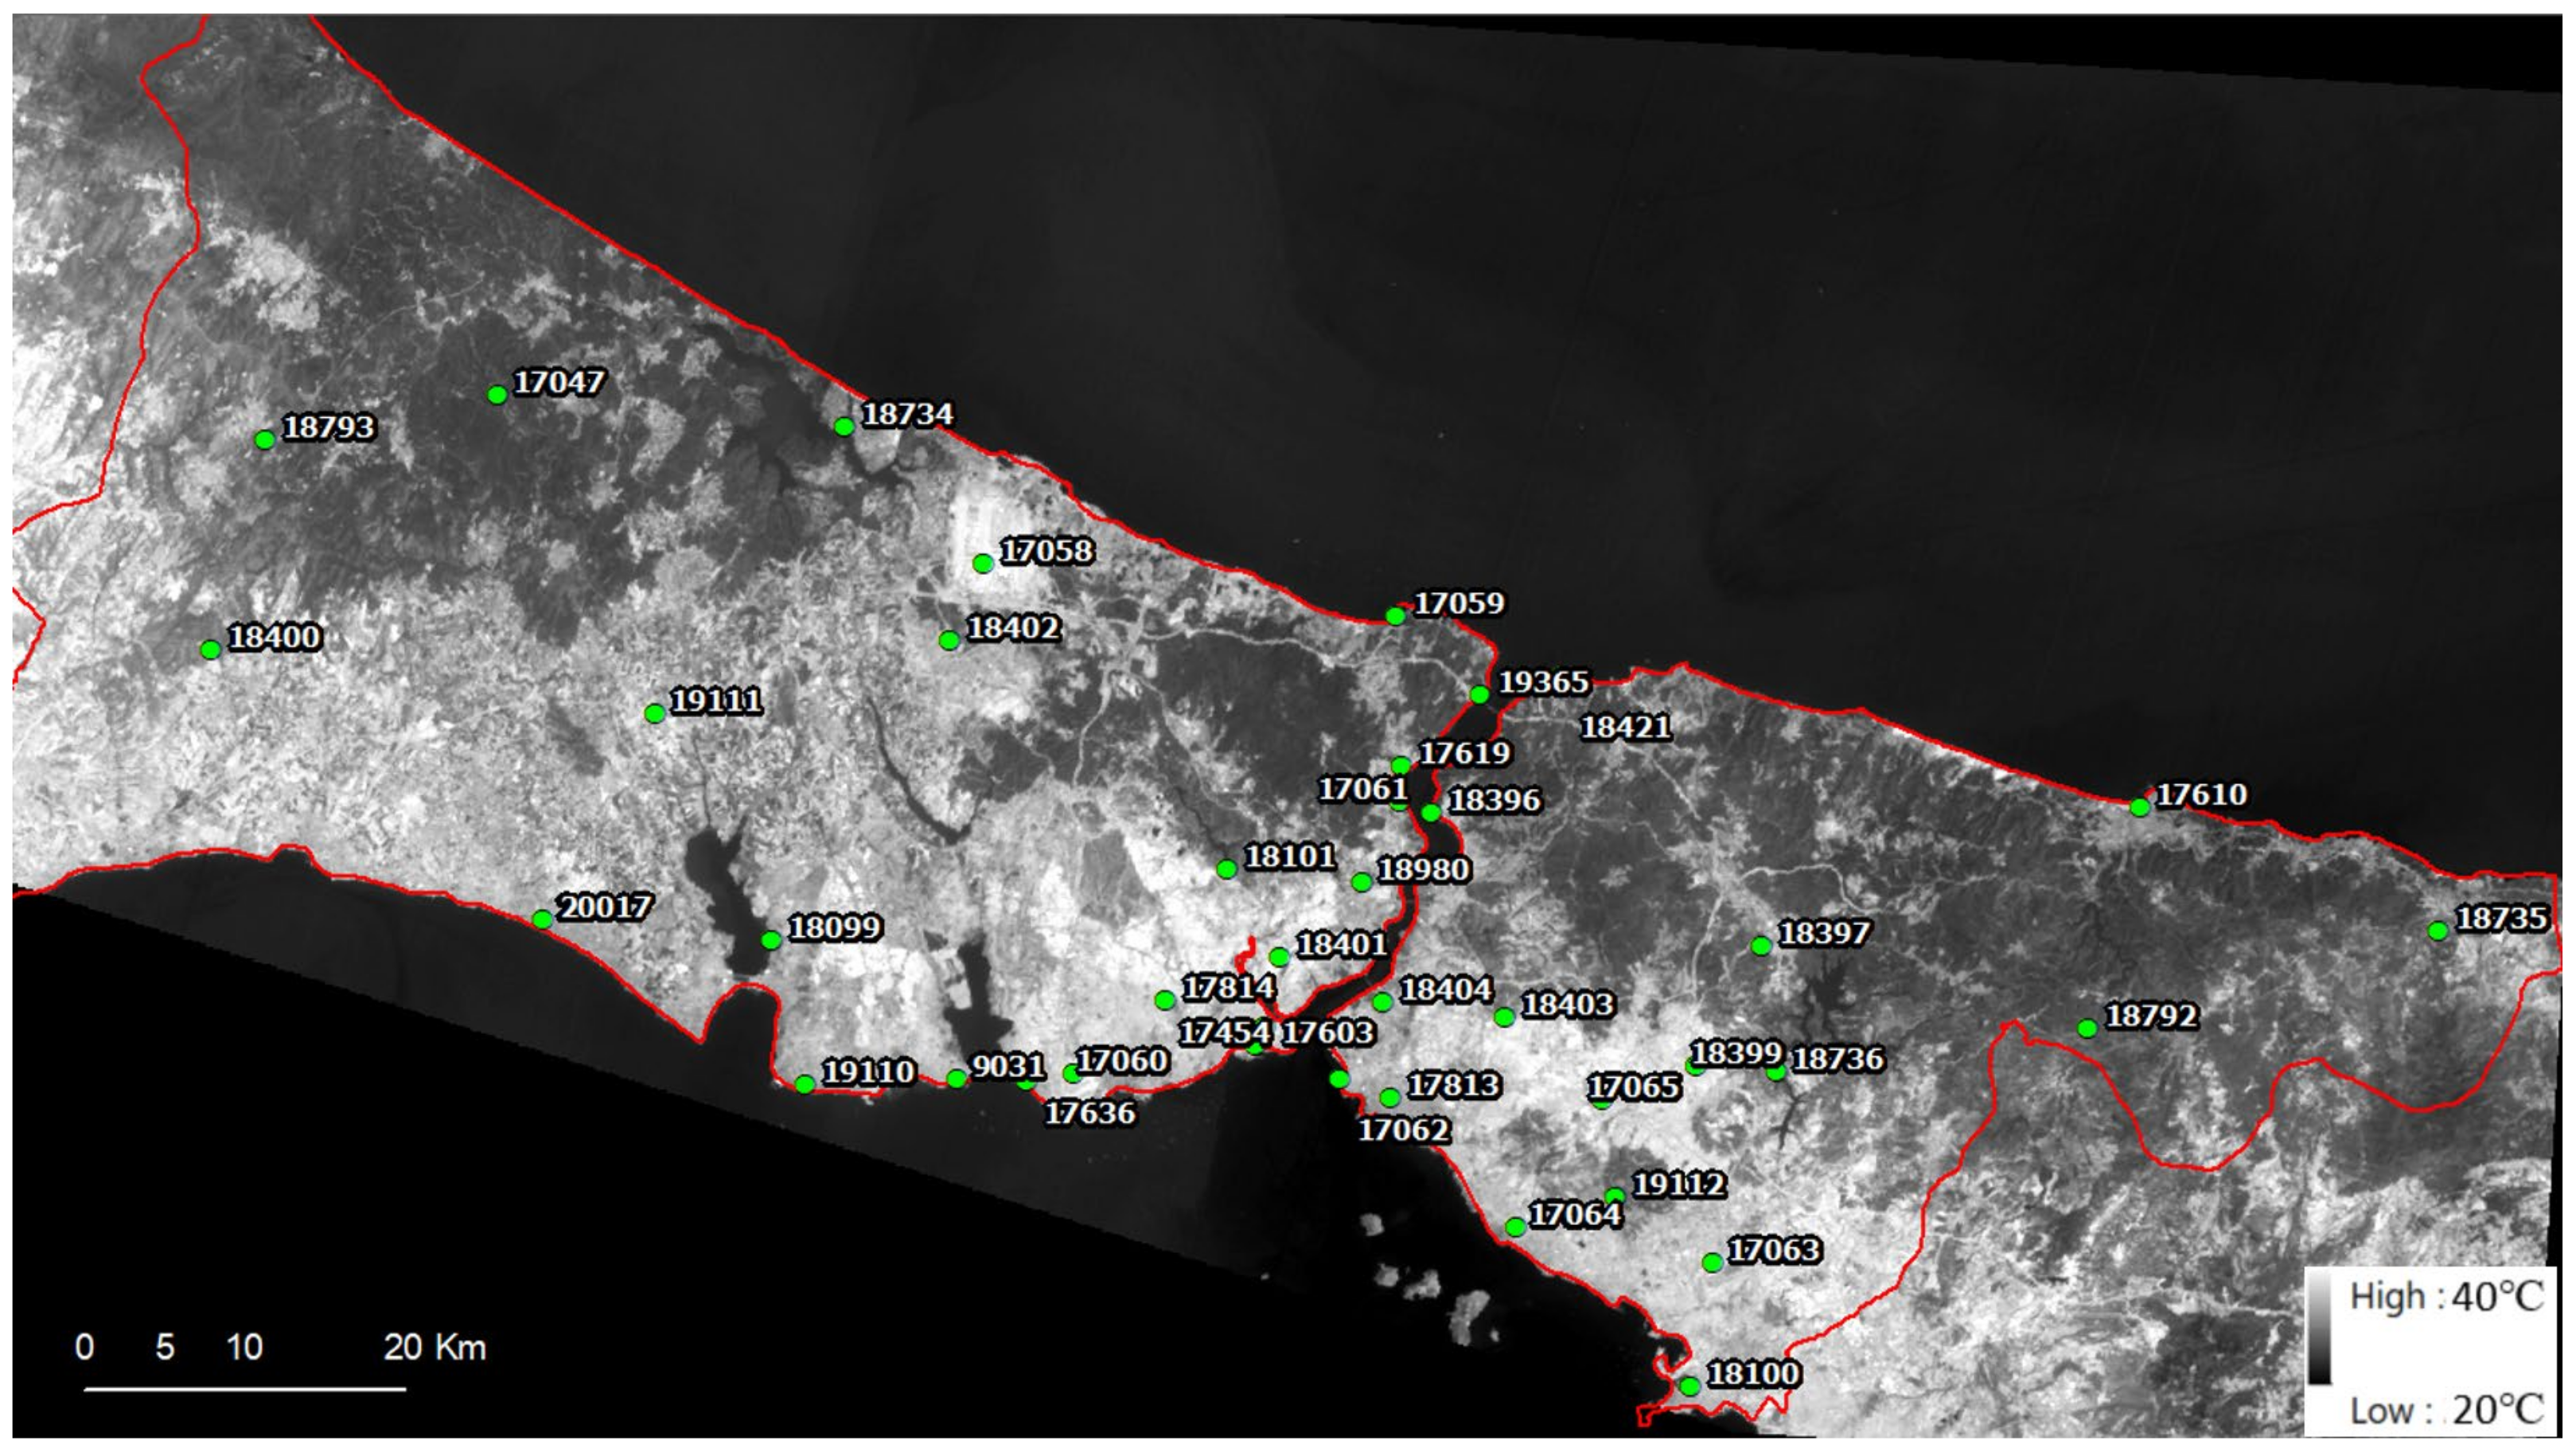
2.1. Materials
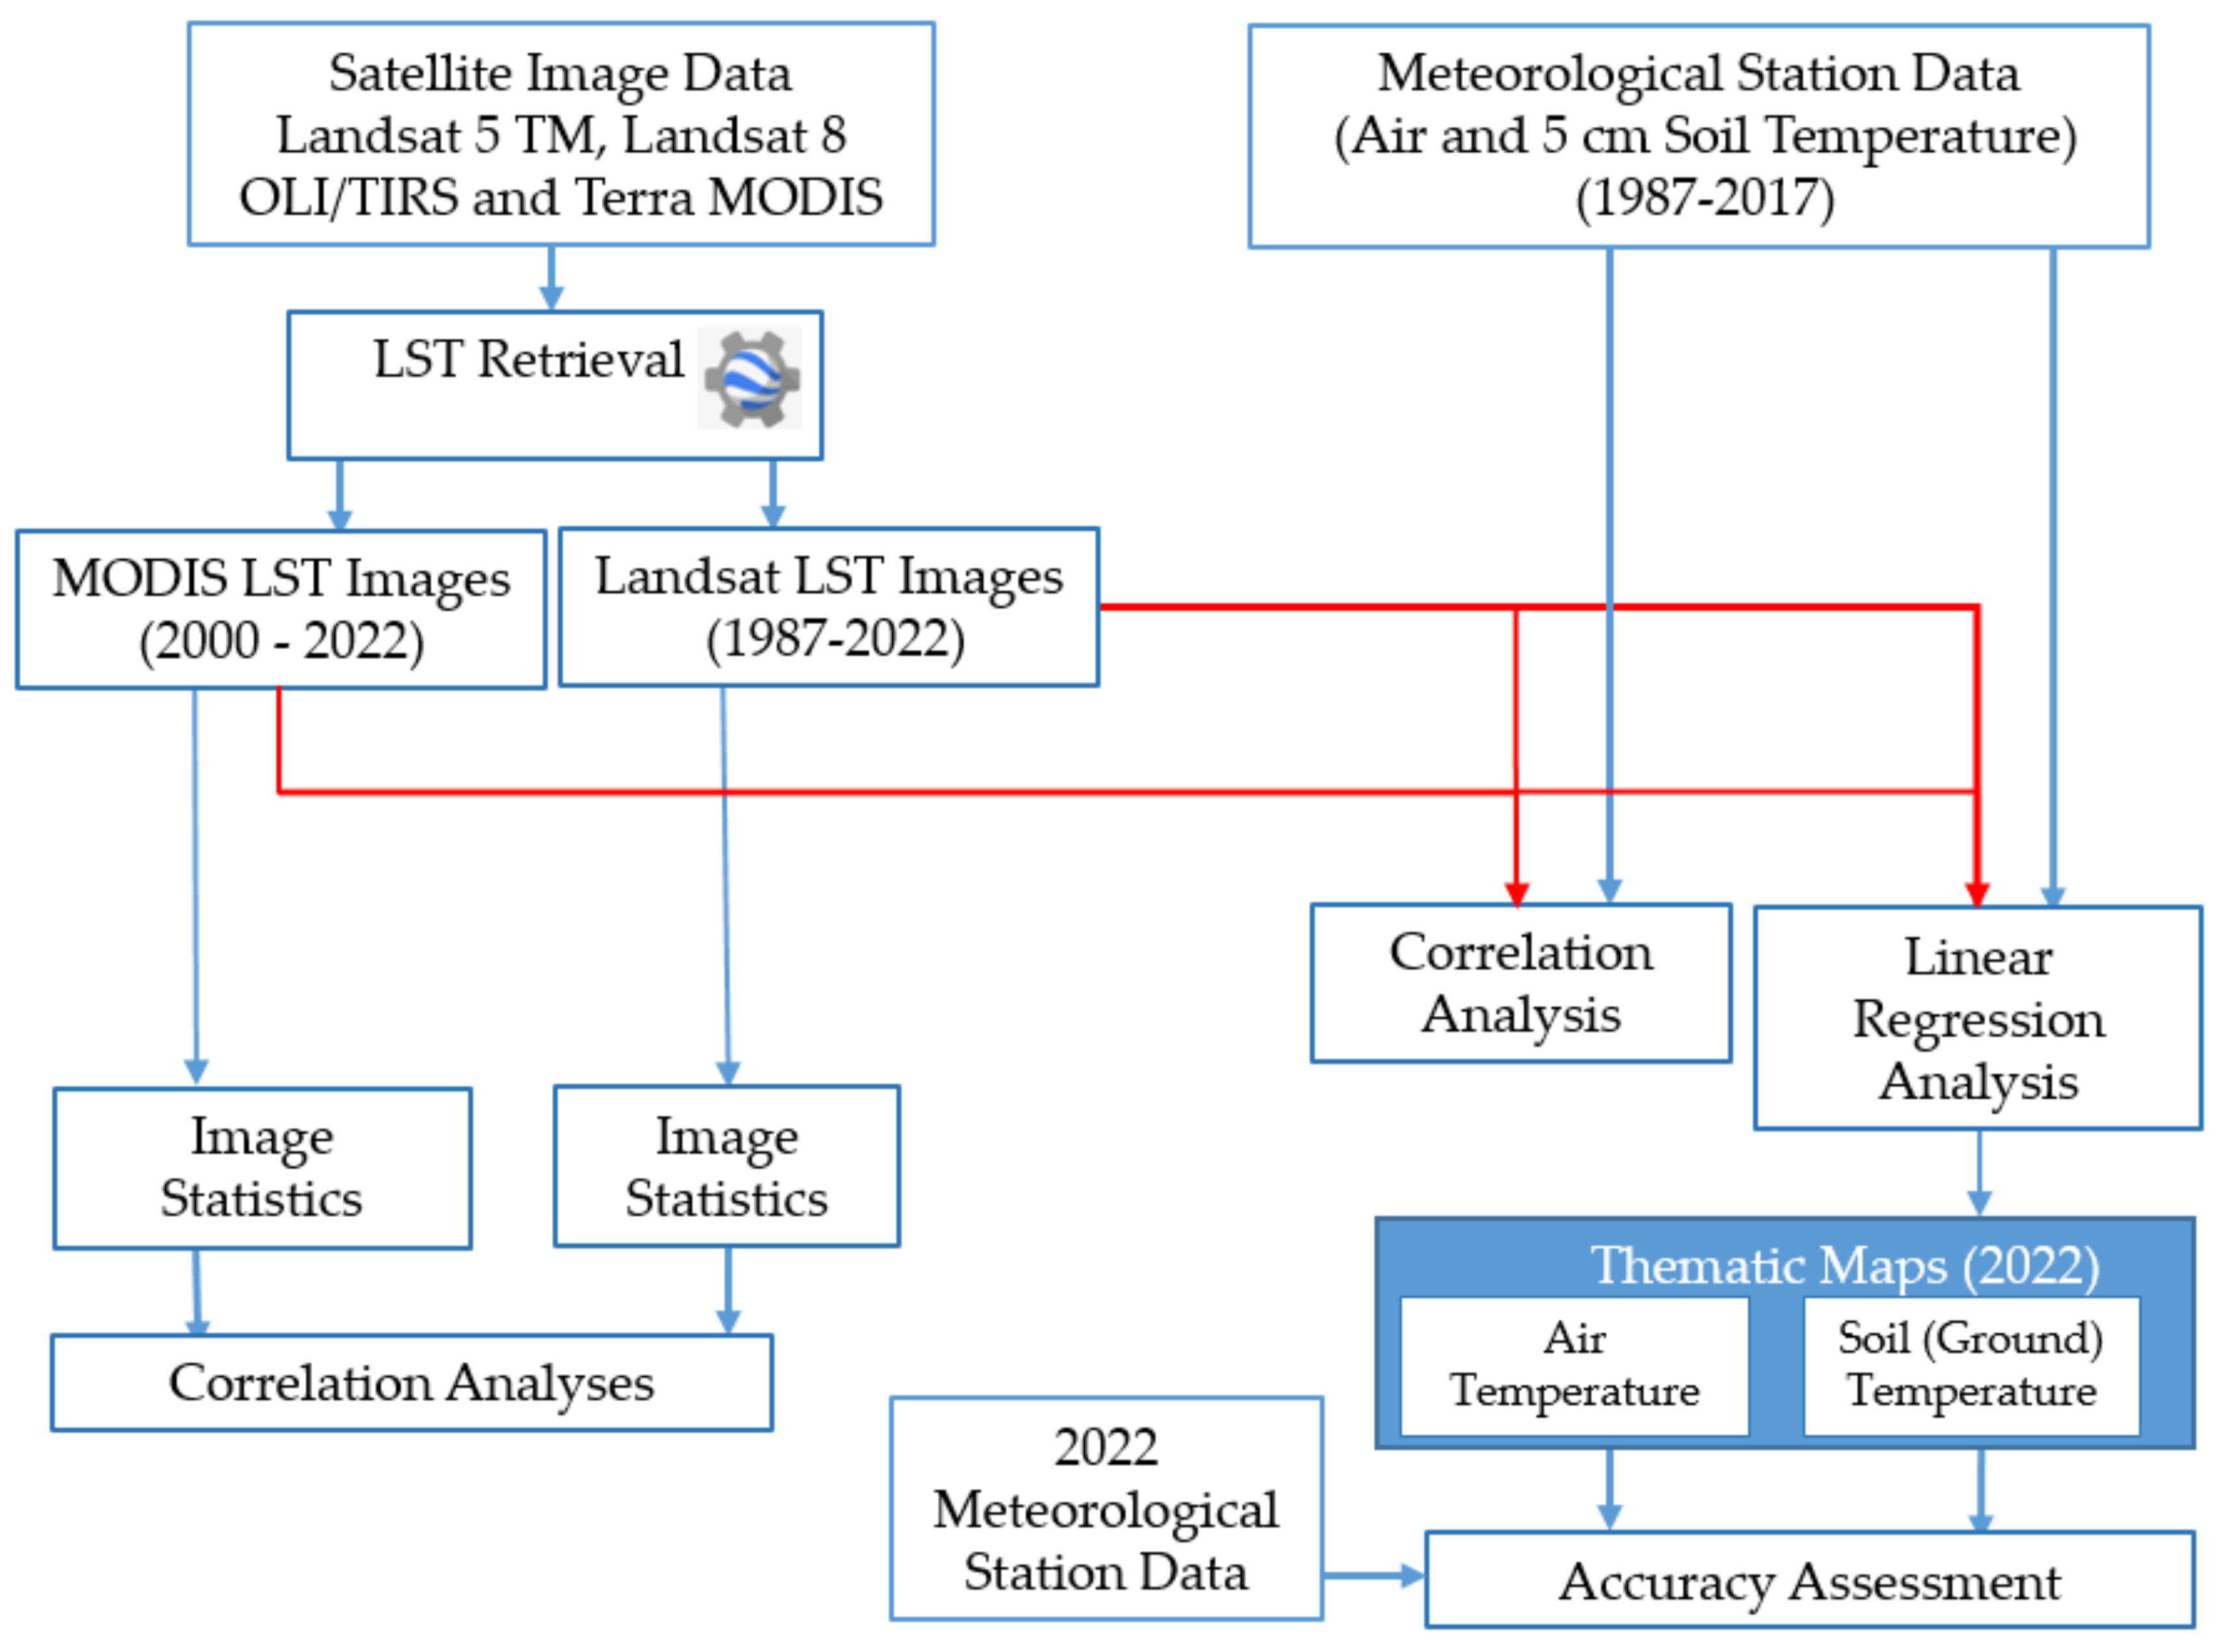
2.2. Methods
2.2.1. LST Retrieval
- ρ = h ∗ c/σ = 1.438 × m ∗ K;
- σ = Boltzmann constant (1.38 × J/K);
- h = Planck’s constant (6.626 × J ∗ s);
- c = the velocity of the light (2.998 × m/s).
2.2.2. Statistical Analysis
2.2.3. Thematic Mapping of Meteorological Parameters
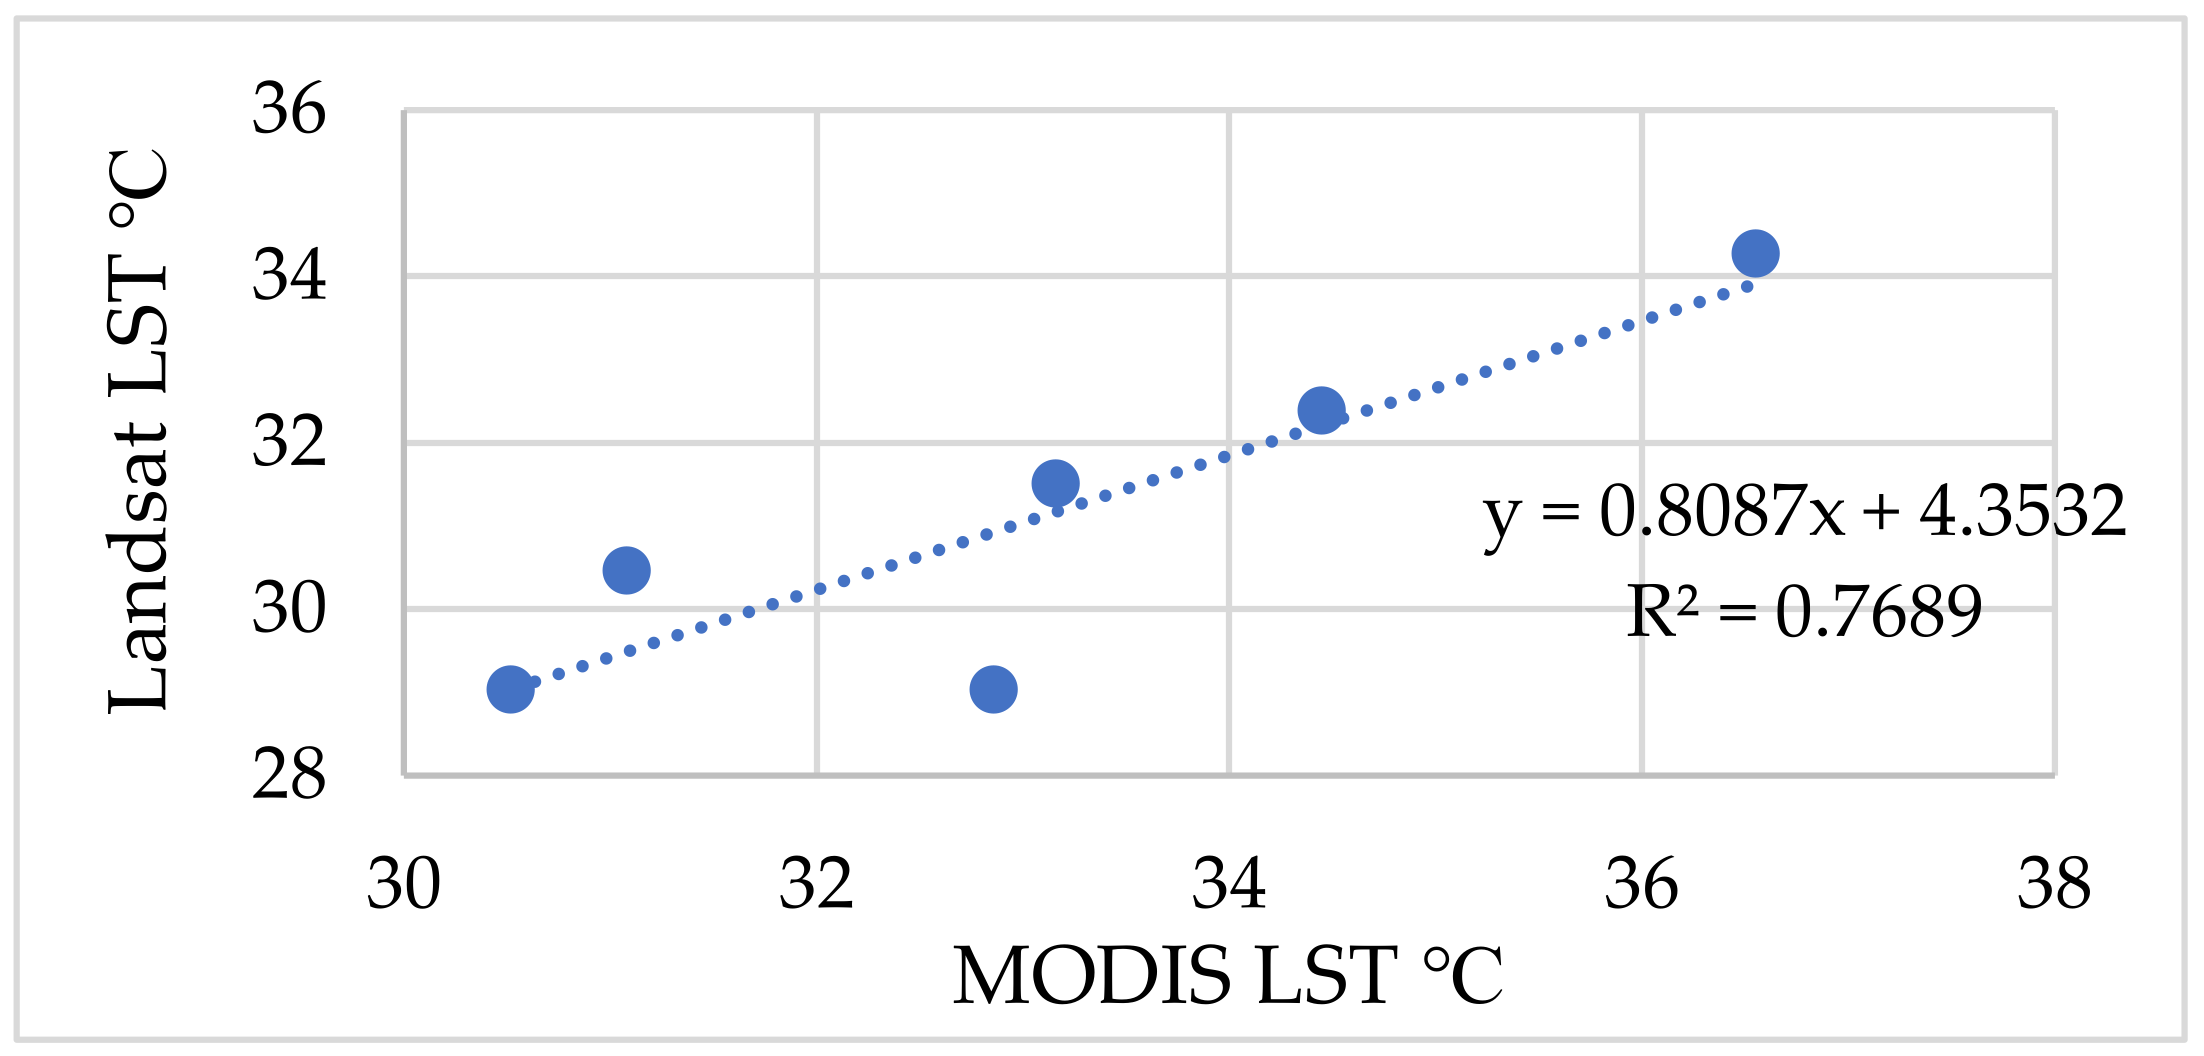
3. Results and Discussion
4. Conclusions
Funding
Institutional Review Board Statement
Informed Consent Statement
Data Availability Statement
Acknowledgments
Conflicts of Interest
References
- The European Space Ageny. Available online: https://climate.esa.int/nl/projecten/land-surface-temperature/about/ (accessed on 10 December 2022).
- Jeganathan, C.; Hamm, N.A.; Mukherjee, S.; Atkinson, P.M.; Raju, P.L.N.; Dadhwal, V.K. Evaluating a thermal image sharpening model over a mixed agricultural landscape in India. Int. J. Appl. Earth Obs. Geoinf. 2011, 13, 178–191. [Google Scholar] [CrossRef]
- Hope, A.; Engstrom, R.; Stow, D. Relationship between AVHRR surface temperature and NDVI in Arctic tundra ecosystems. Int. J. Remote Sens. 2005, 28, 1771–1776. [Google Scholar] [CrossRef]
- Karnieli, A.; Bayasgalan, M.; Bayarjargal, Y.; Agam, N.; Khudulmur, S.; Tucker, C.J. Comments on the use of the vegetation health index over Mongolia. Int. J. Remote Sens. 2006, 27, 2017–2024. [Google Scholar] [CrossRef]
- Abuzar, M.; O’Leary, G.; Fitzgerald, G. Measuring water stress in a wheat crop on a spatial scale using airborne thermal and multispectral imagery. Field Crops Res. 2009, 112, 55–65. [Google Scholar] [CrossRef]
- Anderson, M.C.; Neale, C.M.U.; Li, F.; Norman, J.M.; Kustas, W.P.; Jayanthi, H.; Chavez, J.O.S.E. Upscaling ground observations of vegetation water content, canopy height, and leaf area index during SMEX02 using aircraft and Landsat imagery. Remote Sens. Environ. 2004, 92, 447–464. [Google Scholar] [CrossRef]
- Sarif, M.O.; Gupta, R.D.; Murayama, Y. Assessing Local Climate Change by Spatiotemporal Seasonal LST and Six Land Indices, and Their Interrelationships with SUHI and Hot–Spot Dynamics: A Case Study of Prayagraj City, India (1987–2018). Remote Sens. 2022, 15, 179. [Google Scholar] [CrossRef]
- Hao, B.; Ma, M.; Li, S.; Li, Q.; Hao, D.; Huang, J.; Ge, Z.; Yang, H.; Han, X. Land use change and climate variation in the three gorges reservoir catchment from 2000 to 2015 based on the Google Earth Engine. Sensors 2019, 19, 2118. [Google Scholar] [CrossRef] [Green Version]
- Anderson, M.C.; Allen, R.G.; Morse, A.; Kustas, W.P. Use of Landsat thermal imagery in monitoring evapotranspiration and managing water resources. Remote Sens. Environ. 2012, 122, 50–65. [Google Scholar] [CrossRef]
- Tuzcu Kokal, A.; Ismailoglu, I.; Musaoglu, N.; Tanik, A. Detection of surface temperature anomaly of the Sea of Marmara. Adv. Space Res. 2022, 71, 2996–3004. [Google Scholar] [CrossRef]
- Albarqouni, M.M.; Yagmur, N.; Bektas Balcik, F.; Sekertekin, A. Assessment of Spatio-Temporal Changes in Water Surface Extents and Lake Surface Temperatures Using Google Earth Engine for Lakes Region, Türkiye. ISPRS Int. J. Geo-Inf. 2022, 11, 407. [Google Scholar] [CrossRef]
- Jin, Q.; Wei, J.; Yang, Z.L.; Lin, P. Irrigation-induced environmental changes around the Aral Sea: An integrated view from multiple satellite observations. Remote Sens. 2017, 9, 900. [Google Scholar] [CrossRef] [Green Version]
- Bektaş Balçik, F. Determining the impact of urban components on land surface temperature of Istanbul by using remote sensing indices. Environ. Monit. Assess. 2014, 186, 859–872. [Google Scholar] [CrossRef]
- Dihkan, M.; Karsli, F.; Guneroglu, N.; Guneroglu, A. Evaluation of urban heat island effect in Turkey. Arab. J. Geosci. 2018, 11, 186. [Google Scholar] [CrossRef]
- Sarp, G.; Baydoğan, E.; Güzel, F.; Otlukaya, T. Evaluation of the relationship between urban area and land surface temperature determined from optical satellite data: A case of Istanbul. Adv. Remote Sens. 2021, 1, 31–37. [Google Scholar]
- Aslan, N.; Koc-San, D. Analysis of relationship between urban heat island effect and Land use/cover type using Landsat 7 ETM+ and Landsat 8 OLI images. In Proceedings of the International Archives of the Photogrammetry, Remote Sensing and Spatial Information Sciences—ISPRS Archives, Prague, Czech Republic, 12–19 July 2016; Volume XLI-B8, pp. 821–828. [Google Scholar]
- Li, Y.; Liu, Y.; Bohrer, G.; Cai, Y.; Wilson, A.; Hu, T.; Wang, Z.; Zhao, K. Impacts of forest loss on local climate across the conterminous United States: Evidence from satellite time-series observations. Sci. Total Environ. 2022, 802, 149651. [Google Scholar] [CrossRef]
- Çolak, E.; Sunar, F. Investigating the usefulness of satellite-retrieved land surface temperature (LST) in pre-and post-fire spatial analysis. Earth Sci. Inform. 2022, 16, 945–963. [Google Scholar] [CrossRef]
- Rehman, A.; Qin, J.; Pervez, A.; Khan, M.S.; Ullah, S.; Ahmad, K.; Rehman, N.U. Land-use/land cover changes contribute to land surface temperature: A case study of the Upper Indus Basin of Pakistan. Sustainability 2022, 14, 934. [Google Scholar] [CrossRef]
- Xin, J.; Yang, J.; Sun, D.; Han, T.; Song, C.; Shi, Z. Seasonal differences in land surface temperature under different land use/land cover types from the perspective of different climate zones. Land 2022, 11, 1122. [Google Scholar] [CrossRef]
- Karnieli, A.; Agam, N.; Pinker, R.T.; Anderson, M.; Imhoff, M.L.; Gutman, G.G.; Panov, N.; Goldberg, A. Use of NDVI and land surface temperature for drought assessment: Merits and limitations. J. Clim. 2010, 23, 618–633. [Google Scholar] [CrossRef]
- Rossi, J.B.; Ruhoff, A.; Fleischmann, A.S.; Laipelt, L. Drought Propagation in Brazilian Biomes Revealed by Remote Sensing. Remote Sens. 2023, 15, 454. [Google Scholar] [CrossRef]
- Arabi Aliabad, F.; Zare, M.; Ghafarian Malamiri, H. A comparative assessment of the accuracies of split-window algorithms for retrieving of land surface temperature using Landsat 8 data. Model. Earth Syst. Environ. 2021, 7, 2267–2281. [Google Scholar] [CrossRef]
- Li, Z.L.; Tang, B.H.; Wu, H.; Ren, H.; Yan, G.; Wan, Z.; Trigo, I.F.; Sobrino, J.A. Satellite-derived land surface temperature: Current status and perspectives. Remote Sens. Environ. 2013, 131, 14–37. [Google Scholar] [CrossRef] [Green Version]
- Hulley, G.C.; Ghent, D.; Göttsche, F.M.; Guillevic, P.C.; Mildrexler, D.J.; Coll, C. Land surface temperature. In Taking the Temperature of the Earth; Elsevier: Amsterdam, The Netherlands, 2019; pp. 57–127. [Google Scholar] [CrossRef]
- Georgiou, A.; Akçit, N. Comparison of MODIS-derived land surface temperature with air temperature measurements. In Proceedings of the Fifth International Conference on Remote Sensing and Geoinformation of the Environment (RSCy2017), Paphos, Cyprus, 20–23 March 2017; SPIE: Washington, DC, USA, 2017; Volume 10444, pp. 550–559. [Google Scholar]
- Benali, A.; Carvalho, A.C.; Nunes, J.P.; Carvalhais, N.; Santos, A. Estimating air surface temperature in Portugal using MODIS LST data. Remote Sens. Environ. 2012, 124, 108–121. [Google Scholar] [CrossRef]
- Ozelkan, E.; Bagis, S.; Ozelkan, E.C.; Ustundag, B.B.; Ormeci, C. Land surface temperature retrieval for climate analysis and association with climate data. Eur. J. Remote Sens. 2014, 47, 655–669. [Google Scholar] [CrossRef] [Green Version]
- Jiang, Y.; Lin, W. A Comparative Analysis of Retrieval Algorithms of Land Surface Temperature from Landsat-8 Data: A Case Study of Shanghai, China. Int. J. Environ. Res. Public Health 2021, 18, 5659. [Google Scholar] [CrossRef]
- Landsat 5. Available online: https://www.usgs.gov/landsat-missions/landsat-5 (accessed on 10 December 2022).
- Landsat 8. Available online: https://www.usgs.gov/landsat-missions/landsat-8 (accessed on 10 December 2022).
- MODIS. Available online: https://modis.gsfc.nasa.gov/data/dataprod/mod11.phd (accessed on 10 December 2022).
- Zhengming, W. Collection-6 MODIS Land Surface Temperature Products Users’ Guide, ERI; University of California: Santa Barbara, CA, USA, 2013. [Google Scholar]
- Gorelick, N.; Hancher, M.; Dixon, M.; Ilyushchenko, S.; Thau, D.; Moore, R. Google Earth Engine: Planetary-scale geospatial analysis for everyone. Remote Sens. Environ. 2017, 202, 18–27. [Google Scholar] [CrossRef]
- Weathersparke. Available online: https://tr.weatherspark.com/y/95434/%C4%B0stanbul-T%C3%BCrkiye-Ortalama-Hava-Durumu-Y%C4%B1l-Boyunca (accessed on 20 December 2022).
- Earth Explorer. Available online: https://earthexplorer.usgs.gov/ (accessed on 14 December 2022).
- MGM. Available online: https://mgm.gov.tr/kurumsal/istasyonlarimiz.aspx?il=%C4%B0stanbul (accessed on 20 December 2022).
- Qin, Z.; Karnieli, A.; Berliner, P. A mono-window algorithm for retrieving land surface temperature from Landsat TM data and its application to the Israel-Egypt border region. Int. J. Remote Sens. 2001, 22, 3719–3746. [Google Scholar] [CrossRef]
- Wan, Z.; Dozier, J. A generalized split-window algorithm for retrieving land-surface temperature from space. IEEE Trans. Geosci. Remote Sens. 1996, 34, 892–905. [Google Scholar] [CrossRef] [Green Version]
- Mao, K.; Qin, Z.; Shi, J.; Gong, P. A practical split-window algorithm for retrieving land-surface temperature from MODIS data. Int. J. Remote Sens. 2005, 26, 3181–3204. [Google Scholar] [CrossRef]
- Jiménez-Muñoz, J.C.; Cristóbal, J.; Sobrino, J.A.; Sòria, G.; Ninyerola, M.; Pons, X. Revision of the single-channel algorithm for land surface temperature retrieval from Landsat thermal-infrared data. IEEE Trans. Geosci. Remote Sens. 2008, 47, 339–349. [Google Scholar] [CrossRef]
- Price, J.C. Estimating surface temperatures from satellite thermal infrared data—A simple formulation for the atmospheric effect. Remote Sens. Environ. 1983, 13, 353–361. [Google Scholar] [CrossRef]
- Becker, F.; Li, Z.L. Temperature-independent spectral indices in thermal infrared bands. Remote Sens. Environ. 1990, 32, 17–33. [Google Scholar] [CrossRef]
- Isaya Ndossi, M.; Avdan, U. Application of open source coding technologies in the production of land surface temper-ature (LST) maps from Landsat: A PyQGIS plugin. Remote Sens. 2016, 8, 413. [Google Scholar] [CrossRef] [Green Version]
- Chaulya, S.; Prasad, G.M. Sensing and Monitoring Technologies for Mines and Hazardous Areas: Monitoring and Prediction Technologies; Elsevier: Amsterdam, The Netherlands, 2016. [Google Scholar]
- Çolak, E.; Sunar, F. Yüzey Sıcaklığı ve Spektral Yanma Indekslerinin Orman Yangını Analizinde Kullanımı. VII; Uzaktan Algılama-CBS Sempozyumu: Eskisehir, Turkey, 2018; pp. 311–320. [Google Scholar]
- USGS. Available online: https://www.usgs.gov/landsat-missions/using-usgs-landsat-level-1-data-product (accessed on 14 December 2022).
- Valor, E.; Caselles, V. Mapping land surface emissivity from NDVI: Application to European, African, and South American areas. Remote Sens. Environ. 1996, 57, 167–184. [Google Scholar] [CrossRef]
- Sekertekin, A.; Bonafoni, S. Sensitivity analysis and validation of daytime and nighttime land surface temperature retrievals from Landsat 8 using different algorithms and emissivity models. Remote Sens. 2020, 12, 2776. [Google Scholar] [CrossRef]
- Vlassova, L.; Perez-Cabello, F.; Nieto, H.; Martín, P.; Riaño, D.; De La Riva, J. Assessment of methods for land surface temperature retrieval from Landsat-5 TM images applicable to multiscale tree-grass ecosystem modeling. Remote Sens. 2014, 6, 4345–4368. [Google Scholar] [CrossRef] [Green Version]
- Xu, H.; Deng, Y. Dependent evidence combination based on shearman coefficient and pearson coefficient. IEEE Access 2017, 6, 11634–11640. [Google Scholar] [CrossRef]
- Shirsath, P.B.; Singh, A.K. A comparative study of daily pan evaporation estimation using ANN, regression and climate based models. Water Resour. Manag. 2010, 24, 1571–1581. [Google Scholar] [CrossRef]
- Cuemath. Available online: https://www.cuemath.com/p-value-formula/ (accessed on 21 January 2023).


| Satellite | Spectral Resolution (µm) | Spatial Resolution (m) | Temporal Resolution (Day) | Radiometric Resolution (Bit) |
|---|---|---|---|---|
| Landsat 5 TM | 6 Optical Bands (0.45–2.35) | 30 m | 16 | 8 |
| 1 Thermal Band (10.40–12.50) | 120 m | |||
| Landsat 8 OLI/TIRS | 9 Optical Bands (0.43–2.30) | 30 m 15 m | 16 | 16 |
| 2 Thermal Bands (10.60–12.51) | 100 m | |||
| Earth Science Data Type | Spectral Resolution (µm) | Spatial Resolution | Temporal Resolution | Number Type |
| MOD11A1 | 2 Thermal Bands (31, 32) (10.780–12.270) | 1 km (actual, 0.928 km) | Daily (daytime) | Uint 16 (unsigned integer number) |
| NDVI Threshold | Land Cover Type | Surface Emissivity |
|---|---|---|
| NDVI < 0 | Water | 0.985 |
| 0 ≤ NDVI ≤ 0.1 | Bare soil | ρR (red reflectance band) |
| 0.1 ≤ NDVI ≤ 0.7 | Vegetation mixed with soil | 0.990 + 0.984(1 − ) + 0.04(1 − ) |
| NDVI > 0.7 | Vegetation | 0.990 |
| Data (Mean, °C) | 26 July 2000 | 3 July 2003 | 19 July 2009 | 30 July 2013 | 9 July 2017 | 23 July 2022 |
|---|---|---|---|---|---|---|
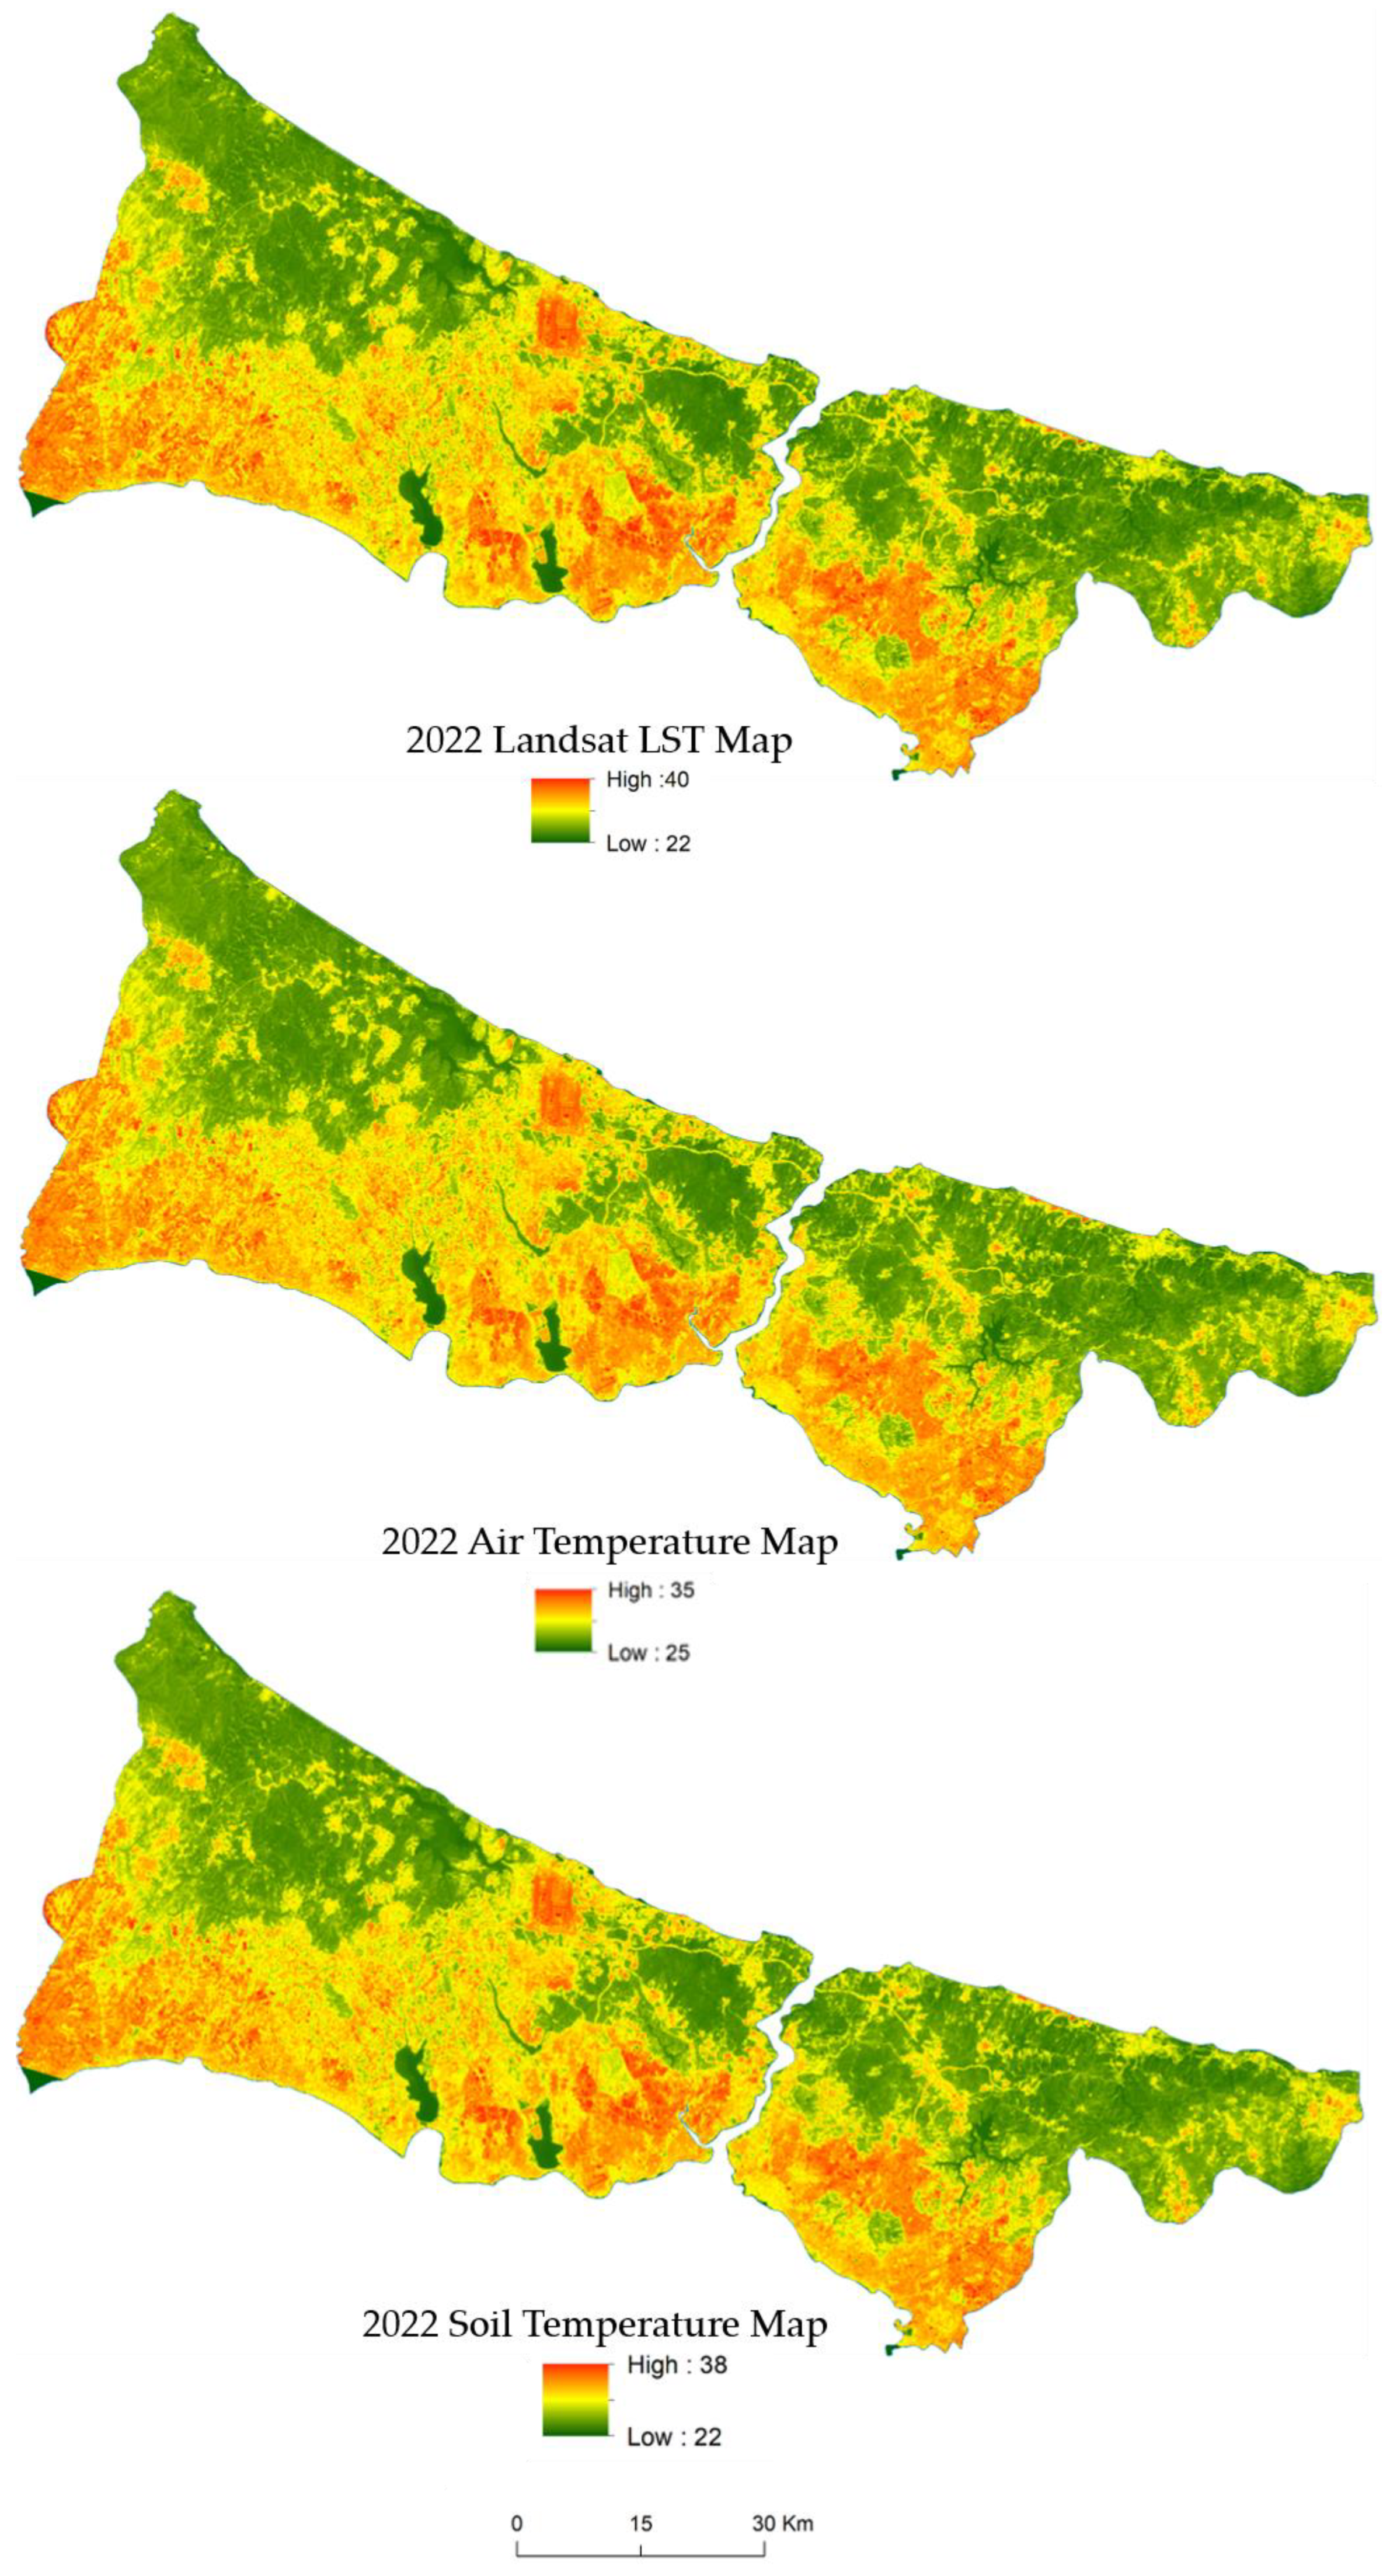
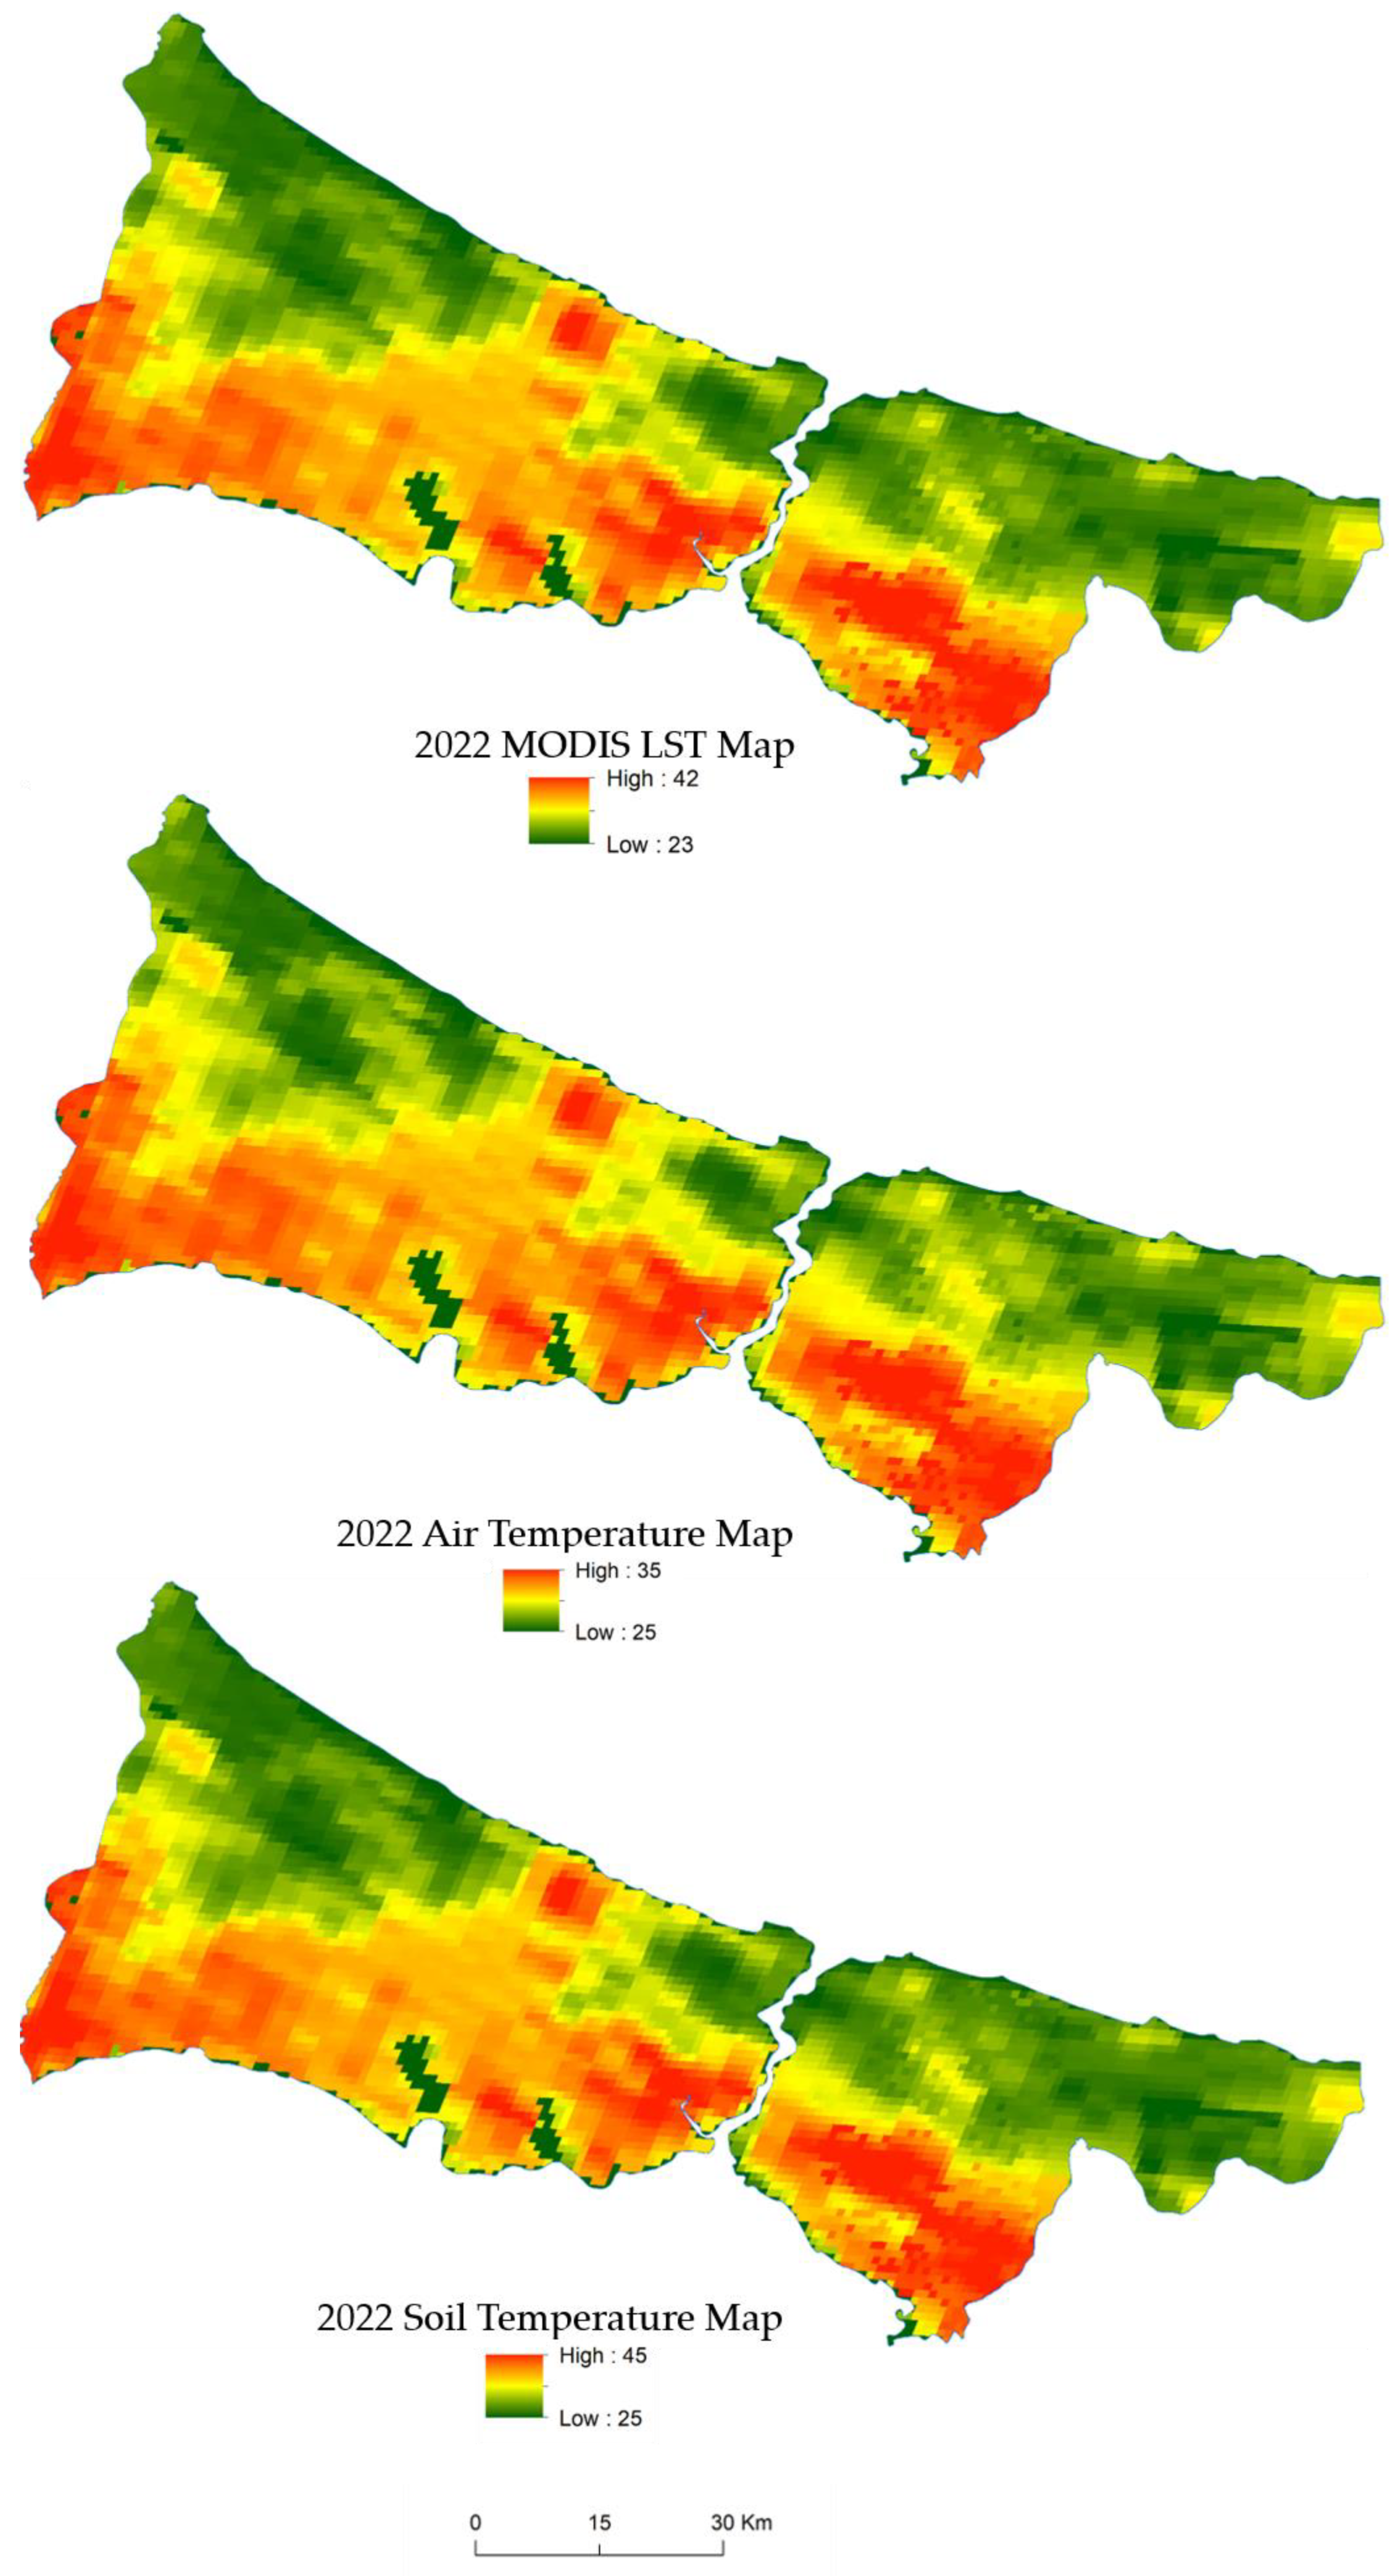
| MODIS LST | 33.16 | 36.55 | 32.86 | 34.45 | 30.52 | 31.08 |
| Landsat LST | 31.52 | 34.28 | 29.04 | 32.4 | 29.04 | 30.47 |
| Difference, Δ | 1.64 | 2.27 | 3.82 | 2.05 | 1.48 | 0.61 |
| Satellite Data | Meteorological Station Data | Year | Σ Point | r2 | p |
|---|---|---|---|---|---|
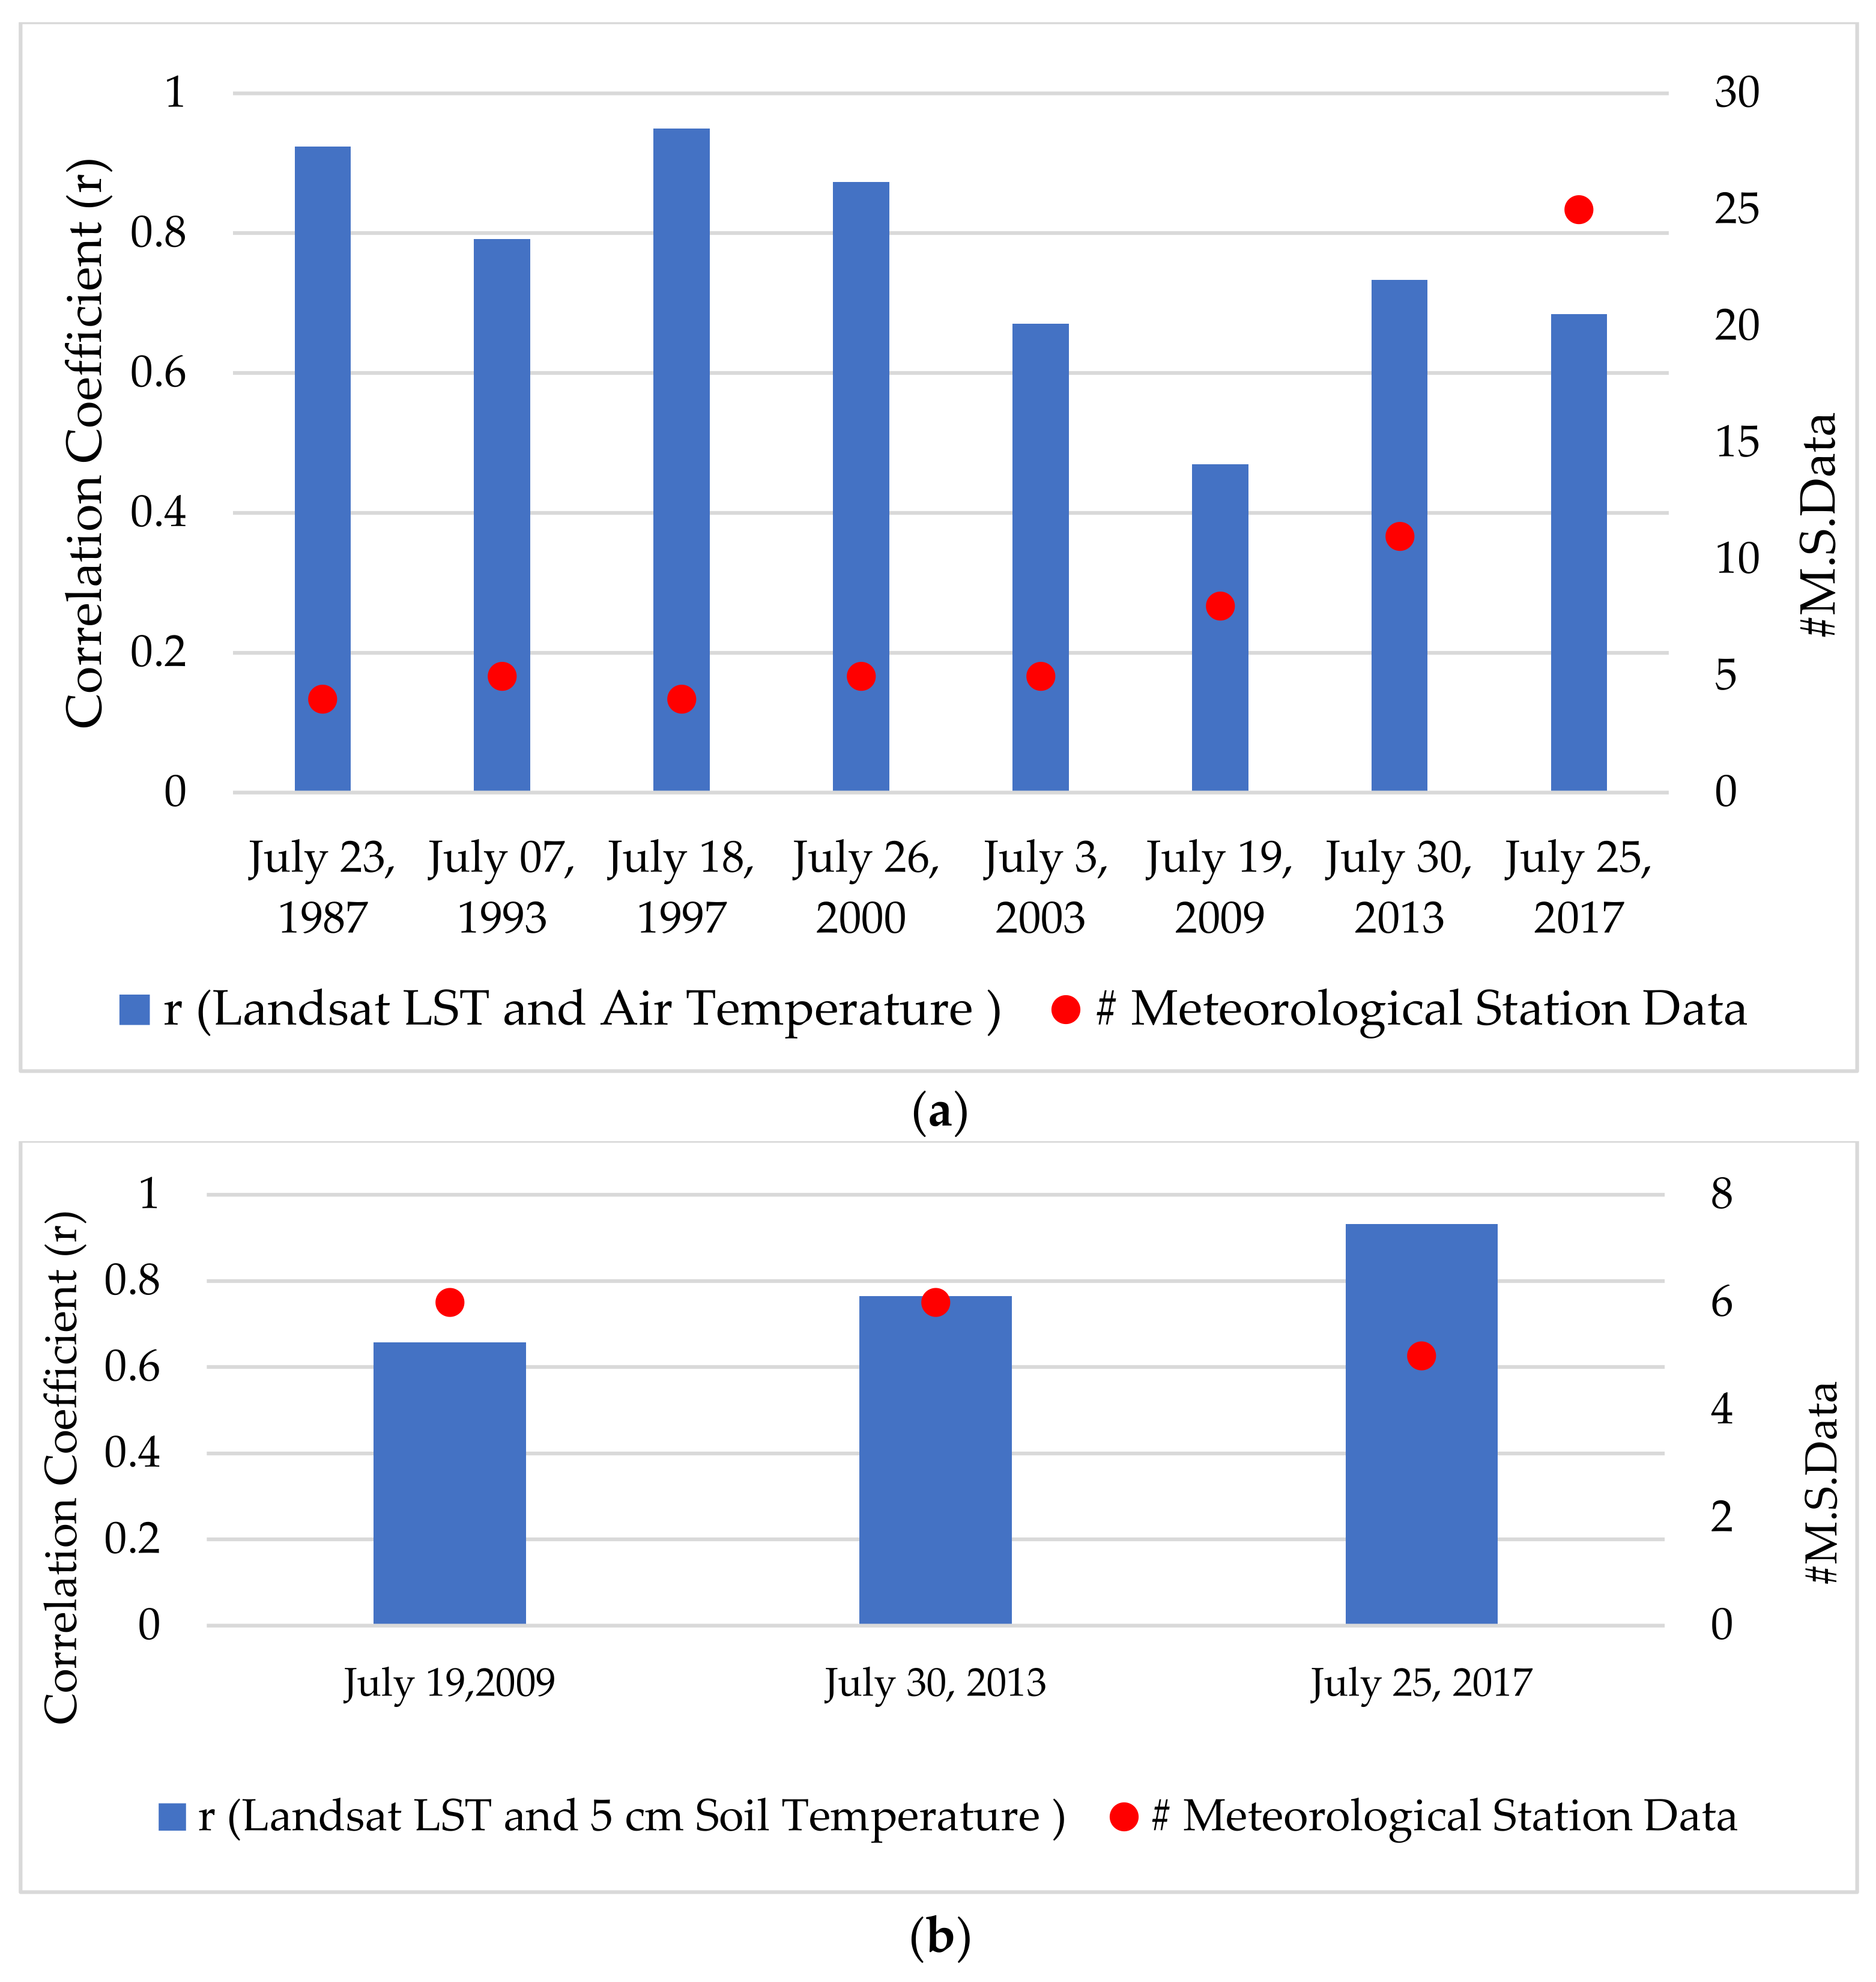
| Landsat LST | Air Temperature | 1987 | 4 | 0.85 | 0.0761 |
| 1993 | 5 | 0.63 | 0.1107 | ||
| 1997 | 4 | 0.90 | 0.0500 | ||
| 2000 | 5 | 0.76 | 0.0533 | ||
| 2003 | 5 | 0.45 | 0.2158 | ||
| 2009 | 8 | 0.22 | 0.2403 | ||
| 2013 | 11 | 0.54 | 0.0103 | ||
| 2017 | 25 | 0.47 | 0.0001 | ||
| Total (8 years) | 68 | 0.53 | 2.52 × 10⁻¹² | ||
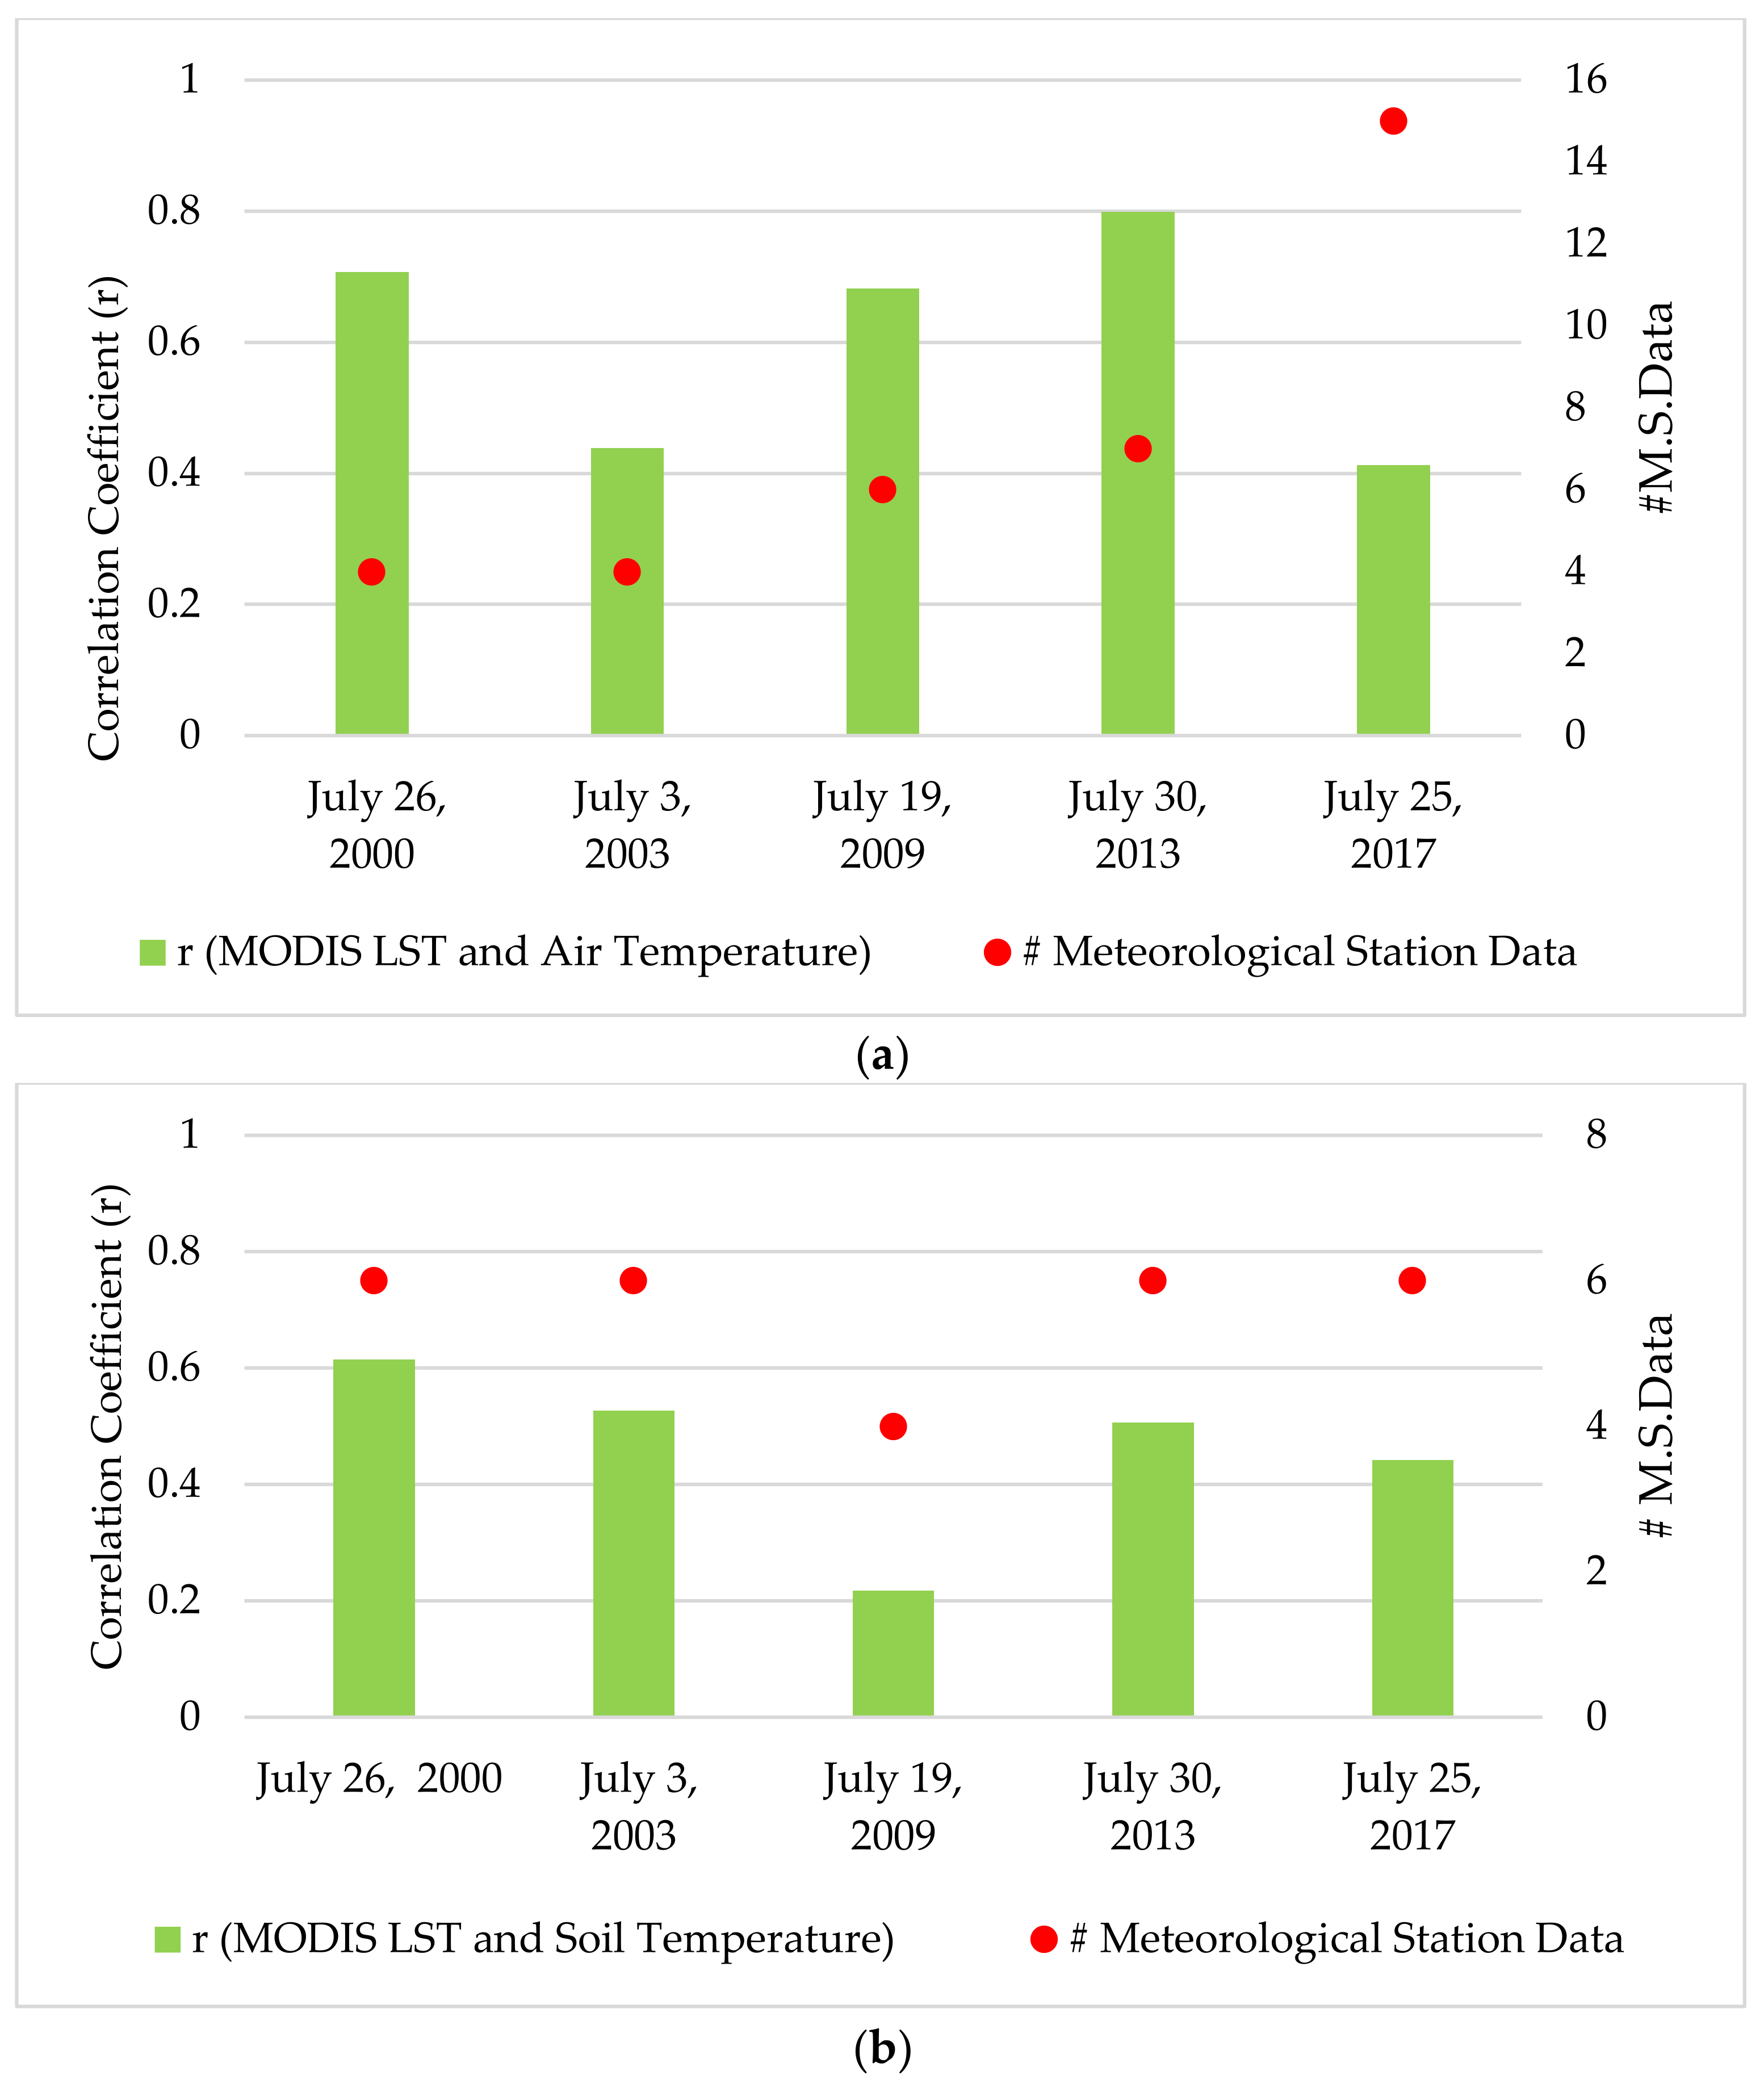
| MODIS LST | Air Temperature | 2000 | 6 | 0.50 | 0.1159 |
| 2003 | 6 | 0.19 | 0.3837 | ||
| 2009 | 8 | 0.47 | 0.0625 | ||
| 2013 | 11 | 0.64 | 0.0032 | ||
| 2017 | 25 | 0.17 | 0.0363 | ||
| Total (5 years) | 56 | 0.26 | 0.00005 | ||
| Landsat LST | 5 cm Soil Temperature | 2009 | 5 | 0.87 | 0.0208 |
| 2013 | 6 | 0.58 | 0.0766 | ||
| 2017 | 6 | 0.58 | 0.0766 | ||
| Total (3 years) | 17 | 0.50 | 0.0016 | ||
| MODIS LST | 5 cm Soil Temperature | 2000 | 6 | 0.38 | 0.1944 |
| 2003 | 6 | 0.28 | 0.2824 | ||
| 2009 | 4 | 0.05 | 0.7828 | ||
| 2013 | 6 | 0.26 | 0.3051 | ||
| 2017 | 6 | 0.20 | 0.3800 | ||
| Total (5 years) | 28 | 0.44 | 0.00012 |
| Parameters | Data | Year | Linear Regression Models | RMSE (°C) |
|---|---|---|---|---|
| Air Temperature | Landsat LST 2022 | 1997 | y = −0.7436x + 42.293 r2 = 0.9024 | 10.95 |
| 2013 | y = 0.6355x + 9.5679 r2 = 0.5373 | 1.42 | ||
| 2017 | y = 0.4099x + 16.685 r2 = 0.4686 | 1.25 | ||
| All (8 years) | y = 0.4952x + 14.295 r2 = 0.5268 | 1.35 | ||
| Air Temperature | MODIS LST 2022 | 2013 | y = 0.6725x + 9.0265 r2 = 0.6383 | 8.54 |
| 2017 | y = 0.2468x + 22.842 r2 = 0.1602 | 1.35 | ||
| All (5 years) | y = 0.3443x + 19.914 r2 = 0.2585 | 1.26 | ||
| 5 cm Soil Temperature | Landsat LST 2022 | 2009 | y = 3.8288x − 83.763 r2 = 0.8696 | 9.32 |
| All (3 years) | y = 0.839x + 3.7863 r2 = 0.4977 | 3.28 | ||
| 5 cm Soil Temperature | MODIS LST 2022 | All (5 years) | y = 1.7682x − 19.925 r2 = 0.4395 | 9.05 |
Disclaimer/Publisher’s Note: The statements, opinions and data contained in all publications are solely those of the individual author(s) and contributor(s) and not of MDPI and/or the editor(s). MDPI and/or the editor(s) disclaim responsibility for any injury to people or property resulting from any ideas, methods, instructions or products referred to in the content. |
© 2023 by the author. Licensee MDPI, Basel, Switzerland. This article is an open access article distributed under the terms and conditions of the Creative Commons Attribution (CC BY) license (https://creativecommons.org/licenses/by/4.0/).
Share and Cite
Dervisoglu, A. Investigation of the Efficiency of Satellite-Derived LST Data for Mapping the Meteorological Parameters in Istanbul. Atmosphere 2023, 14, 644. https://doi.org/10.3390/atmos14040644
Dervisoglu A. Investigation of the Efficiency of Satellite-Derived LST Data for Mapping the Meteorological Parameters in Istanbul. Atmosphere. 2023; 14(4):644. https://doi.org/10.3390/atmos14040644
Chicago/Turabian StyleDervisoglu, Adalet. 2023. "Investigation of the Efficiency of Satellite-Derived LST Data for Mapping the Meteorological Parameters in Istanbul" Atmosphere 14, no. 4: 644. https://doi.org/10.3390/atmos14040644