
Urban Heat Mitigation towards Climate Change Adaptation: An Eco-Sustainable Design Strategy to Improve Environmental Performance under Rapid Urbanization

 ,
,
Abstract
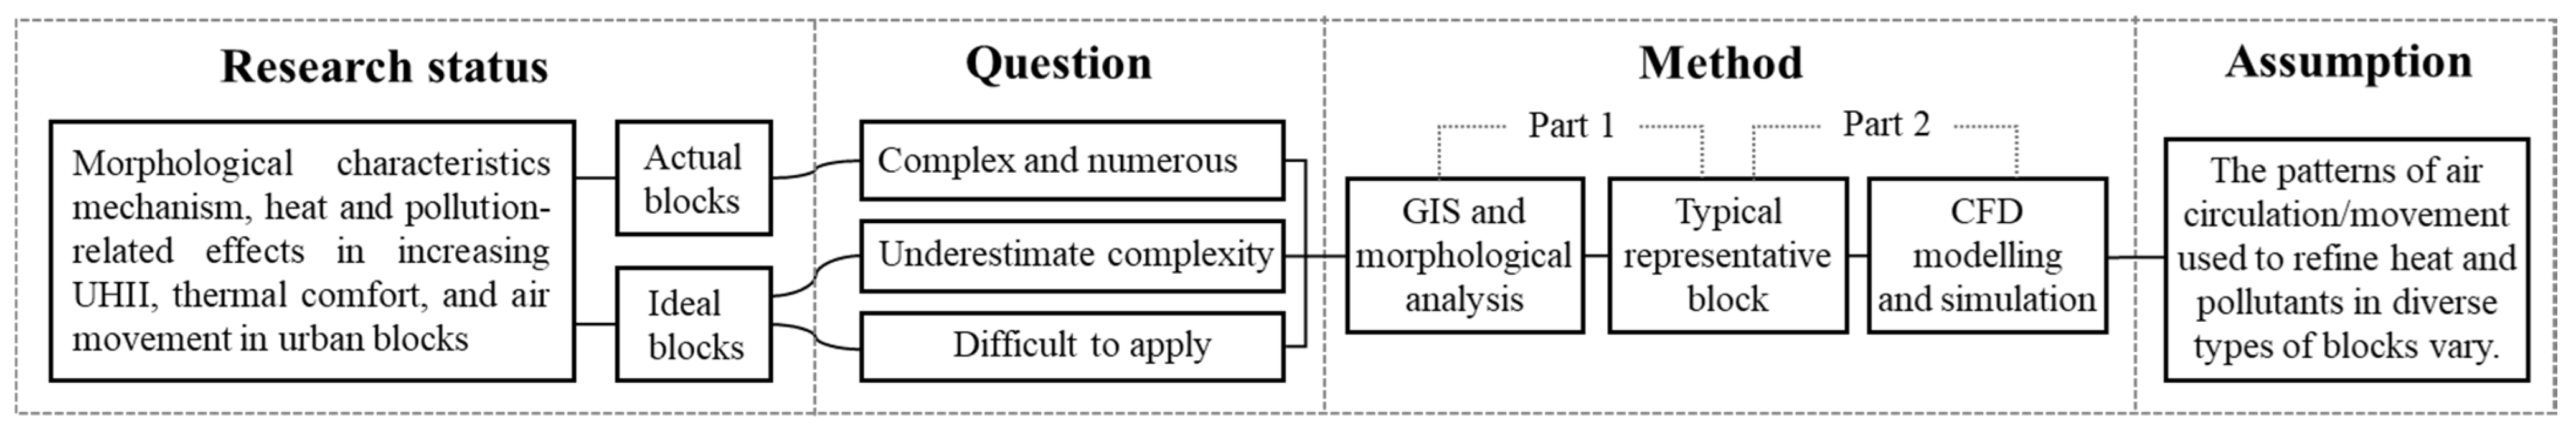
:1. Introduction
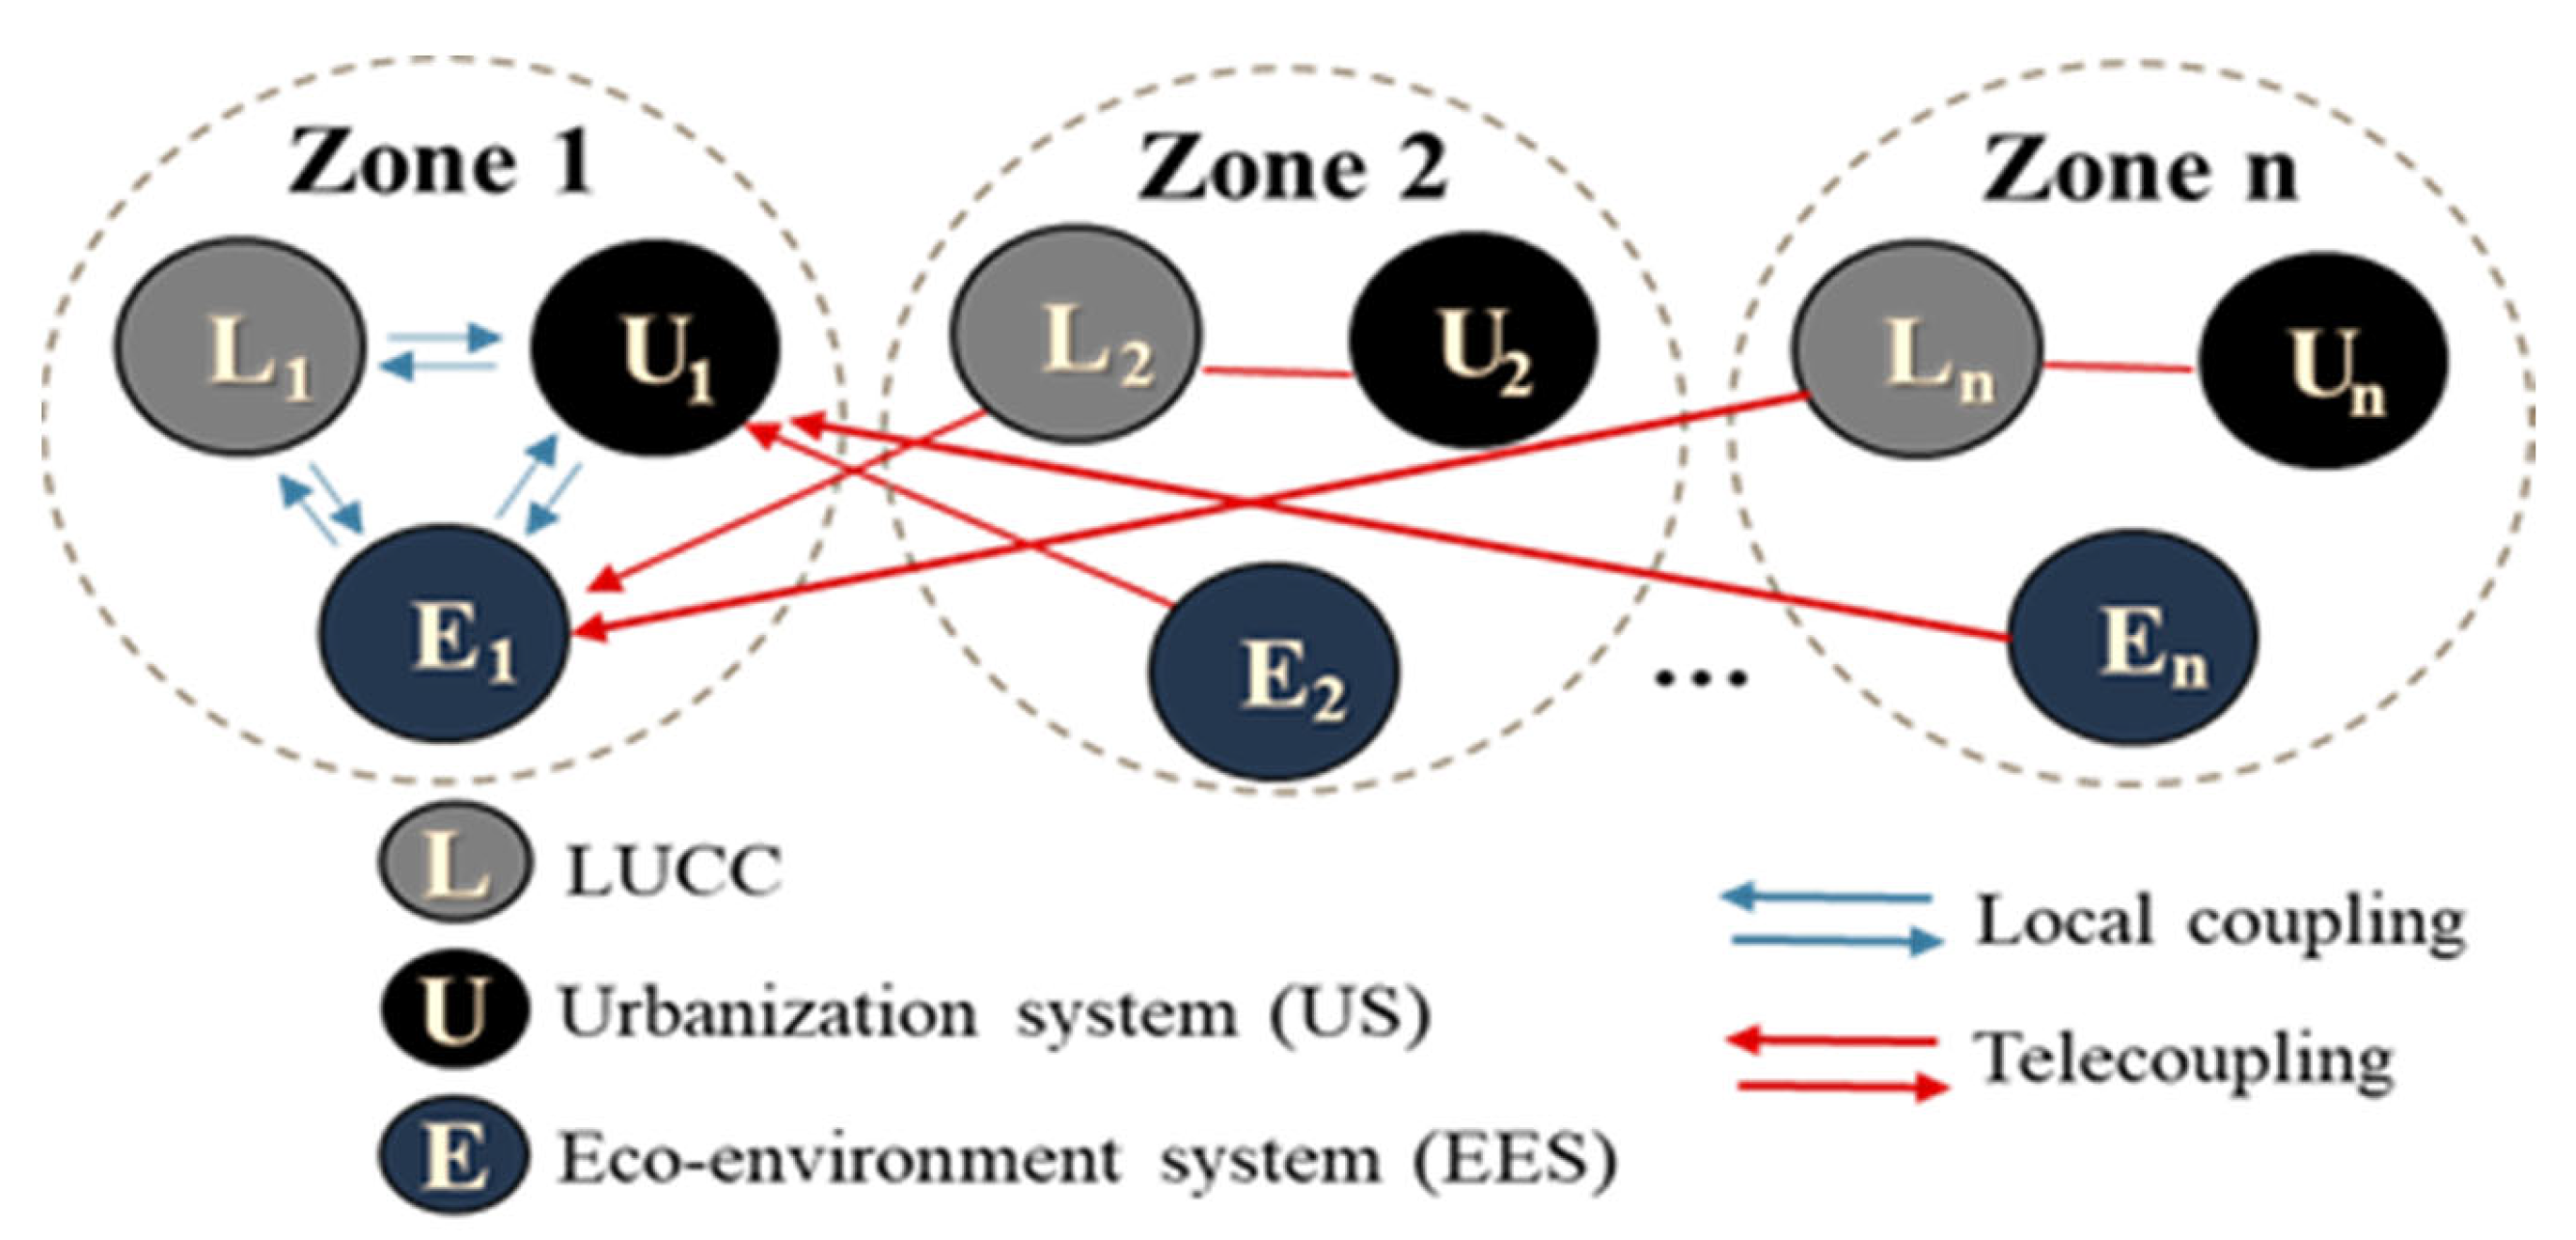
2. Materials and Methods
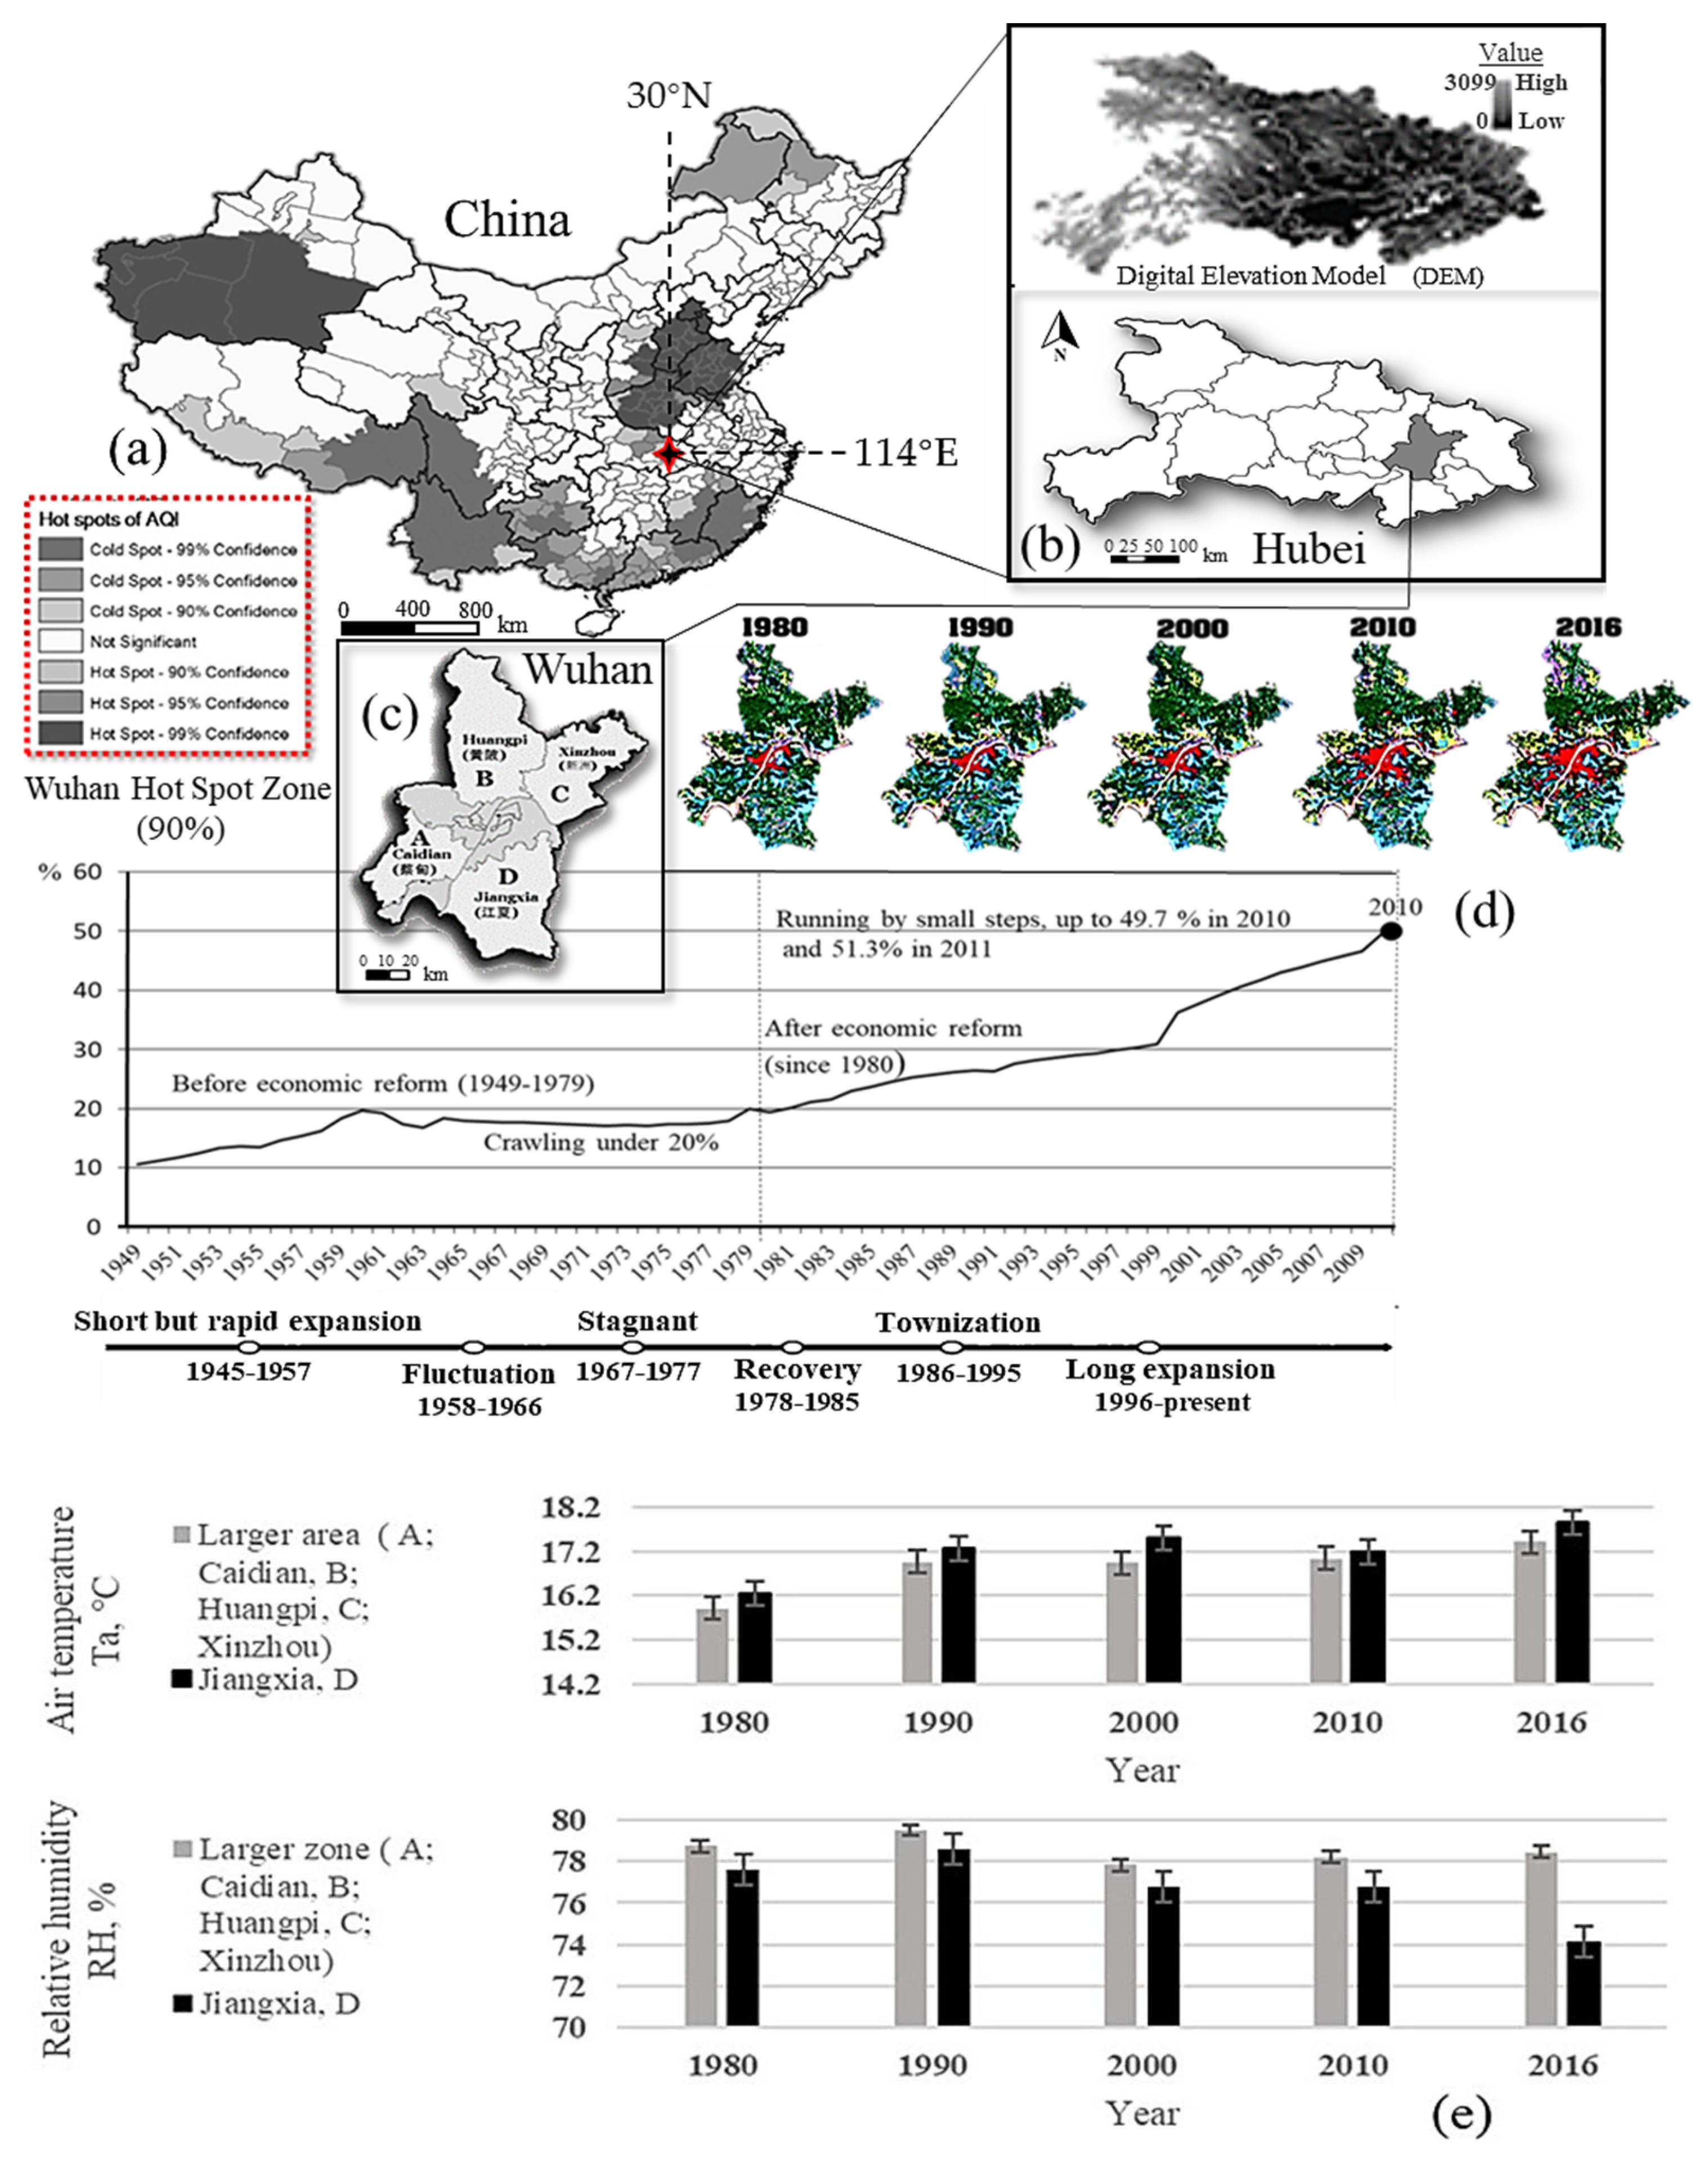
2.1. Study Area
2.2. GIS and LUCC Long-Term Observation along with Meteorological Data Analysis (1980–2016)
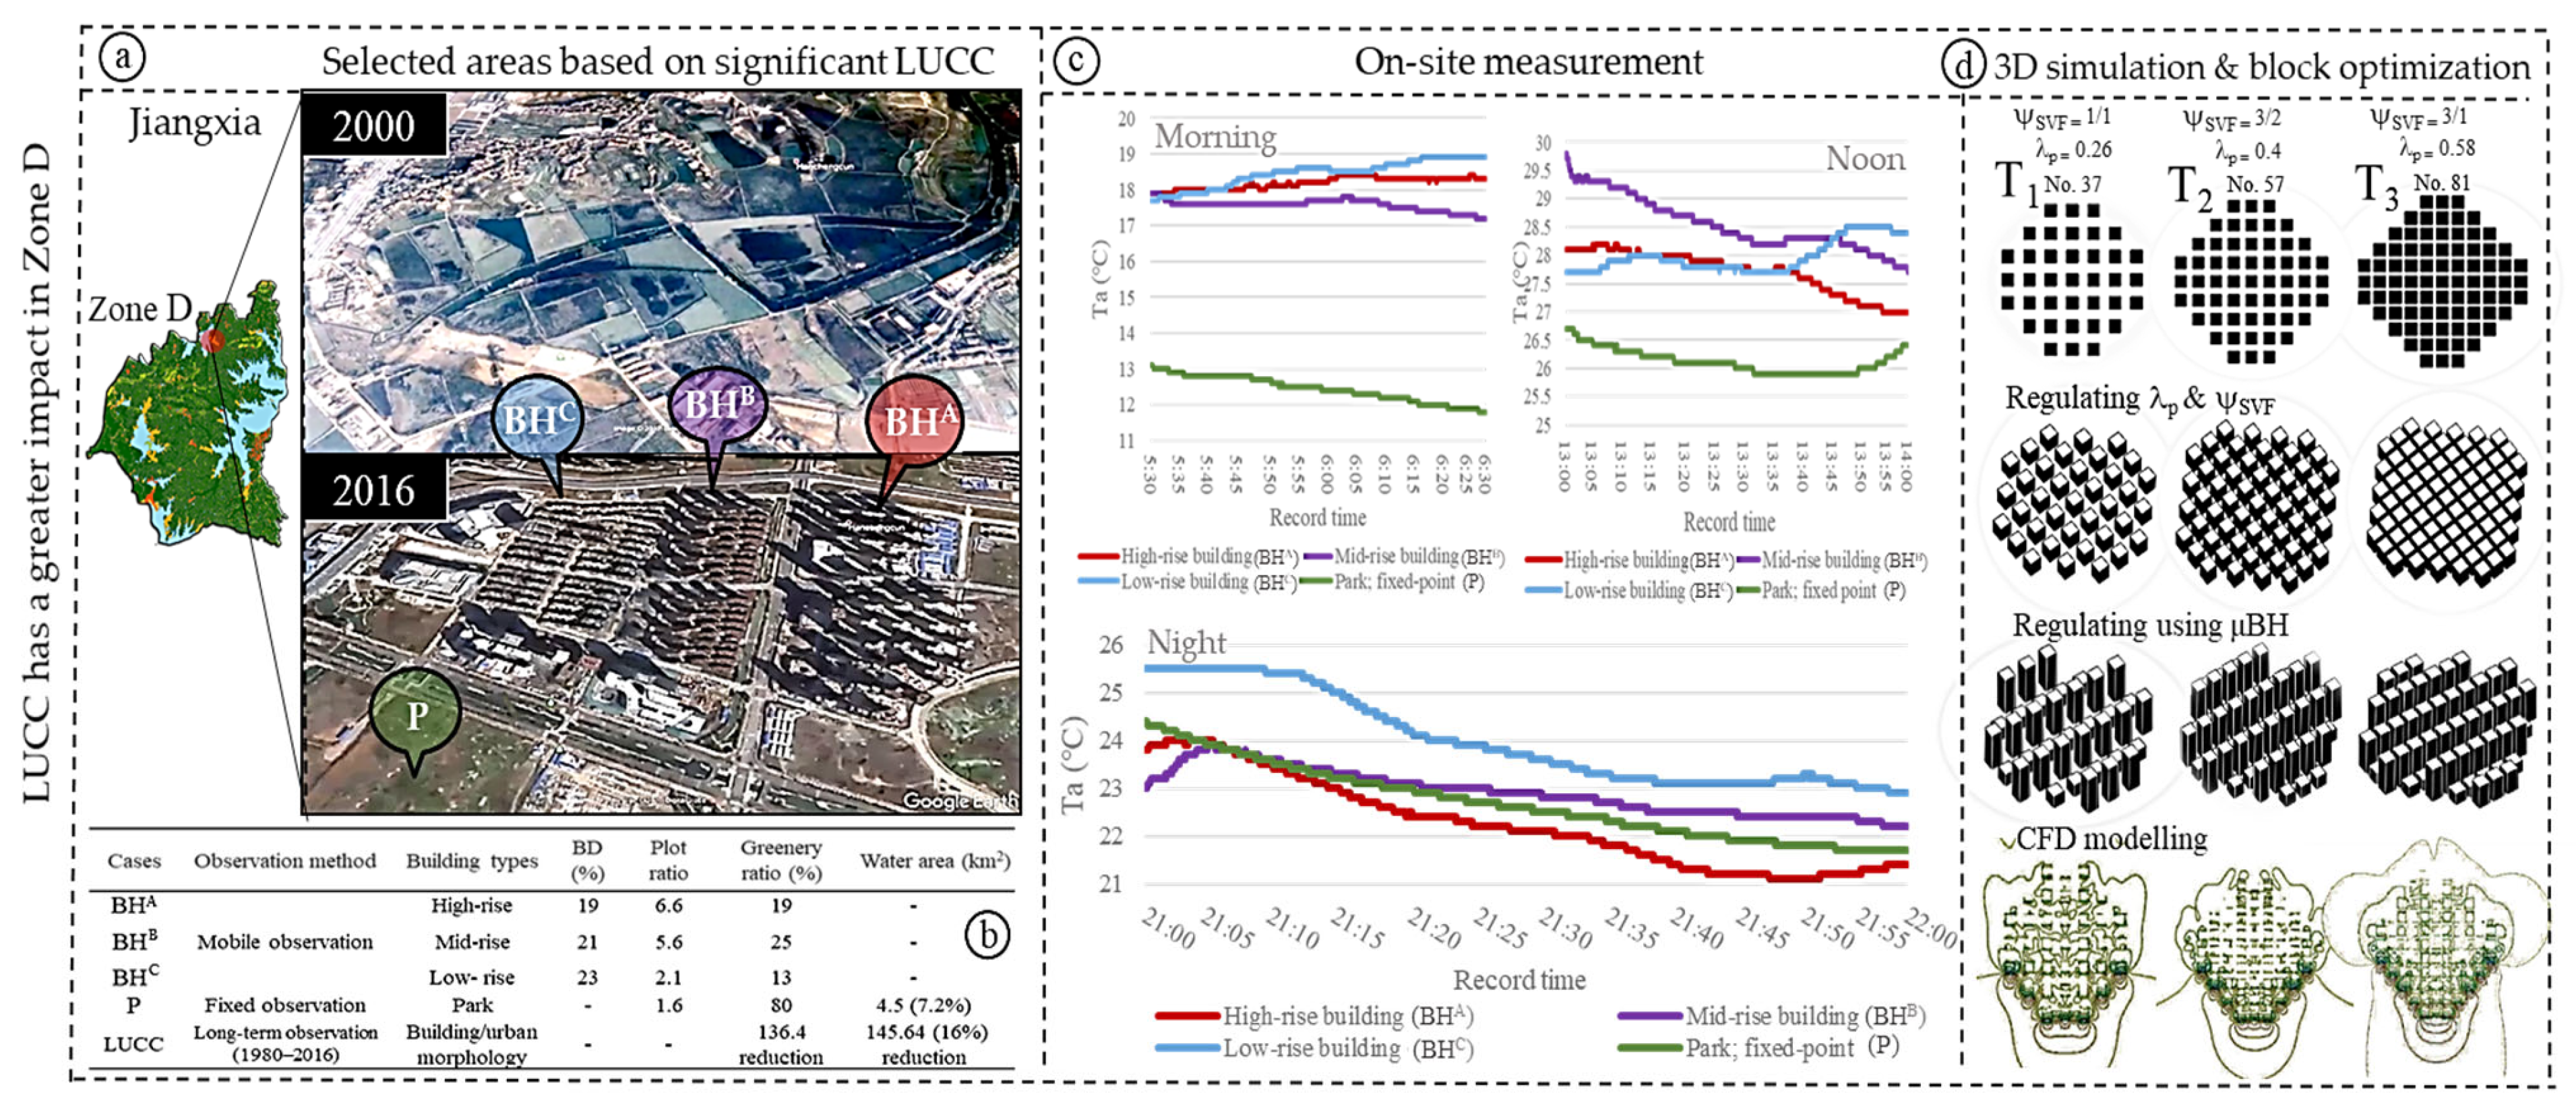
2.3. Comparative Analysis of Developing Areas and Site Selection
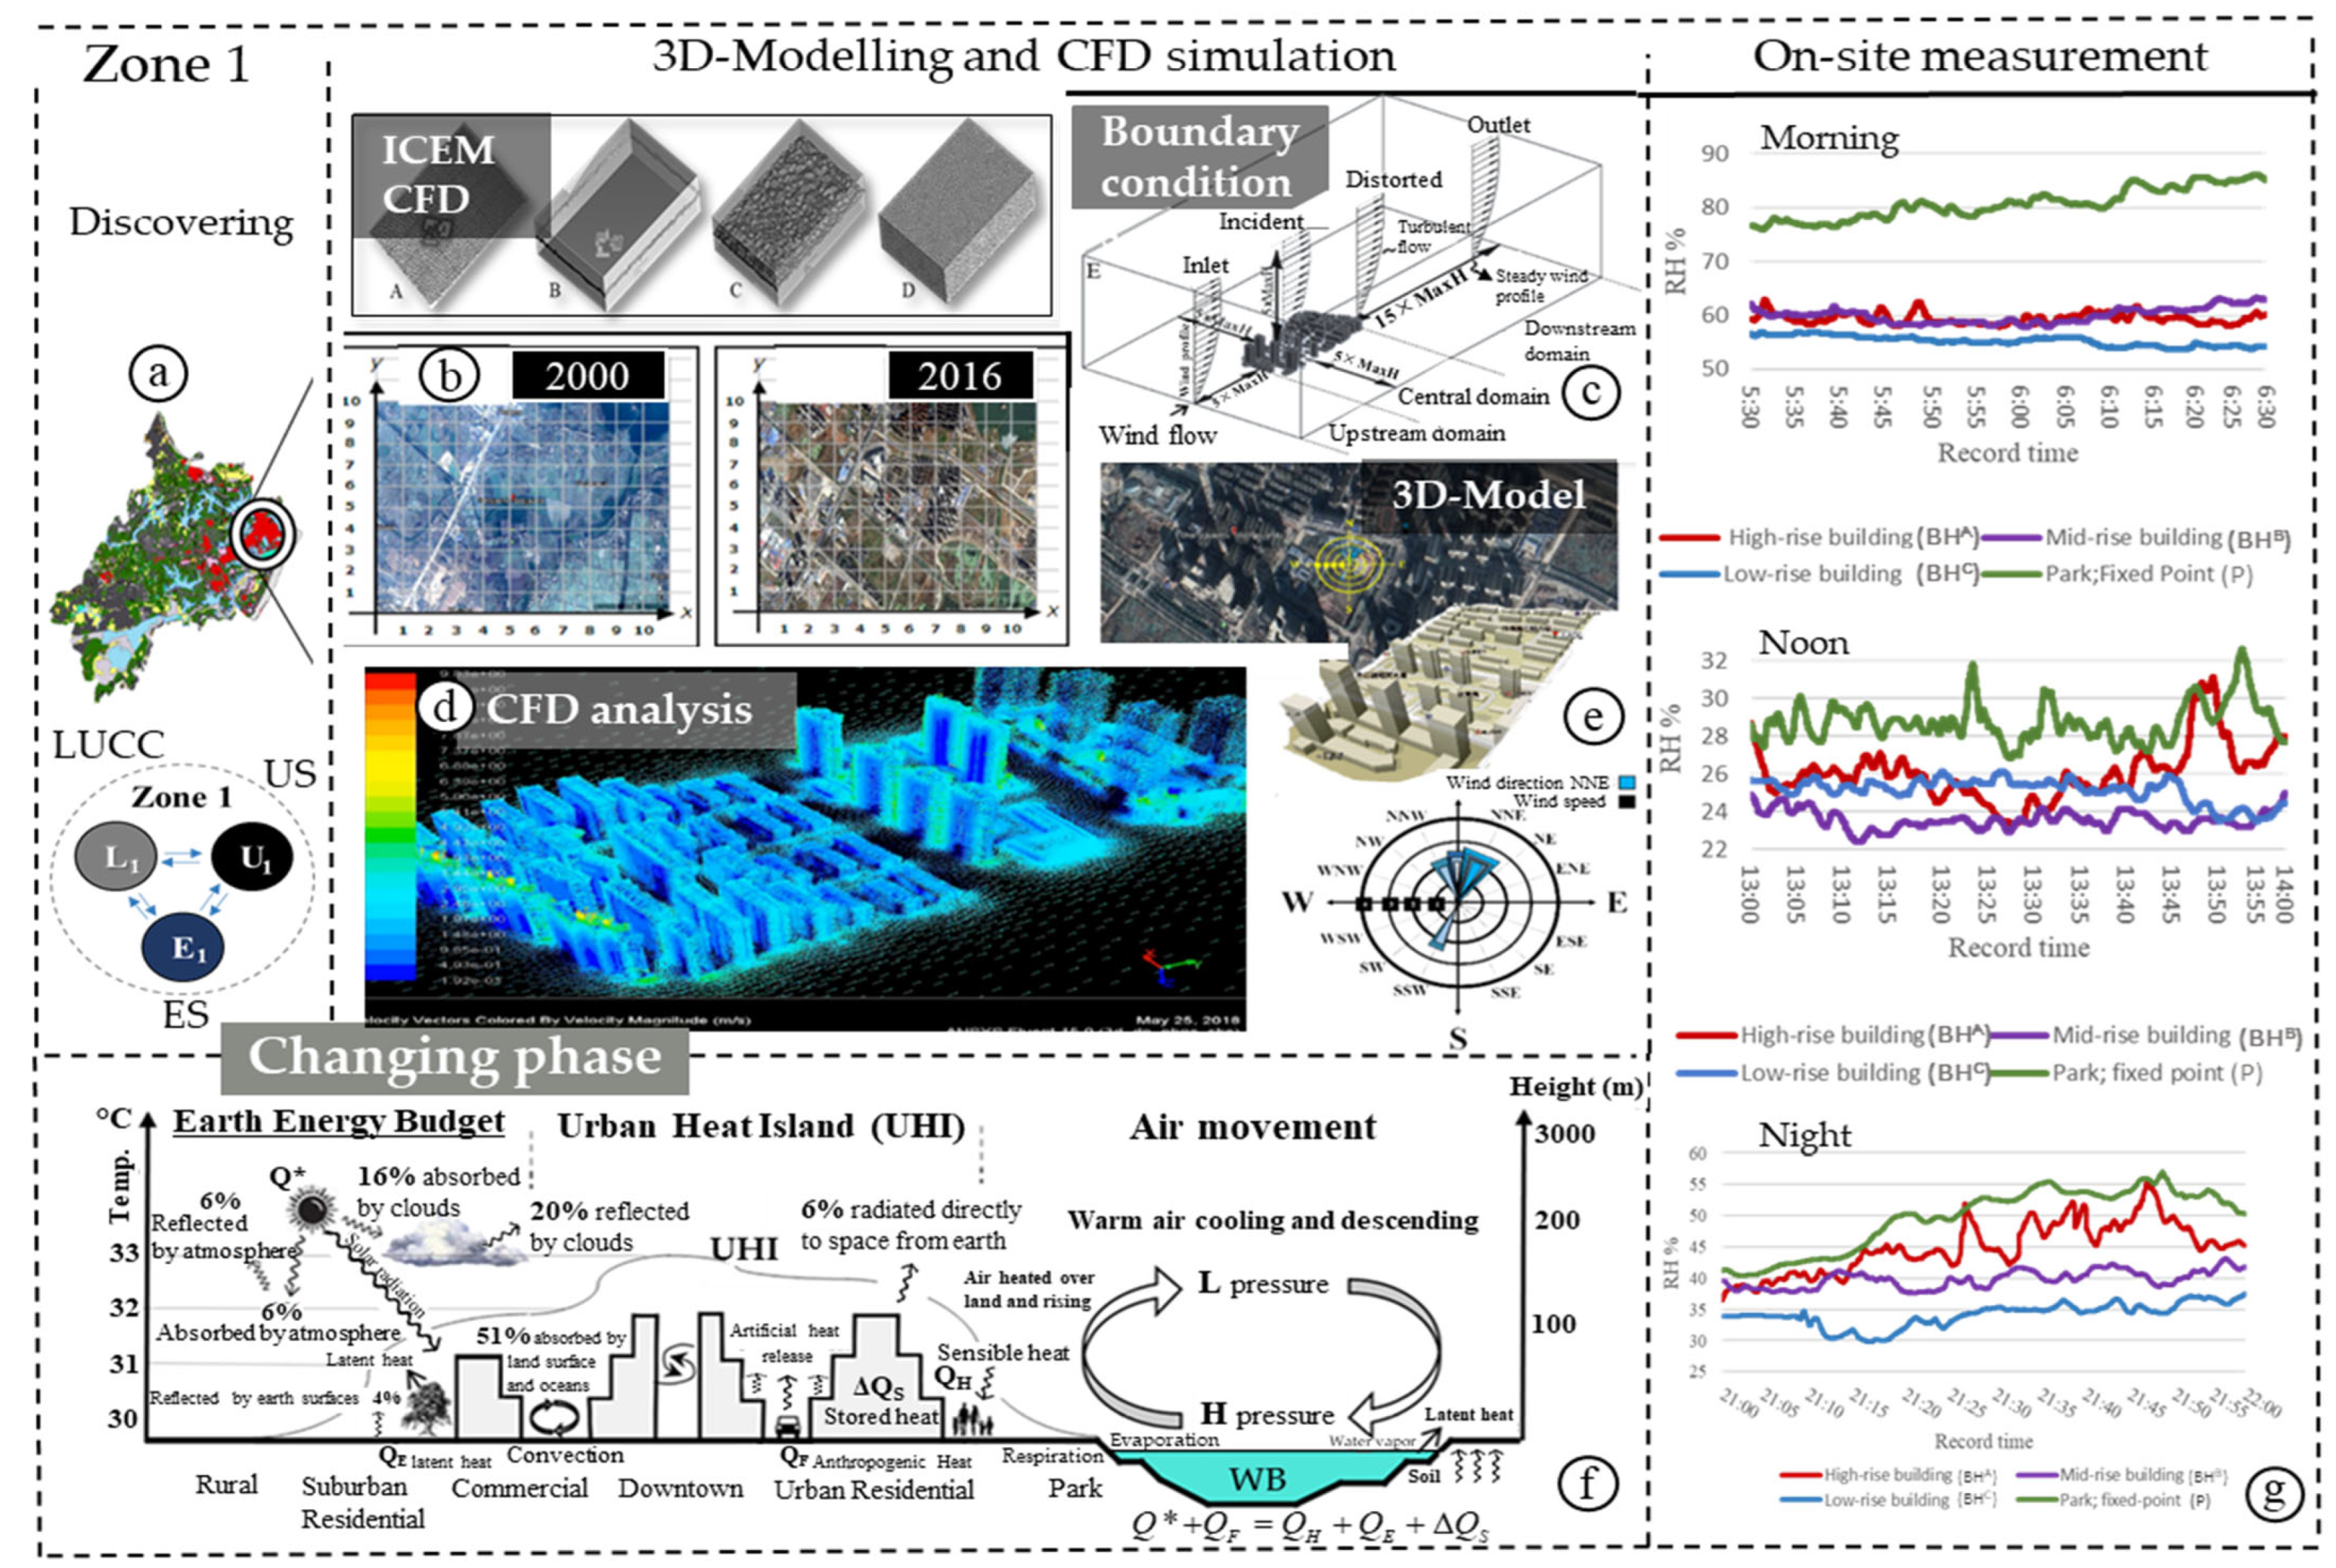
2.4. On-Site Fixed and Mobile Observation and Measurements
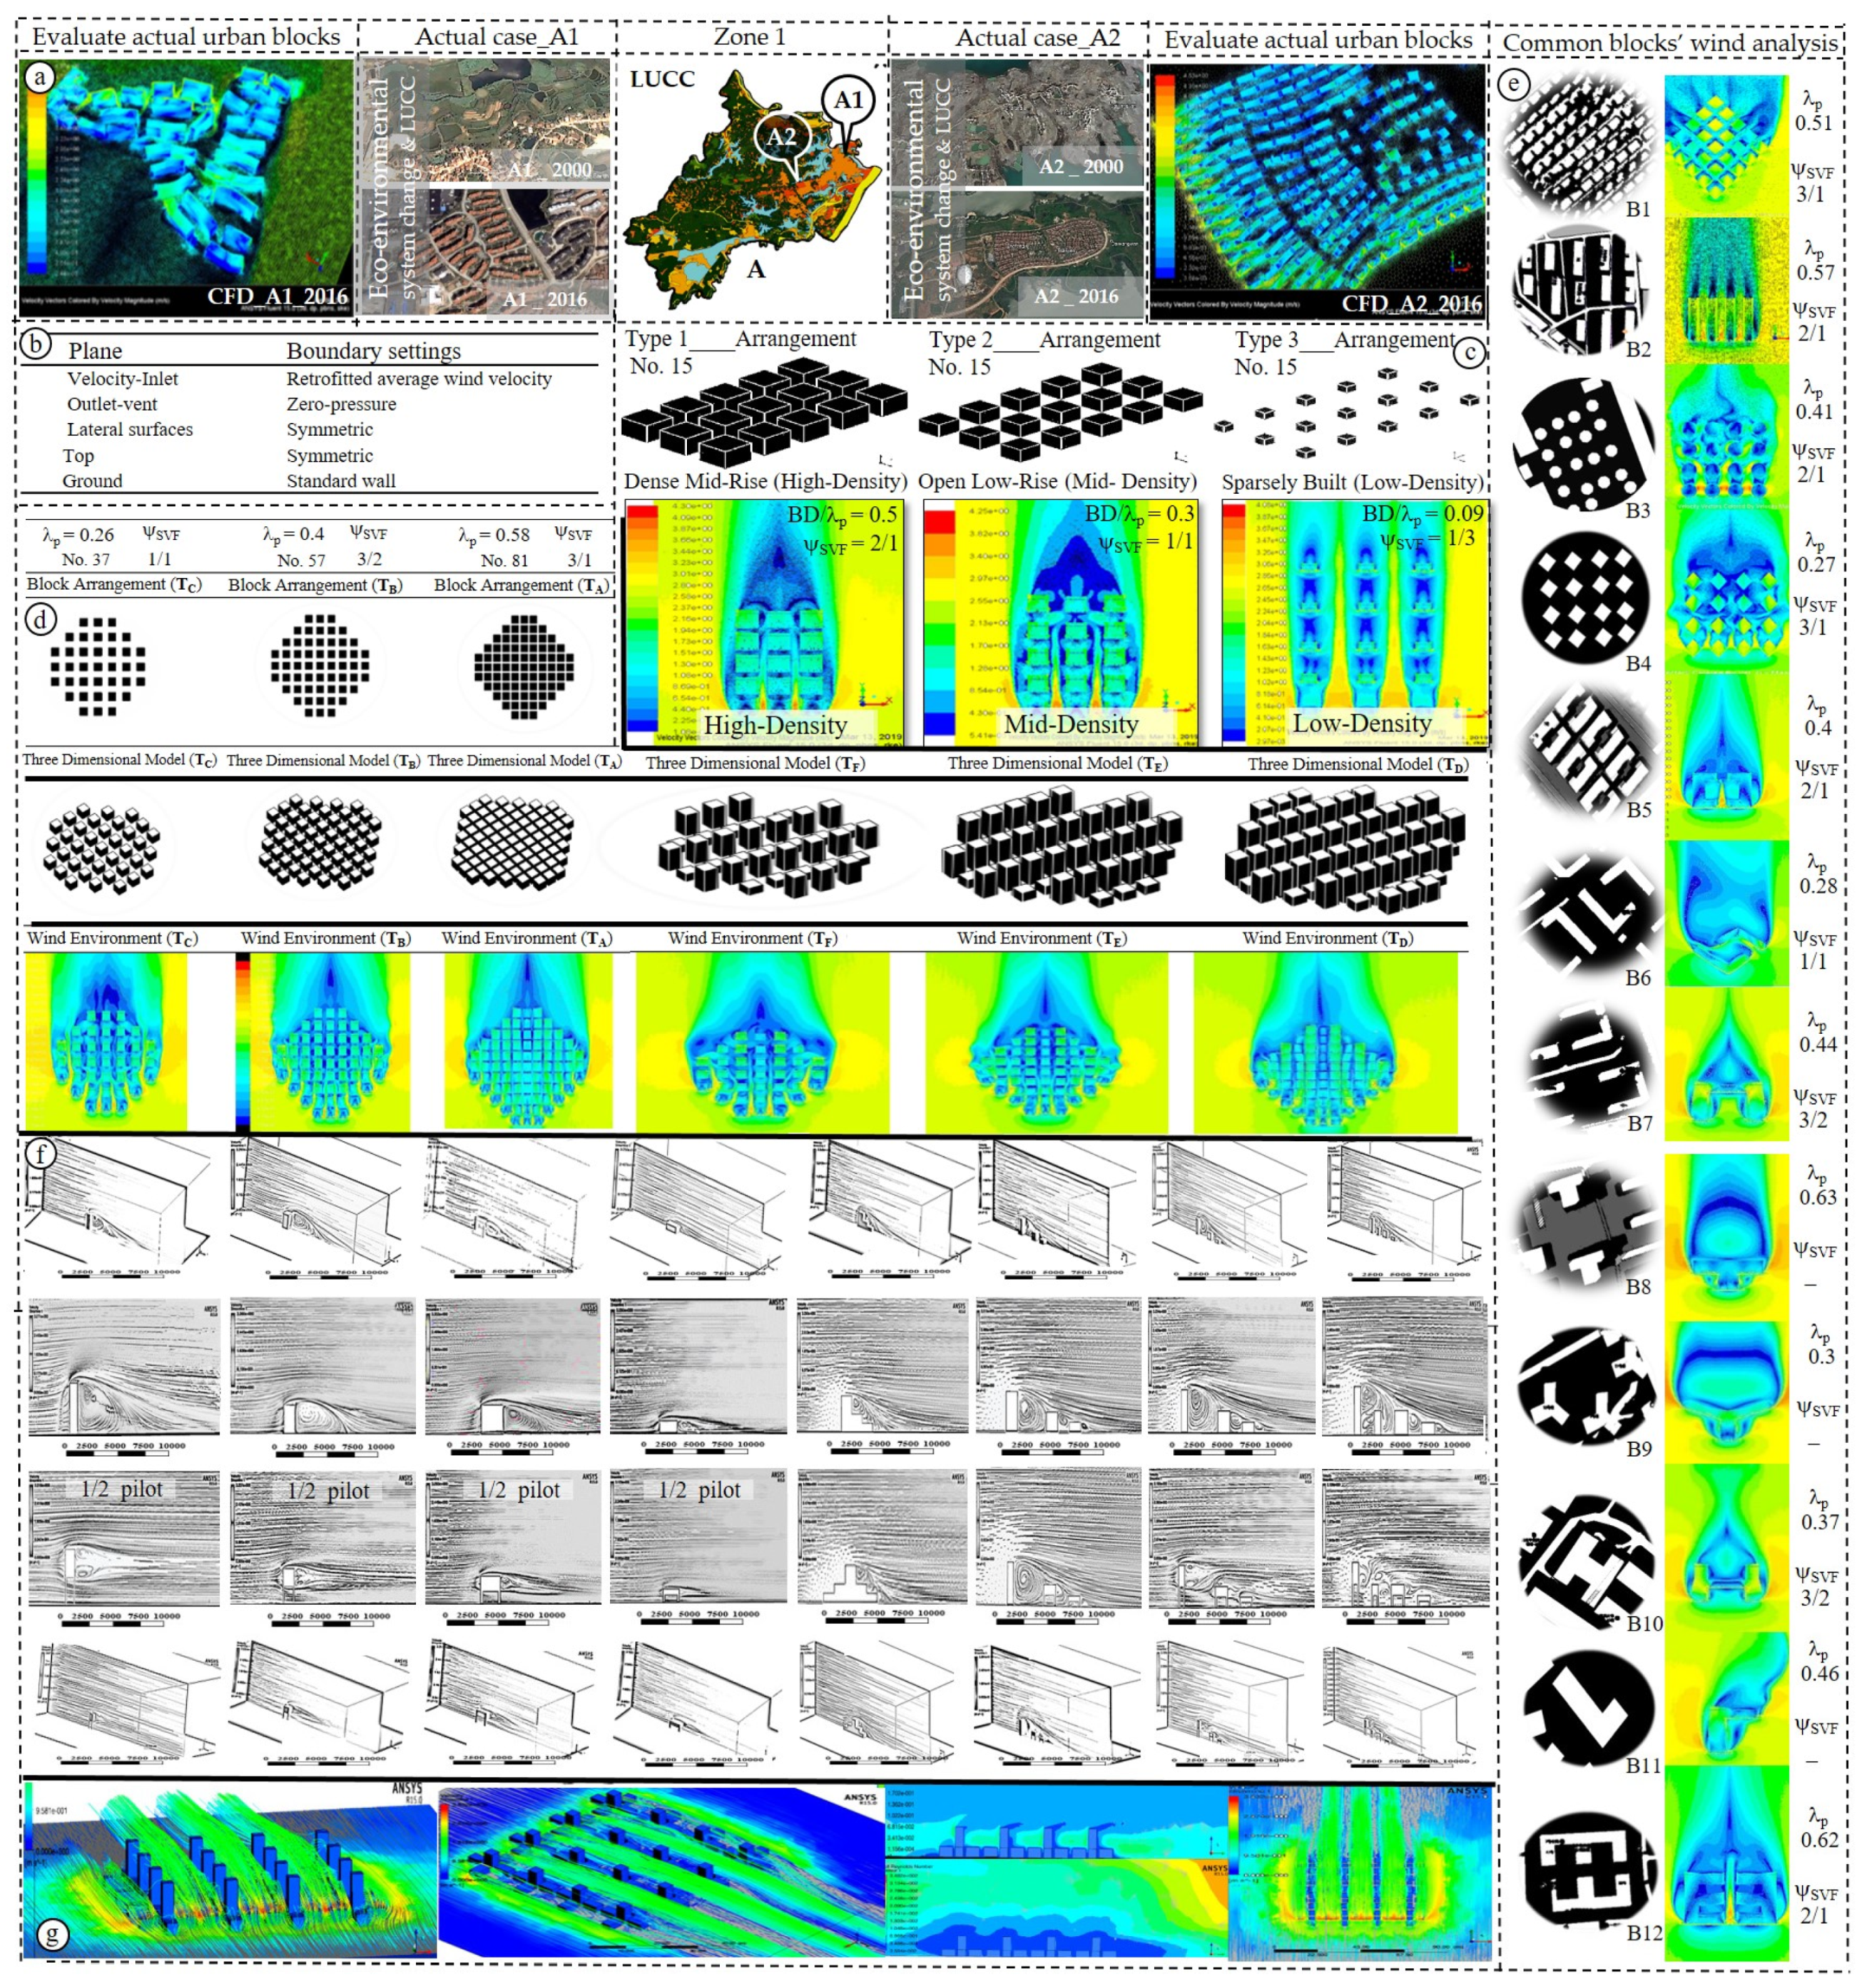
2.5. Numerical CFD Simulation Models Adaptable to Urban Growth
2.6. Typological Strategy of Block Form Design to Reinforce Wind and Mitigate UHII
3. Results and Discussion
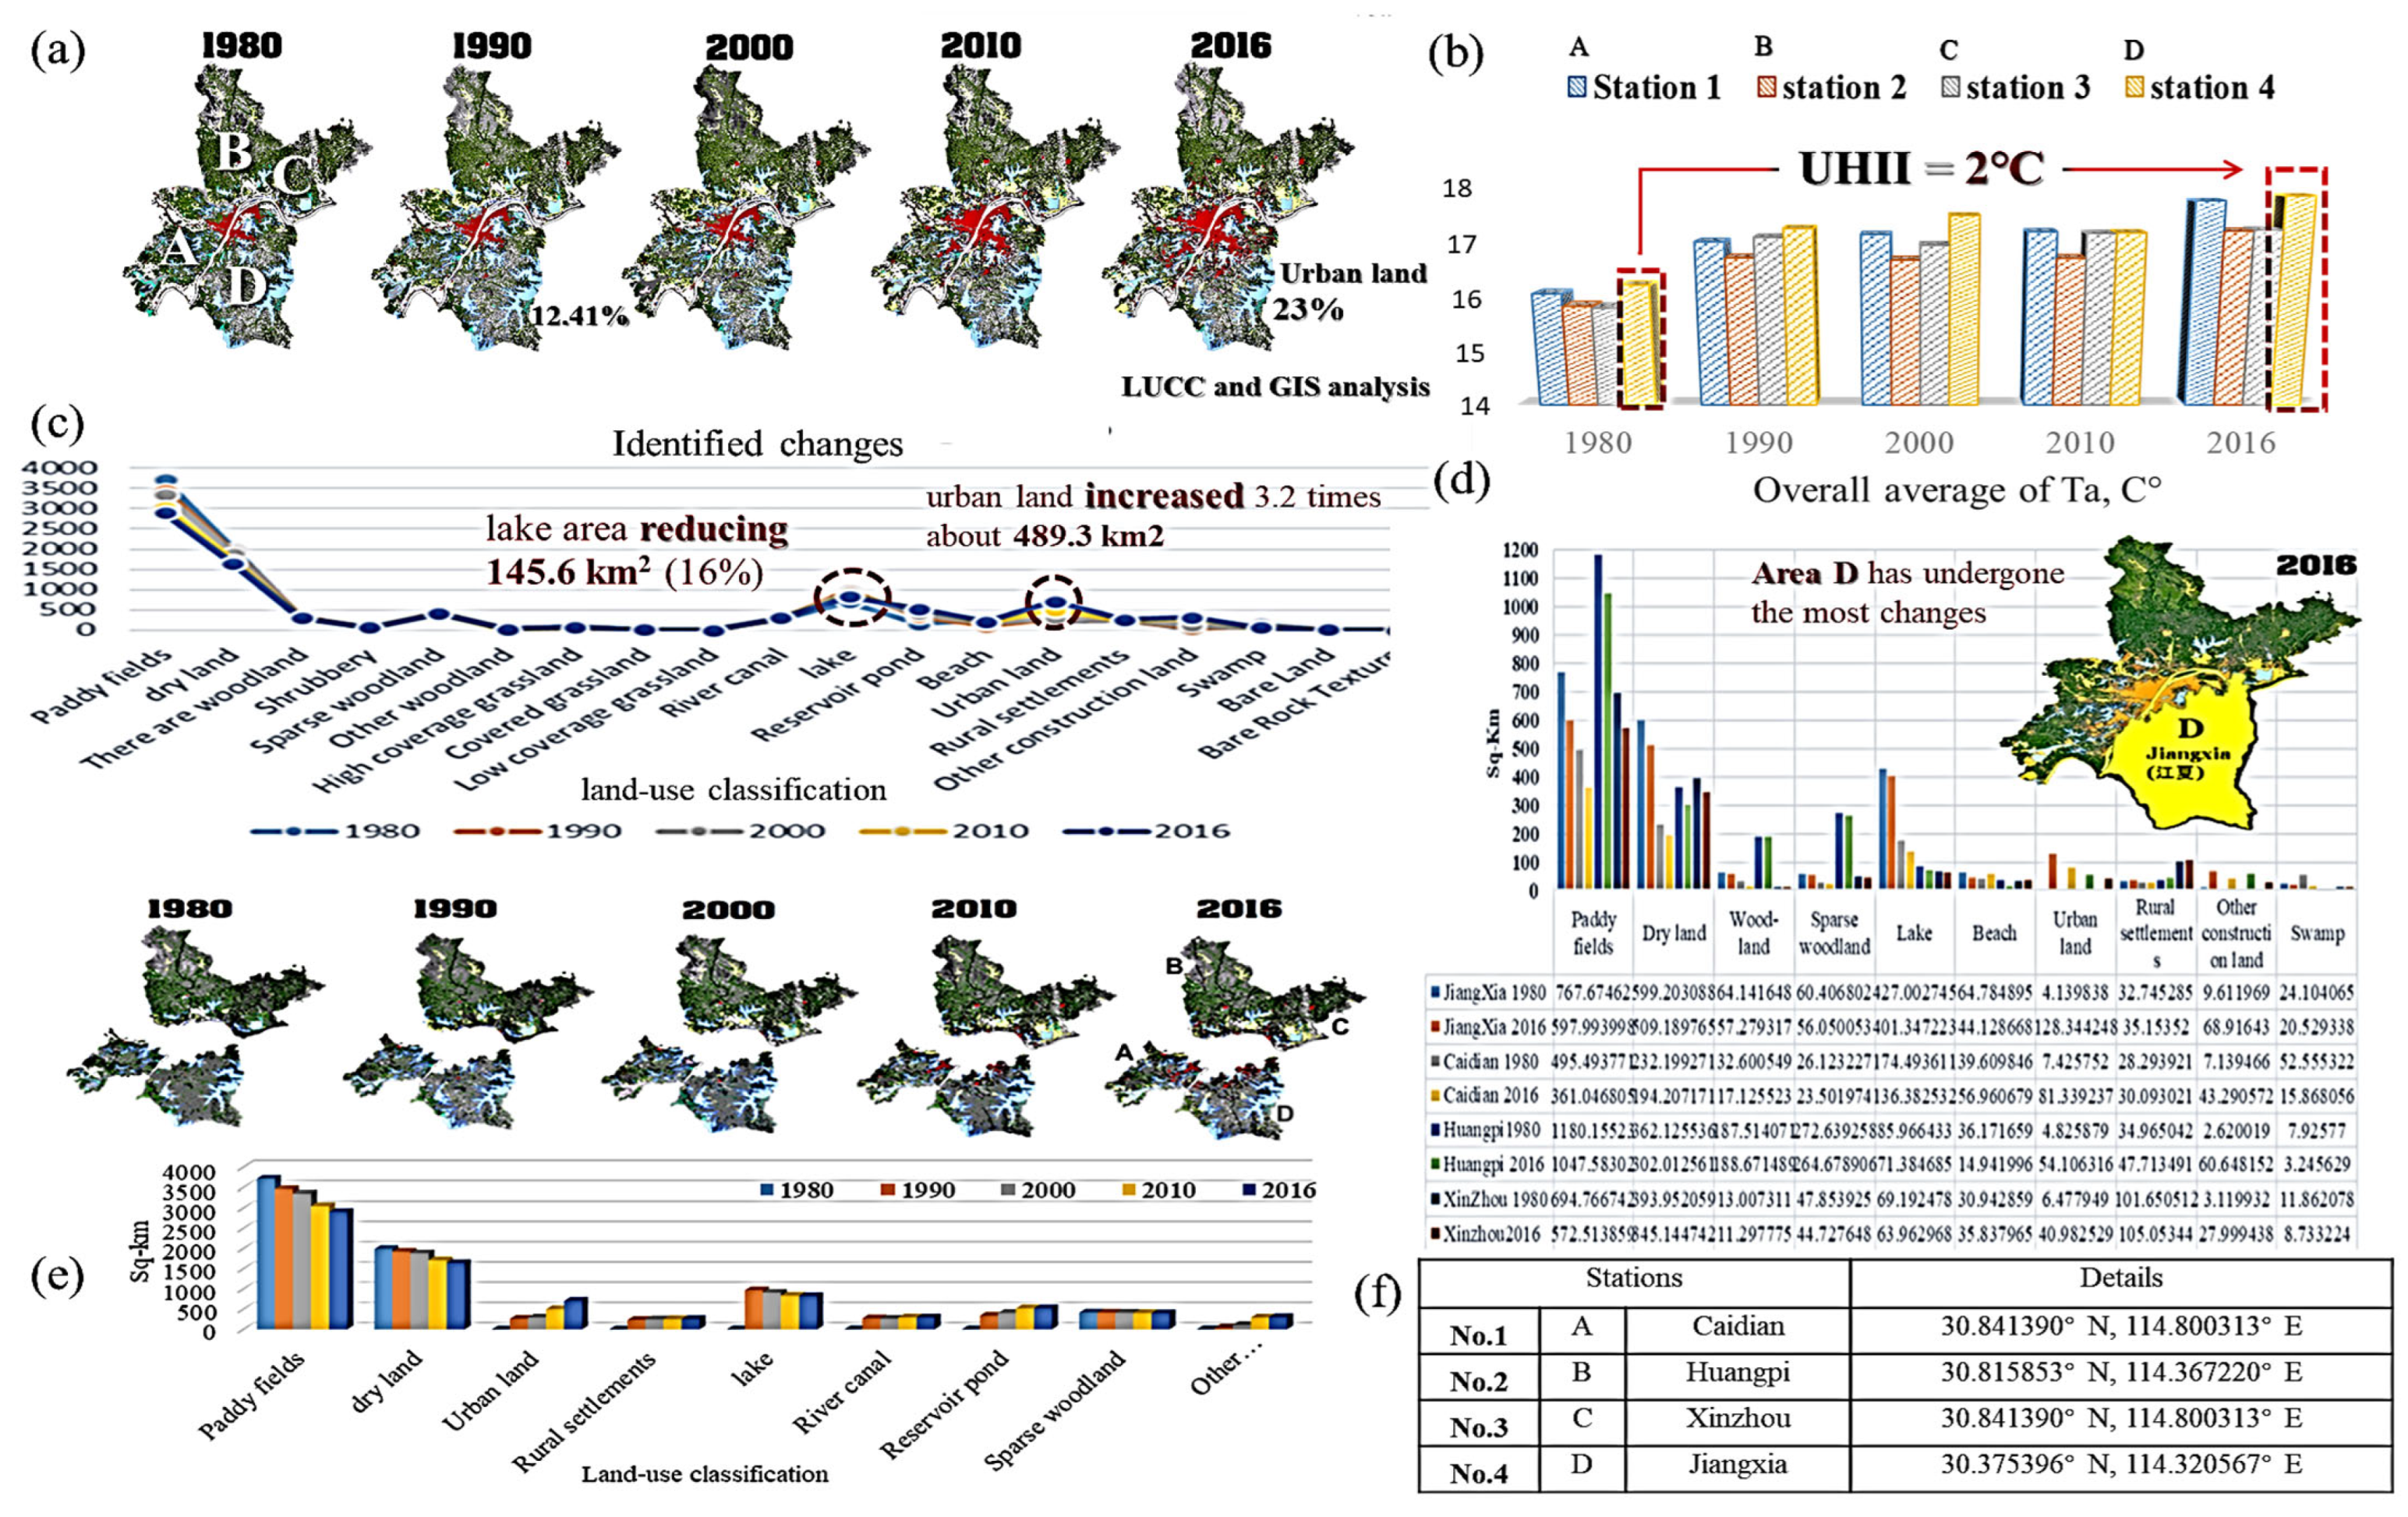
3.1. LUCC and Climatic Changes in Wuhan: A Comprehensive Long-Term Study
3.1.1. Regional LUCC Comparison among Fastest-Growing Areas
3.2. Experimental and Simulation Study
3.2.1. The Impact of Urban Block Morphology on Urban Microclimates
3.2.2. UHII Mitigation Strategies Based on Building Layouts and Typologies
3.2.2.1. Wind Environment Analysis around Buildings within Urban Blocks
3.2.2.2. Modeling Based on ψSVF and λp
3.2.2.3. Typology and Building Form Analysis
4. Conclusions
- The urban morphology of Wuhan is highly affected by its rapid development, with significant changes in developing areas of Jiangxia, Caidian, Hunagpi, and Xinzhou. In 1990, LUCC was accompanied by a dramatic urban land increase (489.3 km2) and the water surface reduction (145.64 km2) became more severe in the urban fringe. Climate changes in the Jiangxia region were most pronounced with higher RH (4.05%) and Ta (0.7%). Long-term meteorological data analysis of urban fringe revealed that Ta increased by 0.4 °C on average per decade. This increases the severity of UHII in urban fringes.
- Different building types of BHA, BHB, and BHC indicate how common building types/morphologies and block configurations affect Ta and RH’s differences over time. Integrating the performance characteristics of these influential urban design elements can effectively be used to control and optimize outdoor ventilation and thermal performance. Hence, normalizing λp, ψSVF, and μBH was found crucial for improving urban microclimates in new development projects which can enhance air circulation and thus mitigate heat around buildings.
- The simulated models’ patterns of the air movement show that adverse air, containing pollution and high temperatures exacerbated by canyons, is intensely linked to the BD/λp within the block arrangement. Eddy forms at various areas of the arrangement pack (the first canyon, central canyon, and last canyon) revealed clear similarities that require a combination with μBH (average building height of BHA, BHB, BHC) for optimizing block scale design. The findings indicate that air movement patterns around building bunches are more determined by positional geometry than by total block morphology, allowing for climate change adaptation.
Author Contributions
Funding
Institutional Review Board Statement
Informed Consent Statement
Data Availability Statement
Conflicts of Interest
Appendix A

| Land Use Classification | ||
|---|---|---|
| No | Category | Explanation |
| 1 | Farmlands/Arable land (1) | Mentions the cultivation of crops in the land, including cultivated land, new land reclamation, leisure, intermittent, grassland crop; to grow crops mainly farmer, agricultural mulberry, agricultural and forestry land; farming more than three years of beach and tideland. |
| 2 | Paddy Fields (11) | Mentions water conservation and irrigation equipment, in the common year to standard irrigation, for rice farming, lotus root and other aquatic crops such as arable land, including the implementation of rice and dryland crop rotation of cultivated land. |
| 3 | Dry-land (12) | Mentions irrigated water and facilities, by natural water crops to grow crops; water and watering facilities, in the general year under the normal irrigation of dry crop arable land; to cultivate the main cultivated land; the normal rotation of the leisure and Intermittently. |
| 4 | Forest/woodlands (2) | Mentions the growth of trees, shrubs, bamboo, coastal mangrove land and other forestry lands, as well as Refers to cannabis> 30% of natural and planted forests. Including timber forests, economic forests, shelter forests, and other forest lands. |
| 5 | Shrubbery lands (22) | Mentions the canopy height> 40%, the height of 2 meters below the dwarf forest and shrubland. |
| 6 | Sparse woodland (23) and Other woodlands (24) | 23)Mentions the forest canopy closure of 10–30% of the woodland.24) Refers to not forest afforestation, trails, nursery and all kinds of the garden (orchard, mulberry, tea, hot forest garden, etc. |
| 7 | Grassland (3) | Mentions the growth of herbaceous plants, covering more than 5% of the various types of grassland, including the main grassland and canopy density10% of the sparse grassland. |
| 8 | High-coverage grassland (31) | Mentions > 50% of the natural grass, improved grass and lawn. Such grassland water conditions are generally good, and the grass is growing dense. |
| 9 | Covered grassland (32) | Mentions the coverage in the 20–50% of the natural grass and improved grass, such grass is generally insufficient water, the grass is more sparse. |
| 10 | Low-coverage grassland (33) | Mentions the coverage of 5–20% natural grassland. Such grassland lacks water, and the grass is sparse, and poor use of animal husbandry conditions. |
| 11 | Waters (4) | Mentions natural land and water conservancy facilities. |
| 12 | River canal (41) | Mentions the natural formation or man-made cavity of the river and the backbone of the yearly water level under the land. Manufactured channels include embankments. |
| 13 | Lake (42) | Mentions the natural formation of the water area below the perennial water level. |
| 14 | Reservoir pond (43) | Mentions the structure of the water storage area below the twelve-monthly water level of the land. |
| 15 | Permanent glacier snow(44) | Mentions the sustained glaciers and snow coated by the land. |
| 16 | Beach (45–46) | 45)Mentions the coastal tide of high tide and low tide between the tidal zone.46) Refers to the river and lake waters and the flood level between the water level between the land. |
| 17 | Built-up and rural areas, industrial and mining, and residential land (5) | Mentions city and rural residential zones, industrial, mining, transportation, and other lands. |
| 18 | Built-up land (51) | Mentions large, medium and small cities and counties above the built space land. |
| 19 | Rural settlements (52) | Mentions rural areas other than towns. |
| 20 | Other structure lands (53) | Mentions factories and mines, large industrial areas, oil, salt, quarry and other land and traffic roads, airports and special land. |
| 21 | Unused land (6) | Land that has not yet been used, including difficult land. |
| 22 | Sandy land (61) | Mentions the surface for the sand cover, vegetation coverage below 5% of the land, together with the desert, not involving the desert in the water system. |
| 23 | Gobi (62) | The ground surface is dominated by crushed gravel, with vegetation covering under 5%. |
| 24 | Saline (63) | The land with saline and alkali-tolerant plants can only be grown when the surface is concentrated, and the vegetation is scarce. |
| 25 | Swamp (64) | Mentions horizontal low-lying, weak drainage, long-term wet, seasonal stagnant water or perennial water, surface growth of wet plants of the land. |
| 26 | Bare Land (65) | Mentions land covered by soil and vegetation coverage under 5%. |
| 27 | Bare Rock Texture (66) | Mentions the surface of rock or gravel, covering the area of >5% land. |
Appendix B
| Constant | Value |
|---|---|
| Cµ | 0.09 |
| Ce1 | 1.44 |
| Ce2 | 1.92 |
| σk | 1.0 |
| σε | 1.3 |
References
- Battista, G.; de Lieto Vollaro, E.; Ocłoń, P.; de Lieto Vollaro, R. Effects of urban heat island mitigation strategies in an urban square: A numerical modelling and experimental investigation. Energy Build. 2023, 282, 112809. [Google Scholar] [CrossRef]
- Zhang, J.; Li, Z.; Hu, D. Effects of urban morphology on thermal comfort at the micro-scale. Sustain. Cities Soc. 2022, 86, 104150. [Google Scholar] [CrossRef]
- Balsa-Barreiro, J.; Li, Y.; Morales, A. Globalization and the shifting centers of gravity of world’s human dynamics: Implications for sustainability. J. Clean. Prod. 2019, 239, 117923. [Google Scholar] [CrossRef]
- Balsa-Barreiro, J.; Morales, A.; Lois-González, R. Mapping Population Dynamics at Local Scales Using Spatial Networks. Complexity 2021, 2021, 8632086. [Google Scholar] [CrossRef]
- Yao, L.; Sun, S.; Song, C.; Li, J.; Xu, W.; Xu, Y. Understanding the spatiotemporal pattern of the urban heat island footprint in the context of urbanization, a case study in Beijing, China. Appl. Geogr. 2021, 133, 102496. [Google Scholar] [CrossRef]
- Zhang, X.; Han, L.; Wei, H.; Tan, X.; Zhou, W.; Li, W.; Qian, Y. Linking urbanization and air quality together: A review and a perspective on the future sustainable urban development. J. Clean. Prod. 2022, 346, 130988. [Google Scholar] [CrossRef]
- Santamouris, M. Recent progress on urban overheating and heat island research. Integrated assessment of the energy, environmental, vulnerability and health impact. Synergies with the global climate change. Energy Build. 2020, 207, 109482. [Google Scholar] [CrossRef]
- Gonzalez-Trevizo, M.E.; Martinez-Torres, K.E.; Armendariz-Lopez, J.F.; Santamouris, M.; Bojorquez-Morales, G.; Luna-Leon, A. Research trends on environmental, energy and vulnerability impacts of Urban Heat Islands: An overview. Energy Build. 2021, 246, 111051. [Google Scholar] [CrossRef]
- Singh, M.; Sharston, R. Quantifying the dualistic nature of urban heat Island effect (UHI) on building energy consumption. Energy Build. 2022, 255, 111649. [Google Scholar] [CrossRef]
- Available online: https://population.un.org/wup/DataQuery (accessed on 1 January 2018).
- Zou, C.; Zhu, J.; Lou, K.; Yang, L. Coupling coordination and spatiotemporal heterogeneity between urbanization and ecological environment in Shaanxi Province, China. Ecol. Indic. 2022, 141, 109152. [Google Scholar] [CrossRef]
- Chen, M.; Liu, W.; Lu, D. Challenges and the way forward in China’s new-type urbanization. Land Use Policy 2015, 55, 334–339. [Google Scholar] [CrossRef]
- Jat, M.K.; Choudhary, M.; Saxena, A. Urban growth assessment and prediction using RS, GIS and SLEUTH model for a heterogeneous urban fringe. Egypt. J. Remote Sens. Space Sci. 2017, 20, 223–241. [Google Scholar]
- Morris, K.I.; Chan, A.; Morris, K.J.; Ooi, M.C.; Oozeer, M.Y.; Abakr, Y.A.; Nadzir, M.S.; Mohammed, I.Y.; Al-Qrimli, H.F. Impact of urbanization level on the interactions of urban area, the urban climate, and human thermal comfort. Appl. Geogr. 2017, 79 (Suppl. C), 50–72. [Google Scholar] [CrossRef]
- Liu, F.; Zhang, Z.; Zhao, X.; Wang, X.; Zuo, L.; Wen, Q.; Yi, L.; Xu, J.; Hu, S.; Liu, B. Chinese cropland losses due to urban expansion in the past four decades. Sci. Total Environ. 2019, 650, 847–857. [Google Scholar] [CrossRef]
- Lemoine-Rodríguez, R.; Inostroza, L.; Zepp, H. Does urban climate follow urban form? Analysing intraurban LST trajectories versus urban form trends in 3 cities with different background climates. Sci. Total Environ. 2022, 830, 154570. [Google Scholar] [CrossRef]
- Wang, Y.; Guo, Z.; Han, J. The relationship between urban heat island and air pollutants and them with influencing factors in the Yangtze River Delta, China. Ecol. Indic. 2021, 129, 107976. [Google Scholar] [CrossRef]
- Zheng, T.; Qu, K.; Darkwa, J.; Calautit, J.K. Evaluating urban heat island mitigation strategies for a subtropical city centre (a case study in Osaka, Japan). Energy 2022, 250, 123721. [Google Scholar] [CrossRef]
- Hou, H.; Su, H.; Liu, K.; Li, X.; Chen, S.; Wang, W.; Lin, J. Driving forces of UHI changes in China’s major cities from the perspective of land surface energy balance. Sci. Total Environ. 2022, 829, 154710. [Google Scholar] [CrossRef]
- Aboelata, A.; Sodoudi, S. Corrigendum to “Evaluating urban vegetation scenarios to mitigate urban heat island and reduce buildings’ Energy in dense built-up areas in Cairo”. Build. Environ. 2020, 172, 106697. [Google Scholar] [CrossRef]
- Aboelata, A.; Sodoudi, S. Evaluating urban vegetation scenarios to mitigate urban heat island and reduce buildings’ energy in dense built-up areas in Cairo. Build. Environ. 2019, 166, 106407. [Google Scholar] [CrossRef]
- Middel, A.; Chhetri, N.; Quay, R. Urban forestry and cool roofs: Assessment of heat mitigation strategies in Phoenix residential neighborhoods. Urban For. Urban Green. 2015, 14, 178–186. [Google Scholar] [CrossRef]
- Rahman, M.A.; Stratopoulos, L.M.; Moser-Reischl, A.; Zölch, T.; Häberle, K.H.; Rötzer, T.; Pretzsch, H.; Pauleit, S. Traits of trees for cooling urban heat islands: A meta-analysis. Build. Environ. 2020, 170, 106606. [Google Scholar] [CrossRef]
- Syafii, N.I.; Ichinose, M.; Wong, N.H.; Kumakura, E.; Jusuf, S.K.; Chigusa, K. Experimental Study on the Influence of Urban Water Body on Thermal Environment at Outdoor Scale Model. Procedia Eng. 2016, 169, 191–198. [Google Scholar] [CrossRef]
- Wu, S.; Yang, H.; Luo, P.; Luo, C.; Li, H.; Liu, M.; Ruan, Y.; Zhang, S.; Xiang, P.; Jia, H.; et al. The effects of the cooling efficiency of urban wetlands in an inland megacity: A case study of Chengdu, Southwest China. Build. Environ. 2021, 204, 108128. [Google Scholar] [CrossRef]
- Jacobs, C.; Klok, L.; Bruse, M.; Cortesão, J.; Lenzholzer, S.; Kluck, J. Are urban water bodies really cooling? Urban Clim. 2020, 32, 100607. [Google Scholar] [CrossRef]
- Abd Elraouf, R.; Elmokadem, A.; Megahed, N.; Eleinen, O.A.; Eltarabily, S. The impact of urban geometry on outdoor thermal comfort in a hot-humid climate. Build. Environ. 2022, 225, 109632. [Google Scholar] [CrossRef]
- Perini, K.; Magliocco, A. Effects of vegetation, urban density, building height, and atmospheric conditions on local temperatures and thermal comfort. Urban For. Urban Green. 2014, 13, 495–506. [Google Scholar] [CrossRef]
- Cárdenas-Jirón, L.A.; Graw, K.; Gangwisch, M.; Matzarakis, A. Influence of street configuration on human thermal comfort and benefits for climate-sensitive urban planning in Santiago de Chile. Urban Clim. 2023, 47, 101361. [Google Scholar] [CrossRef]
- Taleghani, M.; Kleerekoper, L.; Tenpierik, M.; Van Den Dobbelsteen, A. Outdoor thermal comfort within five different urban forms in the Netherlands. Build. Environ. 2015, 83, 65–78. [Google Scholar] [CrossRef]
- Nice, K.A.; Nazarian, N.; Lipson, M.J.; Hart, M.A.; Seneviratne, S.; Thompson, J.; Naserikia, M.; Godic, B.; Stevenson, M. Isolating the impacts of urban form and fabric from geography on urban heat and human thermal comfort. Build. Environ. 2022, 224, 109502. [Google Scholar] [CrossRef]
- Gamero-Salinas, J.; Kishnani, N.; Monge-Barrio, A.; López-Fidalgo, J.; Sánchez-Ostiz, A. Evaluation of thermal comfort and building form attributes in different semi-outdoor environments in a high-density tropical setting. Build. Environ. 2021, 205, 108255. [Google Scholar] [CrossRef]
- Hermosilla, T.; Palomar-Vázquez, J.; Balaguer-Beser, Á.; Balsa-Barreiro, J.; Ruiz, L.A. Using street based metrics to characterize urban typologies. Comput. Environ. Urban Syst. 2014, 44, 68–79. [Google Scholar] [CrossRef] [Green Version]
- Ramponi, R.; Blocken, B.; de Coo, L.B.; Janssen, W.D. CFD simulation of outdoor ventilation of generic urban configurations with different urban densities and equal and unequal street widths. Build. Environ. 2015, 92, 152–166. [Google Scholar] [CrossRef] [Green Version]
- Yin, J.; Zhan, Q.; Tayyab, M.; Zahra, A. The Ventilation Efficiency of Urban Built Intensity and Ventilation Path Identification: A Case Study of Wuhan. Int. J. Environ. Res. Public Health 2021, 18, 11684. [Google Scholar] [CrossRef] [PubMed]
- Sodoudi, S.; Zhang, H.; Chi, X.; Müller, F.; Li, H. The influence of spatial configuration of green areas on microclimate and thermal comfort. Urban For. Urban Green. 2018, 34, 85–96. [Google Scholar] [CrossRef]
- Tan, Z.; Lau, K.-L.; Ng, E. Planning strategies for roadside tree planting and outdoor comfort enhancement in subtropical high-density urban areas. Build. Environ. 2017, 120, 93–109. [Google Scholar] [CrossRef]
- Zeng, P.; Sun, F.; Liu, Y.; Tian, T.; Wu, J.; Dong, Q.; Peng, S.; Che, Y. The influence of the landscape pattern on the urban land surface temperature varies with the ratio of land components: Insights from 2D/3D building/vegetation metrics. Sustain. Cities Soc. 2022, 78, 103599. [Google Scholar] [CrossRef]
- Zhou, W.; Wang, J.; Cadenasso, M. Effects of the spatial configuration of trees on urban heat mitigation: A comparative study. Remote Sens. Environ. 2017, 195, 1–12. [Google Scholar] [CrossRef]
- Zheng, Z.; Zhou, W.; Wang, J.; Hu, X.; Qian, Y. Sixty-Year Changes in Residential Landscapes in Beijing: A Perspective from Both the Horizontal (2D) and Vertical (3D) Dimensions. Remote Sens. 2017, 9, 992. [Google Scholar] [CrossRef] [Green Version]
- Hermosilla, T.; Ruiz, L.A.; Recio, J.; Balsa-Barreiro, J. Land-Use Mapping of Valencia City Area from Aerial Images and LiDAR Data. 2012. Available online: https://www.semanticscholar.org/paper/Land-use-Mapping-of-Valencia-City-Area-from-Aerial-Hermosilla-Ruiz/27de807a604f8bbdbc60d38c07c08f89fe1c72b6 (accessed on 15 February 2023).
- Miao, C.; He, X.; Gao, Z.; Chen, W.; He, B.-J. Assessing the vertical synergies between outdoor thermal comfort and air quality in an urban street canyon based on field measurements. Build. Environ. 2023, 227, 109810. [Google Scholar] [CrossRef]
- Tian, Y.; Zhou, W.; Qian, Y.; Zheng, Z.; Yan, J. The effect of urban 2D and 3D morphology on air temperature in residential neighborhoods. Landsc. Ecol. 2019, 34, 1161–1178. [Google Scholar] [CrossRef]
- Qian, Y.; Zhou, W.; Hu, X.; Fu, F. The Heterogeneity of Air Temperature in Urban Residential Neighborhoods and Its Relationship with the Surrounding Greenspace. Remote Sens. 2018, 10, 965. [Google Scholar] [CrossRef] [Green Version]
- Lee, H.; Mayer, H.; Chen, L. Contribution of trees and grasslands to the mitigation of human heat stress in a residential district of Freiburg, Southwest Germany. Landsc. Urban Plan. 2016, 148, 37–50. [Google Scholar] [CrossRef]
- Ma, X.; Leung, T.M.; Chau, C.K.; Yung, E.H.K. Analyzing the influence of urban morphological features on pedestrian thermal comfort. Urban Clim. 2022, 44, 101192. [Google Scholar] [CrossRef]
- Atwa, S.; Ibrahim, M.; Murata, R. Evaluation of plantation design methodology to improve the human thermal comfort in hot-arid climatic responsive open spaces. Sustain. Cities Soc. 2020, 59, 102198. [Google Scholar] [CrossRef]
- Back, Y.; Kumar, P.; Bach, P.M.; Rauch, W.; Kleidorfer, M. Integrating CFD-GIS modelling to refine urban heat and thermal comfort assessment. Sci. Total Environ. 2023, 858, 159729. [Google Scholar] [CrossRef]
- Chowdhury, M.S.; Hafsa, B. Multi-decadal land cover change analysis over Sundarbans Mangrove Forest of Bangladesh: A GIS and remote sensing based approach. Glob. Ecol. Conserv. 2022, 37, e02151. [Google Scholar] [CrossRef]
- Hu, Y.; Peng, Y.; Gao, Z.; Xu, F. Application of CFD plug-ins integrated into urban and building design platforms for performance simulations: A literature review. Front. Archit. Res. 2023, 12, 148–174. [Google Scholar] [CrossRef]
- Mitkov, R.; Pantusheva, M.; Naserentin, V.; Hristov, P.O.; Wästberg, D.; Hunger, F.; Mark, A.; Petrova-Antonova, D.; Edelvik, F.; Logg, A. Using the Octree Immersed Boundary Method for urban wind CFD simulations. IFAC-PapersOnLine 2022, 55, 179–184. [Google Scholar] [CrossRef]
- Chen, G.; Rong, L.; Zhang, G. Unsteady-state CFD simulations on the impacts of urban geometry on outdoor thermal comfort within idealized building arrays. Sustain. Cities Soc. 2021, 74, 103187. [Google Scholar] [CrossRef]
- Zhou, X.; Chen, H. Impact of urbanization-related land use land cover changes and urban morphology changes on the urban heat island phenomenon. Sci. Total Environ. 2018, 635, 1467–1476. [Google Scholar] [CrossRef] [PubMed]
- Li, Y.; Jia, L.; Wu, W.; Yan, J.; Liu, Y. Urbanization for rural sustainability—Rethinking China’s urbanization strategy. J. Clean. Prod. 2018, 178, 580–586. [Google Scholar] [CrossRef]
- Song, S.; Xu, Y.P.; Zhang, J.X.; Li, G.; Wang, Y.F. The long-term water level dynamics during urbanization in plain catchment in Yangtze River Delta. Agric. Water Manag. 2016, 174, 93–102. [Google Scholar] [CrossRef]
- Gui, K.; Che, H.; Wang, Y.; Wang, H.; Zhang, L.; Zhao, H.; Zheng, Y.; Sun, T.; Zhang, X. Satellite-derived PM2.5 concentration trends over Eastern China from 1998 to 2016: Relationships to emissions and meteorological parameters. Environ. Pollut. 2019, 247, 1125–1133. [Google Scholar] [CrossRef] [PubMed]
- Shi, T.; Huang, Y.; Wang, H.; Shi, C.-E.; Yang, Y.-J. Influence of urbanization on the thermal environment of meteorological station: Satellite-observed evidence. Adv. Clim. Change Res. 2015, 6, 7–15. [Google Scholar] [CrossRef]
- Yao-Dong, D.U.; Hui, A.I.; Hai-Lai, D.U.A.N.; Ya-Min, H.U.; Xian-Wei, W.A.N.G.; Jian, H.E.; Hong-Yu, W.U.; Xiao-Xuan, W.U. Changes in Climate Factors and Extreme Climate Events in South China during 1961–2010. Adv. Clim. Change Res. 2013, 4, 1–11. [Google Scholar] [CrossRef]
- Wang, W.; Liu, K.; Tang, R.; Wang, S. Remote sensing image-based analysis of the urban heat island effect in Shenzhen, China. Phys. Chem. Earth Parts A/B/C 2019, 110, 168–175. [Google Scholar] [CrossRef]
- Zheng, Y.; Ren, C.; Xu, Y.; Wang, R.; Ho, J.; Lau, K.; Ng, E. GIS-based mapping of Local Climate Zone in the high-density city of Hong Kong. Urban Clim. 2018, 24, 419–448. [Google Scholar] [CrossRef]
- Zhang, F.; Zhan, J.; Li, Z.; Jia, S.; Chen, S. Impacts of urban transformation on water footprint and sustainable energy in Shanghai, China. J. Clean. Prod. 2018, 190, 847–853. [Google Scholar] [CrossRef]
- Li, X.; Li, B.; Chen, H. Study on the relationship between urban land sprawl extension and urban thermal environment—Taking Wuhan city as an example. Theor. Appl. Climatol. 2018, 137, 1135–1148. [Google Scholar] [CrossRef]
- Cai, D.; Fraedrich, K.; Guan, Y.; Guo, S.; Zhang, C.; Zhu, X. Urbanization and climate change: Insights from eco-hydrological diagnostics. Sci. Total Environ. 2019, 647, 29–36. [Google Scholar] [CrossRef] [PubMed]
- Mavridou, C.H.M.; Kalff, C. The Impact of Different Building Height Configurations on Navigation and Wayfinding. Available online: https://www.semanticscholar.org/paper/The-impact-of-Different-Building-Height-on-and-Mavridou-Hoelscher/350a1417cc43e06f59a3bbfd04291cdb9b183f41 (accessed on 17 February 2023).
- Guo, L.; Makvandi, M.; Li, B. Observation and Analysis of Urban Micro-Climate and Urban Morphology on Block Scale in Zhengzhou City. World Academy of Science. Eng. Technol. Int. J. Mar. Environ. Sci. 2018, 12, 43–55. Available online: https://publications.waset.org/abstracts/92713/pdf (accessed on 16 February 2023).
- Sato, T.; Ooka, R.; Murakami, S. Analysis of sensible heat, latent heat and mean kinetic energy balance of moving control volume along sea breeze based on meso-scale climate simulation. J. Environ. Eng. 2004, 73, 1029–1035. (In Japanese) [Google Scholar] [CrossRef] [Green Version]
- Nazarian, N.; Kleissl, J. CFD simulation of an idealized urban environment: Thermal effects of geometrical characteristics and surface materials. Urban Clim. 2015, 12, 141–159. [Google Scholar] [CrossRef]
- Thordal, M.S.; Bennetsen, J.; Koss, H. Review for practical application of CFD for the determination of wind load on high-rise buildings. J. Wind. Eng. Ind. Aerodyn. 2019, 186, 155–168. [Google Scholar] [CrossRef]
- Mompean, G. Numerical simulation of a turbulent flow near a right-angled corner using the Speziale non-linear model with RNG K—ε equations. Comput. Fluids 1998, 27, 847–859. [Google Scholar] [CrossRef]
- Shuojun, M.; Jingjing, C.; Jiangtao, H.; Jihao, Z.; Lirong, T.; Fuyun, Z. Numerical Simulation of Urban Ventilation with Different Building Scales. In Proceedings of the 2014 ISFMFE—6th International Symposium on Fluid Machinery and Fluid Engineering, Wuhan, China, 22–25 October 2014. [Google Scholar]
- Khalilzadeh, A.; Ge, H.; Ng, H. Effect of turbulence modeling schemes on wind-driven rain deposition on a mid-rise building: CFD modeling and validation. J. Wind. Eng. Ind. Aerodyn. 2019, 184, 362–377. [Google Scholar] [CrossRef]
- Houda, S.; Belarbi, R.; Zemmouri, N. A CFD Comsol model for simulating complex urban flow. Energy Procedia 2017, 139, 373–378. [Google Scholar] [CrossRef]
- Wang, B.; Malkawi, A. Design-based natural ventilation evaluation in early stage for high performance buildings. Sustain. Cities Soc. 2019, 45, 25–37. [Google Scholar] [CrossRef]
- He, X.; Li, Y.; Wang, X.; Chen, L.; Yu, B.; Zhang, Y.; Miao, S. High-resolution dataset of urban canopy parameters for Beijing and its application to the integrated WRF/Urban modelling system. J. Clean. Prod. 2019, 208, 373–383. [Google Scholar] [CrossRef]


| No | LUCC | Value % | Decline | Increase | No | LUCC | Value % | Decline | Increase |
|---|---|---|---|---|---|---|---|---|---|
| 1 | Paddy fields | 1.279965% | ☑ ↓ | ☒ | 8 | LC Grassland | 1.56226% | ☑ ↓ | ☒ |
| 2 | Dry-lands | 1.214954% | ☑ ↓ | ☒ | 9 | Beach | 1.147242% | ☑ ↓ | ☒ |
| 3 | Woodlands | 1.087316% | ☑ ↓ | ☒ | 10 | Swamp | 2.35544% | ☑ ↓ | ☒ |
| 4 | Shrubbery | 1.019609% | ☑ ↓ | ☒ | 11 | Bare lands | 1.517368% | ☑ ↓ | ☒ |
| 5 | Sparse wood | 1.047605% | ☑ ↓ | ☒ | 12 | Bare rock texture | 1.616842% | ☑ ↓ | ☒ |
| 6 | HC Grassland | 1.017211% | ☑ ↓ | ☒ | 13 | Urban lands | 1173.6238% | ☒ | ☑ ↑ |
| 7 | C Grassland | 1.175336% | ☑ ↓ | ☒ |
Disclaimer/Publisher’s Note: The statements, opinions and data contained in all publications are solely those of the individual author(s) and contributor(s) and not of MDPI and/or the editor(s). MDPI and/or the editor(s) disclaim responsibility for any injury to people or property resulting from any ideas, methods, instructions or products referred to in the content. |
© 2023 by the authors. Licensee MDPI, Basel, Switzerland. This article is an open access article distributed under the terms and conditions of the Creative Commons Attribution (CC BY) license (https://creativecommons.org/licenses/by/4.0/).
Share and Cite
Makvandi, M.; Li, W.; Ou, X.; Chai, H.; Khodabakhshi, Z.; Fu, J.; Yuan, P.F.; Horimbere, E.d.l.J. Urban Heat Mitigation towards Climate Change Adaptation: An Eco-Sustainable Design Strategy to Improve Environmental Performance under Rapid Urbanization. Atmosphere 2023, 14, 638. https://doi.org/10.3390/atmos14040638
Makvandi M, Li W, Ou X, Chai H, Khodabakhshi Z, Fu J, Yuan PF, Horimbere EdlJ. Urban Heat Mitigation towards Climate Change Adaptation: An Eco-Sustainable Design Strategy to Improve Environmental Performance under Rapid Urbanization. Atmosphere. 2023; 14(4):638. https://doi.org/10.3390/atmos14040638
Chicago/Turabian StyleMakvandi, Mehdi, Wenjing Li, Xiongquan Ou, Hua Chai, Zeinab Khodabakhshi, Jiayan Fu, Philip F. Yuan, and Elyse de la Joie Horimbere. 2023. "Urban Heat Mitigation towards Climate Change Adaptation: An Eco-Sustainable Design Strategy to Improve Environmental Performance under Rapid Urbanization" Atmosphere 14, no. 4: 638. https://doi.org/10.3390/atmos14040638