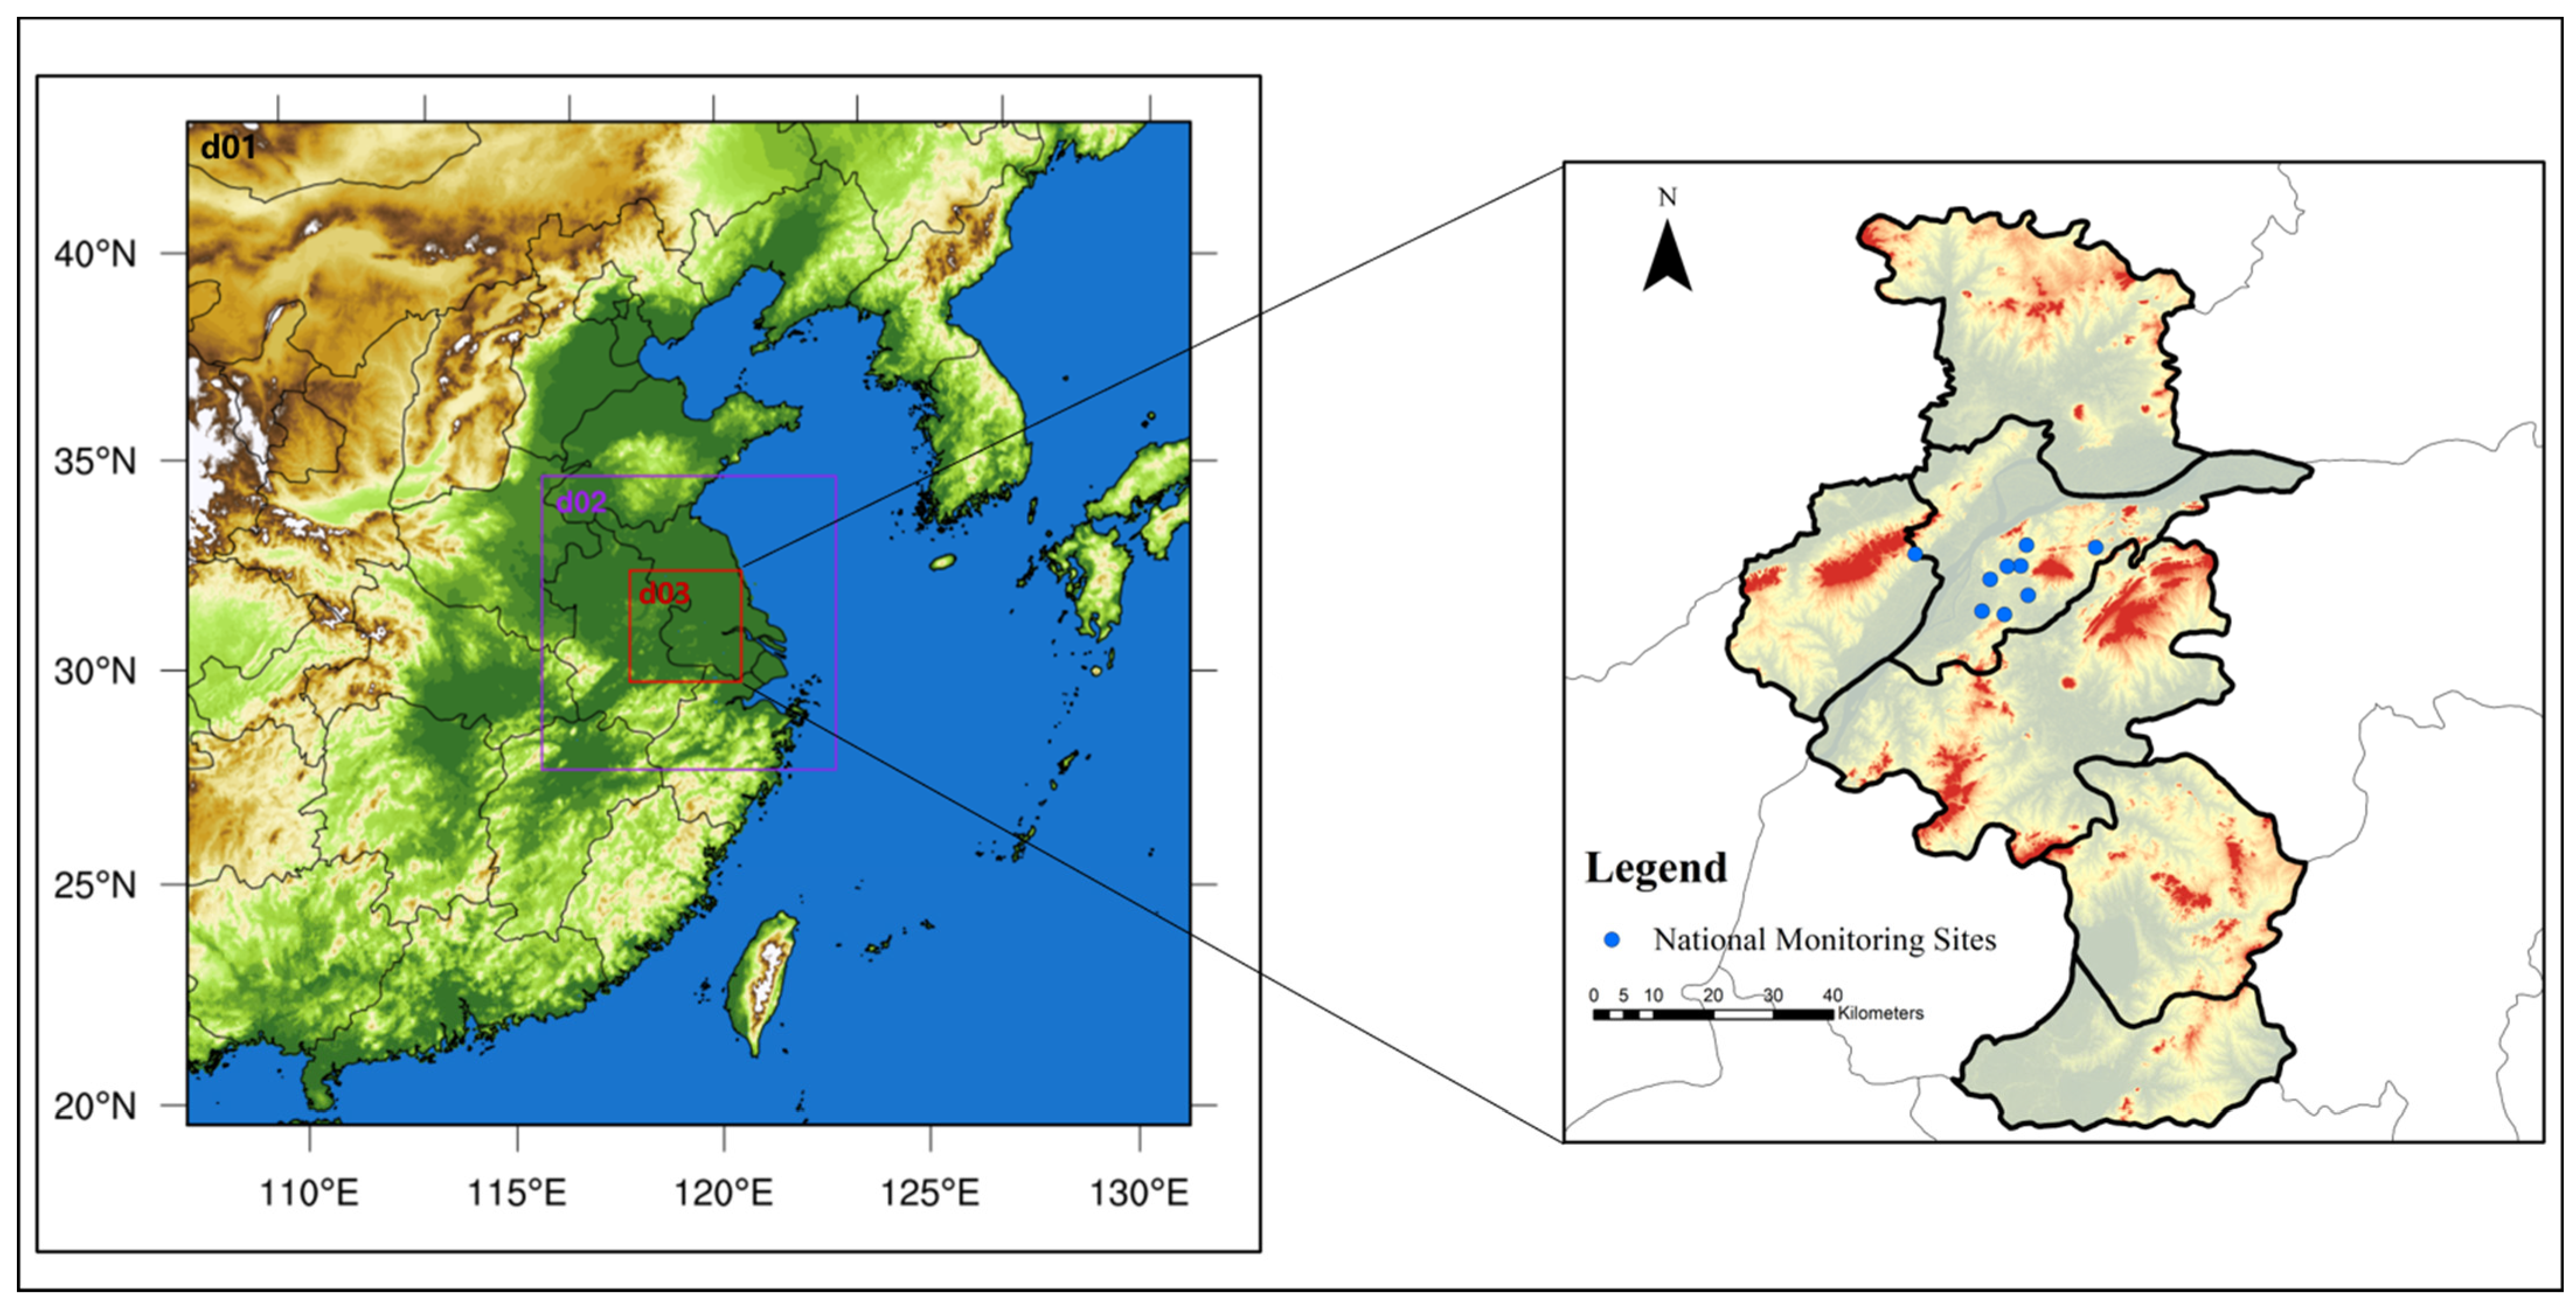
3.1. WRF-Chem Model Validation
The pollutant results simulated by the WRF-Chem model were extracted from the Nanjing state-controlled ambient air quality monitoring stations, and the observed data from the stations and the resultant data obtained from the WRF-Chem model simulation were averaged and tested for accuracy using the correlation coefficient (
R), normalized mean deviation (NMB), mean fractional deviation (MFB) and mean fractional error (MFE) as the criteria for the error test, and the specific formulae are shown in
Table 3.
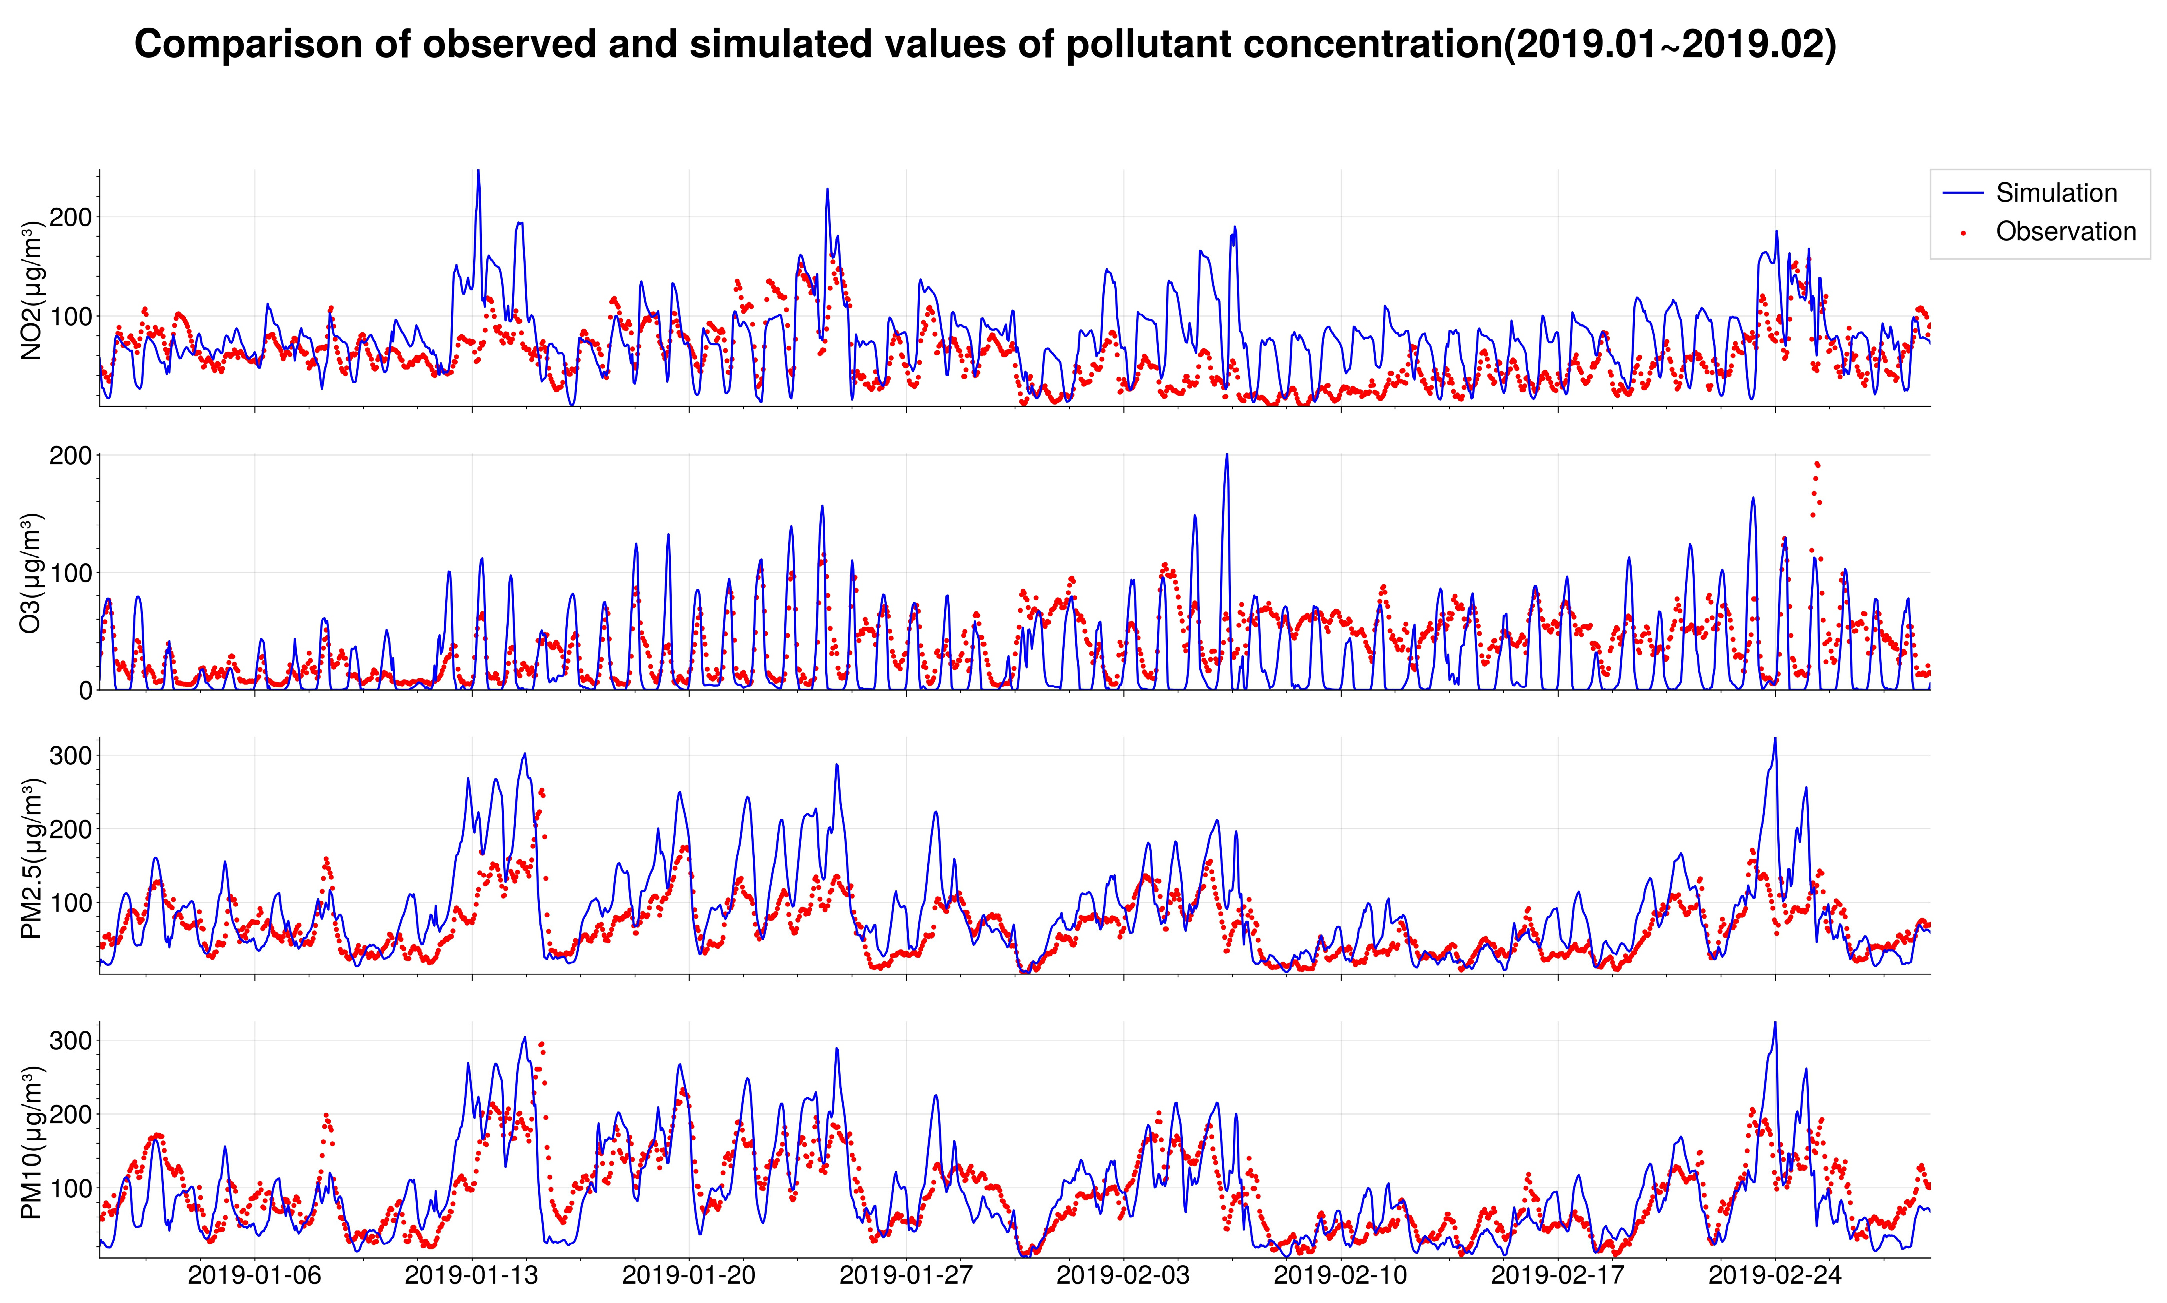
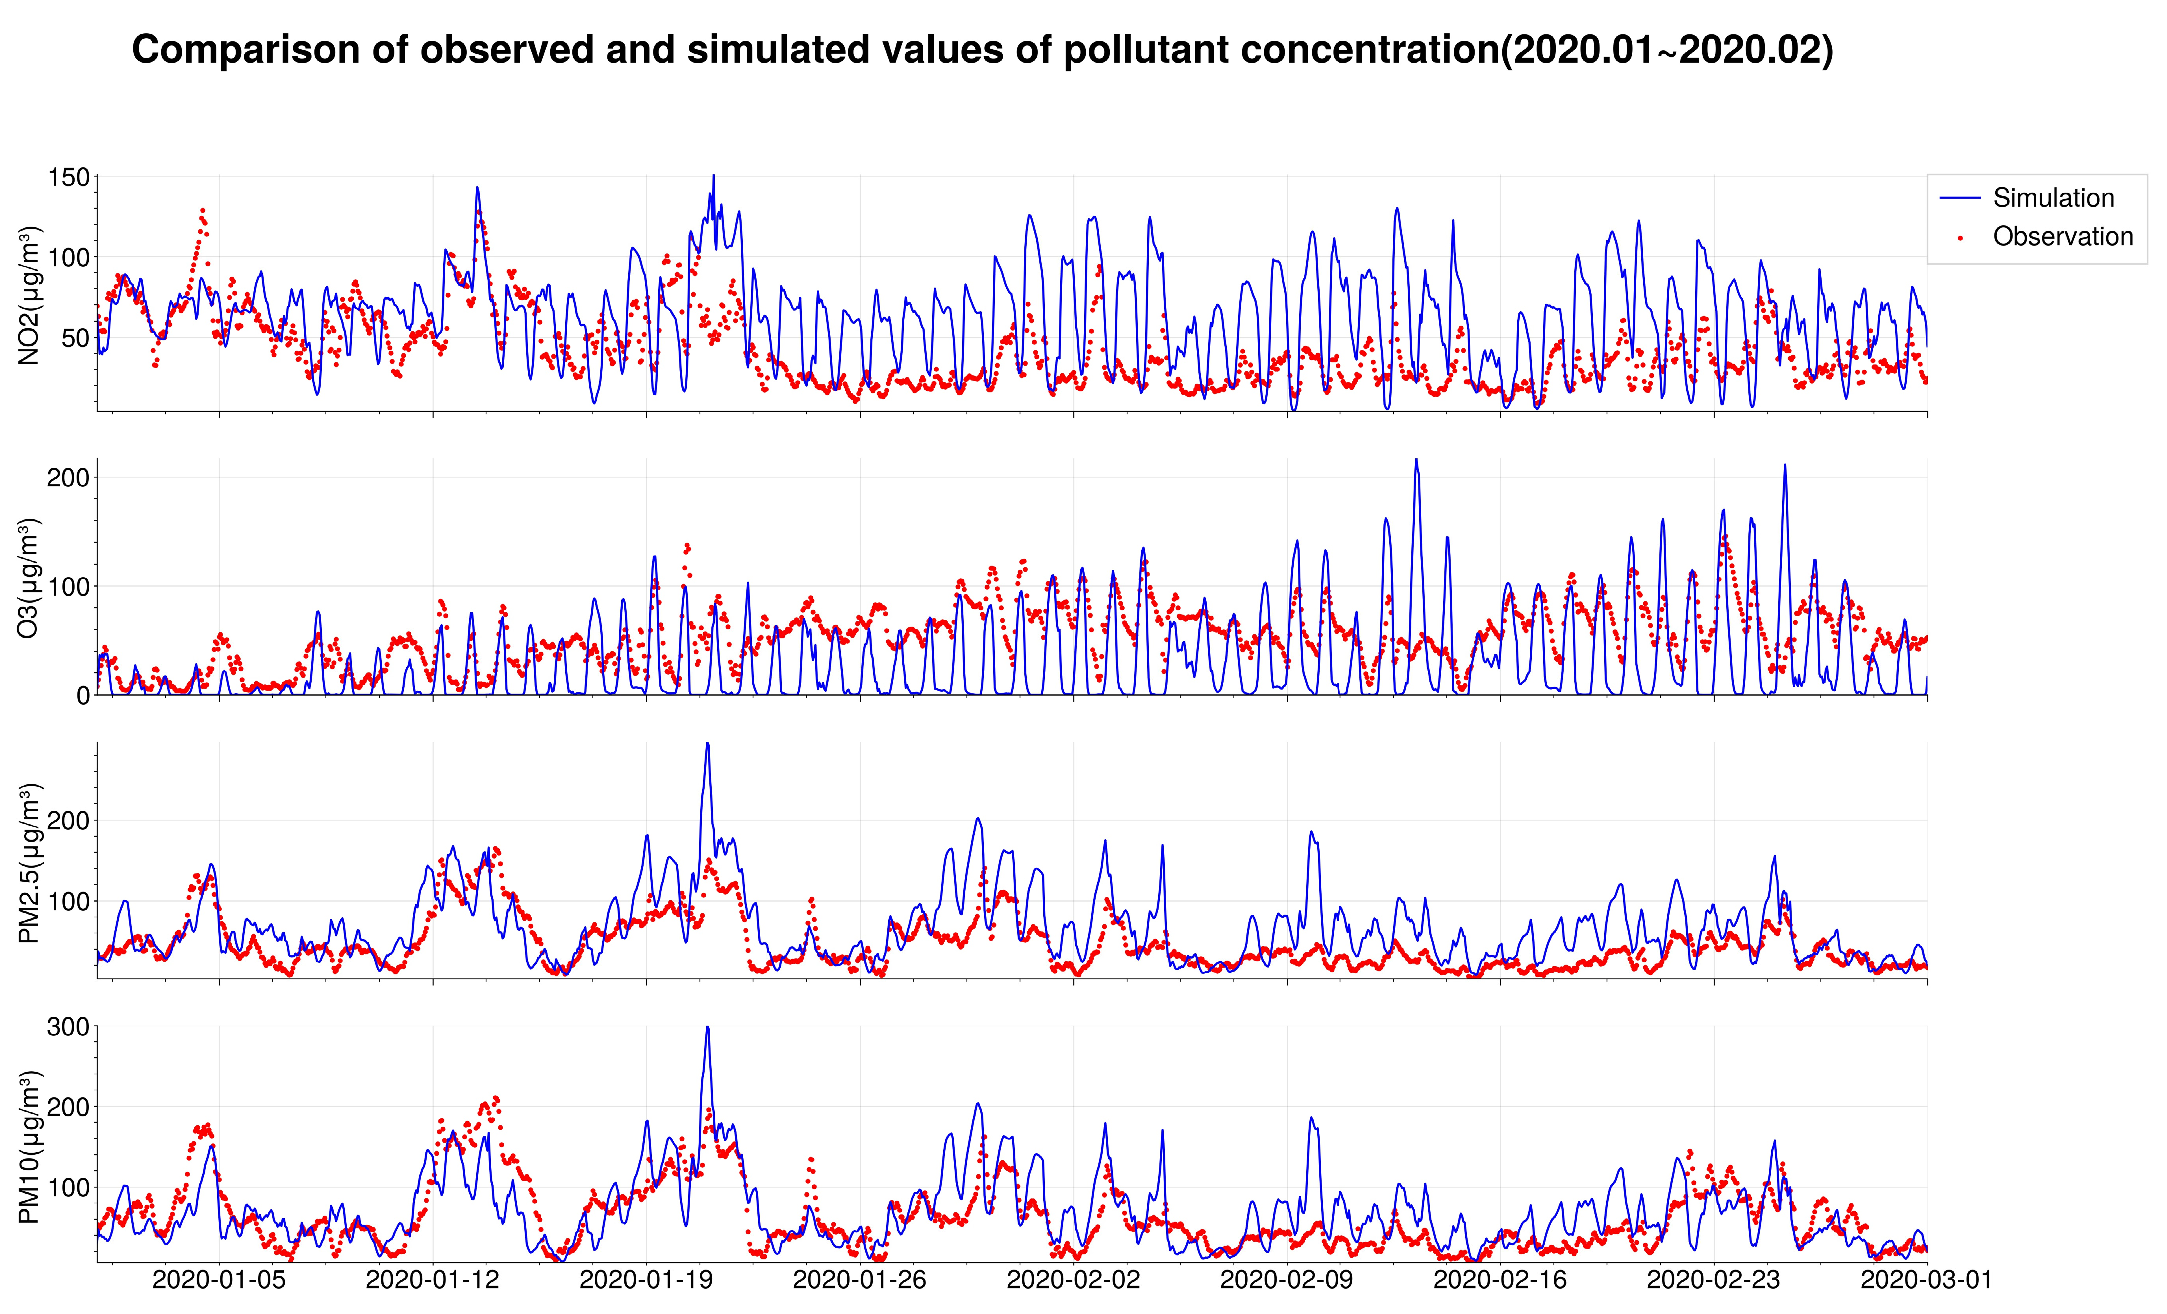
Figure 2 and
Figure 3 show the hour-by-hour near-surface NO
2, O
3, PM
2.5, and PM
10 concentration time series from ground-based observations and model simulations for January and February 2019 and 2020, and the model performance for PM
10, PM
2.5, NO
2, and O
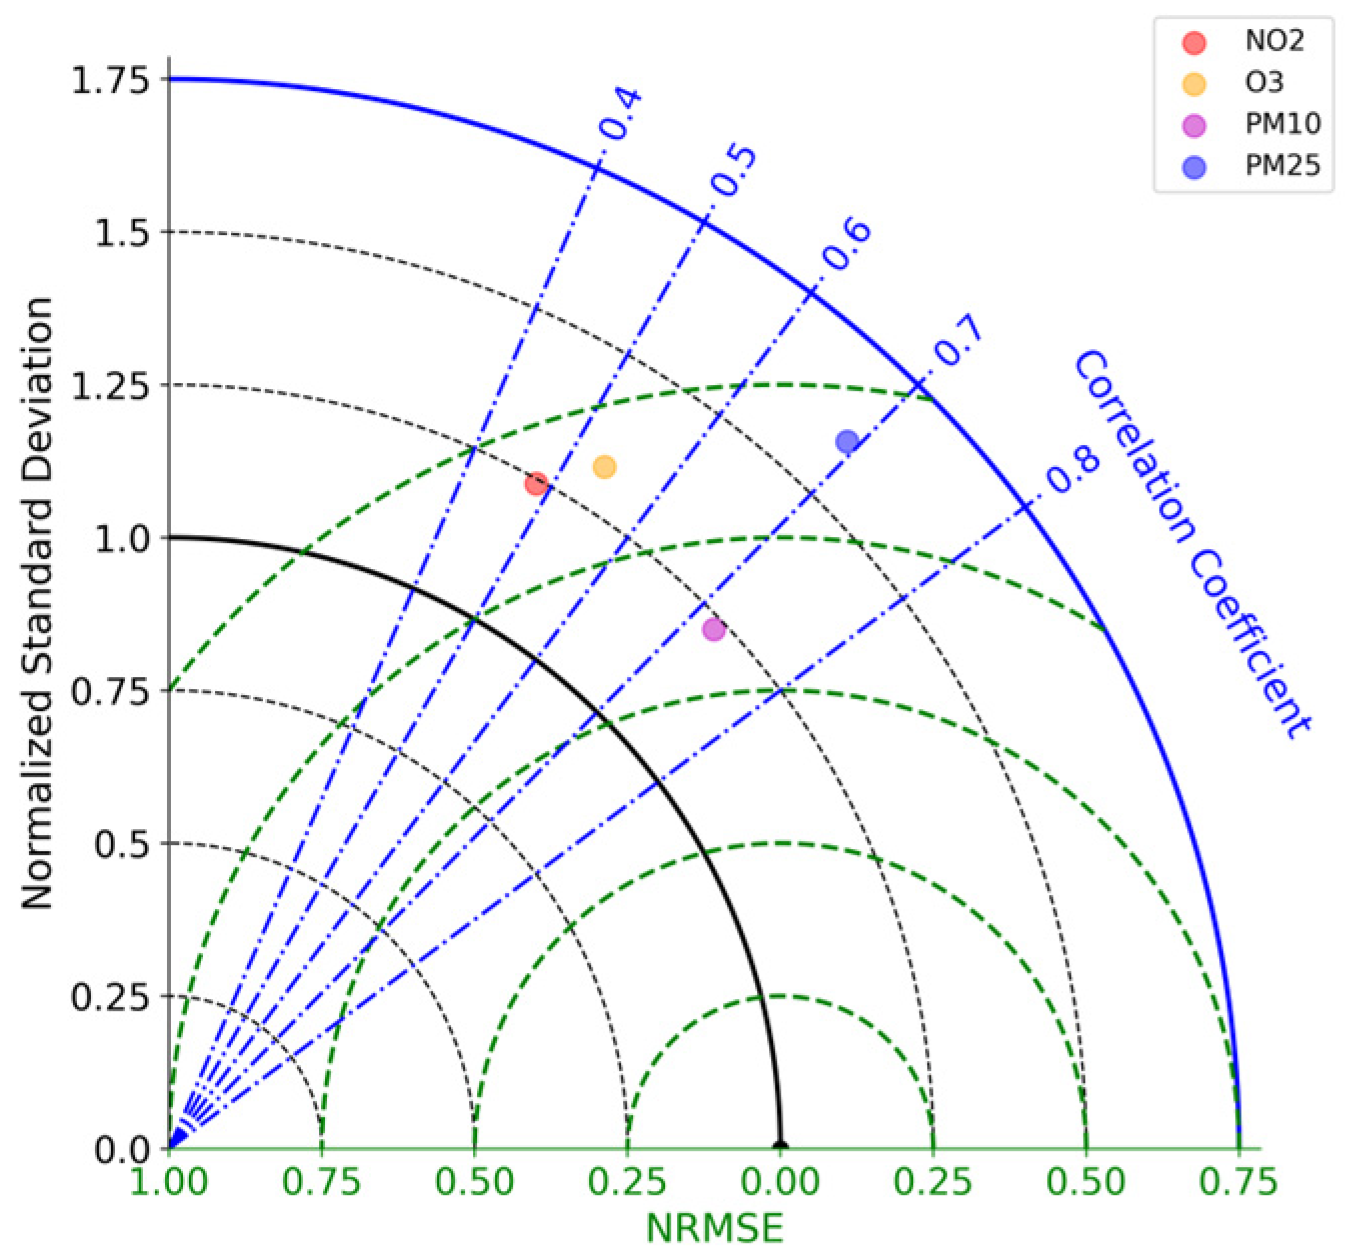
3 for 2019 and 2020 is given in
Table 4 and
Table 5 and presented in Taylor diagrams (see
Figure 4 and
Figure 5). Boylan and Russell [
39] proposed the use of mean fractional deviation (MFB) and mean fractional error (MFE) as measures. If the MFB is within ±30% and the MFE is less than 50%, the simulation performance is excellent; if the MFB is within ±60% and the MFE is less than 75%, the model simulation capability is within acceptable limits.
In terms of PM2.5, the WRF-Chem model could reproduce well the trend of near-ground PM2.5 concentrations over time (R2019 = 0.70, R2020 = 0.67), but during the COVID-19 lockdown period, the model simulated significantly higher PM2.5 concentrations (NMB2019 = 32%, NMB2020 = 45%). For PM10, the model was not only able to simulate the trend of PM10 concentration over time well (R2019 = 0.72, R2020 = 0.64) but could also simulate PM10 concentrations accurately (NMB2019 = 0%, NMB2020 = 10%). For NO2, the correlation between the simulated values and the observed values was general (R2019 = 0.48, R2020 = 0.42), and the model could overestimate the concentration of NO2 (NMB2019 = 33%), and the simulated values of the concentration of NO2 during the COVID-19 lockdown period would be higher. (NMB2020 = 54%). For O3, the correlation between the simulated values and the observed values of the model was also general (R2019 = 0.54, R2020 = 0.49), and the simulated values of the model showed obvious diurnal variation. The model could well reappear the situation when the concentration of O3 is high, but when the actual concentration of O3 is low, the simulation effect of the model is poor, and the simulated values were far lower than the observed values. From the perspective of MFE and MFB, the model performance of NO2, PM2.5, and PM10 is excellent, except for O3. From the perspective of NMB, the model overestimated the concentration of NO2 and PM2.5, especially the concentration of NO2 and PM2.5 during the COVID-19 lockdown period in 2020, but the model underestimated the concentration of O3.
Overall, the WRF-Chem model can better reappear the trends of pollutant concentrations over time, but it has some degree of error in the simulation of pollutant concentrations. The simulation effectiveness of the WRF Chem model in 2020 is decreasing compared to that in 2019, and the pollutant concentration results of the model simulation are higher during the 2020 COVID-19 lockdown period. The results of the patterns provide a research basis for discussing later the changes in air pollutants in Nanjing during the outbreak blockade period and the changes in pollutant concentrations from industrial emissions and traffic emissions.
3.2. Changes in Air Pollutant Concentrations during the LP Compared to the NP
This section discusses the changes in air pollutant concentrations during the initial outbreak of the COVID-19 epidemic in Nanjing. Changes in atmospheric pollutant concentrations are influenced by a combination of meteorological conditions and anthropogenic emissions. It has been shown [
40] that compared to February 2019, the average wind speed, relative humidity, and cumulative effective precipitation days were approximately the same during the same period in 2020 as during the COVID-19 lockdown period, with higher average temperatures and slightly higher cumulative precipitation, making meteorological conditions more favorable for the dispersion of pollutants. By comparing the simulation results in 2019 and 2020 in Scenario 1, the changes in air pollutants in Nanjing during the LP could be obtained.
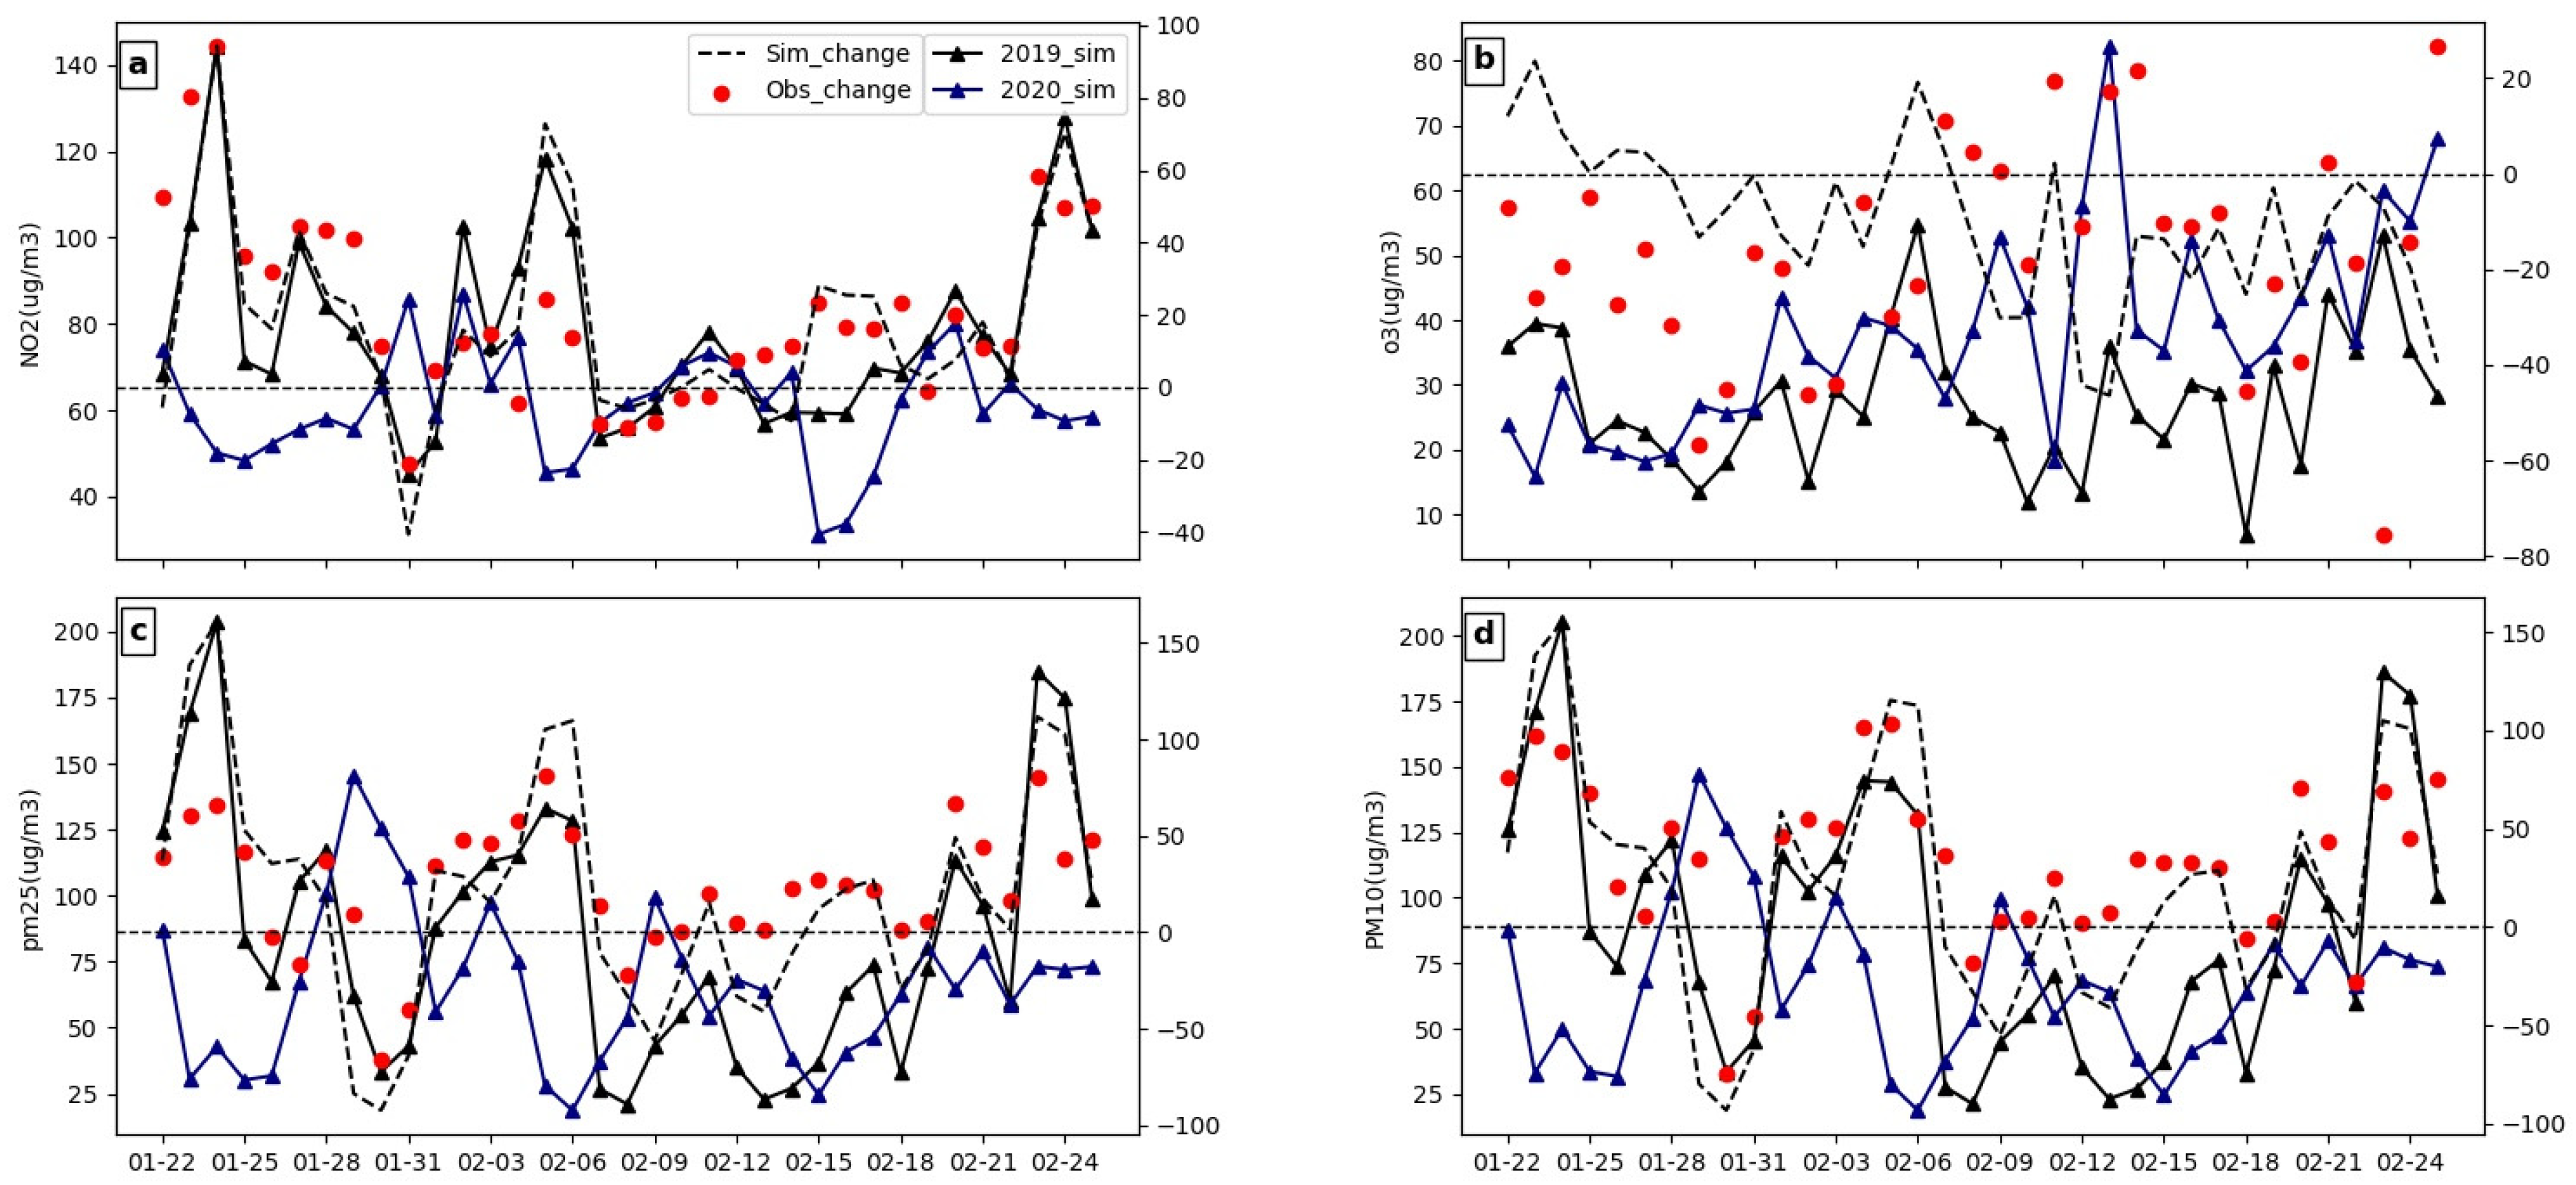
Figure 6 shows the time series of model-simulated daily mean near-surface NO
2, O
3, PM
2.5, and PM
10 concentrations during the NP (2019_sim) and LP (2020_sim), with the differences between 2019 and 2020 observations and model-simulated NO
2, O
3, PM
2.5, and PM
10 concentrations.
As shown in
Figure 6 and
Table 6, the simulated day-by-day average changes in NO
2, O
3, PM
2.5, and PM
10 concentrations between the NP and LP agree well with the observed changes, indicating that the model could reproduce the daily NO
2, PM
2.5, and PM
10 changes between the NP and LP, with O
3 not being too effective. From 24 January to 3 February, influenced by the COVID-19 lockdown policies and the 2020 Chinese New Year, the daily average NO
2 concentrations in 2020 were much smaller than those in the same period in 2019, except for some days. Between 4 February and 12 February, influenced by the 2019 Chinese New Year, the difference in daily average NO
2 concentrations gradually decreased, and the daily average NO
2 concentrations in 2020 were the same as those in the same period in 2019. Between 4 February and 13 February, the difference in daily average NO
2 concentrations gradually increased again.
In terms of PM2.5 and PM10 daily mean concentration changes, the modeling results could reproduce well the observed daily mean concentration temporal trends and concentration trends. In addition to some days being affected by meteorological conditions such as rainfall, for example, between 24 January and 26 January, the weather conditions in 2020 were rainy and influenced by rainfall and the lockdown of the epidemic, and the concentrations of PM2.5 and PM10 in 2020 were much lower during this period than during the same period in 2019. Between 28 January and 30 January 2019, weather conditions were rainy, causing the 2019 PM2.5 and PM10 concentrations to be lower than those during the 2020 COVID-19 lockdown. Between 4 February and 12 February, influenced by the 2019 Chinese New Year, the PM2.5 and PM10 daily average concentrations in 2019 decreased and were on par with the same period in 2020. After 13 February, the difference between the daily average PM2.5 and PM10 concentrations gradually increased again. Overall, the daily average concentrations of PM2.5 and PM10 showed an overall decreasing trend during the 2020 COVID-19 lockdown period due to strict lockdown policies. In contrast to the other three pollutants, O3 concentrations showed an increasing trend during the 2020 outbreak compared to the same period in 2019, except for some days, and although the model was able to reproduce the trend in O3 concentrations, it still underestimated the increase in O3 concentrations.
Figure 7 shows the spatial distribution of mean near-surface NO
2, O
3, PM
2.5 and PM
10 concentrations (μg/m
3) and the proportional reduction in pollutants during the NP and LP for the Nanjing model simulation. The figure shows that most of the major PM
2.5 reduction areas were near the main urban areas of Nanjing, with the average PM
2.5 concentration falling from 72–90 μg/m
3 in 2019 to 60–80 μg/m
3 in 2020, a reduction in over 20%, and the PM
10 situation was similar to that of PM
2.5. In addition, the change in the particulate matter also showed a clear urban-rural difference, with a greater reduction in particulate matter in the main urban areas of Nanjing than in the suburbs of Nanjing. The figure also shows that the average NO
2 concentration decreased from 55~75 μg/m
3 in 2019 to 40~65
in 2020, with a decrease of approximately 16~40% in the area covered by high NO
2 concentrations, and it shows that there was a gradual increase from north to south. The average concentration of O
3, on the other hand, showed an opposite trend to the other three pollutants, with the average O
3 concentration during the LP rising from 20~50
to 30~65
compared to the NP. The area of increase in the average O
3 concentration was mainly near the main urban area of Nanjing, with an increase in more than 40%, and the average O
3 concentration in the northern suburbs of Nanjing had a small decrease. Ozone chemistry was highly nonlinear, and its production was at NO
x saturation (NO
x = NO + NO
2) during winter in urban China due to the relative lack of HOX radicals [
41]. In addition, it can be seen from
Table 7 that the decrease in NO
x significantly reduced O
3 depletion (NO + O
3 = NO
2 + O
2), which led to an increase in O
3 concentration and eased ozone titration [
42]. Thus, a decrease in NO
x led to an increase in ozone [
43].
In conclusion, the reduction in mean NO
2, PM
2.5, and PM
10 concentrations and the increase in mean O
3 concentrations during the epidemic lockdown in Nanjing were comparable to previous results. The reduction in human mobility, traffic restrictions, and the shutdown of factories during the LP were the main reasons for the reduction in pollutant concentrations. In previous studies, Wang et al. [
44] studied the nonlinear effects of four typical pollutants (PM
2.5, NO
2, SO
2, and O
3) in eight cities around the world (Wuhan, China; New York, USA; Milan, Italy; Madrid, Spain; Bandra, India; London, UK; Tokyo, Japan; and Mexico City, Mexico) and found that COVID-19 lockdown policies reduced only NO
2 and PM
2.5, while O
3 concentrations increased somewhat. According to Chen et al. [
9], strict COVID-19 lockdown policies significantly improved air quality in many provinces in mainland China, with national average concentrations of PM
2.5, PM
10, and NO
2 decreasing by 14%, 15%, and 16%, respectively, and O
3 concentrations increasing by 9% during January-April 2020 compared to 2019.
3.3. Changes in Pollutant Concentrations in Industrial Emissions during the LP Compared to the NP
The first priority for controlling air pollutant emissions is industrial emissions [
45], which are the main source of PM
2.5, PM
10, and NO
x emissions. The lockdown policies during the LP in 2020 had a significant impact on the industry, with factories and companies shutting down or reducing their operations, but we do not know from the observed data exactly how much industrial emissions were reduced. Therefore, we used MEIC’s latest anthropogenic emission inventories for 2019 and 2020 [
34] and designed experiments to quantify the changes in pollutant emissions from industry in Nanjing during the LP. By subtracting the simulation results of 2019 in Scenario 1 and Scenario 2, we obtained the industrial emission pollutant data during the NP, and by subtracting the simulation results of 2020 in Scenario 1 and Scenario 2, we obtained the industrial emission pollutant data during the LP, and the difference between the two was the change in industrial emission pollutants in Nanjing during the LP.
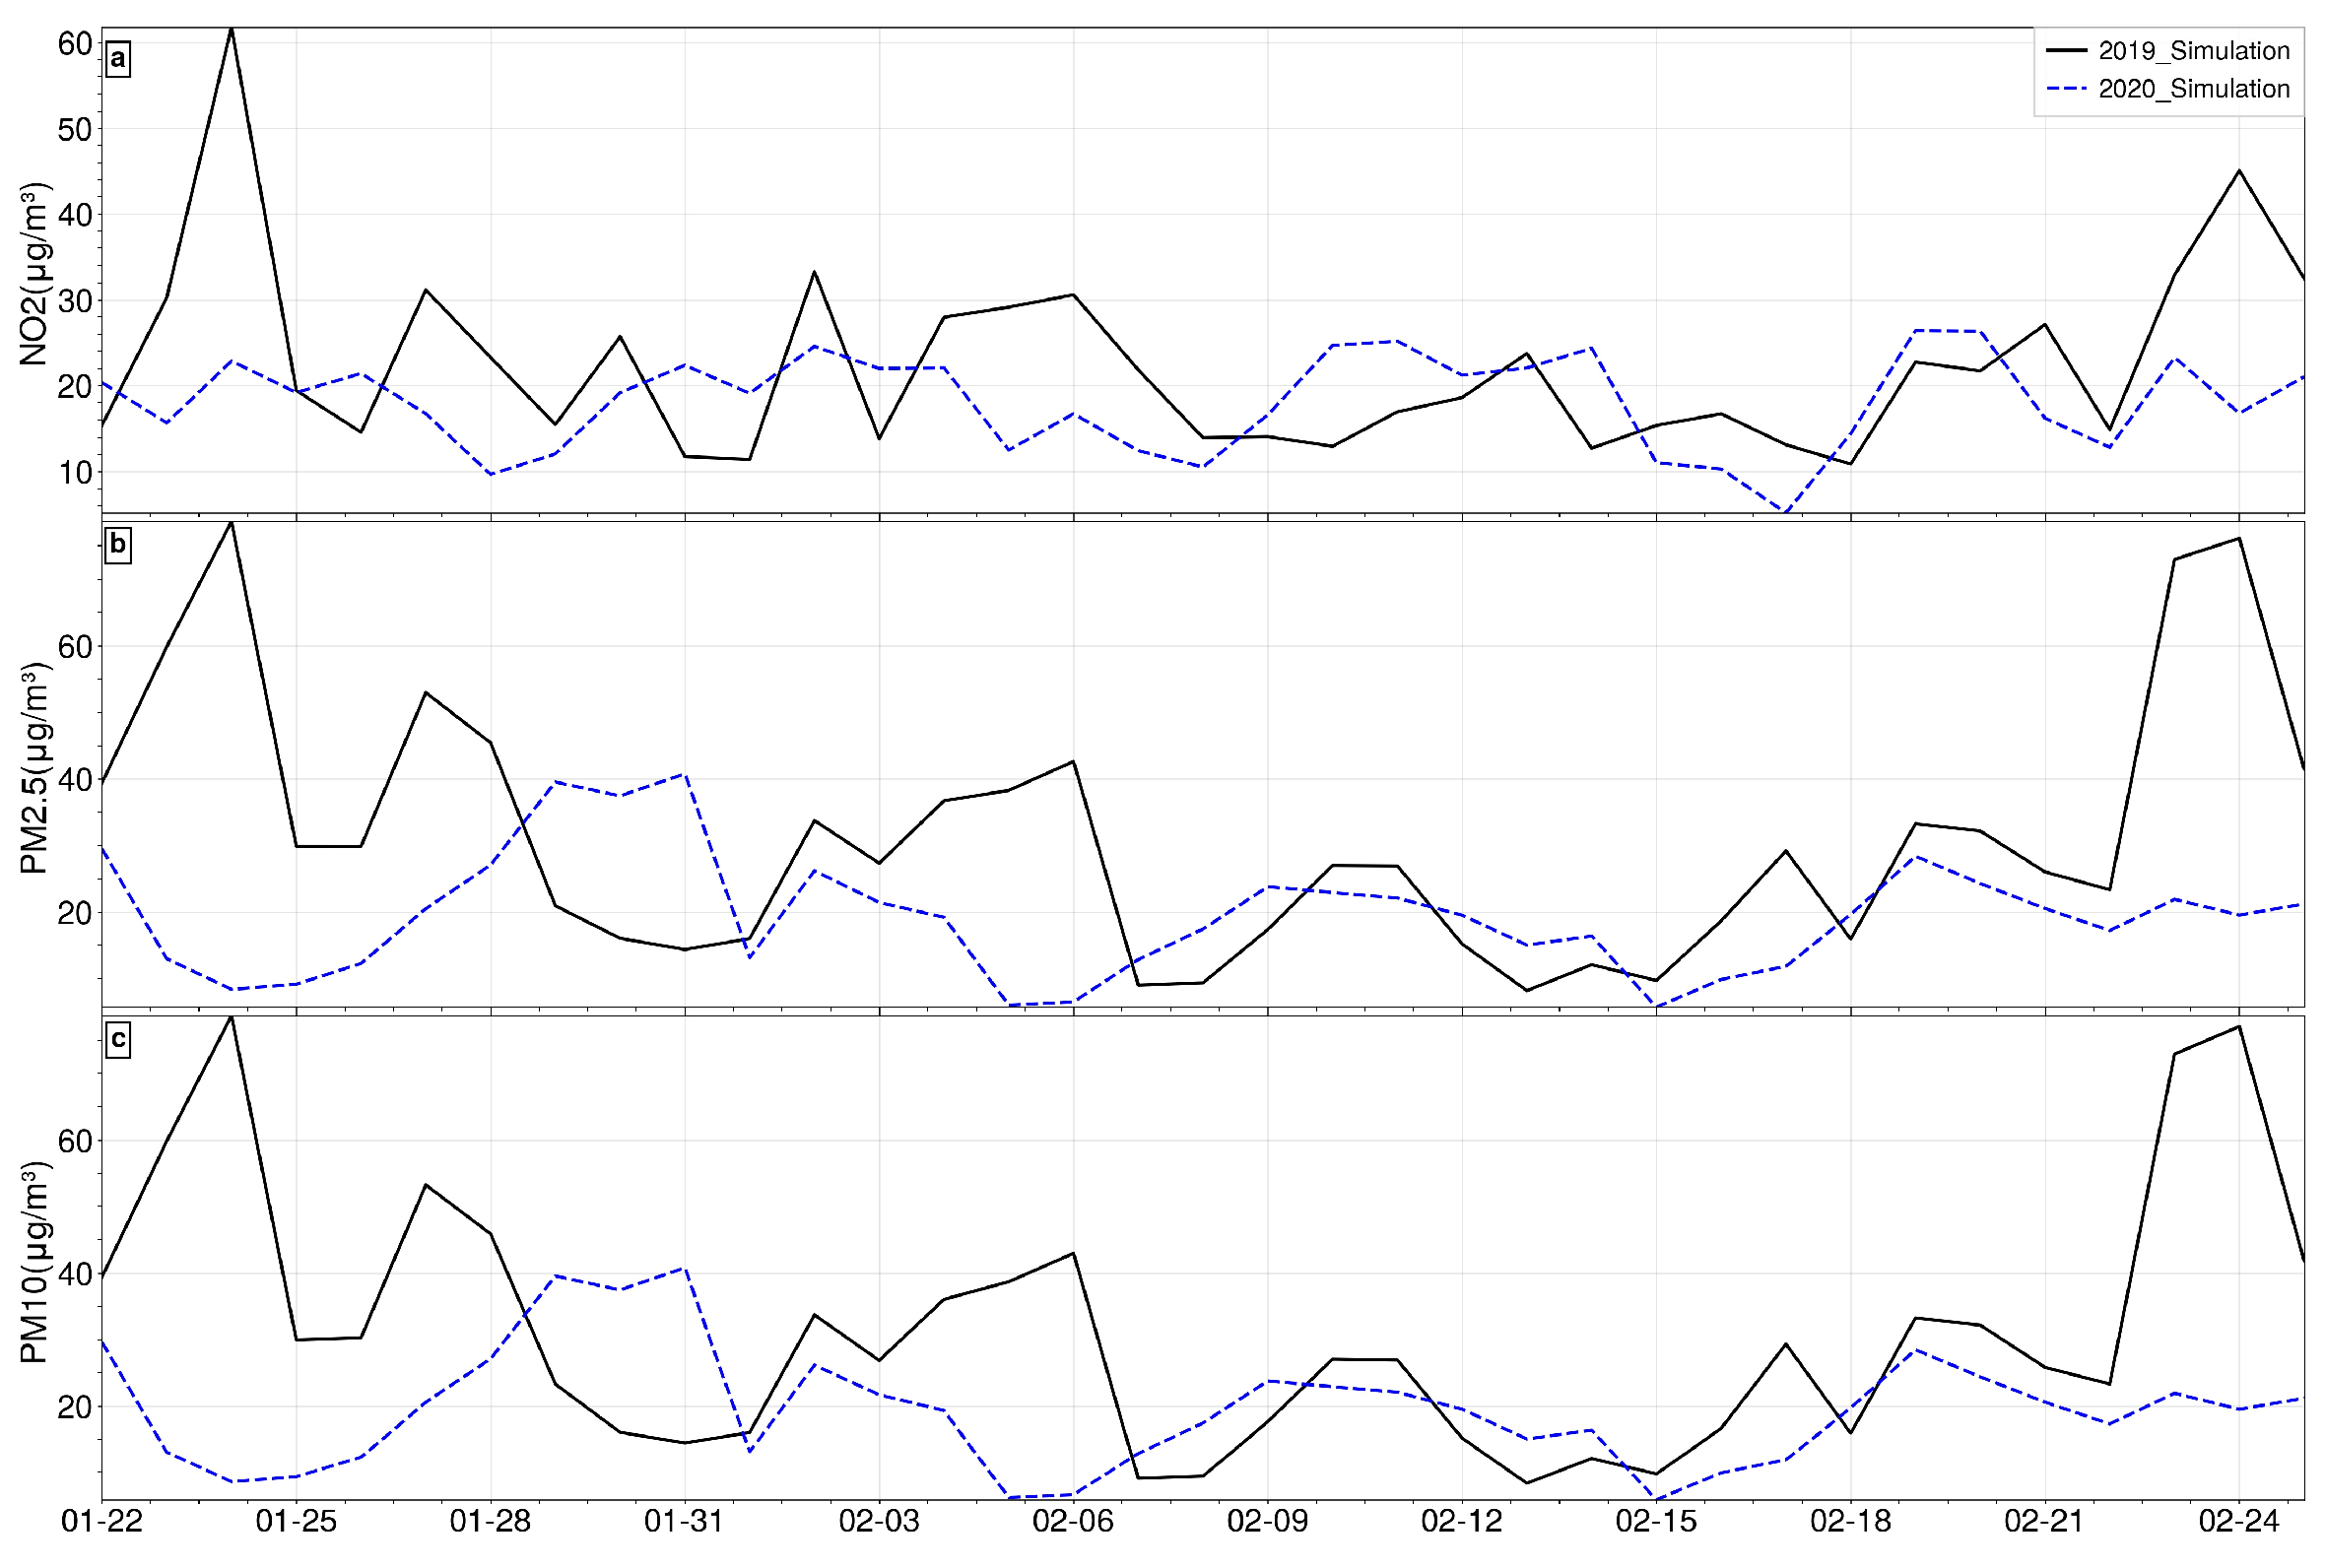
As shown in
Figure 8, the impact of the lockdown policies at the beginning of the outbreak of COVID-19 in 2020 on the daily average concentrations of industrial emissions of NO
2 was limited. The daily average concentrations of industrial emissions of NO
2 during the entire LP were approximately 20
, and the magnitude of change in the daily average concentrations of NO
2 was not too great except for some days. Compared to the NP, the overall average daily concentrations of industrial emissions of NO
2 for the LP were still somewhat lower, but the reduction was not too significant. Industrial emissions, specifically PM
2.5 and PM
10 daily average concentrations, changed with a similar trend. At the beginning of the outbreak in 2020, Nanjing implemented a shutdown of enterprises and factories. Between 22 January and 26 January, there was a clear downward trend in PM
2.5 and PM
10 daily average concentrations due to the lockdown policies and rainfall. Between 27 January and 31 January, as the weather gradually cleared and the atmosphere stabilized, forming stationary weather, the PM
2.5 and PM
10 daily average concentrations gradually increased. Between 1 February and 6 February, as the temperature increased, the PM
2.5 and PM
10 daily average concentrations decreased. During the period from 1 February to 6 February, the daily average concentrations of PM
2.5 and PM
10 gradually increased as the temperature increased. From 7 February to 15 February, some important livelihood enterprises in Nanjing started to resume work and production, and the daily average PM
2.5 and PM
10 concentrations gradually rose but were affected by rainfall and snowfall, and the daily average PM
2.5 and PM
10 concentrations still decreased to a certain extent after the rise. After 16 February, the daily average PM
2.5 and PM
10 concentrations gradually rose again and tended to stabilize. Overall, the industrial emissions, specifically PM
2.5 and PM
10 daily average concentrations, during the LP still decreased to a greater extent compared to the NP.
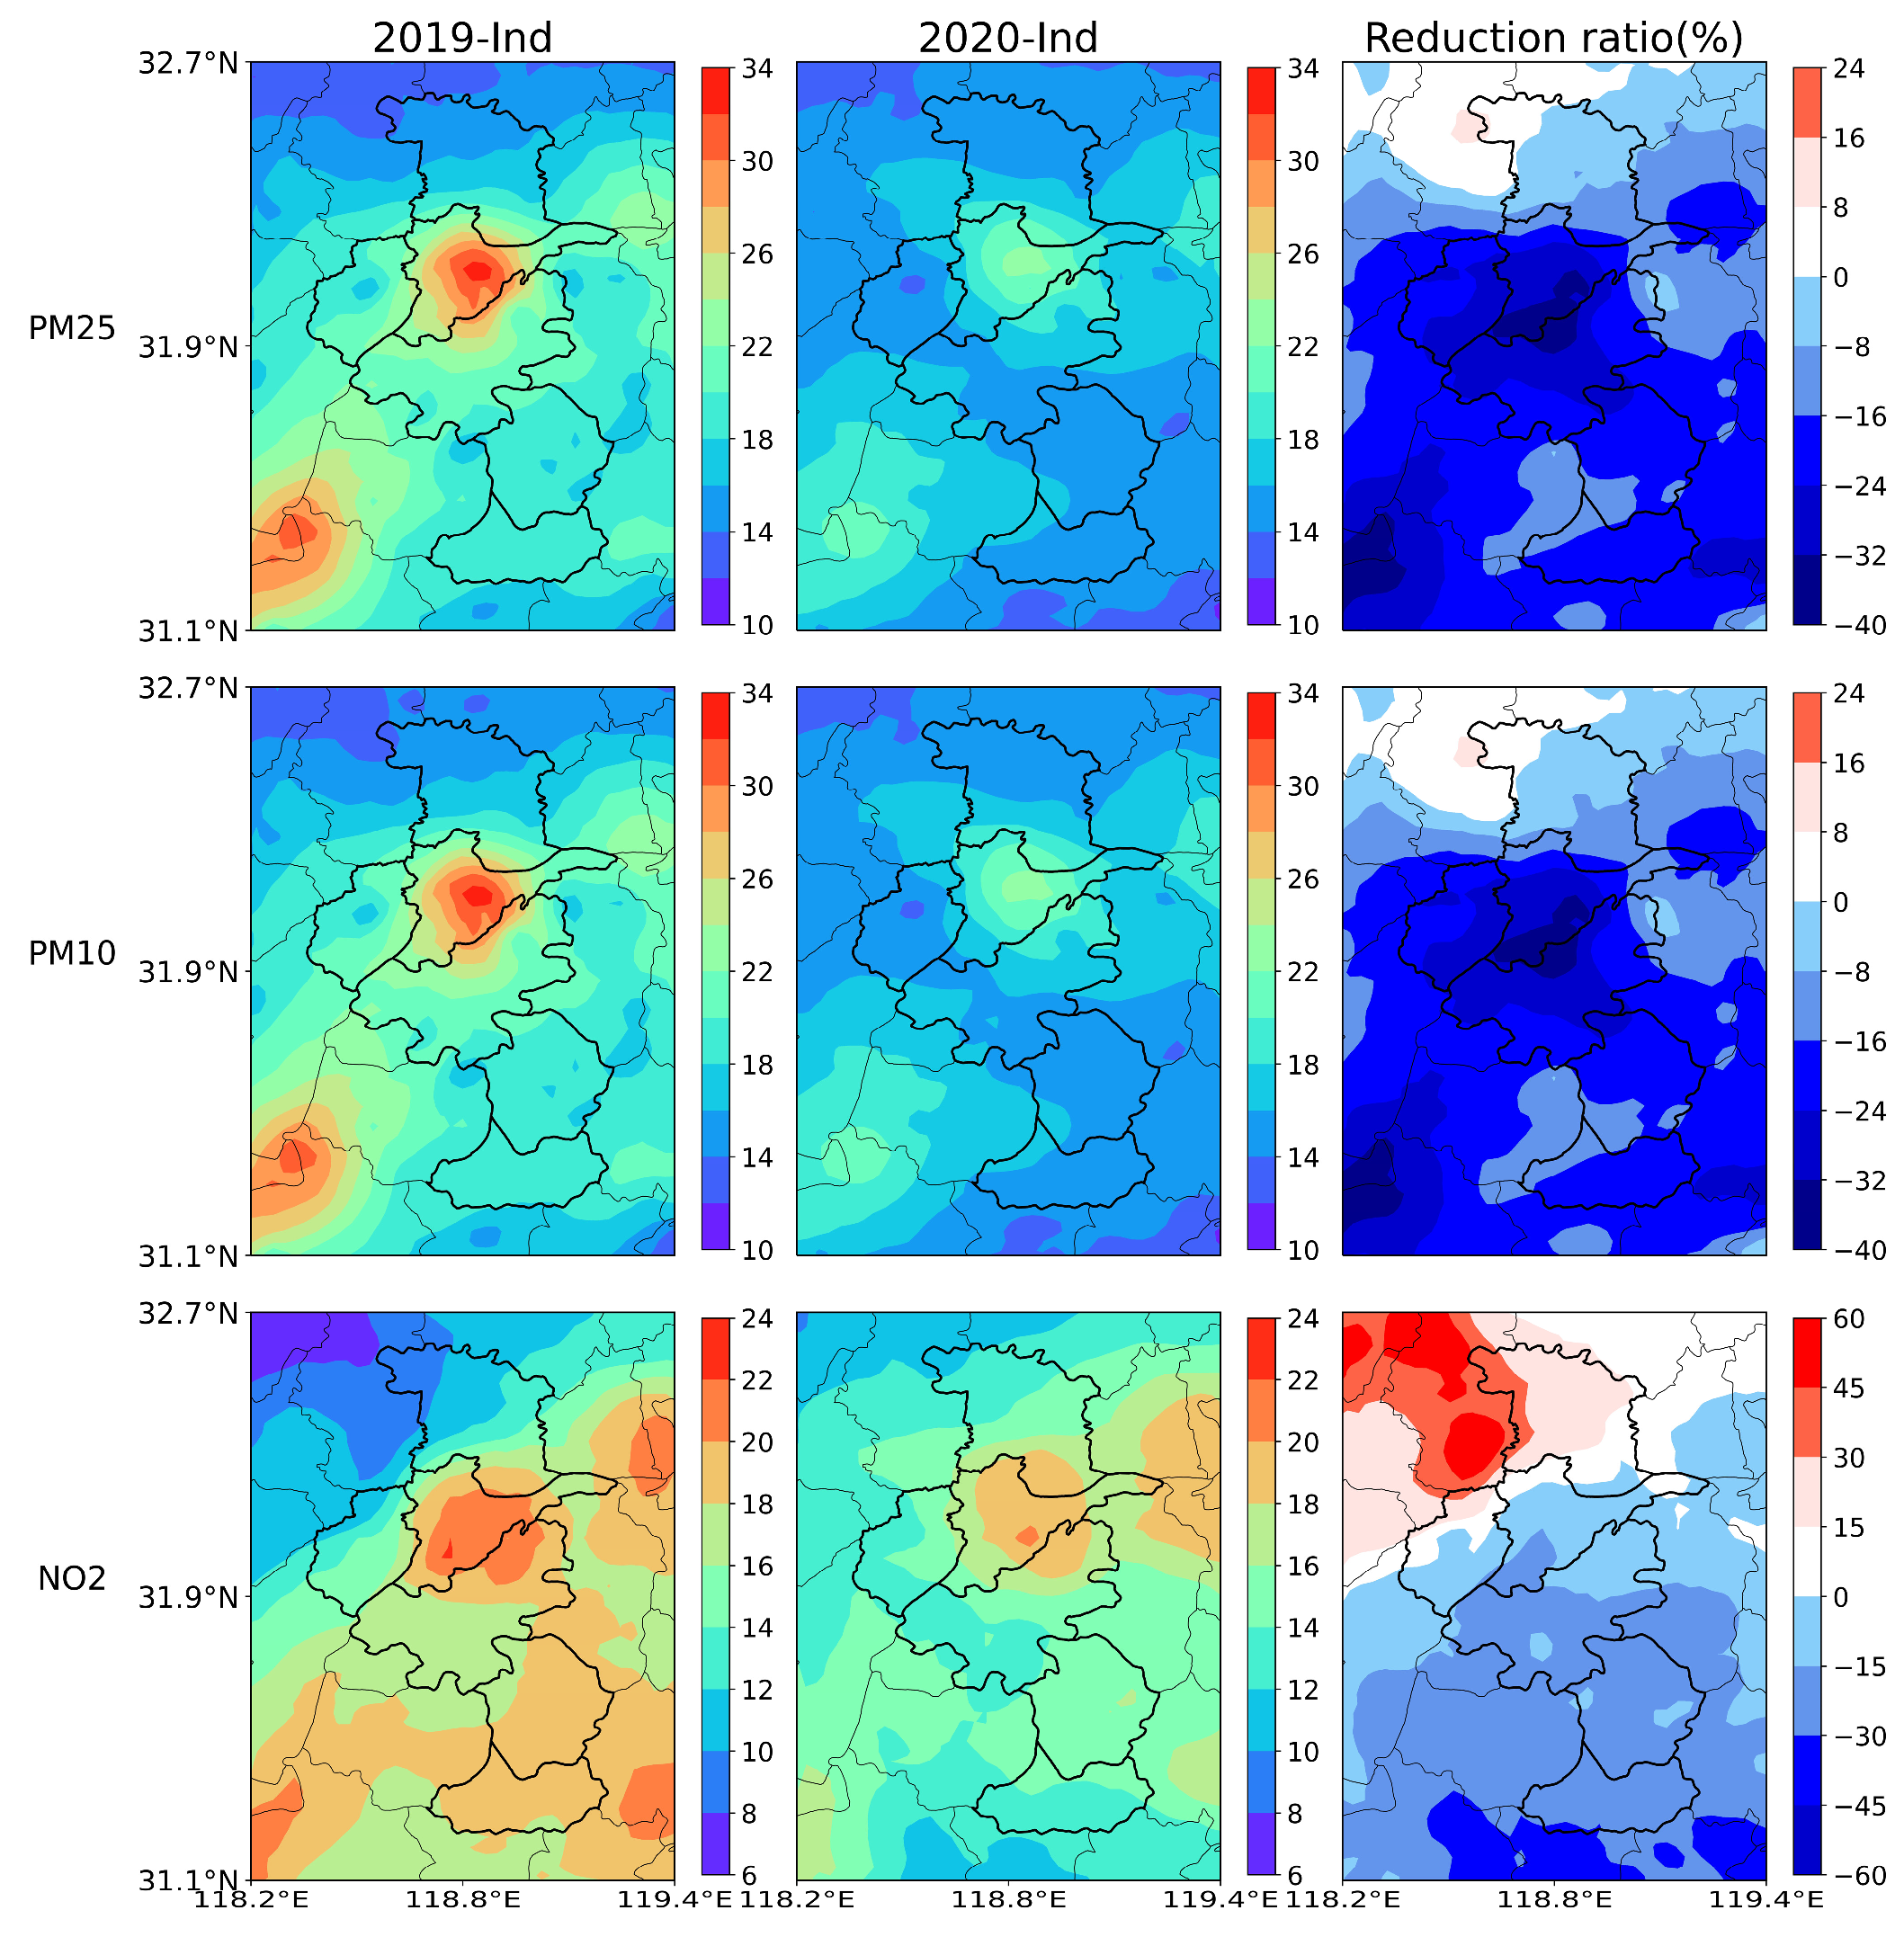
Figure 9 shows the average concentrations of industrial emissions of air pollutants in Nanjing during the LP, the NP, and the changes in industrial emissions of pollutants in Nanjing during the LP. The figure shows that the areas with the largest decrease in PM
2.5 and PM
10 concentrations from industrial emissions in Nanjing was located in the Yuhuatai, Jiangning, and Pukou districts of Nanjing, which is consistent with the actual locations of the major industrial zones in Nanjing. As a result of the COVID-19 lockdown policies, the average industrial emissions, specifically PM
2.5 and PM
10 concentrations, in Nanjing decreased by approximately 3~14
; a decrease in approximately 24~40% compared to the NP. The decrease in the average concentration of industrial NO
2 emissions was mainly located in the southern region of Nanjing (Jiangning District, Gaochun District, Lishui District, and Yuhuatai District), with a decrease in approximately 15~30%. The change in the concentration of industrial emissions of NO
2 in the main urban area of Nanjing was not too great, while the average concentration of industrial emissions of NO
2 in the northern area of Nanjing even showed a small increase, with a rise of approximately 15–30%.
Overall, the concentration of PM
2.5 and PM
10 from industrial emissions decreased by about 24~40% during the LP. In contrast, COVID-19 lockdown policies did not have as great an effect on the concentrations of NO
2 from industrial emissions, which decreased by about 15% to 30%. PM
2.5 and PM
10 concentrations are more sensitive to primary particulate matter emissions [
46], so the impact of COVID-19 lockdown policies on industrial emissions in 2020 is more reflected in PM
2.5 and PM
10.
3.4. Changes in Pollutant Concentrations in Traffic Emissions during the LP Compared to the NP
In recent years, as the number of motor vehicles has increased year by year, the total amount of pollution emitted from motor vehicles has also increased dramatically. Anthropogenic emissions from the transport sector are also considered to be one of the main causes of air pollution, especially NO
x concentrations [
47]. The impact of the COVID-19 lockdown policies, the implementation of very strict traffic controls at all levels of government from the end of January 2020, and the sharp reduction in motor vehicle road access, coupled with strict restrictions on residential travel, resulted in a significant reduction in traffic emissions. Feng et al. [
48] used a regional data assimilation system and near-surface NO
2 observations to extrapolate daily NO
x emissions and found that across China, NO
x emissions were reduced by 36% as a result of the COVID-19 lockdown, which was mainly due to a reduction in transport. Jeong et al. [
49] found that in the Canadian city of Toronto during COVID-19, average traffic decreased by 58%, while PM
2.5 decreased by only 4% relative to the baseline. Therefore, using the same approach as quantifying industrial emissions, the latest MEIC emission inventories for 2019 and 2020 were used to obtain traffic emission pollutant data for 2019 for the same period as COVID-19 lockdown by subtracting the simulation results for 2019 from Scenario 1 and Scenario 3 and subtracting the simulation results for 2020 from Scenario 1 and Scenario 3 to obtain traffic emission pollutant data for 2020 during the COVID-19 lockdown period, with the difference between the two being the change in traffic emission pollutant concentrations in Nanjing during the COVID-19 lockdown period.
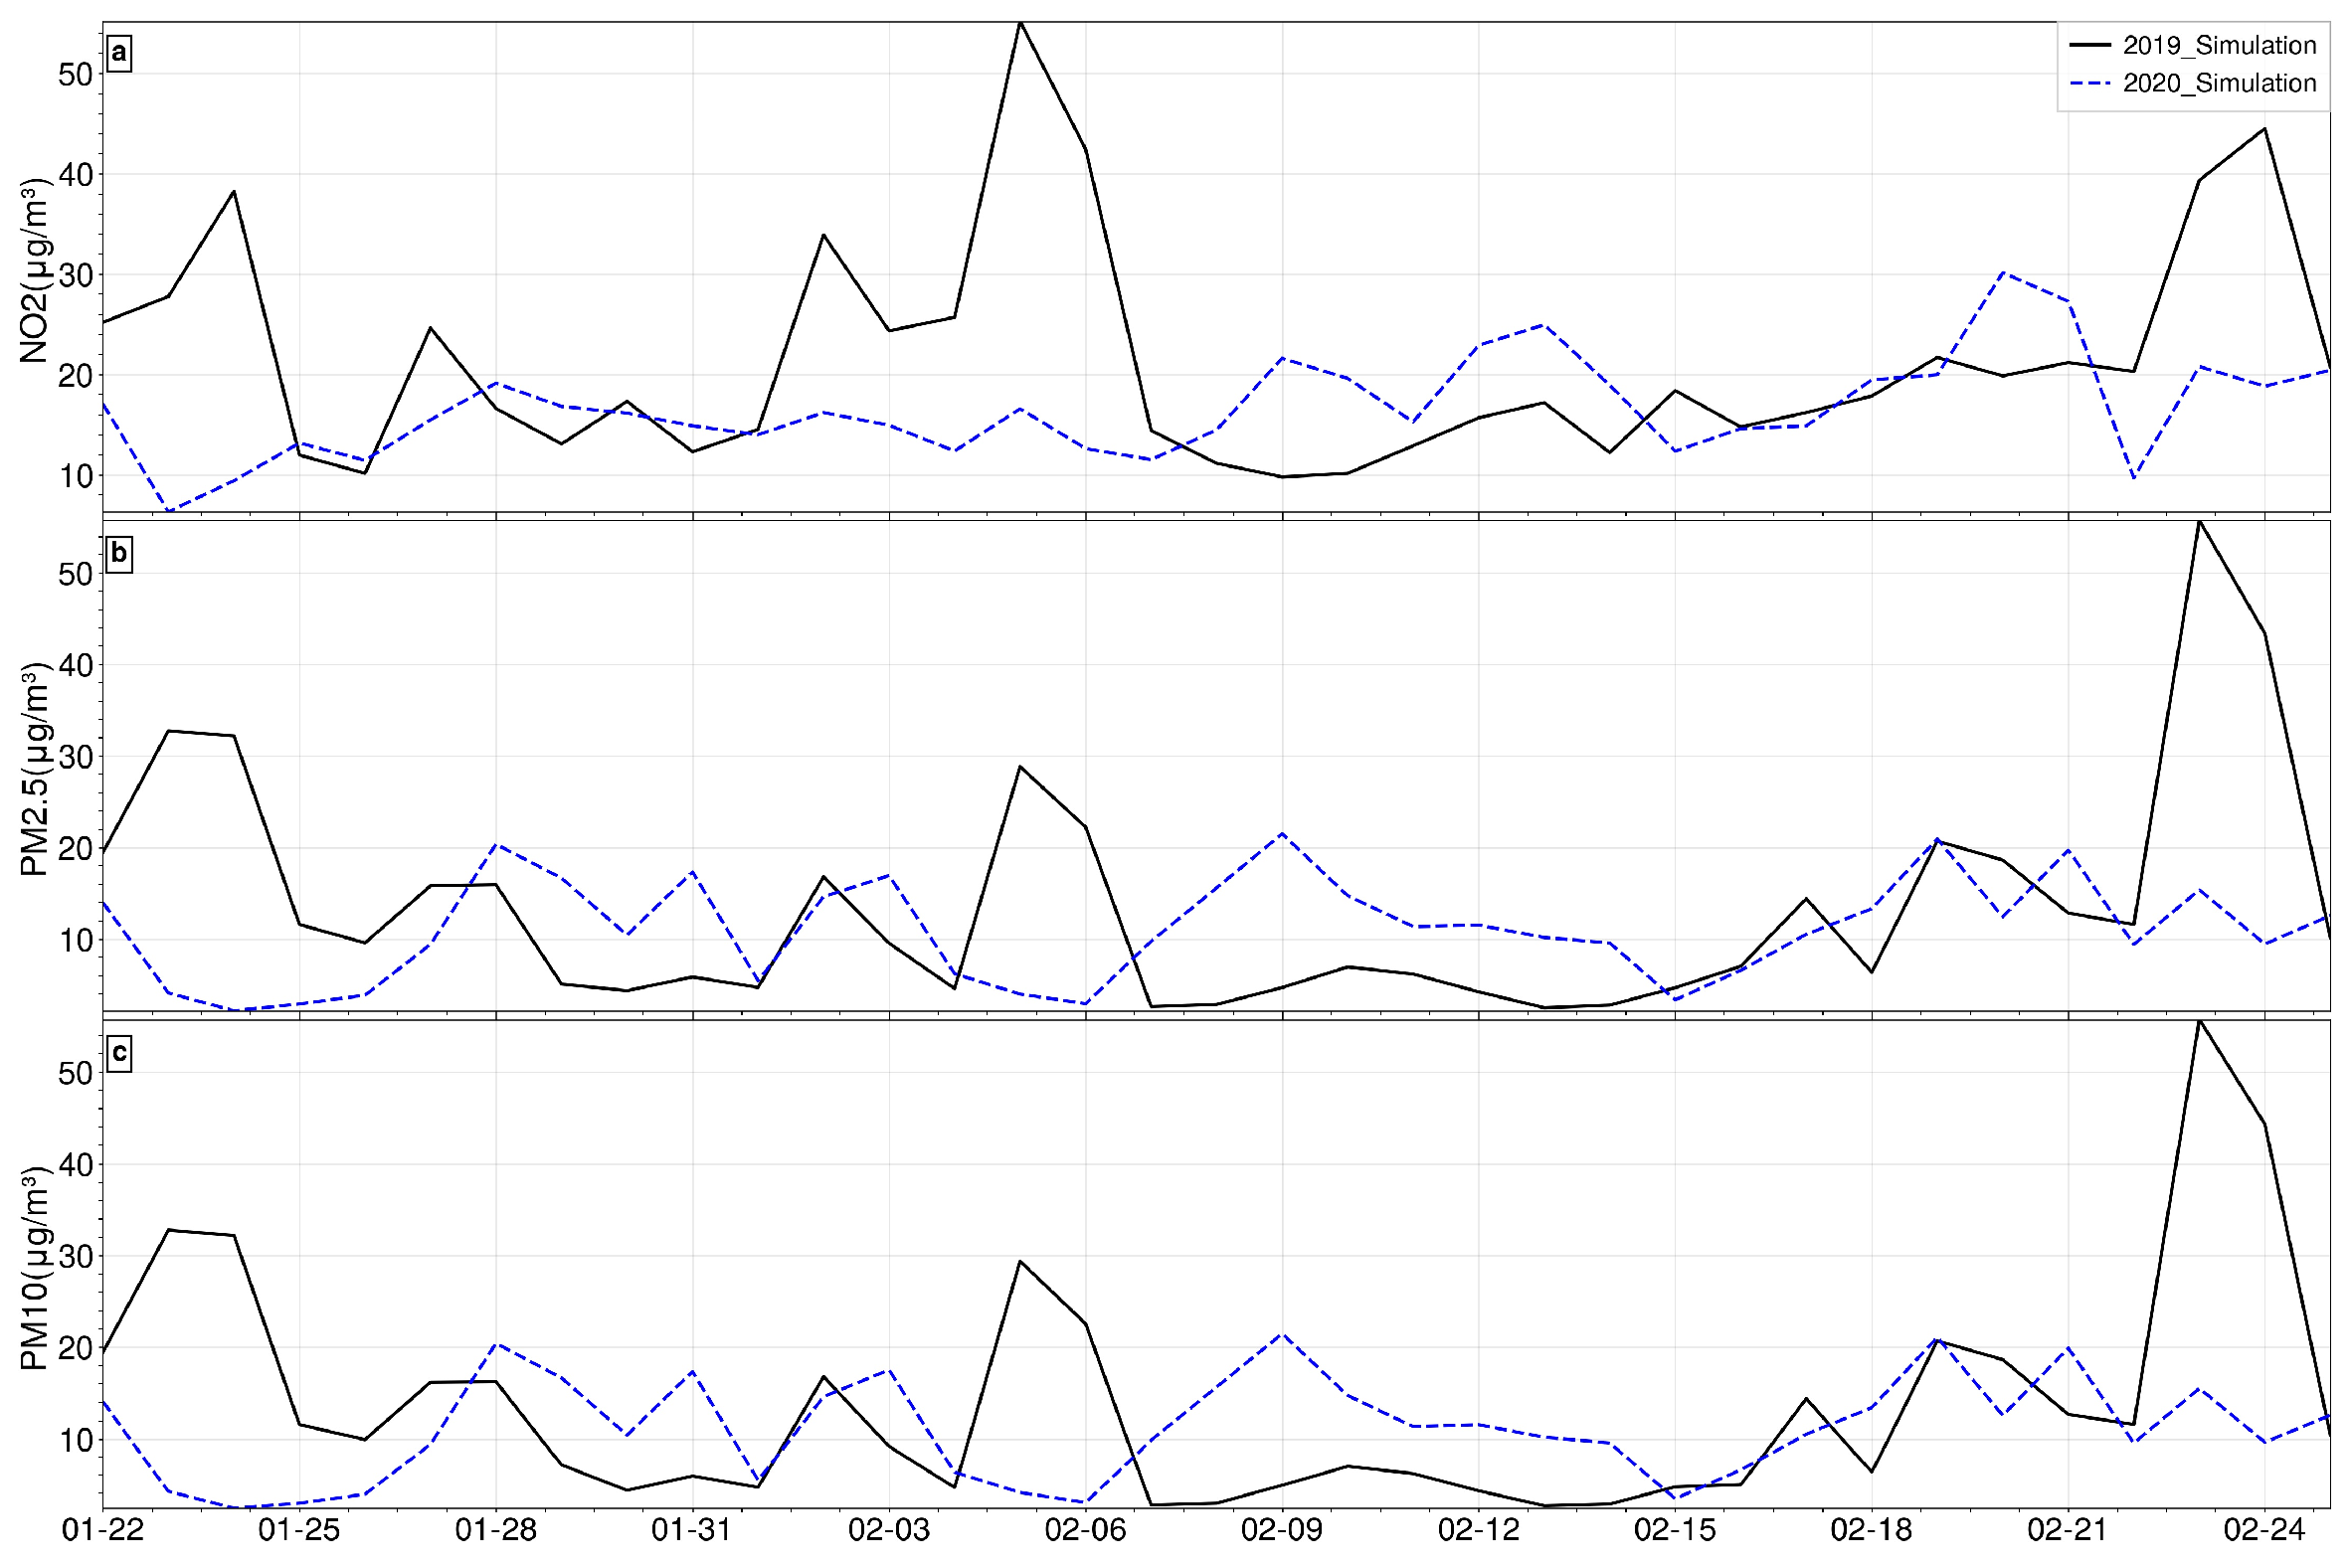
As shown in
Figure 10, the average daily NO
2 concentration from traffic emissions during the LP was approximately 20
, which was not too different compared to the average daily NO
2 concentration during the same period in 2019, except for some days. At the beginning of the LP, there was a significant decrease in the average daily NO
2 concentration due to the COVID-19 lockdown measures and rainfall, after which the average daily NO
2 average concentrations gradually increased, with concentrations remaining at approximately 16
. From 7 February to 10 February 2020, there was a clear upward trend in the daily average NO
2 concentration as enterprises gradually resumed work and production, residents were gradually able to go out, the gathering of people increased, and public transport gradually resumed operation. 12 February to 15 February 2020 was affected by rainfall, and the daily average NO
2 concentration started to decrease and gradually increased after 16 February. From 1 February 2019 to 5 February, influenced by the 2019 Chinese New Year, there was a peak in NO
2 concentrations from traffic emissions and a significant downward trend in the daily average NO
2 concentrations in 2019 from 6 February to 14 February, influenced by prolonged rainfall. Overall, except for some days, the overall traffic emission, NO
2 daily average concentration was still somewhat lower in the LP compared to the NP. Traffic emissions, specifically PM
2.5 and PM
10 daily average concentrations, in 2020 changed in a similar trend to that of NO
2. At the beginning of the LP, there was a significant decrease in the daily average PM
2.5 and PM
10 concentrations, with a significant increase after 7 February. From 9 February to 15 February, there was a downward trend in the daily average PM
2.5, and PM
10 concentrations as the temperature rose, and rainfall occurred.
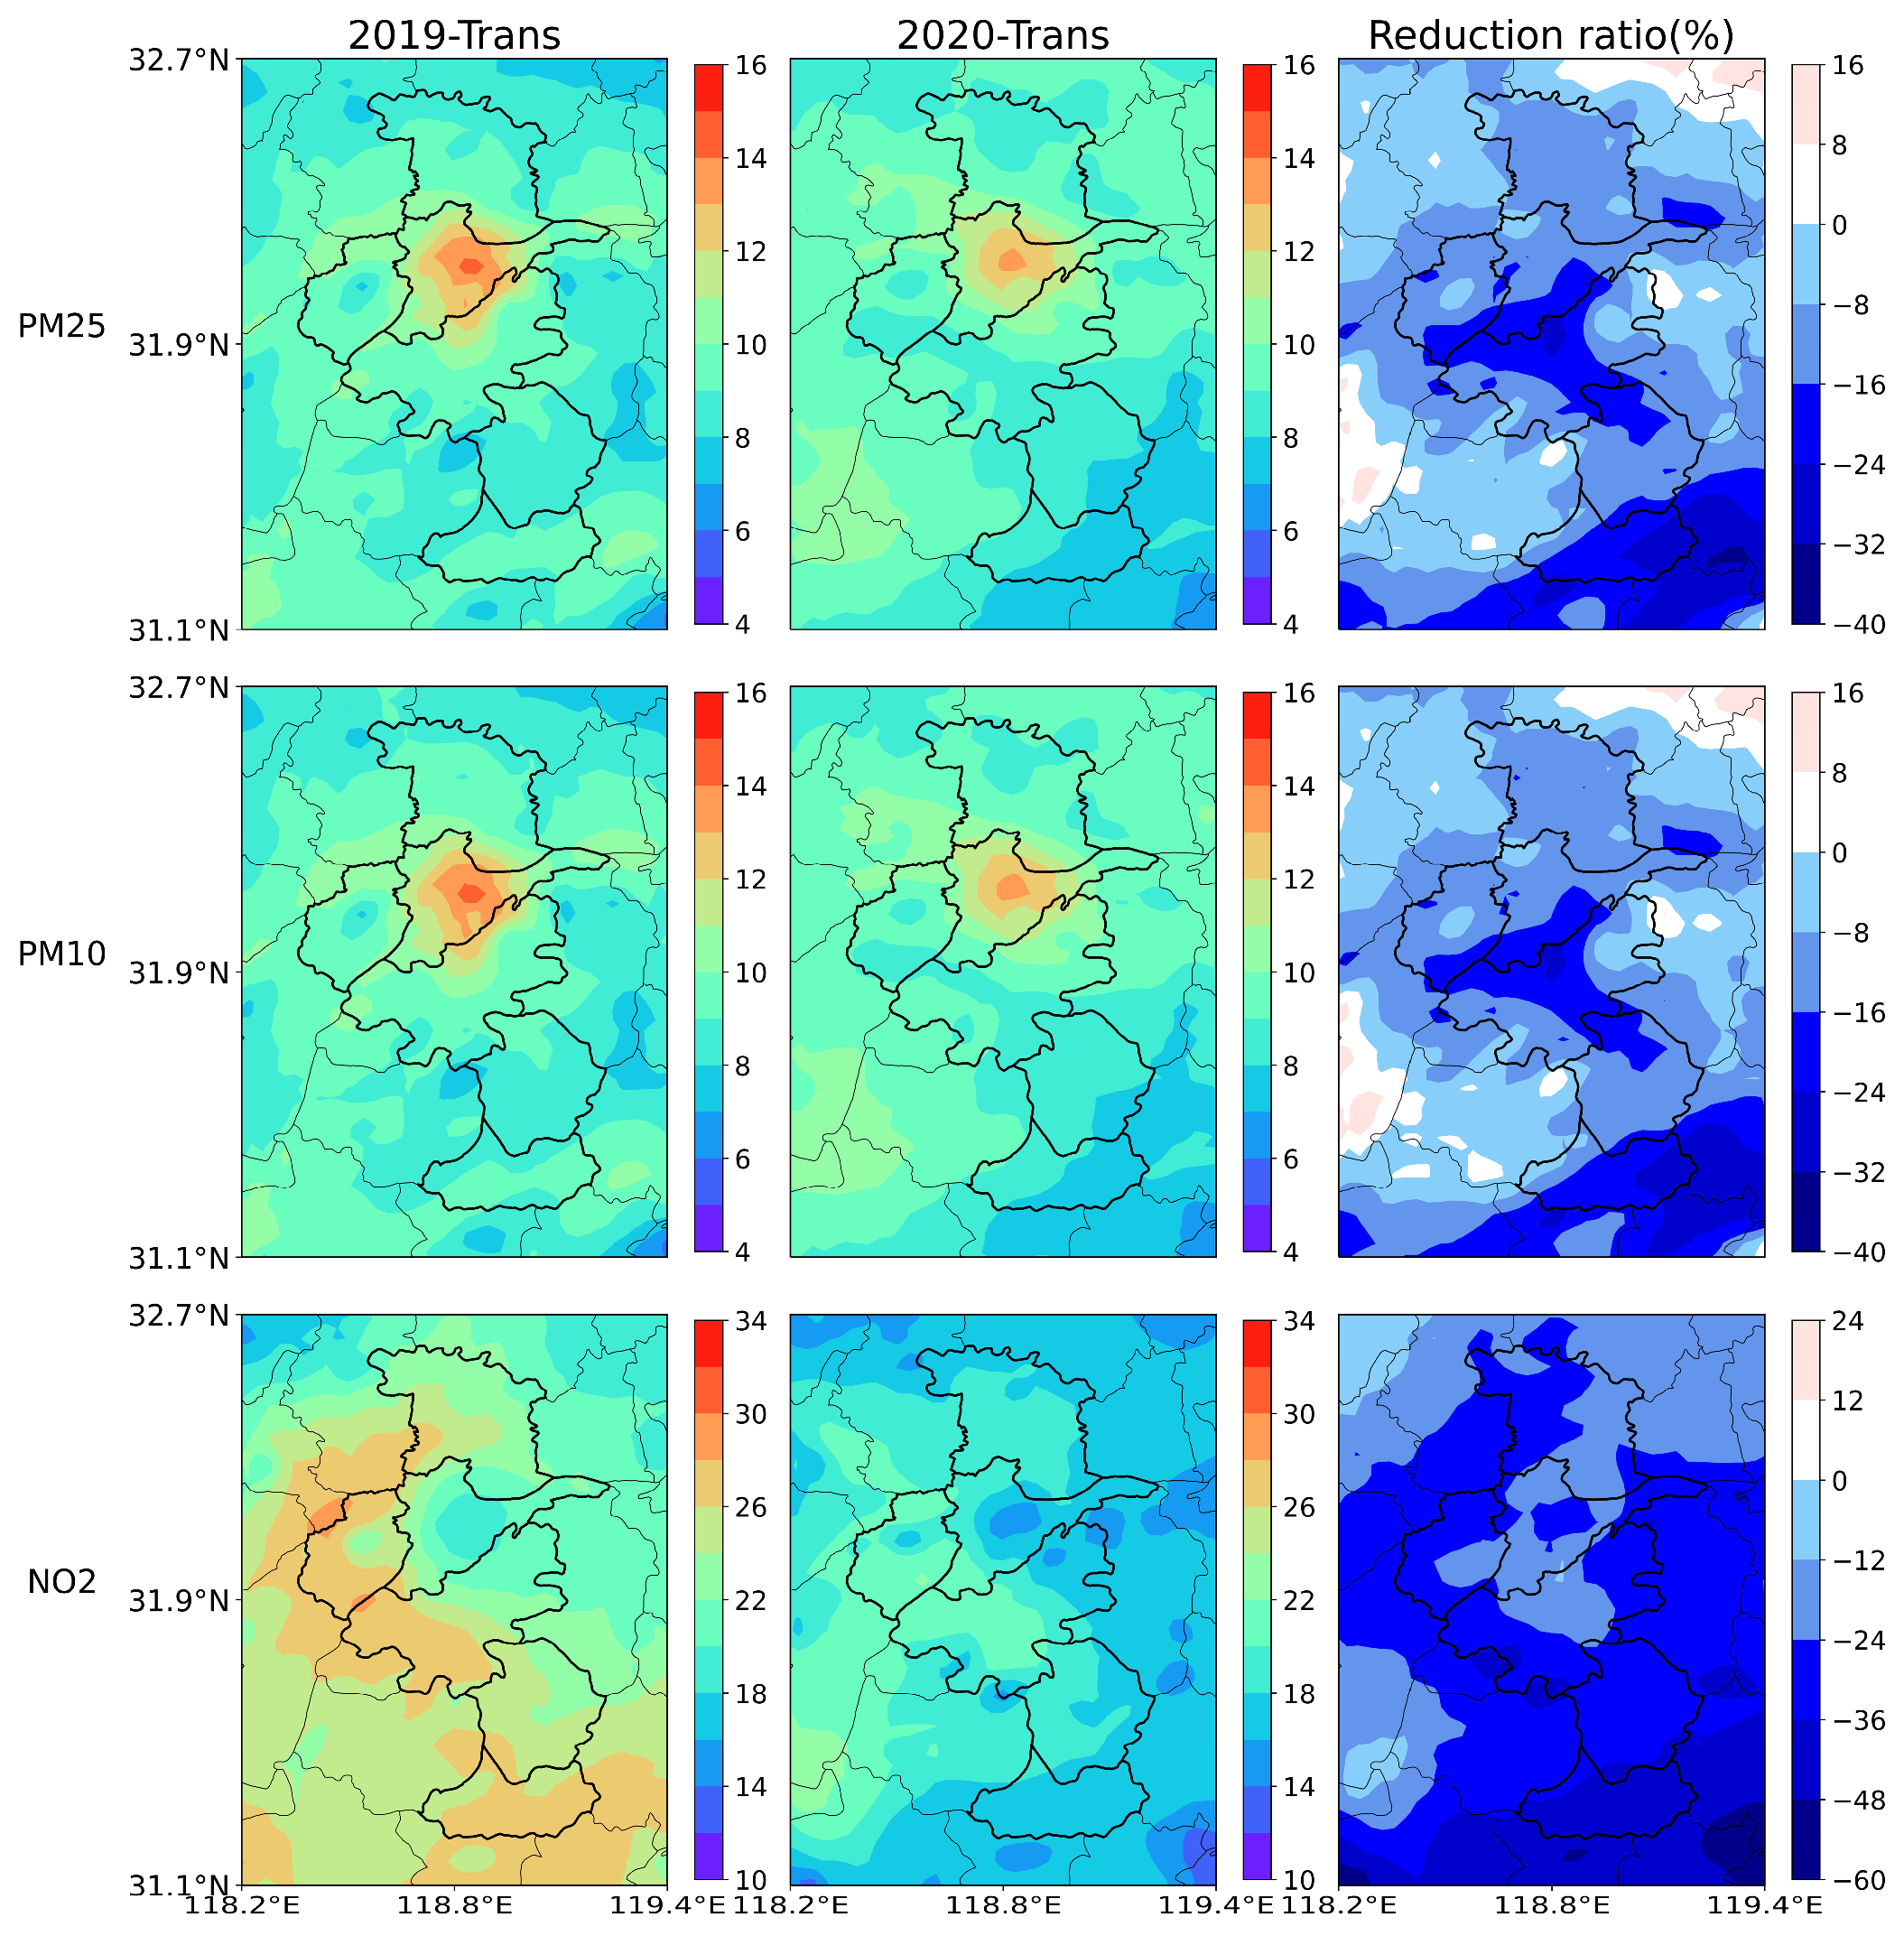
Figure 11 shows the average concentrations of air pollutants emitted from traffic in Nanjing during the LP, NP, and the reduction rate of pollutants emitted from traffic in Nanjing during LP. The graph shows that the PM
2.5 and PM
10 concentrations from traffic emissions in Nanjing in 2019 were approximately 8~15
, while in the same period in 2020, there was a small decrease with overall concentrations in a range of 7~12
; an overall decrease in approximately 18~24%, with PM
2.5 and PM
10 reduction areas mainly in Jiangning District, Nanjing, which is an important transportation and logistics hub and airport hub in Nanjing; therefore, the results obtained from the simulation are consistent with the actual situation. While the concentration of traffic NO
2 emissions was smaller in the main urban area of Nanjing, it was larger around Nanjing. The 2019 Nanjing traffic emission NO
2 concentration was approximately 18~30
. In 2020, during LP, the traffic emission NO
2 concentration decreased significantly, and in 2020, the Nanjing traffic emission NO
2 concentration decreased to 15~22
, with an overall reduction in approximately 20~40%, representing a large reduction. Overall, the impact of the 2020 COVID-19 lockdown policies on traffic emission pollutants was reflected more in the impact on NO
2 concentrations, while for PM
2.5 and PM
10, the changes during the COVID-19 lockdown period were not as significant as the changes in NO
2 concentrations.


