Article

Climate Elasticity of Annual Runoff: Observation in Fifteen Forested Catchments on a Latitudinal Gradient in East Asia

1
The University of Tokyo Hokkaido Forest, The University of Tokyo Forests, Graduate School of Agricultural and Life Sciences, The University of Tokyo, Furano 079-1563, Japan
2
Experimental Forest, National Taiwan University, Nantou 55750, Taiwan
3
Department of Agriculture, Forestry and Bioresources, Research Institute of Agriculture and Life Sciences, Seoul National University, Seoul 08826, Republic of Korea
4
Faculty of Tropical Forestry, Universiti Malaysia Sabah, Kota Kinabalu 88400, Malaysia
5
Department of Conservation, Faculty of Forestry, Kasetsart University, Bangkok 10900, Thailand
6
Executive Office, The University of Tokyo Forests, Graduate School of Agricultural and Life Sciences, The University of Tokyo, Tokyo 113-8657, Japan
7
Faculty of Science & Natural Resources, Universiti Malaysia Sabah, Kota Kinabalu 88400, Malaysia
8
Ecohydrology Research Institute, The University of Tokyo Forests, Graduate School of Agricultural and Life Sciences, The University of Tokyo, Goizuka-cho, Seto 489-0031, Japan
9
Taiwan Forestry Research Institute, Taipei 100, Taiwan
10
Graduate School of Agriculture, Tokyo University of Agriculture and Technology, Tokyo 183-8509, Japan
11
Graduate School of Agricultural and Life Sciences, The University of Tokyo, Tokyo 113-8657, Japan
12
Arboricultural Research Institute, The University of Tokyo Forests, Graduate School of Agricultural and Life Sciences, The University of Tokyo, Kanou, Minamiizu 415-0304, Japan
*
Authors to whom correspondence should be addressed.
Former Affiliation.
Atmosphere 2023, 14(4), 629; https://doi.org/10.3390/atmos14040629
Submission received: 9 February 2023 / Revised: 22 March 2023 / Accepted: 23 March 2023 / Published: 26 March 2023
(This article belongs to the Special Issue Climate Change Impact on the Forest Hydrological Cycle)

Abstract

:
In order to overview the impact of climate change on runoff from forested catchments over Asian countries, we collected water balance data from fifteen long-term catchment monitoring stations (total monitoring period 1975–2018, not continuous), spanning from Sabah, Malaysia (our southernmost site), to Hokkaido, Japan (our northernmost site). We then employed an elasticity analysis to the dataset to examine how the annual runoff from each catchment responded to inter-annual fluctuations in annual rainfall and annual mean air temperature. As a result, we found that (1) the annual runoff was sensitive to annual rainfall for all the catchments examined. In addition, (2) the annual runoff from seven of the fifteen catchments was sensitive to inter-annual changes in the mean air temperature, which was likely due to changes in forest evapotranspiration. Three catchments, however, exhibited an increased runoff in a hot year. Finally, (3) the annual rainfall from the previous year (carry-over soil moisture) was important in explaining the variation in annual runoff in two tropical montane forest catchments. This study may serve as one of the pilot studies toward a comprehensive understanding of the climate elasticity of runoff in countries over Asia, because the examined catchments are unevenly and sparsely distributed over the area.

1. Introduction

The water balance in forested catchments and its interaction with climatic variables have long been a core research subject in ecohydrology e.g., [1,2,3,4]. This is because evapotranspiration (ET), which is strongly influenced by climate [5,6] is potentially higher in forests compared to in other vegetated landscapes [1]. As a result, the water balance in forested catchments is expected to be more sensitive toward variations in climate compared to catchments with other land-uses. Even though some past studies are available, continuous investigations that span across geographical regions and climatic zones remain important because (i) there may be differences in the observed data due to differences in the local geology and vegetation and (ii) the ever-changing climate at local, regional, and global scales [7]. In view of water resource management and downstream flood control, runoff (R) is a variable of higher interest in catchment water balance compared to ET. However, because R is P minus ET, and ET is affected by climate, R is ultimately affected by variation in climate.
The analysis of climate elasticity of runoff, which was originally proposed by Schaake [8] and thereafter developed by a number of researchers e.g., [8], is a statistical approach that investigates the sensitivity of runoff to various climate variabilities such as rainfall, potential evaporation, air temperature, solar radiation, and wind speed. Several studies have employed the approach to examine the current status of climate elasticity of runoff using long-term catchment water balance data and to predict possible changes in runoff using global change scenarios [9,10,11,12,13,14,15,16,17]. Among Asian countries, China is one of the most studied in terms of modeling the climate elasticity of runoff [12,13,14,18,19,20]. However, far fewer studies have been conducted in other Asian countries despite increasing public concerns over the impact of climate changes on the hydrologic cycle.
In order to fill the geographical gaps in the study of climate elasticity of runoff, the authors assembled as many available data as possible in their respective areas and, subsequently, annual water balance data for fifteen forested catchments spanning from Sabah, Malaysia (southernmost, equatorial), to Hokkaido, Japan (northernmost, temperate), were produced. The elasticity analysis was then applied to the collected dataset for the purpose of understanding the spatial distribution of the climate elasticity of runoff across the study region.
Specifically, this study sought to (1) understand the response of annual runoff to inter-annual fluctuations in rainfall, mean air temperature, and past-year rainfall in each forested catchment, and (2) to propose future research directions toward a comprehensive understanding of the climate elasticity of runoff in the Asian region.

2. Data and Methodology

2.1. Data

Fifteen catchments across a gradient of climatic zones in East Asia were selected for this study (Table 1 and Table 2). According to Trewartha climate classification [21,22,23], the fifteen catchments were distributed over three major classes (Table 1): Class A (tropical climate), Class C (subtropical climate), and Class D (temperate climate). Both Gunung Alab in Malaysia (ALA) and Kog Ma D Watershed in Thailand (KOG) in Table 1 are upland catchments in a tropical climate, but they are classified under Class C due to their high altitudes (>1000 m above sea level, masl.) [23,24]. Nan Watershed Research Station Experimental Watershed in Thailand (NAN) is the only catchment belonging to Class A (Table 1). Lienhuachih Watersheds 3, 4, and 5 in Taiwan (LH3, LH4, and LH5) are located almost on the Tropics of Cancer and they belong to Class C (Table 1). Three lowland catchments in Japan, Jyugei No. 1 (JY1), No. 3 (JY3), and Fukuroyamasawa Watershed A (FUA), also belong to Class C. The remaining four catchments in Japan, Shirasaka Experimental Watershed (SEW), Ananomiya Experimental Watershed (AEW), Bakemonosawa (BKE), and Maruyamazawa (MAR), and two catchments in Korea, Bakmoongol (BMG) and Baramgol (BRG), are classified as having a temperate climate.
Although not the most extensive network, the fifteen catchments provided a good geographical coverage, with latitudinal ranges between 5°49′ N and 43°15′ N, and altitudinal ranges between 120 and 1970 masl. (Table 2). Due to differences in both climate and forest management practices, each catchment is distinct in terms of forest type, which includes evergreen broad-leaved forest, deciduous broad-leaved forests, pine forests, mixed forests, and conifer and broad-leaved plantations (Table 2). Other catchment information is summarized in Table 2.
Table 3 summarizes the mean annual rainfall (P), mean annual runoff (R), and mean annual air temperature (Ta) over the period of data collection for each catchment. Unless noted below, both P and Ta were measured at a weather station nearby each catchment and R was monitored by a weir. Additional information on runoff measurement can be found in existing publications for ALA [24], KOG [25], LH3, LH4, LH5 [26], FUA, SEW, AEW, BKE, MAR [27], BMG, and BRG [28,29].

2.2. Analysis

In order to evaluate the sensitivity of runoff to a climate variable such as rainfall, Schaake (1990) [8] introduced the concept of “elasticity of runoff”, in which the percentage change in runoff was defined as the percentage change in the climate variable multiplied by the elasticity ( ε ). More specifically, in case of an investigation on the effects of annual rainfall in a year i ( P i ) on annual runoff in the same year ( R i ), the elasticity can be expressed as follows [9]:
R i R = ε R P P i P
where P , R , and ε R P are mean annual rainfall, mean annual runoff, and the elasticity of annual runoff to annual rainfall, respectively. In addition, P i and R i in Equation (1) are deviations of rainfall and runoff in a particular year from their respective means ( P i = P i P ; R i = R i R ) .
As evapotranspiration (ET) can affect catchment water balance particularly in forested catchments, many previous studies have incorporated potential evaporation into Equation (1). However, due to poor availability of ET data throughout the studied catchments, air temperature (Ta) was used as a surrogate in place of ET [11,14]. The elasticity model in Equation (1) was then expanded into a two-parameter model,
R i R = ε R P P i P + ε R T a T a i
where T a i and ε R T a is the departure of annual mean air temperature in a year i from its long-term mean ( T a ) and the elasticity of runoff to air temperature, respectively. Because there was considerable variation in Ta in the examined catchments (Table 2), we have opted to use the non-normalized T a i instead of the normalized T a i / T a , which may dampen the influence of air temperature in warmer regions due to larger denominators ( T a ).
Carry-over soil moisture and/or groundwater, which was stored in the catchments from a preceding year, can also influence the annual runoff of the current year [11]. Therefore, we tested another two-parameter elasticity model, which is expressed as follows:
R i R = ε R P P i P + ε R P 1 P i 1 P
where P i 1 and ε R P 1 are a departure of annual rainfall in a year i − 1 from P and the elasticity of annual runoff in the current year to annual rainfall in the previous year.
We finally developed a three-parameter elasticity model, incorporating all the variables above to produce the following:
R i R = ε R P P i P + ε R P 1 P i 1 P + ε R T a T a i
Hereafter, the elasticity models based on Equations (1)–(4) are denoted by M1, M2, M3, and M4, respectively. A multiple regression analysis without a constant term (i.e., by setting an intercept at zero) was performed for determining coefficients in all the models. In addition to the various elasticity coefficients, the runoff coefficient (C) was computed and assessed. Both analyses were executed by R software version 3.6.1. For each catchment, the best elasticity model was selected based on the adjusted coefficient of determination (R2), because (1) number of independent variables (i.e., degrees of freedom) varies by models and (2) several catchments have shorter-term data set (as short as five years for BKE, see Table 3).

3. Results & Discussion

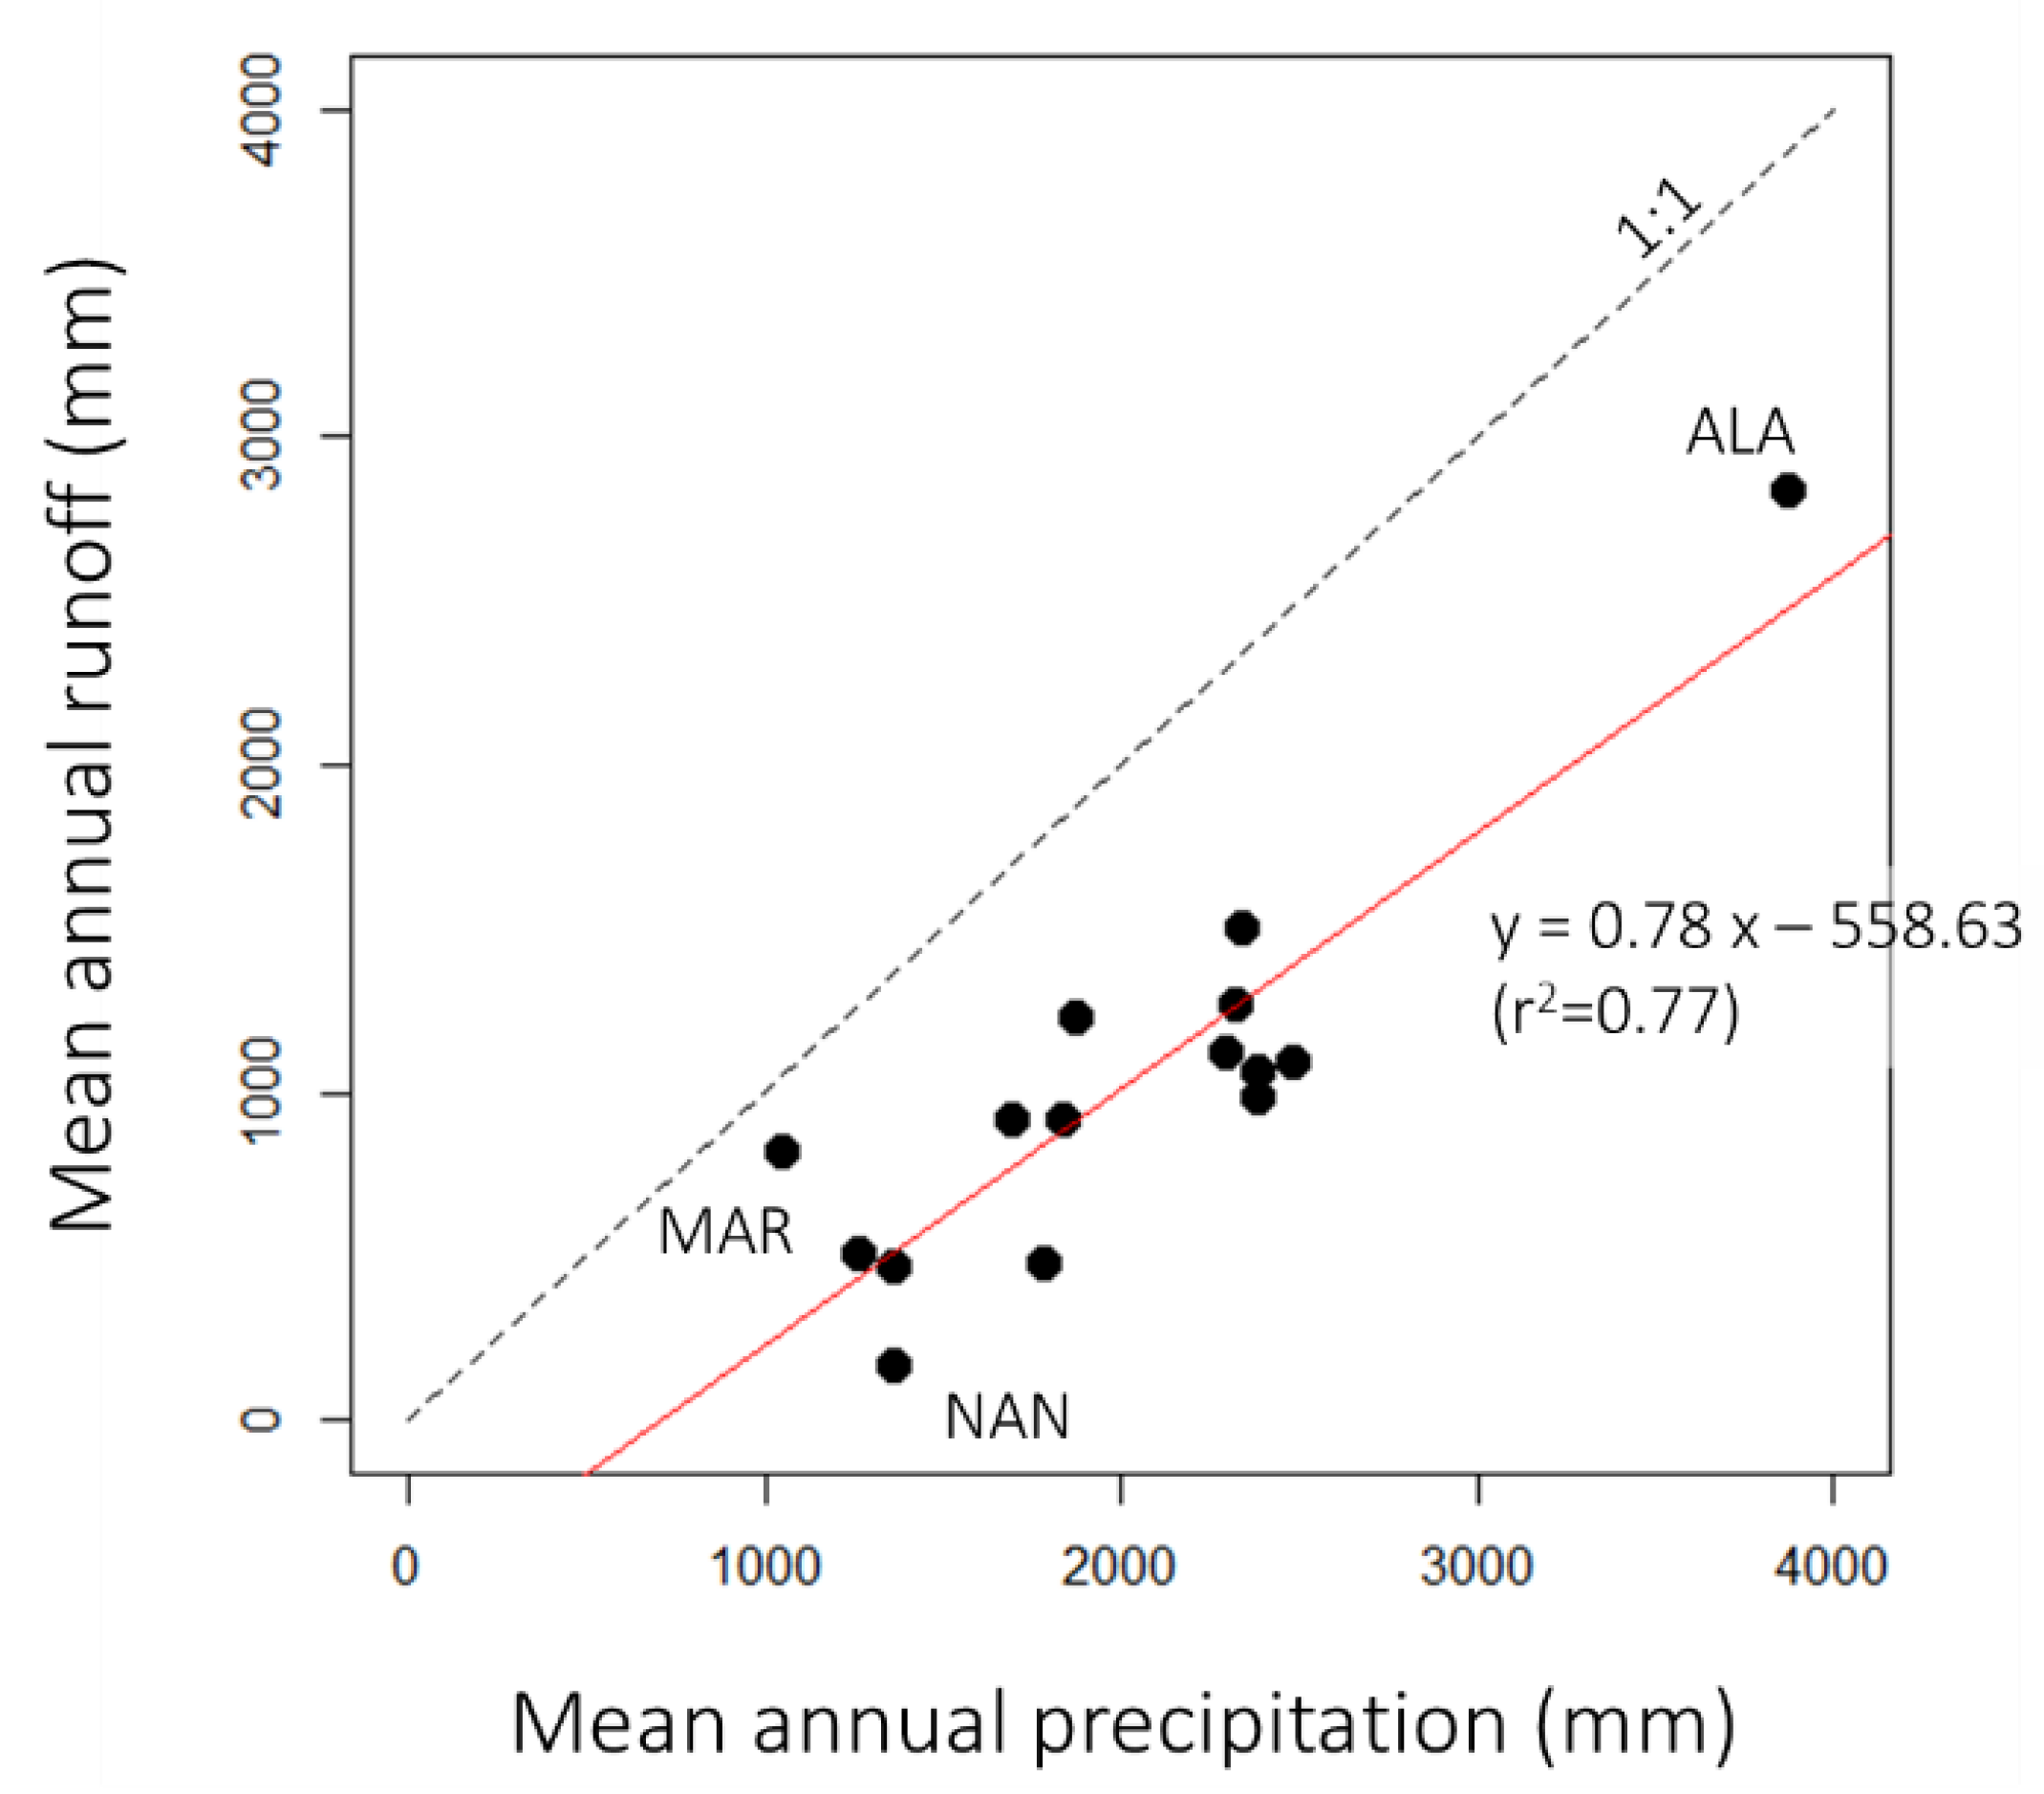
3.1. Overall Water Balances and Selected Elasticity Models

Figure 1 shows the time series of annual rainfall and runoff for each catchment. Although there are inter-annual fluctuations in rainfall and runoff for all the catchments, it can be found from Figure 1 that the annual runoff fluctuated in accordance with the annual rainfall.
Figure 2 compares the mean annual rainfall and runoff across all catchments. The mean annual rainfall ranged from 1051 mm at the northernmost MAR to 3873 mm at the southernmost ALA. The mean annual runoff ranged from 169 mm at NAN to 2841 mm at ALA. Although there were differences in climate, forest type, and geological characteristics between catchments (Table 1 and Table 2), there was a significant positive correlation between the annual rainfall and annual runoff, indicating a strong influence of annual rainfall on annual runoff, as found in most similar studies [10,30,31,32].
The best elasticity model, model coefficients, and their respective adjusted R2 value for each catchment is summarized in Table 4. We have also plotted the various elasticity indices against the runoff coefficient, C (Figure 3). Results for all elasticity models in all catchments is in Appendix A.

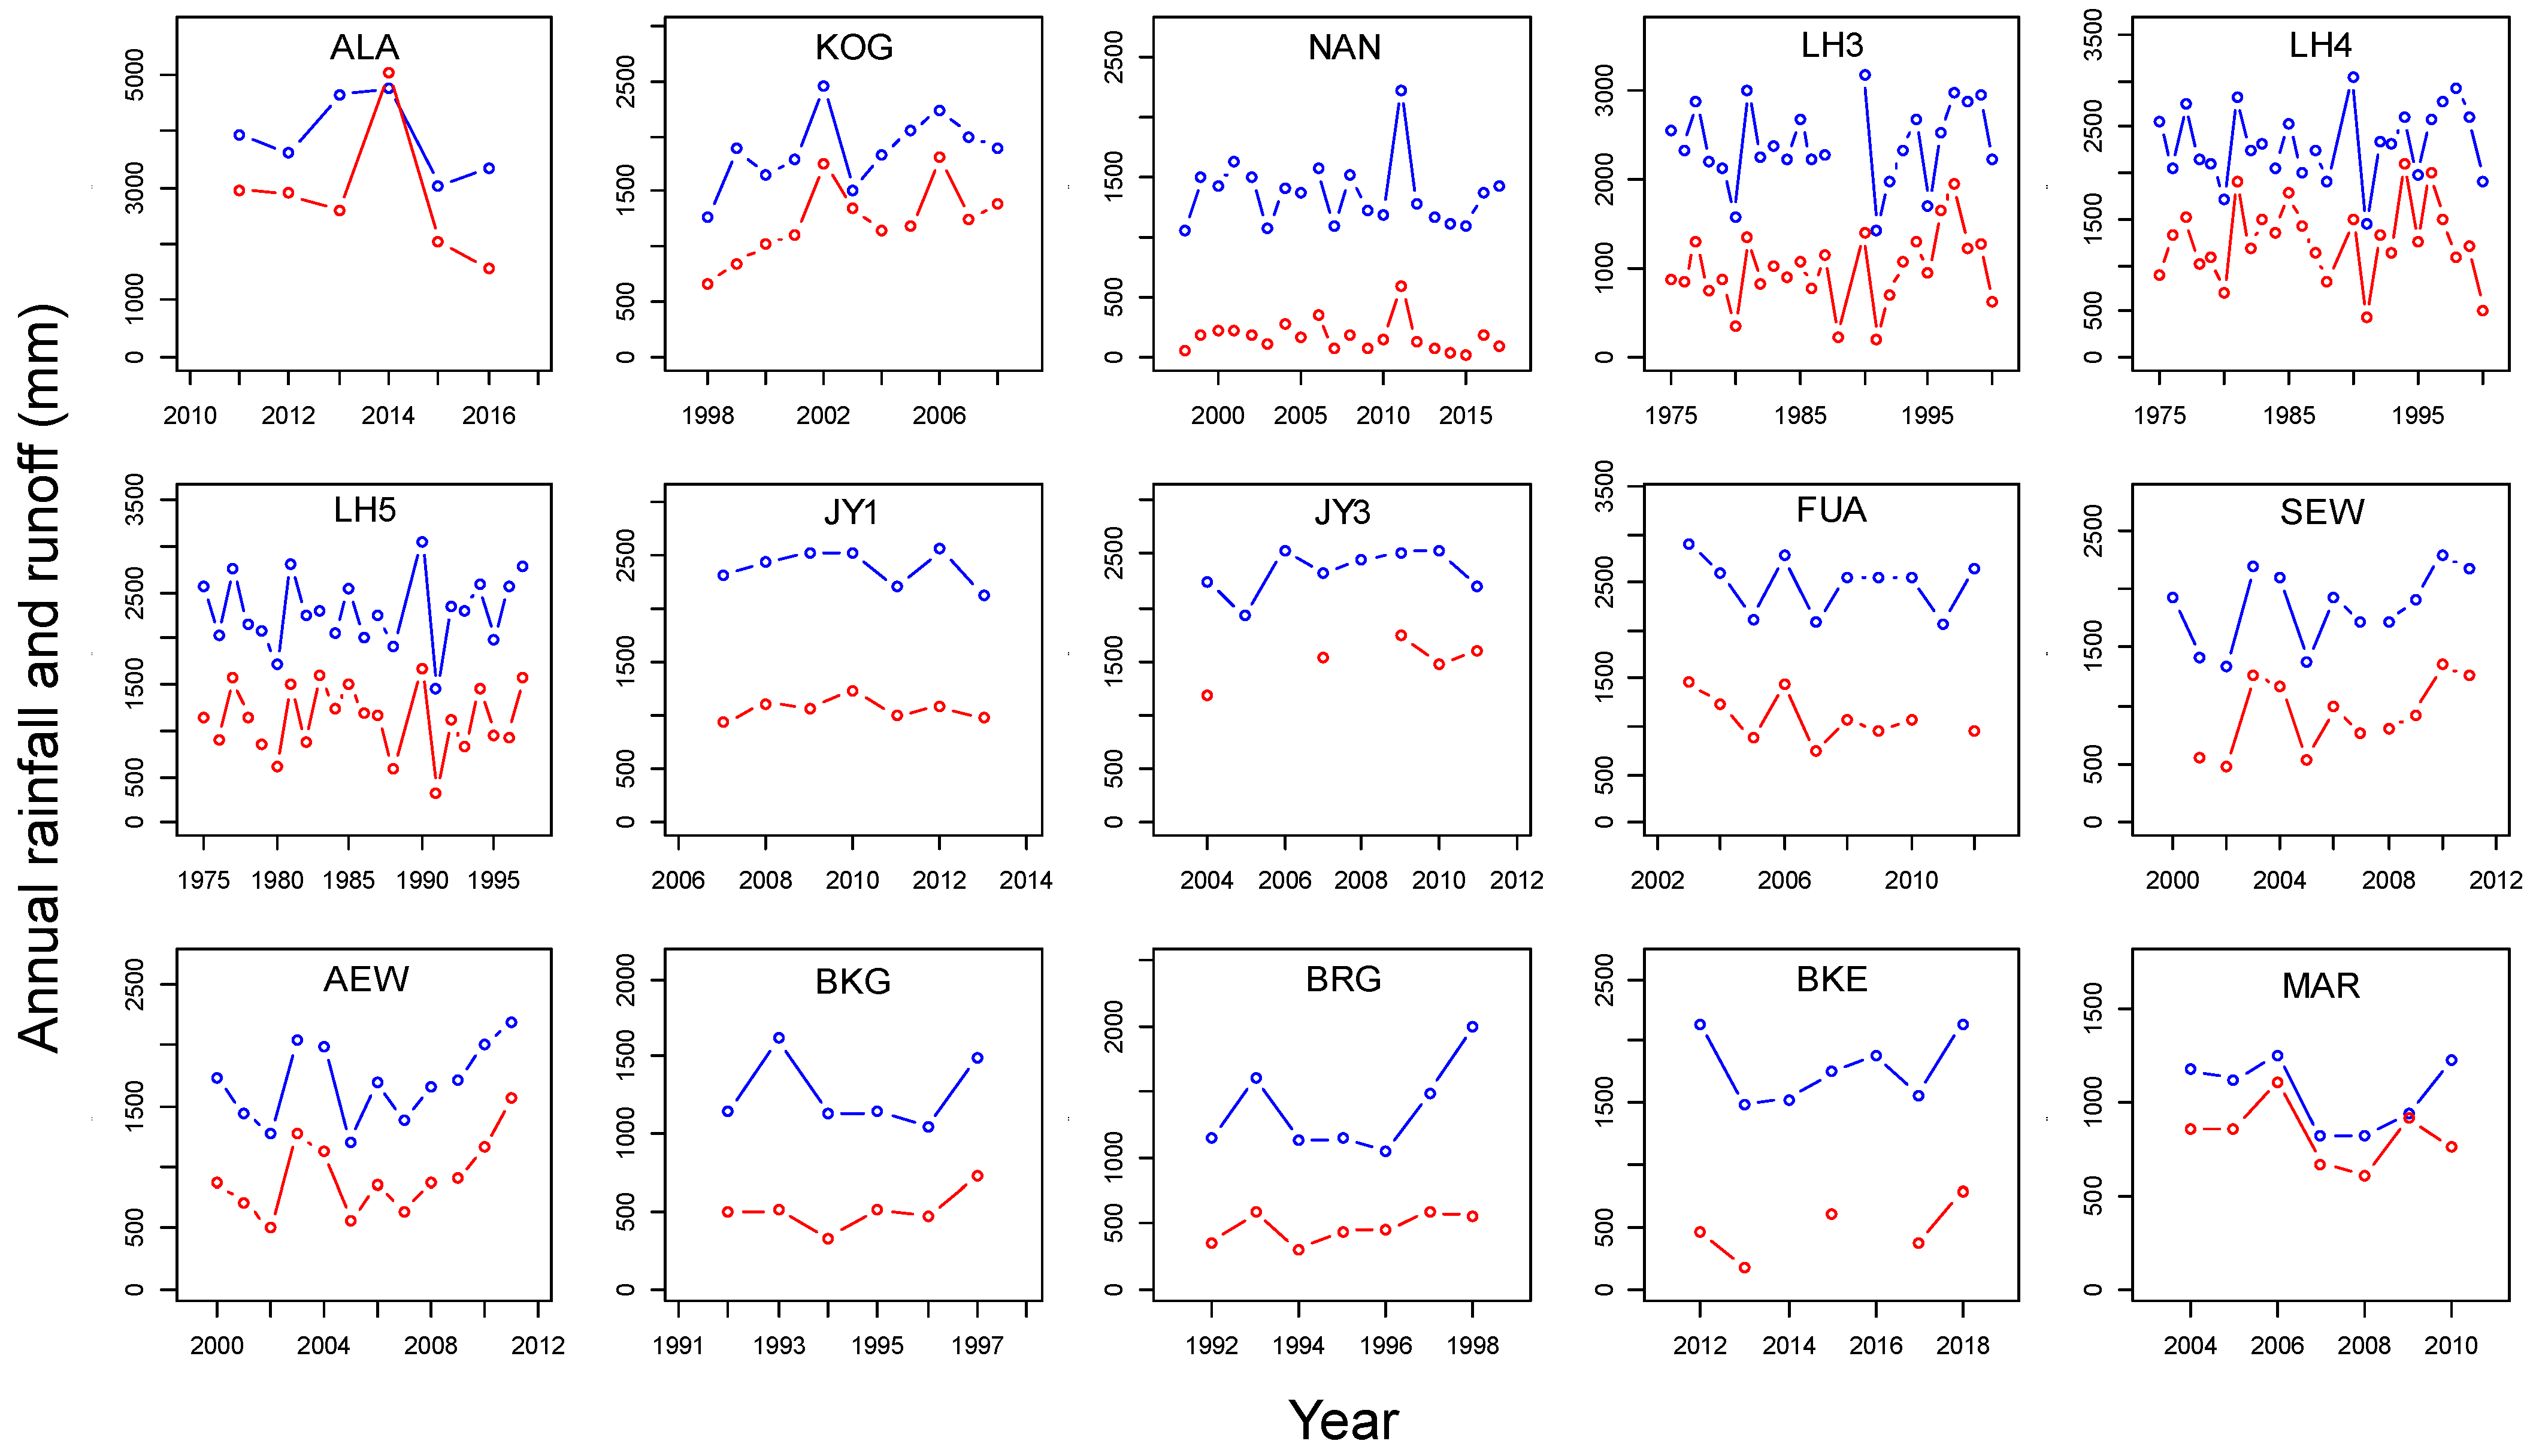
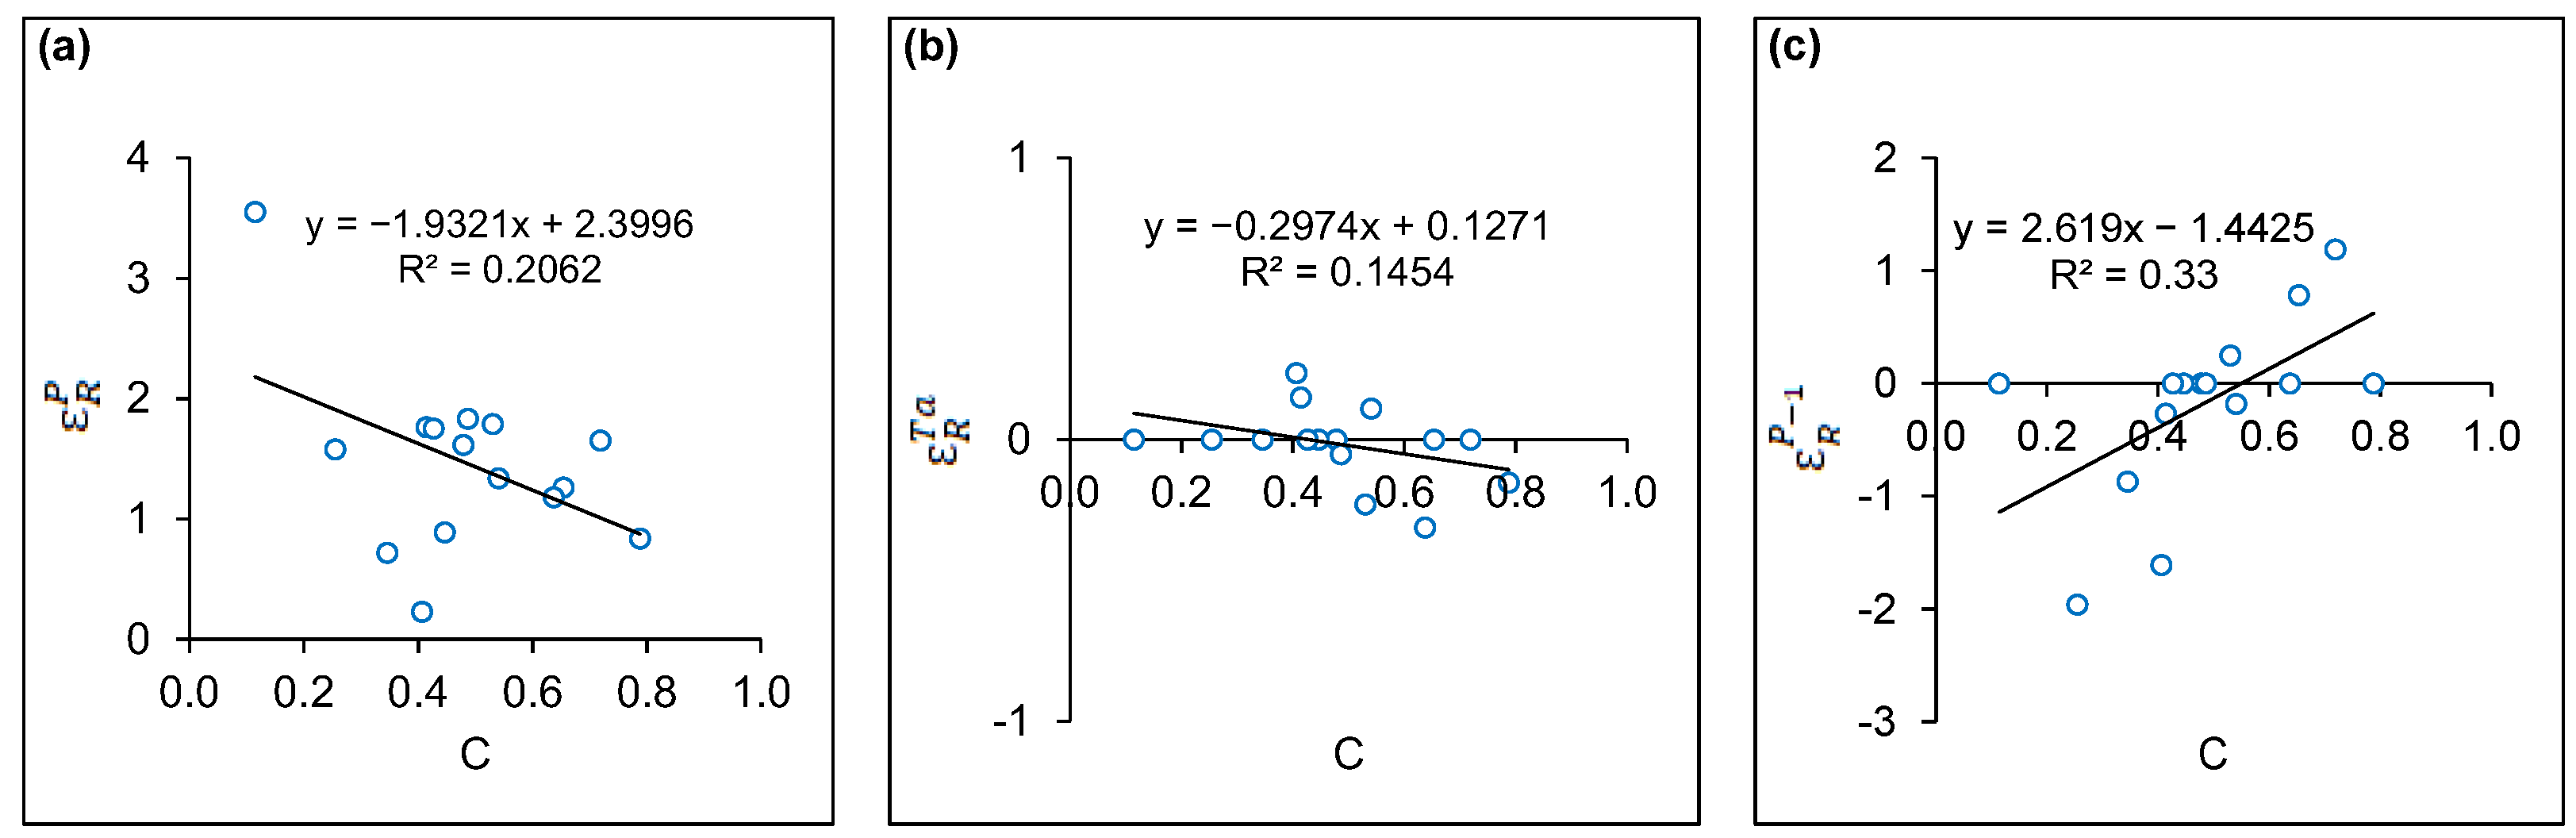
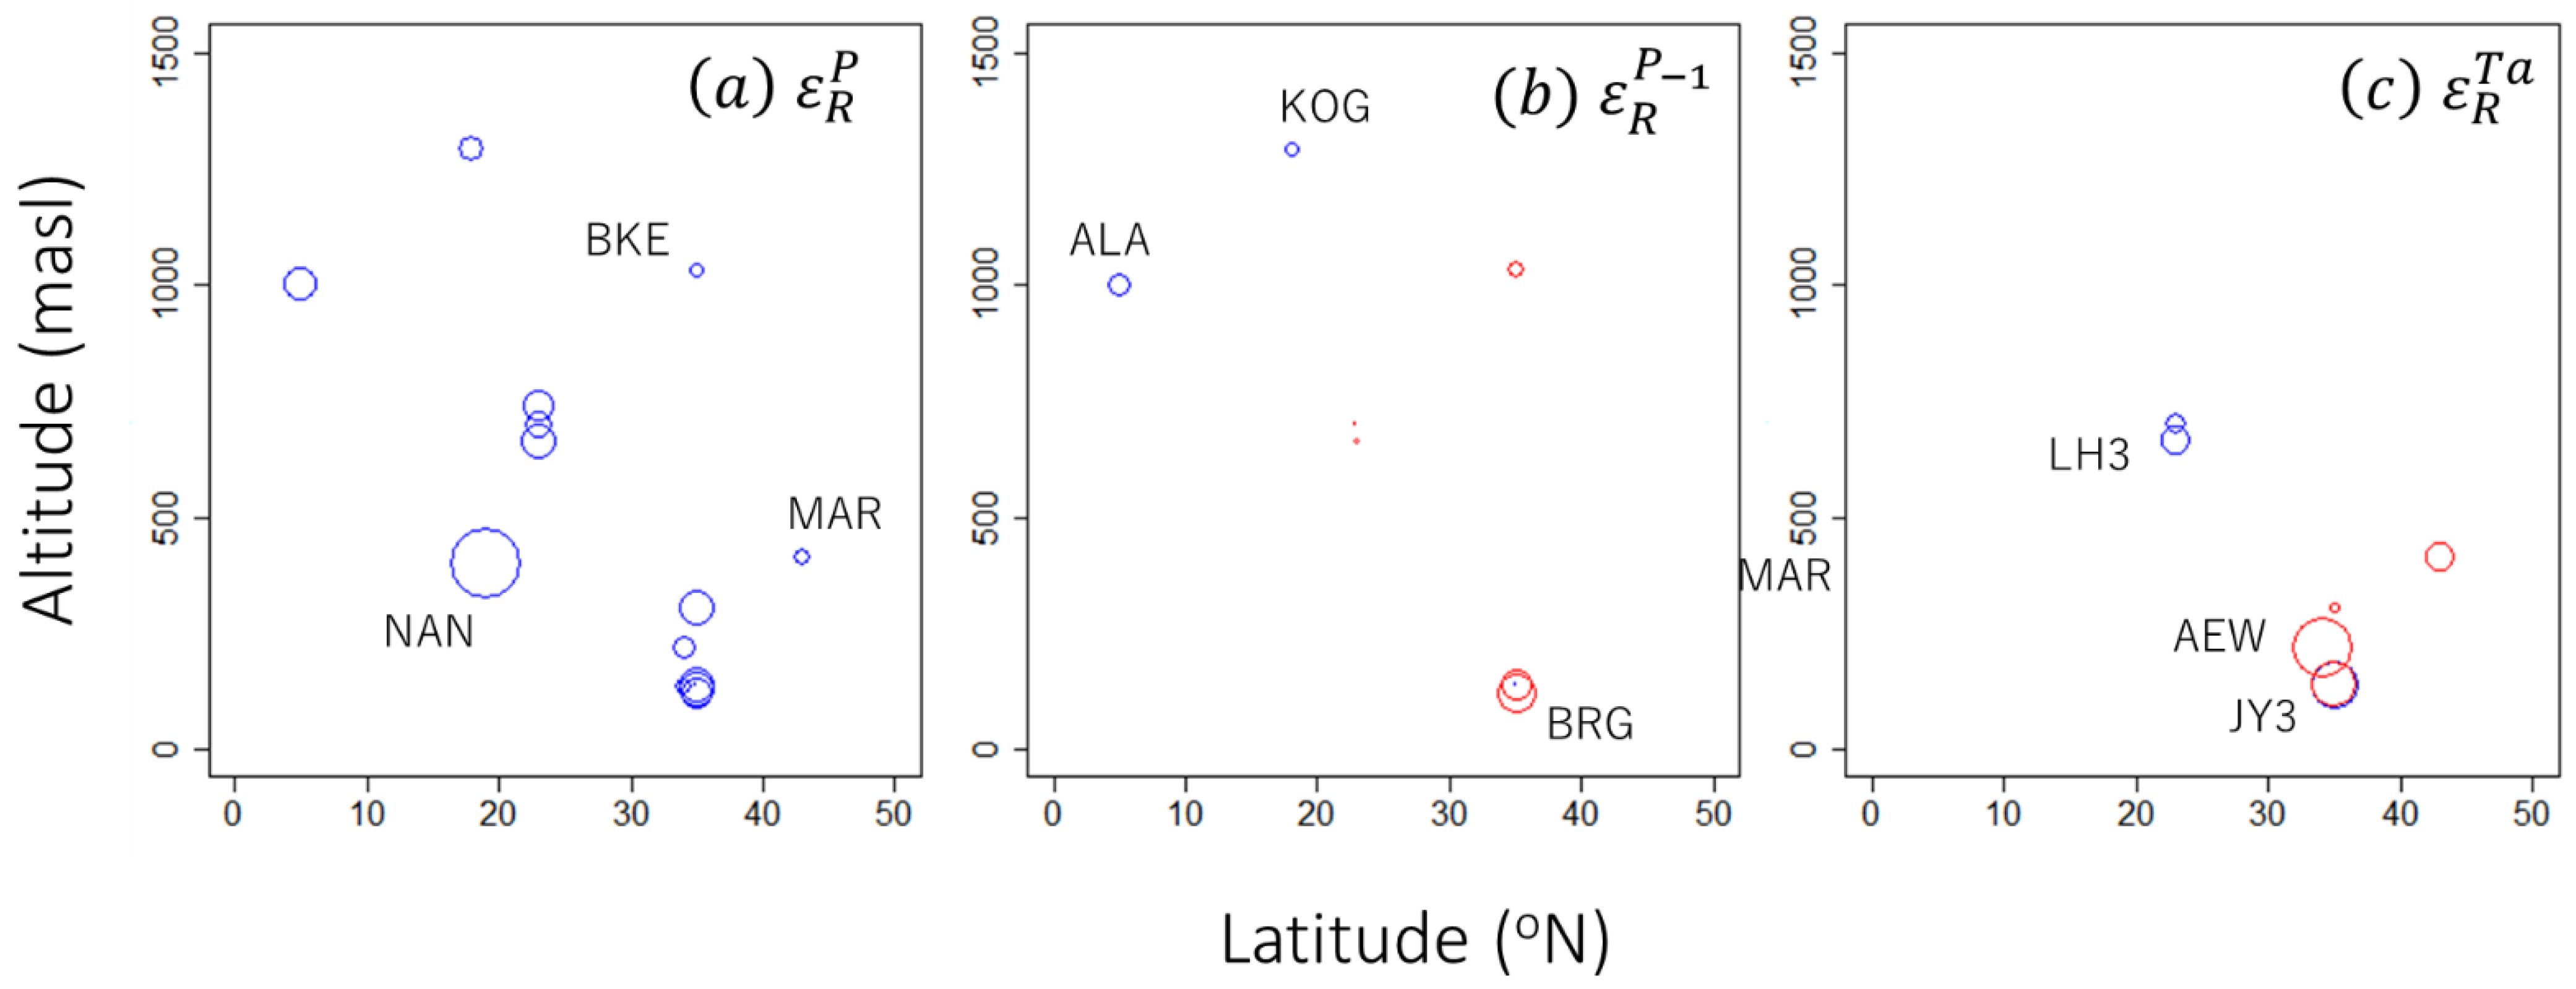
3.2. Annual Rainfall in the Current Year

The elasticity of the annual runoff to the annual rainfall in the current year ( ε R P ) was positive, but it showed varying statistical significance in the studied catchments (Table 4). This indicated that changes in R are directly proportionate to changes in P i . The overall mean ε R P and its standard deviation for all the catchments was 1.467 ± 0.720 (not shown in tables), with minimum and maximum values of 0.720 (p < 0.05) and 3.550 (p < 0.001) in the BMG (temperate lowland) and NAN (tropical lowland) catchments, respectively (Table 4).
The overall mean ε R P of 1.467 indicates that a 1% increase in annual rainfall would cause a 1.467% increase in annual runoff, on average. Such amplified changes in R caused by P i were most pronounced in NAN. In contrast, BRG was the most stable catchment, whereby changes in R caused by changes in P i were well attenuated.
The geographical distribution of ε R P over the studied regions in terms of magnitude is illustrated in Figure 4a. Compared to other elasticity indices ( ε R P 1 and ε R T a ), the inter-catchment variation in ε R P was smaller (Table 4). Nevertheless, Figure 4a implies that mid- and high-altitude catchments in temperate climates have a relatively smaller ε R P (MAR and BKE, see also Table 4). However, a more homogenously distributed observation with increased catchment diversity is necessary to draw a solid conclusion with regards to the altitudinal and latitudinal variation. In addition, there is a geographical gap of low-altitude catchments in tropical climates (Figure 4a), which should be addressed in future studies. As indicated by the largest ε R P in NAN, R in lowland tropical catchments may show large responses to P i fluctuation.
Plots of ε R P against C (Figure 3a) showed an inverse relationship, as has been reported in past studies [9,10,31,33]. This is natural following the law of conservation of mass—a high runoff coefficient (i.e., more rainfall immediately ending up as runoff) would result in low elasticity (i.e., less remaining rainfall entering storage to be released as delayed runoff, either soon after or in the following year).

3.3. Annual Mean Air Temperature

For seven out of the fifteen catchments, the elasticity of R to the annual mean air temperature ( ε R T a ) was incorporated into the best elasticity model, with varying levels of significance (Table 4). In four out of the seven catchments, T a had a negative influence on R, while three other catchments had positive T a R relationships (Table 4). R decreased significantly with increasing T a at a subtropical (JY3, p < 0.05) and a temperate (AEW, p < 0.01) catchment, but increased with increasing T a at another subtropical catchment (LH3, p < 0.001, Table 4). This indicates that an increase in Ta by 1 °C resulted in a 31.1% and 22.9% reduction in R in JY3 and AEW, respectively. In the LH3 however, a 1 °C increase in T a was accompanied by a 15% increase in R . Such changes in R show that year-to-year fluctuations in Ta may be capable of altering the catchment water balance regardless of positive or negative changes—at least in the three forested catchments above.
Predictably, increases in T a will result in increases in the potential evaporation (ETp) [5]. Therefore, for catchments that showed negative ε R T a in this study, decreases in R that accompanied increases in Ta are likely a result of enhanced ET. However, it is known that actual forest ET may not be directly proportional to ETp because Ta influences forest ET by affecting both the evaporative demand of the atmosphere and the stomatal behavior of trees. Assuming the evergreen broad-leaved trees in LH3 exhibited isohydric behavior (stomatal shutdown) as a response to high temperatures, the actual forest ET could be reduced in a hot year instead (and vice versa), which may explain the negative ε R T a values in catchments JY3, SEW, AEW, and MAR [34,35].
Plots of ε R T a against C (Figure 3b) showed an inverse relationship, as did plots of ε R P against C. As data coverage is not contiguous over the studied regions (Figure 4c), it is premature to discuss the geographical distribution of ε R T a at this point. However, if the hypothesis above was true, the response of R toward variation in T a should depend more on a catchment tree’s species composition rather than its geographical region (Figure 4c). This hypothesis is in-part supported by (i) the varying magnitudes of ε R T a in the temperate region (Figure 4c) where there were relatively abundant conifer species known for conservative water-use, and (ii) the lack of significance of ε R T a in the three tropical catchments (Table 4) known for abundant anisohydric broad-leaved trees [36,37,38].

3.4. Annual Rainfall in the Previous Year

In eight catchments, the elasticity of R to P in the previous year ε R P 1 was included in the best elasticity model. The level of significance varied among the catchments (Table 4). While two tropical montane (ALA and KOG) and one temperate catchment (AEW) had positive ε R P 1 , five other catchments had negative values. The minimum and maximum ε R P 1 values were −0.871 and 0.784 in the temperate catchments BRG and KOG, respectively (p < 0.01) (Table 4).
Positive ε R P 1 indicates that water stored in the catchment (carried-over from previous years) contributed to an increase in R . In case of KOG, a +1% change in annual rainfall in the previous year ( P i 1 ) resulted in a 0.784% increase in R . Such a delayed discharge of stored water could be caused by a large water storage capacity in the catchment and slow drainage of the stored water. In the same study area (KOG), Shiraki et al. [25] found the presence of a deep soil layer (5.3 m) on granite bedrock and suggested that this layer plays an important role in delayed discharge. It is interesting to note that a Tropical Montane Cloud Forest (TMCF) catchment, ALA, also exhibited positive ε R P 1 , which was a value that was even greater than that in KOG (Figure 4b), though it is not statistically significant. Contrary to ε R P and ε R T a , as well as past studies [9,10,30,31,32,33], a positive relationship was found between ε R P 1 and C. This could mean that besides immediate rainfall, it is possible that stored rainfall from previous years contributed to runoff. This may appear to contradict what was postulated earlier, specifically that low recharge/storage complements high C. However, it should be noted that ε R P 1 is a longer-term rainfall elasticity compared to ε R P , in which a wave of increased discharge could originate from a deeper storage that has accumulated over periods longer than that of ε R P . It may be worth investigating whether high ε R P 1 values are common in tropical mountainous catchment, especially in the less studied TMCF.
Taken at face value, the negative ε R P 1 values indicate that an increase in P i 1 causes a reduction in R . We were not able to fully address the reason for this negative relationship, but this may be due to the presence of several rainfall–storage–runoff components with different temporal cycles (C, ε R P , ε R P 1 , and ε R P 2 …). Other explanations include the effects of artifacts produced from statistical models. More sophisticated modeling that considers interactions between variables ( P i , P i 1 , and T a ) could improve ε R P 1 derivations.
Most regressions that included the ε R P 1 term were of the M4 regression comprising four variables. This may appear as non-parsimonious, especially for catchments with less samples such as BKG. However, as the aim of this study is to demonstrate the response of annual runoff to inter-annual fluctuations in climatic variables, the additional regression variables were included anyways. Parsimony could be prioritized in studies that seek to determine the optimum models [39]. Collinearity between variables was minimal (Appendix B).

4. Conclusions and Recommendations

In order to fill the knowledge gap regarding the climate elasticity of runoff in East Asian forested catchments, we have collected catchment water balance data from fifteen catchments across five East Asian countries located along a latitudinal gradient. We then performed a pilot analysis of the climate elasticity of runoff on the dataset. In line with past studies, we found that the rainfall elasticity of runoff had a negative relationship with the runoff coefficient and that elasticity was lower in wetter catchments. We also discovered that the previous year’s rainfall elasticity had a positive relationship with the runoff coefficient, which may be linked to catchment storage and the delayed release of water. The annual mean temperature had both a positive and negative influence on the catchment runoff, which could depend on the catchment tree’s species composition (isohydric or anisohydric). At this point, we suggest that the climate elasticity of runoff in a catchment depends on the tree’s species composition and annual rainfall rather than the altitudinal and latitudinal position.
Even though the examined catchments were not contiguous, we were able to specify for each catchment the unique responses of annual runoff to inter-annual variabilities in rainfall and mean air temperature. However, due to insufficient geographical coverage at present, we were not able to draw a solid conclusion with regards to the spatial distribution of the climate elasticity of runoff over the East Asian region. For comprehensive understanding, further studies utilizing a spatially and temporally extended dataset would be needed.
In addition, as implied by the impacts of rainfall in the previous year, the elasticity models and variables used in the models could be refined considering the recent progress in climate elasticity modeling. Studies focusing on chemical signatures and isotopes in runoff are also recommended to understand the immediateness of direct runoff and the delay in groundwater runoff. As performed by several climate elasticity studies in the past, a prediction of the future changes in runoff in Asian forested catchments utilizing global change scenarios can be performed for adaptive water resource management under a changing climate.

Author Contributions

N.T. conceptualized, designed the analysis, reviewed the manuscript, and prepared the original draft; A.N. revised the draft; Y.-J.L. and C.-W.T. collected LH3, LH4, and LH5 data; S.I. collected BMG and BRG data; M.B.M., A.N., F.C. and K.K. collected ALA data; V.T. collected NAN data; C.T. and K.S. collected KOG data; N.H. collected FUA data; Y.A. collected BKE data; Y.A. and H.I. collected JY1 and JY3 data; M.G. and K.K. collected SEW and KEW data; Y.A. collected MAR data. All authors have read and agreed to the published version of the manuscript.

Funding

This research was funded by a Core-to-Core Program (B. Asia-Africa Science Platforms) of the Japan Society for the Promotion of Science, titled ‘A Research Hub of Long-term Forest Monitoring Field Centers on Environmental Changes and Ecosystem Responses: Collaborating for Data, Knowledge and Young Researchers (grant number JPJSCCB20190007)’.

Institutional Review Board Statement

Not applicable.

Informed Consent Statement

Not applicable.

Data Availability Statement

The data presented in this study are available on request from the corresponding author. The data are not publicly available due to copyright reasons.

Acknowledgments

We thank Naoto Kamata, the coordinator of the Core-to-Core Program of the Japan Society for the Promotion of Science. The authors appreciate the Editors and Reviewers for their constructive suggestions and insightful comments, which greatly helped improve this manuscript.

Conflicts of Interest

The authors declare no conflict of interest.

Appendix A

Table A1. Regression coefficients between R i R and various climatic variables ( P i P , T a i , P i 1 P ) in the M1, M2, M3, and M4 regressions, respectively. SE = standard error; n = sample size. Asterisks show significance level (*** p < 0.0001; ** p < 0.001; * p < 0.05). In most cases, simpler two-, and three-variable regressions are sufficient to derive climate elasticity of runoff, especially the traditional rainfall elasticity of runoff ( ε R P ). However, the aim of this study was to determine climatic variables that may affect climate elasticity; therefore, the multi-variable regressions were shown and discussed in the main manuscript.
VariableCatchment
ALAKOGNANLH3LH4LH5JY1JY3FUASEWAEWBMGBRGBKEMAR
M1
Δ P i P 1.741.22 **3.55 ***1.71 ***1.25 ***1.62 ***0.890.941.75 **1.81 ***1.75 ***0.760.72 *1.990.78
SE−0.69−0.32−0.35−0.25−0.3−0.24−0.37−0.96−0.4−0.07−0.13−0.51−0.27−0.93−0.33
R20.560.590.840.680.410.690.490.190.710.990.940.310.540.540.48
Adj. R20.470.550.840.660.390.670.4−0.010.670.990.930.170.460.420.39
n6112024252275911126757
M2
Δ P i P \1.01 *3.59 ***1.71 ***1.20 ***1.62 ***0.881.181.76 **1.83 ***1.80 ***0.761.00 **1.90.84
SE\−0.37−0.38−0.19−0.29−0.25−0.38−0.46−0.42−0.07−0.1−0.57−0.25−0.65−0.33
Δ T a i \−0.040.030.15 ***0.10 *00.1−0.31 *0.03−0.05−0.21 *−0.02−0.190.49−0.15
SE\−0.18−0.13−0.04−0.05−0.04−0.12−0.08−0.12−0.04−0.07−0.18−0.08−0.21−0.14
R2\0.540.850.820.510.690.550.860.710.990.970.310.770.830.58
Adj. R2\0.430.830.80.460.650.370.770.630.990.96−0.040.670.720.41
n\102024252275911126757
M3
Δ P i P 1.651.26 **3.59 ***1.74 ***1.43 ***1.84 ***1.060.281.94 **1.81 ***1.74 ***0.390.72 **1.580.77
SE−0.62−0.28−0.38−0.27−0.32−0.33−0.49−0.88−0.49−0.07−0.13−0.48−0.11−0.46−0.37
Δ P i 1 P 1.190.78 **−0.05−0.35−0.030.140.320.510.30.040.19−1.06−0.87 **−1.960.08
SE−0.67−0.23−0.37−0.25−0.17−0.17−0.57−0.75−0.43−0.07−0.15−0.52−0.16−0.47−0.37
R20.790.780.840.710.490.680.520.260.730.990.950.710.940.980.48
Adj. R20.640.730.820.680.440.640.32−0.480.650.980.940.510.910.970.27
n5101922232074911115647
M4
Δ P i P \0.98 *3.67 ***1.77 ***1.34 ***1.86 ***0.921.542.11*1.83 ***1.79 ***0.230.76 *1.430.87
SE\−0.35−0.44−0.2−0.31−0.34−0.58−0.75−0.62−0.07−0.07−0.37−0.16−0.57−0.37
Δ P i 1 P \0.67 *−0.02−0.27−0.180.140.070.430.640.050.25 *−1.61−0.80 *−1.87−0.18
SE\−0.24−0.39−0.19−0.18−0.17−0.76−0.43−0.8−0.07−0.08−0.49−0.24−0.56−0.45
Δ T a i \0.130.060.15 ***0.11−0.020.09−0.47−0.11−0.05−0.23 **0.24−0.030.11−0.2
SE\−0.26−0.14−0.04−0.06−0.05−0.17−0.21−0.21−0.05−0.05−0.13−0.07−0.16−0.19
R2\0.740.840.840.570.680.550.880.740.990.990.890.950.990.59
Adj. R2\0.610.810.820.50.630.220.520.610.980.980.730.890.960.29
n\91922232074911115647

Appendix B

Figure A1. Regression between various climatic variables: (a) T a i vs. P i P ; (b) P i 1 P ; vs. P i P ; (c) P i 1 P vs. T a i . No clear correlation/collinearity were found.
Atmosphere 14 00629 g0a1

References

  1. Zhang, L.; Dawes, W.R.; Walker, G.R. Response of Mean Annual Evapotranspiration to Vegetation Changes at Catchment Scale. Water Resour. Res. 2001, 37, 701–708. [Google Scholar] [CrossRef]
  2. Bonan, G.B. Forests and Climate Change: Forcings, Feedbacks, and the Climate Benefits of Forests. Science 2008, 320, 1444–1449. [Google Scholar] [CrossRef] [PubMed] [Green Version]
  3. Bonan, G.B. Forests and Global Change. In Forest Hydrology and Biogeochemistry. Ecological Studies; Levia, D., Carlyle-Moses, D., Tanaka, T., Eds.; Springer: Dordrecht, The Netherlands, 2011; Volume 216, ISBN 978-94-007-1363-5. [Google Scholar]
  4. Kumar, A.; Mishra, S.; Bakshi, S.; Upadhyay, P.; Thakur, T.K. Response of Eutrophication and Water Quality Drivers on Greenhouse Gas Emissions in Lakes of China: A Critical Analysis. Ecohydrology 2023, 16, e2483. [Google Scholar] [CrossRef]
  5. Monteith, J.; Unsworth, M. Principles of Environmental Physics: Plants, Animals, and the Atmosphere, 4th ed.; Academic Press: Cambridge, MA, USA, 2013; pp. 1–401. [Google Scholar] [CrossRef]
  6. Campbell, G.S.; Norman, J.M. An Introduction to Environmental Biophysics; Springer: Berlin/Heidelberg, Germany, 1998. [Google Scholar] [CrossRef]
  7. AR5 Climate Change 2014: Mitigation of Climate Change—IPCC. Available online: https://www.ipcc.ch/report/ar5/wg3/ (accessed on 18 January 2023).
  8. Schaake, J.S. From Climate to Flow. In Climate Change and US Water Resources; Waggoner, P.E., Ed.; John Wiley: New York, NY, USA, 1990; pp. 177–206. ISBN 9780471618386. [Google Scholar]
  9. Sankarasubramanian, A.; Vogel, R.M.; Limbrunner, J.F. Climate Elasticity of Streamflow in the United States. Water Resour. Res. 2001, 37, 1771–1781. [Google Scholar] [CrossRef] [Green Version]
  10. Chiew, F.H.S. Estimation of Rainfall Elasticity of Streamflow in Australia. Hydrol. Sci. J. 2010, 51, 613–625. [Google Scholar] [CrossRef]
  11. Xu, X.; Yang, D.; Sivapalan, M. Assessing the Impact of Climate Variability on Catchment Water Balance and Vegetation Cover. Hydrol. Earth Syst. Sci. 2012, 16, 43–58. [Google Scholar] [CrossRef] [Green Version]
  12. Yang, H.; Yang, D. Derivation of Climate Elasticity of Runoff to Assess the Effects of Climate Change on Annual Runoff. Water Resour. Res. 2011, 47, 7526. [Google Scholar] [CrossRef]
  13. Fu, G.; Charles, S.P.; Chiew, F.H.S. A Two-Parameter Climate Elasticity of Streamflow Index to Assess Climate Change Effects on Annual Streamflow. Water Resour. Res. 2007, 43, W11419. [Google Scholar] [CrossRef]
  14. Ma, H.; Yang, D.; Tan, S.K.; Gao, B.; Hu, Q. Impact of Climate Variability and Human Activity on Streamflow Decrease in the Miyun Reservoir Catchment. J. Hydrol. 2010, 389, 317–324. [Google Scholar] [CrossRef]
  15. Xing, W.; Wang, W.; Zou, S.; Deng, C. Projection of Future Runoff Change Using Climate Elasticity Method Derived from Budyko Framework in Major Basins across China. Glob. Planet. Chang. 2018, 162, 120–135. [Google Scholar] [CrossRef]
  16. Amrit, K.; Mishra, S.K.; Pandey, R.P.; Himanshu, S.K.; Singh, S. Standardized Precipitation Index-Based Approach to Predict Environmental Flow Condition. Ecohydrology 2019, 12, e2127. [Google Scholar] [CrossRef]
  17. Himanshu, S.K.; Pandey, A.; Madolli, M.J.; Palmate, S.S.; Kumar, A.; Patidar, N.; Yadav, B. An Ensemble Hydrologic Modeling System for Runoff and Evapotranspiration Evaluation over an Agricultural Watershed. J. Indian Soc. Remote Sens. 2023, 51, 177–196. [Google Scholar] [CrossRef]
  18. Fu, G.; Charles, S.P.; Viney, N.R.; Chen, S.; Wu, J.Q. Impacts of Climate Variability on Stream-Flow in the Yellow River. Hydrol. Process. 2007, 21, 3431–3439. [Google Scholar] [CrossRef]
  19. Sun, S.; Chen, H.; Ju, W.; Song, J.; Zhang, H.; Sun, J.; Fang, Y. Effects of Climate Change on Annual Streamflow Using Climate Elasticity in Poyang Lake Basin, China. Theor. Appl. Climatol. 2013, 112, 169–183. [Google Scholar] [CrossRef]
  20. Zhou, Y.; Lai, C.; Wang, Z.; Chen, X.; Zeng, Z.; Chen, J.; Bai, X. Quantitative Evaluation of the Impact of Climate Change and Human Activity on Runoff Change in the Dongjiang River Basin, China. Water 2018, 10, 571. [Google Scholar] [CrossRef] [Green Version]
  21. Trewartha, G.T.; Horn, L.H. An Introduction to Climate; McGraw-Hill: New York, NY, USA, 1980; p. 416. [Google Scholar]
  22. Trewartha, G.T. An Introduction to Climate; McGraw-Hill: New York, NY, USA, 1968; p. 408. [Google Scholar]
  23. Lai, Y.J.; Tanaka, N.; Im, S.; Kuraji, K.; Tantasirin, C.; Tuankrua, V.; Majuakim, L.; Cleophas, F.; Mahali, M.B. Climate Classification of Asian University Forests under Current and Future Climate. J. For. Res. 2020, 25, 136–146. [Google Scholar] [CrossRef]
  24. Mahali, M.; Kuraji, K.; Majuakim, L. Hydro-Meteorological Monitoring & Research in Crocker Range Park, Sabah Malaysia. In Proceedings of the 7th Symposium of Asian University Forest Consortium, Furano, Japan, 11–14 October 2016. [Google Scholar]
  25. Shiraki, K.; Tanaka, N.; Chatchai, T.; Suzuki, M. Water Budget and Rainfall to Runoff Processes in a Seasonal Tropical Watershed in Northern Thailand. Hydrol. Res. Lett. 2017, 11, 149–154. [Google Scholar] [CrossRef] [Green Version]
  26. Cheng, J.D.; Yan, C.S.; Yeh, J.L. Baseflow and Storage Relationships for Small Forested Watersheds (English Summary). Taiwan J. For. Sci. 2001, 16, 161–173. [Google Scholar]
  27. Committee, Hydrology and Water Quality Division: Fundamental Data Development. Report of the Hydrological Observation and Chemical Analysis of Water Quality in the University of Tokyo Forests; The University of Tokyo: Tokyo, Japan, 2019; Volume 63. [Google Scholar]
  28. Im, S.; Lee, J.; Kuraji, K.; Lai, Y.J.; Tuankrua, V.; Tanaka, N.; Gomyo, M.; Inoue, H.; Tseng, C.W. Soil Conservation Service Curve Number Determination for Forest Cover Using Rainfall and Runoff Data in Experimental Forests. J. For. Res. 2020, 25, 204–213. [Google Scholar] [CrossRef]
  29. Im, S.; Yang, H.; Eu, S.; Li, Q. Long-Term Monitoring Programs of Watershed Hydrology in the University Forests, SNU. In Proceedings of the 7th Symposium of Asian University Forest Consortium, Furano, Japan, 11–14 October 2016. [Google Scholar]
  30. Andréassian, V.; Coron, L.; Lerat, J.; Le Moine, N. Climate Elasticity of Streamflow Revisited—An Elasticity Index Based on Long-Term Hydrometeorological Records. Hydrol. Earth Syst. Sci. 2016, 20, 4503–4524. [Google Scholar] [CrossRef] [Green Version]
  31. Chiew, F.H.S.; Peel, M.C.; Mcmahon, T.A.; Siriwardena, L.W. Precipitation Elasticity of Streamflow in Catchments across the World. In Climate Variability and Change—Hydrological Impacts, Proceedings of the Fifth FRIEND World Conference, Havana, Cuba, 27 November–1 December 2006; IAHS Press: Wallingford, UK, 20 November 2006; Volume 308, pp. 256–262. [Google Scholar]
  32. Zhang, Y.; Viglione, A.; Blöschl, G. Temporal Scaling of Streamflow Elasticity to Precipitation: A Global Analysis. Water Resour. Res. 2022, 58, e2021WR030601. [Google Scholar] [CrossRef]
  33. Seymenov, K. Climate Elasticity of Annual Streamflow in Northwest Bulgaria. In Smart Geography: 100 Years of the Bulgarian Geographical Society; Springer: Cham, Switzerland, 2020; pp. 105–115. [Google Scholar] [CrossRef]
  34. Hisada, S.; Senge, M.; Ito, K.; Maruyama, T. Comparison of Characteristic of Water Balance between Evergreen Coniferous and Deciduous Broad-Leaved Forests. IDRE J. 2011, 271, 1–7. [Google Scholar] [CrossRef]
  35. Tanaka, N.; Kume, T.; Yoshifuji, N.; Tanaka, K.; Takizawa, H.; Shiraki, K.; Tantasirin, C.; Tangtham, N.; Suzuki, M. A Review of Evapotranspiration Estimates from Tropical Forests in Thailand and Adjacent Regions. Agric. For. Meteorol. 2008, 148, 807–819. [Google Scholar] [CrossRef]
  36. Kumagai, O.; Porporato, A. Strategies of a Bornean Tropical Rainforest Water Use as a Function of Rainfall Regime: Isohydric or Anisohydric? Plant Cell Environ. 2012, 35, 61–71. [Google Scholar] [CrossRef]
  37. Zhao, Z.; Zhao, P.; Zhang, Z.; Ouyang, L.; Zhao, X.; Zhu, L.; Cao, C.; Zeng, L. Enhanced Isohydric Behavior Decoupled the Whole-Tree Sap Flux Response to Leaf Transpiration under Nitrogen Addition in a Subtropical Forest. Forests 2022, 13, 1847. [Google Scholar] [CrossRef]
  38. Mrad, A.; Sevanto, S.; Domec, J.C.; Liu, Y.; Nakad, M.; Katul, G. A Dynamic Optimality Principle for Water Use Strategies Explains Isohydric to Anisohydric Plant Responses to Drought. Front. For. Glob. Chang. 2019, 2, 49. [Google Scholar] [CrossRef] [Green Version]
  39. Sinha, J.; Sharma, A.; Khan, M.; Goyal, M.K. Assessment of the Impacts of Climatic Variability and Anthropogenic Stress on Hydrologic Resilience to Warming Shifts in Peninsular India. Sci. Rep. 2018, 8, 13833. [Google Scholar] [CrossRef] [PubMed] [Green Version]
Figure 1. Time series of annual rainfall (blue) and runoff (red) for each catchment.
Atmosphere 14 00629 g001
Figure 2. Regression of mean annual runoff against mean annual rainfall.
Atmosphere 14 00629 g002
Figure 3. C vs. (a) ε R P , (b) ε R T a , and (c) ε R P 1 .
Atmosphere 14 00629 g003
Figure 4. Coefficient values in the elasticity models along altitudinal- and a latitudinal-gradients. Blue-colored and red-colored circles indicate positive and negative coefficients, respectively, and their magnitudes are represented by diameter size.
Atmosphere 14 00629 g004
Table 1. Examined catchment information.
CatchmentAbbreviationState/Province, CountryClimatic Zone (*)LongitudeLatitude
Gunung AlabALASabah, MalaysiaCfb116°21′5°49′
Kog Ma D WatershedKOGChiangmai, ThailandCfa98°54′18°49′
Nan Watershed Research StationNANNan, ThailandAw100°00′19°00′
Lienhuachih Watershed 3LH3Nantou, TaiwanCwa120°54′23°55′
Lienhuachih Watershed 4LH4Nantou, TaiwanCwa120°54′23°56′
Lienhuachih Watershed 5LH5Nantou, TaiwanCwa120°54′23°56′
Jyugei No.1JY1Shizuoka, JapanCfa138°50′34°41′
Jyugei No. 3JY3Shizuoka, JapanCfa138°51′34°42′
Fukuroyamasawa Watershed AFUAChiba, JapanCfa140°06′35°12′
Shirasaka Experimental WatershedSEWAichi, JapanDoa137°10′35°13′
Ananomiya Experimental WatershedAEWAichi, JapanDoa137°06′35°15′
BukmoongolBKGJeollanam, KoreaDoa127°36′35°02′
BaramgolBRGJeollanam, KoreaDa127°36′35°02′
BakemonosawaBKESaitama, JapanDcb138°49′35°54′
MaruyamazawaMARHokkaido, JapanDcb142°34′43°15′
* As per Trewartha climate classification [21,22,23].
Table 2. Examined catchment information.
Catchment (Abbreviation)Altitudinal Range (masl)Area (ha)Forest TypeBedrock
ALA1000–19708.5Evergreen broad-leavedPaleogene sedimentary rocks
KOG1290–14408.6Evergreen broad-leavedMesozoic granite
NAN400–80061,200.0Deciduous broad-leaved including irrigated croplands and villagesPaleozoic siltstone
LH3666–7814.1Evergreen broad-leavedPaleogene sandstone and shale
LH4728–7975.9Chinese fir (plantation)Paleogene sandstone and shale
LH5735–7888.4Evergreen broad-leavedPaleogene sandstone and shale
JY1133–3207.3Evergreen broad-leavedNeogene andesite
JY3220–3351.6Camphor laurel (plantation)Neogene andesite
FUA129–2250.8Japanese cedar and cypress (plantation)Neogene sandstone and mudstone
SEW304–62988.5Deciduous broad-leaved with evergreen conifersCretaceous granite
AEW140–21813.9Deciduous broad-leaved with evergreen pineCretaceous granite
BKG120–34116.0Pine mixed with Japanese cedarPrecambrian granite gneiss
BRG140–35915.7Mixed pine forestPrecambrian granite gneiss
BKE1030–164041.1Deciduous broad-leavedPaleo-Mesozoic sandstone and mudstone
MAR415–810220.0Deciduous broad-leavedQuaternary tuff
Table 3. Mean annual rainfall (P), runoff (R), and air temperature (Ta) in each catchment throughout the studied period. N.A. = not available.
Catchment (Abbreviation)P (mm)R (mm)Ta (°C)Data Period
ALA3873 (±641)2841 (±1094)162011−2016
KOG1870 (±316)1229 (±328)19.9 (±0.34)1998−2008
NAN1362 (±266)169 (±127)26 (±0.59)1998−2017
LH32386 (±443)984 (±402)21.2 (±0.97)1975−1988 and 1990−2000
LH42320 (±390)1268 (±414)21.2 (±0.97)1975−1988 and 1990−2000
LH52297 (±379)1122 (±361)21.3 (±0.98)1975−1988 and 1990−1997
JY12385 (±157)1063 (±89)15.4 (±0.21)2007−2013
JY32338 (±198)1503 (±187)15.4 (±0.31)2007 and 2009−2011
FUA2485 (±276)1089 (±234)13.9 (±0.35)2004, 2003−2010, and 2012
SEW1838 (±317)916 (±300)13.1 (±0.27)2001−2011
AEW1693 (±306)919 (±299)13.1 (±0.27)2000−2011
BKG1261 (±212)510 (±117)14 (±0.49)1992−1997
BRG1365 (±322)467 (±108)14.2 (±0.65)1992−1998
BKE1783 (±258)475 (±203)8.6 (±0.50)2012−2013, 2015, and 2017−2018
MAR1051 (±175)823 (±155)5.9 (±0.39)2004−2010
Table 4. Selected elasticity model and its coefficients for each catchment.
Catchment
(Abbreviation)
ModelCoefficients *CAdjusted
R2
ε R P ε R P 1 ε R T a
ALAM31.6551.1890.7190.644
KOGM31.2630.7840.6540.727
NANM13.5500.1140.837
LH3M41.765−0.2690.1500.4140.819
LH4M41.339−0.1790.1100.5410.501
LH5M11.6160.4790.671
JY1M10.8900.4460.400
JY3M21.182−0.3110.6370.774
FUAM11.7520.4270.675
SEWM21.833−0.0510.4860.986
AEWM41.7890.247−0.2290.5300.985
BKGM40.229−1.6110.2360.4060.728
BRGM30.720−0.8710.3460.914
BKEM31.581−1.9630.2550.969
MARM20.839−0.1530.7880.407
* Bold–italic, bold, and italicized coefficients indicate significance levels of p < 0.001, p < 0.01, and p < 0.05, respectively.
Disclaimer/Publisher’s Note: The statements, opinions and data contained in all publications are solely those of the individual author(s) and contributor(s) and not of MDPI and/or the editor(s). MDPI and/or the editor(s) disclaim responsibility for any injury to people or property resulting from any ideas, methods, instructions or products referred to in the content.

