Article

El Niño Onset Time Affects the Intensity of Landfalling Tropical Cyclones in China

1
College of Ocean and Meteorology, Guangdong Ocean University, Zhanjiang 524088, China
2
China Meteorological Administration-Guangdong Ocean University (CMA-GDOU) Joint Laboratory for Marine Meteorology, South China Sea Institute of Marine Meteorology, Guangdong Ocean University, Zhanjiang 524088, China
*
Author to whom correspondence should be addressed.
Atmosphere 2023, 14(4), 628; https://doi.org/10.3390/atmos14040628
Submission received: 21 February 2023 / Revised: 22 March 2023 / Accepted: 24 March 2023 / Published: 26 March 2023
(This article belongs to the Special Issue El Niño-Southern Oscillation Related Extreme Events)

Abstract

:
In this work, we studied the influence of spring (SP) and summer (SU) El Niño events on the landfalling tropical cyclones (TCs) in China. The results showed that compared to SU El Niño years, the average latitude of the landfalling TCs in SP El Niño years shifted significantly southward and that the average TC intensity was significantly stronger, especially in the post-landfall period. Additionally, more severe tropical storm-level TCs generated over the South China Sea made landfall in China. Meanwhile, in SP El Niño years, landfalling TCs in southern China had a greater landfall intensity, but landfalling TCs in eastern China were the opposite. These changes in TC intensity during the SP El Niño years could be attributed to more favorable dynamical and thermodynamical conditions, which are beneficial for maintaining TC intensity and duration after landfall. These results could have important implications for an in-depth understanding of TC activities, as well as TC disaster prevention and mitigation.

1. Introduction

Tropical cyclones (TCs) cause catastrophic weather conditions and occur worldwide. Their activities are influenced by various climate modes across a range of time scales [1,2,3,4]. The strong winds and heavy precipitation caused by landfalling TCs can generate a range of disasters (such as storm surges, floods, landslides, etc.), which can, in turn, cause severe loss of life and damage to property in many countries and regions [5,6,7,8]. Therefore, studying the characteristics and climatological laws of landfalling TC activities could provide important references for preventing and reducing TC-related disasters.
Currently, much research has focused on the frequency, genesis position, track, duration, intensity, and destructiveness of landfalling TCs [9,10,11,12,13]. According to Li et al. [14], the mean locations of the lifetime maximum intensity (LMI) of landfalling TCs in China from 1979 to 2018 have gradually shifted closer to the coast, which could be related to the landward migration of TC genesis locations. Mei and Xie [15] investigated the landfall intensity of TCs in East and Southeast Asia and found that it has increased since the late 1970s and that the proportion of intense TCs (category 4 or 5) has doubled or even tripled, which could be related to the local increase in sea surface warming in the marginal regions of East and Southeast Asia.
The El Niño-Southern Oscillation (ENSO) is an interannual-scale fundamental pattern between the tropical Pacific Ocean and the surrounding atmosphere [16], which modulates TC activities in the Western North Pacific (WNP) [17,18,19,20,21], including ENSO-related landfalling TCs [22,23,24,25]. ENSO influences large-scale environmental conditions in the WNP through the strong modulation of the atmosphere and ocean, thereby altering TC activities [2,26]. A study examined how different types of El Niño events (e.g., eastern type vs. central type) affected landfalling TCs in East Asia during 1961–2009 and found that, due to the differences in large-scale circulation, TCs were more likely to make landfall in Japan and Korea during the summer of Central Pacific (CP) El Niño years, while in the fall of CP El Niño years, landfalling TCs in central India, the Malay Peninsula, and the Philippines could be suppressed [24]. Another previous study [25] also found that TCs generated in the WNP were likely to cause more severe disasters in China during La Niña and Eastern Pacific (EP) El Niño years.
The impact of ENSO on landfalling TC activities has been generally explored based on the spatial distribution patterns of El Niño events (i.e., CP and EP types) or based on the classification of ENSO phases [24,25]. However, those results are difficult to apply to the seasonal-scale prediction of TC activities. Due to the diversity of El Niño events, exploring the impact of El Niño events on TC activities from the perspective of the onset time of the El Niño events could have some implications for their seasonal prediction.
Xu and Chan [27] classified El Niño events according to their onset times, defining El Niño events that occurred in April–June as spring-type (SP) El Niño events and those that occurred in July–October as summer-type (SU) El Niño events. They found that the different onset times of the El Niño events were related to the Asian–Australian monsoon, which could in turn affect TC activities. This classification has since been widely applied in other subsequent studies [27,28,29,30]. Liang et al. [30] investigated the impact of the onset time of El Niño events on TCs generated in the WNP and showed that in SP El Niño years, the mean genesis position of TCs in the WNP shifted significantly eastward and toward the equator. Additionally, the TCs are generally stronger and last longer. In contrast, the mean location of TC formation was only eastward in SU event years, and TC intensity changed significantly, except for categories 1 + 2 + 3. The significant eastward and southward shift of the mean genesis position in SP El Niño years has mainly been attributed to the southeastward shift of favorable atmospheric and oceanic conditions, which are primarily related to the onset times of westerly wind anomalies near the Central Equatorial Pacific.
As one of the countries most affected by TCs worldwide, China has an average of 7–9 landfalling TCs per year [5,31,32]. Those landfalling TCs are closely related to ENSO [33,34]. It would be of great significance to disaster prevention and mitigation efforts for TC activities in the typhoon season to be predicted in advance, according to the early stages of ENSO signals. Therefore, in this work, we aimed to compare and analyze the impact of the different onset times of El Niño events (i.e., SP and SU types) on the landfalling TCs in China. This paper is organized as follows: Section 2 introduces the data and methods used in this work; Section 3 focuses on our analysis of the characteristics of landfalling TCs in China during the typhoon seasons of the developing years of SP/SU El Niño events; Section 4 further investigates the possible mechanisms behind the identified impacts; and Section 5 sets out our conclusions.

2. Data and Methods

2.1. Data

The monthly average sea surface temperature (SST) data used to calculate the Niño3.4 index were from the Extended Reconstructed SST version 4 (ERSST-v4), which was provided by the National Oceanic and Atmospheric Administration (NOAA) and had a horizontal resolution of 2° × 2°. The best track data were obtained from the Northwest Pacific tropical cyclone best track dataset, which was provided by the Joint Typhoon Warning Center (JTWC) of the International Best Tracking Archive for Climate Stewardship (IBTrACS). The JTWC dataset included the TC latitudes, longitudes, maximum sustained wind speeds, and offshore distances at 3 h intervals.
The monthly mean ERA5 reanalysis data were downloaded from the European Centre for Medium-Range Weather Forecasts (ECMWF) and included an upper air layer dataset with a vertical structure of 37 layers and a single-layer dataset at ground level, both of which had a horizontal resolution of 1° × 1°. Specifically, the selected variables included relative humidity (600 hPa), total column water vapor (TCWV), the U and V components of wind (850 hPa), relative vorticity (850 hPa), and vertical velocity (500 hPa), among others.

2.2. Methods

Referring to the previous definitions of SP and SU El Niño events [27,29,30], an El Niño event was first defined when the Niño3.4 index exceeded 0.5 °C and lasted for more than 5 months. However, two necessary conditions needed to be added to the definition of an El Niño event: First, according to the Climate Prediction Center’s (CPC) calculation method, the corresponding monthly Niño3.4 index had to be obtained by calculating the 30-year climate state values for each 5-year cycle to remove the warming trends of the Niño 3.4 index that were caused by global warming. Second, when the SSTA in an event was intermittently less than 0.5 °C for 1 month and the 3 month sliding average of the Niño 3.4 index for that month exceeded 0.5 °C, the preceding and following events were considered to be continuous, and the event could be regarded as an El Niño event. The month when the Niño 3.4 index first exceeded 0.5 °C was defined as the onset month of the El Niño event. An El Niño event was defined as an SP El Niño event when the onset month was in April–June and as a SU El Niño event when the onset month was in July–October.
Following the above definitions, 18 El Niño events were counted for 1951–2017, but 2 needed to be excluded. The 1951 El Niño event was removed due to its short duration. The 1986–1988 El Niño event was excluded because its Niño3.4 index evolution showed a bimodal pattern that lacked the usual seasonal phase lock of El Niño events. After the classification, there were eight SP El Niño events (1957/58, 1965/66, 1972/73, 1982/83, 1991/92, 1997/98, 2002/03, and 2015/16) and eight SU El Niño events (1958/59, 1963/64, 1969/70, 1976/77, 1994/95, 2004/05, 2006/07, and 2009/10) from 1951 to 2017. The El Niño events obtained from this classification were consistent with those identified by Liang et al. [30]. Figure 1 shows the temporal evolution of the Niño 3.4 index from the El Niño developing year to the El Niño decay year for the SP and SU El Niño events. Unlike SU El Niño events, SP El Niño events were usually stronger and lasted longer, which was consistent with previous results [27,28,29,30].
During the movement of TCs, when the offshore distance changed from a positive to zero and the position was located in China’s land area, it was defined as a TC that made landfall in China. In order to investigate the differences in TCs with different landfall intensities between the SP and SU El Niño years, the TCs were classified into three categories, according to the tropical cyclone landfall intensity criteria of the China Meteorological Administration (CMA). Based on the landfall intensity of the TCs, they were categorized as tropical depression-tropical storms (TD+TS: 20.9–47.4 kt), strong tropical storms (STS: 47.5–63.3 kt), or typhoons (TY: ≥63.4 kt). According to the results of previous studies [35,36], we focused on TCs that were generated in the typhoon season (June–November) of the developing year of each El Niño event.
To further investigate the possible mechanisms of the differences in tropical cyclone activities during the two types of El Niño events, this paper mainly considered the thermodynamic and dynamical conditions, such as relative humidity at 600 hPa, TCWV, relative vorticity at 850 hPa, and vertical velocity at 500 hPa, which can have important effects on tropical cyclone activities. These environmental factors were mainly obtained from the monthly averaged ERA5 reanalysis data, and their differences in typhoon seasons during the development years of the two types of El Niño events were analyzed.
In this study, the climatology is represented using the average from 1951 to 2017. Because of the relatively small sample sizes of SP and SU El Niño events in this study, it was not guaranteed that the samples followed a Gaussian distribution. Therefore, a nonparametric test, known as the Wilcoxon–Mann–Whitney test [37,38,39,40], was used to assess the statistical significance of the differences.

3. The Characteristics of Landfalling TCs during the SP and SU El Niño Years

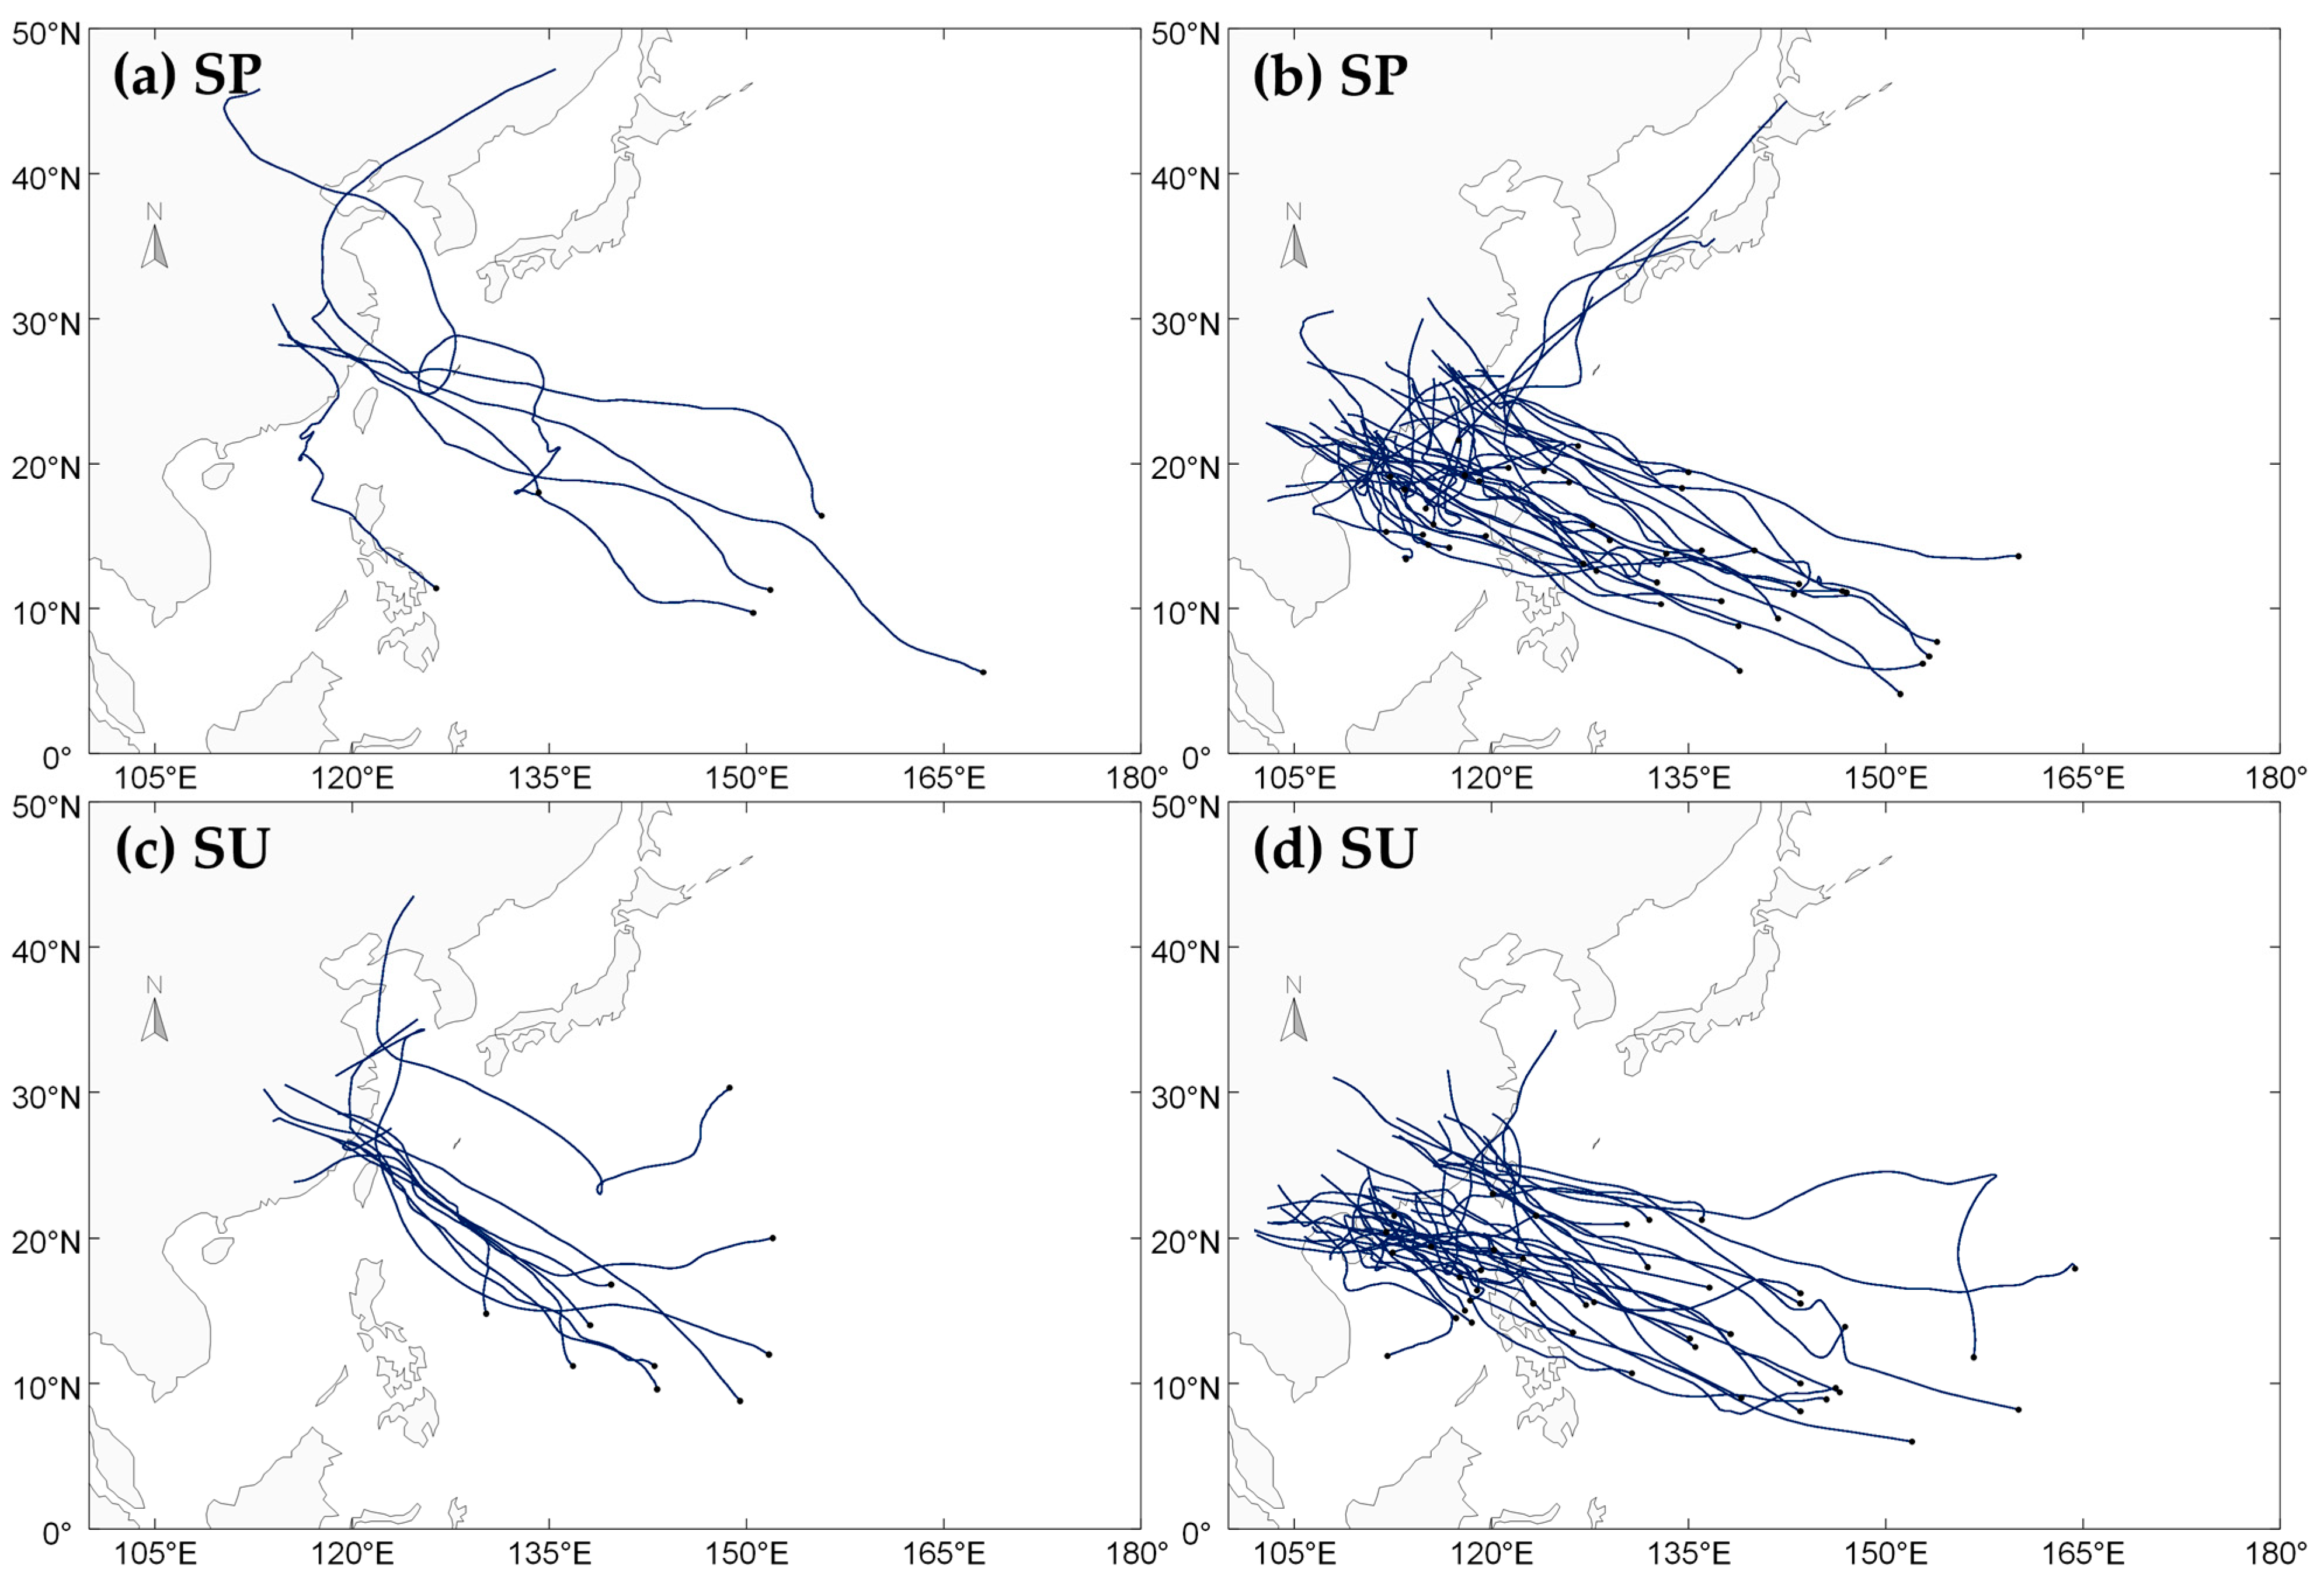
3.1. Characteristics of Landfalling TCs

According to the JTWC dataset, a total of 453 TCs made landfall in China during the typhoon season in 1951–2017, with an annual average of 5.96 TCs. Among these events, 47 TCs made landfall in China during SP El Niño years, with an annual average of 5.88 TCs, and 52 TCs made landfall during SU El Niño years, with an annual average of 6.50 TCs. The characteristic differences in the landfalling TCs in China between the typhoon season of the SP El Niño years and the SU El Niño years are shown in Table 1. The mean TC genesis latitude of the SP El Niño years was more southward compared to the climatology and that of the SU El Niño years, which was in agreement with the results of Liang et al. [30]. In SP El Niño years, the average latitude of landfalling TCs shifted significantly southward (p < 0.01), and the TC average intensity (55.53 kt) was also significantly stronger (p < 0.01), both of which passed the 95% significance test. Landfalling TCs in SP El Niño years also lasted longer. The TC best tracks with different classifications in the typhoon season of the two types of El Niño years were further investigated (Figure 2). TCs in both types of El Niño years usually tracked northwestward, and most made landfall south of 30° N.
In terms of landfalling TCs, we focused more on TCs after they made landfall. The average position of TCs in SP El Niño years was 115.90° E and 25.58° N, while that of SU El Niño years was 113.66° E and 23.64° N. The differences between those positions passed the 95% significance test (Table 1). For SP El Niño years, the average landfall intensity of TCs was 62.79 kt, whereas it was only 52.99 kt for SU El Nino years, indicating a reduction of approximately 18.5% (p = 0.03). This was because TCs made landfall more intensely in SP El Niño years (Table 2). Meanwhile, the average intensity of TCs after landfall in SP El Niño years (40.26 kt) was significantly greater than that in SU El Niño years (35.54 kt), indicating that landfalling TCs in China during SP El Niño years could cause greater disasters and losses in the landfall area compared to those during SU El Niño years.
To further understand the characteristics of landfalling TCs in China during SP and SU El Niño years, we calculated the average TC position (Figure 3), intensity, and duration with different landfall intensities (Table 2). Based on Figure 3, the stronger the landfall intensity of landfalling TCs in China, the more eastward their genesis locations. In SP El Niño years, STS-level TCs were more likely to be generated over the South China Sea, leading to a westward shift in the mean position of TC formation compared to that in SU El Niño years. In SU El Niño years, the mean genesis location of TY-level TCs shifted eastward in comparison to that in SP El Niño years. There was little difference in the genesis position of TD+TS-level TCs between the two types of El Niño years.
Table 2 shows that in SP El Niño years, the number of TY-level TCs (21) accounted for the largest proportion of the total number (47) at 44.7%, while in SU El Niño years, TD+TS-level TCs (25) made up the largest proportion at 48.1%. This implied that landfalling TCs in China in SP El Niño years were likely to make landfall at a stronger intensity than those in SU El Niño years. Compared to SU El Niño years, the average position of TD+TS-level TCs in SP El Niño years shifted significantly northeastward. In contrast, the average positions of both STS-level TCs and TY-level TCs shifted significantly southwestward. The average intensity of TD+TS-level TCs was significantly stronger in SP El Niño years than in SU El Niño years (p = 0.02), whereas the average intensities of STS-level TCs and TY-level TCs were weaker in SP El Niño years but this did not pass the 95% significance test. In terms of TC duration, TD+TS-level and TY-level TCs in SP El Niño years lasted longer than those in SU El Niño years, while the duration of STS-level TCs was the opposite.
Previous studies have shown that differences in TC genesis locations [11,33,41,42] and TC landfall locations [25,43,44] can cause various impacts on coastal countries and regions. Consequently, the possible impacts of TCs with different generation sources (i.e., the South China Sea (SCS) and the Western North Pacific (WNP)) and those at various landfall locations (i.e., Eastern China (EC) and Southern China (SC)) on China during two types of El Niño years were further analyzed in this work.

3.2. Landfalling TCs Generated over the SCS and WNP

In this section, we divided TC genesis locations into the SCS and WNP according to a boundary line along 120° N. From 1951 to 2017, 89 (20%) and 364 (80%) landfalling TCs were generated in the SCS (TCSCS) and WNP (TCWNP), respectively. Among them, 13 landfalling TCs were generated in the SCS region during SP El Niño years and 12 were generated during SU El Niño years, while 34 and 40 TCs were generated in the WNP region during SP and SU El Niño years, respectively (Table 3). Figure 4 displays the moving tracks of landfalling TCs generated in the SCS and WNP regions during the two types of El Niño years. As shown in Figure 4a,c, the moving tracks of TCSCS were diverse in SP El Niño years, while they tended to move northwestward during SU El Niño years, mostly making landfall in the western parts of Guangdong Province and Hainan Province. Meanwhile, TCWNP tended to move northwestward during both types of El Niño years (Figure 4b,d). Therefore, the results in Table 3 were obtained statistically, and there were no significant differences in the mean genesis positions of landfalling TCs in the SCS and WNP regions between the two types of El Niño years. In terms of average position, the average longitude of TCSCS shifted significantly eastward in SP El Niño years compared to that in SU El Niño years (p = 0.02), whereas TCWNP shifted significantly southwestward in SP El Niño years compared to SU El Niño years (p < 0.01). In terms of average intensity, the average intensities of both TCSCS and TCWNP in SP El Niño years were significantly greater than those in SU El Niño years (p < 0.01). This indicated that TCs generated in both the SCS and WNP genesis regions during SP El Niño years were stronger than those generated in SU El Niño years.
The TC parameters of TCs after landfall were also examined (Table 3). Compared to SU El Niño years, the average position of TCSCS shifted significantly northeastward in SP El Niño years (p < 0.01). This could be verified by their moving tracks. In the WNP region, the average position of TCs in SP El Niño years also shifted northeastward compared to that in SU El Niño years, but this did not pass the statistical significance test. In terms of intensity, the average post-landfall intensity of TCSCS was significantly stronger in SP El Niño years (p < 0.01). It is also worth noting that the landfall intensity of TCSCS in SU El Niño years was apparently weaker than that of SP El Niño years (p = 0.01) because TCSCS usually made landfall at the TD+TS level in SU El Niño years (Figure 3b).

3.3. TCs Making Landfall in East and South China

Likewise, according to the results of previous studies [11,25], the eastern coastal region of China was subdivided into EC and SC using a 25°N boundary line. There were 387 TCs (85%) that made landfall in SC (TCSC) from 1951 to 2017, while 66 TCs (15%) made landfall in EC (TCEC). Among them, 6 TCs made landfall in EC during SP El Niño years and 10 made landfall during SU El Niño years, while 41 and 42 TCs made landfall in SC during SP and SU El Niño years, respectively (Table 4). Figure 5 shows the moving tracks of TCs that made landfall in EC and SC during the two types of El Niño years. TCEC were generated in the WNP region during both types of El Niño years (Figure 5a,c). As seen in Table 4, compared to SU El Niño years, the average latitude of the TCSC shifted significantly southward, and their average intensity was significantly stronger in SP El Niño years (p < 0.01). Additionally, TCEC had a longer mean lifetime duration in the SP El Niño years.
According to the post-landfall statistics of TCs (Table 4), the average position of TCEC was significantly northwestward in SP El Niño years, whereas, for TCs that made landfall in SC, the average position was significantly northeastward in SP El Niño years. It is noteworthy that the average intensity and landfall intensity of TCSC in SP El Niño years were significantly greater than those in SU El Niño years (p < 0.01), whereas the average intensity and landfall intensity of TCEC were the opposite. Additionally, post-landfall TCEC lasted significantly longer in SP El Niño years than in SU El Niño years.

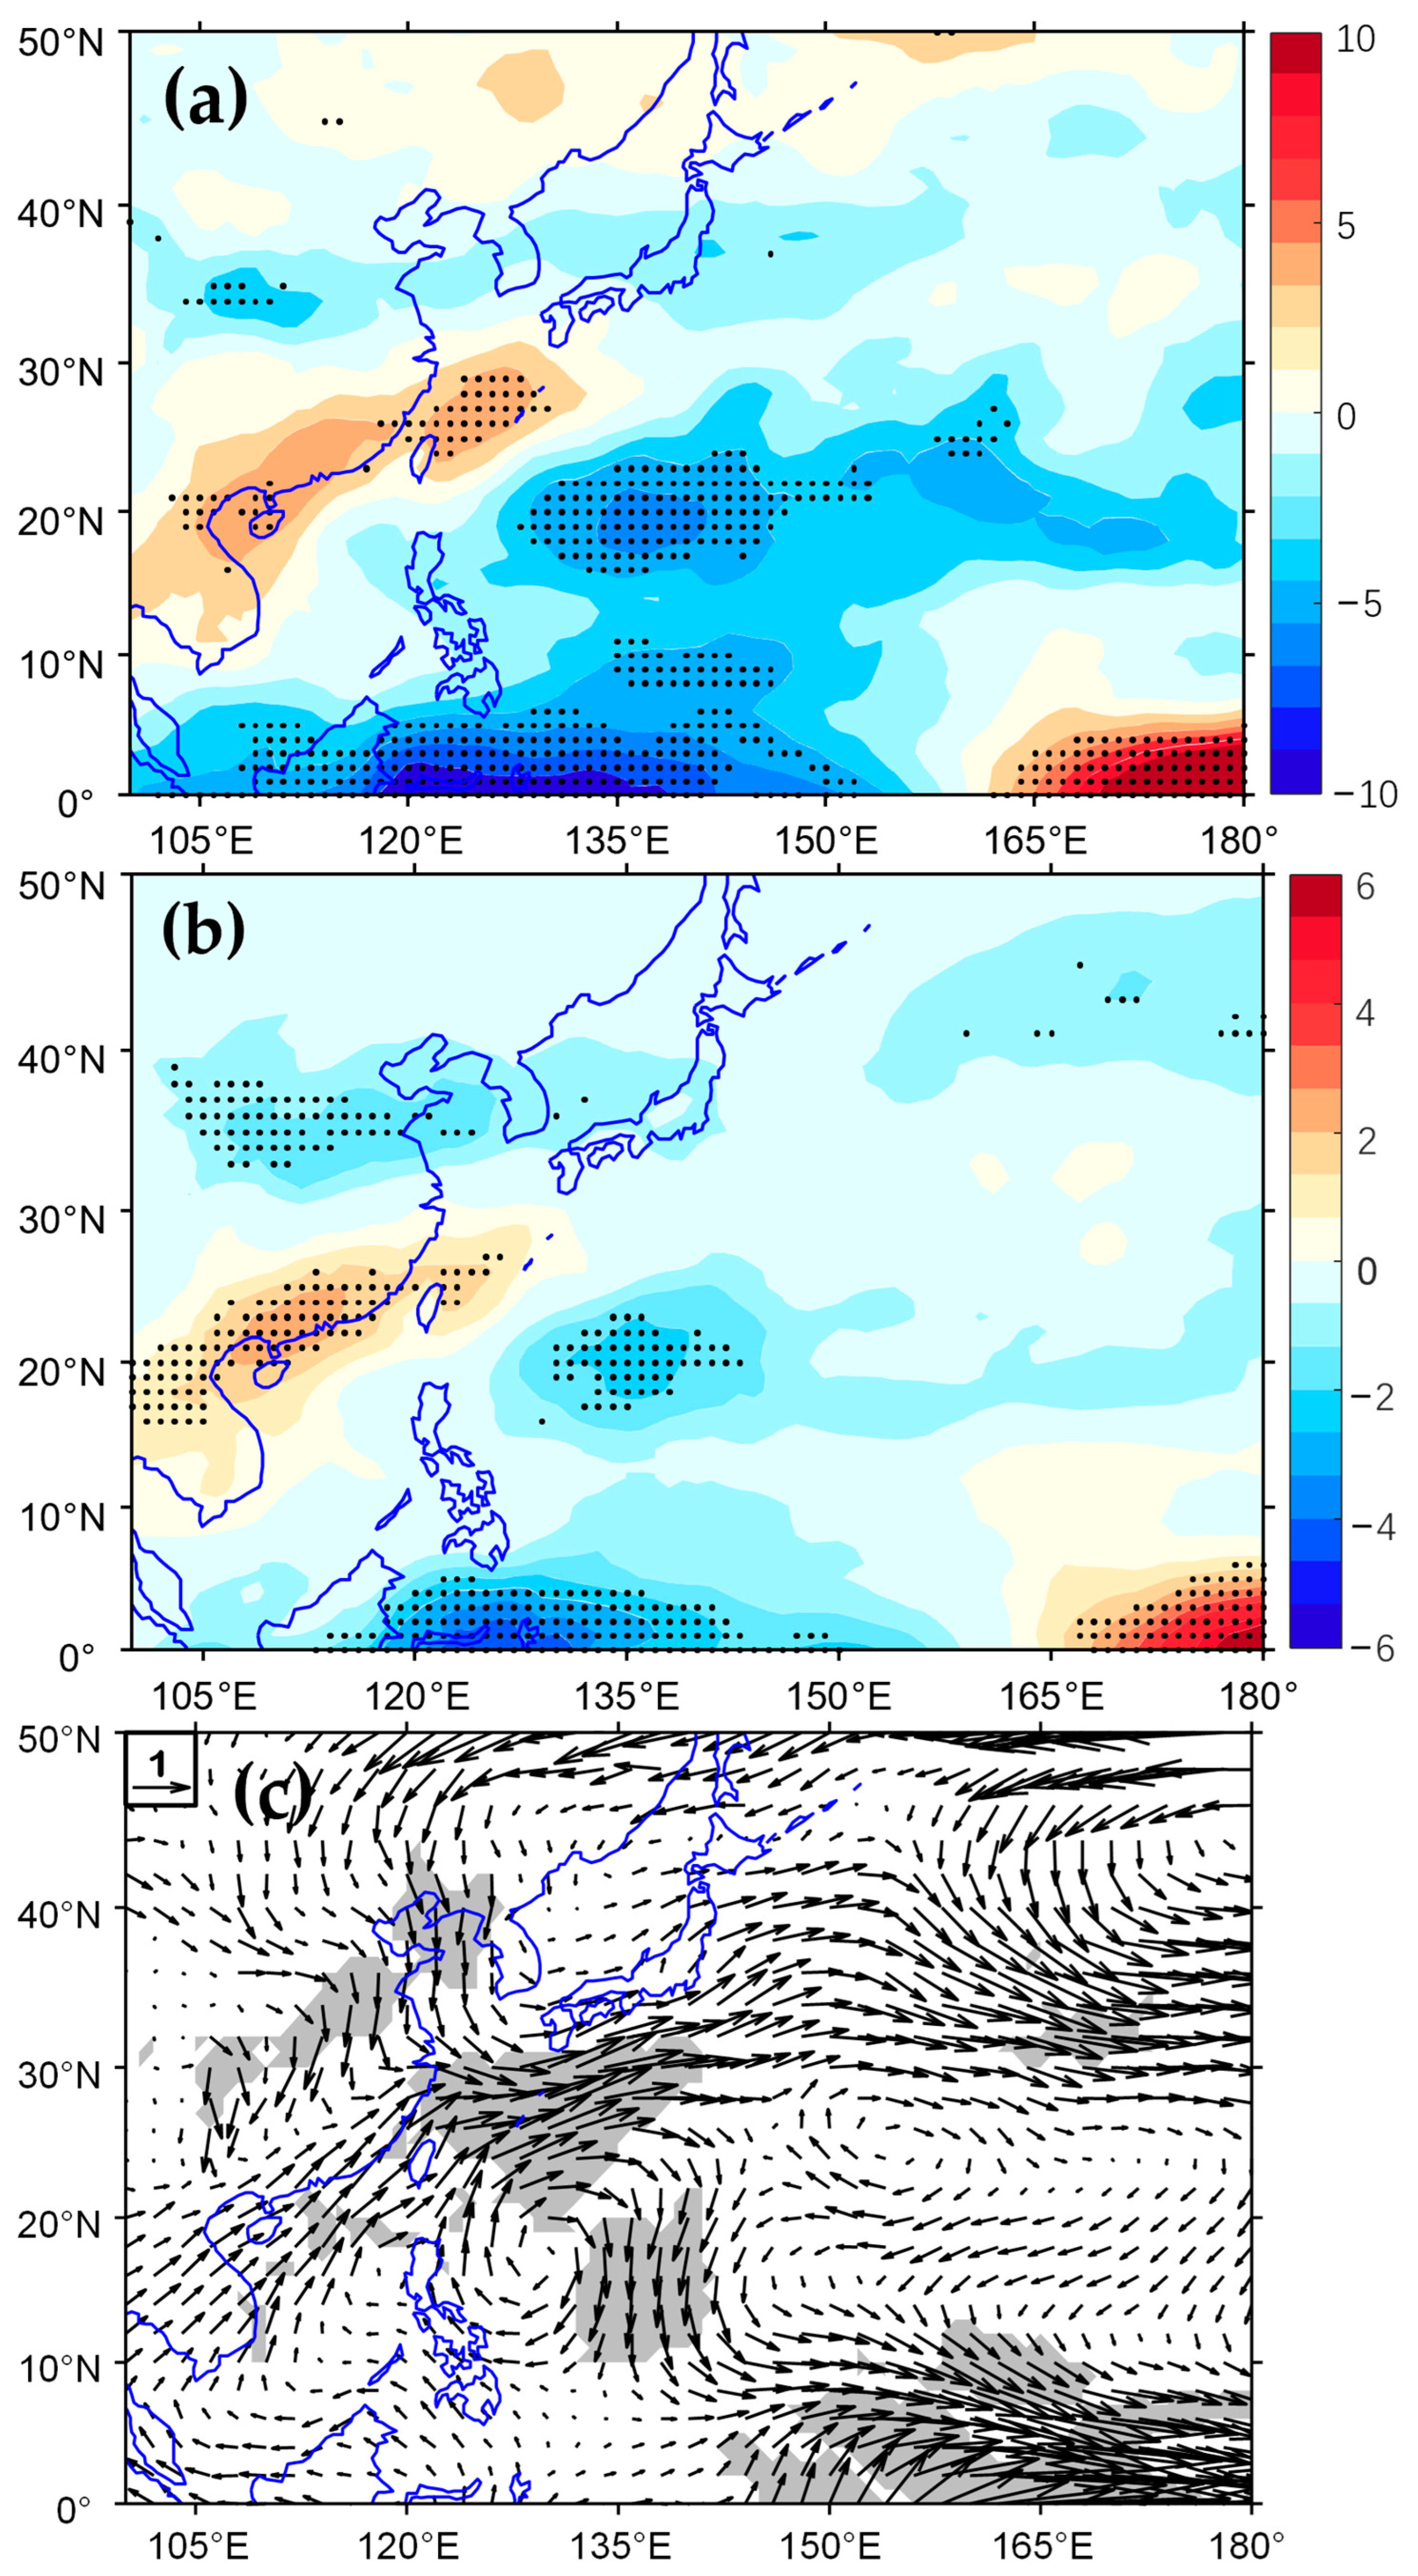
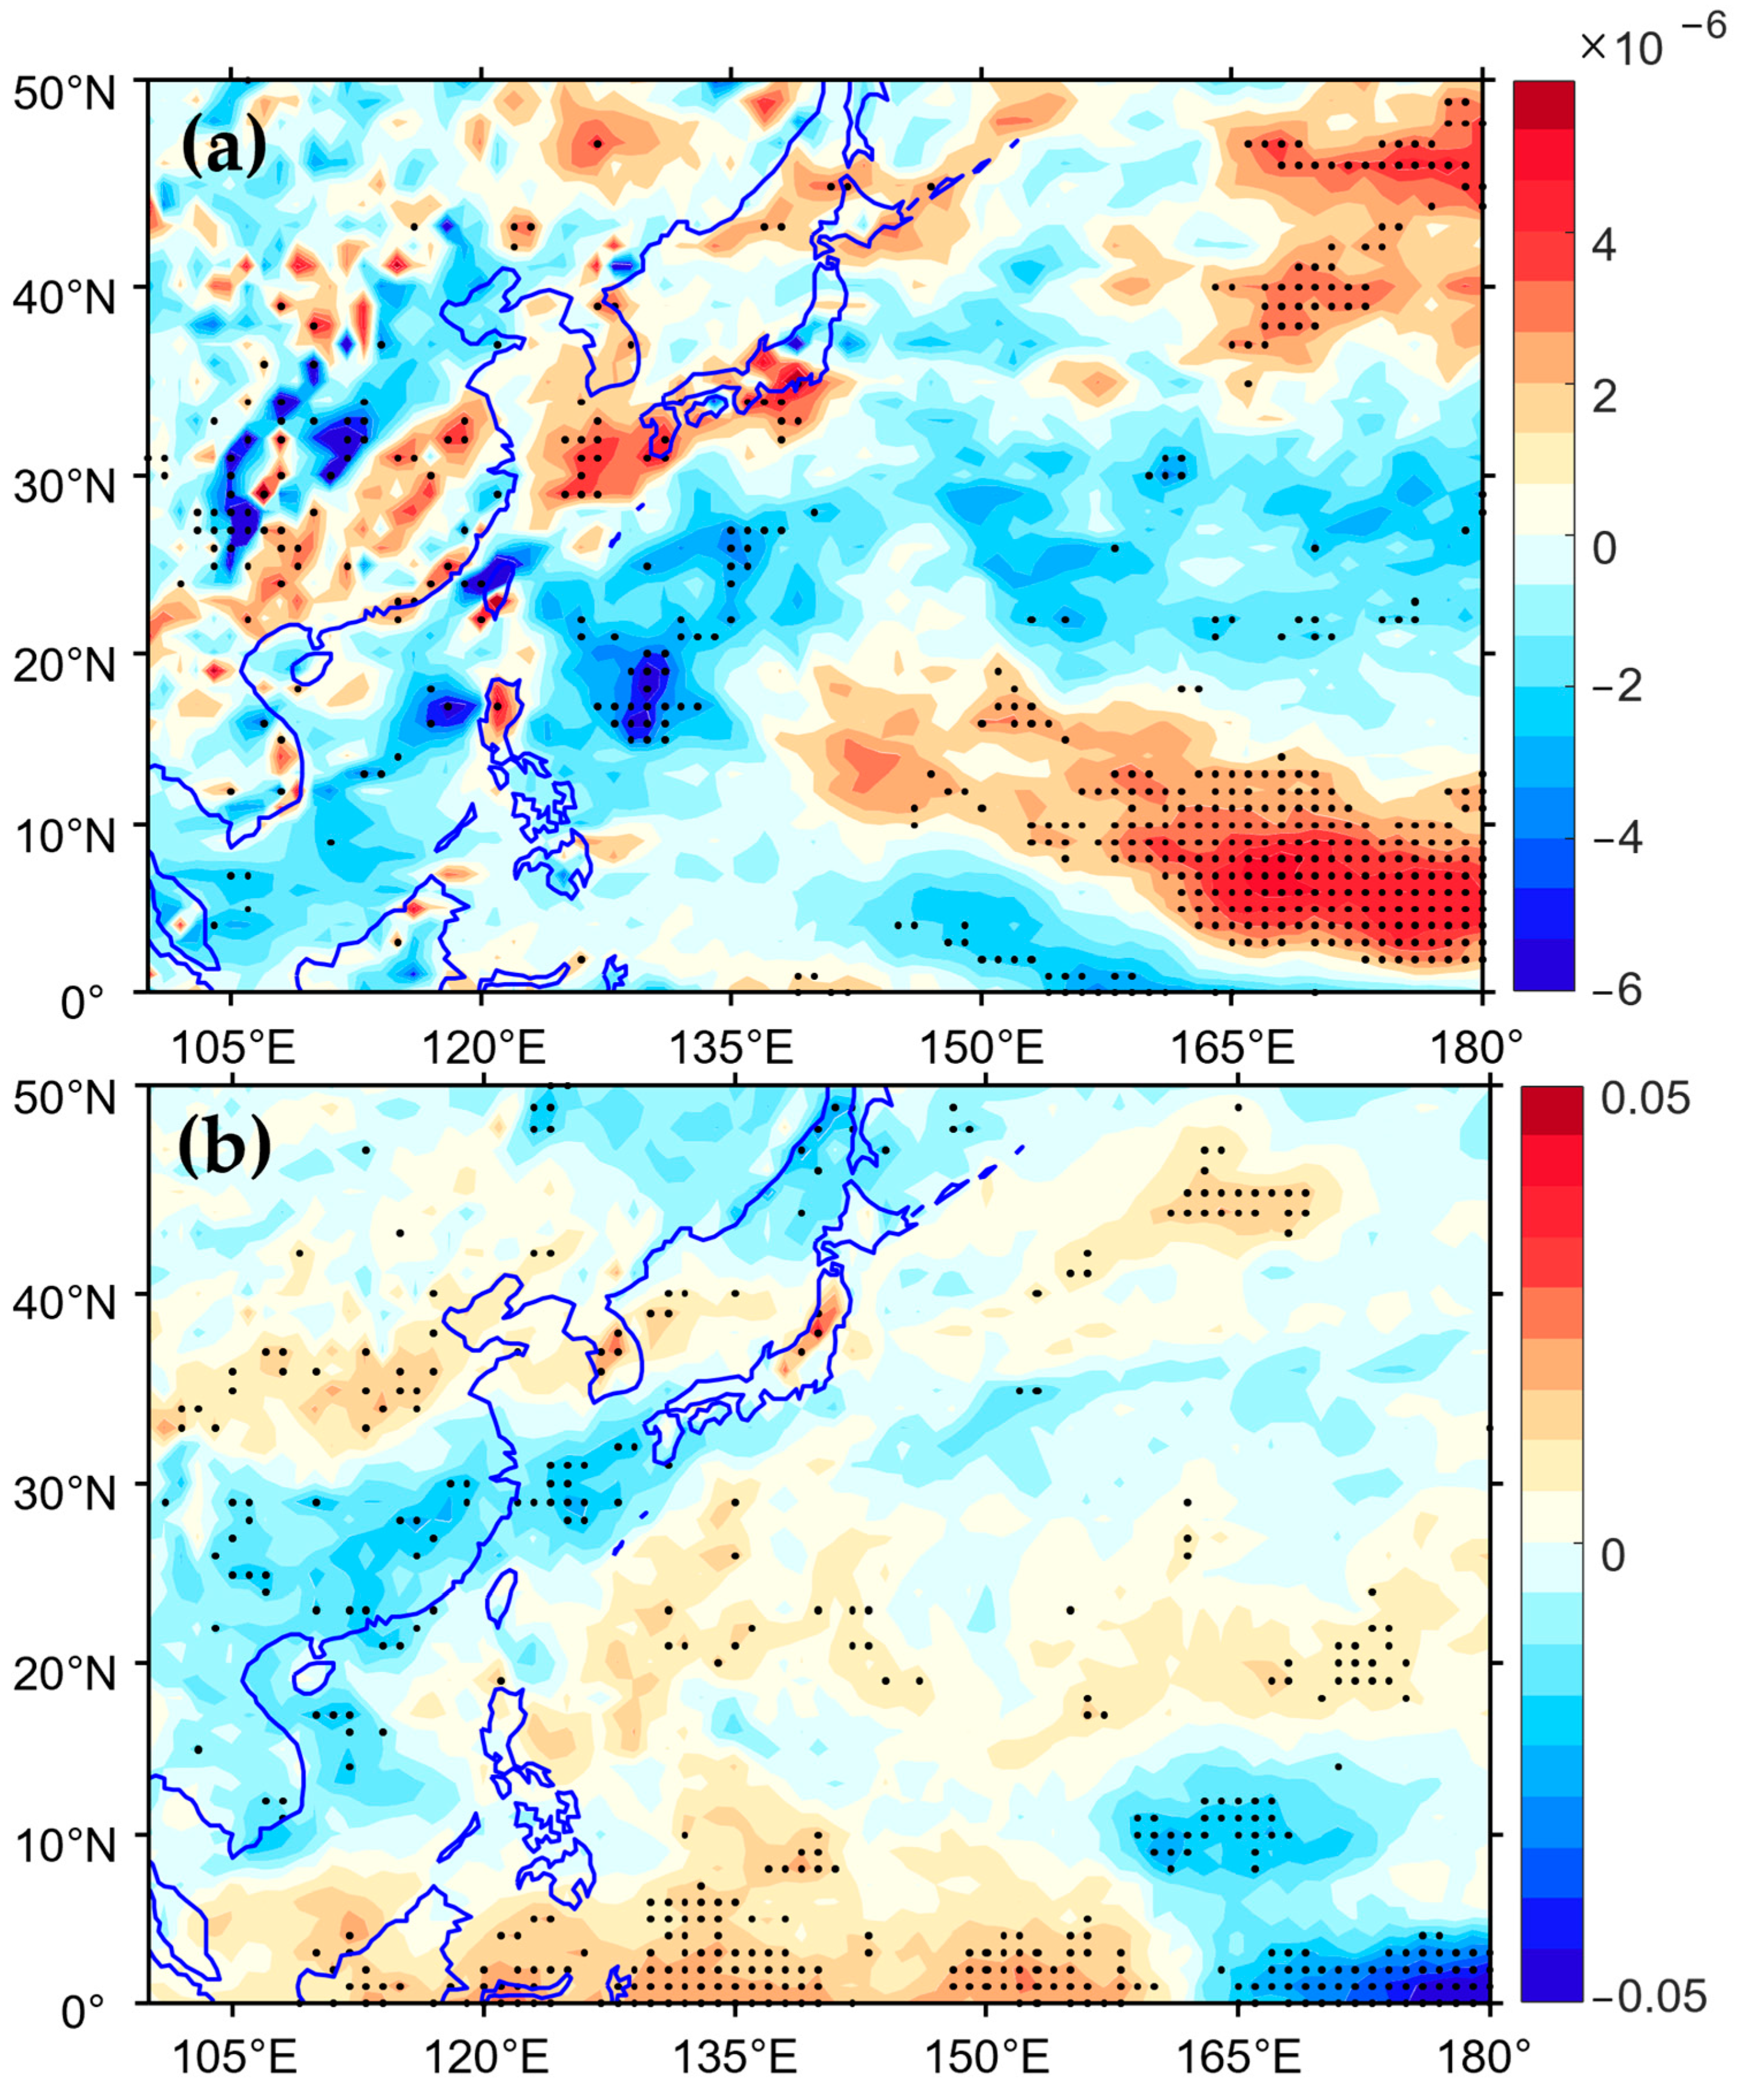
4. Mechanistic Analysis

In the previous section, we found that the average post-landfall intensity of landfalling TCs in China in the SP El Niño years was statistically significantly greater than that in the SU El Niño years. So, we then explored how the different onset times of El Niño events caused these significant differences in the average post-landfall intensity of TCs in China.
The post-landfall development of tropical cyclones can be influenced by thermodynamic and atmospheric dynamical factors [12]. Figure 6a,b display the differences in relative humidity at 600 hPa and TCWV during the typhoon season of the two types of El Niño years. Both of these factors showed significant positive differences between the main active regions after TCs made landfall. It is well known that atmospheric water vapor content is mainly concentrated in the lower and middle troposphere. High mid-level relative humidity is conducive to developing convective activity and releasing latent heat from condensation, which promotes the development of tropical cyclones [45]. In comparison to SU El Niño years, the higher mid-level relative humidities and the more abundant water vapor contents in the main active regions after landfalling TC activities supported the prolonged duration and intensity of TCs during SP El Niño years. Furthermore, the differences in horizontal wind at 850 hPa (Figure 6c) showed that there were significant anomalous southwesterly flows over the southeastern coast of China in SP El Niño years. These anomalous southwesterly flows favored the transportation of water vapor, thus providing a source of heat for the development of landfalling TCs.
In addition to the influence of thermodynamic factors, atmospheric dynamical factors also affect TC activities. Low-level relative vorticity and vertical velocity at 500 hPa are particularly important dynamical factors that affect TC activities. Greater low-level relative vorticities facilitate the low-level convergence and upward transportation of water vapor, thus promoting TC development. Figure 7a shows the differences in low-level relative vorticity between the typhoon season for the two types of El Niño years. It shows that there was a significant positive difference between low-level relative vorticities in the main TC activity regions after TCs made landfall, which contributed to the maintenance of TC intensity in SP El Niño years. Because of the increased low-level relative vorticities in the main TC activity areas after TCs landfall in SP El Niño years, the low-level convergence was enhanced, and there was a significant anomalous upward motion at 500 hPa (Figure 7b), which also facilitated the development of TCs.
In general, compared to SU El Niño years, the anomalous southwesterly flows at 850 hPa over the southeast coast of China in the SP El Niño year transported water vapor that contributed to the development of landfalling TCs. The thermodynamic factors (i.e., mid-level relative humidity and TCWV) and dynamical factors (i.e., low-level relative vorticity and vertical velocity at 500 hPa) in the main active regions after TCs made landfall were favorable for maintaining TC intensity and duration.

5. Conclusions

In this study, according to the definitions of Xu and Chan [27], Xu et al. [29], and Liang et al. [30], we identified eight SP El Niño events and eight SU El Niño events during the period of 1951–2017. Subsequently, we compared the characteristics of TCs that made landfall in China during the typhoon season of the SP and SU El Niño years and their possible impact mechanisms. Our main conclusions were as follows:
The average latitude of TCs that made landfall in China shifted significantly southward, and the average intensity was significantly stronger during the typhoon season of SP El Niño years relative to that of SU El Niño years. In SP El Niño years, TCs made landfall in China with stronger landfall intensity, but the average intensities of STS-level TCs and TY-level TCs were weaker than those in SU El Niño years. In addition, more STS-level TCs were generated in the SCS and made landfall in China during SP El Niño years. Furthermore, the landfalling TC parameters also differed in terms of the genesis region and landfall locations. It is noteworthy that in SP El Niño years, the landfall intensity and average post-landfall intensity of TCEC were weaker than those in SU El Niño years. In contrast, the intensity of TCSC was the opposite. TCEC also lasted significantly longer in SP El Niño years. The landfall intensity and average post-landfall intensity in SP El Niño years were greater than those in SU El Niño years, which meant that TCs in SP El Niño years had a greater potential to cause damage after making landfall in China. During SP El Niño years, the large-scale conditions over the southeast coast of China were more likely to include a moister mid-level relative humidity and TCWV, a stronger relative vorticity in the low-level troposphere, and a stronger vertical velocity at 500 hPa. These conditions were beneficial for maintaining TC intensity and post-landfall duration.
Overall, we concluded that more attention should be paid to TCs generated during SP El Niño events because of their higher landfall intensity, which makes them more likely to cause more destructive damage in China after they make landfall. As presented in the previous sections, TC activities could be predicted on a seasonal scale based on the onset time of an El Niño event. For example, since SP El Niño events occur earlier, they could be identified from the early stages of SST anomalies in the tropical Pacific. When an SP El Niño event occurs, it is likely that stronger and longer TCs will make landfall in China during the following typhoon season. Therefore, measures could be taken in advance by the relevant authorities to mitigate the adverse effects of TCs.

Author Contributions

Conceptualization, J.Y., S.T. and F.X.; methodology, J.Y. and S.Z. (Shaojing Zhang); software, J.Y., M.Z. and Y.L.; formal analysis, J.Y.; data curation, J.Y. and M.Z.; writing—original draft preparation, J.Y. and S.T.; writing—review and editing, J.Y., S.T., F.X. and L.H.; visualization, J.Y., S.Z. (Shihan Zhang) and Y.W. All authors have read and agreed to the published version of the manuscript.

Funding

This research was jointly funded by the Key Areas Research and Development Program Project of Guangdong Province (2020B0101130021), the National Key Research and Development Program Project of China (2018YFA0605604), and the National Natural Science Foundation of China (72293604, 42130605).

Institutional Review Board Statement

Not applicable.

Informed Consent Statement

Not applicable.

Data Availability Statement

In this study, the Extended Reconstructed SST version 4 (ERSST-v4) data were obtained from https://psl.noaa.gov/data/gridded/data.noaa.ersst.v4.html (accessed on 21 October 2022), the TC best track data were obtained from IBTrACS-JTWC (https://www.ncei.noaa.gov/products/international-best-track-archive, accessed on 21 October 2022), and the ECMWF ERA5 reanalysis data were downloaded from https://cds.climate.copernicus.eu/cdsapp#!/search?text=ERA5 (accessed on 21 October 2022).

Acknowledgments

The authors would like to thank the funding agencies and the NOAA and ECMWF for the availability of their original data used in this work.

Conflicts of Interest

The authors declare no conflict of interest.

References

  1. Amaya, D.J. The Pacific Meridional Mode and ENSO: A Review. Curr. Clim. Chang. Rep. 2019, 5, 296–307. [Google Scholar] [CrossRef]
  2. Lin, I.I.; Camargo, S.J.; Patricola, C.M.; Boucharel, J.; Chand, S.; Klotzbach, P.; Chan, J.C.L.; Wang, B.; Chang, P.; Li, T.; et al. ENSO and Tropical Cyclones. In El Niño Southern Oscillation in a Changing Climate; Geophysical Monograph Series; AGU: Washington, DC, USA, 2020; pp. 377–408. [Google Scholar]
  3. Li, R.C.; Zhou, W. Revisiting the intraseasonal, interannual and interdecadal variability of tropical cyclones in the western North Pacific. Atmos. Ocean. Sci. Lett. 2018, 11, 198–208. [Google Scholar] [CrossRef] [Green Version]
  4. Pu, X.; Chen, Q.; Zhong, Q.; Ding, R.; Liu, T. Influence of the North Pacific Victoria mode on western North Pacific tropical cyclone genesis. Clim. Dyn. 2018, 52, 245–256. [Google Scholar] [CrossRef]
  5. Xiao, F.; Xiao, Z. Characteristics of tropical cyclones in China and their impacts analysis. Nat. Hazards 2010, 54, 827–837. [Google Scholar]
  6. Welker, C.; Faust, E. Tropical cyclone-related socio-economic losses in the western North Pacific region. Nat. Hazards Earth Syst. Sci. 2013, 13, 115–124. [Google Scholar] [CrossRef]
  7. Klotzbach, P.J.; Bowen, S.G.; Pielke, R.; Bell, M. Continental US hurricane landfall frequency and associated damage: Observations and future risks. Bull. Am. Meteorol. Soc. 2018, 99, 1359–1376. [Google Scholar] [CrossRef]
  8. Wang, H.; Xu, M.; Onyejuruwa, A.; Wang, Y.; Wen, S.; Gao, A.E.; Li, Y. Tropical cyclone damages in Mainland China over 2005–2016: Losses analysis and implications. Environ. Dev. Sustain. 2019, 21, 3077–3092. [Google Scholar] [CrossRef]
  9. Chen, X.; Wu, L.; Zhang, J. Increasing duration of tropical cyclones over China. Geophys. Res. Lett. 2011, 38, L02708. [Google Scholar] [CrossRef]
  10. Zhang, W.; Leung, Y.; Wang, Y. Cluster analysis of post-landfall tracks of landfalling tropical cyclones over China. Clim. Dyn. 2013, 40, 1237–1255. [Google Scholar] [CrossRef]
  11. Li, R.C.Y.; Zhou, W.; Shun, C.M.; Lee, T.C. Change in Destructiveness of Landfalling Tropical Cyclones over China in Recent Decades. J. Clim. 2017, 30, 3367–3379. [Google Scholar] [CrossRef]
  12. Liu, L.; Wang, Y.; Zhan, R.; Xu, J.; Duan, Y. Increasing Destructive Potential of Landfalling Tropical Cyclones over China. J. Clim. 2020, 33, 3731–3743. [Google Scholar] [CrossRef]
  13. Wang, S.; Toumi, R. More tropical cyclones are striking coasts with major intensities at landfall. Sci. Rep. 2022, 12, 5236. [Google Scholar] [CrossRef]
  14. Li, G.; Li, Q.; Xu, Y.; Xu, P.; Wang, W.; Huang, D.; Wu, Y.; He, L. Changes of Tropical Cyclones Landfalling in China from 1979 to 2018. J. Geophys. Res. Atmos. 2022, 127, e2022JD036701. [Google Scholar] [CrossRef]
  15. Mei, W.; Xie, S. Intensification of landfalling typhoons over the northwest Pacific since the late 1970s. Nat. Geosci. 2016, 9, 753–757. [Google Scholar] [CrossRef]
  16. Bjerknes, J. Atmospheric teleconnection from the tropical Pacific. Mon. Weather. Rev. 1969, 97, 103–172. [Google Scholar] [CrossRef]
  17. Chan, J.C. Tropical cyclone activity over the western North Pacific associated with El Niño and La Niña events. J. Clim. 2000, 13, 2960–2972. [Google Scholar] [CrossRef]
  18. Camargo, S.J.; Sobel, A.H. Western North Pacific tropical cyclone intensity and ENSO. J. Clim. 2005, 18, 2996–3006. [Google Scholar] [CrossRef]
  19. Curry, J.A.; Webster, P.J.; Kim, H.-M. Modulation of North Pacific Tropical Cyclone Activity by Three Phases of ENSO. J. Clim. 2011, 24, 1839–1849. [Google Scholar]
  20. Wang, C.; Li, C.; Mu, M.; Duan, W. Seasonal modulations of different impacts of two types of ENSO events on tropical cyclone activity in the western North Pacific. Clim. Dyn. 2012, 40, 2887–2902. [Google Scholar] [CrossRef]
  21. Tu, S.; Xu, J.; Xu, F.; Liang, M.; Ji, Q.; Chen, S. Differences in the destructiveness of tropical cyclones over the western North Pacific between slow- and rapid-transforming El Niño years. Environ. Res. Lett. 2020, 15, 024014. [Google Scholar] [CrossRef]
  22. Wu, M.; Chang, W.; Leung, W. Impacts of El Niño–Southern Oscillation events on tropical cyclone landfalling activity in the western North Pacific. J. Clim. 2004, 17, 1419–1428. [Google Scholar] [CrossRef]
  23. Fudeyasu, H.; Iizuka, S.; Matsuura, T. Impact of ENSO on landfall characteristics of tropical cyclones over the western North Pacific during the summer monsoon season. Geophys. Res. Lett. 2006, 33, L21815. [Google Scholar] [CrossRef]
  24. Zhang, W.; Graf, H.F.; Leung, Y.; Herzog, M. Different El Niño Types and Tropical Cyclone Landfall in East Asia. J. Clim. 2012, 25, 6510–6523. [Google Scholar] [CrossRef]
  25. Liu, L. Impact of Different Types of ENSO Years on Intensity Changes of Landfalling Tropical Cyclones over China. Atmosphere 2019, 10, 161. [Google Scholar] [CrossRef] [Green Version]
  26. Zhao, H.; Wang, C. On the relationship between ENSO and tropical cyclones in the western North Pacific during the boreal summer. Clim. Dyn. 2018, 52, 275–288. [Google Scholar] [CrossRef] [Green Version]
  27. Xu, J.; Chan, J.C.L. The Role of the Asian–Australian Monsoon System in the Onset Time of El Niño Events. J. Clim. 2001, 14, 418–433. [Google Scholar] [CrossRef]
  28. Horii, T.; Hanawa, K. A relationship between timing of El Niño onset and subsequent evolution. Geophys. Res. Lett. 2004, 31, L06304. [Google Scholar] [CrossRef]
  29. Xu, H.; Xu, J.; Liu, C.; Ou, N. Distinguishing Characteristics of Spring and Summer Onset El Niño Events. J. Clim. 2020, 33, 4579–4597. [Google Scholar] [CrossRef] [Green Version]
  30. Liang, M.; Xu, J.; Chan, J.C.L.; Liu, C.; Xu, H. How does the onset time of El Niño events affect tropical cyclone genesis and intensity over the western North Pacific? Int. J. Climatol. 2021, 42, 1–16. [Google Scholar] [CrossRef]
  31. Zhang, Q.; Wu, L.; Liu, Q. Tropical cyclone damages in China 1983–2006. Bull. Am. Meteorol. Soc. 2009, 90, 489–496. [Google Scholar] [CrossRef] [Green Version]
  32. Lu, X.; Zhao, B. Analysis of the climatic characteristics of landing tropical cyclones in East China. J. Trop. Meteorol. 2013, 19, 145. [Google Scholar]
  33. Liu, K.S.; Chan, J.C.L. Climatological characteristics and seasonal forecasting of tropical cyclones making landfall along the South China coast. Mon. Weather. Rev. 2003, 131, 1650–1662. [Google Scholar] [CrossRef]
  34. Zhang, H.; Guan, Y. Impacts of four types of ENSO events on tropical cyclones making landfall over mainland china based on three best-track datasets. Adv. Atmos. Sci. 2013, 31, 154–164. [Google Scholar] [CrossRef]
  35. Chen, J.; Tan, P.; Wu, L.; Liu, J.; Chen, H. Climatological analysis of passage-type tropical cyclones from the Western North Pacific into the South China Sea. Terr. Atmos. Ocean. Sci. 2017, 28, 327–343. [Google Scholar] [CrossRef] [Green Version]
  36. Zhan, R.; Wang, Y.; Ding, Y. Impact of the Western Pacific Tropical Easterly Jet on Tropical Cyclone Genesis Frequency over the Western North Pacific. Adv. Atmos. Sci. 2022, 39, 235–248. [Google Scholar] [CrossRef]
  37. Chu, P.-S. Large-scale circulation features associated with decadal variations of tropical cyclone activity over the central North Pacific. J. Clim. 2002, 15, 2678–2689. [Google Scholar] [CrossRef]
  38. Hsu, P.-C.; Chu, P.-S.; Murakami, H.; Zhao, X. An abrupt decrease in the late-season typhoon activity over the western North Pacific. J. Clim. 2014, 27, 4296–4312. [Google Scholar] [CrossRef]
  39. Cao, X.; Liu, Y.; Wu, R.; Bi, M.; Dai, Y.; Cai, Z. Northwestwards shift of tropical cyclone genesis position during autumn over the western North Pacific after the late 1990s. Int. J. Climatol. 2020, 40, 1885–1899. [Google Scholar] [CrossRef]
  40. Yang, Y.T.; Kuo, H.C.; Tsujino, S.; Chen, B.F.; Peng, M.S. Characteristics of the Long-Lived Concentric Eyewalls in Tropical Cyclones. J. Geophys. Res. Atmos. 2021, 126, e2020JD033703. [Google Scholar] [CrossRef]
  41. Dare, R.A.; Davidson, N.E. Characteristics of tropical cyclones in the Australian region. Mon. Weather. Rev. 2004, 132, 3049–3065. [Google Scholar] [CrossRef]
  42. Wang, J.; Qian, W. Statistic analysis of tropical cyclone impact on the China mainland during the last half century. Chin. J. Geophys. 2005, 48, 1069–1077. [Google Scholar] [CrossRef]
  43. Huang, X.; He, L.; Zhao, H.; Huang, Y. Characteristics of tropical cyclones generated in South China Sea and their landfalls over China and Vietnam. Nat. Hazards 2017, 88, 1043–1057. [Google Scholar]
  44. Liu, K.S.; Chan, J.C.L. Recent increase in extreme intensity of tropical cyclones making landfall in South China. Clim. Dyn. 2020, 55, 1059–1074. [Google Scholar] [CrossRef]
  45. Gray, W.M. Tropical Cyclone Genesis; Colorado State University Libraries: Fort Collins, CO, USA, 1975; Volume 234, pp. 53–56. [Google Scholar]
Figure 1. The Niño3.4 indices from the developing year to the decaying year of (a) SP El Niño events and (b) SU El Niño events. The El Niño developing and decaying years are denoted by year (0) and year (+1), respectively.
Atmosphere 14 00628 g001
Figure 2. The best track data for the different classifications of TCs making landfall in China during SP (a) and SU (b) El Niño years.
Atmosphere 14 00628 g002
Figure 3. The genesis positions of the different classifications of landfalling TCs in China during SP (a) and SU (b) El Niño years. The different symbols denote the genesis positions of TD+TS (triangle), STS (diamond), and TY (dots). The gray symbols indicate the mean TC genesis positions between 1951 and 2017 with regard to the TC categories.
Atmosphere 14 00628 g003
Figure 4. The best track data for landfalling TCs with different genesis locations (i.e., (a,c) the SCS and (b,d) WNP) in SP and SU El Niño years. The black dots denote the genesis positions.
Atmosphere 14 00628 g004
Figure 5. Same as Figure 4, but for TCs with different landfall locations ((a,c) EC and (b,d) SC).
Atmosphere 14 00628 g005
Figure 6. The differences (SP minus SU) in the (a) relative humidity at 600 hPa (unit: %), (b) TCWV (unit: kg·m−2), and (c) horizontal wind (unit: m·s−1) at 850 hPa during the typhoon season of SP and SU El Niño years. The (a,b) dots and (c) shaded areas mark the areas that were statistically significant at the 95% confidence level.
Atmosphere 14 00628 g006
Figure 7. The differences (SP minus SU) in the (a) relative vorticity at 850 hPa (unit: 10−6 s−1), and (b) vertical velocity at 500 hPa (unit: Pa·s−1) during the typhoon season of SP and SU El Niño years. The dots mark the areas that were statistically significant at the 95% confidence level.
Atmosphere 14 00628 g007
Table 1. The differences between the TC parameters of landfalling TCs in China during the typhoon season of SP and SU El Niño years. The total represents the entire track of each TC, and post-landfall represents the post-landfall track of each TC. The differences (sixth column) were the rates of change in SP El Niño years relative to SU El Niño years. A * indicates statistical significance at the 95% confidence level, based on the Wilcoxon–Mann–Whitney test. The p-value is the statistical significance of the last column.
TC ParameterClimSPSUDiff
(%)
p-Value
TC count4534752--
TotalGenesis Lon (° E)133.05133.01133.72−0.50.69
Genesis Lat (° N)14.6713.7015.12−9.40.21
Lon (° E)124.65124.74125.29−0.40.10
Lat (° N)19.2519.2319.73−2.5 *<0.01
Intensity (kt)54.4255.5351.657.5 *<0.01
Duration (days)6.888.007.0513.50.29
Post-LandfallLon (° E)115.20115.90113.662.0 *<0.01
Lat (° N)24.6625.5823.648.2 *<0.01
Intensity (kt)41.6840.2635.5413.3 *<0.01
Landfall Intensity (kt)58.5362.7952.9918.5 *0.03
Duration (days)1.471.771.5613.00.43
Table 2. The TC parameters of the different classifications of TCs making landfall in China during SP and SU El Niño years. The differences (sixth column) were the rates of change in SP El Niño years relative to SU El Niño years. A * indicates statistical significance at the 95% confidence level, based on the Wilcoxon–Mann–Whitney test. The p-value is the statistical significance of the last column.
TC ParameterTC ClassificationClimSPSUDiff
(%)
p-Value
TC CountTD+TS1761325--
STS1091313--
TY1682114--
Lon (° E)TD+TS122.35121.97120.461.3 *<0.01
STS124.40120.24124.72−3.6 *<0.01
TY126.54128.22131.64−2.6 *<0.01
Lat (° N)TD+TS19.4820.5218.918.5 *<0.01
STS19.0917.6420.82−15.3 *<0.01
TY19.1719.2419.81−2.9 *<0.01
Intensity (kt)TD+TS44.0343.4340.966.0 *0.02
STS49.8845.3747.33−4.10.38
TY64.9466.5068.23−2.50.34
Duration (days)TD+TS5.777.825.8533.70.36
STS7.056.477.71−16.10.52
TY7.949.078.595.60.84
Table 3. The TC parameters of landfalling TCs with different genesis locations (i.e., the SCS and WNP) in SP and SU El Niño years. The total represents the entire track of each TC, and post-landfall represents the post-landfall track of each TC. The differences (Diff) were the rates of change in SP El Niño years relative to SU El Niño years. A * indicates statistical significance at the 95% confidence level, based on the Wilcoxon–Mann–Whitney test. The p-value is the statistical significance of the differences (Diff).
TC ParameterSCSWNP
SPSUDiff
(%)
p-ValueSPSUDiff
(%)
p-Value
TC Count1312--3440--
Genesis Lon (° E)115.60116.04−0.40.64139.67139.030.50.94
Genesis Lat (° N)16.6916.93−1.40.8112.5514.58−14.00.13
TotalLon (° E)114.30113.091.1 *0.02127.03128.09−0.8 *<0.01
Lat (° N)19.8619.163.70.6319.0919.86−3.9 *<0.01
Intensity (kt)35.8132.2810.9 *<0.0159.8656.096.7 *<0.01
Duration (days)5.205.70−8.80.769.077.4621.60.08
Post-LandfallLon (° E)114.99110.254.3 *<0.01116.26115.280.90.63
Lat (° N)23.7120.7814.1 *<0.0126.3424.995.40.15
Intensity (kt)36.1126.4536.5 *<0.0141.9439.855.20.44
Landfall Intensity (kt)50.5434.7545.4 *0.0167.4758.4815.40.08
Duration (days)1.842.18−15.60.551.741.3826.10.61
Table 4. Same as Table 3, but for TCs with different landfall locations (i.e., EC and SC).
TC ParameterECSC
SPSUDiff
(%)
p-ValueSPSUDiff
(%)
p-Value
TC Count610--4142--
Genesis Lon (° E)147.77143.293.10.43130.85131.44−0.40.82
Genesis Lat (° N)12.0714.87−18.80.6213.9415.18−8.20.24
TotalLon (° E)132.36131.350.80.95122.61123.41−0.60.87
Lat (° N)22.6722.301.70.9418.2618.92−3.5 *<0.01
Intensity (kt)63.5563.81−0.40.8353.2947.8611.3 *<0.01
Duration (days)13.718.7057.60.117.176.667.70.33
Post-landfallLon (° E)118.54118.81−0.2 *0.03115.36112.922.2 *<0.01
Lat (° N)34.6629.3318.2 *<0.0123.7422.824.0 *<0.01
Intensity (kt)25.1146.89−46.4 *<0.0143.3433.9027.8 *<0.01
Landfall Intensity (kt)49.0067.90−27.80.2364.8049.4531.0 *<0.01
Duration (days)2.331.03126.2 *<0.011.681.69−0.60.78
Disclaimer/Publisher’s Note: The statements, opinions and data contained in all publications are solely those of the individual author(s) and contributor(s) and not of MDPI and/or the editor(s). MDPI and/or the editor(s) disclaim responsibility for any injury to people or property resulting from any ideas, methods, instructions or products referred to in the content.

