Article

Evaluating CMIP6 Historical Mean Precipitation over Africa and the Arabian Peninsula against Satellite-Based Observation

by
Isaac Kwesi Nooni
1,
Faustin Katchele Ogou
2,
Abdoul Aziz Saidou Chaibou
3,
Francis Mawuli Nakoty
4,
Gnim Tchalim Gnitou
5 and
Jiao Lu
1,*
1
School of Atmospheric Science and Remote Sensing, Wuxi University, Wuxi 214105, China
2
Laboratory of Atmospheric Physics, Department of Physics, University of Abomey-Calavi, Cotonou 01 BP 526, Benin
3
Département de Physique, Faculté des Sciences et Techniques, Université Abdou Moumouni, Niamey BP 10662, Niger
4
School of Electronic and Information Engineering, Nanjing University of Information Science and Technology, Nanjing 210044, China
5
College of Hydrology and Water Resources, Hohai University, Nanjing 210098, China
*
Author to whom correspondence should be addressed.
Atmosphere 2023, 14(3), 607; https://doi.org/10.3390/atmos14030607
Submission received: 28 February 2023 / Revised: 13 March 2023 / Accepted: 18 March 2023 / Published: 22 March 2023
(This article belongs to the Special Issue Precipitation in Africa)

Abstract

:
This study evaluated the historical precipitation simulations of 49 global climate models (GCMs) of the Coupled Model Intercomparison Project Phase 6 (CMIP6) in reproducing annual and seasonal precipitation climatology, linear trends, and their spatial correlation with global SST across Africa and the Arabian Peninsula during the period of 1980–2014, using Global Precipitation Climatology Centre (GPCP) data as a reference. Taylor’s diagram was used to quantify the strengths and weaknesses of the models in simulating precipitation. The CMIP6 multi-mean ensemble (MME) and the majority of the GCMs replicated the dominant features of the spatial and temporal variations reasonably well. The CMIP6 MME outperformed the majority of the individual models. The spatial variation of the CMIP6 MME closely matched the observation. The results showed that at annual and seasonal scales, the GPCP and CMIP6 MME reproduced a coherent spatial pattern in terms of the magnitude of precipitation. The humid region received >300 mm and the arid region received <50 mm across Africa and the Arabian Peninsula. The models from the same modeling centers replicated the precipitation levels across different seasons and regions. The CMIP6 MME and the majority of the individual models overestimate (underestimate) in humid (arid and semi-arid)-climate zones. The annual and pre-monsoon seasons (i.e., DJFMA) were better replicated in the CMIP6 GCMs than in the monsoon-precipitation model (MJJASON). The CMIP6 MME (GPCP) showed stronger wetting (drying) trends in the northern hemisphere. In contrast, a strong drying trend in the CMIP6 MME and a weak wetting trend in the GPCP were shown in the Southern Hemisphere. The CMIP6 MME captures the spatial pattern of linear trends better than individual models across different climate zones and regions. The relationship between precipitation and sea-surface temperature (SST) exhibited a high spatial correlation (−0.80 and 0.80) with large variability across different regions and climate zones. The GPCP (CMIP6 MME) exhibited a heterogenous (homogeneous) spatial pattern, with higher correlation coefficients recorded in the CMIP6 MME than in the GPCP in all cases. Individual models from the same modeling centers showed spatial homogeneity in correlation values. The differences exhibited by the individual GCMs highlight the significance of each model’s unique dynamics and physics; however, model selection should be considered for specific applications.

1. Introduction

Under a warming climate, changes in precipitation (PREC) distribution and timing pose significant challenges to the survival of humans, flora, and fauna [1]. For this reason, accurate knowledge of the amount and timing is critically important, particularly across regional water basins experiencing water scarcity [2]. Thus, measuring and monitoring this essential climate variable is of significant interest for many sectors of our society (agriculture, drinking-water supply, energy production, eco-hydrology, etc.) [3].
Traditionally, the use of rain gauges is a direct and the most accurate form of measuring PREC, but consistent records are lacking in many global regions [4]. The availability of satellites covering nearly all of the Earth’s land surface makes it easier to estimate PREC indirectly [4].
Recently, precipitation estimates from satellite-based systems have become alternatives rather than substitutes. The availability of data-driven models makes it possible to merge different data sources or inputs (e.g., satellite measurement and in situ observations) to generate high-resolution products at global coverage and longer time scales. One typical product is the Global Precipitation Climatology Project (GPCP). Readers are directed to [5] for details. Furthermore, another indirect method is simulating PREC from either model reanalysis or global climate model (GCM) output archived in the Coupled Model Intercomparison Project Phase [6,7]. The latter features significant contributions from many climate-modeling centers [7]. The latest version to have been released is the CMIP Phase 6 (CMIP6), and over 50 models have been released [7].
Historical GCM simulations serve as benchmarks of model performance, and they are usually validated against observed data to determine their reliability in reproducing climate variables of interest (e.g., PREC) [8]. Since the release of CMIP6, many studies have comprehensively evaluated precipitation across different regions of the globe [9].
These studies have reported that the simulated precipitation from CMIP6 performs comparably to observed data or even better than its predecessors [7,8]. Regional variability has become a special focus of the scientific community. The African continent is of particular interest due to its unique size, location, and complex and diverse climate in the Northern and Southern Hemispheres.
In the context of the African continent, previous studies have conducted sub-regional evaluations to judge the reliability of the CMIP6 in reproducing historical-precipitation simulations. For example, Amalzouri et al. [10] evaluated 27 CMIP6 GCMs and ensembles using the Climatic Research Unit (CRU) as observed data over Africa and found that the CMIP6 model ensemble reasonably replicated the historical precipitation, despite considerable regional differences across the continent [10]. Lim Kim Sian et al. [11] compared the mean precipitation from 23 GCMs using CMIP6 models with Global Precipitation Climatology Centre (GPCC) observations in the southern African subcontinent. Babaousmail et al. [12] compared the mean precipitation from 15 CMIP6 models using CRU and GPCC observations in the Northern Africa region. Faye et al. [13] compared extreme precipitation for an ensemble mean of 27 CMIP6 models with GPCP and Tropical Rainfall Measuring Mission Multi-satellite Precipitation Analysis 3B42 (TRMM) from 1997–2014 in West Africa. In addition, Ajibola et al. [14] compared the mean precipitation from seven (7) High-Resolution Model Intercomparison Project (HighResMIP) simulations of CMIP6 with CRU, GPCC, and University of Delaware (UDEL) v5.01 during 1950–2014 in West Africa. Akinsanola et al. [15] compared the mean precipitation from 16 CMIP6 models with GPCP and TRMM observations in East Africa. Furthermore, Ayugi et al. [16] analyzed projected precipitation extremes over Eastern Africa using 15 CMIP6 models. In summary, all these studies generally indicated that the CMIP6 model ensemble can reproduce historical simulations of mean or extreme precipitation, despite the varied performance among these studies, which may be attributed to the number of models used. It is still inconclusive whether the models used offer a constrained understanding of the precipitation variability across Africa, since the number of CMIP6 models used in previous studies in the region is less than 30. However, a comprehensive study on mean-precipitation-based large CMIP6 models (i.e., 49 models) that do not examine the seasonality, trends, and large-scale impacts in the region to provide additional information on the spatiotemporal variability of simulated PREC is lacking. In particular, it is unknown how the CMIP6 ensemble of 49 models would explain the seasonality, the magnitude and direction of trends, and the changes to mean precipitation due to sea-surface temperatures (SSTs) in a given region. To address this knowledge gap, we compared the mean precipitation in historical simulations of 49 GCMs of CMIP6 and the MME in reproducing annual and seasonal precipitation climatology, linear trends, and their spatial correlation with global SSTs across Africa and the Arabian Peninsula during the period 1of 980–2014, using GPCP as reference data.
First, 49 CMIP6 models and the MME were evaluated to determine their ability to reproduce mean precipitation with GPCP observations from 1980 to 2014. This study argues that extending the CMIP6 model’s ensemble size to >30 can help to understand the characteristics of mean precipitation over Africa. Furthermore, the long-term trends are considered from the African perspective, as the continent’s agricultural production system wholly or partially depends on the correct amount and timing of PREC. In addition, recent studies have shown a strong association between precipitation variability and large-scale circulations [17]. The unique geographic location of Africa, which meets both the Indian and Atlantic Oceans, means these teleconnections may significantly alter the redistribution of mean precipitation over Africa [17]. The long-term trends in the annual and seasonal variation of mean rainfall with teleconnections are investigated.
Lastly, due to changing climatic and socio-economic scenarios, water demand is increasing due to increased population and agricultural requirements. However, the African region is still significantly under-represented in terms of research output compared to other global regions [18,19,20,21]. The latest IPCC-assessment reports (AR6) advocated more impact-vulnerability assessments. This study aims to contribute to the body of research on the region’s mean precipitation. Specifically, we (1) statistically assessed the strength of 49 CMIP6 GCMs and their ensemble (MME) relative to satellite-based observation, (2) analyzed the precipitation climatology at annual and seasonal scales, (3) investigated the linear trends of the precipitation at annual and seasonal scales, and (4) determined the relationship between precipitation and global sea-surface temperature from 1980 to 2014.
The remainder of the paper is organized as follows: Section 2 describes the satellite datasets, CMIP6 models and the methods. Section 3 describes the results and presents the discussion. A summary and conclusions are presented in Section 4.

2. Materials and Methods
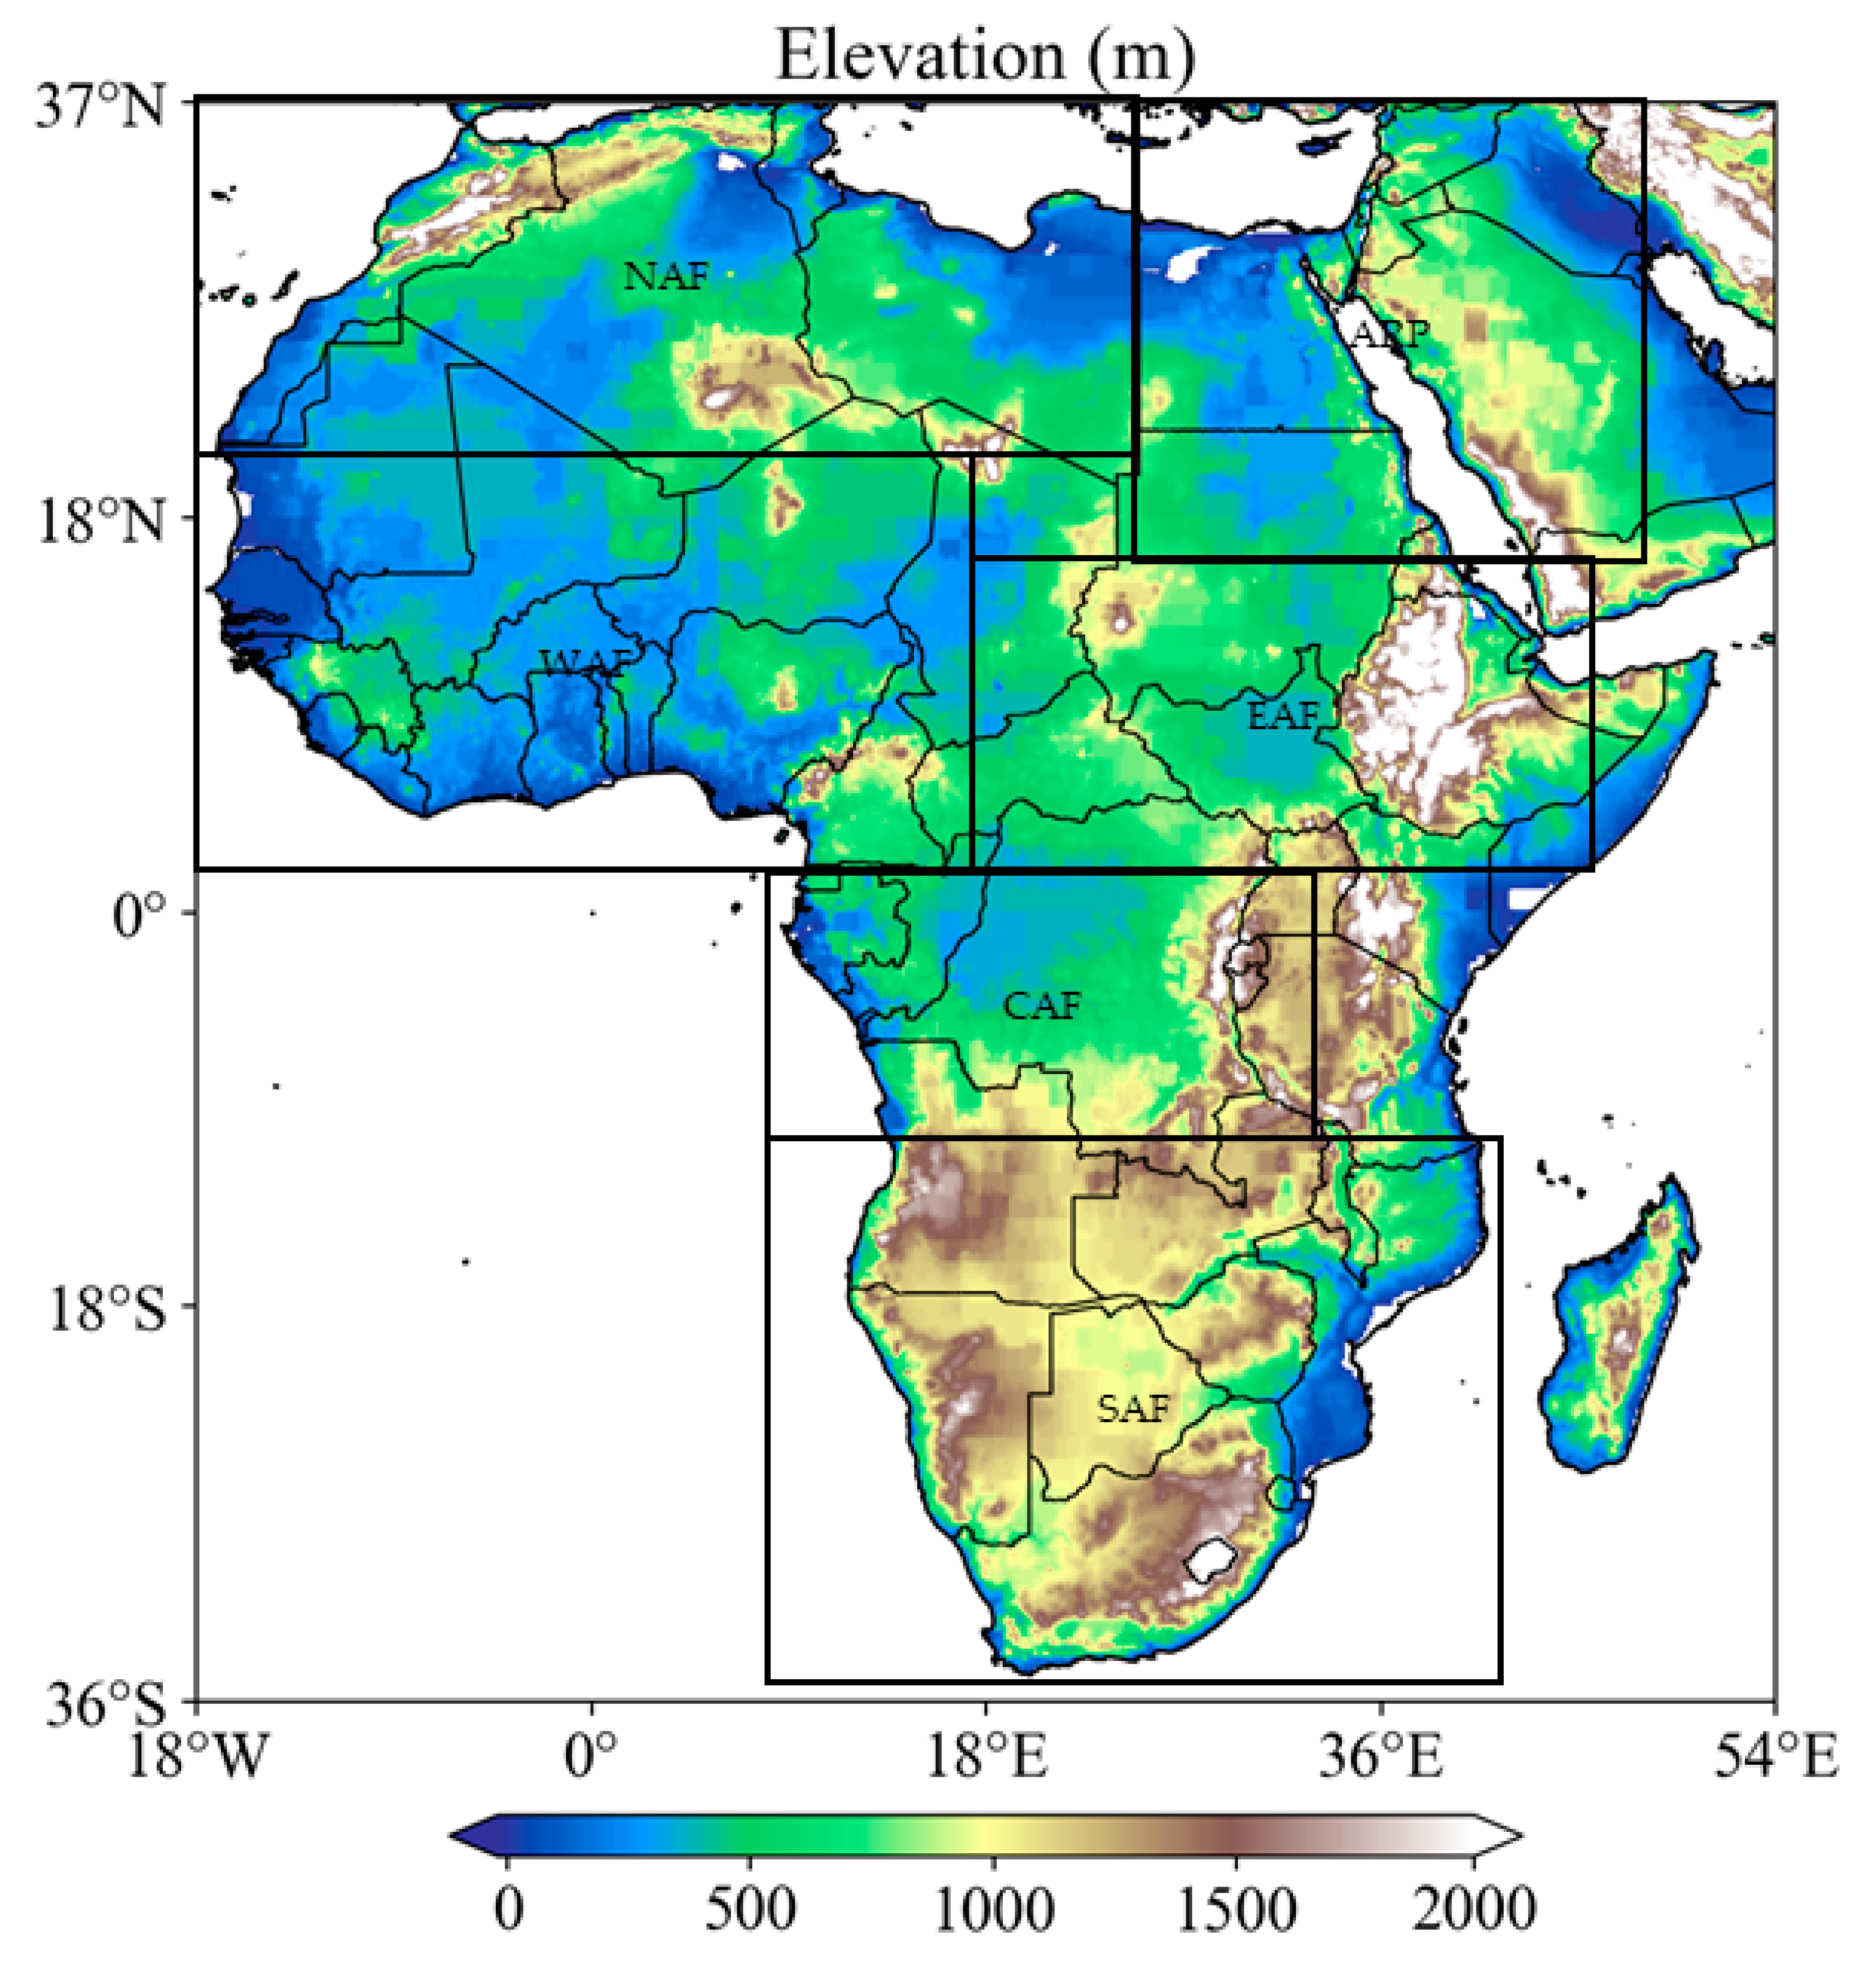
2.1. Study Area

The African continent covers a total land mass of approximately >30 million km2. It extends from 14°00′ W, 52°00′ E, and 32°00′ N to 35°00′ S, straddling the equator (Figure 1). The continent is divided into sub-regions, namely, West Africa (WAF), East Africa (EAF), North Africa (NAF), Central Africa (CEF), and Southern Africa (SAF) [22]; these terms are widely used [10,23,24,25]. The continent has complex topographic features that vary significantly, including mountainous regions, such as the Ethiopian Highlands, Kenyan Highlands, Cameroonian Highlands, and the Atlas Mountains in North Africa, regions interspersed with lowlands, and hilly areas with river valleys interleaved across the continent. The highest elevation, which is >5000 m, is Mount Kilimanjaro, in Tanzania (Figure 1). The continent has a large number of water bodies, such as Lake Victoria, the Nile River, etc., and the Congo Basin, which helps to regulate the climate of the region. The monsoon season features much precipitation, while the dry season’s precipitation is related to local causes. Generally, the mean precipitation (temperature) across the entire continent is <350 mm year−1 (15 °C to 27 °C) [10]. The WAF and EAF are dominated by the monsoon seasons with a pattern of onset to cessation of May–June–July–August–September–October–November (MJJASON) in the Northern Hemisphere (NH) [15,25,26]. The CAF has a tri-modal rainfall pattern [10]. The SAF and NAF have unimodal rainfall patterns and follow the December–January–February–March–April (DJFMA) monsoon pattern. The Arabian Peninsula (ARP)’s climate is largely influenced by the Indian summer monsoon in the South and the Mediterranean synoptic scale systems in the North [27,28]. The four seasons in the ARP are the northeast monsoon in the winter (December–January–February–March, DJFM), the spring transition (April–May), the southwest monsoon (June–July–August-September, JJAS), all of which are related to convective PREC, and the autumn (October–November) [28].

2.2. Data

2.2.1. Gridded Satellite Precipitation Datasets

We used the Global Precipitation Climatology Project, version 3.2 (GPCPv3.2), provided by the NASA website at www.earthdata.nasa.gov/esds accessed on 10 May 2022, as the reference observation-based dataset. The GPCP dataset covers the African continent and the Arabian Peninsula (ARP) for performance purposes. The GPCPv3.2 was developed by the World Climate Research Program (WCRP)/Global Water Cycle and Energy Experiment (GEWEX). The GPCP v3.2 has a spatial resolution of 0.5° × 0.5°, with a timespan ranging from January 1979 until the present. The GPCP v3.2 combines global satellite products and in situ observations [29]. The GPCP has been widely used to evaluate GCMs across different climate regions [29].

2.2.2. CMIP6 Models

In this study, we used the monthly precipitation output of 49 CMIP6 historical runs [7], obtained from https://esgf-node.llnl.gov/search/cmip6 accessed on 22 January 2023, for the period 1950–2014. The selected GCMs from CMIP6 were based on their availability under r1i1p1f1 initial conditions, and the quality of their performance in simulating precipitation in Africa in previous studies [3,10]. We regridded all models to the observation datasets of 0.5° × 0.5° using bilinear interpolation. The study computed the multi-model ensemble mean (MME) of the 49 CMIP6 runs (Equation (1)). The motivation for using MME was based on the argument that MME is superior to individual models [30].

2.2.3. Global Sea-Surface Temperature

We obtained the observed monthly mean SST dataset from the GHRSST Global Data Assembly Center (GDAC) at the Jet Propulsion Laboratory (JPL) Physical Oceanography Distributed Active Archive Center (PO.DAAC) with a horizontal resolution of 1.0° × 1.0°.
It was downloaded from the website http://ghrsst.jpl.nasa.gov/GHRSST_product_table.html (accessed on 22 January 2023).
All the datasets were converted into a spatial resolution of 0.5° × 0.5° using a bilinear interpolation [31,32]. Table 1 summarizes the details of the models.

2.3. Methods

We aggregated the monthly datasets into annual and seasonal values using Climate Data Operator (CDO, version 1.6.4). The climatology was computed by spatial and temporal averaging of the long-term dataset from 1980 to 2014 and quantified over the African continent and Arabian Peninsula. The mean bias of spatial distribution was reported for satellite-based precipitation data (GPCP) and the CMIP6 GCMs.
The GCM multi-model mean (MME) was computed by averaging forty-nine (49) individual GCMs (Table 1) based on Equation (1)
MME = 1 n i = 1 n GCMs i
To quantify the agreement between observations and model simulations, Taylor diagrams [33] were used to show the ability of different GCMs to simulate precipitation compared to observation at annual and seasonal scales. The Taylor diagram was computed based on the following metrics: the Pearson correlation coefficients, standard deviations of the error, and root-mean-square errors (RMSD).
The climatological precipitation patterns were computed to compare the consistency between the GPCP and the GCM simulations. We averaged the monthly values at each grid point for spatial climatological mean into annual and seasonal.
This study used two seasons (i.e., monsoon and pre-monsoon seasons). These were the West African monsoon season (i.e., May–June–July–August–September–October–November (MJJASON), representing the wettest season, and December–January–February–March–April (JFMA), representing the driest season in the Northern Hemisphere (NH). Conversely, DJFMA represents the wettest season in the Southern Hemisphere (SH), while MJJASON represents the driest. These seasonal differences largely follow the continent’s agricultural calendar, as agriculture is rain-based. The precipitations in the dry seasons in both hemispheres are related to the local rainfall during this season. Previous studies in the region applied this seasonal analysis [34,35].
We averaged monthly values into annual and seasonal time series for GPCP and GCM simulations to compute the annual cycle. The mean annual precipitation anomalies were calculated as the deviations (using the Z-score method (Equation (2))) from the climatology from 1980 to 2014.
Z std = Z i Z ¯ σ
where Z std denotes standardized Z, Z ¯ is the average, and σ is the standard deviation of the variable Z.
To understand the wetness and dryness trends over the period, we computed the significance of the linear trends to compare the consistency between the CMIP6 MME, the GCMs, and the GPCP using the Man Kendal test [36,37] and the Sen slope test [38] at 95% confidence intervals. The benefits of using these non-parametric tests are that they are unaffected by outliers and that they are widely recommended by the World Meteorological Organization as standard tests for trend analysis [39]. They are widely used for hydro-meteorological studies across Africa [24,34,40].
Furthermore, we explored the relationship between precipitation and SST to examine how these datasets capture their interrelationships. These relationship are examined in both the GPCP and CMIP6 MME datasets. Several studies examined such relationships in the past [17,41].

3. Results and Discussion

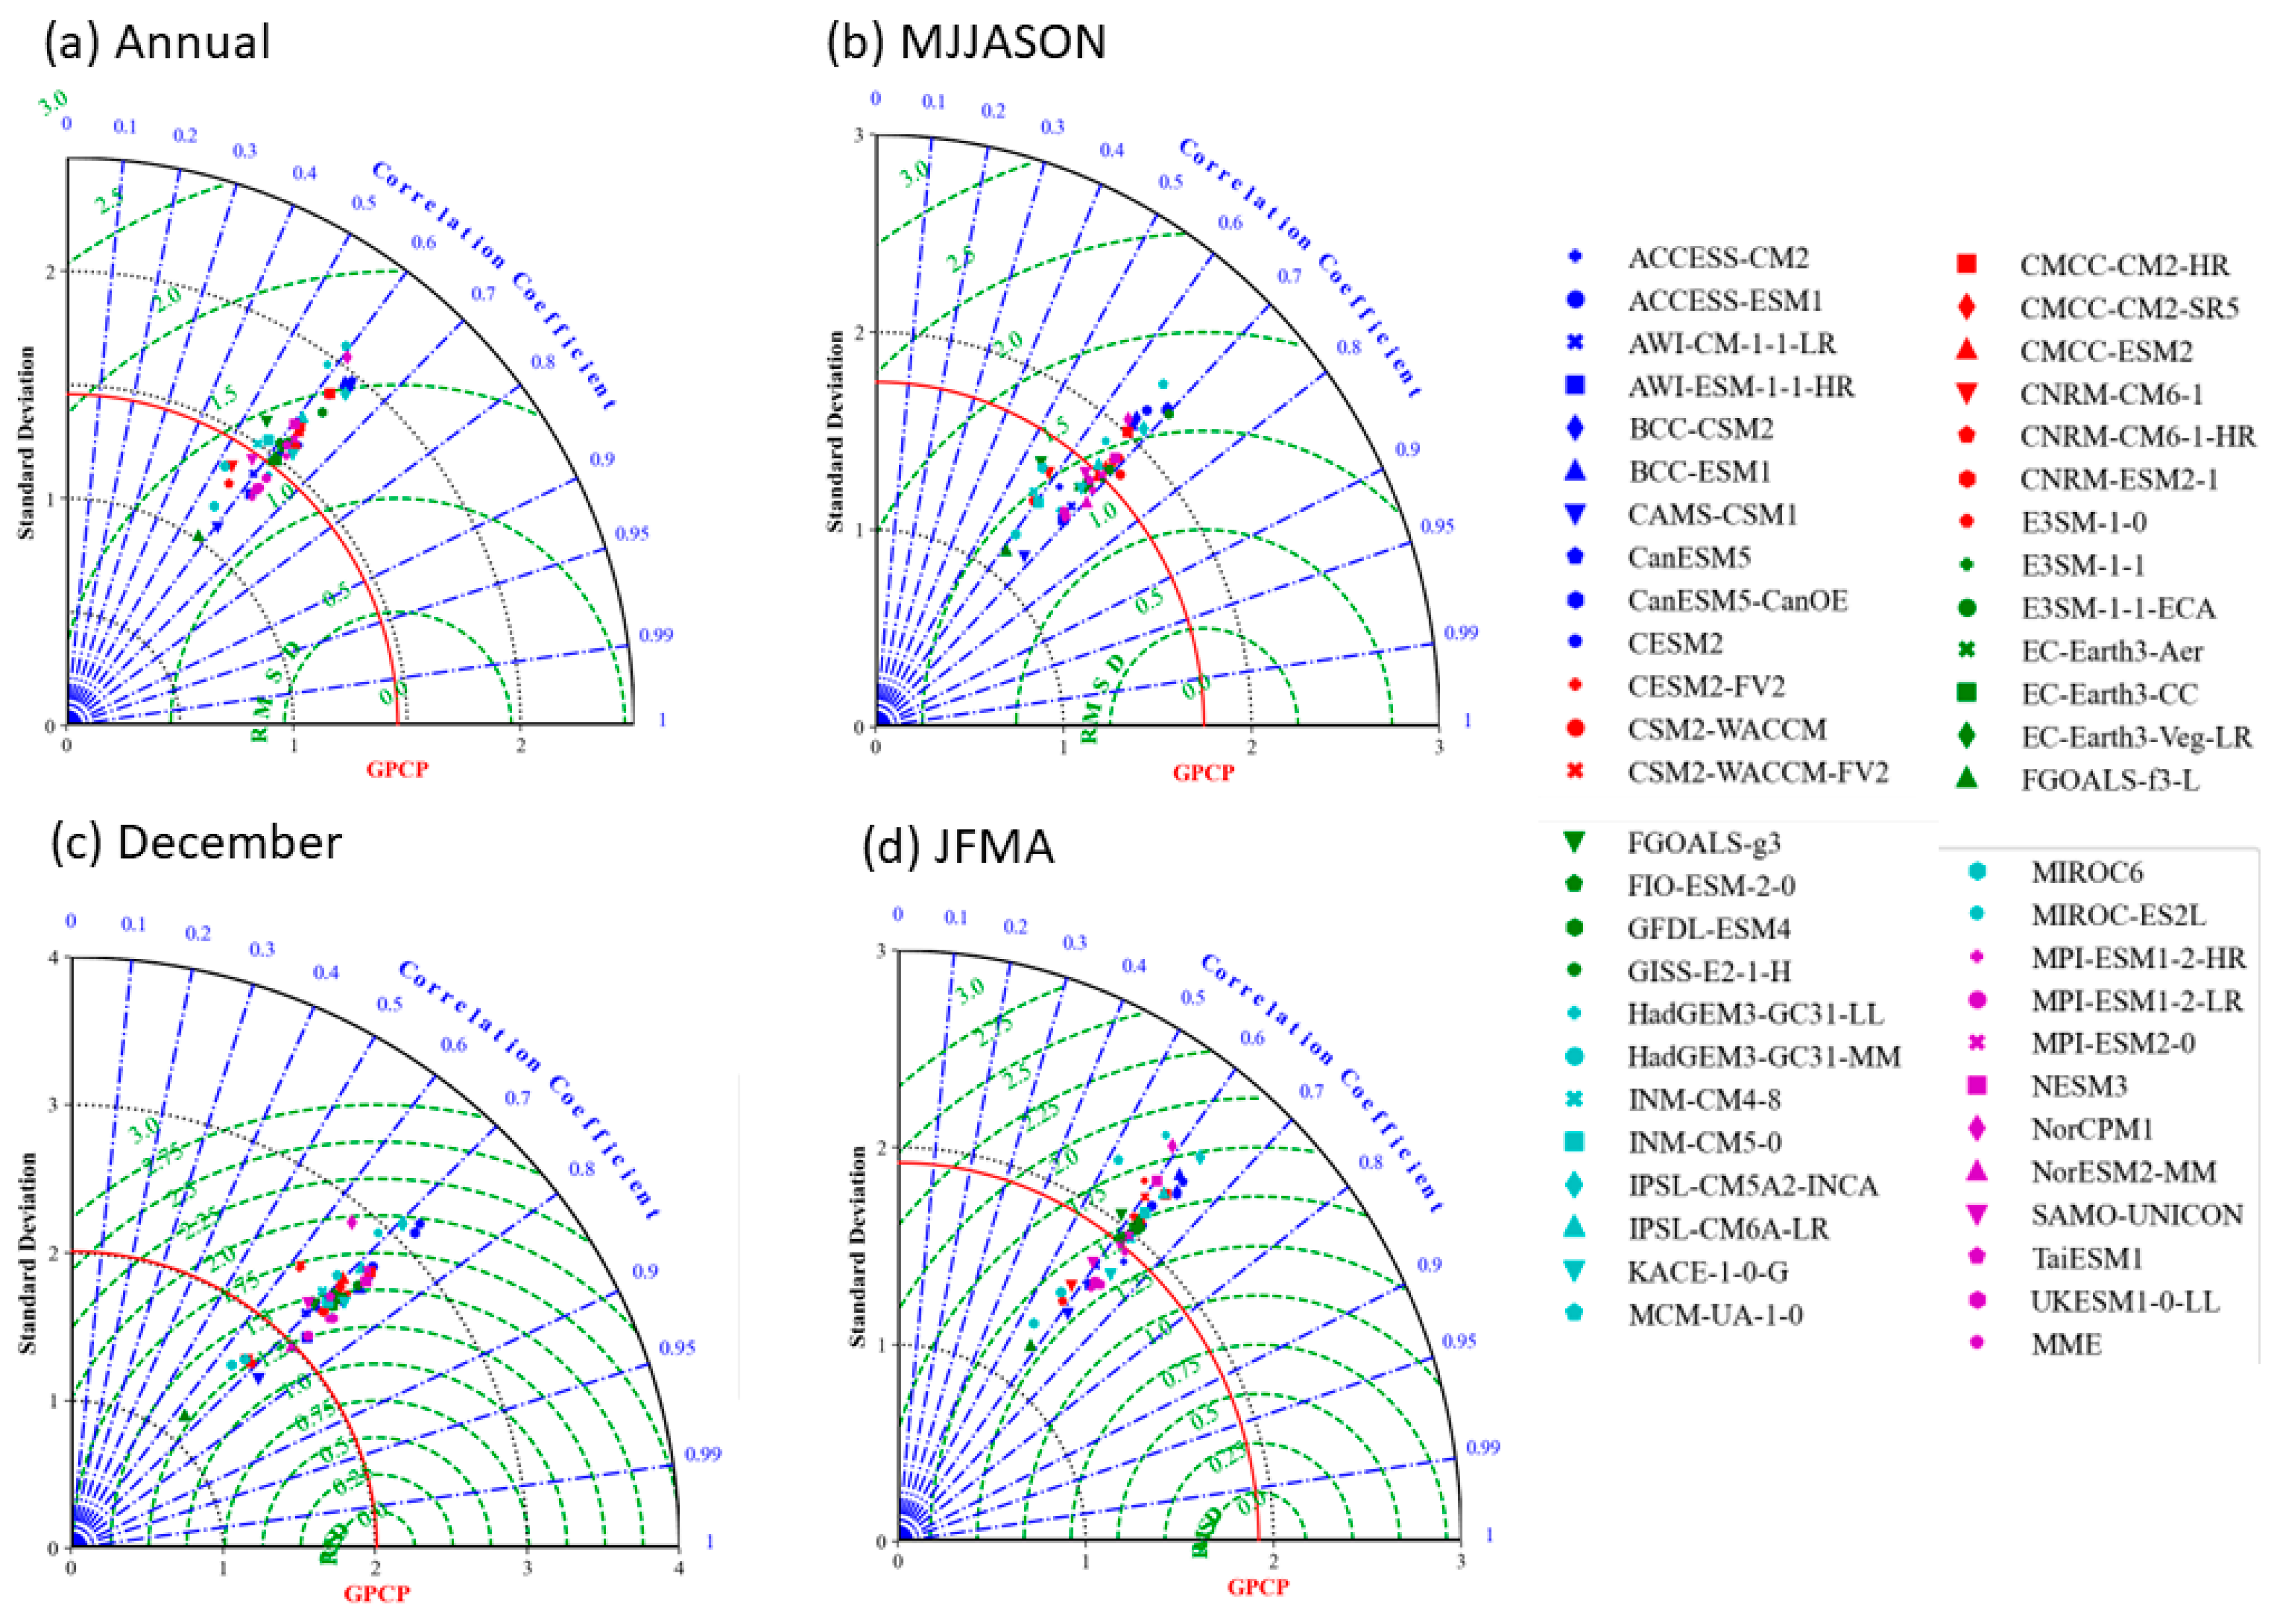
3.1. Performance Evaluation of GPCP and CMIP6 Models

Figure 2 presents the Taylor diagram for the average precipitation for the GPCP and the simulated GCMs. The correlation (r), normalized root-mean-square difference (RMSD), and standard deviation values for GPCP/CMIP6 MME/49 GCMs are presented. As shown by the high value of r, low RMSD (SD) values are desirable to indicate improvements in the GCMs’ -simulation capability relative to GPCP [33].
Figure 2a presents the Taylor diagram for the mean annual precipitation for the GPCP and CMIP6 MME and the 49 selected GCMs. The GPCP r/RMSD/SD were 1/0 mm/1.46 mm. We observed an overlap in the values of a few of the models. The following models showed dispersion lower than the observed value (GPCP = 1.46 mm): CAMS-CSM1 (1.10), FGOALS-f3-L (1.02), GISS-E2-1-H (1.17), MICRO6 (1.17), CNRM-CM6-1-HR (1.28), AWI-ESM-1—HR (1.30), MPI-ESM1-2-HR (1.30), NorESM2-MM (1.33), CNRM-ESM2-1 (1.34), MPI-ESM1-2-LR (1.35), HadGEM3-GC31-MM (1.34), AWWI-CM-1-1-LR (1.38), CNRM-CM6-1 (1.36), UKESM1-0-LL (1.40), HadGEM3-GC31-LL (1.42), and SAMO-UNICON (1.43). The study recognized that four GCMs showed a degree of scattering that was slightly higher than the GPCP but lower than the CMIP6 MME, Earth3-Aer (1.47), EC-Earth-CC (1.49), EC-Earth3-Veg-LR (1.5), and INM-CM4-8 (1.50), while ACCESS-CM2 showed an identical SD to CMIP6 MME (1.53). The remainder, in Table S2, showed higher SD values than the CMIP6 MME.
The Taylor-diagram results in the MJJASON (Figure 2b) and December (Figure 2c) showed higher r, RMSD, and SD values. The GPCP (CMIP6 MME) r/RMSD/SDs were 1/0 mm/1.75 mm (0.96/1.34/1.66) in the MJJASON. The E3SM-1-1 (1.75) exhibited an identical SD to the GPCP. The following five models showed SD values slightly closer to those of the GPCP but higher than those of the CMIP MME, in ascending order: CMCC-ESM2 (1.74), SAMO-UNICON (1.71), FIO-ESM-2-0 (1.69), TaiESM1 (1.69), and EC-Earth3-CC (1.67) (Figure 2b). The remaining models showed SD values that were lower (higher) than the CMIP6 MME in the MJJASON; these are shown in Table S2 and Table S3, respectively.
In December, the GPCP (CMIP6 MME) exhibited the following r/RMSD/SD values: 1/0/2.01 (0.74/1.58/2.3). Few models showed SD values that were lower than those of the GPCP: MPI-ESM1-2-HR (2.01), NorESM2-MM (1.99), CNRM-CM6-1 (1.72), CNRM-ESM2-1 (1.72), HadGEM3-GC31-MM (1.72), CNRM-CM6-1-HR (1.73), CAMS-CSM1 (1.69), MICRO6 (1.63), FGOALS-f3-L (1.17), GISS-E2-1-H (1.63). The remaining 40 models showed greater scattering (SD) than the GPCP (Figure 2c).
In Figure 2d, comparable to the r/RMSD/SD of the GPCP, the MME (r/RMSD/SD) values were 1/0/1.92, compared with the 0.64/1.63/1.90 in the JFMA. The TaiESM1 (1.92) exhibited better SDs than the CMIP6 MME (1.90) relative to the GPCP (1.92). About 31 models showed high r and larger RMSD and SD values, respectively (Figure 2c). Details are provided in Table S2-JFMA. We observed that 17 models showed slightly lower SD values relative to the CMIP MME in JFMA, as shown in Figure 2c (further details are shown in Table S3-JFMA).
It is interesting to note that the degree of scattering among some of the models’ results differed, with the exception of overlaps relative to the observation (Figure 2). In general, the MME and individual models produced decent simulations of the annual and seasonal mean precipitation but with differences in the correlation coefficient, RMSD, and deviations. At the annual scale, only UKESM1-0-0-LL, MPI-ESM1-2-HR, MPI-ESM1-2-LR, HadGEM3-GC31-LL, with r/RMSD/SD values closer to those of the GPCP, produced better performances than the MME relative to the GPCP in every respect (i.e., r/RMSD/SD). However, MPI-ESM1-2-HR, MPI-ESM1-2-LR, and AWI-ESM-1-1-HR produced better performances during the WAM season (i.e., MJJASON) than the MME relative to the GPCP in every respect (i.e., r/RMSD/SD). In the post-monsoon season of the JFMA, the normalized SD of the TaiESM (1.92) was similar to that of the GPCP, while that of the MME (1.90) was lower. However, the r/RMSD was better in the MME (0.64/1.63) than in the TaiESM1 (0.62/1.68) in the JFMA. The GCM MME showed superior performance, much better than any individual model in the boreal winter month of December. This study suggests that the MME showed significantly superior performance to most of the individual models in most cases. These results are consistent with those of previous studies on the African continent [10,13,35].
Interestingly, many of the individual models from the modeling centers displayed comparable performances, despite their slight similarities (differences) in replicating the mean precipitation in terms of r/RMSD/SD values. For example, the models with similarities in their performance (i.e., r/RMSD/SD) developed by the US Department of Energy (DOE) (E3SM-1-0, E3SM-1-1, E3SM-1-ECA) and their related modeling groups tended to share common modeling physics, and showed performances that were consistent with previous studies [42].
Other developers, CNRM-CERFACS (CNRM-CM6-1, CNRM-CM6-1-HR, CNRM-ESM2-1) [43,44] and the U.K. Met Office (HadGEM3-GC31-MM, HadGEM3-GC31-LL, UKESM1-0-LL [45], shared model physics. However, more specific differences arose in the use of different CMIP6 forcing data, which to tend to influence GCM-model performance.
By contrast, other individual model variants exhibited differences in model performance related to their levels of uncertainty, and this result was consistent with the literature [46,47,48]. The GCMs produced decent simulations of seasonal mean precipitation despite disagreement in the models RMSD and SD. The CMIP6 MME performance was better than that of most of the individual models in simulating annual and seasonal mean precipitation, which, again, was consistent with previous studies [6,7,35,49,50].

3.2. Climatology of GPCP and CMIP6 Models

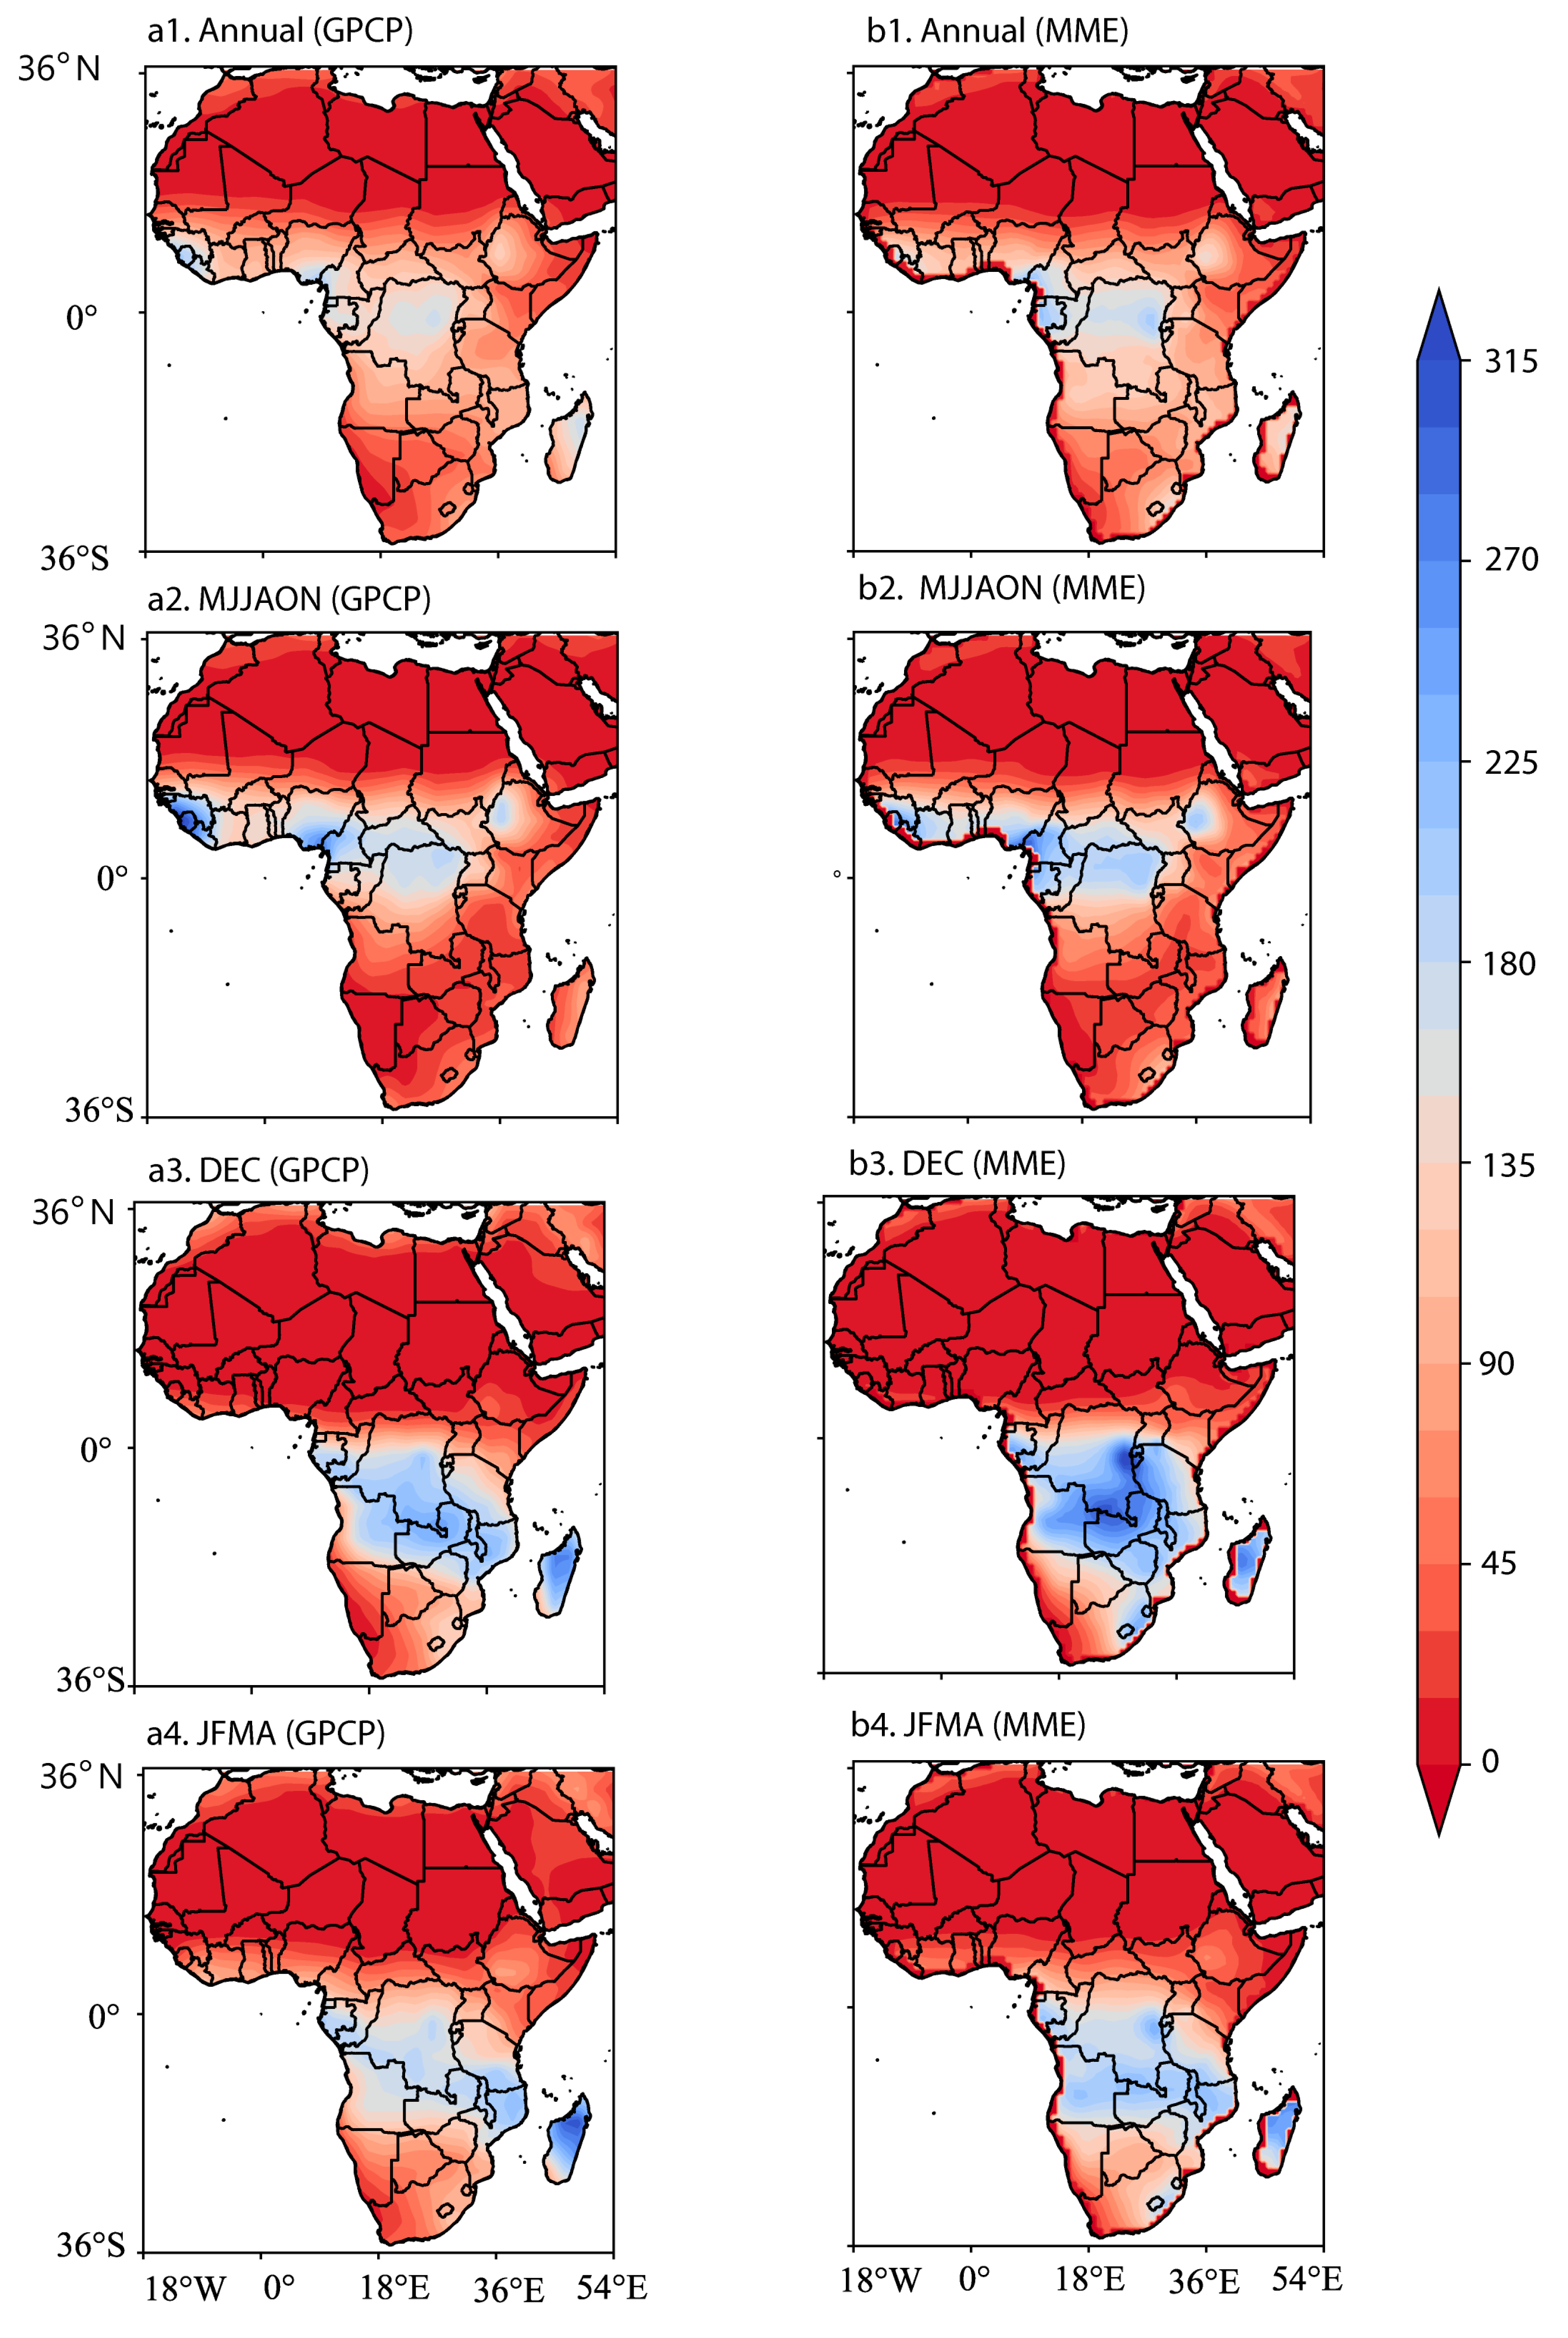
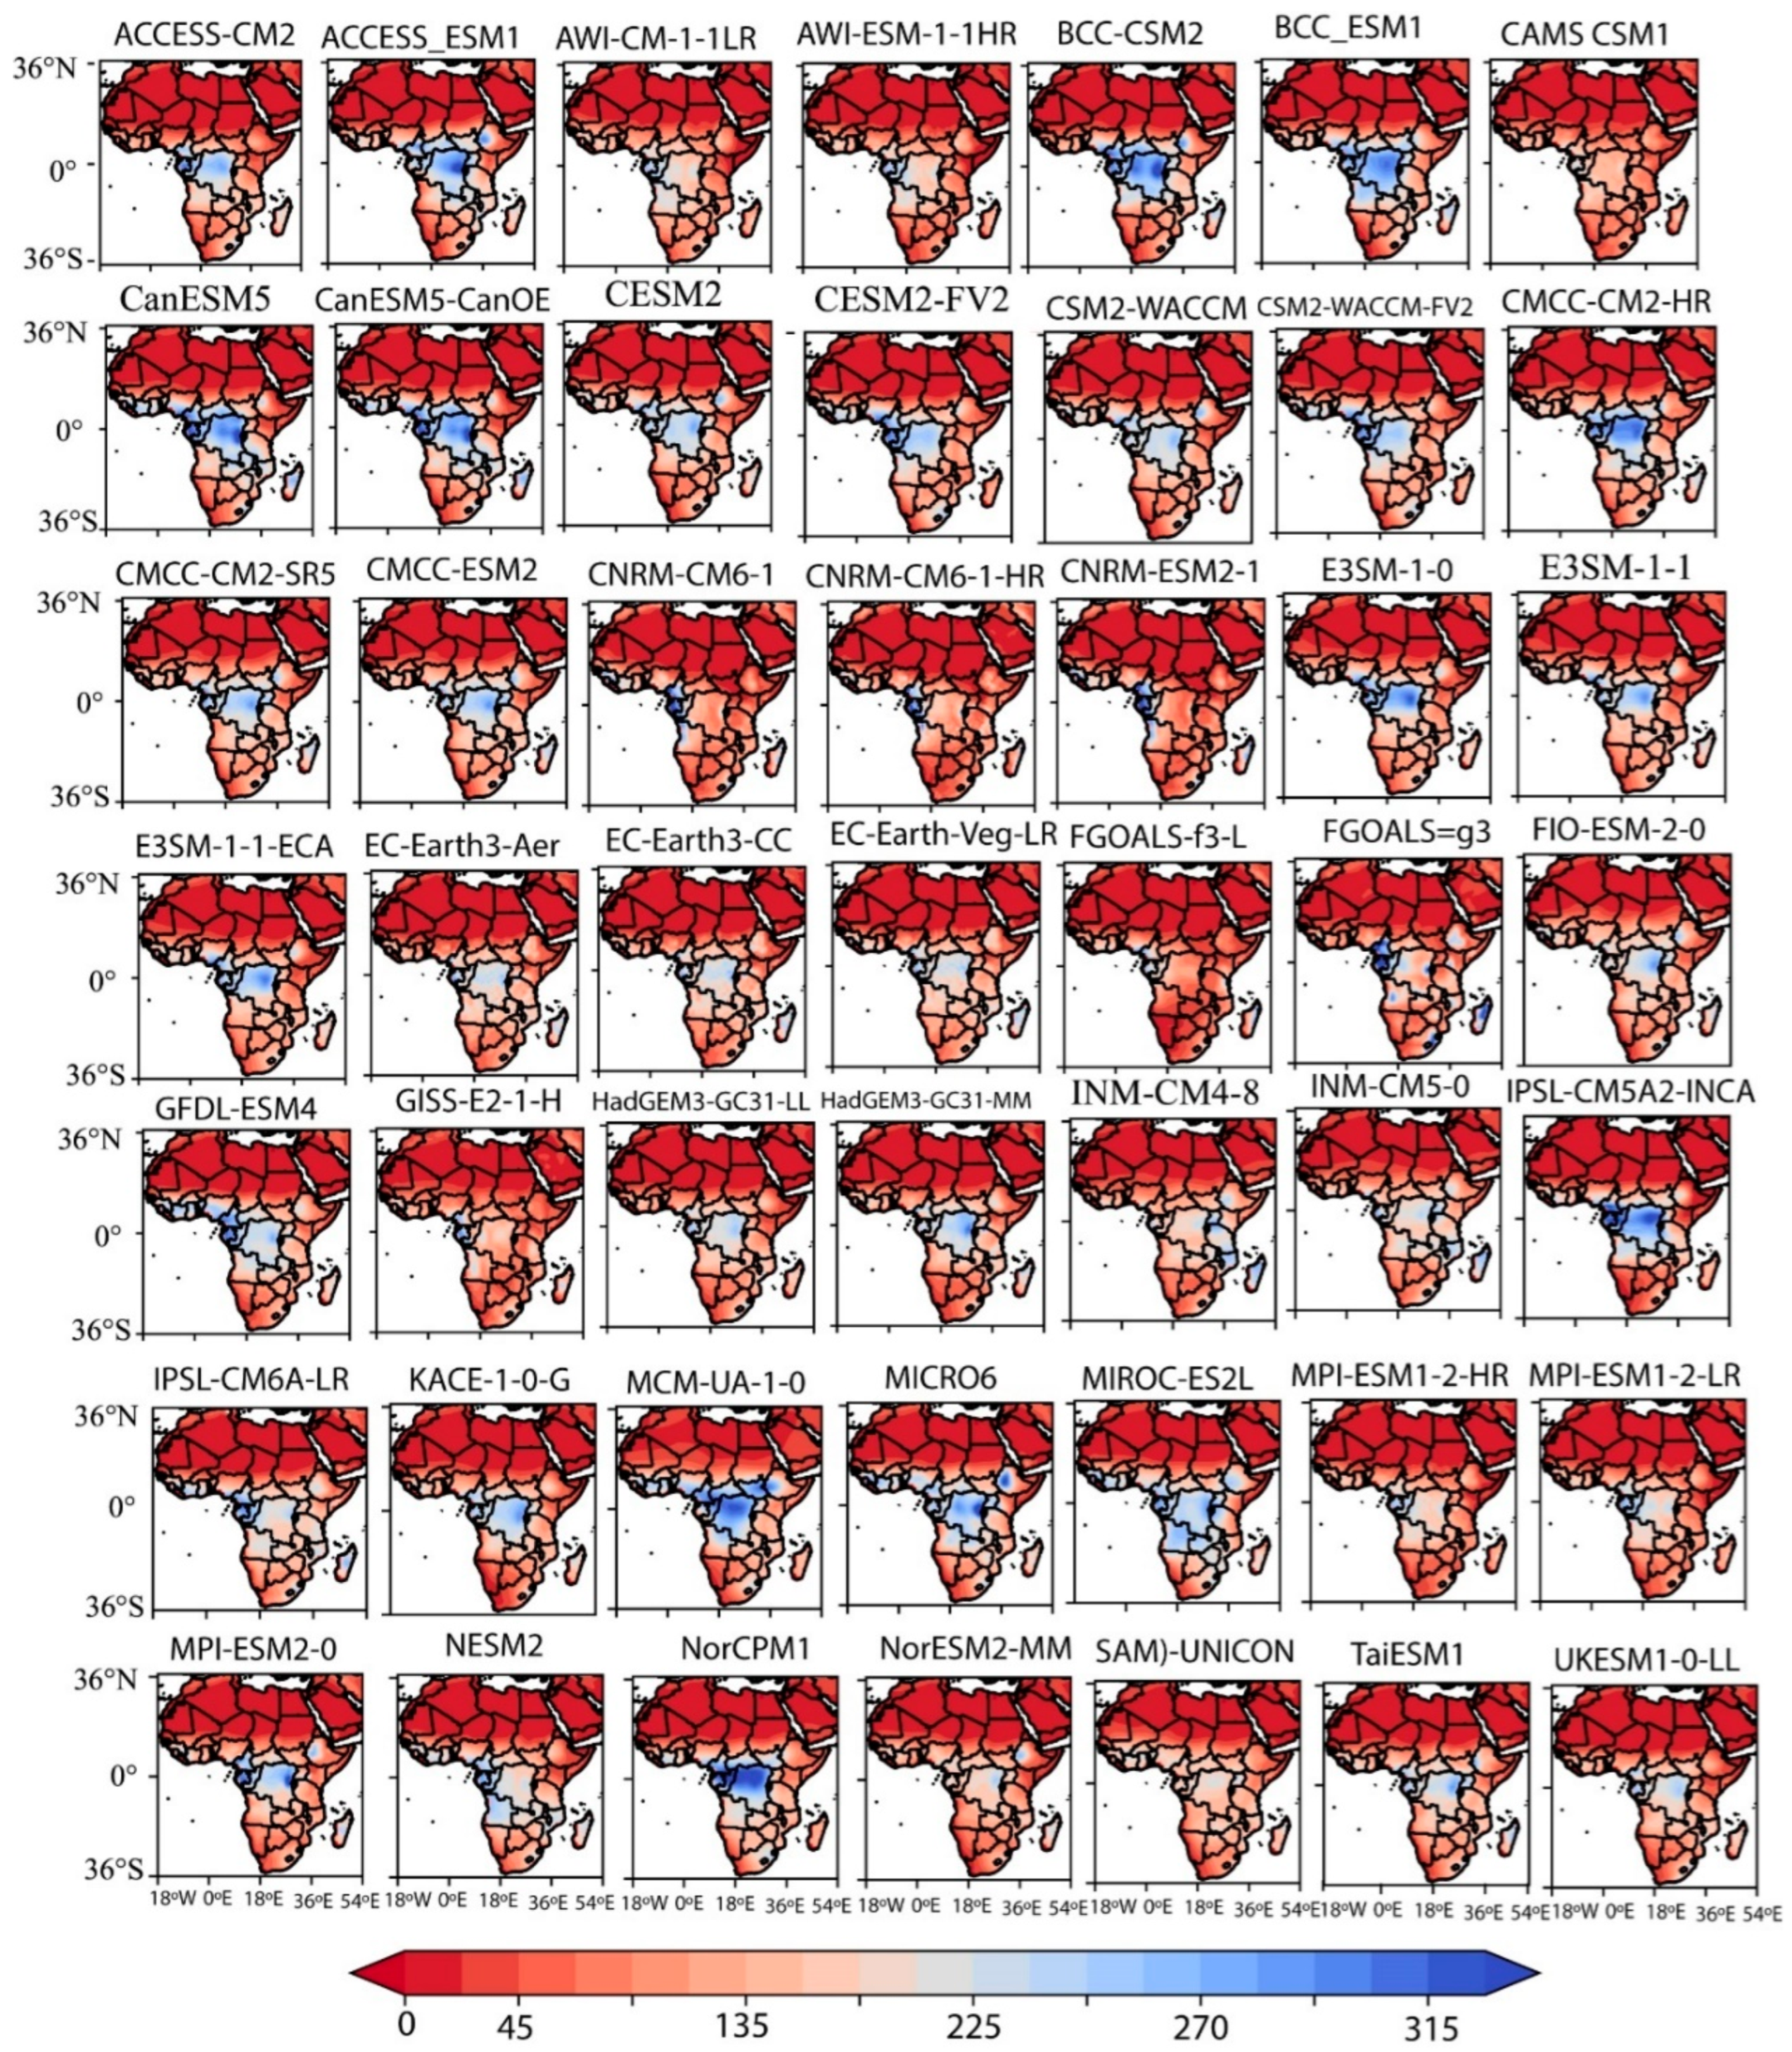
3.2.1. Spatial Variations

To investigate the performance of the GCM models in simulating the mean precipitation, the spatial distribution of CMIP6 MME was compared with observation (GPCP) during the period of 1980–2014 (Figure 3). The annual variations in GPCP (Figure 3(a1) and CMIP6 MME (Figure 3(b1)) and the seasonal variations in GPCP (Figure 3(a2–a4)) and CMIP6 MME (Figure 3(b2–b4)) were computed over the African continent and the ARP to compare the agreement in spatial distribution. Compared with the GPCP, the CMIP6 MME reproduced coherent spatial patterns in many parts of Africa and the Arabian Peninsula, despite some differences in the magnitude of precipitation. A striking difference over the West African coast (15° W, 5–10° N) extending along the Guinean Coast reproduced spatially heterogeneous distribution and magnitude of precipitation. Our result is consistent with [10], in which the authors reported regional differences in simulated mean precipitation in GCM-ensemble mean and observations. In this study, for example, the CMIP6 MME’s failure to replicate the spatial pattern over the periphery of the Guinean coast (15° W, 5–10° N) compared to GPCP was not surprising, since previous studies reported the drawbacks of GCMs in simulating tropical precipitation, especially since convective and large circulations are integral mechanisms linked to the features of the West African monsoon (WAM) [35,51,52,53].
The spatial patterns of the Sahara Desert (15–30° N) and the Arabian Peninsula, in the Northern Hemisphere (NH), were presented well. However, the magnitude was mainly limited to <50 mm/year, which was consistent with those of drier regions with Mediterranean climates [12,54,55,56]. Additionally, the precipitation over the Sahelian belt and the whole East African (26–52° E, 10° S–5° N) region was relatively comparable with that of the GPCP (Figure 3), in line with previous studies [15]. The GPCP and CMIP6 MME captured the higher mean PREC amounts in the near-equatorial NH and Southern Hemisphere (SH). For example, the Central African tropical rainforest regions recorded the highest PREC values.
Figure 3(a2–a4,b2–b4) show the spatial distribution in terms of magnitude and pattern based on long-term mean precipitation from the 34-year historical period (1980–2014). Overall, the CMIP6 MME reproduced the precipitation amount and spatial pattern better than observation (i.e., GPCP). Figure 3(a2,b2) shows a spatial pattern for the MJJASON seasons, which are influenced by the West African monsoon (WAM), which develops in boreal spring and summer around the 5–10° N from May to August due to the seasonal migration of ITCZ at its northmost position in the JJA, at 10° N [57,58]. The CMIP6 MME (Figure 3(a3,b3)) had a PREC amount along the Guinean Coast and southern Sahel that was higher by about >250 mm than that of the GPCP, which was consistent with [13,26]. The reduced amount towards locations in the Western equator and the Congo Basin in the MJJASON is attributable to seasonal withdrawal in boreal autumn [35].
The intra-seasonal-precipitation distribution based on long-term mean precipitation from the 34-year historical period (1980–2014) for December is shown in Figure 3(a3,b3). In the boreal winter month of December, high precipitation amounts started at 5° S in the Central African tropical rainforest regions and stretched from the Kalahari Desert (25–30° S) towards the south-eastern coast of the Mozambique area and Madagascar, with precipitation >300 mm in December (Figure 3(a3,b3)).
In the boreal JFMA seasons, high amounts were found in the SH between 10° S and 30° S, with high magnitude within the Kalahari Desert (25–30° S) extending towards the Mozambique area and Madagascar (Figure 3(a4,b4)). This was related to the ITCZ at its southmost position, at 15° N, which the satellite and CMIP model’s features represented reasonably well—except for a limited amount in areas of southwestern Southern Africa (SAF). The relatively high amounts of precipitation over 25–30° S compared with the precipitation in the JFMA seasons was consistent with [11].
The EAF (26–52° E, 10° S–5° N) region presented the same mean precipitation pattern at the annual scale (Figure 3(a1,b1)). However, more variations in precipitation regimes were contrasted between the MJJASON in the EAF and the JFMA in the EAF, respectively (Figure 3(a2,a3,b2,b3)). In the EAF, the long rains are in boreal spring, and the short rains are in boreal autumn [59,60]. High spatial variations in precipitation amounts with EAF precipitation were limited to the Ethiopian and Kenyan highlands [61] in the annual, MJJASON, and JFMA periods, respectively. It should be noted that the high spatiotemporal distribution of the precipitation in the EAF region was related to the complex climatological cycle of the East African monsoon system (EAMS) [13,15].
To further explore the climatology of Africa and the Arabian Peninsula, we computed the interannual variations in the 49 GCM models. As shown by the interannual (Figure 4) and seasonal (Figures S1–S3) variations, the majority of the individual CMIP6 matched the observed GPCP. The agreement was more evident in the replications of the simulated PREC shown in Figure 4, in Dec (Figure S2), and in the JFMA (Figure S3) than in the MJJASON (Figure S1).
The spatial patterns were consistent with the climatology of the arid and semi-arid areas, and this was more pronounced in the arid climates at 15–30° N, 10° S, and 30° S, as well as along the 26–52° E, 10° S–5° N regions. In particular, CMIP6 models from the same modeling group tend to show similar spatial patterns, consistent with [43,44,45].
Furthermore, some of the individual model variants used in this study, such as CAMs-CSM1, FIO-ESM-2-0, GFDL-ESM4, GISS-E2-1-H, KACCE-1-0-G, MCM-UA-1-0, NESM2, SAMP-UNICON, and TaiESM1, showed similar spatial patterns to the observed GPCP, which might have been related to the improved model physics in the CMIP6 architecture, consistent with [6]. These results indicate that the ability of many of the individual models to reproduce a realistic precipitation climatology and variability during the historical period is consistent with that in previous studies of the whole African region [10], West Africa [13,14], EAF [15], SAF region [11], and Northern Africa [12]. This helps to build confidence in CMIP6 PREC projection studies.
The seasonal cycle showed that the majority of the individual models reproduced the simulated precipitation satisfactorily in the MJJASON (Figure S1), Dec (Figure S2), and the JFMA (Figure S3), respectively. Most of the models in the eastern part of the Sahelian belt showed relatively high precipitation, extending to the Ethiopian Highlands. In particular, the individual models that matched the spatial variations were related to the models that tended to share most of the model physics [6,7]. The similarities were more pronounced in the arid- and semi-arid-climate zones in the NAF and SAF.
The performance of the older modeling centers tended to replicate the PREC sufficiently well in all cases in all the climate regions across Africa (i.e., annual and seasonal) compared with observations compared with the new modeling centers. For example, all the models reproduced the precipitation in the arid climatic regions across Africa and the ARP. However, the monsoon PREC (i.e., MJJASON) in humid regions with bimodal annual cycles performed poorly in replicating the PREC. The older centers that replicated the spatial pattern of the monsoon PREC to similar degrees were as follows: E3SM-Project, USA (E3SM-1-0, E3SM-1-1, E3SM-1-ECA), IPSL, France (IPSL-CM6A-LR, IPSL-CM6A-INCA), MPI, Germany (MPI-ESM1-2-HR, MPI-ESM1-2-LR, MPI-ESM2-0), CNRM-CERFACS (CNRM-CM6-1, CNRM-CM6-1-HR, CNRM-ESM2-1), the U.K. Met Office (HadGEM3-GC31-MM, HadGEM3-GC31-LL, UKESM1-0-LL, BCC, China (BCC-CSM2, BCC-ESM1), EC-EARTH, Europe (EC-Earth3-Veg-LR, EC-Earth-CCC, EC-Earth3-AerChem), CSIRO, CCSR, Japan (MICRO6, MICRO-E32L), CSRIO (ACCESS-CM2, ACCESS-ESM1), and NCAR, US (ESM2-FV2, CESM2-WACCM, CESM2-WACCM). This was related to the sharing of significant model physics and configurations between these centers. Stand-alone centers that developed individual model variants replicated the monsoon precipitation relative to observation (TaiESM1, SAMO-UNICON, NESM3, MCM-UA-1-0, and KACE-1-0-G) in the humid equatorial regions. In other regions, Konda et al. [19] found that similar individual models based on the seasonal mean performed well in replicating rainfall in India (AWI-ESM-1-1-LR, BCC-CSM2-MR, BCC-ESM1, CNRM-CM6-1, CNRM-ESM2-1, GFDL-CM4, INM-CM5-0, MIROC-ES2L, MIROC6, and TaiESM1). However, a few exceptions occurred, in which the models could not reproduce the WAM in the MJJASON, as shown along the southwestern coast stretching to Cameroon and the Nigerian Coast of the WAF (Figure S1). Similar results in the EAMS in Dec (Figure S2) and the JFMA (Figure S3) and a few cases in the JFMA (Figure S3) in humid climates in the equatorial region were observed, with a precipitation variability between 0° and 5° W. Other modeling centers, such as the Alfred Wegener Institute (AWI-CM-1-LR, AWI-ESM-1-HR), NCC, Norway (NorCMP1, NorESM2-LM), EURO Mediterranean Centre, Italy (CMCC-CM2-HR4, CMCC-CM2-SR5, CMCC-ESM2), Institute for Numerical Mathematics, Russia (INM-CM4-8, INM-CM5-0), and CASS, China (FGOALS-f3-L, FGOALS-g3) underestimated the monsoon-season (MJJASON) precipitation in equatorial regions. This is unsurprising and is related to the drawbacks in GCMs’ ability to simulate seasonal precipitation. In turn this may be related to the difficulty in parameterizing different versions of large-scale and convective precipitation [7]. Past studies reported GCMs’ inability to simulate the precipitation seasonality in terms of spatial patterns and magnitude over Central Africa (i.e., 5° S) [62,63,64], East Africa [59,65], and sub-Saharan Africa [66]. Overall, CMIP6 MME simulates seasonal precipitation better than individual models. Our results were consistent with previous studies in other regions of the world. For example, using 27 GCMs of the CMIP6, Pimonsree et al. [18] evaluated the performance of the CMIP6 in replicating GPCC rainfall in South-East Asia (SEA). The authors found that the CMIP6 models simulated the annual mean rainfall climatology. A similar result was revealed by Iqbal et al. [67], but with 35 CMIP6s replicating APHRODITE rainfall in mainland South-East Asia (MSEA) for the period of 1975–2014. Furthermore, Ding et al. [20] evaluated the performance of 12 GCMs of the CMIP6 against CRU data in the Yellow River Basin. They found that the IPSL-CM6A-LR and EC-Earth3-CC models had excellent performances in replicating precipitation in the study area.

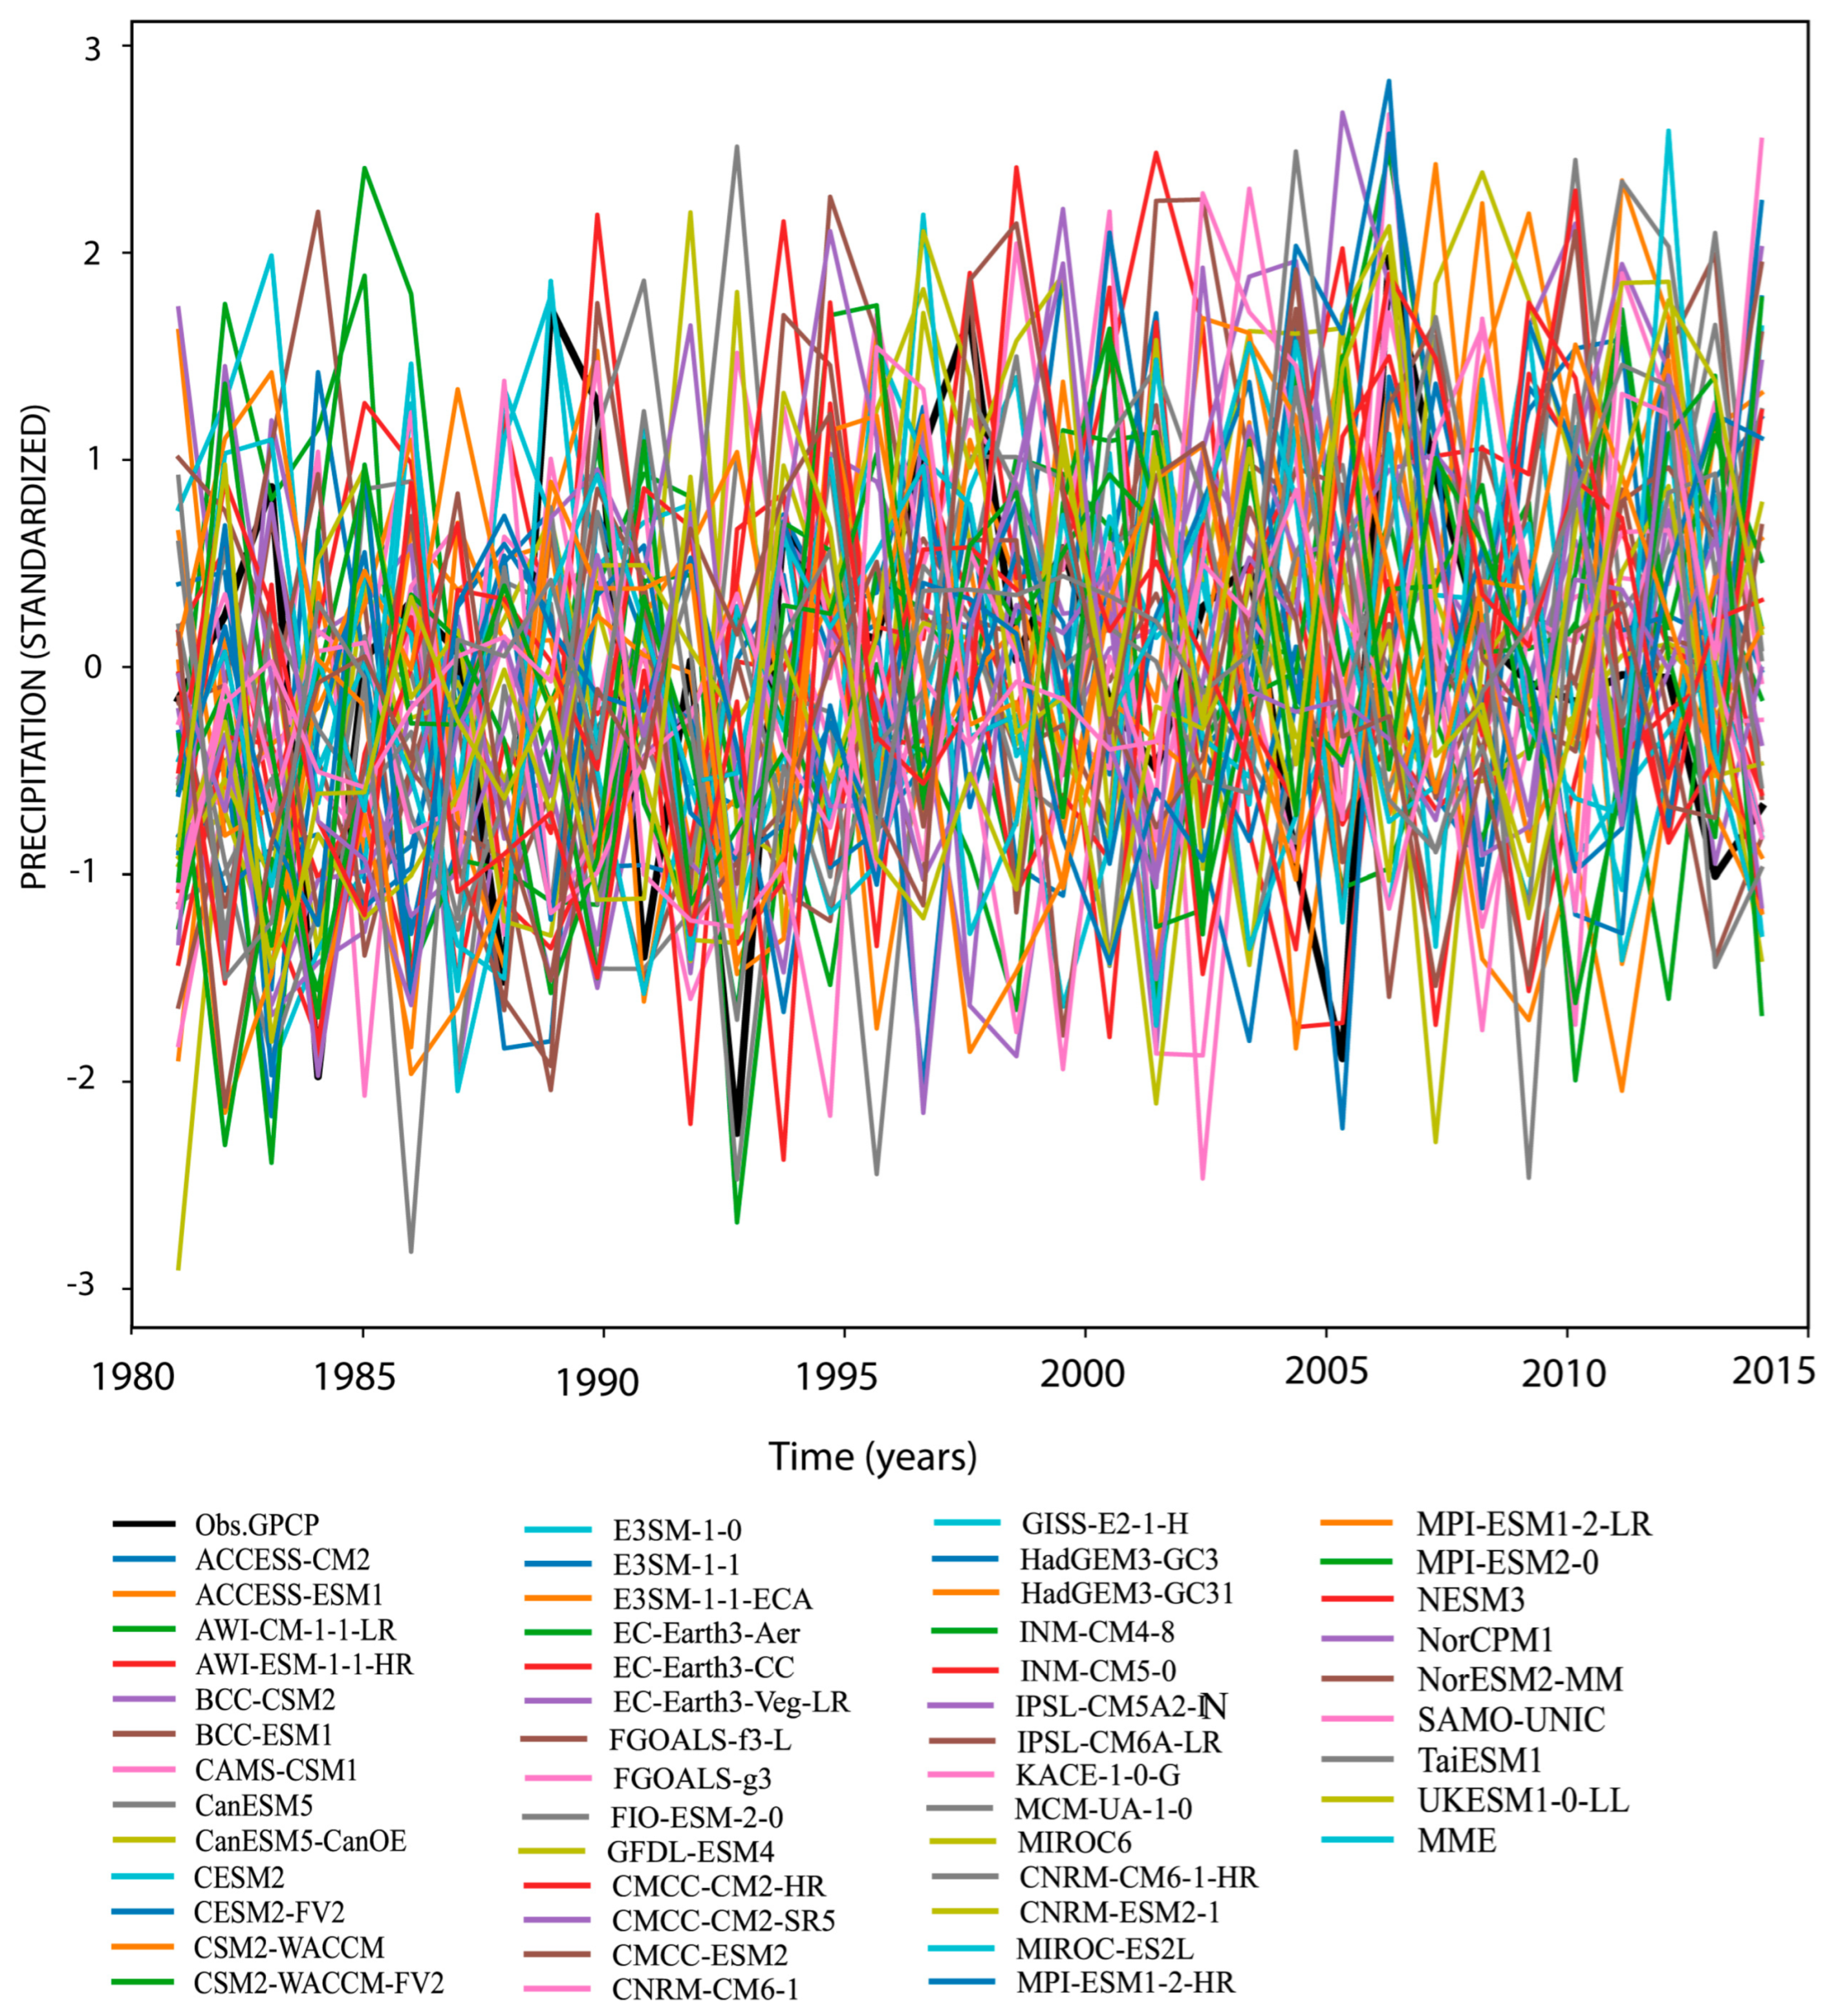
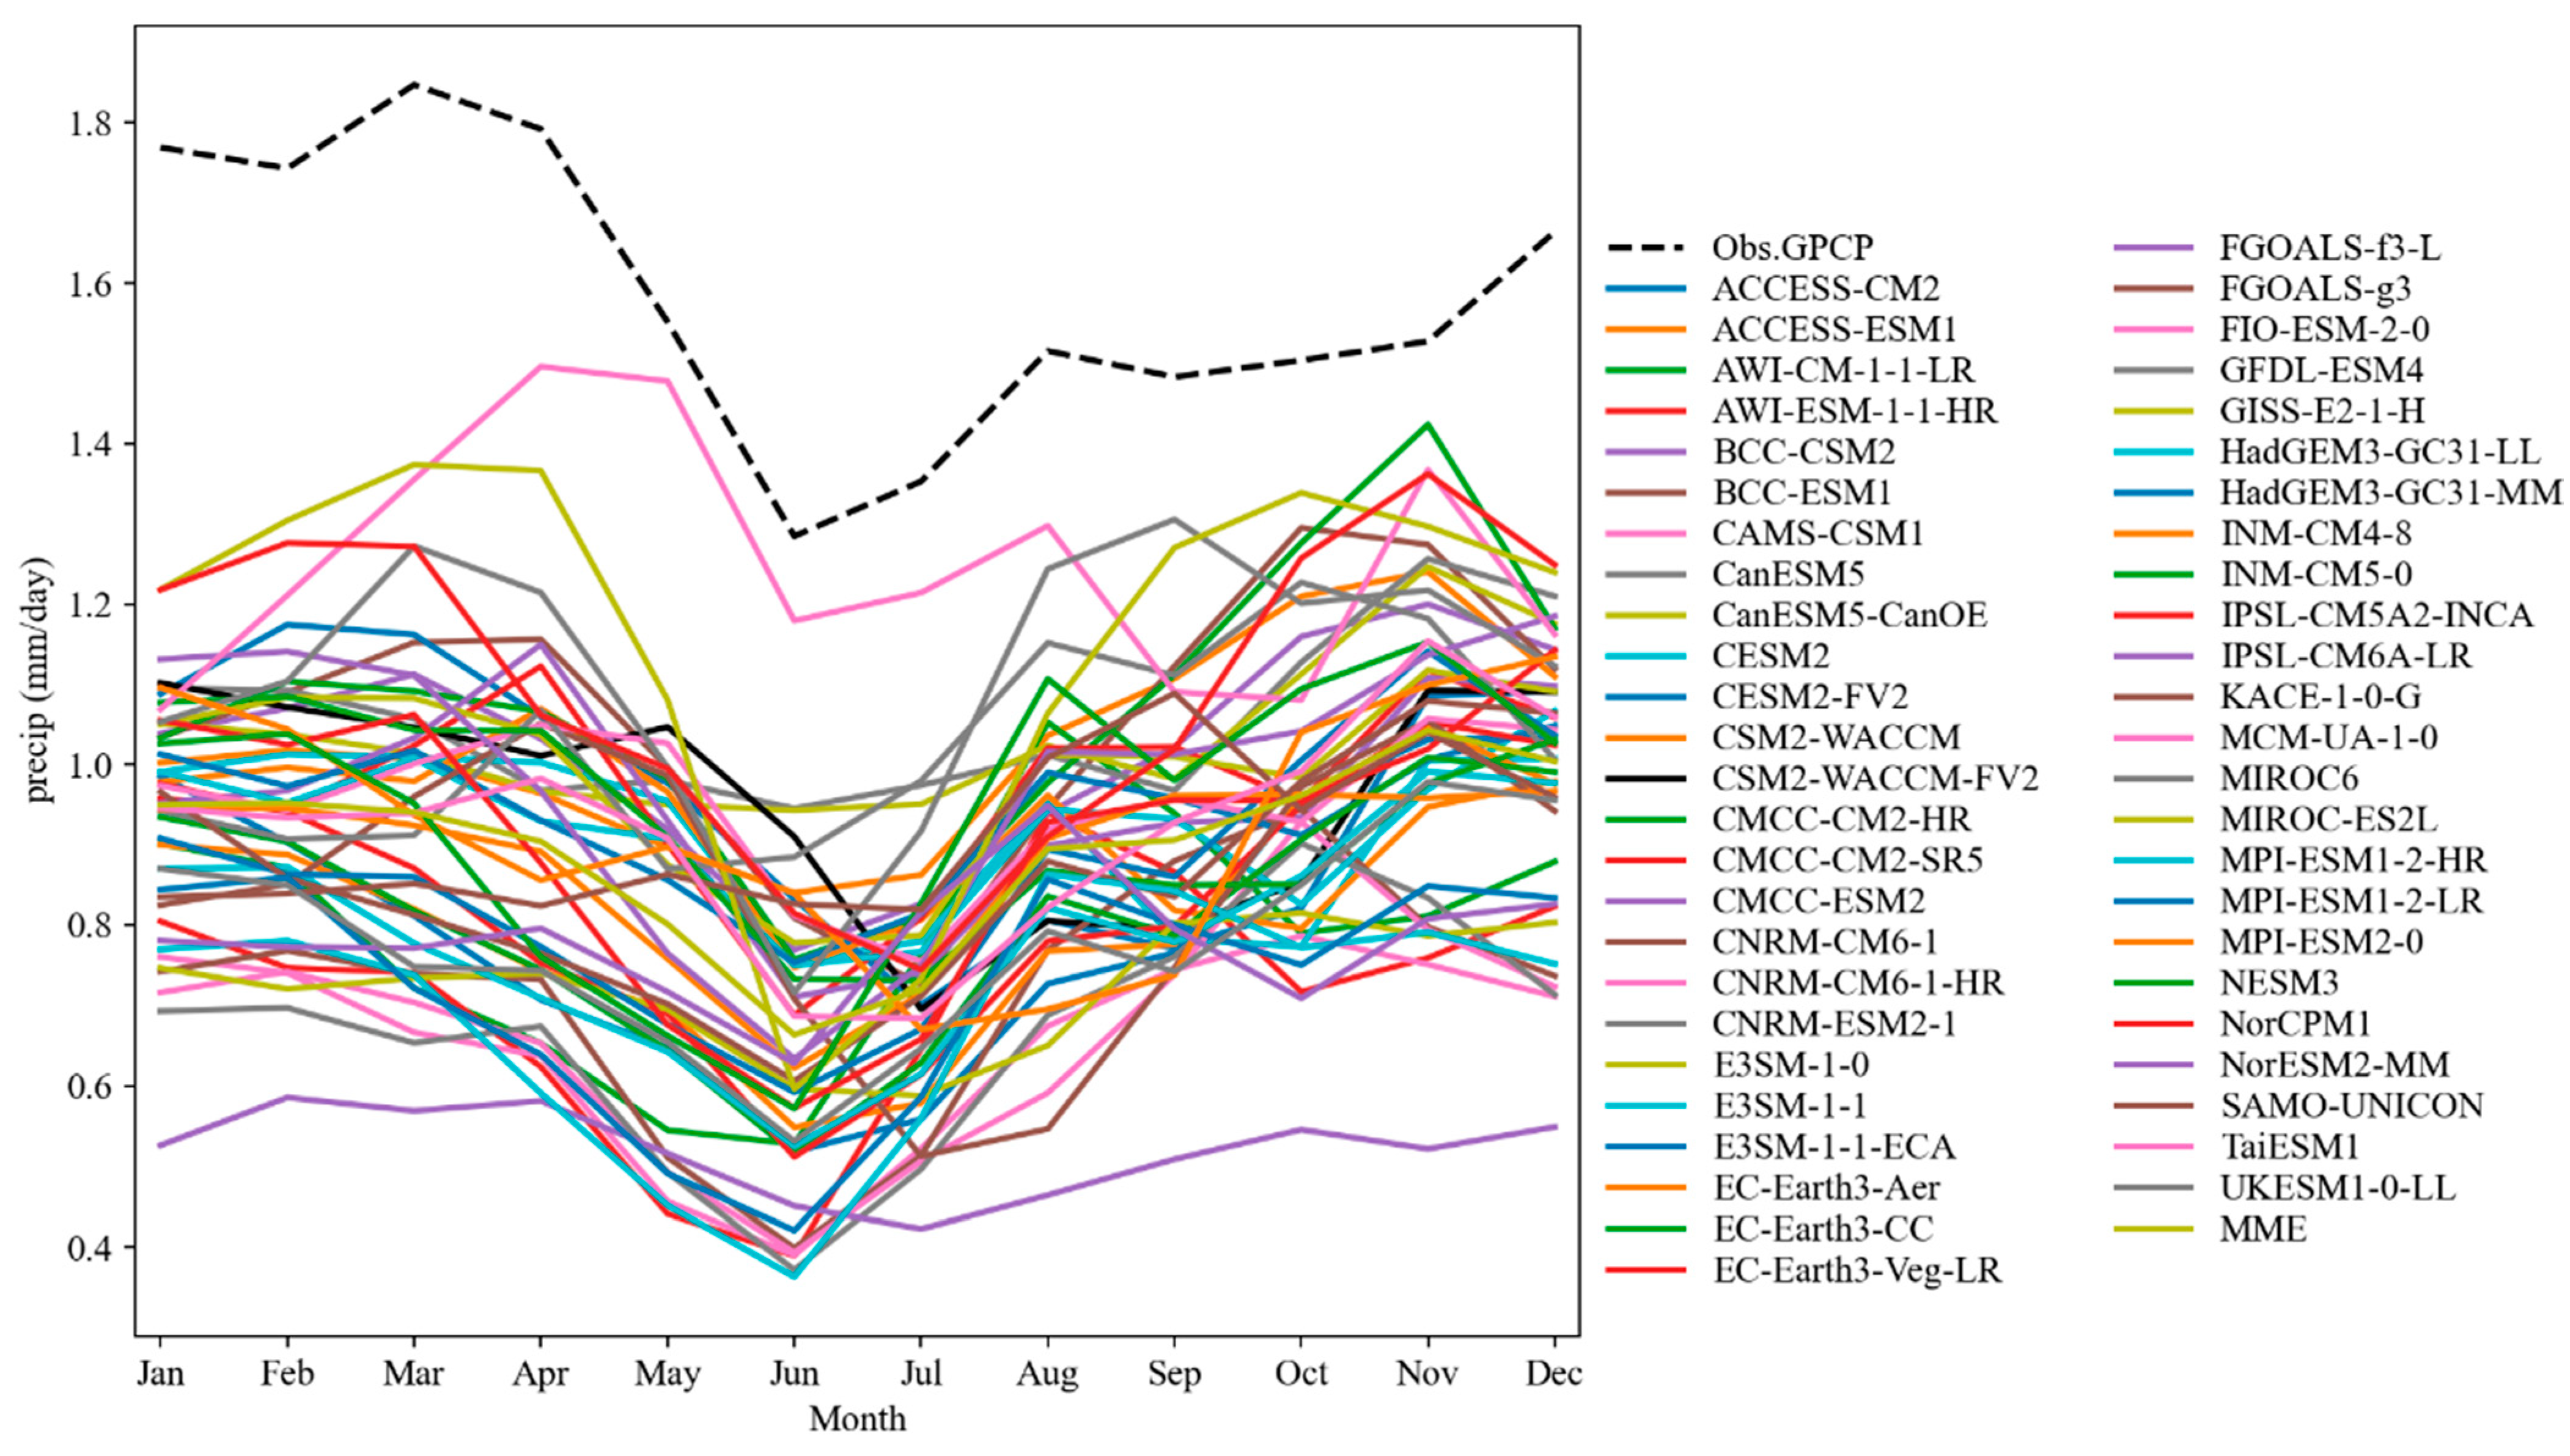
3.2.2. Temporal Variations

Here, we explore the annual mean cycle of the observed GPCP. Next, we compare it with the simulated CMIP6 MME and the 49 individual model products (Figure 5). The interannual variations in the GPCP (black color) and the CMIP6 MME (magenta) showed an increasing trend. However, some of the models showed an increasing trend with GPCP and CMIP6 MME, while a few showed a decreasing trend. Similar results were shown for the MJJASON (Figure S4a), December (Figure S4b), and JFMA (Figure S4c) with increasing (decreasing) trends in simulated precipitation relative to observation. This suggests that some of the CMIP6 models performed better and others were poorer in capturing the interannual variability. Furthermore, fewer models showed overlap or no appreciable difference between the CMIP6 MMEs. Overall, the GCM ensemble showed better results than the individual models. Furthermore, most of the individual models belonging to the same modeling centers typically had similar simulated values in their precipitation anomalies, which was consistent with the literature [6,7,35,49,50].
The annual cycle variations of the MME GCM-simulated precipitation and 49 selected CMIP6 simulations (colored lines) for 1980–2014 are compared with the observation (i.e., GPCP, dotted black line) in Figure 6. In Figure 6, the GPCP’s annual-precipitation cycle begins in boreal winter and peaks in boreal spring (1.85 mm day−1). It ends in boreal summer, with the lowest value in June (1.6 mm day−1). Generally, the precipitation peaks in March and the lowest is in June, which is comparable to most of the GCMs, which had CMIP6 MME peaks in April (1.35 mmday−1) and their lowest values in June (0.7 day−1). The GPCP and CMIP6 MME mimicked the annual cycle well, but all the individual GCMs, including the ensemble mean, were underestimated. The simulated precipitation’s annual cycle matched the observed data in the arid- and semi-arid-climate zones in the NAF and SAF, where the precipitation cycle was unimodal (Figure 6). By contrast, the simulated mean precipitation did not match the observed GPCP in the humid climates in the equatorial region with bimodal annual cycles (Figure 6). Overall, the CMIP6 MME exhibited a much better performance than the majority of the individual models, which was consistent with previous studies [35,47]. Similar results in replicating the annual cycle were revealed by Pimonsree et al. for South-East Asia (SEA) for the period 1975–2014, with 27 GCMs of the CMIP6 [18].

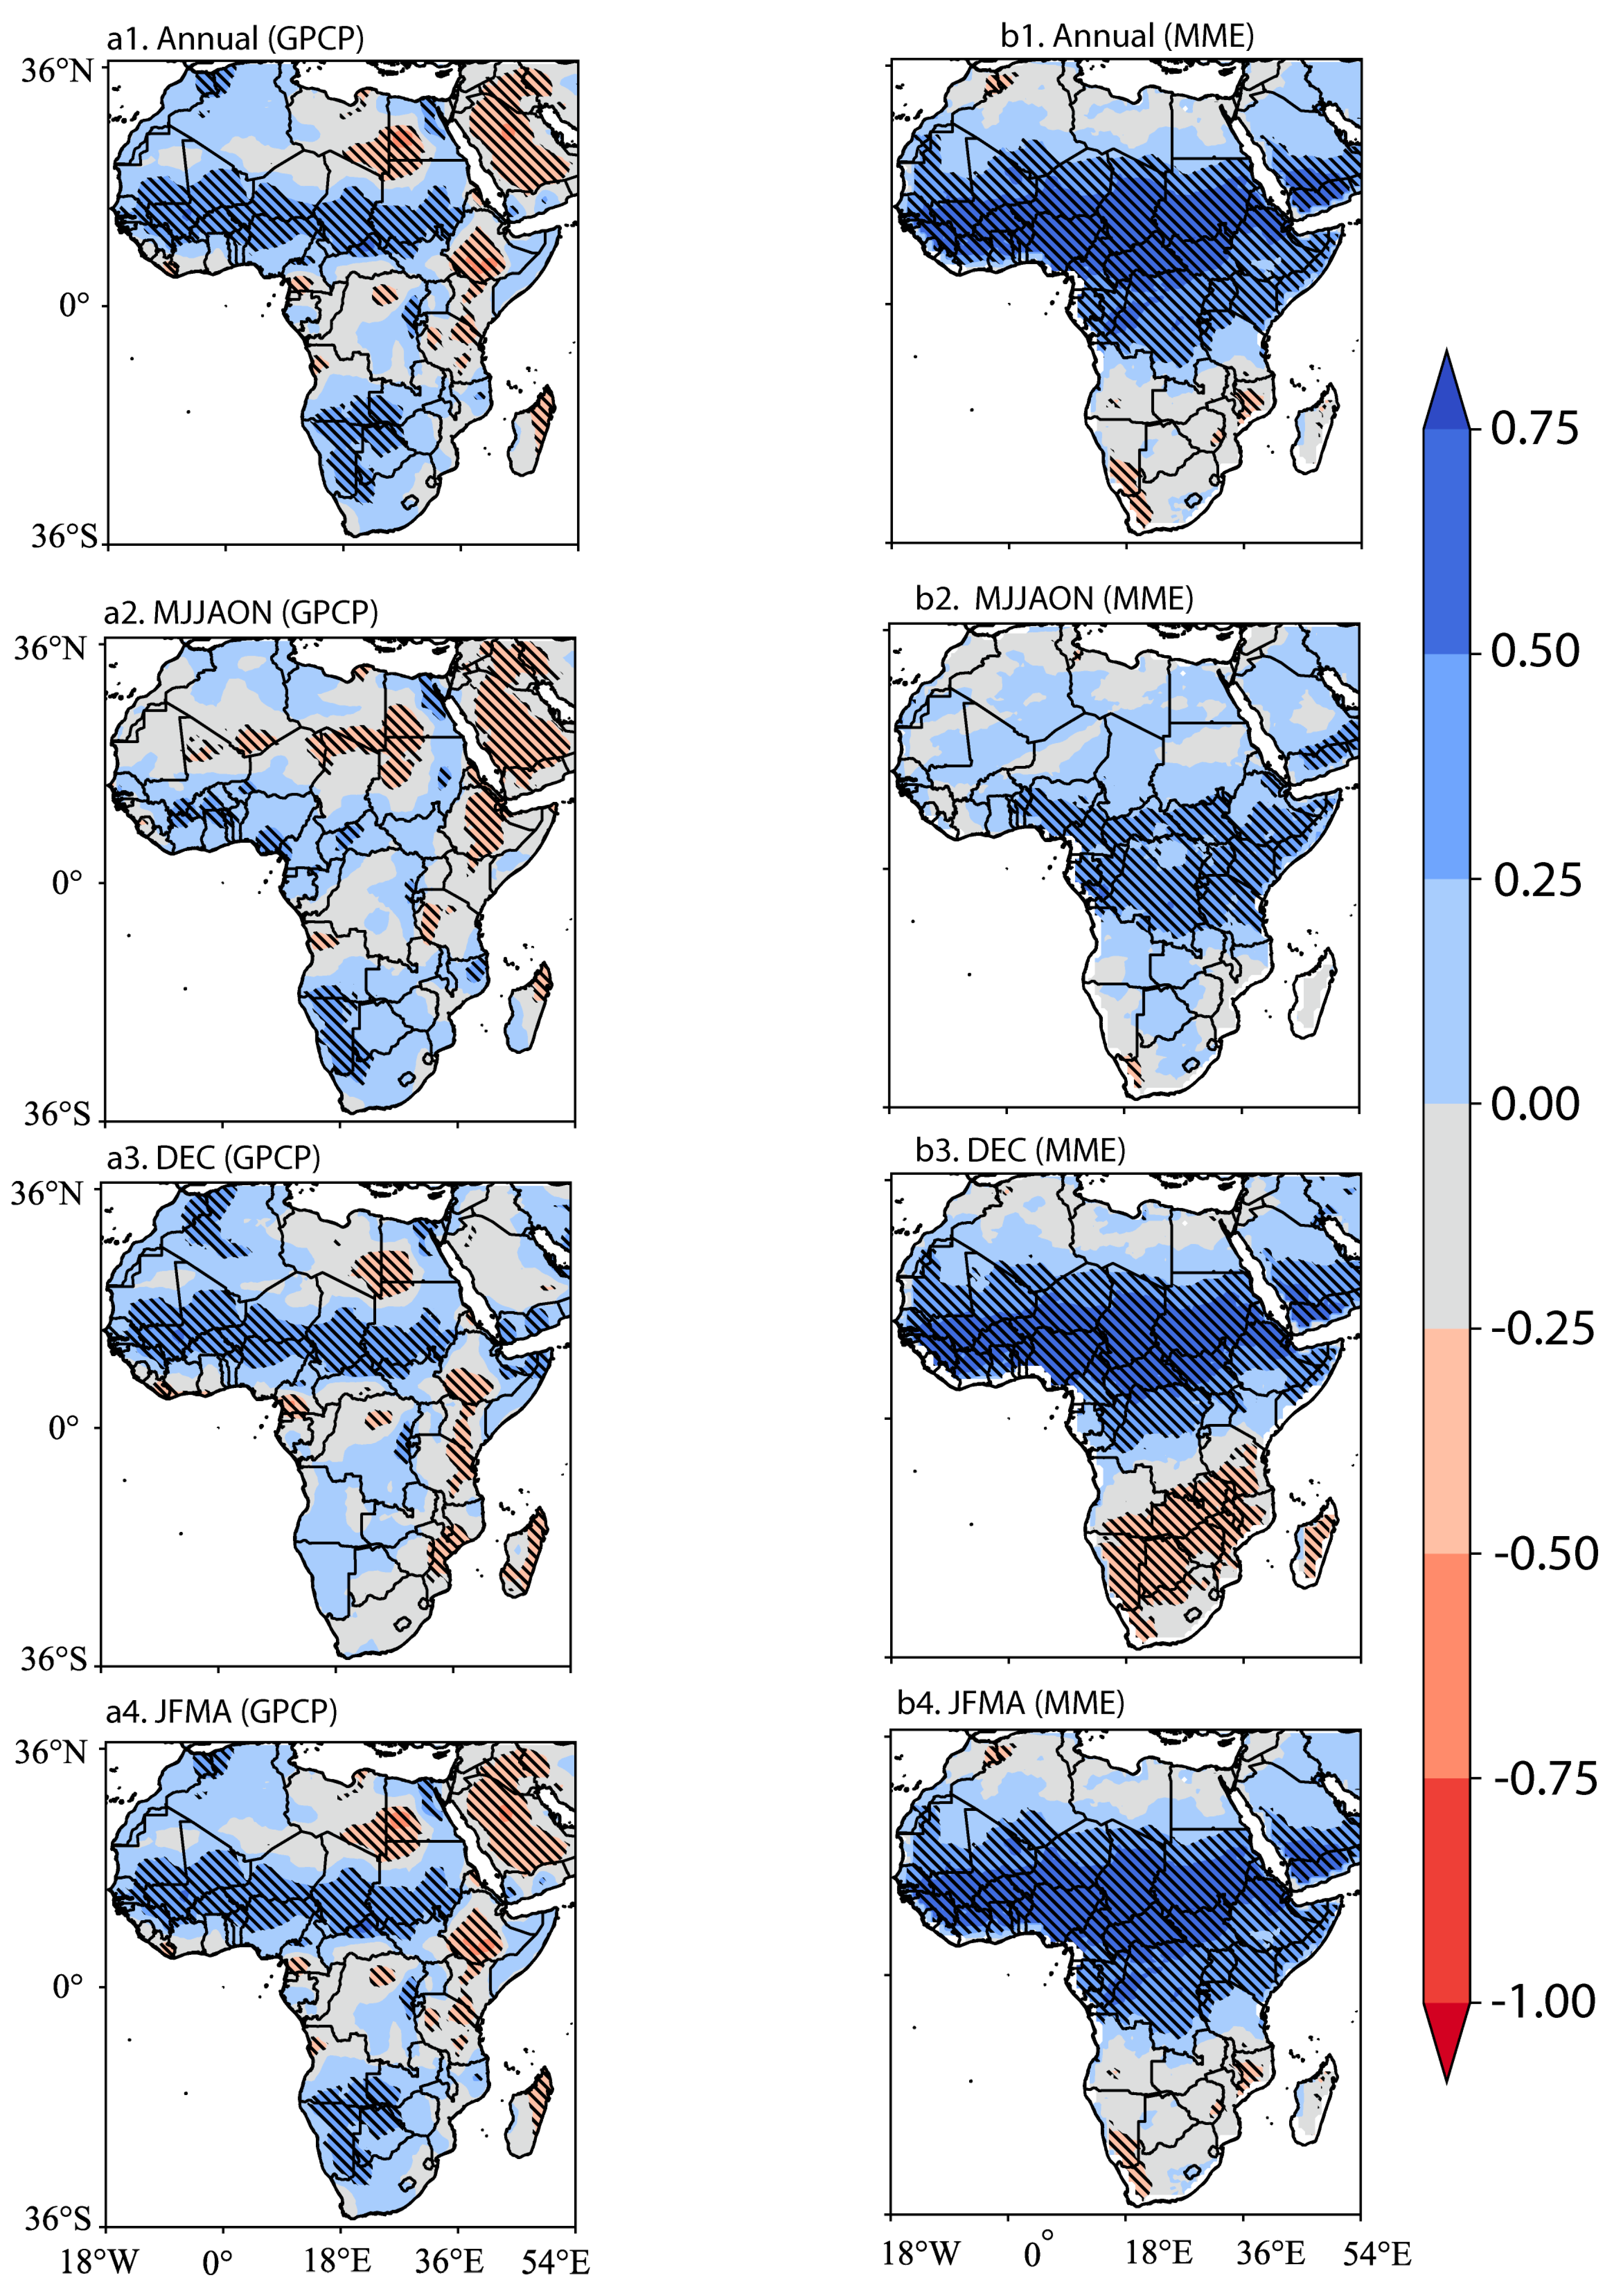
3.3. Linear Trend in Annual and Seasonal Precipitation

Considering the whole study area over the period 1980–2014, the GPCP trend and CMIP6 MME ranges −1.10 to +0.75 mm/decades were computed based on the M-K and Sen’s Slope test (Figure 7). Figure 7(a1–a4) shows the linear trends in the GPCP observations, while Figure 7(b1–b4) shows the equivalent values for the CMIP6 MME. Overall, the results showed that most of the regions across the study areas exhibited differences in their wetting and drying trends between the GPCP and the CMIP6 MME (statistically significant at 0.05).
In arid climates (in 15–30° N) in the NAF, both the GPCP and the CMIP6 MME showed similar trends in wetting/drying, with pockets of mixed wetting (drying) results in both datasets. The Arabian Peninsula showed the opposite results, where the annual trend analysis showed wetting in the CMIP6 MME and drying in the GPCP. Furthermore, similar arid climates in the SAF showed a wetting (drying) trend in the GPCP (CMIP6 MME), with differences in magnitude values. The equatorial region showed a wetting trend in the CMIP6 MME, but mixed results in the GPCP. In Figure 7(a1), the Central Africa Forest region, extending to the interior areas of the East Africa Rift Valley, showed distinct positive (negative) linear trends in the GPCP. However, a resemblance with distinct spatial patterns in the wetting trend was observed in the Sahelian belt, with differences in magnitude (Figure 7(a1,b1)).
The seasonal characteristics of the linear trends are presented. The seasonal characteristics of the monsoon precipitation (MJJASON) in the GPCP (Figure 7(a2,b4)) and the CMIP6 MME ((Figure 7(b2,b4)) showed that the wetting trend in the WAF region was consistent with similar studies conducted in the past [35]. Furthermore, in Figure 7(a2,a4), the drying (wetting) linear trend in the ARP (SAF) contrasts with Figure 7(b2,b4), where a wetting (drying) trend in the Arabian Peninsula (SAF) is displayed. The CMIP6 MME showed wetting in the Sahelian belt, region 5° S in the Central African tropical rainforest regions extending to the Kalahari Desert (25–30° S), and the south-eastern coast of the Mozambique area and Madagascar. In contrast, the observation dataset showed mixed results of wetting (drying) linear trends (Figure 7(a2,b2,a4,b4)). The mixed results of the wetting (drying) in the tropical regions, particularly semi-arid regions, were expected, as previous studies reported uncertainty in climate seasonality in warming climates [68].
In Figure 7(a3,b3), the major differences are shown for the whole Arabian Peninsula and the SAF. The Arabian Peninsula showed wetting trends in both datasets; however, the CMIP6 MME was more pronounced than in the GPCP, while the SAF region showed a wetting (drying) trend in the GPCP (CMIP6 MME). The remaining regions’ results were similar to those of other regions. This result is of high societal importance and provides important information for agricultural-impact analysis. The regional and seasonal differences in wet and dry trends need further studies to determine whether these trends are related to the warming climate or internal/natural variability.

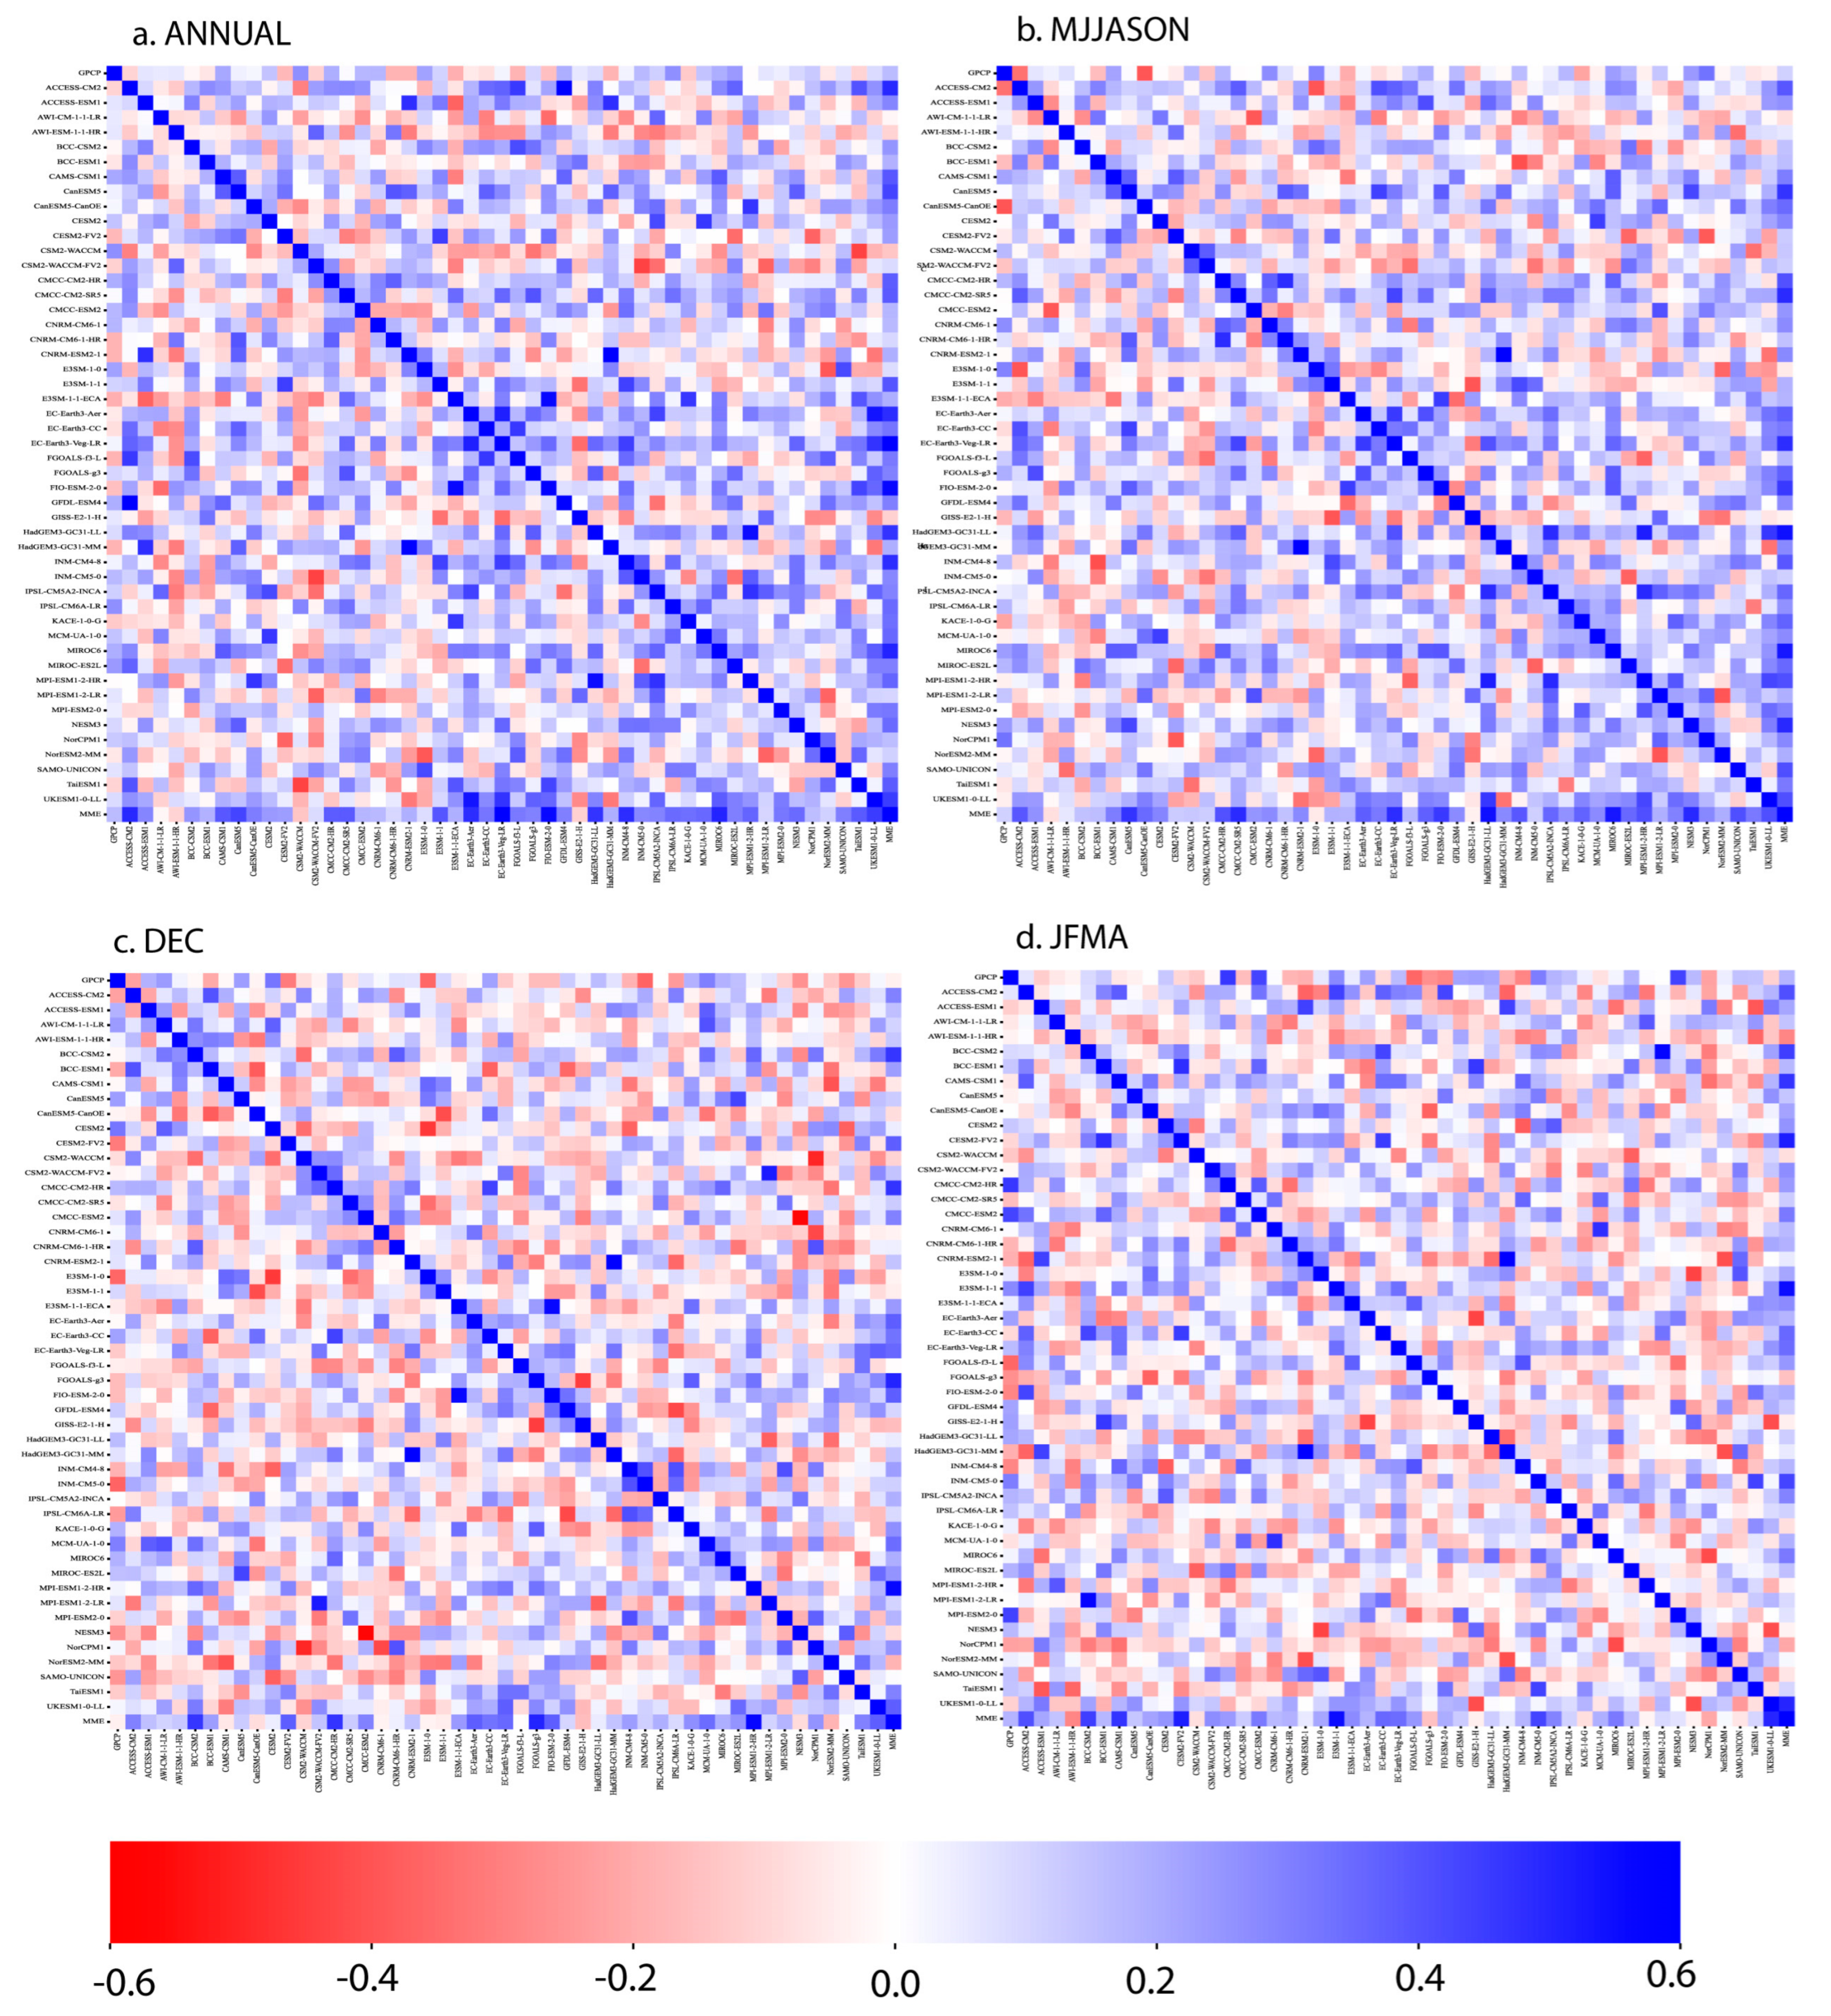
3.4. Temporal Correlation Analysis via Heatmaps

The individual models’ interdependencies, their MME, and the GPCP precipitation were analyzed through the Pearson correlation coefficient. Significant positive correlation coefficients were found among many of the models, whereas significant negative correlation coefficients were obtained within the data. Only two models, i.e., CNRM-ESM2-1 and HadGEM3-GC31-MM), were strongly correlated over time, with a correlation coefficient of 1. It was found that in December (Dec), models such as the CESM2 (0.33), E3SM-1-0 (−0.36), and INM-CM5-0 (−0.36) were significantly correlated with GPCP. During the JFMA season, the CMCC-CM2-HR (0.46), CMCC-ESM2 (0.43), FGOALS-f3-L (−0.36), and MPI-ESM2-0 (0.44) were found to be related to the observation data. Meanwhile, the ACCESS-CM2 (−0.34), CanESM5-CanOE (−0.4), and NorCPM1 (0.33) models were significantly associated during the monsoon period. However, no evidence of a relationship between GPCP and the individual models and their MME over the continent of Africa, including the Arabian Peninsula, were observed at the annual scale. The best-performing GCMs and their ensembles’ mean relative to the GPCP over the study area (as shown by the correlation coefficients) are summarized and presented in Figure 8.

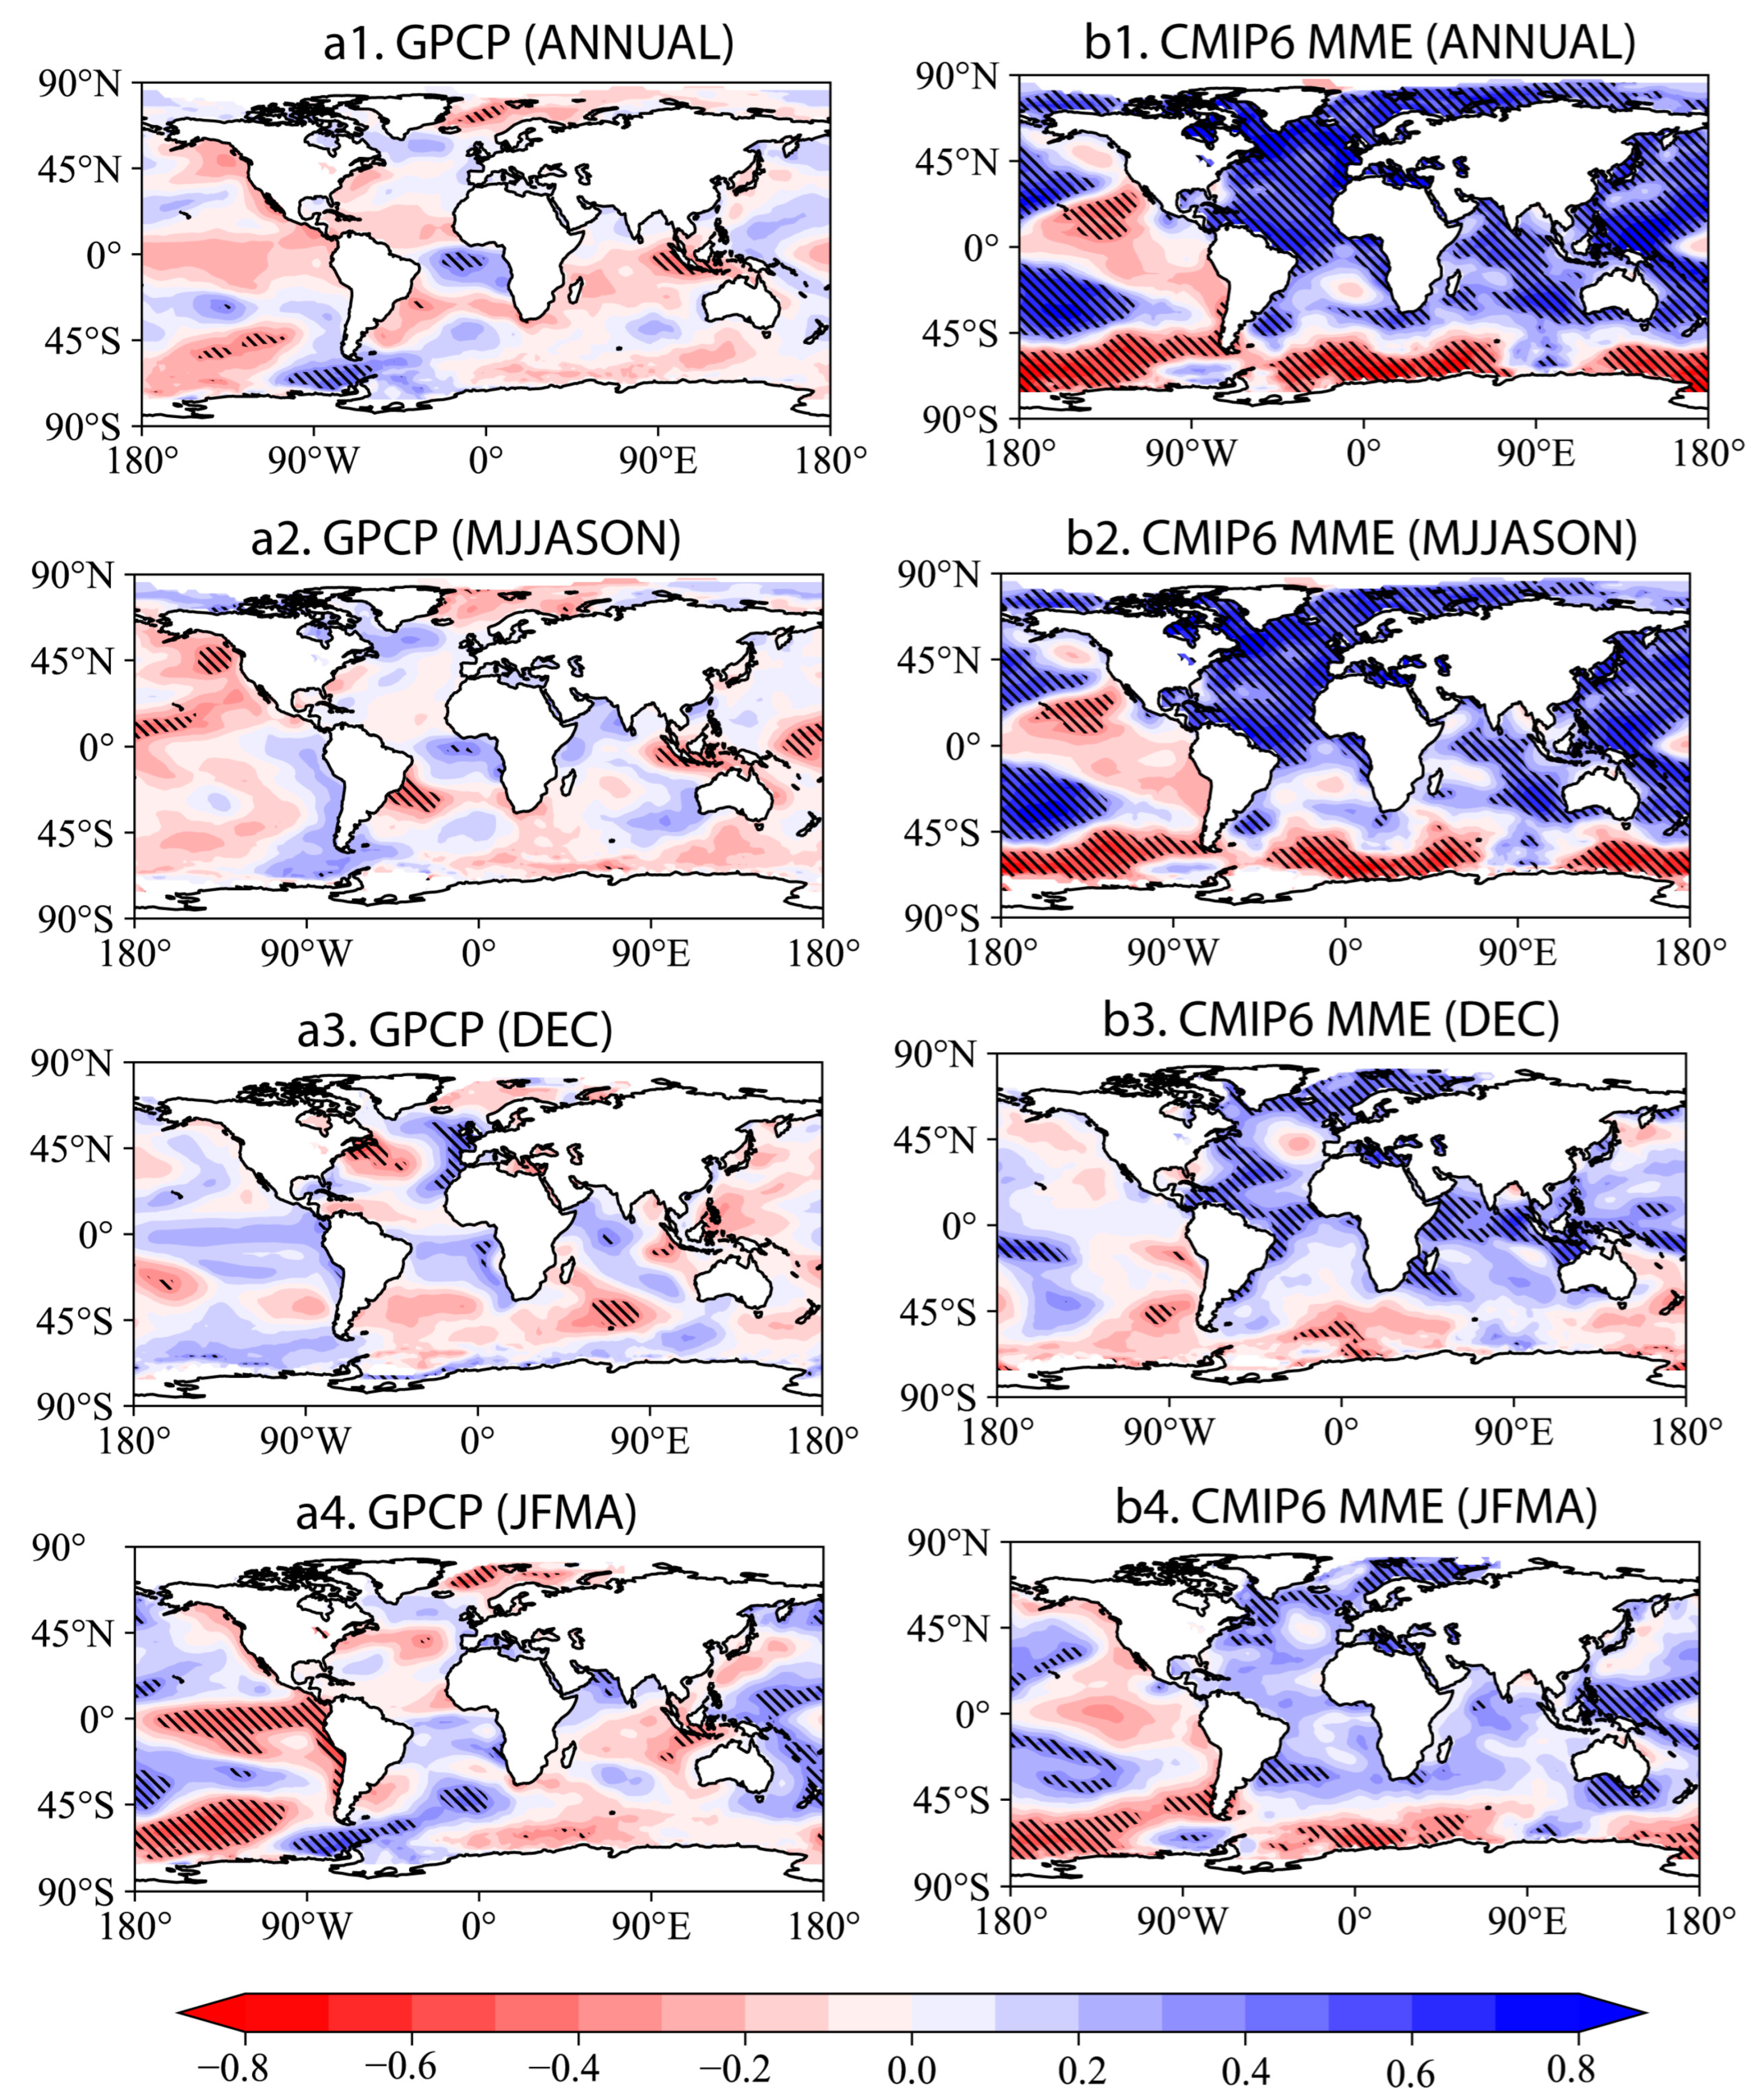
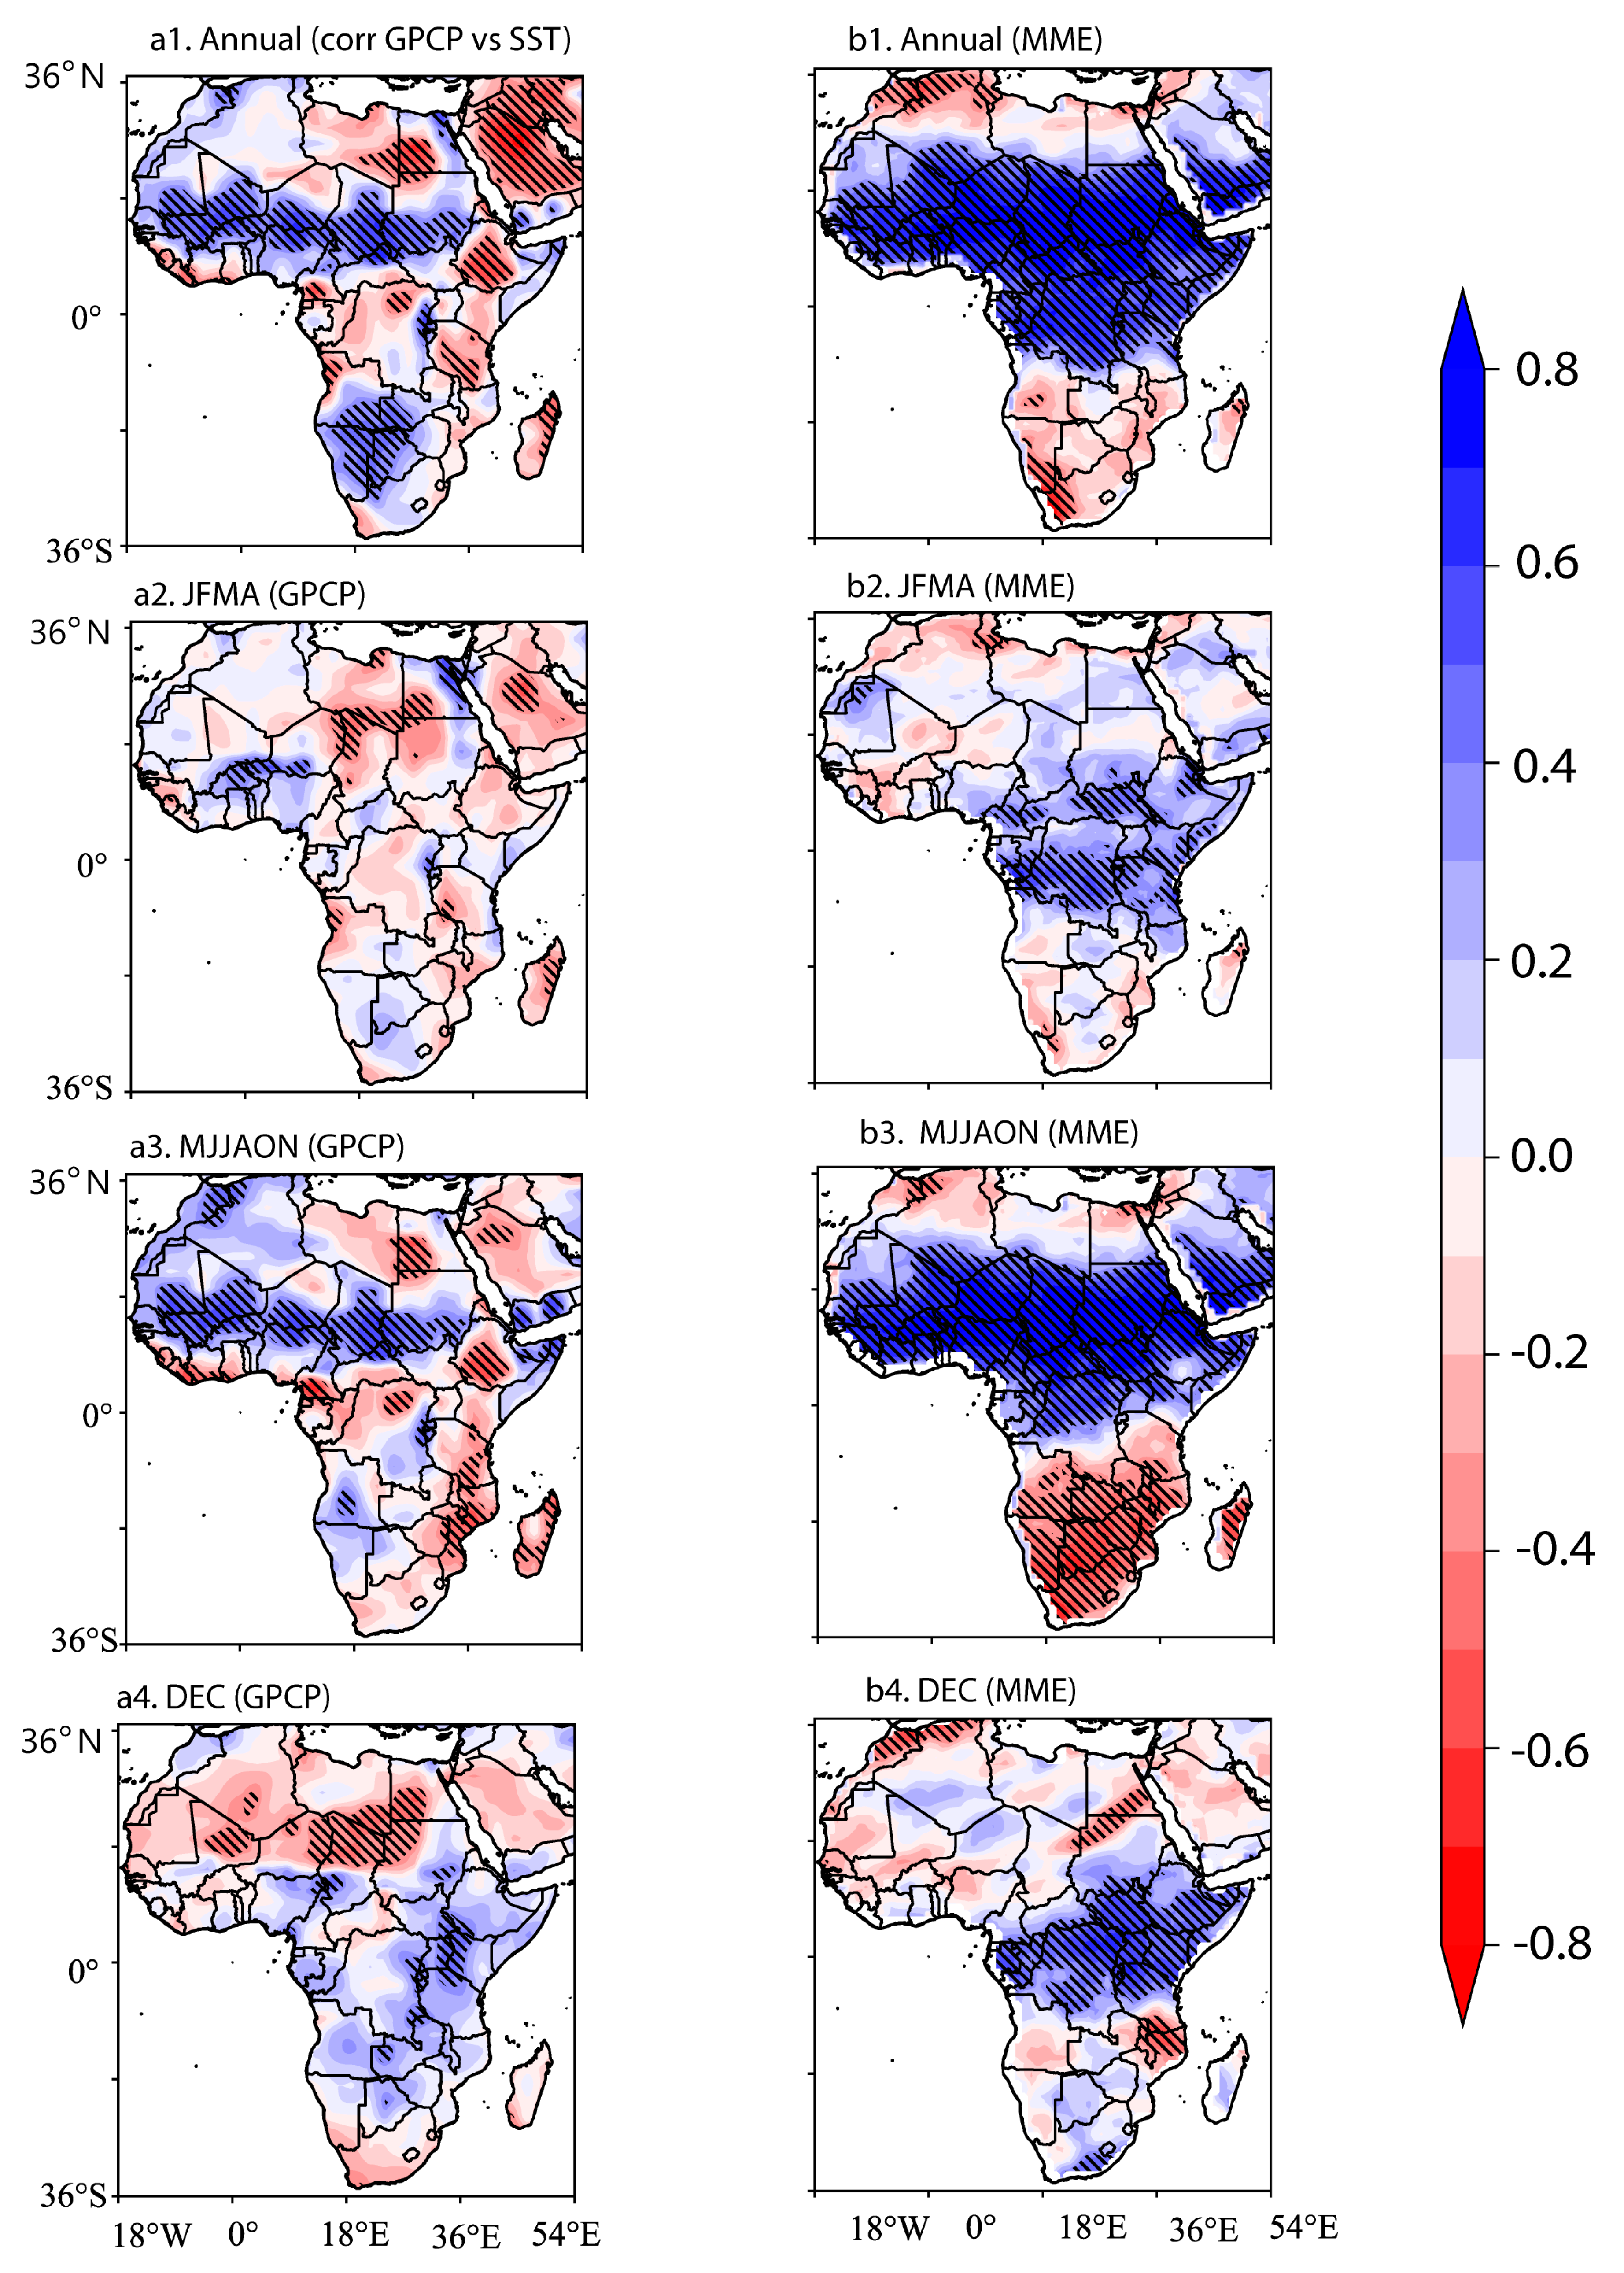
3.5. Relationship between Precipitation and Sea-Surface Temperature (SST)

We computed the interannual and seasonal correlation between the precipitation (CMIP6 MME–observation) and the global sea-surface temperature (SST) (Figure 9). The correlation between precipitation (CMIP6–observation) and the global sea-surface temperature at the annual scale is shown in Figure 9(a1,b1). A positive correlation typically means wetter conditions associated with higher SST values, while a negative correlation is associated with dryer conditions. The CMIP6 MME showed strongly positive (statistically significant) correlations around the tropical Atlantic and Indian Oceans, respectively; the CMIP6 MME related to warm SST favors convective processes, which may increase precipitation. However, the GPCP showed weakly negative but statistically significant correlations for the same geographic region. A few exceptions were found in the equatorial region (25° W–25° E, 0°–15° N), which displayed a positive correlation; however, the CMIP6 MME showed strong statistically significant trends. Most of the regions exhibited an inverse relationship between the GPCP-SST and the CMIP6 MME-SST.
Furthermore, we computed the correlation coefficient between the mean precipitation (GPCP and CMIP MME) and the SST anomalies for different seasons during the period of 1980–2014 (Figure 9(a2–a4,b2–b4)). We observed that both the CMIP6 MME and the GPCP in Figure 9(a2,b2) exhibited a similar spatial-correlation structure between precipitation and SST compared with those in Figure 9(a1,b1). Generally, the inverse relationship between the GPCP-SST and the CMIP6 MME-SST (Figure 9(a2,b2)) exhibited was related to the position of the ITCZ in the CMIP6 models and how the ITCZ was resolved, as reported in previous studies [35]. The observed ITCZ was positioned in the NH around May to August, around 15° N [58].
In the tropical Indian Ocean, positive (negative) correlations were seen in GPCP (CMIP6 MME) in February and March, and the observed ITCZ was positioned in the SH [57]. In December (Figure 9(a3,b3)) and the JFMA (Figure 9(a4,b4)), both the CMIP6 MME and the GPCP exhibited a similar spatial correlation structure. Overall, in the equatorial region (25° W–25° E, 0–15° N), positive values were shown in both datasets. A similar relationship was observed between the Indian-summer-monsoon rainfall (ISMR) and its SST at different timescales when Konda et al. [19] analyzed the ensemble of 30 GCMs from the CMIP6.
The spatial distributions of the correlation coefficients of the GPCP and the CMIP6 MME PREC (i.e., annual and seasonal) and SST during 1980–2014 were computed over land (Figure 10). To a large extent, similar correlation patterns are shown in Figure 10(a1,a2,b1,b2). Both showed that the spatial patterns of the CMIP6 MME tended to be closer to the GPCP and with corresponding magnitudes (correlation coefficients of −0.80 and +0.80). Overall, the major differences in the direction and magnitude of the spatial correlation were observed in NAF (i.e., 15–30° N) and the Arabian Peninsula, the Guinea Coast extending towards the Central Africa Forest region and the interior areas of EAF (26–52° E, 10° S–5° N), the Kalahari Desert, and the south-eastern coast of the Mozambique area and Madagascar (25–30° S). In contrast, we observed distinct spatial patterns in the positive correlations in the Sahelian belt (Figure 10(a1,b1)), suggesting the Sahelian belt (with its semi-arid climate) as spots as both datasets were well reproduced by the spatial correlation. However, the absolute values of correlation were slightly lower in the GPCP. Similar results are shown in Figure 10(a3,a4) and Figure 10(b3,b4), respectively. In contrast, the GPCP and CMIP6 MME reproduced almost the same correlation pattern, with corresponding magnitudes, in the WAF and SAF regions.
Similarly, we computed the spatial distributions of the correlation coefficients of 49 individual models annually (Figure 11) and seasonally (Figures S5–S8) between the simulated precipitation and the SST from 1980 to 2014. We observed a more homogeneous spatial correlation among many of the individual models (r > 0.7), with arid and semi-arid climates showing negative and humid climates showing positive values. Overall, the individual CMIP6 models better matched the observed GPCP in the semi-arid and arid climates, despite differences in the magnitude of the correlation values. A major difference in the humid climates, especially around the equatorial region, extending towards the Horn of Africa region, was observed. These discrepancies were pronounced at the seasonal scale (Figures S5–S8), and the trends in the variability were consistent with the complex interactions of the different models’ physics [7,35].

4. Summary and Conclusions

This study evaluated the performances of 49 CMIP6 GCMs over the African continent and Arabian Peninsula compared with satellite-based observed data (i.e., GPCP) during 1980–2014. A Taylor diagram was used to quantify the CMIP6 MME and the 49 models’ ability to simulate the precipitation relative to the observed data. In the spatial and temporal climatology, linear trends were examined to compare how well the GCMs replicated the precipitation at the annual and seasonal scales. The spatial correlation was computed to determine the relationship between the precipitation and the global SST.
We summarize the key findings as follows:
  • The CMIP6 MME exhibited a much better performance than the majority of the individual models.
  • The CMIP6 MME reproduced the spatial pattern of the African monsoon more realistically than the majority of the GCMs. The CMIP6 MME and the GCMs exhibited a better ability to replicate the simulated precipitation in arid and semi-arid conditions in the NAF, Arabian Peninsula, SAF, and pockets of the EAF and the Sahelian belt. However, the model’s performance was low in humid regions along the Guinean Coast of the WAF, extending to the 5° S in the CEF.
  • Most of the models reproduced pre-monsoon precipitation (i.e., December and JFMA) better than monsoon precipitation (MJJASON), suggesting that GCMs exhibit poor performance in simulating the spatial patterns of precipitation in monsoon seasons than in pre-monsoon seasons. In particular, individual models from the same modeling centers exhibited similarities in replicating wet (dry) precipitation bias at seasonal scales, suggesting dependence on the sharing of model physics and configurations.
  • Regarding which GCMs are superior in replicating spatial and temporal variations, model sub-setting is encouraged, as most of the GCMs’ performances in reproducing precipitation were region- and season-specific. These seasonal differences are more insightful and provide significant information for agricultural-impact analysis. Depending on the application, model sub-selection is strongly encouraged.
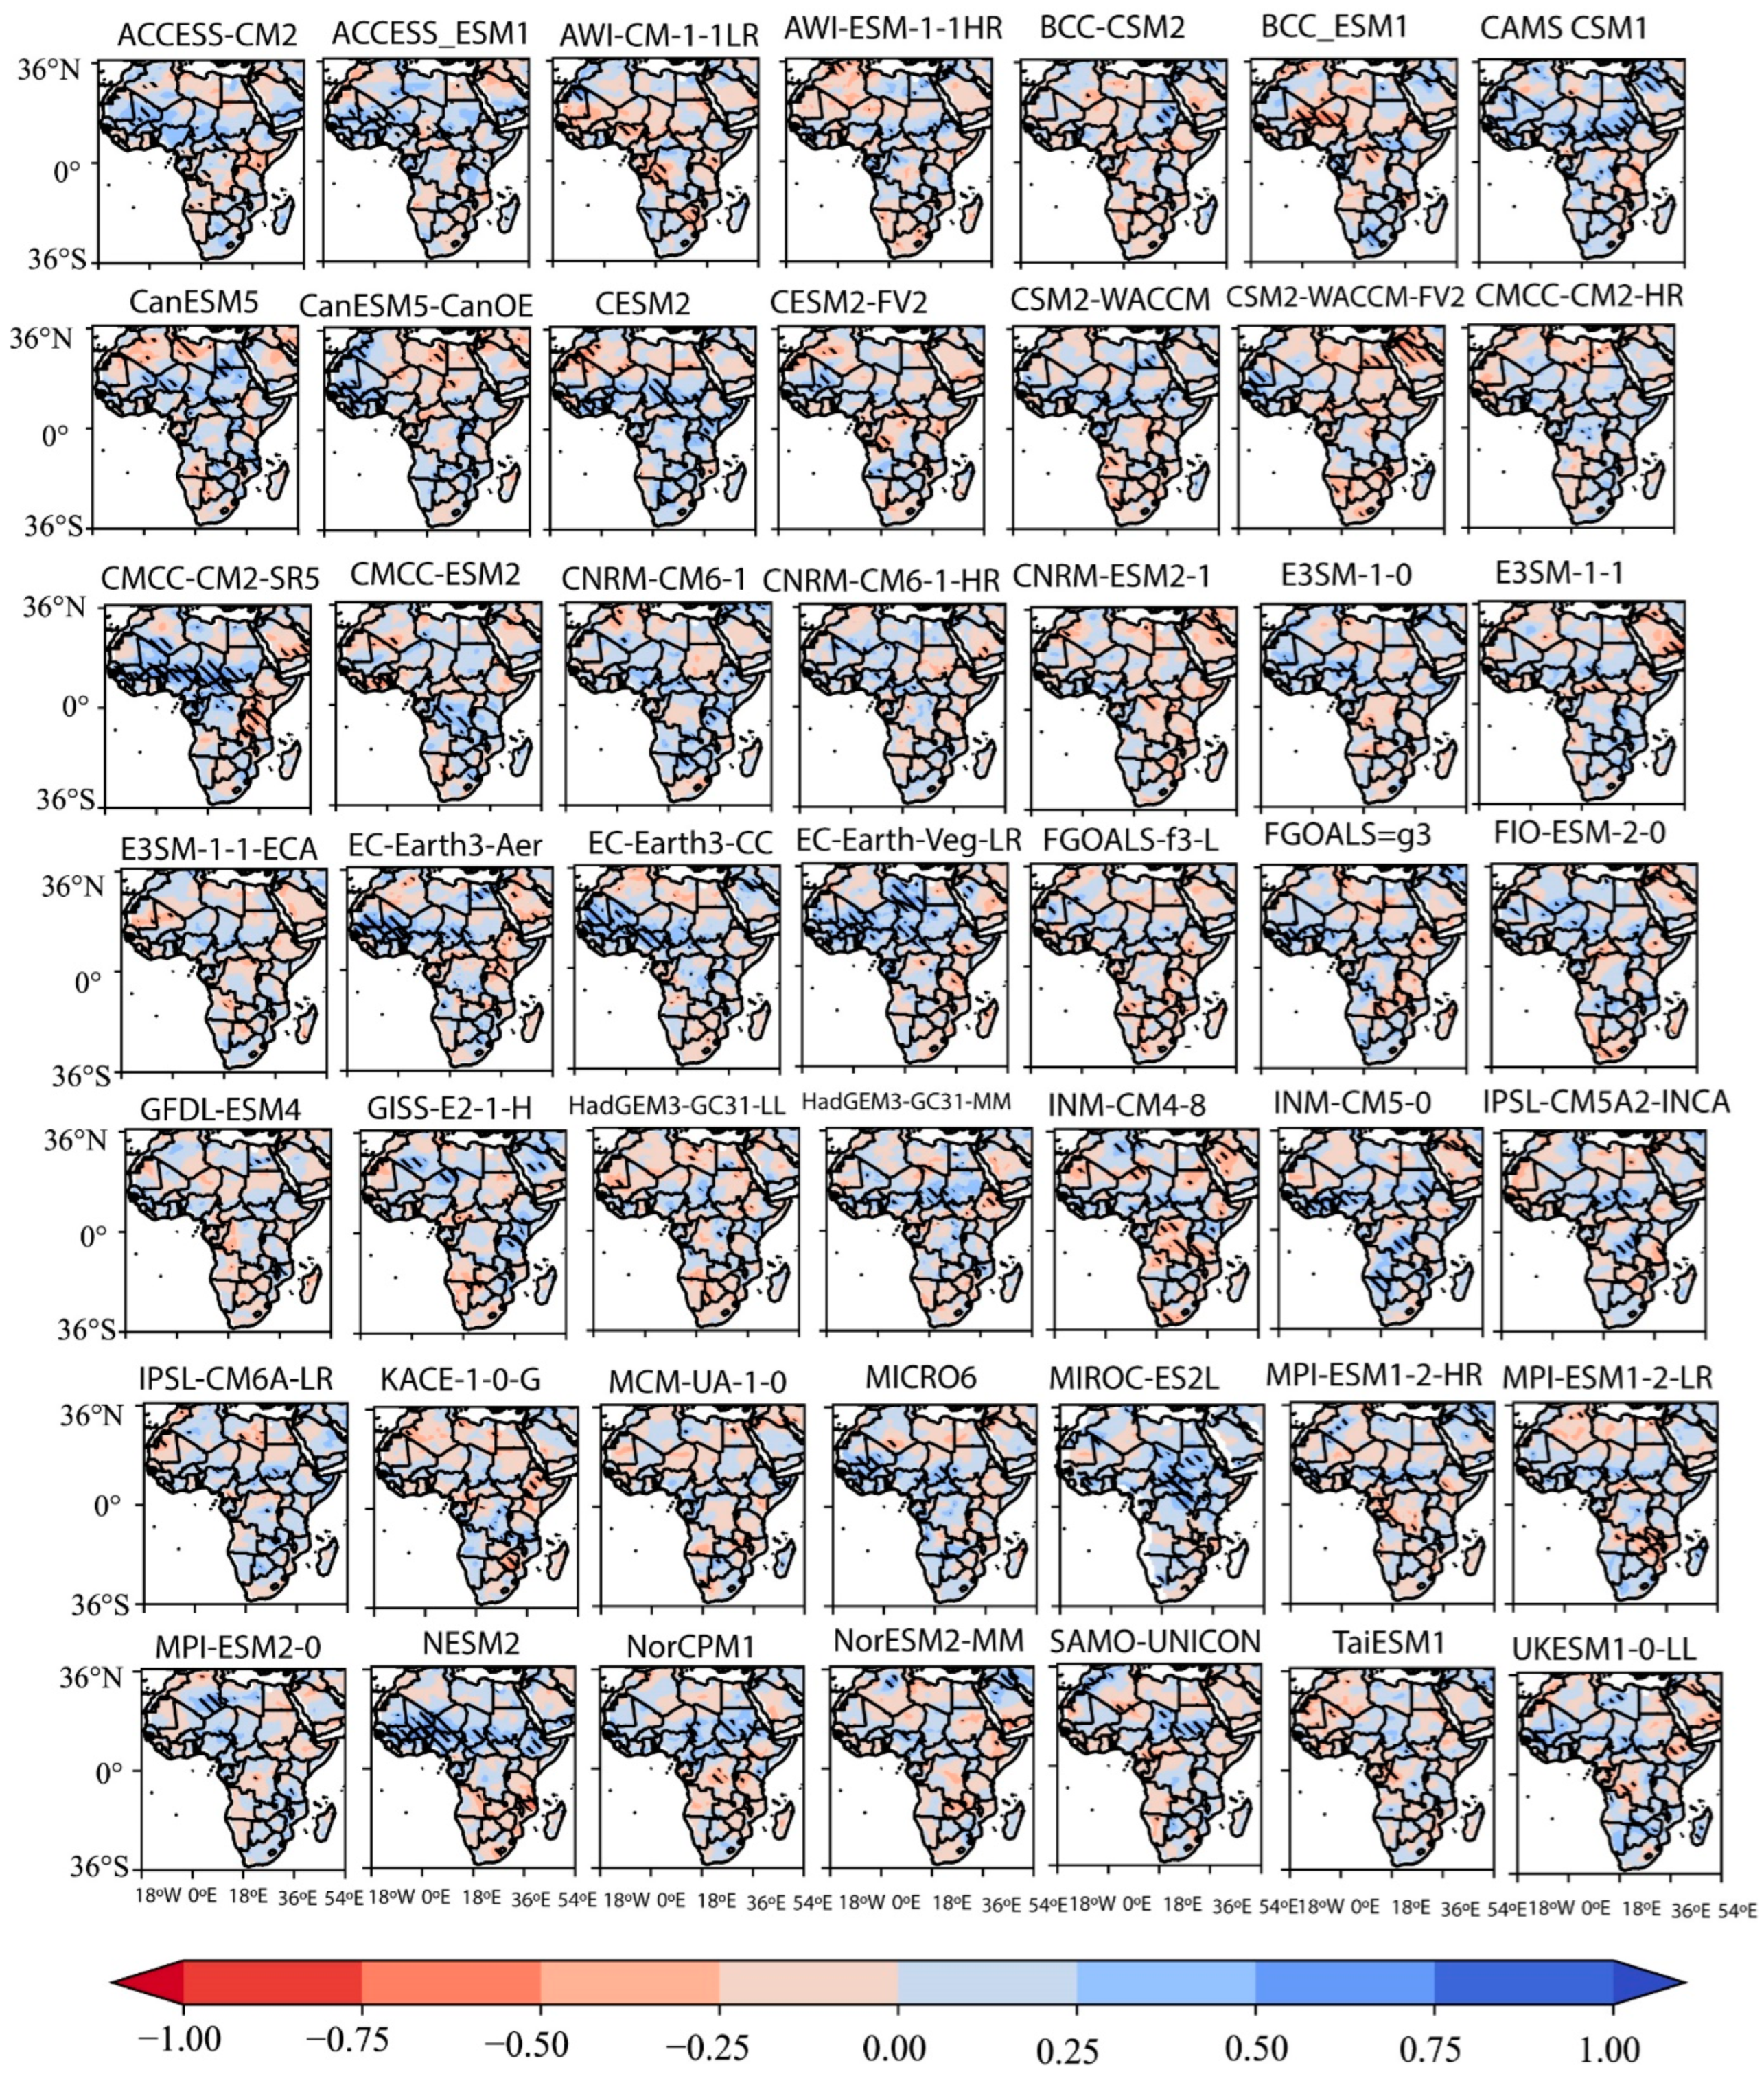
  • Furthermore, the GPCP exhibited a more heterogenous spatial correlation, and the CMIP6 MME showed a more homogeneous spatial correlation, in the equatorial region (at both annual and seasonal scales). Few of the models showed more heterogenous spatial correlations, while the majority showed homogeneous spatial correlations.
This study demonstrated the GCMs’ performances in simulating precipitation patterns, magnitudes, and trends and the correlation with major circulation features at annual and seasonal scales. Most of the models reproduced pre-monsoon precipitation (i.e., December and JFMA) better than monsoon precipitation (MJJASON) in the tropics; this was related to GCMs’ drawbacks in predicting convective precipitation. The differences exhibited by the individual GCMs highlight the significance of each model’s unique dynamics and physics. This study provides a framework for further research into the future effects of climate change and human adaptation and mitigation strategies. Therefore, it allows the selection of appropriate models tailored to specific climate regions and for various applications. Readers are advised to interpret these results with caution as the inferences are subject to considerable uncertainties, and any further studies should perform bias correction to minimize these uncertainties. This is necessary when determining the patterns and trends for sustainable development and future adaptation measurements.

Supplementary Materials

The following supporting information can be downloaded at: https://www.mdpi.com/article/10.3390/atmos14030607/s1, Figure S1. Spatial distribution of MJJASON mean precipitation in 49 selected models from 1980 to 2014. Figure S2. Spatial distribution of DEC mean precipitation in 49 selected models during 1980–2014. Figure S3. Spatial distribution of JFMA mean precipitation in 49 selected models during 1980–2014. Figure S4. Seasonal variations in observation (i.e., GPCP, black line), CMIP6 MME, and 49 CMIP6-simulated precipitation anomalies from 1980 to 2014 across Africa and the Arabian Peninsula. Anomalies are calculated through the mean over the period. Figure S5. Spatial distributions of correlation coefficients of 49 selected CMIP6 models and SST during 1980–2014 in MJJASON. Hatched area indicates a 95% confidence level. Figure S6. Spatial distributions of correlation coefficients of 49 selected CMIP6 models and SST during 1980–2014, in December. Hatched area indicates a 95% confidence level. Figure S7. Spatial distributions of correlation coefficients of 49 selected CMIP6 models and SST during 1980–2014 at JFMA. Hatched area indicates a 95% confidence level.

Author Contributions

Conceptualization, I.K.N., F.K.O. and J.L.; methodology, I.K.N. and F.K.O.; software, I.K.N. and F.K.O.; validation, I.K.N., F.K.O. and J.L.; formal analysis, I.K.N. and F.K.O.; investigation, I.K.N. and F.K.O.; data curation, I.K.N., F.K.O., G.T.G. and A.A.S.C.; writing—original draft preparation, I.K.N.; writing—review and editing, G.T.G., A.A.S.C. and F.M.N.; visualization, G.T.G., A.A.S.C. and F.M.N. All authors have read and agreed to the published version of the manuscript.

Funding

This research received no external funding.

Institutional Review Board Statement

Not applicable.

Informed Consent Statement

Not applicable.

Data Availability Statement

The dataset used in this study is publicly available. The GPCP and CMIP6 data can be downloaded at https://www.ncei.noaa.gov/data/global-precipitation-climatology-project-gpcp-monthly/access/ accessed on 10th May 2022 and https://esgf-node.llnl.gov/search/cmip6 accessed on 22 January 2023 respectively. The SST data is at http://ghrsst.jpl.nasa.gov/GHRSST_product_table.html accessed on 22 January 2023.

Acknowledgments

We acknowledge the administrative and technical support provided by the School of Atmospheric Science and Remote Sensing, Wuxi University. In addition, we thank the developers, managers, and funding agencies of GPCP, CMIP6, and the GHRSST-GDAC at the JPL PO DAAC for granting access to these datasets, in accordance with their specific data-use and citation policies.

Conflicts of Interest

The authors declare no conflict of interest.

References

  1. IPCC. Climate Change 2021: The Working Group I Contribution to the Sixth Assessment Report; Cambridge University Press: Cambridge, UK, 2023. [Google Scholar]
  2. IPCC. The Working Group II contribution, Climate Change 2022: Impacts, Adaptation and Vulnerability; Cambridge University Press: Cambridge, UK, 2022. [Google Scholar]
  3. Dosio, A.; Jury, M.W.; Almazroui, M.; Ashfaq, M.; Diallo, I.; Engelbrecht, F.A.; Klutse, N.A.B.; Lennard, C.; Pinto, I.; Sylla, M.B.; et al. Projected future daily characteristics of African precipitation based on global (CMIP5, CMIP6) and regional (CORDEX, CORDEX-CORE) climate models. Clim. Dyn. 2021, 57, 3135–3158. [Google Scholar] [CrossRef]
  4. Sun, Q.; Miao, C.; Duan, Q.; Ashouri, H.; Sorooshian, S.; Hsu, K.-L. A Review of Global Precipitation Data Sets: Data Sources, Estimation, and Intercomparisons. Rev. Geophys. 2018, 56, 79–107. [Google Scholar] [CrossRef] [Green Version]
  5. Adler, R.F.; Sapiano, M.R.P.; Huffman, G.J.; Wang, J.-J.; Gu, G.; Bolvin, D.; Chiu, L.; Schneider, U.; Becker, A.; Nelkin, E.; et al. The Global Precipitation Climatology Project (GPCP) Monthly Analysis (New Version 2.3) and a Review of 2017 Global Precipitation. Atmosphere 2018, 9, 138. [Google Scholar] [CrossRef] [PubMed] [Green Version]
  6. O'Neill, B.C.; Tebaldi, C.; van Vuuren, D.P.; Eyring, V.; Friedlingstein, P.; Hurtt, G.; Knutti, R.; Kriegler, E.; Lamarque, J.F.; Lowe, J.; et al. The Scenario Model Intercomparison Project (ScenarioMIP) for CMIP6. Geosci. Model Dev. 2016, 9, 3461–3482. [Google Scholar] [CrossRef] [Green Version]
  7. Eyring, V.; Bony, S.; Meehl, G.A.; Senior, C.A.; Stevens, B.; Stouffer, R.J.; Taylor, K.E. Overview of the Coupled Model Intercomparison Project Phase 6 (CMIP6) experimental design and organization. Geosci. Model Dev. 2016, 9, 1937–1958. [Google Scholar] [CrossRef] [Green Version]
  8. Ebert, E.E.; Janowiak, J.E.; Kidd, C. Comparison of Near-Real-Time Precipitation Estimates from Satellite Observations and Numerical Models. Bull. Am. Meteorol. Soc. 2007, 88, 47–64. [Google Scholar] [CrossRef] [Green Version]
  9. Zong-Ci, Z.; Yong, L.; Jian-Bin, H. A Review on Evaluation Methods of Climate Modeling. Adv. Clim. Chang. Res. 2013, 4, 137–144. [Google Scholar] [CrossRef]
  10. Almazroui, M.; Saeed, F.; Saeed, S.; Nazrul Islam, M.; Ismail, M.; Klutse, N.A.B.; Siddiqui, M.H. Projected Change in Temperature and Precipitation Over Africa from CMIP6. Earth Syst. Environ. 2020, 4, 455–475. [Google Scholar] [CrossRef]
  11. Lim Kam Sian, K.T.C.; Wang, J.; Ayugi, B.O.; Nooni, I.K.; Ongoma, V. Multi-Decadal Variability and Future Changes in Precipitation over Southern Africa. Atmosphere 2021, 12, 742. [Google Scholar] [CrossRef]
  12. Babaousmail, H.; Hou, R.; Ayugi, B.; Ojara, M.; Ngoma, H.; Karim, R.; Rajasekar, A.; Ongoma, V. Evaluation of the Performance of CMIP6 Models in Reproducing Rainfall Patterns over North Africa. Atmosphere 2021, 12, 475. [Google Scholar] [CrossRef]
  13. Faye, A.; Akinsanola, A.A. Evaluation of extreme precipitation indices over West Africa in CMIP6 models. Clim. Dyn. 2022, 58, 925–939. [Google Scholar] [CrossRef]
  14. Ajibola, F.; Zhou, B.; Gnitou, G.; Onyejuruwa, A. Evaluation of the performance of CMIP6 HighResMIP on West African precipitation. Atmosphere 2020, 11, 1053. [Google Scholar] [CrossRef]
  15. Akinsanola, A.A.; Ongoma, V.; Kooperman, G.J. Evaluation of CMIP6 models in simulating the statistics of extreme precipitation over Eastern Africa. Atmos. Res. 2021, 254, 105509. [Google Scholar] [CrossRef]
  16. Ayugi, B.; Dike, V.; Ngoma, H.; Babaousmail, H.; Mumo, R.; Ongoma, V. Future Changes in Precipitation Extremes over East Africa Based on CMIP6 Models. Water 2021, 13, 2358. [Google Scholar] [CrossRef]
  17. Woolnough, S.J.; Slingo, J.M.; Hoskins, B.J. The relationship between convection and sea surface temperature on intraseasonal time scale. J. Clim. 2000, 13, 2086–2104. [Google Scholar] [CrossRef]
  18. Pimonsree, S.; Kamworapan, S.; Gheewala, S.; Thongbhakdi, A.; Prueksakorn, K. Evaluation of CMIP6 GCMs performance to simulate precipitation over Southeast Asia. Atmos. Res. 2022, 282, 106522. [Google Scholar] [CrossRef]
  19. Konda, G.; Vissa, N.K. Evaluation of CMIP6 models for simulations of surplus/deficit summer monsoon conditions over India. Clim. Dyn. 2023, 60, 1023–1042. [Google Scholar] [CrossRef]
  20. Ding, Y.; Jiang, C.; Zhou, Z.; Gao, T.; Wang, S.; Zhang, X.; Cai, H.; Shi, H. Evaluation of precipitation and its time series components in CMIP6 over the Yellow River Basin. Clim. Dyn. 2023, 60, 1203–1223. [Google Scholar] [CrossRef]
  21. Das, P.; Zhang, Z.; Ghosh, S.; Lu, J.; Ayugi, B.; Ojara, M.A.; Guo, X. Historical and projected changes in Extreme High Temperature events over East Africa and associated with meteorological conditions using CMIP6 models. Glob. Planet. Chang. 2023, 222, 104068. [Google Scholar] [CrossRef]
  22. Iturbide, M.; Gutiérrez, J.; Alves, L.; Bedia, J.; Cerezo-Mota, R.; Cimadevilla, E.; Cofiño, A.; Di Luca, A.; Faria, S.; Gorodetskaya, I.; et al. An update of IPCC climate reference regions for subcontinental analysis of climate model data: Definition and aggregated datasets. Earth Syst. Sci. Data 2020, 12, 2959–2970. [Google Scholar] [CrossRef]
  23. Teichmann, C.; Jacob, D.; Remedio, A.R.; Remke, T.; Buntemeyer, L.; Hoffmann, P.; Kriegsmann, A.; Lierhammer, L.; Buelow, K.; Weber, T.; et al. Assessing mean climate change signals in the global CORDEX-CORE ensemble. Clim. Dyn. 2021, 57, 1269–1292. [Google Scholar] [CrossRef]
  24. Nooni, I.; Fiifi, D.; Hagan, D.; Ullah, W.; Lu, J.; Shijie, L.; Prempeh, N.; Gnitou, G.; Thiam, K.; Lim, C.; et al. Projections of Drought Characteristics Based on the CNRM-CM6 Model over Africa. Agriculture 2022, 12, 495. [Google Scholar] [CrossRef]
  25. Gnitou, G.T.; Tan, G.; Niu, R.; Nooni, I.K. Assessing Past Climate Biases and the Added Value of CORDEX-CORE Precipitation Simulations over Africa. Remote Sens. 2021, 13, 2058. [Google Scholar] [CrossRef]
  26. Akinsanola, A.A.; Zhou, W. Projection of West African summer monsoon rainfall in dynamically downscaled CMIP5 models. Clim. Dyn. 2019, 53, 81–95. [Google Scholar] [CrossRef]
  27. Patlakas, P.; Stathopoulos, C.; Flocas, H.; Kalogeri, C.; Kallos, G. Regional Climatic Features of the Arabian Peninsula. Atmosphere 2019, 10, 220. [Google Scholar] [CrossRef] [Green Version]
  28. US Marine Corps. A Persian Gulf Region Climatology; Headquarters United States Marine Corps: Washington, DC, USA, 1990. [Google Scholar]
  29. Adler, R.F.; Huffman, G.J.; Chang, A.; Ferraro, R.; Ping-Ping, X. The Version-2 Global Precipitation Climatology Project (GPCP) monthly precipitation analysis (1979–present). J. Hydrometeorol. 2003, 4, 1147–1167. [Google Scholar] [CrossRef]
  30. Mote, P.; Brekke, L.; Duffy, P.B.; Maurer, E. Guidelines for constructing climate scenarios. Eos Trans. AGU 2011, 92, 257–258. [Google Scholar] [CrossRef]
  31. Sumiya, E.; Dorjsuren, B.; Yan, D.; Dorligjav, S.; Wang, H.; Enkhbold, A.; Weng, B.; Qin, T.; Wang, K.; Gerelmaa, T.; et al. Changes in Water Surface Area of the Lake in the Steppe Region of Mongolia: A Case Study of Ugii Nuur Lake, Central Mongolia. Water 2020, 12, 1470. [Google Scholar] [CrossRef]
  32. Sein, Z.; Zhi, X.; Ogou, F.; Nooni, I.; Paing, K. Evaluation of coupled model intercomparison project phase 6 models in simulating precipitation and its possible relationship with sea surface temperature over Myanmar. Front. Environ. Sci. 2022, 10, 2228. [Google Scholar] [CrossRef]
  33. Taylor, K.E. Summarizing multiple aspects of model performance in a single diagram. J. Geophys. Res. 2001, 106, 7183–7192. [Google Scholar] [CrossRef]
  34. Nooni, I.; Hagan, D.; Hagan, T.; Wang, G.; Ullah, W.; Shijie, L.; Lu, J.; Bhatti, A.; Shi, X.; Lou, D.; et al. Spatiotemporal Characteristics and Trend Analysis of Two Evapotranspiration-Based Drought Products and Their Mechanisms in Sub-Saharan Africa. Remote Sens. 2021, 13, 533. [Google Scholar] [CrossRef]
  35. Xue, Y.; De Sales, F.; Lau, W.K.M.; Boone, A.; Feng, J.; Dirmeyer, P.; Guo, Z.; Kim, K.-M.; Kitoh, A.; Kumar, V.; et al. Intercomparison and analyses of the climatology of the West African Monsoon in the West African Monsoon Modeling and Evaluation project (WAMME) first model intercomparison experiment. Clim. Dyn. 2010, 35, 3–27. [Google Scholar] [CrossRef] [Green Version]
  36. Mann, H.B. Non-parametric tests against trend. Econometrica 1945, 13, 245–259. [Google Scholar] [CrossRef]
  37. Kendall, M. Rank Correlation Measures; Charles Griffin: London, UK, 1975; Volume 202. [Google Scholar]
  38. Sen, P.K. Estimates of the Regression Coefficient Based on Kendall's Tau. J. Am. Stat. Assoc. 1968, 63, 1379–1389. [Google Scholar] [CrossRef]
  39. Mitchell, J.M.; Dzerdzeevskii, B.; Flohn, H. Climate Change, 79th ed.; World Meteorological Organization: Geneva, Switzerland, 1966. [Google Scholar]
  40. Nooni, I.K.; Wang, G.; Hagan, D.F.T.; Lu, J.; Ullah, W.; Li, S. Evapotranspiration and its Components in the Nile River Basin Based on Long-Term Satellite Assimilation Product. Water 2019, 11, 1400. [Google Scholar] [CrossRef] [Green Version]
  41. Kitoh, A.; Arakawa, O. On overestimation of tropical precipita tion by an atmospheric GCM with prescribed SST. Geophys. Res. Lett. 1999, 26, 2965–2968. [Google Scholar] [CrossRef]
  42. Golaz, J.-C.; Caldwell, P.M.; Van Roekel, L.P.; Petersen, M.R.; Tang, Q.; Wolfe, J.D.; Abeshu, G.; Anantharaj, V.; Asay-Davis, X.S.; Bader, D.C.; et al. The DOE E3SM Coupled Model Version 1: Overview and Evaluation at Standard Resolution. J. Adv. Model. Earth Syst. 2019, 11, 2089–2129. [Google Scholar] [CrossRef] [Green Version]
  43. Voldoire, A.; Saint-Martin, D.; Sénési, S.; Decharme, B.; Alias, A.; Chevallier, M.; Colin, J.; Guérémy, J.-F.; Michou, M.; Moine, M.-P.; et al. Evaluation of CMIP6 DECK Experiments With CNRM-CM6-1. J. Adv. Model. Earth Syst. 2019, 11, 2177–2213. [Google Scholar] [CrossRef] [Green Version]
  44. Séférian, R.; Nabat, P.; Michou, M.; Saint-Martin, D.; Voldoire, A.; Colin, J.; Decharme, B.; Delire, C.; Berthet, S.; Chevallier, M.; et al. Evaluation of CNRM Earth System Model, CNRM-ESM2-1: Role of Earth System Processes in Present-Day and Future Climate. J. Adv. Model. Earth Syst. 2019, 11, 4182–4227. [Google Scholar] [CrossRef] [Green Version]
  45. Sellar, A.A.; Jones, C.G.; Mulcahy, J.P.; Tang, Y.; Yool, A.; Wiltshire, A.; O'Connor, F.M.; Stringer, M.; Hill, R.; Palmieri, J.; et al. UKESM1: Description and Evaluation of the U.K. Earth System Model. J. Adv. Model. Earth Syst. 2019, 11, 4513–4558. [Google Scholar] [CrossRef] [Green Version]
  46. Hansen, J.; Sato, M.; Ruedy, R.; Nazarenko, L.; Lacis, A.; Schmidt, G.A.; Russell, G.; Aleinov, I.; Bauer, M.; Bauer, S.; et al. Efficacy of climate forcings. J. Geophys.Res. Atmos. 2005, 110, D18104. [Google Scholar] [CrossRef]
  47. Gregory, J.M.; Ingram, W.J.; Palmer, M.A.; Jones, G.S.; Stott, P.A.; Thorpe, R.B.; Lowe, J.A.; Johns, T.C.; Williams, K.D. A new method for diagnosing radiative forcing and climate sensitivity. Geophys. Res. Lett. 2004, 31, L03205. [Google Scholar] [CrossRef] [Green Version]
  48. Gleckler, P.J.; Taylor, K.E.; Doutriaux, C. Performance metrics for climate models. J. Geophys. Res. Atmos. 2008, 113, D06104. [Google Scholar] [CrossRef]
  49. Crétat, J.; Vizy, E.K.; Cook, K.H. How well are daily intense rainfall events captured by current climate models over Africa? Clim. Dyn. 2014, 42, 2691–2711. [Google Scholar] [CrossRef]
  50. Hourdin, F.; Musat, I.; Grandpeix, J.-Y.; Polcher, J.; Guichard, F.; Favot, F.; Marquet, P.; Boone, A.; Lafore, J.P.; Redelsperger, J.-L.; et al. AMMA-Model intercomparison project. Bull. Am. Meteorol. Soc. 2010, 91, 95–104. [Google Scholar] [CrossRef]
  51. Douville, H.; Chauvin, F.; Broqua, H. Influence of soil moisture on the Asian and African monsoons Part I: Mean monsoon and daily precipitation. J. Clim. 2001, 14, 2381–2403. [Google Scholar] [CrossRef]
  52. Flato, G. Coauthors. In Evaluation of Climate Models; Cambridge University Press: Cambridge, UK, 2013. [Google Scholar]
  53. Kendon, E.J.; Stratton, R.A.; Tucker, S.; Marsham, J.H.; Berthou, S.; Rowell, D.P.; Senior, C.A. Enhanced future changes in wet and dry extremes over Africa at convection-permitting scale. Nat. Commun. 2019, 10, 1794. [Google Scholar] [CrossRef] [PubMed] [Green Version]
  54. Rowell, D.P.; Folland, C.K.; Maskell, K.; Ward, M.N. Variability of summer rainfall over tropical North Africa (1906–1992): Observations and modeling. Q. J. R. Meteorol. Soc. 1995, 121, 669–704. [Google Scholar]
  55. Patricola, C.M.; Cook, K.H. Northern African climate at the end of the twenty-first century: An integrated application of regional and global climate models. Clim. Dyn. 2010, 35, 193–212. [Google Scholar] [CrossRef] [Green Version]
  56. Hamed, M.M.; Nashwan, M.S.; Shahid, S. A novel selection method of CMIP6 GCMs for robust climate projection. Int. J. Climatol. 2022, 42, 4258–4272. [Google Scholar] [CrossRef]
  57. Sultan, B.; Janicot, S.; Drobinski, P. Characterization of the diurnal cycle of the West African Monsoon around the monsoon onset. J. Clim. 2007, 20, 4014–4032. [Google Scholar] [CrossRef]
  58. Sultan, B.; Janicot, S. Abrupt shift of the ITCZ over West Africa and intra-seasonal variability. Geophys. Res. Lett. 2000, 27, 3353–3356. [Google Scholar] [CrossRef]
  59. Ongoma, V.; Chen, H.; Gao, C. Projected changes in mean rainfall and temperature over East Africa based on CMIP5 models. Int. J. Climatol. 2018, 38, 1375–1392. [Google Scholar] [CrossRef]
  60. Ayugi, B.; Zhihong, J.; Zhu, H.; Ngoma, H.; Babaousmail, H.; Rizwan, K.; Dike, V. Comparison of CMIP6 and CMIP5 models in simulating mean and extreme precipitation over East Africa. Int. J. Climatol. 2021, 41, 6474–6496. [Google Scholar] [CrossRef]
  61. Funk, C.; Hoell, A.; Shukla, S.; Husak, G.; Michaelsen, J. The East African Monsoon System: Seasonal Climatologies and Recent Variations. In The Monsoons and Climate Change: Observations and Modeling; de Carvalho, L.M.V., Jones, C., Eds.; Springer International Publishing: Cham, Switzerland, 2016; pp. 163–185. [Google Scholar]
  62. Agyekum, J.; Annor, T.; Lamptey, B.; Quansah, E.; Agyeman, R.Y.K. Evaluation of CMIP5 Global Climate Models over the Volta Basin: Precipitation. Adv. Meteorol. 2018, 2018, 4853681. [Google Scholar] [CrossRef] [Green Version]
  63. Aloysius, N.R.; Sheffield, J.; Saiers, J.E.; Li, H.; Wood, E.F. Evaluation of historical and future simulations of precipitation and temperature in central Africa from CMIP5 climate models. J. Geophys. Res. Atmos. 2016, 121, 130–152. [Google Scholar] [CrossRef] [Green Version]
  64. Fotso-Nguemo, T.C.; Chamani, R.; Yepdo, Z.D.; Sonkoué, D.; Matsaguim, C.N.; Vondou, D.A.; Tanessong, R.S. Projected trends of extreme rainfall events from CMIP5 models over Central Africa. Atmos. Sci. Lett. 2018, 19, e803. [Google Scholar] [CrossRef]
  65. Ongoma, V.; Chen, H.; Gao, C. Evaluation of CMIP5 twentieth century rainfall simulation over the equatorial East Africa. Theor. Appl. Climatol. 2019, 135, 893–910. [Google Scholar] [CrossRef]
  66. Vizy, E.K.; Cook, K.H.; Crétat, J.; Neupane, N. Projections of a Wetter Sahel in the Twenty-First Century from Global and Regional Models. J. Clim. 2013, 26, 4664–4687. [Google Scholar] [CrossRef]
  67. Iqbal, Z.; Shahid, S.; Ahmed, K.; Ismail, T.; Ziarh, G.F.; Chung, E.-S.; Wang, X. Evaluation of CMIP6 GCM rainfall in mainland Southeast Asia. Atmos. Res. 2021, 254, 105525. [Google Scholar] [CrossRef]
  68. Mahony, C.R.; Wang, T.; Hamann, A.; Cannon, A.J. A global climate model ensemble for downscaled monthly climate normals over North America. Int. J. Climatol. 2022, 42, 5871–5891. [Google Scholar] [CrossRef]
Figure 1. Digital elevation model (DEM) of the African continent and Arabian Peninsula.
Atmosphere 14 00607 g001
Figure 2. Taylor diagram comparing PREC observation (GPCP) with MME and 49 models (CMIP6) during 1980–2014. (a) Annual, (b) MJJASON, (c) December, (d) JFMA.
Atmosphere 14 00607 g002
Figure 3. Spatial distribution of multi-year mean precipitation in GPCP (a1a4), and MME (b1b4) for annual (a1,b1), JFMA (a2,b2), MJJASON (a3,b3), and December (a4,b4) periods during 1980–2014. The unit is mm year−1.
Atmosphere 14 00607 g003
Figure 4. Spatial distribution of multi-year mean precipitation in 49 selected individual models. The unit is mm year−1.
Atmosphere 14 00607 g004
Figure 5. Interannual variations of observation (i.e., GPCP, black line) in CMIP6 MME- and 49 CMIP6-simulated precipitation anomalies during 1980–2014 across Africa and the Arabian Peninsula. Anomalies were calculated using the mean over the period.
Atmosphere 14 00607 g005
Figure 6. Annual cycle of precipitation (mm) in GPCP (dotted black line) and CMIP6 models (colored lines) averaged over the period from 1980 to 2014.
Atmosphere 14 00607 g006
Figure 7. Linear trends of GPCP (a1a4) (left), and MME (b1b4) (right) at annual scale (a1,b1), JFMA (a2,b2), MJJASON (a3,b3), and December (a4,b4). The unit is mm decade−1. The black dots indicate that the trend passes the 0.05 significance test.
Atmosphere 14 00607 g007
Figure 8. Heatmap plots comparing correlation coefficients of mean precipitation between GPCP and 49 GCMs and their (a) annual, (b), MJJASON, (c) December, and (d) JFMA MME during 1980–2014.
Atmosphere 14 00607 g008
Figure 9. Correlation coefficient between observation GPCP and GCMs and the corresponding sea-surface temperature (SST) at annual scale (a1,b1), MJJASON (a2,b2), December (a3,b3), and JFMA (a4,b4). from 1980 to 2014. Hatched area indicates a 95% confidence level.
Atmosphere 14 00607 g009
Figure 10. Spatial distributions of correlation coefficients of GPCP and CMIP6 MME PREC and SST (i.e., annual scale (a1,b1), JFMA (a2,b2), MJJASON (a3,b3), and December (a4,b4)). during 1980–2014. Hatched area indicates a 95% confidence level.
Atmosphere 14 00607 g010
Figure 11. Spatial distributions of annual correlation coefficients of 49 selected CMIP6 models and SST during 1980–2014. Hatched area indicates a 95% confidence level.
Atmosphere 14 00607 g011
Table 1. The information on the CMIP6 Global Climate Models (GCM) used in this study.
No.Model NameInstitution Resolution
1ACCESS-ESM1-5Commonwealth Scientific and Industrial Research Organisation (CSIRO), Australia 192 × 145
2ACCESS-CM2 Commonwealth Scientific and Industrial Research Organisation (CSIRO) and Australian Research Council Centre of Excellence for Climate System Science (ACCESS), Australia192 × 144
3AWI-CM-1-1-MRAlfred Wegener Institute Climate Model384 × 192
4AWI-ESM-1-1-LRAlfred Wegener Institute Climate Model192 × 96
5BCC-CSM2-MRBeijing Climate Center, China Meteorological Administration, China320 × 160
6BCC-ESM1Beijing Climate Center, China Meteorological Administration, China128 × 64
7CAMS-CSM1-0Climate Academy of Meteorological Sciences-Climate Simulation Model100×100
8CanESM5Canadian Centre for Climate Modelling and Analysis (CCCMA), Canada 128 × 64
9CanESM5-CanOECanadian Centre for Climate Modelling and Analysis (CCCMA), Canada100×100
10CESM2National Centre for Atmospheric Research (NCAR), USA288 × 192
11CESM2-FV2National Centre for Atmospheric Research (NCAR), USA144 × 96
12CESM2-WACCMNational Centre for Atmospheric Research (NCAR), USA288 × 192
13CESM2-WACCM-FV2National Centre for Atmospheric Research (NCAR), USA144 × 96
14CMCC-CM2-HR4Euro-Mediterranean Centre on Climate Change, Italy288 × 192
15CMCC-CM2-SR5Euro-Mediterranean Centre on Climate Change, Italy288 × 192
16CMCC-ESM2Euro-Mediterranean Centre on Climate Change, Italy288 × 192
17CNRM-CM6-1Center National de Recherches Météorologiques– Center Européen de Recherche et de Formation Avancée en Calcul Scientifique, France.256 × 128
18CNRM-CM6-1-HRCenter National de Recherches Météorologiques– Center Européen de Recherche et de Formation Avancée en Calcul Scientifique, France.720 × 360
19CNRM-ESM2-1Center National de Recherches Météorologiques– Center Européen de Recherche et de Formation Avancée en Calcul Scientifique, France.256 × 128
20E3SM-1-0Lawrence Livermore National Laboratory (LLNL), USA360 × 180
21E3SM-1-1E3SM Project 360 × 180
22E3SM-1-1-ECA360 × 180360 × 180
23EC-Earth3-AerChemEC-EARTH consortium, The Netherlands/Ireland 512 × 256
24EC-Earth-CCEC-EARTH consortium, The Netherlands/Ireland 512 × 256
25EC-Earth3-Veg-LREC-EARTH consortium, The Netherlands/Ireland 512 × 256
26FGOALS-f3-LChinese Academy of Sciences, China288 180
27FGOALS-g3Chinese Academy of Sciences, China 180 × 80
28FIO-ESM-2-0First Institute of Oceanography Earth System Model Earth System Models288 × 180
29GFDL-ESM4NOAA Geophysical Fluid Dynamics Laboratory, USA288 × 180
30GISS-E2-1-HNASA Goddard Institute for Space Studies, USA144 × 90
31HadGEM3-GC31-LLMet Office Hadley Centre, United Kingdom192 × 144
32HadGEM3-GC31-MMMet Office Hadley Centre, United Kingdom432 × 324
33INM-CM4-8Institute for Numerical Mathematics, Russia180 × 120
34INM-CM5-0180 × 120
35IPSL-CM5A2-INCAInstitut Pierre-Simon Laplace, France180 × 120
36IPSL-CM6A-LR144 × 143
37KACE-1-0-GNational Institute for Meteorological Sciences/Korean Meteorological Administration (NIMS-KMA)192 × 144
38MCM-UA-1-0University of Arizona (UA), USA96 × 80
39MICRO6Japan Agency for Marine Earth Science and Technology (JAMSTEC), The University of Tokyo, Japan256 × 128
40MICRO-ES2LThe University of Tokyo, Japan128 × 64
41MPI-ESM1-2-HRMax Planck Institute for Meteorology, Germany384 × 192
42MPI-ESM1-2-LR192 × 96
43MRI-ESM2-0Meteorological Research Institute, Japan320 × 160
44NESM3Nanjing University of Information Science and Technology, China192 × 96
45NorCPM1Norwegian Climate Center, Norway144 × 96
46NorESM2-LMNorwegian Climate Center, Norway144 × 96
47SAM0-UNICONSeoul National University, South Korea288 × 192
48TaiESM1Research Center for Environmental Changes, Taipei, Taiwan192 × 96
49UKESM1-0-LLMet Office Hadley Centre, United Kingdom192 × 144
Disclaimer/Publisher’s Note: The statements, opinions and data contained in all publications are solely those of the individual author(s) and contributor(s) and not of MDPI and/or the editor(s). MDPI and/or the editor(s) disclaim responsibility for any injury to people or property resulting from any ideas, methods, instructions or products referred to in the content.

