
Tree Traits and Microclimatic Conditions Determine Cooling Benefits of Urban Trees
by
 , , , ,
Mahmuda Sharmin
1,2,*,
Mark G. Tjoelker
1,
Sebastian Pfautsch
3,
Manuel Esperón-Rodriguez
1 ,
,
Paul D. Rymer
1 and
Sally A. Power
1 1
Hawkesbury Institute for the Environment, Western Sydney University, Locked Bag 1797, Penrith, NSW 2751, Australia
2
Department of Forestry and Environmental Science, Shahjalal University of Science and Technology, Sylhet 3114, Bangladesh
3
Urban Planning and Management, School of Social Sciences, Western Sydney University, Locked Bag 1797, Penrith, NSW 2751, Australia
*
Author to whom correspondence should be addressed.
Atmosphere 2023, 14(3), 606; https://doi.org/10.3390/atmos14030606
Submission received: 26 January 2023
/
Revised: 1 March 2023
/
Accepted: 8 March 2023
/
Published: 22 March 2023
(This article belongs to the Special Issue Strategies for Mitigation and Adaptation to Urban Heat)
Abstract
:Trees play a key role in mitigating urban heat by cooling the local environment. This study evaluated the extent to which street trees can reduce sub-canopy air temperature relative to ambient conditions (ΔT), and how ΔT relates to tree traits and microclimatic variables. Air temperature under the canopies of 10 species was recorded within residential areas in Western Sydney, Australia, during summer 2019–2020. Tree and canopy traits, namely tree height, specific leaf area, leaf dry matter content, leaf area index, crown width and the Huber value (the ratio of sapwood area to leaf area) were then measured for all species. Species differed significantly in their ΔT values, with peak cooling (maximum ΔT −3.9 °C) observed between 9–10 am and sub-canopy warming (i.e., positive ΔT values) typically occurring during afternoon and overnight. Trees with high LAI and wider canopies were associated with the greatest daytime cooling benefits and lower levels of nighttime warming. ΔT was also negatively related to windspeed and vapor pressure deficit, and positively to solar irradiance. This study provides valuable information on how tree characteristics and microclimate influence potential cooling benefits that may aid planning decisions on the use of trees to mitigate heat in urban landscapes.
1. Introduction
Global mean air temperature has increased by 1 °C compared to pre-industrial times and is expected to reach +1.5 °C by 2050 [1]. Climate models predict that global warming will be associated with more frequent, severe and intense extreme heat events [1,2], and cities are also predicted to become warmer in the coming years [3]. Within cities, increasingly extreme temperatures lead to challenging conditions for urban residents, particularly during heatwaves [4]. Therefore, a greater understanding of mitigation options to reduce urban heat is necessary to improve local conditions for urban populations.
Urban areas are mosaics of buildings, streets and different types of impervious surfaces, along with green and blue infrastructure [5]. Impervious surfaces (i.e., man-made surfaces such as concrete, asphalt and buildings) can cover up to 50% of urban areas, although this cover varies considerably across cities [6]. Urban areas also differ in their radiative, thermal, aerodynamic and moisture properties relative to surrounding peri-urban and natural areas, absorbing heat and re-radiating longwave radiation within the urban matrix, resulting in higher air and surface temperatures [7,8]. As a consequence, temperatures in urban and peri-urban areas are typically higher than in the surrounding rural landscape—a phenomenon known as the urban heat island effect (UHI) [9].
Multiple heat mitigation strategies are available to modify the heat balance of urban areas. Of these, nature-based solutions (e.g., green roofs and walls, planting trees, presence of water bodies) are highlighted as sustainable, cost-effective ways of reducing urban heat and improving the livability of cities across the globe [10,11]. Trees are a key component of urban green space and have a demonstrated ability to reduce local air temperatures [12,13]. Indeed, a modelling study of four cities from different climate zones (Melbourne [Australia], Zurich [Switzerland], Phoenix [USA] and Singapore [Singapore]) reported that vegetation cover can decrease daytime maximum air temperatures by 3.1 to 5.8 °C [14]. Furthermore, empirical studies have demonstrated air temperature reductions of 2.8 °C associated with tree canopies in Campinas, Brazil [15] and 1.1 °C in Greater Sydney, Australia [16]. The extent to which tree crowns reduce air temperature varies substantially across studies [14,17], with differences likely due to the nature of the surrounding built-up area, the extent of vegetation cover, soil water availability, time of day and local microclimate [18].
Trees cool the surrounding area directly by blocking solar irradiation and transpiring water to the atmosphere [19]. Morphological traits, such as tree size, crown width, crown density, leaf dry matter content (LDMC), leaf area (LA), specific leaf area (SLA) and the Huber value influence the amount of canopy shade cast, light reflectance and transpiration rate [20,21,22]. Shaded surfaces absorb less solar radiation and therefore re-radiate less heat, thereby maintaining cooler air temperatures underneath tree crowns [16]. Both LDMC and SLA are negatively correlated with leaf thickness [23], and thinner leaves can more effectively lower air temperature [24] due to their thinner leaf boundary—a thin layer of still air that surrounds each leaf. The Huber value (i.e., the ratio of stem xylem cross-sectional area to leaf area supported by the respective stem segments) [25] represents the amount of leaf area of a stem that can transpire water [15] and hence a tree’s capacity for transpirational cooling under optimal conditions [26].
Transpiration rates are regulated by solar irradiance, VPD, and windspeed [27], with stomatal opening generally greatest at biologically optimal solar irradiance, VPD and windspeed [28]. High windspeed disrupts the leaf boundary layer enhancing CO2 and H2O diffusion [29], resulting in increased transpiration. High VPD typically causes plants to close their stomata to reduce water loss, resulting in a decline in transpiration rate. High VPD conditions are associated with extreme heat and/or drought conditions [27]. Similarly, later in the day/evening atmospheric demand for water is often lower (low VPD), resulting in stomatal closure and reduced transpiration rates [30]. In many species, nighttime stomatal opening has, however, been observed [30,31]. Nighttime plant transpiration can be up to 20% of daytime transpiration levels and is also positively correlated with VPD [32]. As a result, nighttime cooling due to plant transpiration can occur under and surrounding tree crowns [30].
The cooling benefits of urban trees—referred to as delta temperature (ΔT), the difference between ambient air temperature and sub-canopy air temperature—vary among species and depend on plant traits, tree structure and crown characteristics [15,24]. Knowledge of the extent to which different tree species and their associated traits can provide microclimatic benefits during summertime periods of high temperatures and can improve urban livability and thereby the wellbeing of urban residents. However, whilst species might differ in the extent to which they are able to influence the local microclimate [33,34], it is not feasible to evaluate all urban trees for any given city. Therefore, a traits-based approach that identifies those tree characteristics that are broadly associated with greater shade and evapotranspiration rates, and hence likely to provide greater cooling benefits, is a more feasible approach.
Urban areas across Western Sydney, Australia, have recently experienced record-breaking temperatures of 45–48.9 °C [10,35,36] and are predicted to reach 50 °C by 2040 [37]. Exposure to such extreme temperatures, along with a relatively high surface cover of man-made materials, such as roads, pavements and buildings, makes this area a prime location for evaluating the role of vegetation in mitigating urban heat. This study assessed sub-canopy temperatures of 10 commonly planted tree species across urbanized areas in Western Sydney to address the following questions: (1) How do tree species differ in their ability to influence summertime air temperatures and which canopy traits are associated with greater cooling benefits? (2) How do relationships between species/canopy traits and sub-canopy air temperature differ between day and nighttime? (3) How do climatic variables influence diurnal patterns in canopy-associated cooling? It is hypothesized that (1) tree species with more extensive (e.g., greater crown width, height and DBH) and dense (e.g., high leaf area index [LAI]) crowns, along with specific leaf characteristics (e.g., high leaf dry matter content [LDMC] and low specific leaf area [SLA]) are associated with greater shading and higher rates of evapotranspiration and, hence, will have lower sub-canopy air temperatures; (2) canopy-associated cooling will occur predominantly during sunlight hours, with limited overnight cooling; and (3) the combined effects of high VPD and high solar irradiance will partly reduce canopy cooling benefits by reducing transpirational cooling via daytime stomata closure, while high windspeed will partly increase the cooling benefits of trees via mixing of cooler air.
2. Materials and Methods
2.1. Study Site
This study was carried out in Richmond and Cranebrook, two suburbs in Western Sydney, New South Wales, Australia (33°52′32.6″ S, 151°12′33.1″ E). Western Sydney has a humid subtropical climate with an annual mean maximum temperature of 24 °C, mean minimum temperature of 11.1 °C and mean annual rainfall of 741 mm (average between 1990–2020 Bureau of Meteorology, www.bom.gov.au, 10 December 2020). The 2019–2020 austral summer in which the study was carried out was Australia’s warmest summer on record, with a mean maximum temperature 2.14 °C warmer than the 1961–90 average [38]. The number of days per year over 35 °C in Western Sydney has increased from an average of 9.5 days per year in the 1970s to 15.4 in the past decade and is predicted to rise to 19 days per year by 2030 [39]. Penrith local government area, where the suburb of Cranebrook is located, hit a peak of 48.9 °C in the summer of 2019–2020, the highest temperature recorded in the Sydney region since 1939. At air temperatures above 35 °C, the ability of the human body to cool itself is reduced, making it a common benchmark temperature for occupational health and safety experts, as well as academic and government researchers [40]. Furthermore, the Greater Sydney region has faced a series of drought events in the last few years, which continued through the summer months when the study took place. This resulted in an exceptionally hot and dry period during which data were collected, including record-breaking levels of afternoon heat. Additionally, during this time, unprecedented bushfires heavily impacted various parts of Western Sydney [41].
2.2. Data Collection
2.2.1. Tree Species Selection
The ten most abundant street tree species in Richmond and Cranebrook were identified using urban tree inventory data sourced from the respective city councils. Ten replicates of each tree species were identified, except for four species (Eucalyptus microcorys, Melaleuca quinquenervia, Sapium sebiferum, and Ulmus parvifolia) each of which had nine individuals. Temperature loggers were installed at the base of each tree canopy, although vandalism resulted in the loss of one replicate of each of the four above-mentioned tree species. To standardize urban microclimatic conditions, full-sized individual street trees with separate canopies growing in grass verges were randomly selected within low-rise residential areas comprising a mix of impervious and vegetated surfaces (Figure 1). Species were selected with contrasting crown and leaf characteristics (Table 1). All trees were located in residential areas characterized by single-story buildings (except five individuals of Platanus acerifolia that were situated along a street in a non-residential area). Trees were located within a 4 km radius of a Bureau of Meteorology weather station (see details below).
2.2.2. Air Temperatures under Tree Canopies
Microclimatic data were collected from 9 December 2019 to 28 February 2020, during the austral summer. Sub-canopy temperatures were measured using automated, water-proof temperature loggers (Tempmate®-S1 V2, Imec Messtechnik, Heilbronn, Germany) installed at the base of tree canopies, at a height of 3–4 m aboveground. Loggers were enclosed in custom-made shields to avoid exposure to direct sunlight (Figure 1c) [42]. Holes were drilled into the top of the shields to allow ventilation of the loggers. Loggers were programmed to record air temperature at 10-min intervals for days, with an accuracy of ±0.5 °C (−20 °C/+40 °C; ±1.0 °C outside of that range of temperature) and a resolution of 0.1 °C. The accuracy of the custom-built devices and loggers was evaluated by comparison with data from the nearest weather stations [43].
2.2.3. Climate Data Collection
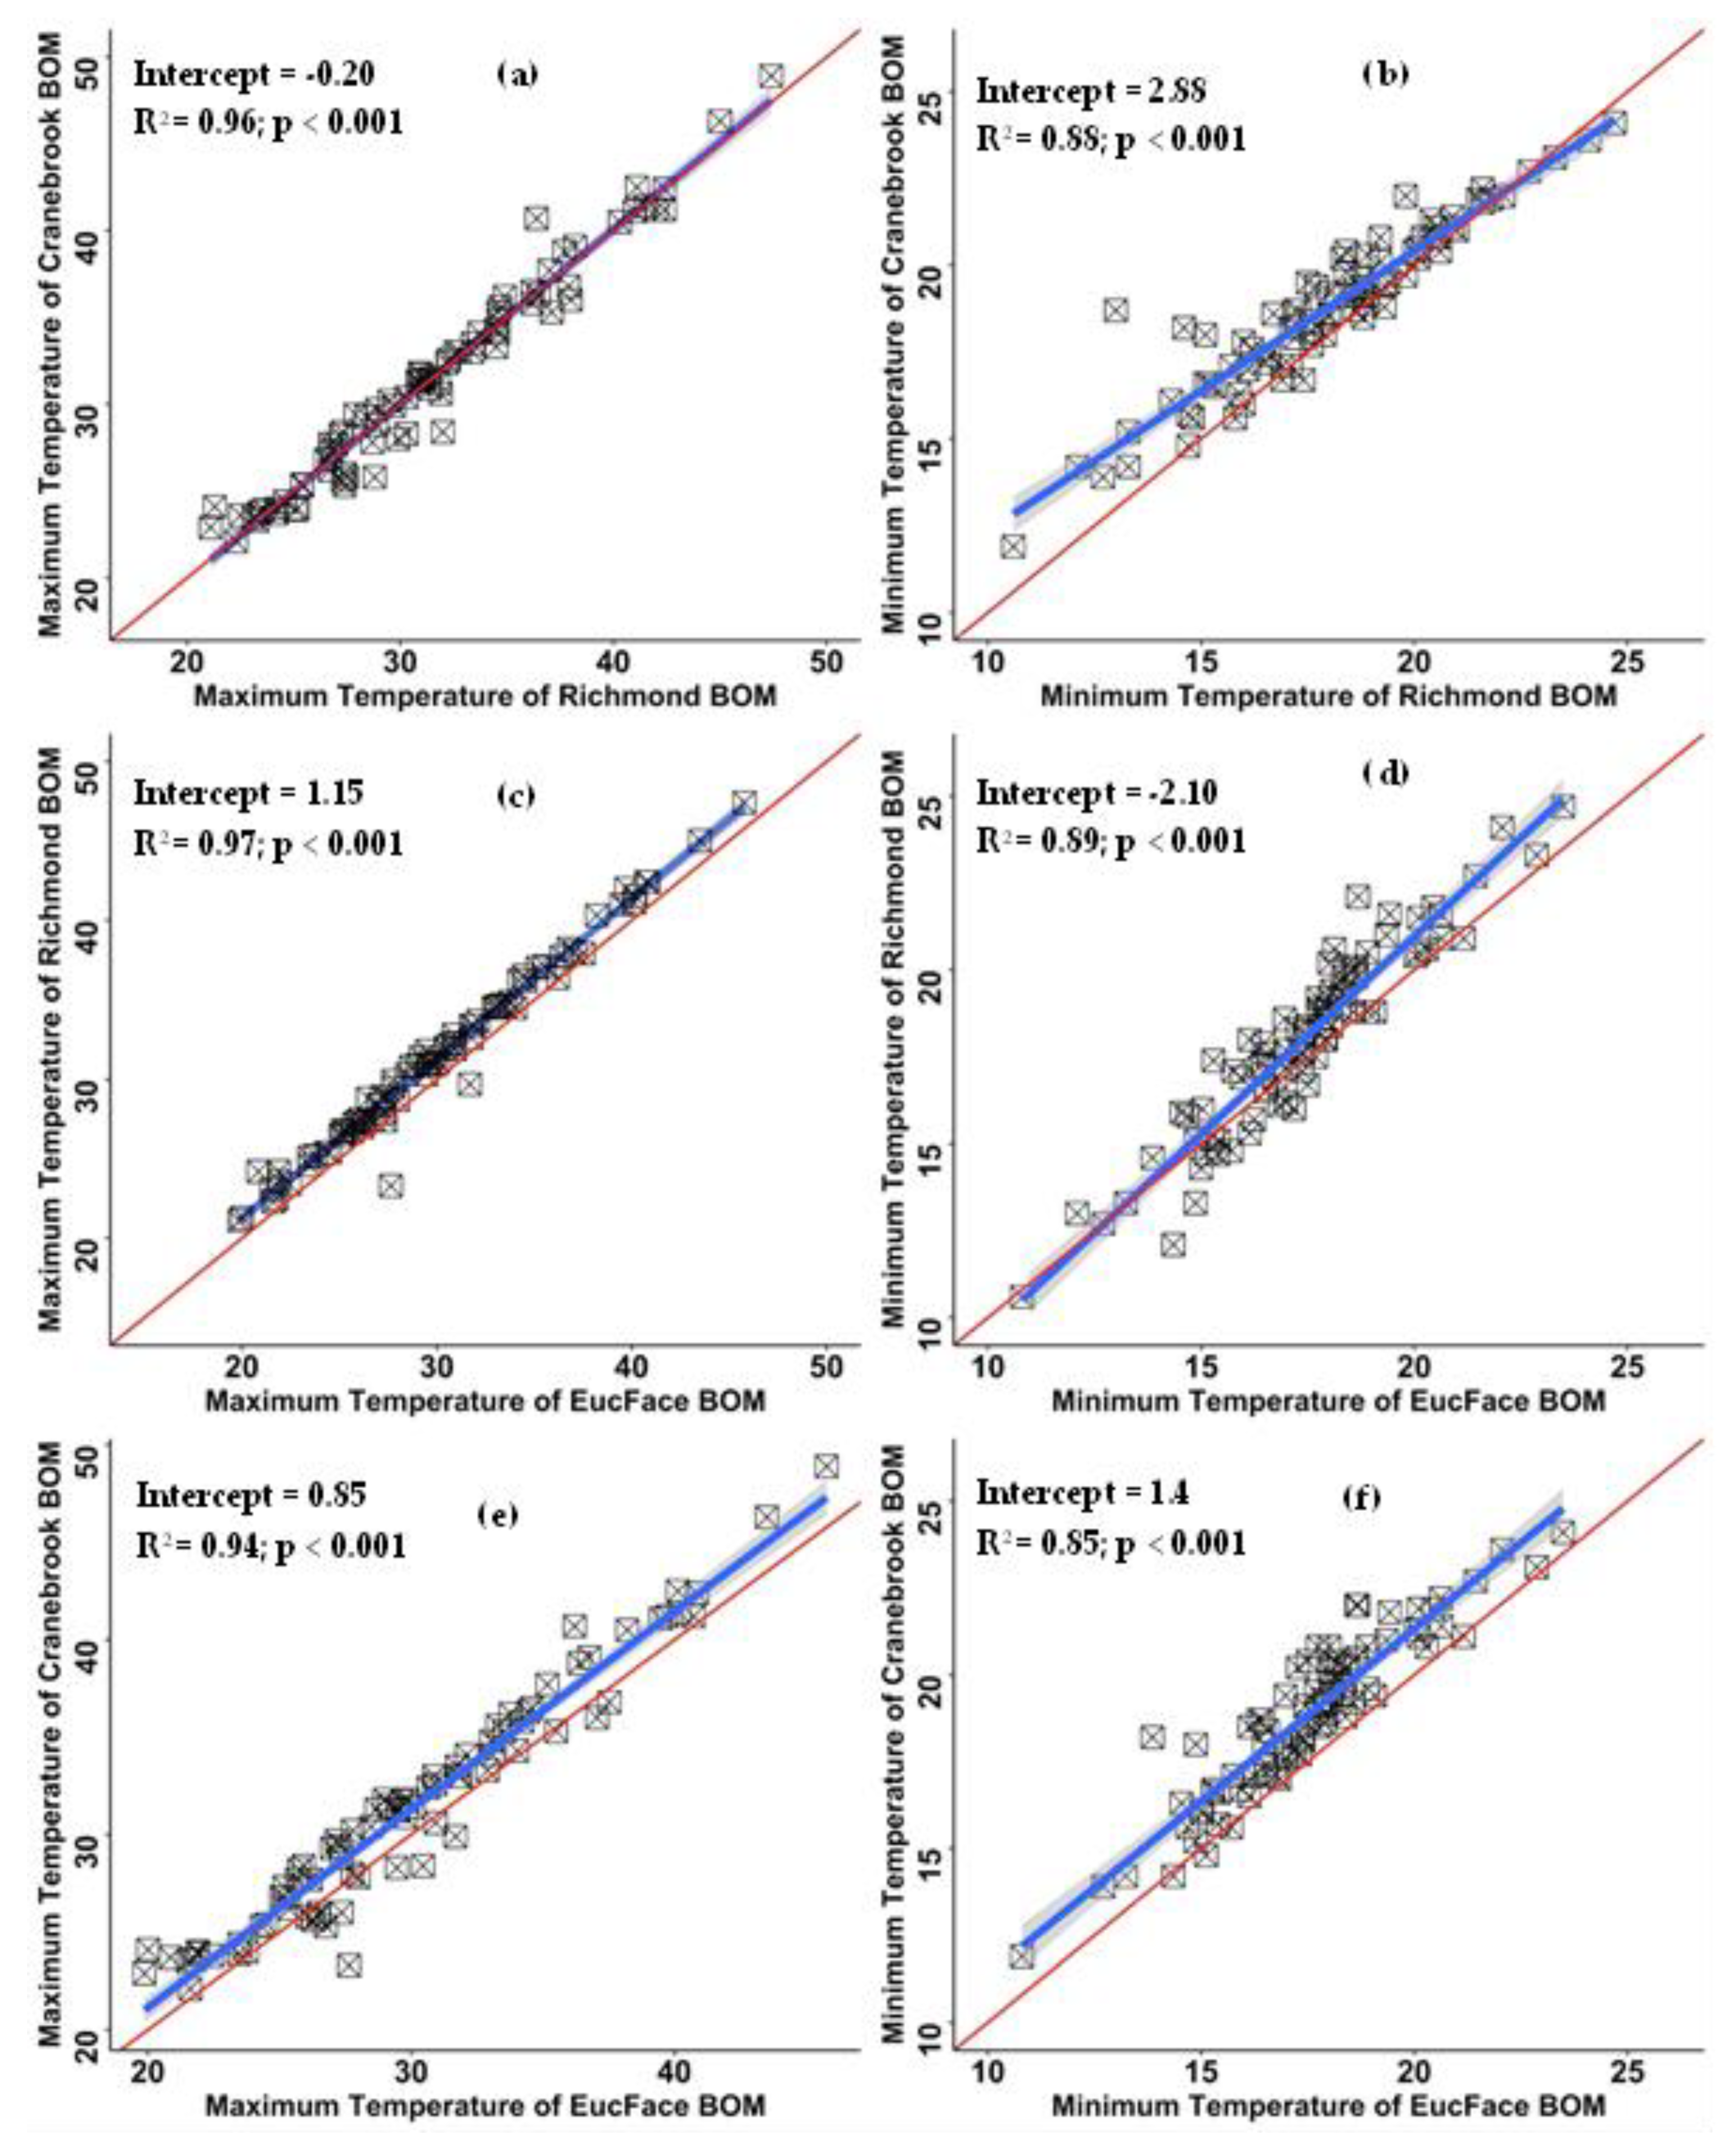
Ambient climate data were sourced from the two closest Bureau of Meteorology (BOM) weather stations. Data from these sites were used due to a lack of funding to purchase and install instruments in non-canopy, exposed conditions across the study area, as well as concern for the risk of vandalism for sensors that were visible to passers-by (i.e., not shielded by the canopies). Whilst it is recognized that this imposes some constraints in the interpretation of canopy cooling benefits, we considered that the relatively small study area and availability of high temporal resolution data from two nearby BOM stations made this a viable alternative. Ambient air temperature, humidity and windspeed data at 1-min resolution were sourced from the meteorological stations at the Royal Australian Air Force (RAAF) site in Richmond (station id: 067105, latitude −33.60, longitude 150.78 and height 19.0 m above sea level [asl]) and at Penrith Lakes for Cranebrook (station id: 067113, latitude −33.72° S, longitude 150.68° E and height 24.7 m asl). As solar irradiation data were not available at BOM sites, these data (~ 1-min resolution) were sourced from the EucFace meteorological station at the Hawkesbury Campus of Western Sydney University at Richmond (latitude −33.62° S, longitude 150.75° E and height 20 m asl), located between the two BOM stations. Solar irradiation was measured using a LI-200 pyranometer (wavelength 400 to 1100 nm range, sensitivity 75 μA per 1000 W m−2). All 1-min resolution data were averaged to 10-min intervals to correspond with sub-crown air temperature data. High R2 values for maximum and minimum temperatures between both BOM sites and EucFace meteorological station data provided confidence in the use of solar irradiance data from the latter, alongside Cranbrook and Richmond BOM sites’ meteorological data (Figure 2).
The method of Snyder and Shaw [44] was followed to calculate VPD from air temperature. At first, saturated vapor pressure (SVP) for a given temperature and humidity was calculated using Equation (1). Vapor pressure deficit (VPD) is the difference between SVP and actual vapor pressure and was calculated with Equation (2).
SVP(Pascals) = 610.7 × 10 7.5T/(237.3+T)
VPD = (1 − (RH/100)) × SVP)
2.2.4. Morphological Trait Measurements
Height, diameter at breast height (DBH; 1.3 m above ground), crown width and leaf area index (LAI) were measured for 96 individual trees. Tree height and crown depth were measured using a Haglöf laser meter (L400, Haglöf, Sweden) with a height resolution of 0.1 m, angle resolution of 0.1° and accuracy of 0.1°. Crown width measurements were taken as the length of x and y orthogonal axes from edge to edge for the widest and narrowest points through the crown centre and then averaged. DBH was measured using a diameter tape at a height of 1.3 m.
Leaf area index (LAI) was measured in January and March 2020 for each individual tree using a plant canopy analyser (LAI-2200, Li-COR, Lincoln, NE, USA). Four LAI measurements were taken at 1 m height above ground and with a 90° view cap on a fish-eye lens. LAI is the ratio of the area of leaves to the area of the ground under the crown [45] and was measured on overcast days to improve contrast. LAI data were analysed using FV2200 software developed for the LAI-2200, deploying an isolated crown model.
One small branch (diameter range of 10 to 15 mm and length of 30 cm) was collected from six to eight replicate trees of each species, from the north side of the mid-canopy, to measure specific leaf area (SLA), leaf dry matter content (LDMC), and to determine the Huber value (the ratio of the sapwood cross-sectional area to the total supported leaf area) [46]. Excised samples were immediately placed in an insulated foam box.
To calculate the Huber Value, fresh leaves of each branch were scanned and then the total projected leaf area of each branch was estimated using WinFOLIA Software (Regent Instrument Inc., Quebec, QC, Canada). Subsequently, the sapwood diameter with- and without bark, and the length of branches were measured using a digital caliper (ABS Digital caliper, CD-6-inch ASX, Japan) with an accuracy of ±0.02 mm, resolution of 0.01 mm and a ruler, respectively. For sapwood area calculations, branches were assumed not to contain hardwood. To calculate leaf area, SLA and LDMC, three to five mature and fully expanded leaves per individual tree, excluding the petiole, were chosen. The fresh weight of the leaves was measured, before scanning their area and drying them in an oven for 48 h at 70 °C after which their dry weight was determined. Specific leaf area (SLA) was calculated by dividing the leaf surface area by its dry mass [47]. Leaf dry matter content (LDMC) was determined by dividing dry weight by fresh weight [47].
2.3. Data Analysis
To evaluate diurnal species-specific patterns in sub-canopy air temperature, days were split into morning (07:00 to 13:00), afternoon (15:00 to 18:00) and nighttime (00:00 to 05:00) periods. Cloudy or hazy days (solar irradiance below 500 KW m−2) resulting from the extensive bushfires occurring at the time were excluded from the dataset; this resulted in a subset of 37 days (out of a total of 110) used for analyses.
To calculate delta temperature (ΔT), the ambient air temperature was subtracted from the sub-canopy air temperature of the nearest weather station (Richmond or Cranebrook). Negative ΔT values indicated that sub-canopy temperatures were lower than ambient air temperature measured by the BOM weather station (i.e., cooling benefit), whereas positive ΔT values indicated warmer sub-canopy temperatures compared to ambient air temperature. Analyses were conducted in two phases, detailed below. All analyses and graphing were carried out using the R version 3.5.1 [48]. A p-value of 0.05 was considered significant.
First, to understand the effect of tree species on ΔT, linear mixed effect models (lmer) were fitted for each part of the day separately, with tree species, solar irradiance and VPD considered as fixed effects. Dates and suburbs were specified as random effects. A similar model was used for the nighttime data, except that solar irradiance was excluded. The fitted models were used to evaluate differences among tree species using the function emmeans from the emmeans package [49]. Letters displayed for pairwise comparisons were extracted using multcomp package [50].
Secondly, linear mixed effect models (lmer) were used to investigate relationships among ΔT, tree traits and climate variables. For analyses using daytime (morning and afternoon) measurements, temperature data, solar irradiance, windspeed, VPD, days since last rain and all tree traits (i.e., height, stem height, crown width, leaf areas, LAI, SLA, LDMC, Huber Value) were specified as fixed effects. Date, suburbs and tree species were specified as random factors. For nighttime analyses, the model excluded solar irradiance. The lme4 package was used for lmer analyses [51].
3. Results
Tree species used in this study differed significantly in their canopy width, DBH, tree height, Huber value, LDMC, LAI and SLA (Supplementary Figure S1 and Table S1). Within-species differences are also evident from the boxplots in Supplementary Figure S1.
3.1. Daytime and Nighttime Delta Temperature
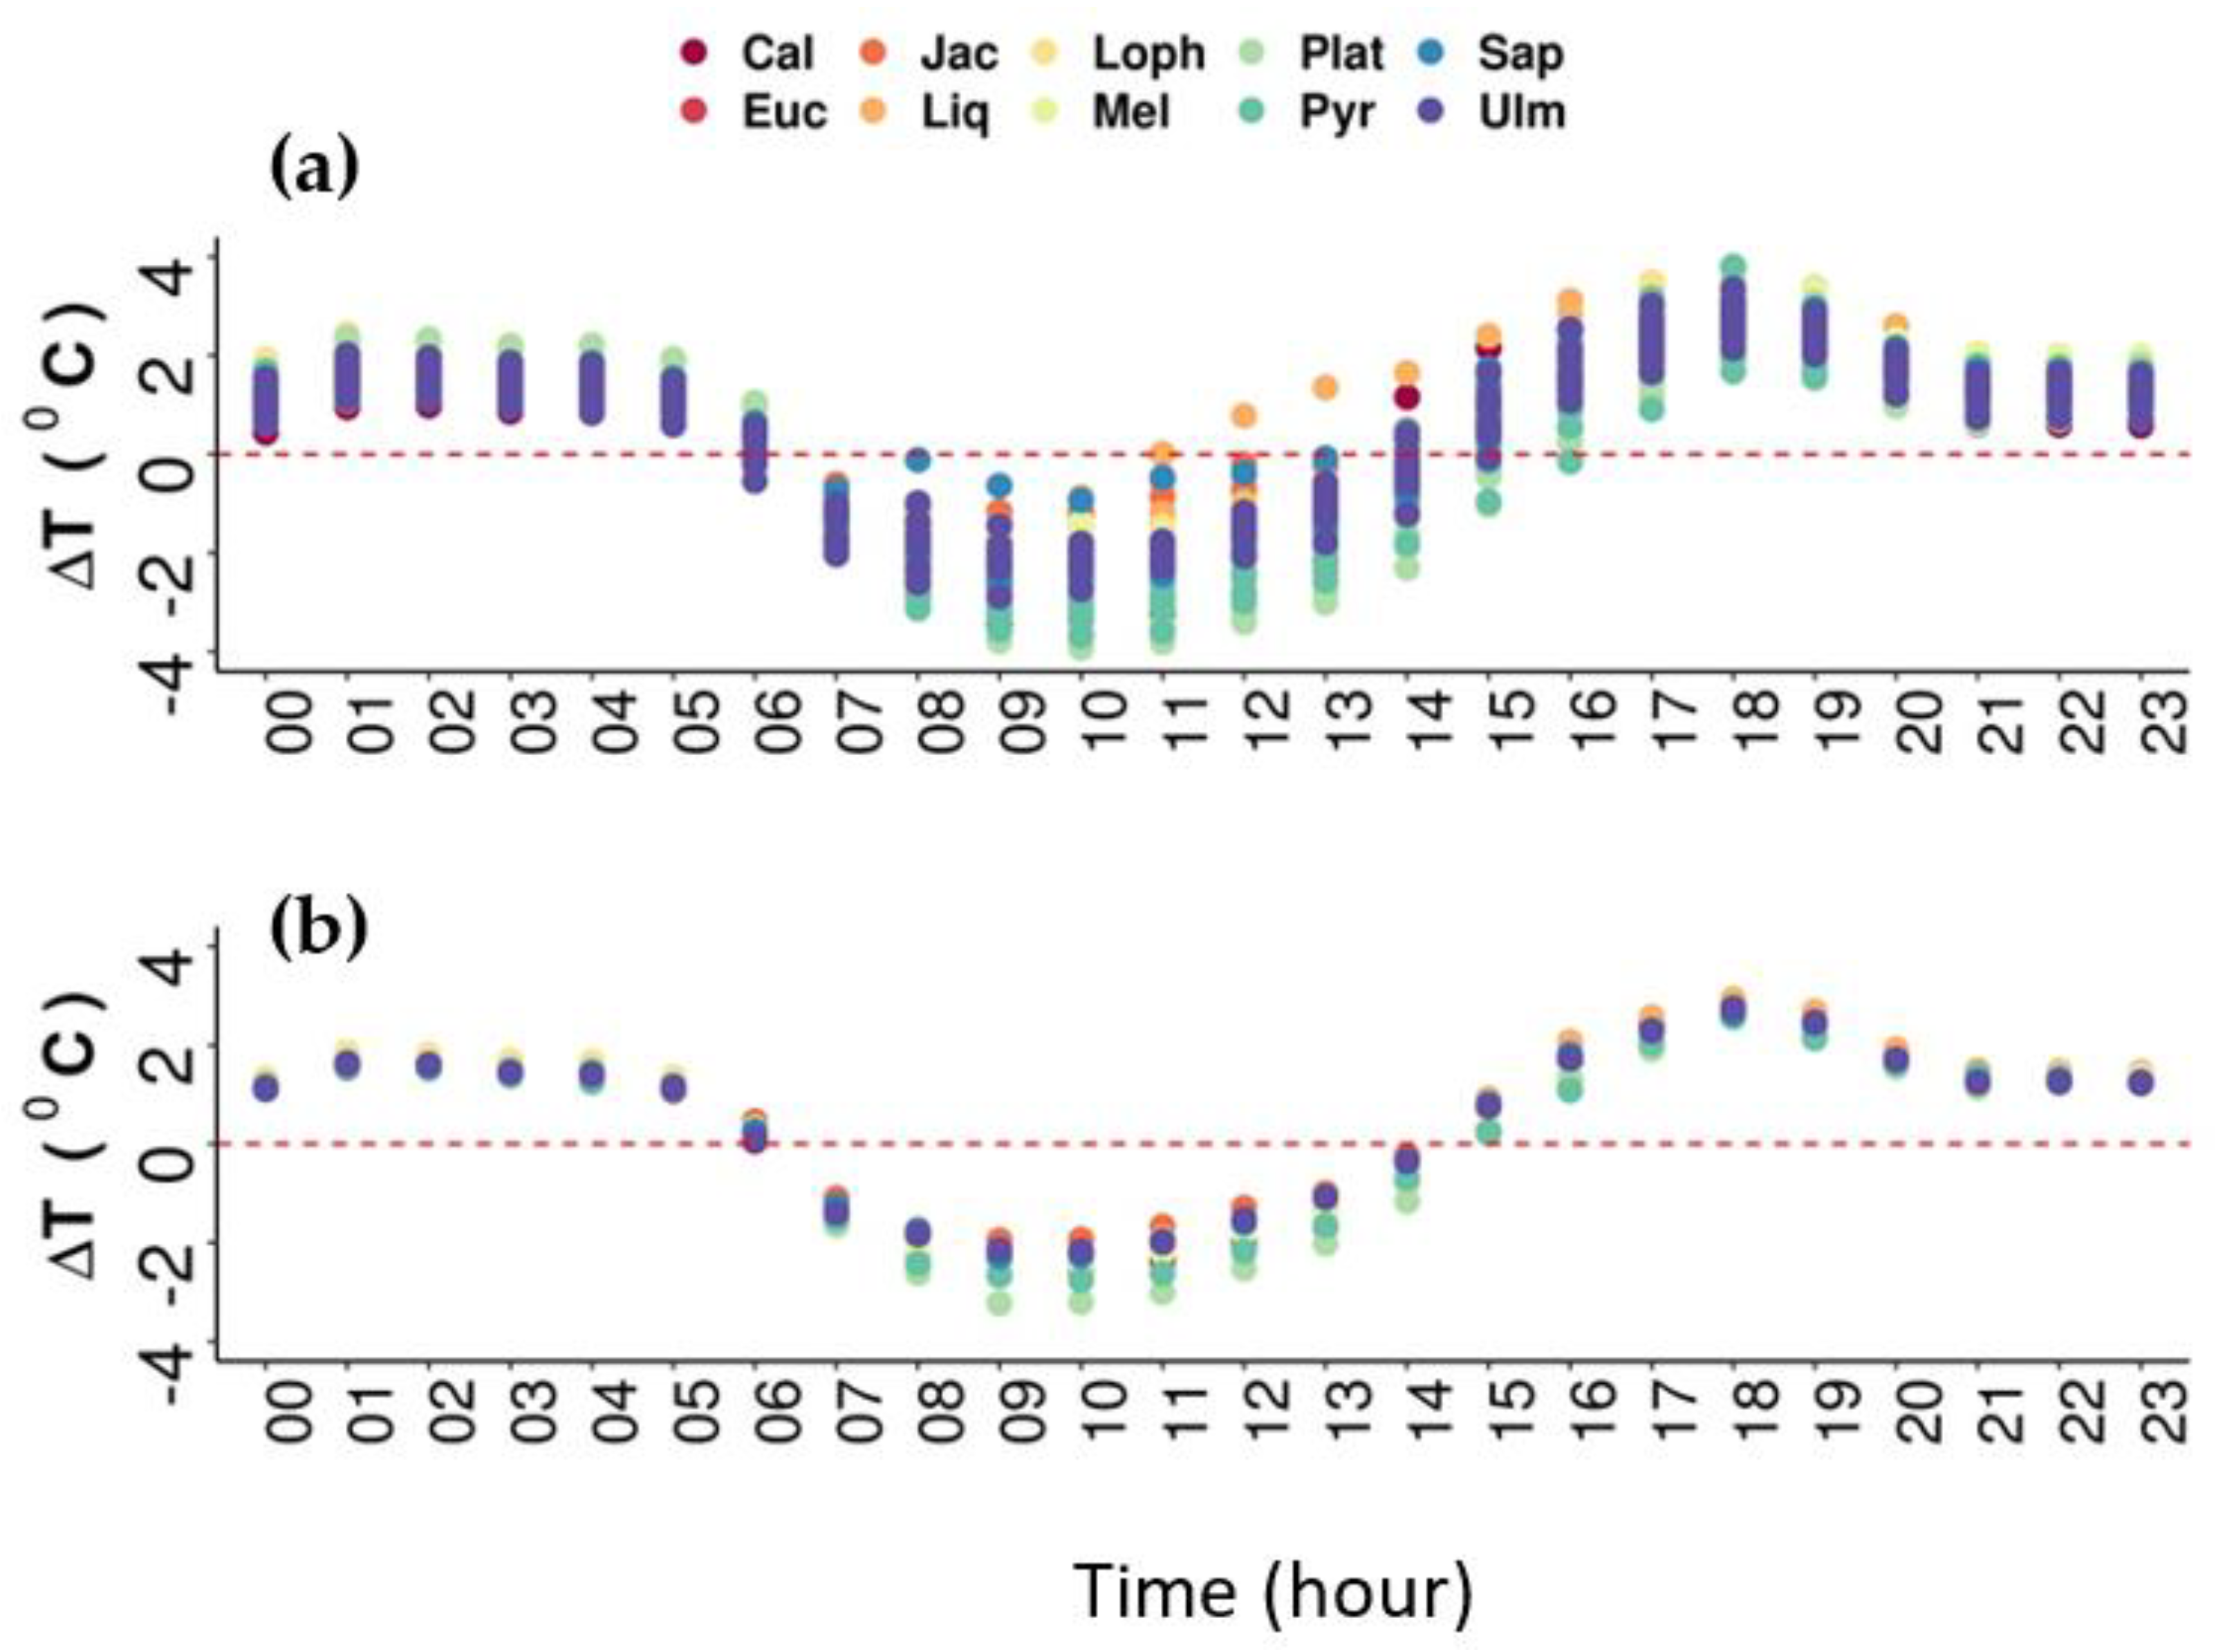
Temperature differences between ambient air and the air below the crowns (ΔT) of individual trees and species showed a diurnal pattern (Figure 3a,b). In summer 2019–2020, the mean maximum cooling benefit (i.e., the coolest sub-crown temperatures relative to ambient air) for individual trees and species was observed in the morning between 09:00 and 10:00 h (local time) with a mean maximum of 3.9 °C and 3.2 °C, respectively. Sub-crown temperatures were typically below ambient from 07:00 to 14:00 h, with positive ΔT values recorded outside of this time interval (Figure 3a,b). At 18:00 h, mean maximum sub-canopy air temperature of individual trees and species was up to 3.8 °C and 2.9 °C warmer than the ambient temperature (Figure 3a,b). A drop in positive ΔT values from late afternoon peaks to the early part of the night was observed, although nighttime values remained positive (i.e., warmer sub-canopies than ambient air) until around 06:00–07:00 am. Mean nighttime warming under individual trees ranged from 0.6 °C to 2.45 °C, with species-level ΔT values ranging from 1.08 °C to 1.86 °C.
3.2. Species Differences
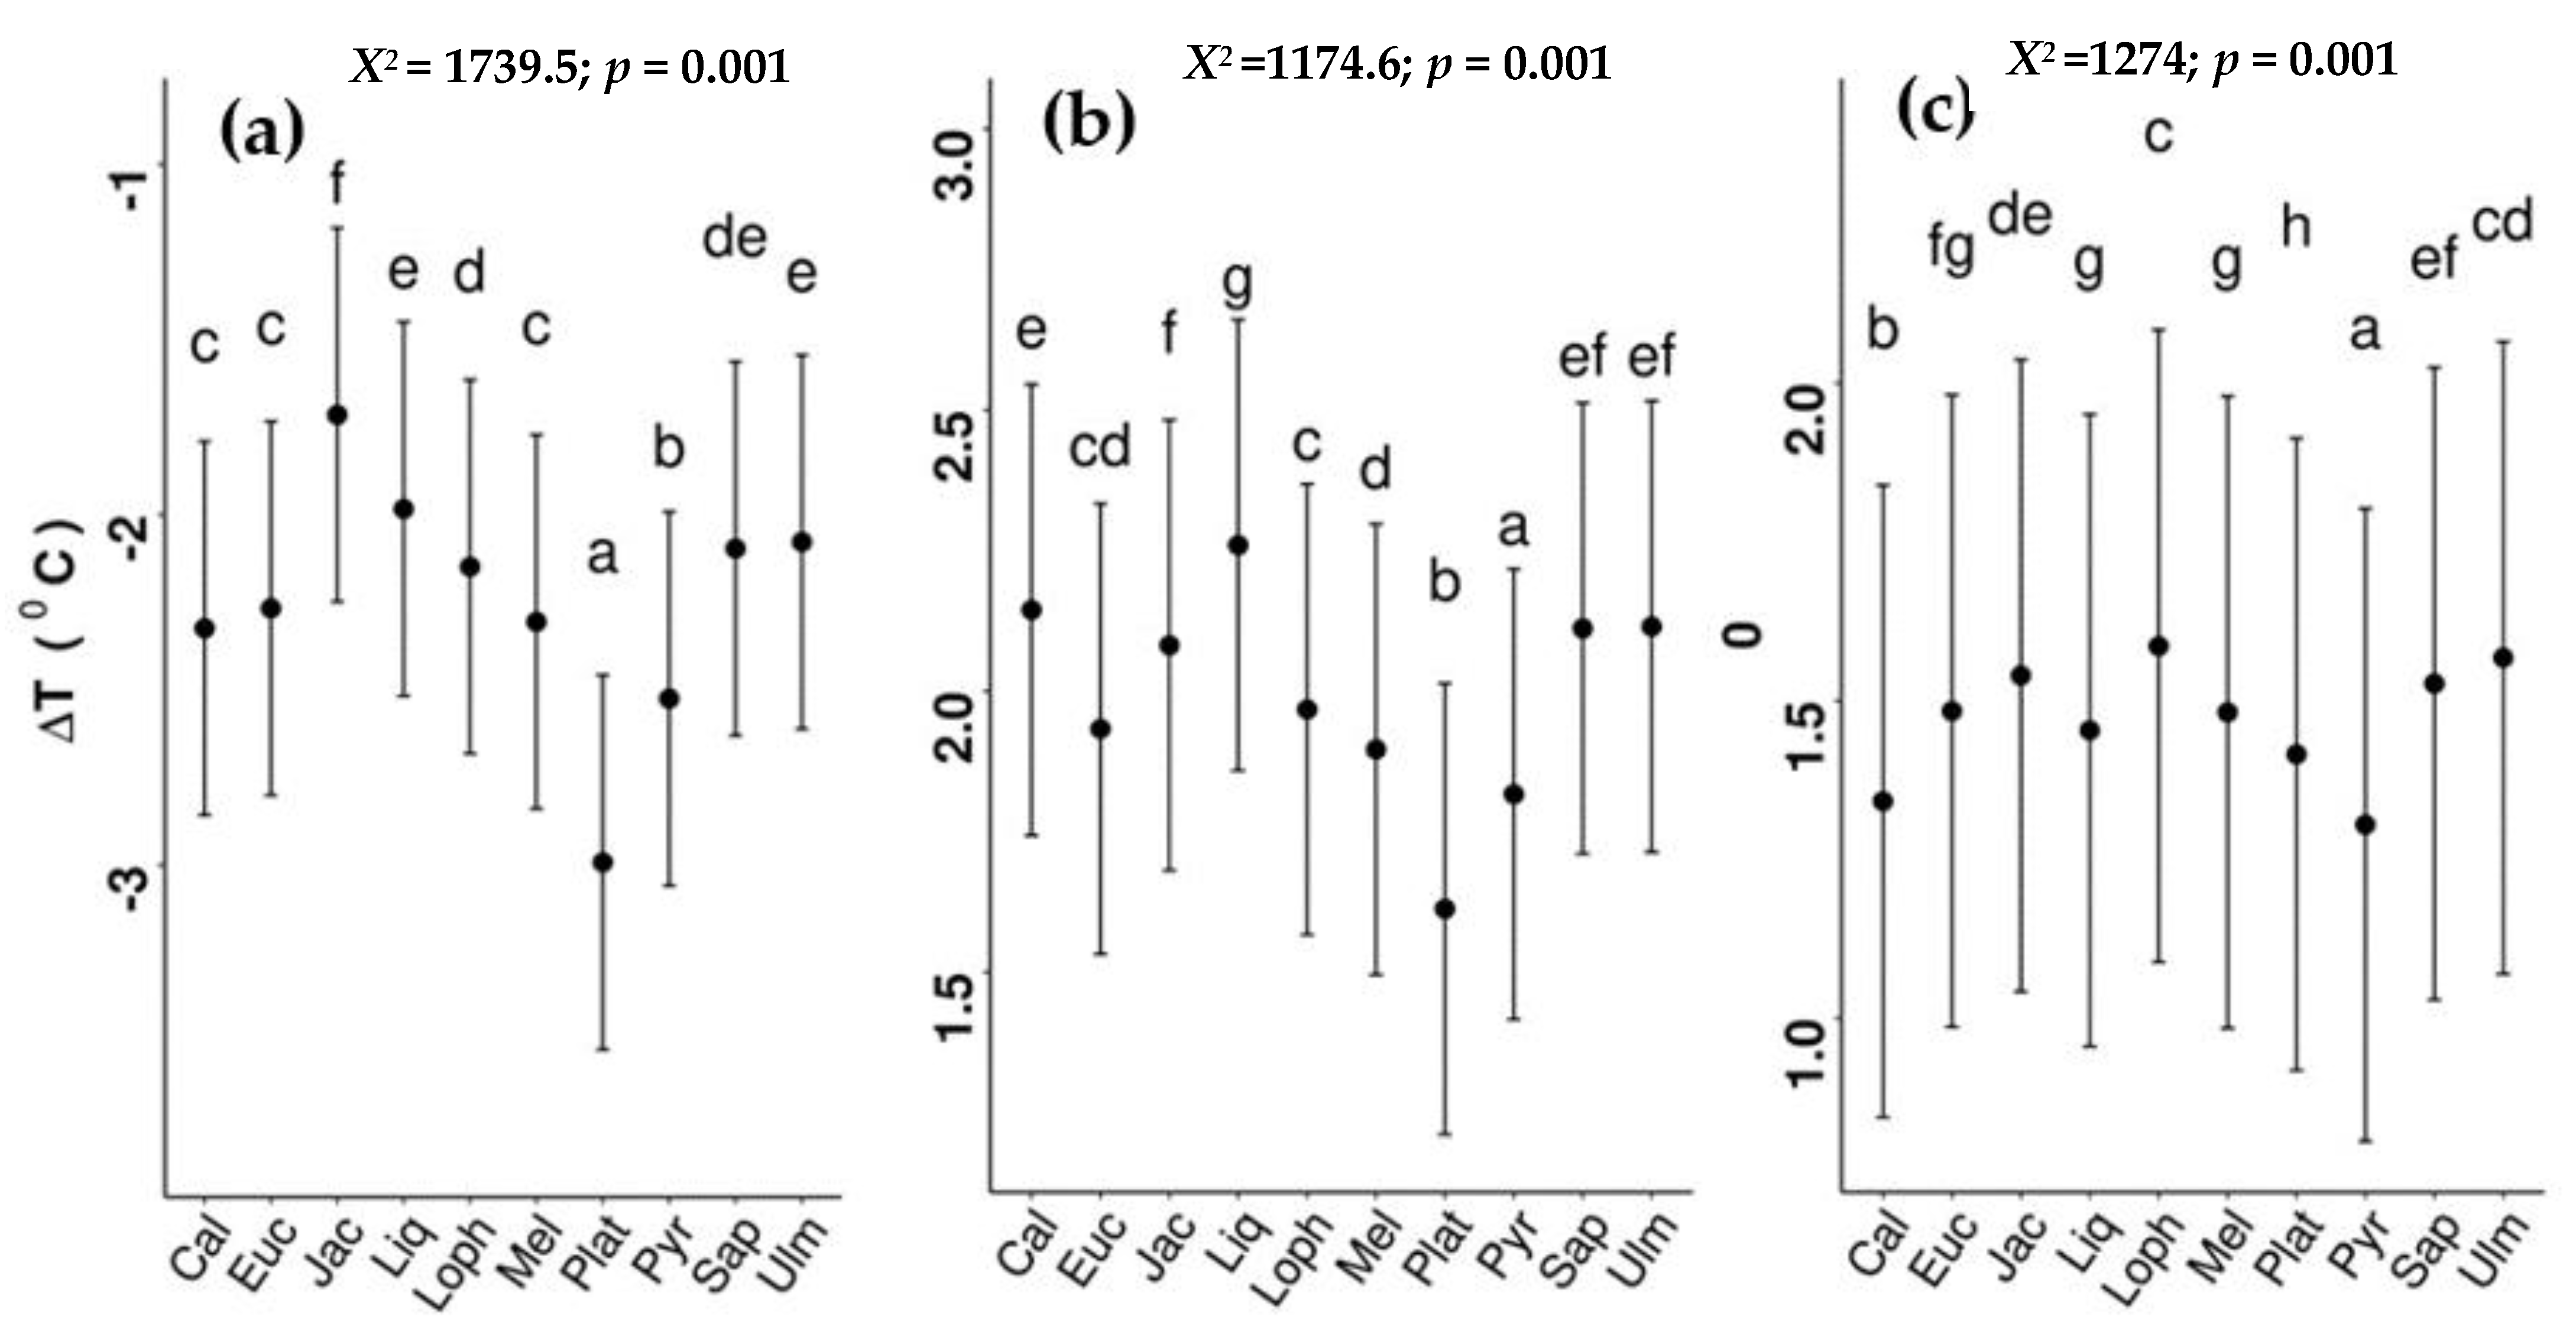
Delta T differed among species and across different times of the day (Supplementary Table S1). In the morning (07:00 to 13:00 h), P. acerifolia (mean −3.02 °C) had the most negative ΔT (i.e., greatest cooling benefit), followed by Pyrus calleryana (−2.58 °C); the overall (all species) mean maximum value for ΔT was −1.27 °C (Figure 4a). Jacaranda mimosifolia had the least negative ΔT in the morning, followed by Liquiambar styraciflua, S. sebiferum, and U. parvifolia.
Sub-canopy air temperatures for all species were warmer than ambient air temperatures in the afternoon (i.e., positive ΔT) and this pattern continued at nighttime for some species (e.g., E. microcorys, J. mimosifolia, and Lophostemon confertus) (Figure 4b,c). Although the rank order of tree species’ ΔT differed in the afternoon, compared to morning, P. acerifolia and P. calleryana had relatively cooler sub-canopies (although still warmer than ambient air temperature), while those under L. styraciflua were the warmest.
At nighttime (00:00 to 05:00), mean ΔT differences between species (average of 0.19 °C) were smaller than during the daytime, although sub-canopy temperatures in Callistemon viminalis, P. calleryana, S. sebiferum and U. parvifolia were slightly lower than those of other species (Figure 4c).
3.3. Relationships between ΔT, Climatic Variables, and Tree Characteristics
To evaluate relationships between ΔT, tree characteristics and climatic variables, all data points (10 min resolution) for the 37 days for all individuals (96 trees) were used for analysis. The lmer model for the morning (07:00 to 13:00 h) showed that canopy-associated ΔT was affected by microclimatic variables and tree traits (R2 = 0.48 p < 0.001).
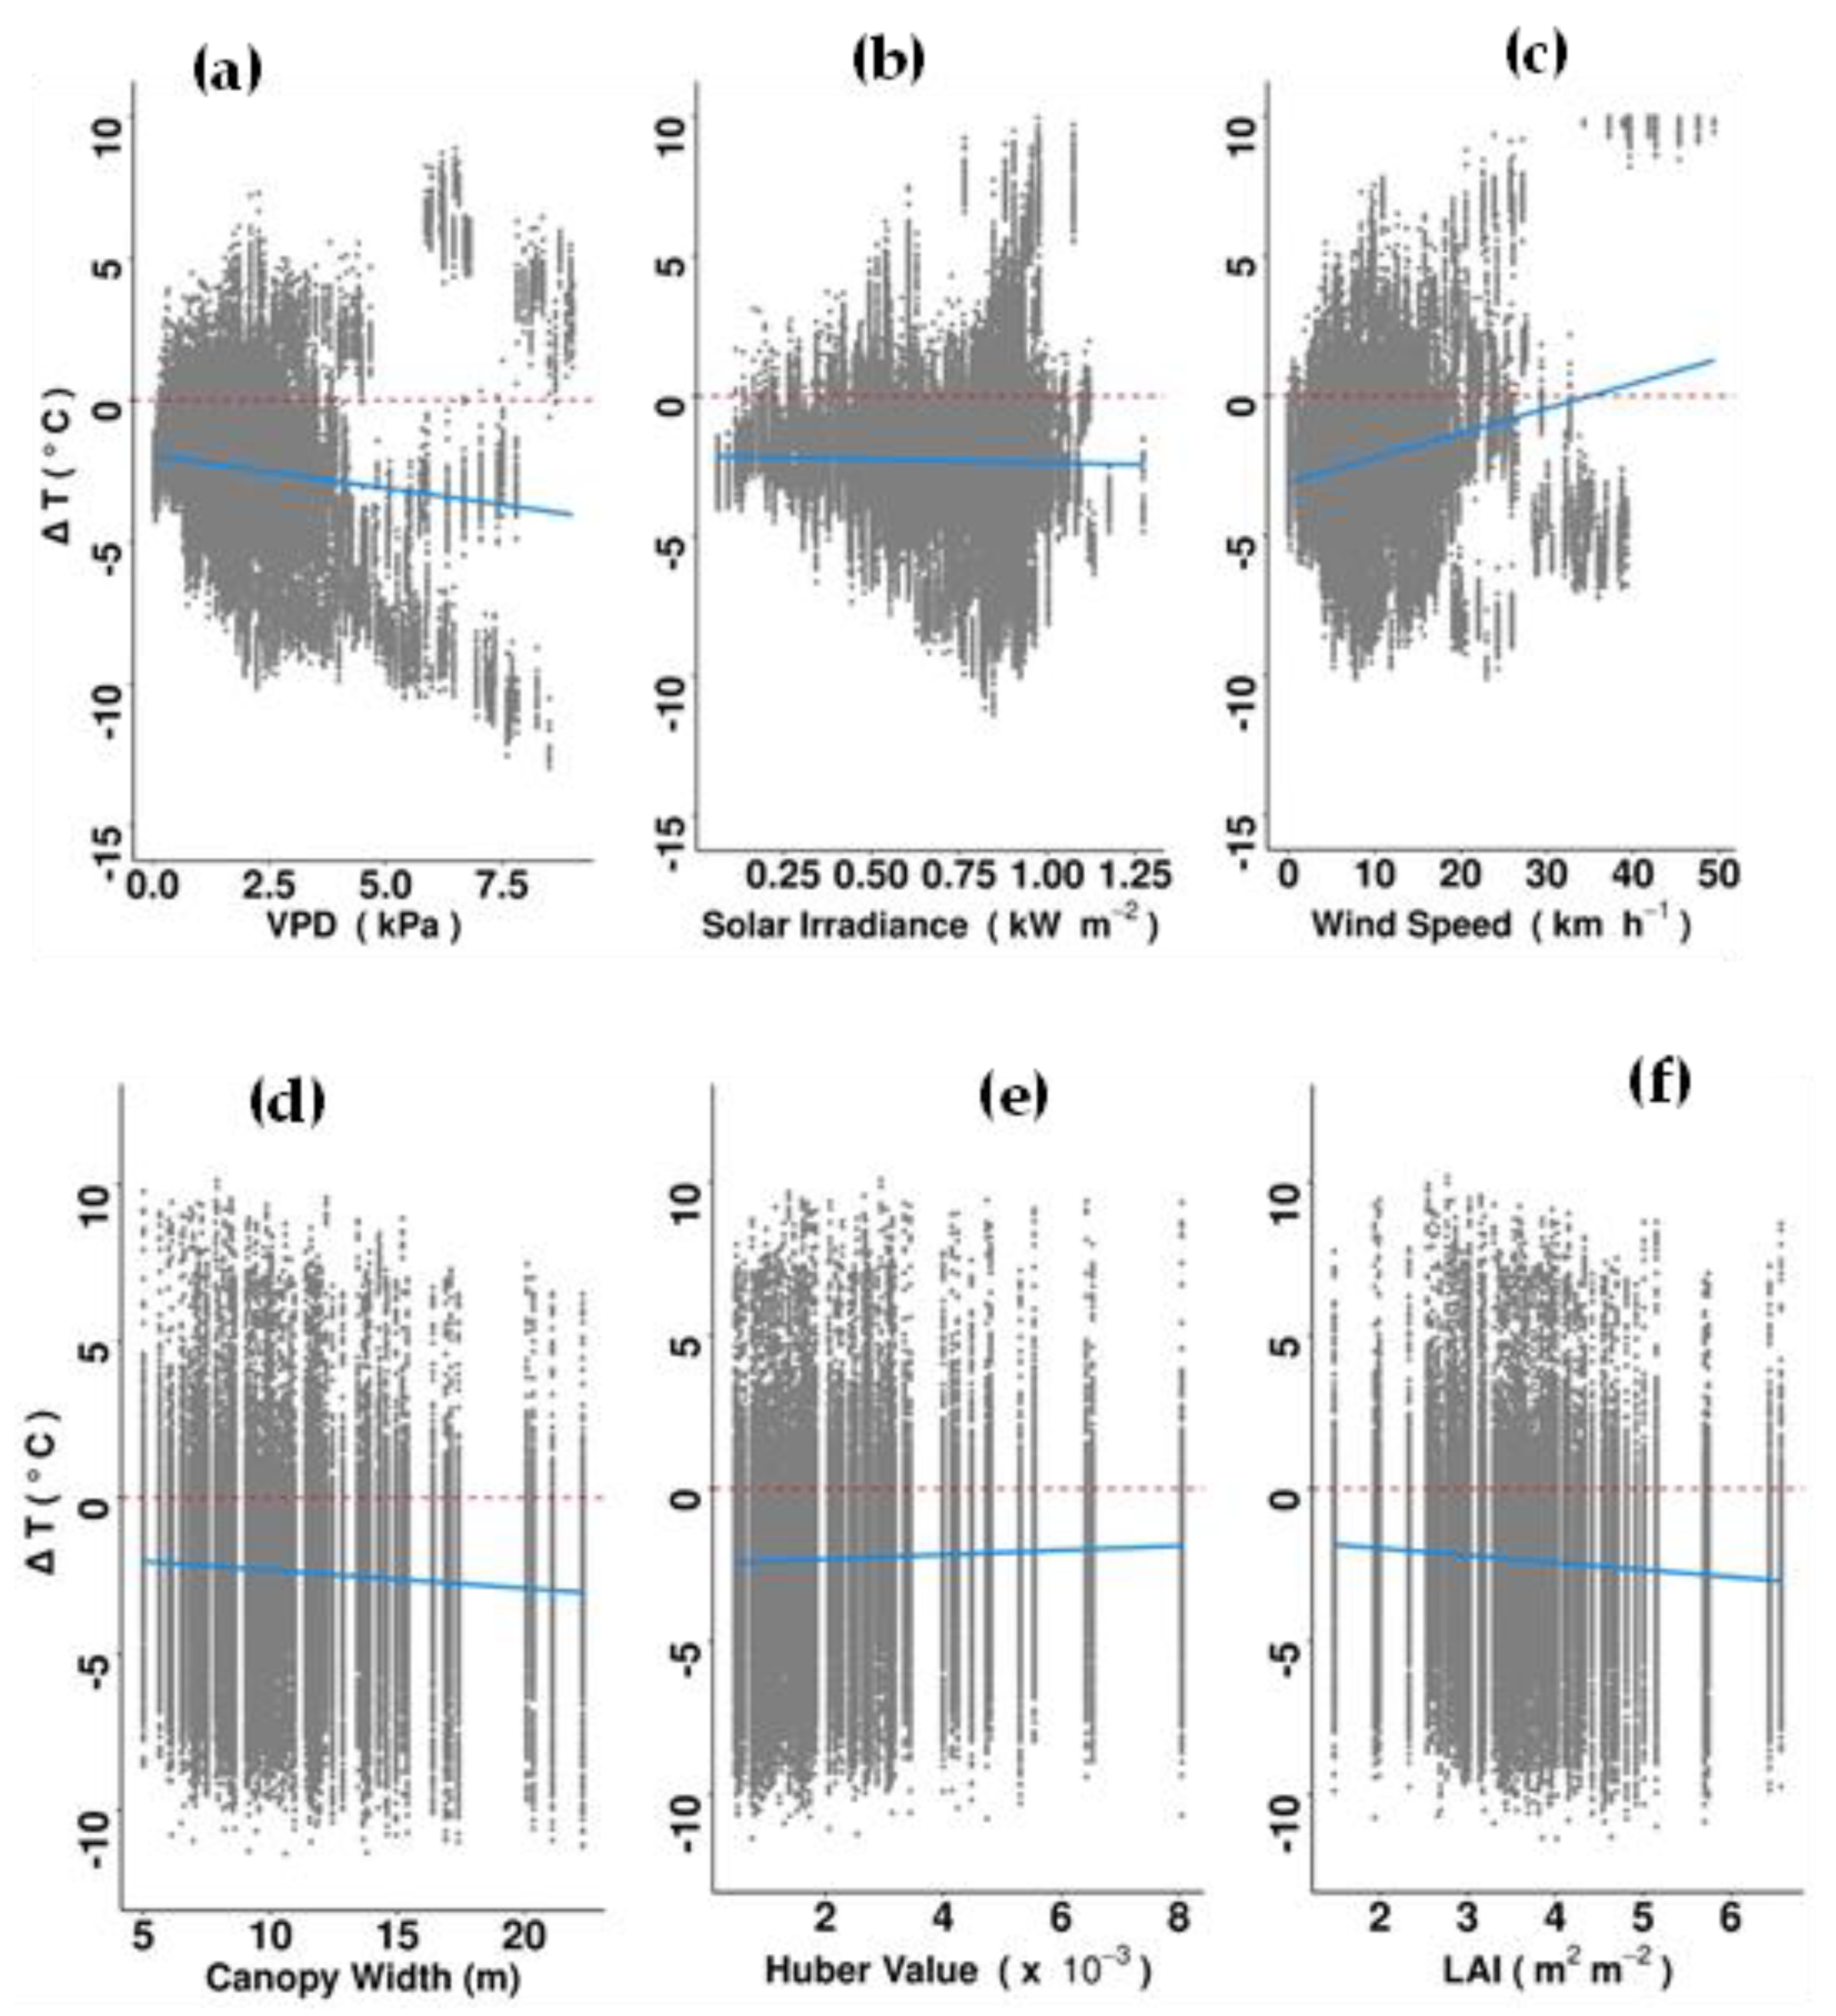
Delta T was negatively related to LAI and crown width (i.e., sub-canopy temperature was lower when tree crowns were wide and dense), but not with other traits (Supplementary Table S2). Delta T values became more negative (greater cooling benefits) with increasing VPD and windspeed (Figure 5). The opposite pattern was found between ΔT and solar irradiance. Among the evaluated climatic parameters and tree traits, VPD (t-value 23.10, p < 0.001) and LAI (t-value = 18.78, p-value = 0.001) explained the greatest amount of variance in ΔT (Supplementary Table S2).
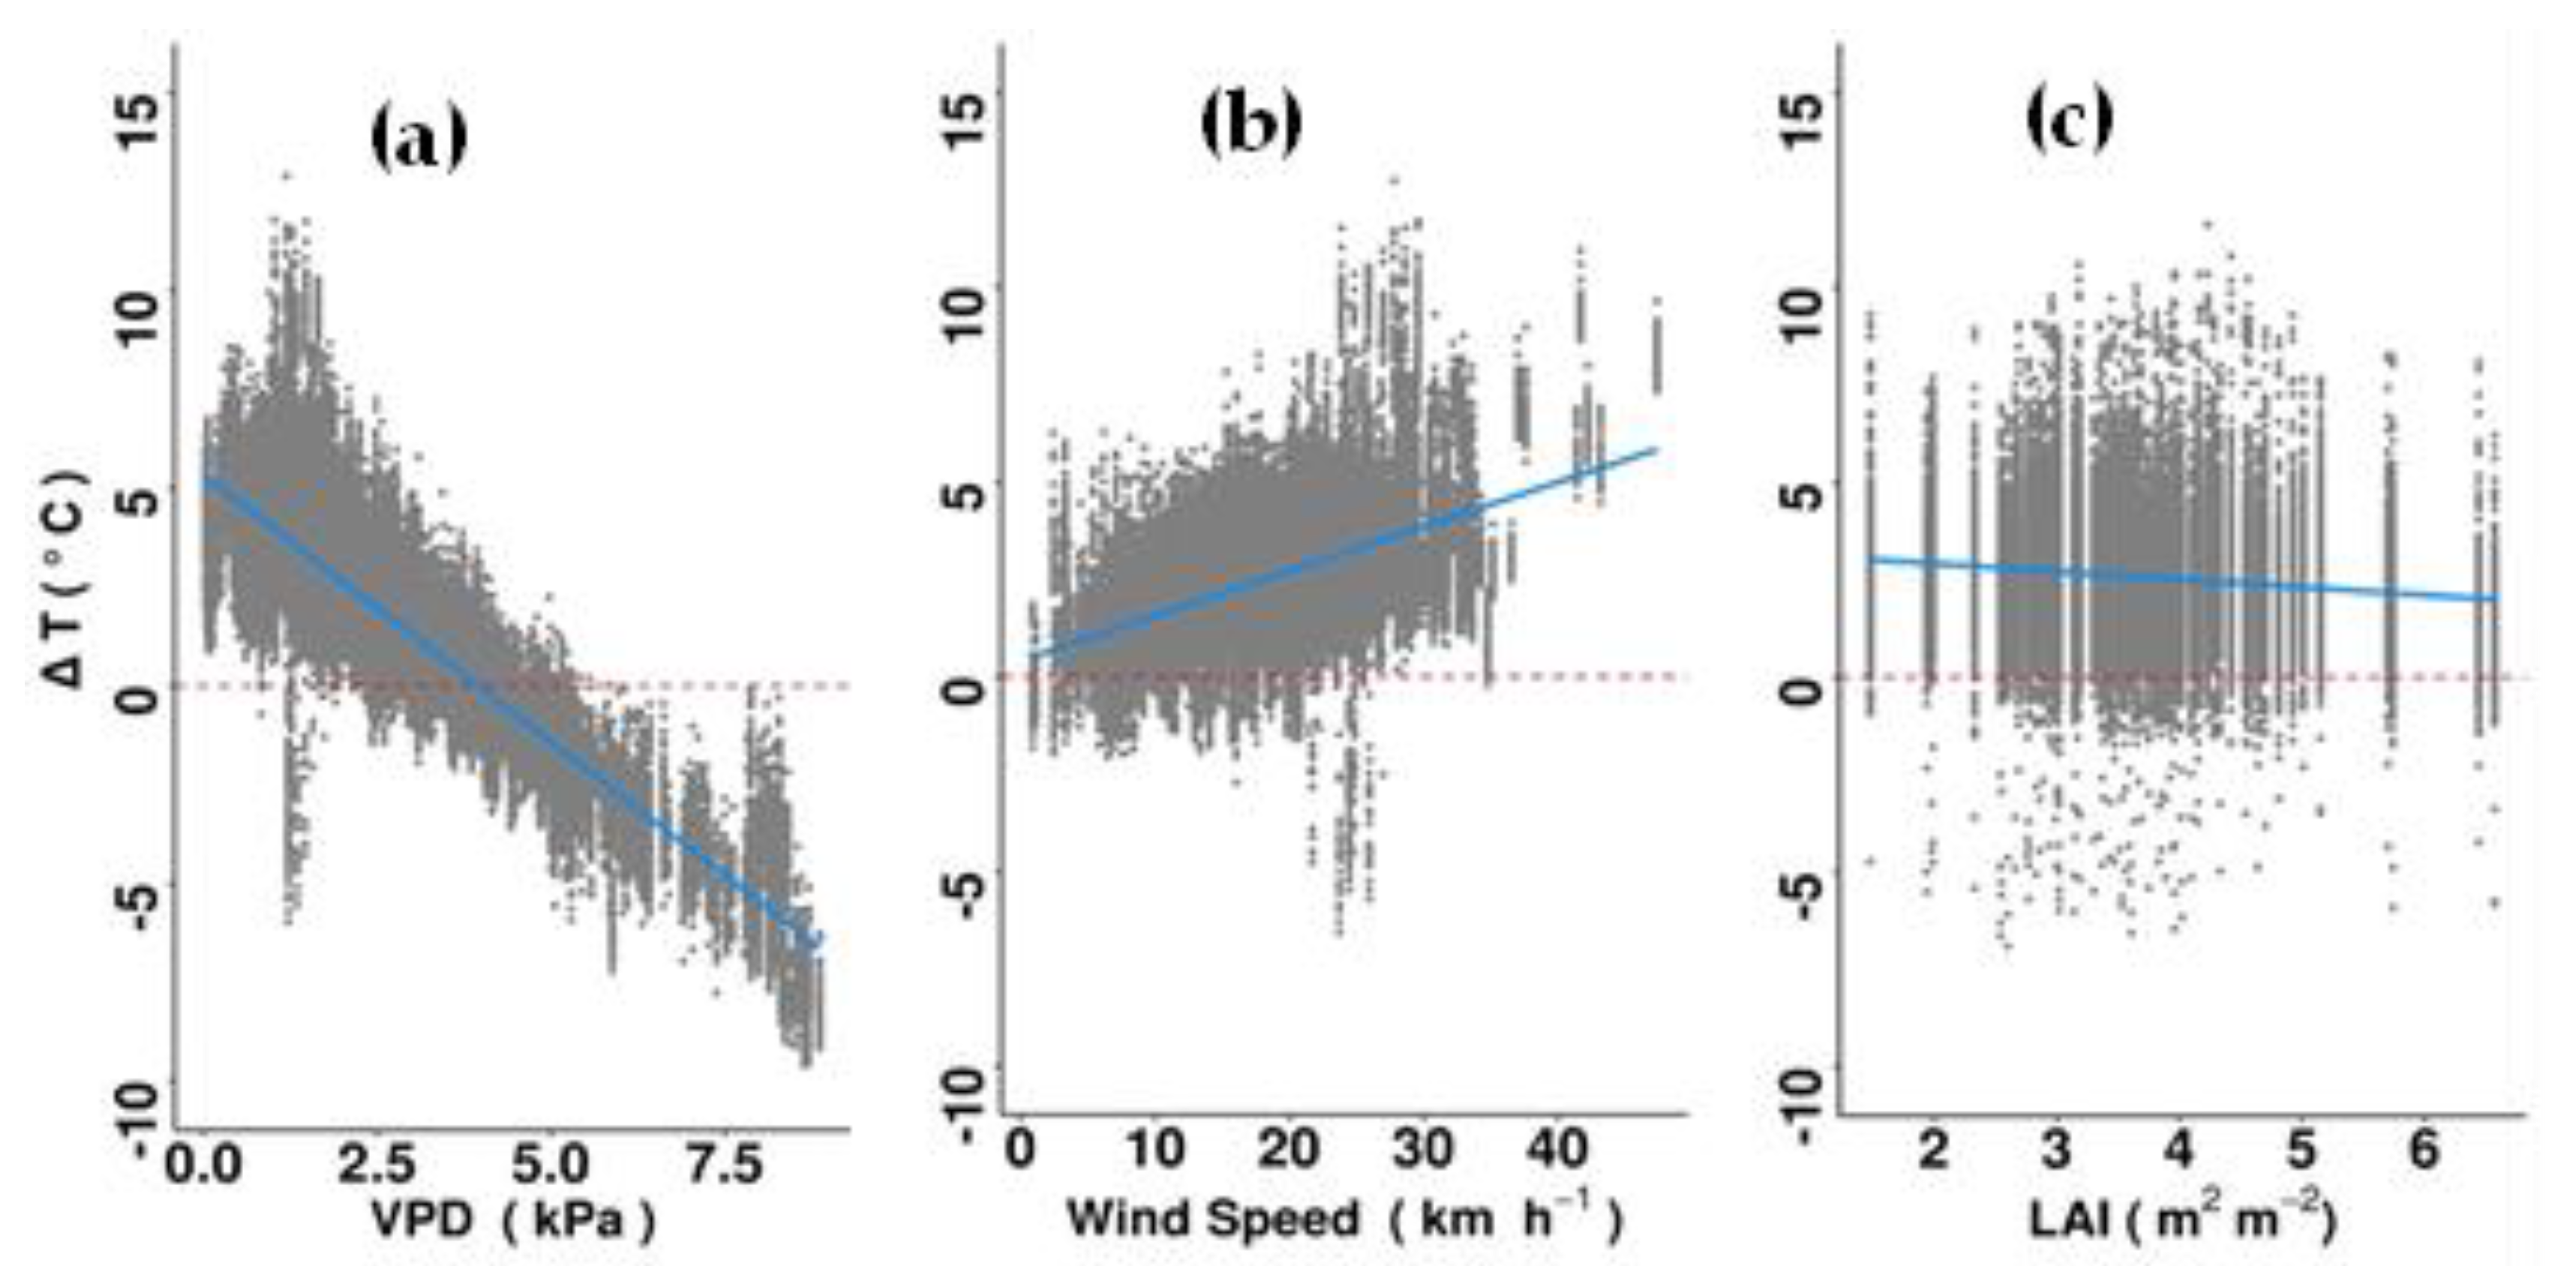
In the afternoon (15:00 to 19:00), ΔT was inversely related to VPD and solar irradiance (i.e., cooler sub-canopy temperatures with higher values of these climate variables) (Supplementary Table S3). The relationship between ΔT and VPD switched from positive to negative at a VPD value of ~3.5 kPa (Figure 6). There was also a significant positive relationship between ΔT and windspeed (i.e., atmospheric mixing). Among the climatic variables, VPD and windspeed explained the highest amounts of data variance. Delta T was significantly and negatively related to canopy width and LAI. Leaf area index (LAI) explained the greatest amount of data variance of all measured traits (Figure 6; Supplementary Table S3).
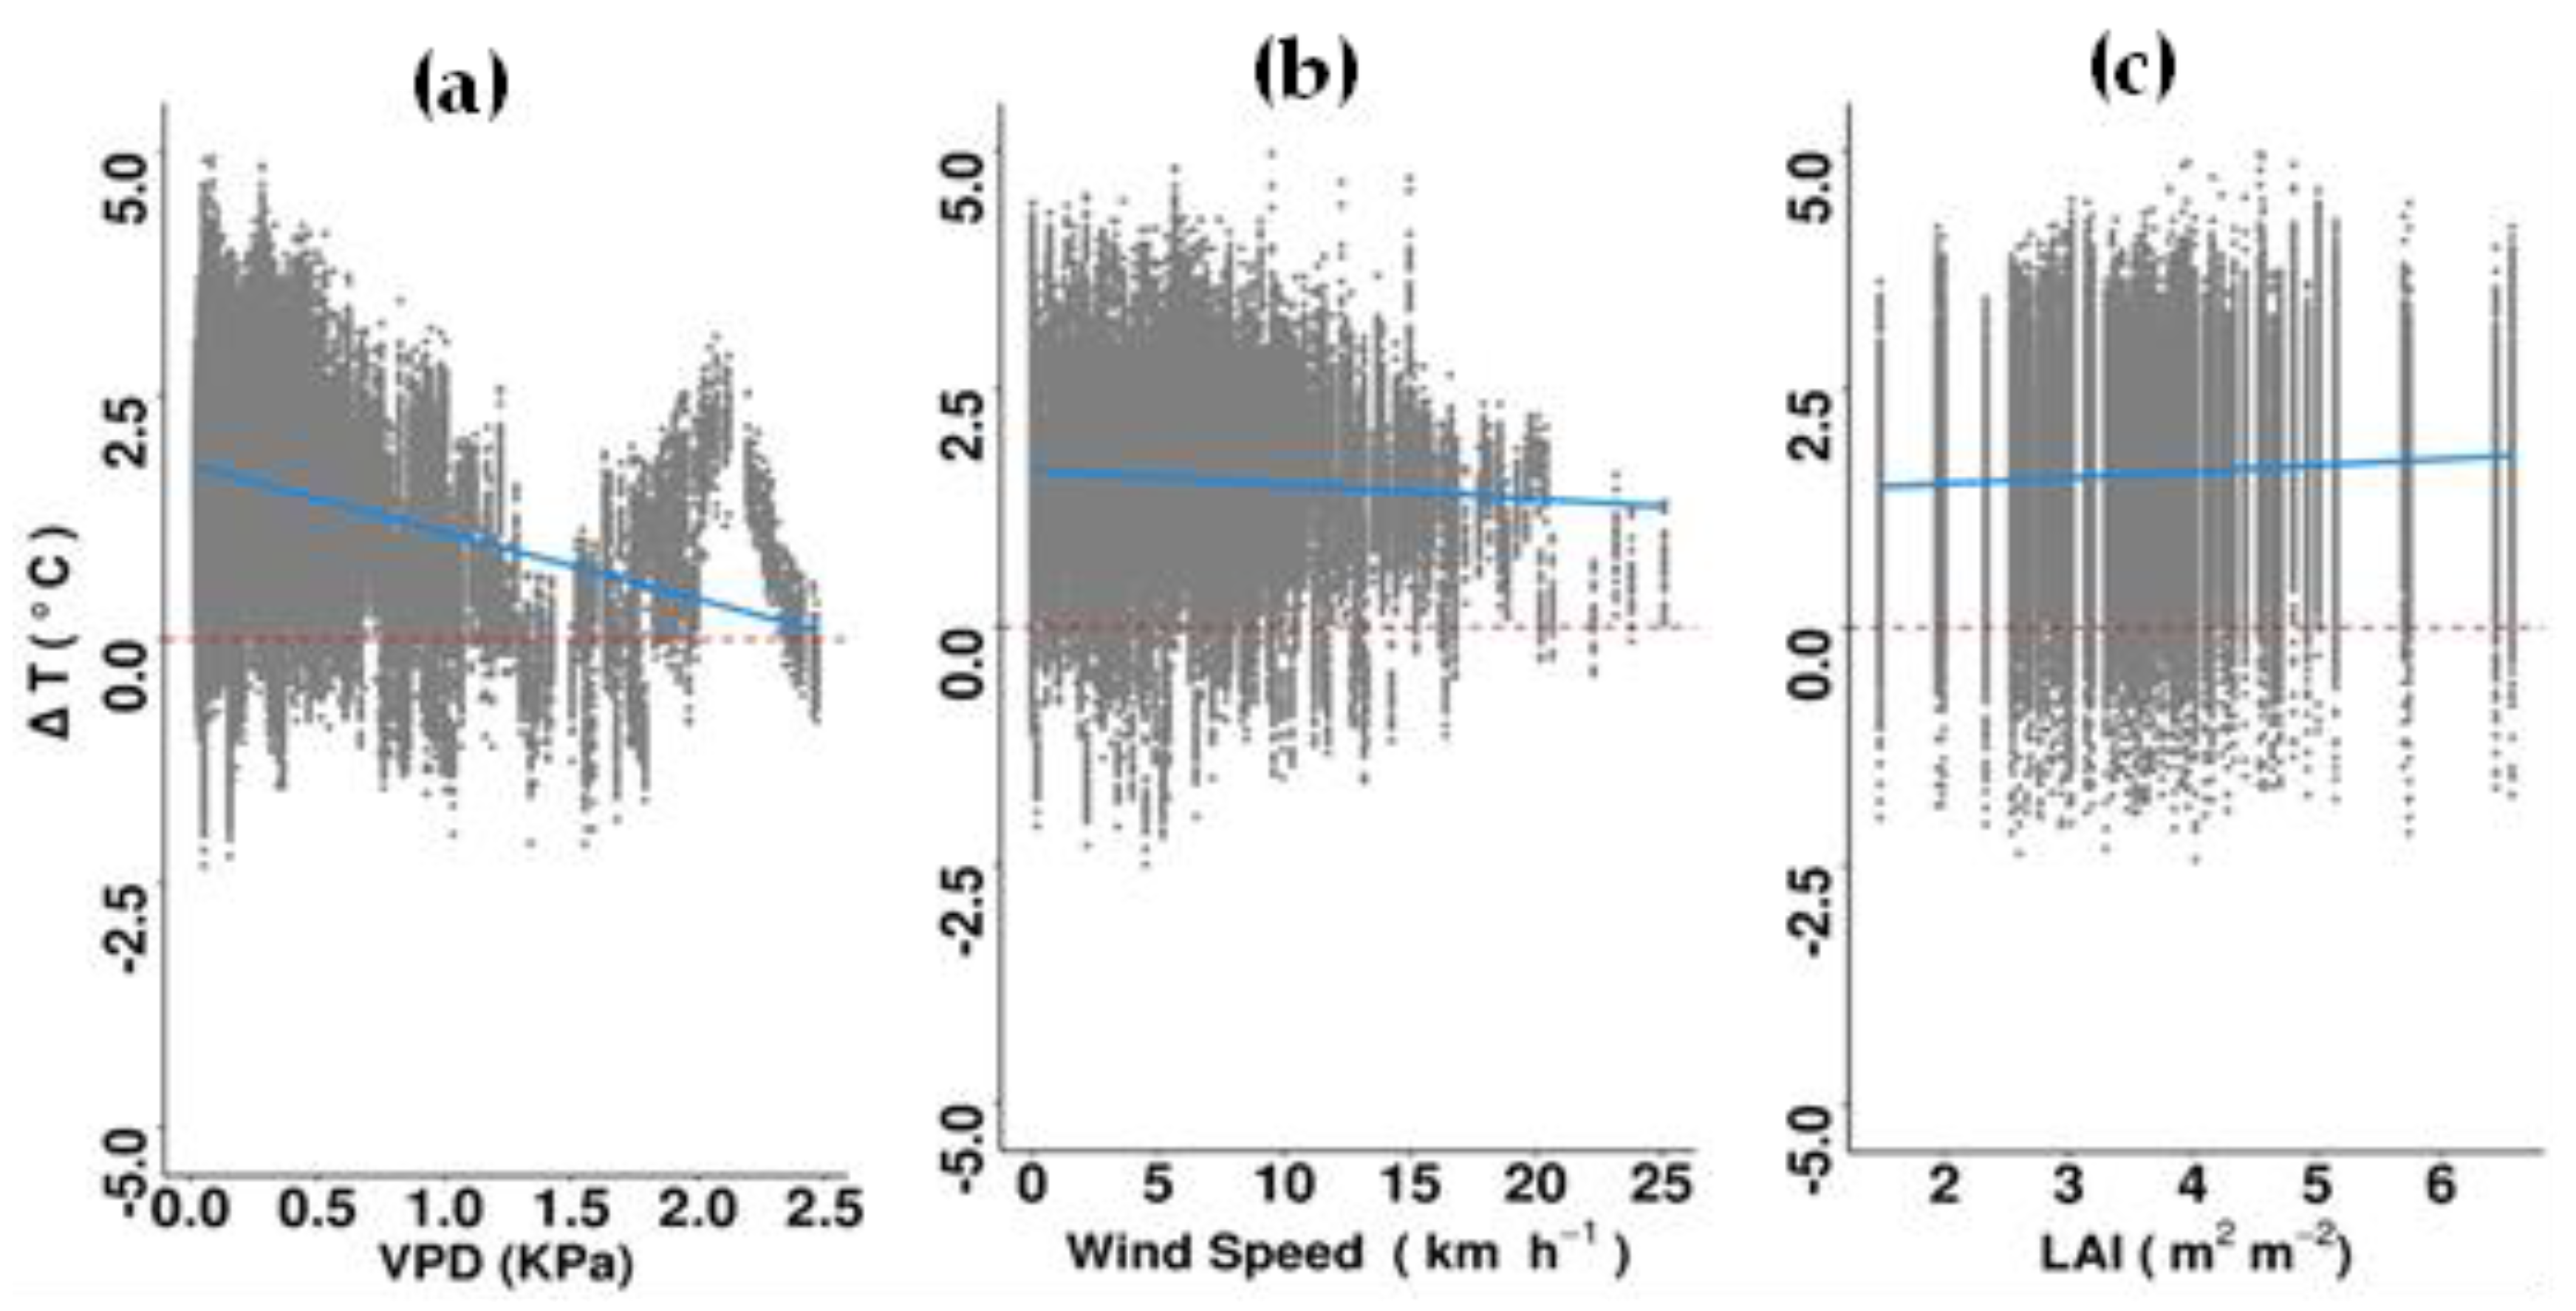
During the night, warming effects decreased with increasing VPD and windspeed (R2 = 0.93, p < 0.0001). The tree canopy-associated warming effect increased with tree height and higher values of LDMC. VPD was the climate variable explaining the greatest amount of variance in ΔT, and LAI was the tree trait with the strongest relationship with nighttime ΔT (Figure 7; Supplementary Table S4). Delta T was significantly and negatively correlated to the Huber value and canopy width (Supplementary Table S4).
4. Discussion
A large dataset of sub-canopy air temperatures allowed this study to determine how common urban tree species in Western Sydney modify daytime and nighttime microclimates in summer. The inclusion of local climate variables and morphological trait data highlighted both the importance of species traits and the role of microclimatic parameters in the cooling benefits offered by urban trees.
Tree characteristics are known to influence air temperatures in urban environments. The mean maximum 3.9 °C of air cooling in the morning recorded in this study is greater than the ∼1.8 °C cooling reported by Alonzo et al. [52] in Washington DC, USA, and the ∼1 °C effects observed in Madison, Wisconsin, USA, by Ziter et al. [53]. Tree species in the current study differed significantly in terms of their cooling/warming effects, with average species-level ΔT values varying two-fold. Among the 10 species studied, P. acerifolia (mean 3.02 °C; mean LAI 3.62 m2 m−2 and mean crown width 16.21 m) provided the greatest cooling benefits, followed by P. calleryana (mean 2.58 °C, mean LAI 4.35 m2 m−2 and mean crown width 7.52 m) in the morning. Several studies have investigated the effect of LAI on sub-canopy air temperatures and showed that daytime cooling benefits improve with increasing LAI values [22,43,54]. At the other end of the scale, J. mimosifolia had the smallest impact on daytime air temperatures during summertime, with an average reduction of 1.5 °C. This species had no leaves and therefore a low LAI (mean 1.75 m2 m−2) during its flowering period from October to early December. However, when this species is in full leaf (mean LAI of 3.42 m2 m−2 measured in February 2020), it can potentially provide much greater cooling benefits, as has been observed in Wollongong, NSW, Australia, where mean daytime cooling of 5.1 °C on days with temperatures of 25 °C or above has been associated with this species [55].
Similarly, wider crowns can potentially reflect a greater proportion of incoming solar irradiation and provide a larger shaded area, resulting in greater cooling benefits [56]. Wujeska-Klause and Pfautsch [43] observed that air temperatures of streets with high canopy cover were, on average, 0.5 °C (max 2.1 °C) cooler than streets with low canopy cover, again highlighting the importance of canopy size. Trees with large canopies cast shade over large areas, which can lead to a decrease in local air temperature [24]. Shaded areas also absorb less solar irradiation, resulting in lower energy storage and re-emission in the form of sensible heat, which can warm the surrounding air [57,58]. Overall, the findings of relationships between sub-canopy ΔT (during morning and afternoon) and LAI and canopy width provide partial support for the first hypothesis of the current study and highlight the importance of shade cast (both in terms of the absolute amount and intensity of shade) for daytime temperatures in urban streetscapes.
The observed interactions between canopy-associated cooling and solar irradiance across the day support observations by Motazedian et al. [18] and Shashua-Bar et al. [59]. Both studies reported tree shade-associated air temperature reductions and human thermal comfort in the morning in cities located in temperate oceanic (Melbourne, Australia) and arid (southern Israel) climates, respectively. Solar energy drives evapotranspiration in the morning, particularly from 07:00 to 10:00 h [60], which may explain the increase in magnitude of morning cooling benefits with increasing solar irradiance in this study. High solar zenith angles in the morning can also lead to large structural shading, slowing the warming of man-made surfaces and thereby increasing the cooling benefits of street trees [61].
Canopy-associated warming was observed in the afternoon and continued overnight, with average temperature increases of 1.19 °C (afternoon) and 1.53 °C (night), relative to ambient air. Among the 10 tree species in the current study, L. styraciflua had the warmest afternoon sub-canopy temperatures (mean 2.43 °C) and P. acerifolia (mean 1.78 °C) the lowest. Although positive afternoon ΔT values decreased with increasing LAI, again indicating that shade intensity can influence the local microclimate by reducing thermal loading of surrounding man-made materials, they still mostly indicated higher sub-canopy temperatures than ambient air. The positive relationship between afternoon sub-canopy air temperatures and windspeed in this study highlights the important role of atmospheric mixing [62,63]. The transport of warm air masses from the hot, arid interior of the continent into suburban areas in the afternoon likely negated canopy-associated cooling, especially when combined with high VPD and associated stomatal closure. This, combined with re-radiated heat from surrounding buildings likely plays an important role in our observation of afternoon sub-canopy warming. Several studies have reported that trees with high LAI can trap re-radiated heat in the evening and overnight [55,64,65,66]. For example, a study conducted in Washington DC, found that the cooling benefits of trees located along streets were less than trees surrounded by grass, due to re-radiated heat from beneath the canopy and surrounding surfaces, highlighting the importance of planting context [52]. Disentangling the effects of canopy density on both trapping re-radiated heat (resulting in warming) and increasing the extent of sub-surface shading (thereby reducing re-radiation of sensible heat and reducing sub-canopy air temperatures) is a topic that warrants further study.
Canopy-associated warming can also be a response to sub-optimal water availability limiting transpiration. This, in turn, reduces latent heat flux and generates large amounts of sensible heat, thereby increasing local air temperature [29]. We speculate that the extreme nature of the weather in the runup to and during the study period played a role in observed sub-canopy warming, particularly during the afternoon. From 2017 to 2019, the study sites experienced very low levels of rainfall, with 2019 having the lowest rainfall on record [67]. Furthermore, during the “black summer” bushfire season of 2019–2020, Richmond and Cranebrook experienced 10 days above 40 °C, representing a period of extreme heat [68]. During this period, Tabassum et al. [69] found widespread evidence of tree canopy damage in Penrith, Western Sydney, while Marchin et al. [64] reported that around 60% of plant species they studied in Western Sydney experienced dieback due to the extremely hot and dry conditions prevailing during this time. While high temperatures and VPD during heatwaves are known to result in stomatal closure [66], the lack of physiological measurements in our study does not allow us to conclude that stomatal closure and the associated reduction in latent heat loss was responsible for sub-canopy warming during afternoon periods—a potential “disservice” of urban trees. We do, however, interpret the higher afternoon sub-canopy temperatures as evidence of both the role of atmospheric mixing, discussed above, and the urban heat island effect, with high levels of afternoon re-radiated heat from surrounding man-made materials captured by our sub-canopy dataloggers.
In terms of the response of trees to water stress, tree species can differ widely in their stomatal (and thus transpirational) strategies. These can be characterized as isohydric (maintaining leaf water potential by reducing stomatal conductance) and anisohydric (maintaining stomatal opening despite water limitation) responses [70,71]. Anisohydric trees can keep their stomata open for longer than isohydric species under sub-optimal water conditions and therefore continue transpiring water [72]. However, actively increasing water loss at high temperatures can make trees vulnerable to hydraulic failure under drought conditions [71,73]. A lack of data on tree species’ response to water deficit makes it difficult to speculate on how water use strategies influence the extent of cooling. This is, therefore, a key knowledge gap, particularly in the context of rising global temperatures, more frequent heatwaves and increasing human exposure to urban heat.
Vapor pressure deficit (VPD), which influences stomatal function and evapotranspiration [74], was posited to have an indirect, yet important influence on sub-canopy temperatures and ΔT across the day [75]. Indeed, evapotranspiration has been shown to decrease air temperatures by 2.0 to 8.0 °C in vegetated areas [76]. VPD typically increases rapidly in the morning and reaches a maximum rate by early afternoon, then declines toward dusk [77]. In the morning, under low VPD conditions, most plants keep their stomata open and maintain a stable transpiration rate. Progressive stomatal closure in the late morning leads to a reduction in cooling (ΔT moving towards zero) before VPD reaches its highest levels [78]. In this study, VPD had similar effects on morning and afternoon ΔT (>3.5 KPa), which supports our hypothesis of positive impacts of VPD on the contribution of transpiration to canopy cooling.
Despite the common expectation that nighttime stomatal closure results in minimal transpiration after dark, studies have shown that transpiration can occur after sunset in plants from a wide range of climates [30,79]. Lindén et al. [80] and Ibsen et al. [17] observed a positive correlation between VPD and transpiration-driven, canopy-associated cooling at night. The findings of a negative correlation between nighttime VPD and ΔT in the current study also point to the possibility of nighttime transpiration, although, ΔT values were generally positive during nighttime. It can be speculated that, during periods of low ambient rainfall—such as was the case during the months preceding this study—trees need to conserve water and thus transpiration is likely to play a relatively small role in canopy-associated cooling, compared to more typical, wet summer conditions. In Sydney, street trees do not generally receive additional irrigation beyond the initial ~ 2-year establishment phase, even during prolonged dry spells [81]. Further study is needed to investigate whether VPD and water availability regulate nighttime transpiration by street trees in a manner that is similar to daytime.
Nighttime canopy-associated warming of up to 0.4 °C has been reported by Alonzo et al. [52] in Washington DC, and also by Wujeska-Klause and Pfautsch [43] in a study in Parramatta, NSW, Australia, around 40 km from the current study area. Taken together, nighttime warming (and in our study also during summer afternoons)—associated with street trees in heavily built-up areas—suggests that canopies can hamper the transfer of re-radiated heat from man-made surfaces into the atmosphere. The extent of canopy- and man-made surface cover are, however, known to affect the influence of vegetation on temperatures in the built environment [52,53,82], and the relative amount of man-made versus natural surface cover is clearly a key factor influencing urban heat dynamics.
Reducing the area of heat-absorbing dark and unshaded surfaces is critical for reducing air temperatures during summer, given the amount of heat stored and subsequently re-radiated overnight [83]. Indeed, the lack of difference in nighttime temperature between streets with low and high canopy cover reported by Pfautsch and Rouillard [84] strongly suggests that reducing the area of grey surface cover is key to reducing nighttime air temperatures in urban settings. The current study indicates that, in Western Sydney, trees play an important role in managing daytime temperatures and mitigating urban heat (particularly in the morning), but provide few, if any, temperature benefits overnight during the hot summer months. These results highlight the importance of developing a deeper understanding of the interactions between surface characteristics, local microclimate and tree cover for reducing urban heat and improving the livability of cities during both the day and night.
5. Conclusions and Implications
This study focused on identifying the canopy and leaf traits associated with lower urban air temperatures and the influence of climatic variables on diurnal patterns in canopy-associated cooling. Trees with dense (high LAI) and wide canopies were associated with the greatest cooling. Of the 10 species assessed here, P. acerifolia, which had the widest canopies, provided the highest cooling benefits in streetscapes across the studied suburbs. Other species with similarly dense and wide canopies may represent good options for reducing urban air temperatures, and this can potentially be factored into the design of future planting strategies. Trees provided the greatest level of summertime cooling in the morning, but with increasing solar irradiance and windspeed, canopies were associated with sub-canopy warming in the afternoon and at night. Collectively, these findings reinforce the current perception that planting trees can help mitigate urban heat in cities across the globe, but that the extent of associated cooling benefits depends on the physiological and morphological tree traits and the prevailing climatic conditions. Active and passive irrigation will help to increase soil moisture and should allow trees to maintain high rates of transpirational cooling. Other nature-based solutions (e.g., blue space, green walls and roofs) also need to be considered as part of a strategy to increase evaporative cooling across the built environment, to provide relief from afternoon and nighttime urban heat.
Supplementary Materials
The following supporting information can be downloaded at: https://www.mdpi.com/article/10.3390/atmos14030606/s1, Figure S1. Within- and among species differences in tree characteristics; (a) canopy width, (b) DBH, (c) leaf area index, (d) height, (e) specific leaf area, (f) leaf dry matter content and (g) Huber value. ANOVA results of differences among species for respective traits are given in each plot. Table S1. Analysis of variance results from LMER models to test whether delta temperature (ΔT) varies among tree species in the morning, afternoon and nighttime. Tree species, solar irradiance and VPD (vapor pressure deficient) were considered as fixed effects, and Dates and suburbs as random effects. Table S2. Results of LMER models assessing the relationship between delta temperature (ΔT) in the morning and tree traits (leaf area index [LAI], tree height, crown width, specific leaf area [SLA], Huber value and leaf dry matter content [LMDC]), and microclimatic variables (solar irradiance, VPD and wind speed). Table S3. Results of LMER models assessing the relationship between delta temperature (ΔT) in the afternoon and tree traits (leaf area index [LAI], tree height, crown width, specific leaf area [SLA], Huber value and leaf dry matter content [LMDC]) and microclimatic variables (solar irradiance, VPD and wind speed). Table S4. Results of LMER models assessing the relationship between nighttime ΔT and tree traits (leaf area index [LAI], tree height, crown width, specific leaf area [SLA], Huber value and leaf dry matter content [LMDC]) and microclimatic variables (solar irradiance, VPD and wind speed).
Author Contributions
M.S. co-designed the study, collected and analysed the data and drafted the manuscript. S.A.P., M.G.T., P.D.R., M.E.-R. and S.P., conceptualized, designed and supervised the study and contributed to manuscript writing. S.A.P., M.G.T. and P.D.R. acquired project funding. All authors have read and agreed to the published version of the manuscript.
Funding
This work was funded by the Hort Frontiers Green Cities Fund [Project number GC15002], part of the Hort Frontiers strategic partnership initiative developed by Hort Innovation, with co-investment from Macquarie University, Western Sydney University and the NSW Department of Planning and Environment, as well as contributions from the Australian Government.
Institutional Review Board Statement
Not applicable.
Informed Consent Statement
Not applicable.
Data Availability Statement
Data will be available upon request.
Acknowledgments
Special thanks are due to Alison Hewitt for her assistance with identifying tree species in the field, and to Onyeka Nzie and Yogesh Chaudhari for their assistance with fieldwork.
Conflicts of Interest
The authors declare no conflict of interest.
References
- IPCC. Climate Change 2021: The Physical Science Basis. Contribution of Working Group I to the Sixth Assessment Report of the Intergovernmental Panel on Climate Change; Cambridge University Press: Cambridge, UK, 2021. [Google Scholar]
- Meehl, G.A.; Tebaldi, C. More intense, more frequent, and longer lasting heat waves in the 21st century. Science 2004, 305, 994–997. [Google Scholar] [CrossRef] [PubMed] [Green Version]
- Esperon-Rodriguez, M.; Tjoelker, M.G.; Lenoir, J.; Baumgartner, J.B.; Beaumont, L.J.; Nipperess, D.A.; Power, S.A.; Richard, B.; Rymer, P.D.; Gallagher, R.V. Climate change increases global risk to urban forests. Nat. Clim. Chang. 2022, 12, 950–955. [Google Scholar] [CrossRef]
- Tuholske, C.; Caylor, K.; Funk, C.; Verdin, A.; Sweeney, S.; Grace, K.; Peterson, P.; Evans, T. Global urban population exposure to extreme heat. Proc. Natl. Acad. Sci. USA 2021, 118, e2024792118. [Google Scholar] [CrossRef] [PubMed]
- Elmqvist, T.; Fragkias, M.; Goodness, J.; Güneralp, B.; Marcotullio, P.J.; McDonald, R.I.; Parnell, S.; Schewenius, M.; Sendstad, M.; Seto, K.C.; et al. (Eds.) Urbanization, Biodiversity and Ecosystem Services: Challenges and Opportunities; Springer: London, UK, 2013. [Google Scholar]
- Fuller, R.A.; Gaston, K.J. The scaling of greenspace coverage in European cities. Biol. Lett. 2009, 5, 352–355. [Google Scholar] [CrossRef] [Green Version]
- Manoli, G.; Fatichi, S.; Schlapfer, M.; Yu, K.; Crowther, T.W.; Meili, N.; Burlando, P.; Katul, G.G.; Bou-Zeid, E. Magnitude of urban heat islands largely explained by climate and population. Nature 2019, 573, 55–60. [Google Scholar] [CrossRef]
- Oke, T.R. The energetic basis of the urban heat island. Q. J. R. Meteorol. Soc. 1982, 108, 1–24. [Google Scholar] [CrossRef]
- Zhao, L.; Lee, X.; Smith, R.B.; Oleson, K. Strong contributions of local background climate to urban heat islands. Nature 2014, 511, 216–219. [Google Scholar] [CrossRef]
- Ossola, A.; Lin, B.B. Making nature-based solutions climate-ready for the 50 °C world. Environ. Sci. Policy 2021, 123, 151–159. [Google Scholar] [CrossRef]
- Mutani, G.; Todeschi, V. The effects of green roofs on outdoor thermal comfort, urban heat island mitigation and energy savings. Atmosphere 2020, 11, 123. [Google Scholar] [CrossRef] [Green Version]
- Akbari, H.; Pomerantz, M.; Taha, H. Cool surfaces and shade trees to reduce energy use and improve air quality in urban areas. Sol. Energy 2001, 70, 295–310. [Google Scholar] [CrossRef]
- Bowler, D.E.; Buyung-Ali, L.; Knight, T.M.; Pullin, A.S. Urban greening to cool towns and cities: A systematic review of the empirical evidence. Landsc. Urban Plan. 2010, 97, 147–155. [Google Scholar] [CrossRef]
- Meili, N.; Manoli, G.; Burlando, P.; Carmeliet, J.; Chow, W.T.L.; Coutts, A.M.; Roth, M.; Velasco, E.; Vivoni, E.R.; Fatichi, S. Tree effects on urban microclimate: Diurnal, seasonal, and climatic temperature differences explained by separating radiation, evapotranspiration, and roughness effects. Urban For. Urban Green. 2021, 58, 126970. [Google Scholar] [CrossRef]
- De Abreu-Harbich, L.V.; Labaki, L.C.; Matzarakis, A. Effect of tree planting design and tree species on human thermal comfort in the tropics. Landsc. Urban Plan. 2015, 138, 99–109. [Google Scholar] [CrossRef]
- Sharmin, M. Urban Vegetation: Towards Cooler, Biodiverse Cities of the Future. In Hawkesbury Institute for the Environment; Western Sydney University, Hawkesbury: Richmond, Australia, 2022. [Google Scholar]
- Ibsen, P.C.; Borowy, D.; Dell, T.; Greydanus, H.; Gupta, N.; Hondula, D.M.; Meixner, T.; Santelmann, M.V.; Shiflett, S.A.; Sukop, M.C.; et al. Greater aridity increases the magnitude of urban nighttime vegetation-derived air cooling. Environ. Res. Lett. 2021, 16, 034011. [Google Scholar] [CrossRef]
- Motazedian, A.; Coutts, A.M.; Tapper, N.J. The microclimatic interaction of a small urban park in central Melbourne with its surrounding urban environment during heat events. Urban For. Urban Green. 2020, 52, 126688. [Google Scholar] [CrossRef]
- Winbourne, J.B.; Jones, T.S.; Garvey, S.M.; Harrison, J.L.; Wang, L.; Li, D.; Templer, P.H.; Hutyra, L.R. Tree transpiration and urban temperatures: Current understanding, implications, and future research directions. BioScience 2020, 70, 576–588. [Google Scholar] [CrossRef]
- Wang, C.; He, J.; Zhao, T.H.; Cao, Y.; Wang, G.; Sun, B.; Yan, X.; Guo, W.; Li, M.H. The smaller the leaf is, the faster the leaf water loses in a temperate forest. Front. Plant Sci. 2019, 10, 58. [Google Scholar] [CrossRef] [Green Version]
- Fauset, S.; Freitas, H.C.; Galbraith, D.R.; Sullivan, M.J.P.; Aidar, M.P.M.; Joly, C.A.; Phillips, O.L.; Vieira, S.A.; Gloor, M.U. Differences in leaf thermoregulation and water use strategies between three co-occurring Atlantic forest tree species. Plant Cell Environ. 2018, 41, 1618–1631. [Google Scholar] [CrossRef] [Green Version]
- Kong, L.; Lau, K.K.L.; Yuan, C.; Chen, Y.; Xu, Y.; Ren, C.; Ng, E. Regulation of outdoor thermal comfort by trees in Hong Kong. Sustain. Cities Soc. 2017, 31, 12–25. [Google Scholar] [CrossRef]
- Wilson, P.J.; Thompson, K.; Hodgson, J.G. Specific leaf area and leaf dry matter content as alternative predictors of plant strategies. New Phytol. 1999, 143, 155–162. [Google Scholar] [CrossRef]
- Rahman, A.M.; Stratopoulos, L.M.F.; Moser-Reischl, A.; Zölch, T.; Häberle, K.; Rötzer, T.; Pretzsch, H.; Pauleit, S. Traits of trees for cooling urban heat islands: A meta-analysis. Build. Environ. 2020, 170, 106606. [Google Scholar] [CrossRef]
- Sellin, A.; Rosenvald, K.; Ounapuu-Pikas, E.; Tullus, A.; Ostonen, I.; Lohmus, K. Elevated air humidity affects hydraulic traits and tree size but not biomass allocation in young silver birches (Betula pendula). Front. Plant Sci. 2015, 6, 860. [Google Scholar] [CrossRef] [PubMed] [Green Version]
- Tyree, M.T.; Ewers, F.W. The hydraulic architecture of trees and other woody plants. New Phytol. 1991, 119, 345–360. [Google Scholar] [CrossRef]
- Grossiord, C.; Buckley, T.N.; Cernusak, L.A.; Novick, K.A.; Poulter, B.; Siegwolf, R.T.W.; Sperry, J.S.; McDowell, N.G. Plant responses to rising vapor pressure deficit. New Phytol. 2020, 226, 1550–1566. [Google Scholar] [CrossRef] [PubMed] [Green Version]
- Aphalo, P.J.; Jarvis, P.G. The boundary layer and the apparent responses of stomatal conductance to wind speed and to the mole fractions of CO2 and water vapour in the air. Plant Cell Environ. 1993, 16, 771–783. [Google Scholar] [CrossRef]
- Carvalho, D.R.; Torre, S.; Kraniotis, D.; Almeida, D.P.; Heuvelink, E.; Carvalho, S.M. Elevated air movement enhances stomatal sensitivity to abscisic acid in leaves developed at high relative air humidity. Front. Plant Sci. 2015, 6, 383. [Google Scholar] [CrossRef] [Green Version]
- Konarska, J.; Uddling, J.; Holmer, B.; Lutz, M.; Lindberg, F.; Pleijel, H.; Thorsson, S. Transpiration of urban trees and its cooling effect in a high latitude city. Int. J. Biometeorol. 2016, 60, 159–172. [Google Scholar] [CrossRef]
- Chen, L.; Zhang, Z.; Li, Z.; Tang, J.; Caldwell, P.; Zhang, W. Biophysical control of whole tree transpiration under an urban environment in Northern China. J. Hydrol. 2011, 402, 388–400. [Google Scholar] [CrossRef]
- Zeppel, M.; Tissue, D.; Taylor, D.; Macinnis-Ng, C.; Eamus, D. Rates of nocturnal transpiration in two evergreen temperate woodland species with differing water-use strategies. Tree Physiol. 2010, 30, 988–1000. [Google Scholar] [CrossRef] [Green Version]
- Rahman, A.M.; Armson, D.; Ennos, A.R. A comparison of the growth and cooling effectiveness of five commonly planted urban tree species. Urban Ecosyst. 2014, 18, 371–389. [Google Scholar] [CrossRef]
- Lin, B.S.; Lin, Y. Cooling effect of shade trees with different characteristics in a subtropical urban park. Am. Soc. Hortic. Sci. 2010, 45, 83–86. [Google Scholar] [CrossRef] [Green Version]
- Trancoso, R.; Syktus, J.; Toombs, N.; Ahrens, D.; Wong, K.K.; Pozza, R.D. Heatwaves intensification in Australia: A consistent trajectory across past, present and future. Sci. Total Environ. 2020, 742, 140521. [Google Scholar] [CrossRef]
- Bureau of Meteorology (BOM). Greater Sydney in January 2020: Record Heat, Severe Storms, Smoke and Dust. Monthly Climate Summary for Greater Sydney. 2020. Available online: http://www.bom.gov.au/climate/current/month/nsw/archive/202001.sydney (accessed on 6 March 2021).
- Lewis, S.C.; King, A.D.; Mitchell, D.M. Australia’s unprecedented future temperature extremes under paris limits to warming. Geophys. Res. Lett. 2017, 44, 9947–9956. [Google Scholar] [CrossRef] [Green Version]
- BOM. Australia in Summer 2018–19. 2019. Available online: http://www.bom.gov.au/climate/current/season/aus/archive/201902.summary.shtml (accessed on 25 May 2019).
- The Commonwealth Scientific and Industrial Research Organisation (CSIRO); Bureau of Meteorology (BOM). Climate Change in Australia Information for Australia’s Natural Resource Management Regions: Technical Report; CSIRO: Canberra, Australia; Bureau of Meteorology: Melbourne, Australia, 2015. [Google Scholar]
- Singh, S.; Hanna, E.G.; Kjellstrom, T. Working in Australia’s heat: Health promotion concerns for health and productivity. Health Promot. Int. 2015, 30, 239–250. [Google Scholar] [CrossRef]
- Whittaker, J.; Haynes, K.; Wilkinson, C.; Tofa, M.; Dilworth, T.; Collins, J.; Tait, L.; Samson, S. Black Summer—How the NSW Community Responded to the 2019–20 Bushfire Season; Bushfire and Natural Hazards CRC: Melbourne, Australia, 2021. [Google Scholar]
- Pfautsch, S.; Wujeska-Klause, A.; Walters, J.R. Measuring local-scale canopy-layer air temperatures in the built environment: A flexible method for urban heat studies. Comput. Environ. Urban Syst. 2023, 99, 101913. [Google Scholar] [CrossRef]
- Wujeska-Klause, A.; Pfautsch, S. The best urban trees for daytime cooling leave nights slightly warmer. Forests 2020, 11, 945. [Google Scholar] [CrossRef]
- Snyder, R.L.; Shaw, R.H. Converting Humidity Expressions with Computers and Calculators; Leaflet 21372; Cooperative Extension, Division of Agriculture and Natural Resources, University of California: Davis, CA, USA, 1984. [Google Scholar]
- Breda, N.J. Ground-based measurements of leaf area index: A review of methods, instruments and current controversies. J. Exp. Bot. 2003, 54, 2403–2417. [Google Scholar] [CrossRef] [Green Version]
- Vinya, R.; Malhi, Y.; Brown, N.; Fisher, J.B. Functional coordination between branch hydraulic properties and leaf functional traits in miombo woodlands: Implications for water stress management and species habitat preference. Acta Physiol. Plant. 2012, 34, 1701–1710. [Google Scholar] [CrossRef]
- Pérez-Harguindeguy, N.; Díaz, S.; Garnier, E.; Lavorel, S.; Poorter, H.; Jaureguiberry, P.; Bret-Harte, M.S.; Cornwell, W.K.; Craine, J.M.; Gurvich, D.E.; et al. New handbook for standardised measurement of plant functional traits worldwide. Aust. J. Bot. 2013, 61, 167. [Google Scholar] [CrossRef]
- R Core Team. R: A Language and Environment for Statistical Computing; R Foundation for Statistical Computing: Vienna, Austria, 2020. [Google Scholar]
- Lenth, R.; Singmann, H.; Love, J.; Buerkner, P.; Herve, M.; emmeans:Estimated Marginal Means, Aka Least-Squares Means. R Package Version 1.4.5. 2020. Available online: https://github.com/rvlenth/emmeans (accessed on 1 April 2021).
- Bretz, F.; Hothorn, T.; Westfall, P. Multiple Comparisons Using R; CRC Press: Boca Raton, FL, USA, 2010. [Google Scholar]
- Bates, D.; Mächler, M.; Bolker, B.; Walker, S. Fitting linear mixed-effects models using ime4. J. Stat. Softw. 2015, 67, 1–48. [Google Scholar] [CrossRef]
- Alonzo, M.; Baker, M.E.; Gao, Y.; Shandas, V. Spatial configuration and time of day impact the magnitude of urban tree canopy cooling. Environ. Res. Lett. 2021, 16, 084028. [Google Scholar] [CrossRef]
- Ziter, C.D.; Pedersen, E.J.; Kucharik, C.J.; Turner, M.G. Scale-dependent interactions between tree canopy cover and impervious surfaces reduce daytime urban heat during summer. Proc. Natl. Acad. Sci. USA 2019, 116, 7575–7580. [Google Scholar] [CrossRef] [PubMed] [Green Version]
- Sanusi, R.; Johnstone, D.; May, P.; Livesley, S.J. Microclimate benefits that different street tree species provide to sidewalk pedestrians relate to differences in Plant Area Index. Landsc. Urban Plan. 2017, 157, 502–511. [Google Scholar] [CrossRef]
- Aguiar, A.C.; French, K.; Chisholm, L.A. A comparison of the ameliorating effects of native and exotic street trees on surface heat retention at dusk. Urban Clim. 2014, 10, 56–62. [Google Scholar] [CrossRef]
- Shahidan, M.F.; Shariff, M.K.M.; Jones, P.; Salleh, E.; Abdullah, A.M. A comparison of Mesua ferrea L. and Hura crepitans L. for shade creation and radiation modification in improving thermal comfort. Landsc. Urban Plan. 2010, 97, 168–181. [Google Scholar]
- Rahman, A.M.; Moser, A.; Rötzer, T.; Pauleit, S. Within canopy temperature differences and cooling ability of Tilia cordata trees grown in urban conditions. Build. Environ. 2017, 114, 118–128. [Google Scholar] [CrossRef]
- Barišić, I.; Netinger Grubeša, I.; Krstić, H.; Kubica, D. Field and Laboratory Assessment of Different Concrete Paving Materials Thermal Behavior. Sustainability 2022, 14, 6638. [Google Scholar] [CrossRef]
- Shashua-Bar, L.; Pearlmutter, D.; Erell, E. The influence of trees and grass on outdoor thermal comfort in a hot-arid environment. Int. J. Climatol. 2011, 31, 1498–1506. [Google Scholar] [CrossRef]
- Granier, A.; Huc, R.; Barigah, S. Transpiration of natural rain forest and its dependence on climatic factors. Agric. For. Meteorol. 1996, 78, 19–29. [Google Scholar] [CrossRef]
- Yu, Q.; Ji, W.; Pu, R.; Landry, S. A Preliminary Exploration of the Cooling Effect of Tree Shade in Urban Landscapes. Int. J. Appl. Earth Obs. Geoinf. 2020, 92, 102161. [Google Scholar] [CrossRef]
- Oliveira, A.; Lopes, A.; Correia, E.; Niza, S.; Soares, A. Heatwaves and summer urban heat islands: A daily cycle approach to unveil the urban thermal signal changes in lisbon, portugal. Atmosphere 2021, 12, 292. [Google Scholar] [CrossRef]
- Alcoforado, M.; Andrade, H.; Lopes, A.; Vasconcelos, J. Application of climatic guidelines to urban planning: The example of Lisbon (Portugal). Landsc. Urban Plan. 2009, 90, 56–65. [Google Scholar] [CrossRef]
- Souch, C.A.; Souch, C. The effect of trees on summertime below canopy urban climates: A case study Bloomington, Indiana. J. Arboric. 1993, 19, 303–312. [Google Scholar] [CrossRef]
- Taha, H.; Akbari, H.; Rosenfeld, A. Heat island and oasis effects of vegetative canopies: Micro-meteorological field-measurements. Theor. Appl. Climatol. 1991, 44, 123–138. [Google Scholar] [CrossRef] [Green Version]
- Kaluarachichi, T.U.N.; Tjoelker, M.G.; Pfautsch, S. Temperature reduction in urban surface materials through tree shading depends on surface type not tree species. Forests 2020, 11, 1141. [Google Scholar]
- Bureau of Meteorology (BOM). Previous Droughts 2020. Available online: http://www.bom.gov.au/climate/drought/knowledge-centre/previous-droughts.shtml#:~:text=The%202019%20cool%20season%20was,Basin%20and%20New%20South%20Wales (accessed on 18 August 2022).
- Marchin, R.M.; Esperon-Rodriguez, M.; Tjoelker, M.G.; Ellsworth, D.S. Crown dieback and mortality of urban trees linked to heatwaves during extreme drought. Sci. Total Environ. 2022, 850, 157915. [Google Scholar] [CrossRef]
- Tabassum, S.; Manea, A.; Ossola, A.; Thomy, B.; Blackham, D.; Leishman, M.R. The angriest summer on record: Assessing canopy damage and economic costs of an extreme climatic event. Urban For. Urban Green. 2021, 63, 127221. [Google Scholar] [CrossRef]
- Klein, T.; Niu, S. The variability of stomatal sensitivity to leaf water potential across tree species indicates a continuum between isohydric and anisohydric behaviours. Funct. Ecol. 2014, 28, 1313–1320. [Google Scholar] [CrossRef]
- Marchin, R.M.; Backes, D.; Ossola, A.; Leishman, M.R.; Tjoelker, M.G.; Ellsworth, D.S. Extreme heat increases stomatal conductance and drought-induced mortality risk in vulnerable plant species. Glob. Chang. Biol. 2022, 28, 1133–1146. [Google Scholar] [CrossRef]
- Tardieu, F.; Simonneau, T. Variability among species of stomatal control under fluctuating soil water status and evaporative demand: Modelling isohydric and anisohydric behaviours. J. Exp. Bot. 1998, 49, 419–432. [Google Scholar] [CrossRef] [Green Version]
- McDowell, N.G.; Sapes, G.; Pivovaroff, A.; Adams, H.D.; Allen, C.D.; Anderegg, W.R.L.; Arend, M.; Breshears, D.D.; Brodribb, T.; Choat, B.; et al. Mechanisms of woody-plant mortality under rising drought, CO2 and vapour pressure deficit. Nat. Rev. Earth Environ. 2022, 3, 294–308. [Google Scholar] [CrossRef]
- Osonubi, O.; Davies, W.J. The Influence of plant water stress on stomatal control of gas exchange at different levels of atmospheric humidity. Oecologia 1980, 46, 1–6. [Google Scholar] [CrossRef] [PubMed]
- Urban, J.; Ingwers, M.W.; McGuire, M.A.; Teskey, R.O. Increase in leaf temperature opens stomata and decouples net photosynthesis from stomatal conductance in Pinus taeda and Populus deltoides x nigra. J. Exp. Bot. 2017, 68, 1757–1767. [Google Scholar] [CrossRef] [PubMed] [Green Version]
- Taha, H. Urban climates and heat islands: Albedo, evapotranspiration, and anthropogenic heat. Energy Build. 1997, 25, 99–103. [Google Scholar] [CrossRef] [Green Version]
- O’grady, A.P.; Eamus, D.; Hutly, L.B. Transpiration increases during the dry season: Patterns of tree water use in eucalypt open-forests of northern Australia. Tree Physiol. 1999, 19, 591––597. [Google Scholar] [CrossRef]
- Esperon-Rodriguez, M.; Power, S.A.; Tjoelker, M.G.; Marchin, R.M.; Rymer, P.D. Contrasting heat tolerance of urban trees to extreme temperatures during heatwaves. Urban For. Urban Green. 2021, 66, 127387. [Google Scholar] [CrossRef]
- Dawson, T.E.; Burgress, S.S.O.; Tu, K.P.; Oliveira, R.S.; Santiago, L.S.; Fisher, J.B.; Simonin, K.A.; Ambrose, A.R. Nighttime transpiration in woody plants from contrasting ecosystems. Tree Physiol. 2007, 27, 561–575. [Google Scholar] [CrossRef] [Green Version]
- Lindén, J.; Fonti, P.; Esper, J. Temporal variations in microclimate cooling induced by urban trees in Mainz, Germany. Urban For. Urban Green. 2016, 20, 198–209. [Google Scholar] [CrossRef]
- Esperon-Rodriguez, M.; Power, S.A.; Tjoelker, M.G.; Rymer, P.D. Urban tree inventories and future climate risk in Australian cities: Pitfalls, possibilities and practical considerations. Urban For. Urban Green. 2022, 78, 127769. [Google Scholar] [CrossRef]
- Oke, T.R.; Mills, G.; Christen, A.; Voogt, J.A. Energy Balance. In Urban Climates; Cambridge University Press: Cambridge, UK, 2017; pp. 158–196. [Google Scholar]
- Memon, R.A.; Leung, D.Y.C.; Liu, C.-H. Effects of building aspect ratio and wind speed on air temperatures in urban-like street canyons. Build. Environ. 2010, 45, 176–188. [Google Scholar] [CrossRef]
- Pfautsch, S.; Rouillard, S. Benchmarking Heat in Parramatta, Sydney’s Central River City; Western Sydney University: Parramatta, Australia, 2019; 56p. [Google Scholar]
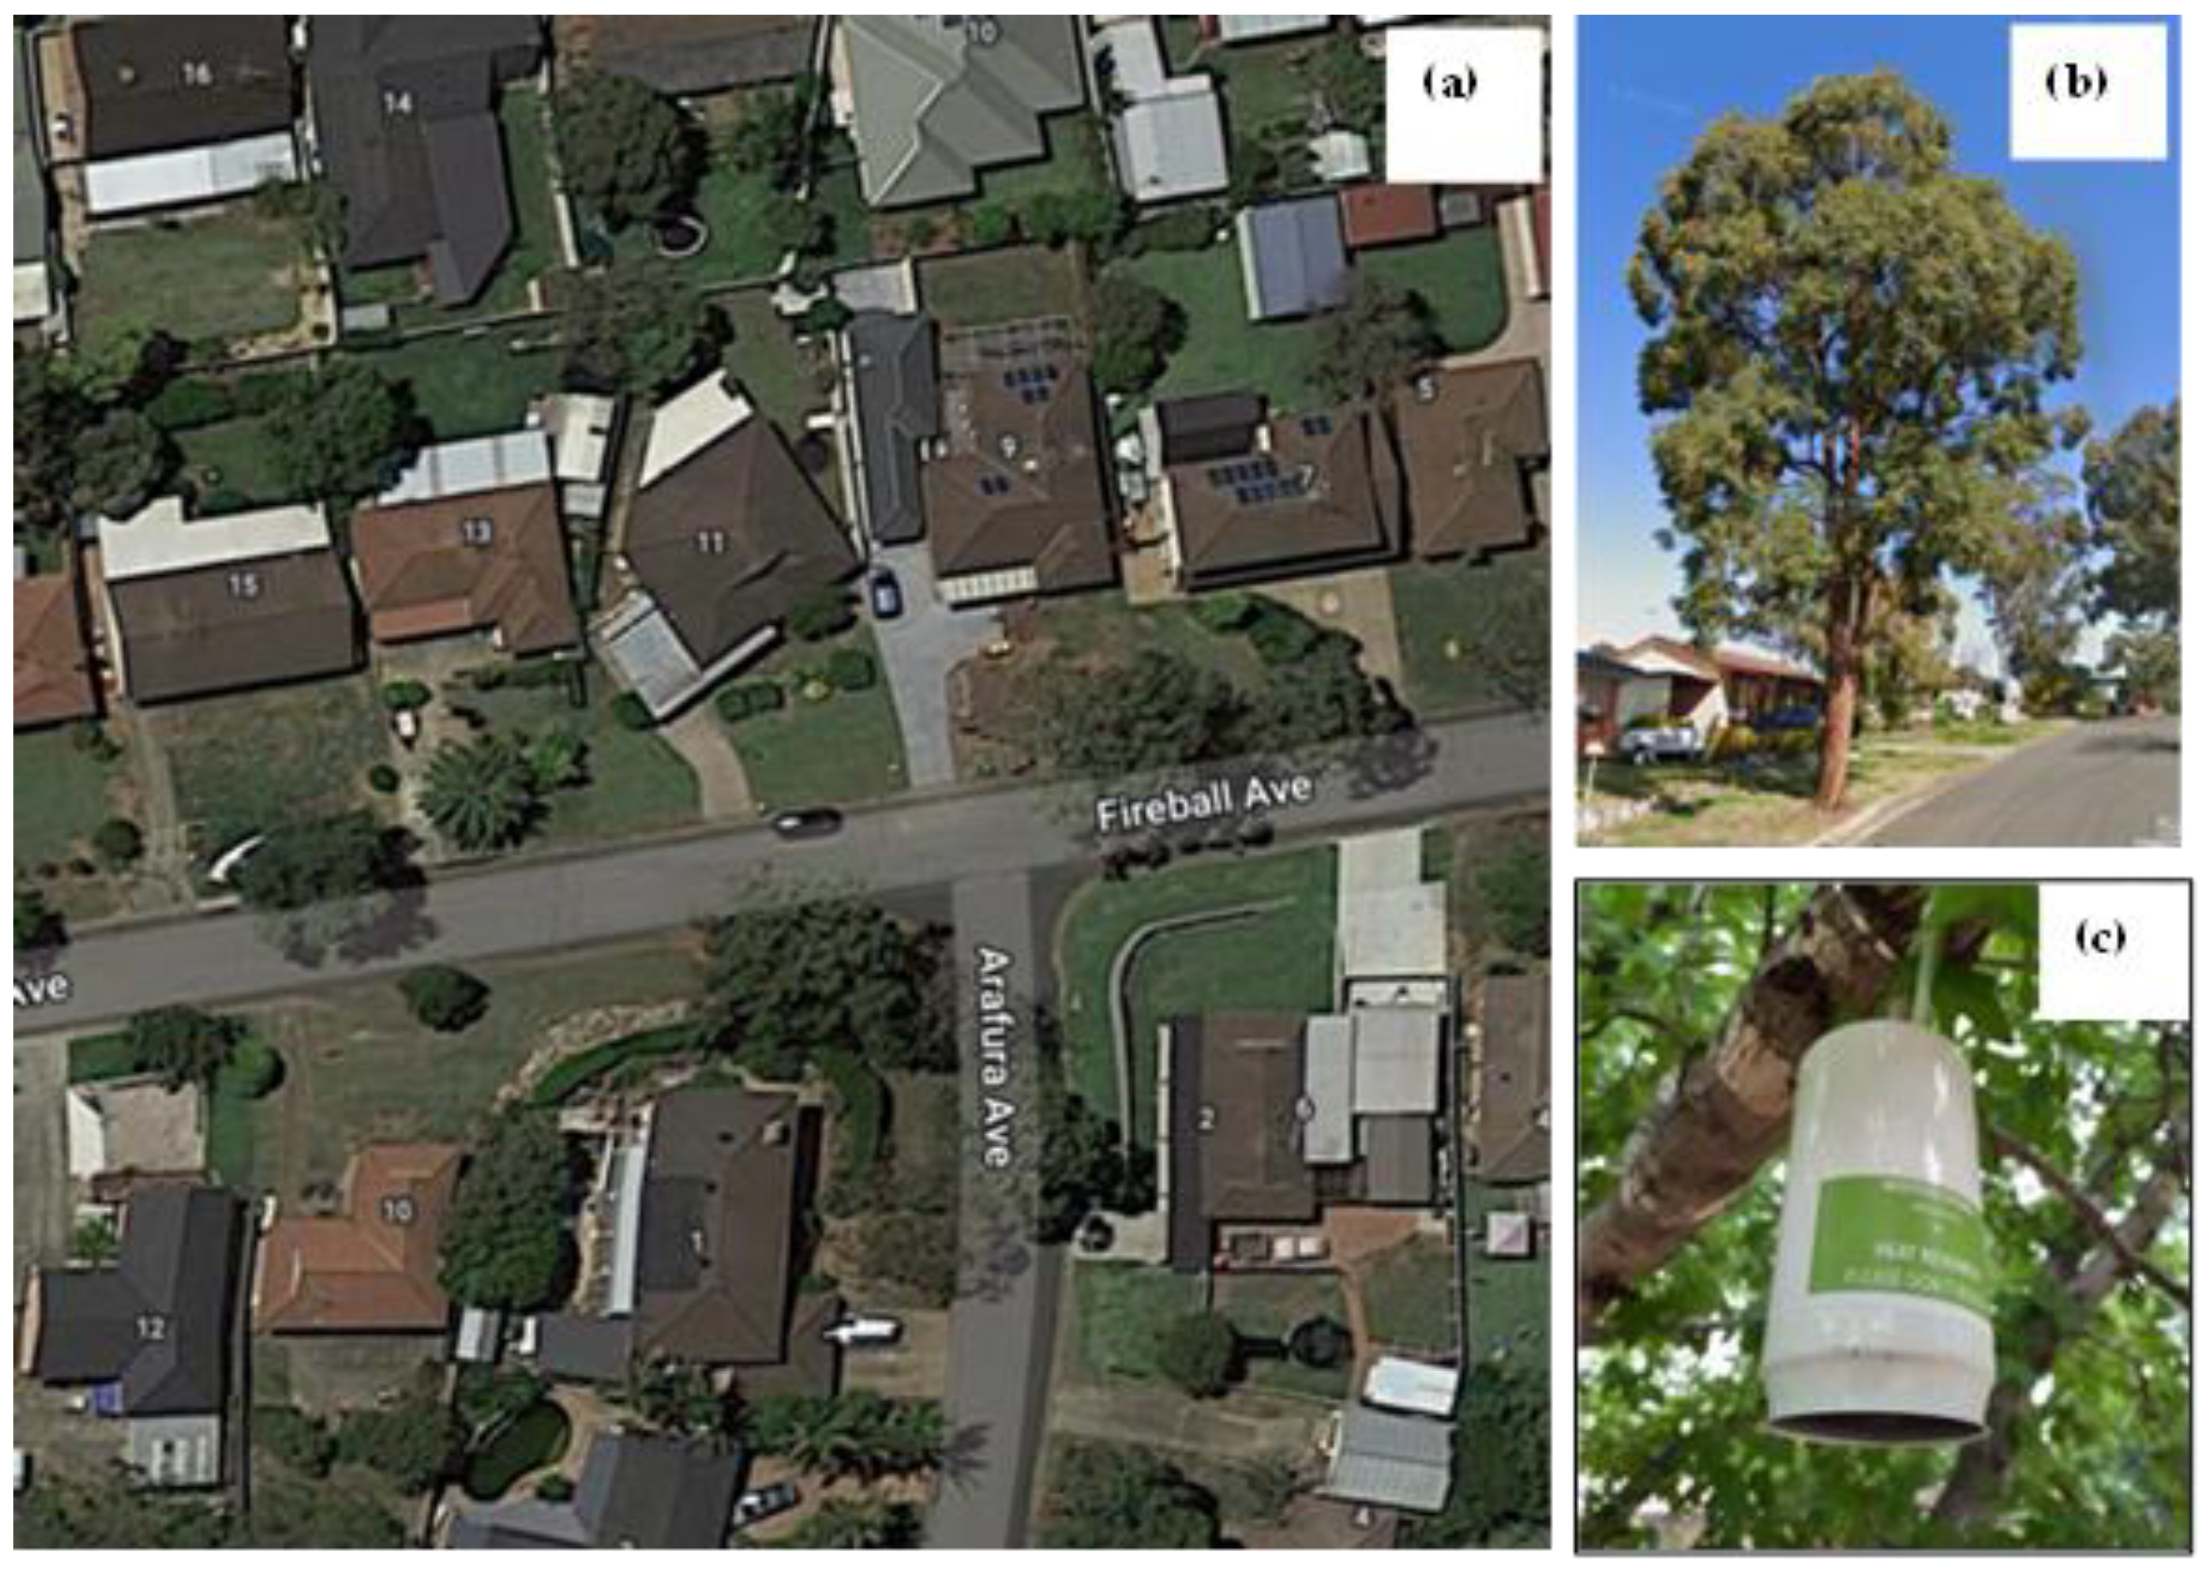
Figure 1.
(a) Example of the urban morphology of one of the studied suburbs, Cranebrook, (b) street trees (Eucalyptus microcorys located on Arafura Avenue, Cranebrook), and (c) sensor and shielding affixed to a tree. The street map of Cranebrook shows that trees are growing on nature strips (verges) and at varying distances from houses. Images of (a,b) were sourced from google maps.

Figure 2.
Correlation between air temperatures recorded by three weather stations (EucFace, Richmond and Cranebrook); (a,b) maximum and minimum temperatures of Richmond BOM vs maximum and minimum temperatures from the EucFace meteorological station; (c,d) maximum and minimum temperatures of Richmond BOM vs maximum and minimum temperatures of Cranebrook BOM; (e,f) maximum and minimum temperatures of Cranebrook BOM vs maximum and minimum temperatures of the EucFace meteorological station.

Figure 3.
Diurnal variations in ΔT averaged across 37 summer days for individual trees (n = 96) (a) and species averages (9 to 10 replicates for each species) (b). The dashed red lines indicate no difference between the sub-canopy and ambient air temperatures. Circle colours correspond to tree species. For abbreviations of species names and number of trees for each species see Table 1.

Figure 4.
Species differences in ΔT (a) in the morning (07:00 to 13:00), (b) in the afternoon (15:00 to 19:00), and (c) at night (01:00 to 05:00). Different letters indicate significant differences at p < 0.05. The black points indicate mean values (±SE). For abbreviations of species names and number of replicates see Table 1. Chi-square (X2) and p values for each of the lmer models are given in the figures. Analysis of variance (ANOVA) results of lmer models for each plot are in Supplementary Table S1.

Figure 5.
Relationship between ΔT and (a) vapor pressure deficit (VPD), (b) solar irradiance, (c) wind speed, (d) canopy width, (e) Huber value and (f) leaf area index (LAI) in the morning (07:00 to 13:00 h), using all recorded data from 96 individual trees over a three-month period. Total number of observations was 127,822. The dashed red lines indicate no difference between the canopy and ambient air temperatures and solid blue lines indicate best-fit trend predictions. Only significant relationships are shown. For detailed results of the lmer model see Supplementary Table S2.

Figure 6.
Relationship between ΔT and (a) vapor pressure deficit (VPD), (b) wind speed and (c) leaf area index (LAI) in the afternoon, using all recorded data from 96 individual trees over a three-month period. The dashed red lines indicate no difference between the sub-canopy and ambient air temperatures and soild blue lines correspond to regression slopes. There was a total of 127,822 data points. For detailed results of the lmer model see Supplementary Table S3.

Figure 7.
Relationships between ΔT and (a) vapor pressure deficit (VPD), (b) wind speed and (c) leaf area index at nighttime, using all recorded data from 96 individual trees over a three-month period. Only the first three strongest relationships with high chi-square (X2) values are shown. The dashed red lines indicate no difference between the sub-canopy and ambient air temperatures and the solid blue lines represent regression slopes. There was a total of 106,560 data points. Only significant relationships are shown. For detailed results of the lmer model see Supplementary Table S4.


Table 1.
Mean and standard deviation of the characteristics of the 10 tree species selected in Richmond and Cranebrook, Greater Sydney, Australia. Numbers of individual trees are given in parentheses.
Table 1.
Mean and standard deviation of the characteristics of the 10 tree species selected in Richmond and Cranebrook, Greater Sydney, Australia. Numbers of individual trees are given in parentheses.
| Species List | Species Abbreviation (Number) | Family | Evergreen/ Deciduous | Canopy Width | Height (m) | DBH (cm) | Huber Value (cm2 mm−2) | LDMC (mg g−1) | LAI (m2 m−2) | SLA (cm2 g−1) |
|---|---|---|---|---|---|---|---|---|---|---|
| Callistemon viminalis Sol. ex Gaertn | Cal (10) | Myrtaceae | Evergreen | 7.2 ± 1.0 | 6.6 ± 1.1 | 18.6 ± 4.5 | 0.0052 ± 0.002 | 516.2 ± 50.0 | 2.74 ± 0.7 | 58.4 ± 15.0 |
| Eucalyptus microcorys F. Muell | Euc (9) | Myrtaceae | Deciduous | 13.1 ± 1.9 | 13.6 ± 1.9 | 50.1 ± 14.9 | 0.0017 ± 0.0005 | 493.0 ± 22.1 | 2.9 ± 0.5 | 73.2 ± 7.6 |
| Jacaranda mimosifolia D. Don | Jac (10) | Bignoniaceae | Deciduous | 10.9 ± 1.8 | 9.2 ± 2.0 | 32.3 ± 11.8 | 0.0016 ± 0.001 | 384.1 ± 39.1 | 3.42 ± 0.5 | 144.0 ± 25.0 |
| Liquidambar styraciflua L. | Liq (10) | Altingiaceae | Deciduous | 13.4 ± 4.4 | 15.1 ± 3.1 | 51.8 ± 16.0 | 0.0022 ± 0.001 | 389.0 ± 0.2 | 4.05 ± 0.7 | 121.0 ± 17.9 |
| Lophostemon confertus R.Br. | Loph (10) | Myrtaceae | Deciduous | 10.3 ± 1.5 | 11.2 ± 1.8 | 44.9 ± 13.0 | 0.002 ± 0.001 | 437.5 ± 80.0 | 4.23 ± 0.8 | 69.7 ± 13.8 |
| Melaleuca quinquenervia (Cav.) S.T.Blake | Mel (9) | Myrtaceae | Evergreen | 9.7 ± 2.0 | 10.5 ± 1.8 | 61.0 ± 35.1 | 0.0026 ± 0.0006 | 379.7 ± 50.1 | 3.55 ± 0.8 | 61.9 ± 13.5 |
| Platanus × acerifolia (Aiton) Willd. | Plat (10) | Platanaceae | Deciduous | 16.2 ± 3.8 | 16.4 ± 2.5 | 56.4 ± 38.4 | 0.0016 ± 0.001 | 392.0 ± 50.3 | 3.62 ± 1.0 | 133.0 ± 40.6 |
| Pyrus calleryana Decne. | Pyr (10) | Rosaceae | Deciduous | 7.5 ± 1.3 | 8.1 ± 3.4 | 21.3 ± 6.5 | 0.003 ± 0.0008 | 463.2 ± 23.7 | 4.35 ± 1.2 | 89.3 ± 14.1 |
| Sapium sebiferum (L.) Roxb. | Sap (9) | Euphorbiaceae | Deciduous | 9.5 ± 2.0 | 9.2 ± 1.3 | 35.5 ± 11.9 | 0.001 ± 0.0003 | 378.0 ± 43.0 | 3.44 ± 0.2 | 156 ± 53.8 |
| Ulmus parvifolia Jacq. | Ulm (9) | Ulmaceae | Deciduous | 11.5 ± 2.7 | 10.0 ± 1.6 | 29.9 ± 7.4 | 0.003 ± 0.002 | 408.0 ± 39.5 | 3.92 ± 1.0 | 90.1 ± 8.0 |
Disclaimer/Publisher’s Note: The statements, opinions and data contained in all publications are solely those of the individual author(s) and contributor(s) and not of MDPI and/or the editor(s). MDPI and/or the editor(s) disclaim responsibility for any injury to people or property resulting from any ideas, methods, instructions or products referred to in the content. |
© 2023 by the authors. Licensee MDPI, Basel, Switzerland. This article is an open access article distributed under the terms and conditions of the Creative Commons Attribution (CC BY) license (https://creativecommons.org/licenses/by/4.0/).
Share and Cite
MDPI and ACS Style
Sharmin, M.; Tjoelker, M.G.; Pfautsch, S.; Esperón-Rodriguez, M.; Rymer, P.D.; Power, S.A. Tree Traits and Microclimatic Conditions Determine Cooling Benefits of Urban Trees. Atmosphere 2023, 14, 606. https://doi.org/10.3390/atmos14030606
AMA Style
Sharmin M, Tjoelker MG, Pfautsch S, Esperón-Rodriguez M, Rymer PD, Power SA. Tree Traits and Microclimatic Conditions Determine Cooling Benefits of Urban Trees. Atmosphere. 2023; 14(3):606. https://doi.org/10.3390/atmos14030606
Chicago/Turabian StyleSharmin, Mahmuda, Mark G. Tjoelker, Sebastian Pfautsch, Manuel Esperón-Rodriguez, Paul D. Rymer, and Sally A. Power. 2023. "Tree Traits and Microclimatic Conditions Determine Cooling Benefits of Urban Trees" Atmosphere 14, no. 3: 606. https://doi.org/10.3390/atmos14030606
Note that from the first issue of 2016, this journal uses article numbers instead of page numbers. See further details here.