
High Wet Deposition of Black Carbon over the Sichuan Basin of China

Abstract
:1. Introduction
2. Methodology
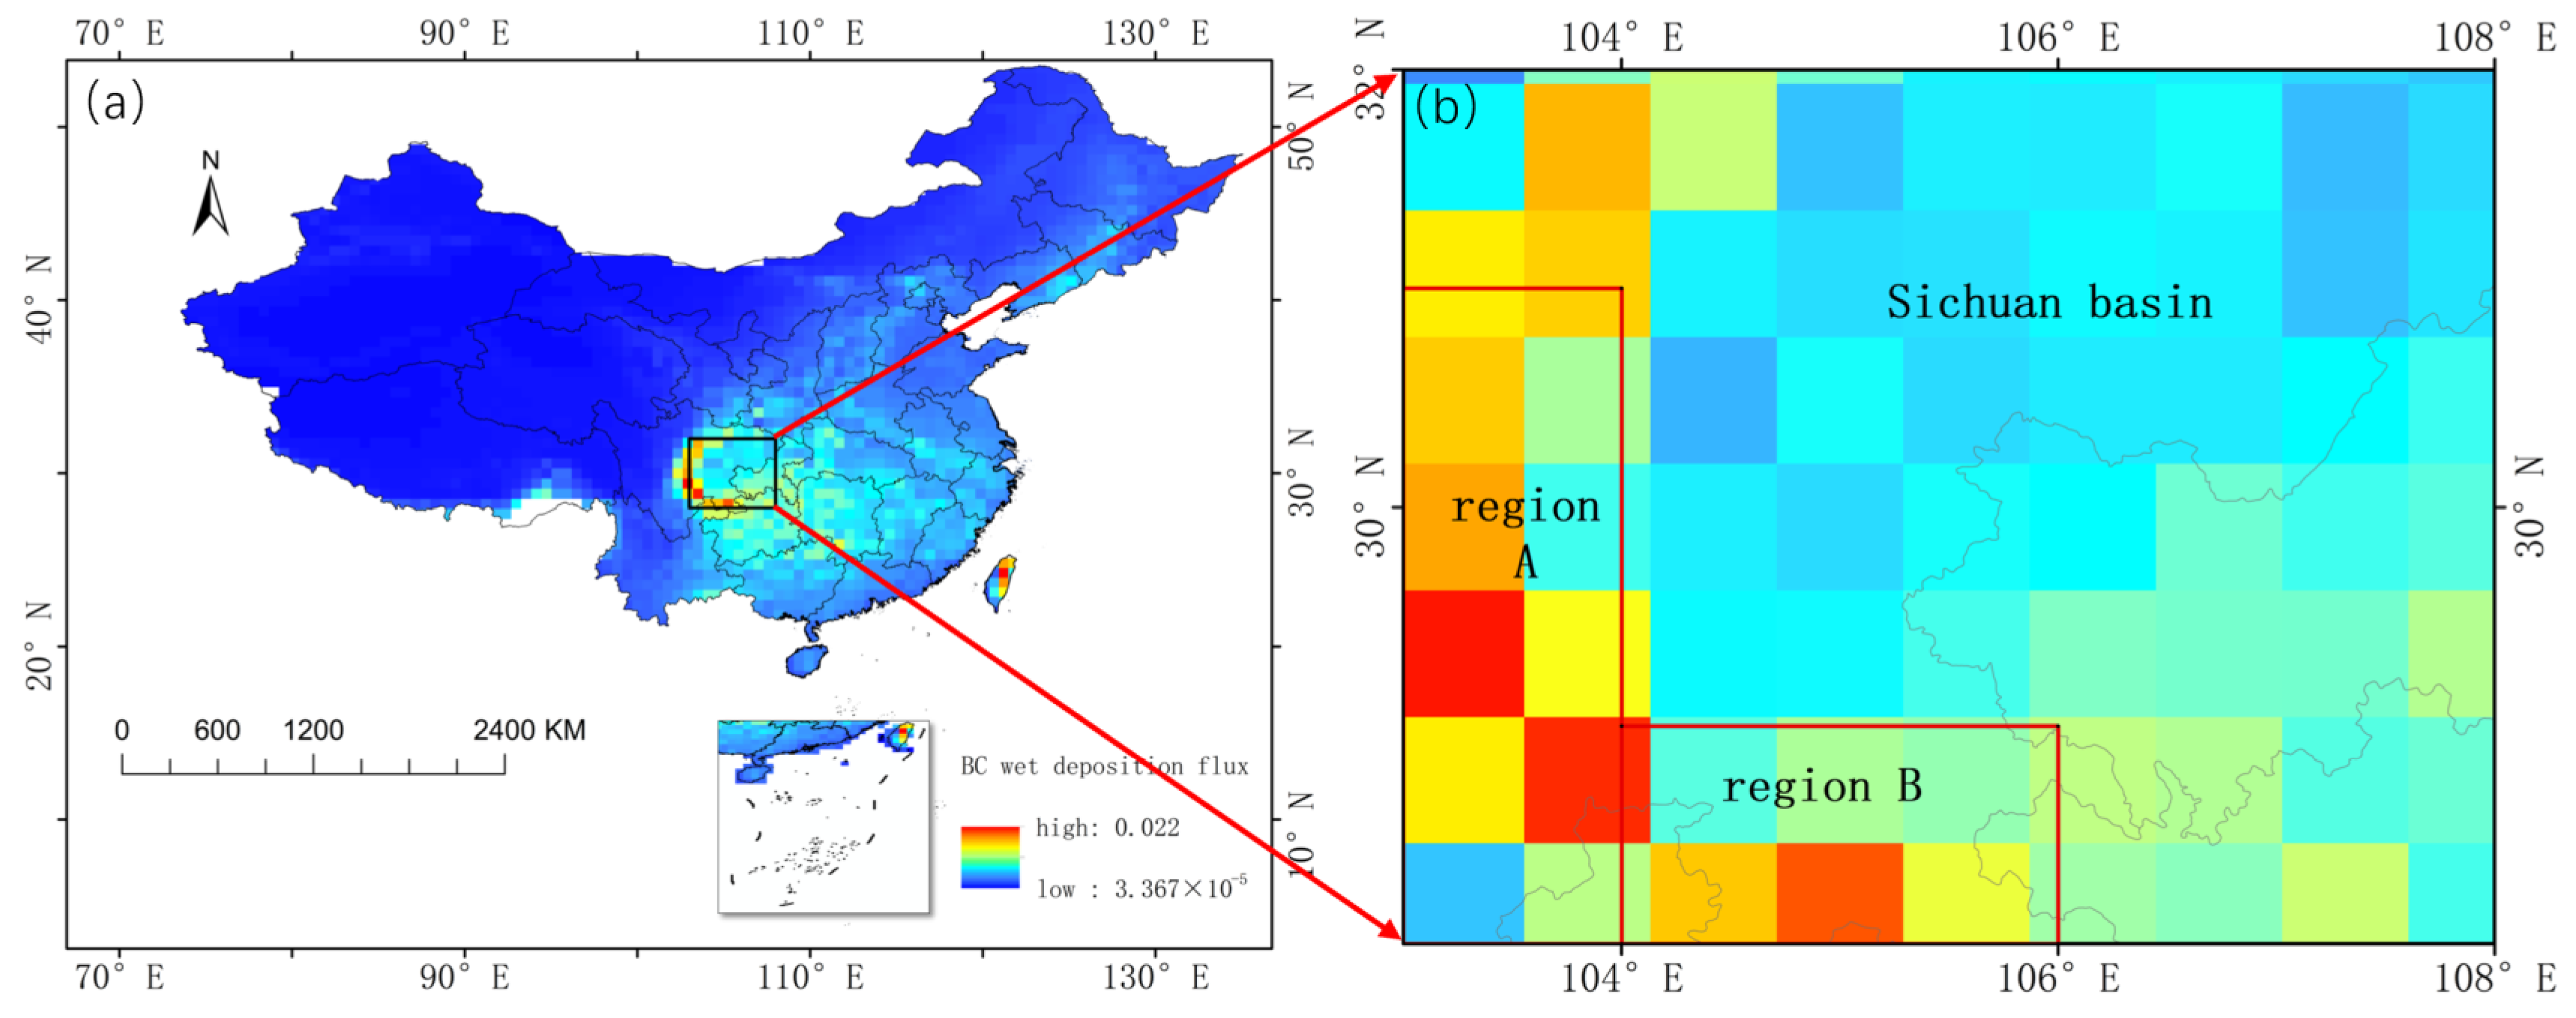
2.1. Targeted Area
2.2. MERRA-2 Dataset
2.3. Pearson Correlation Coefficient
3. Results and Discussion
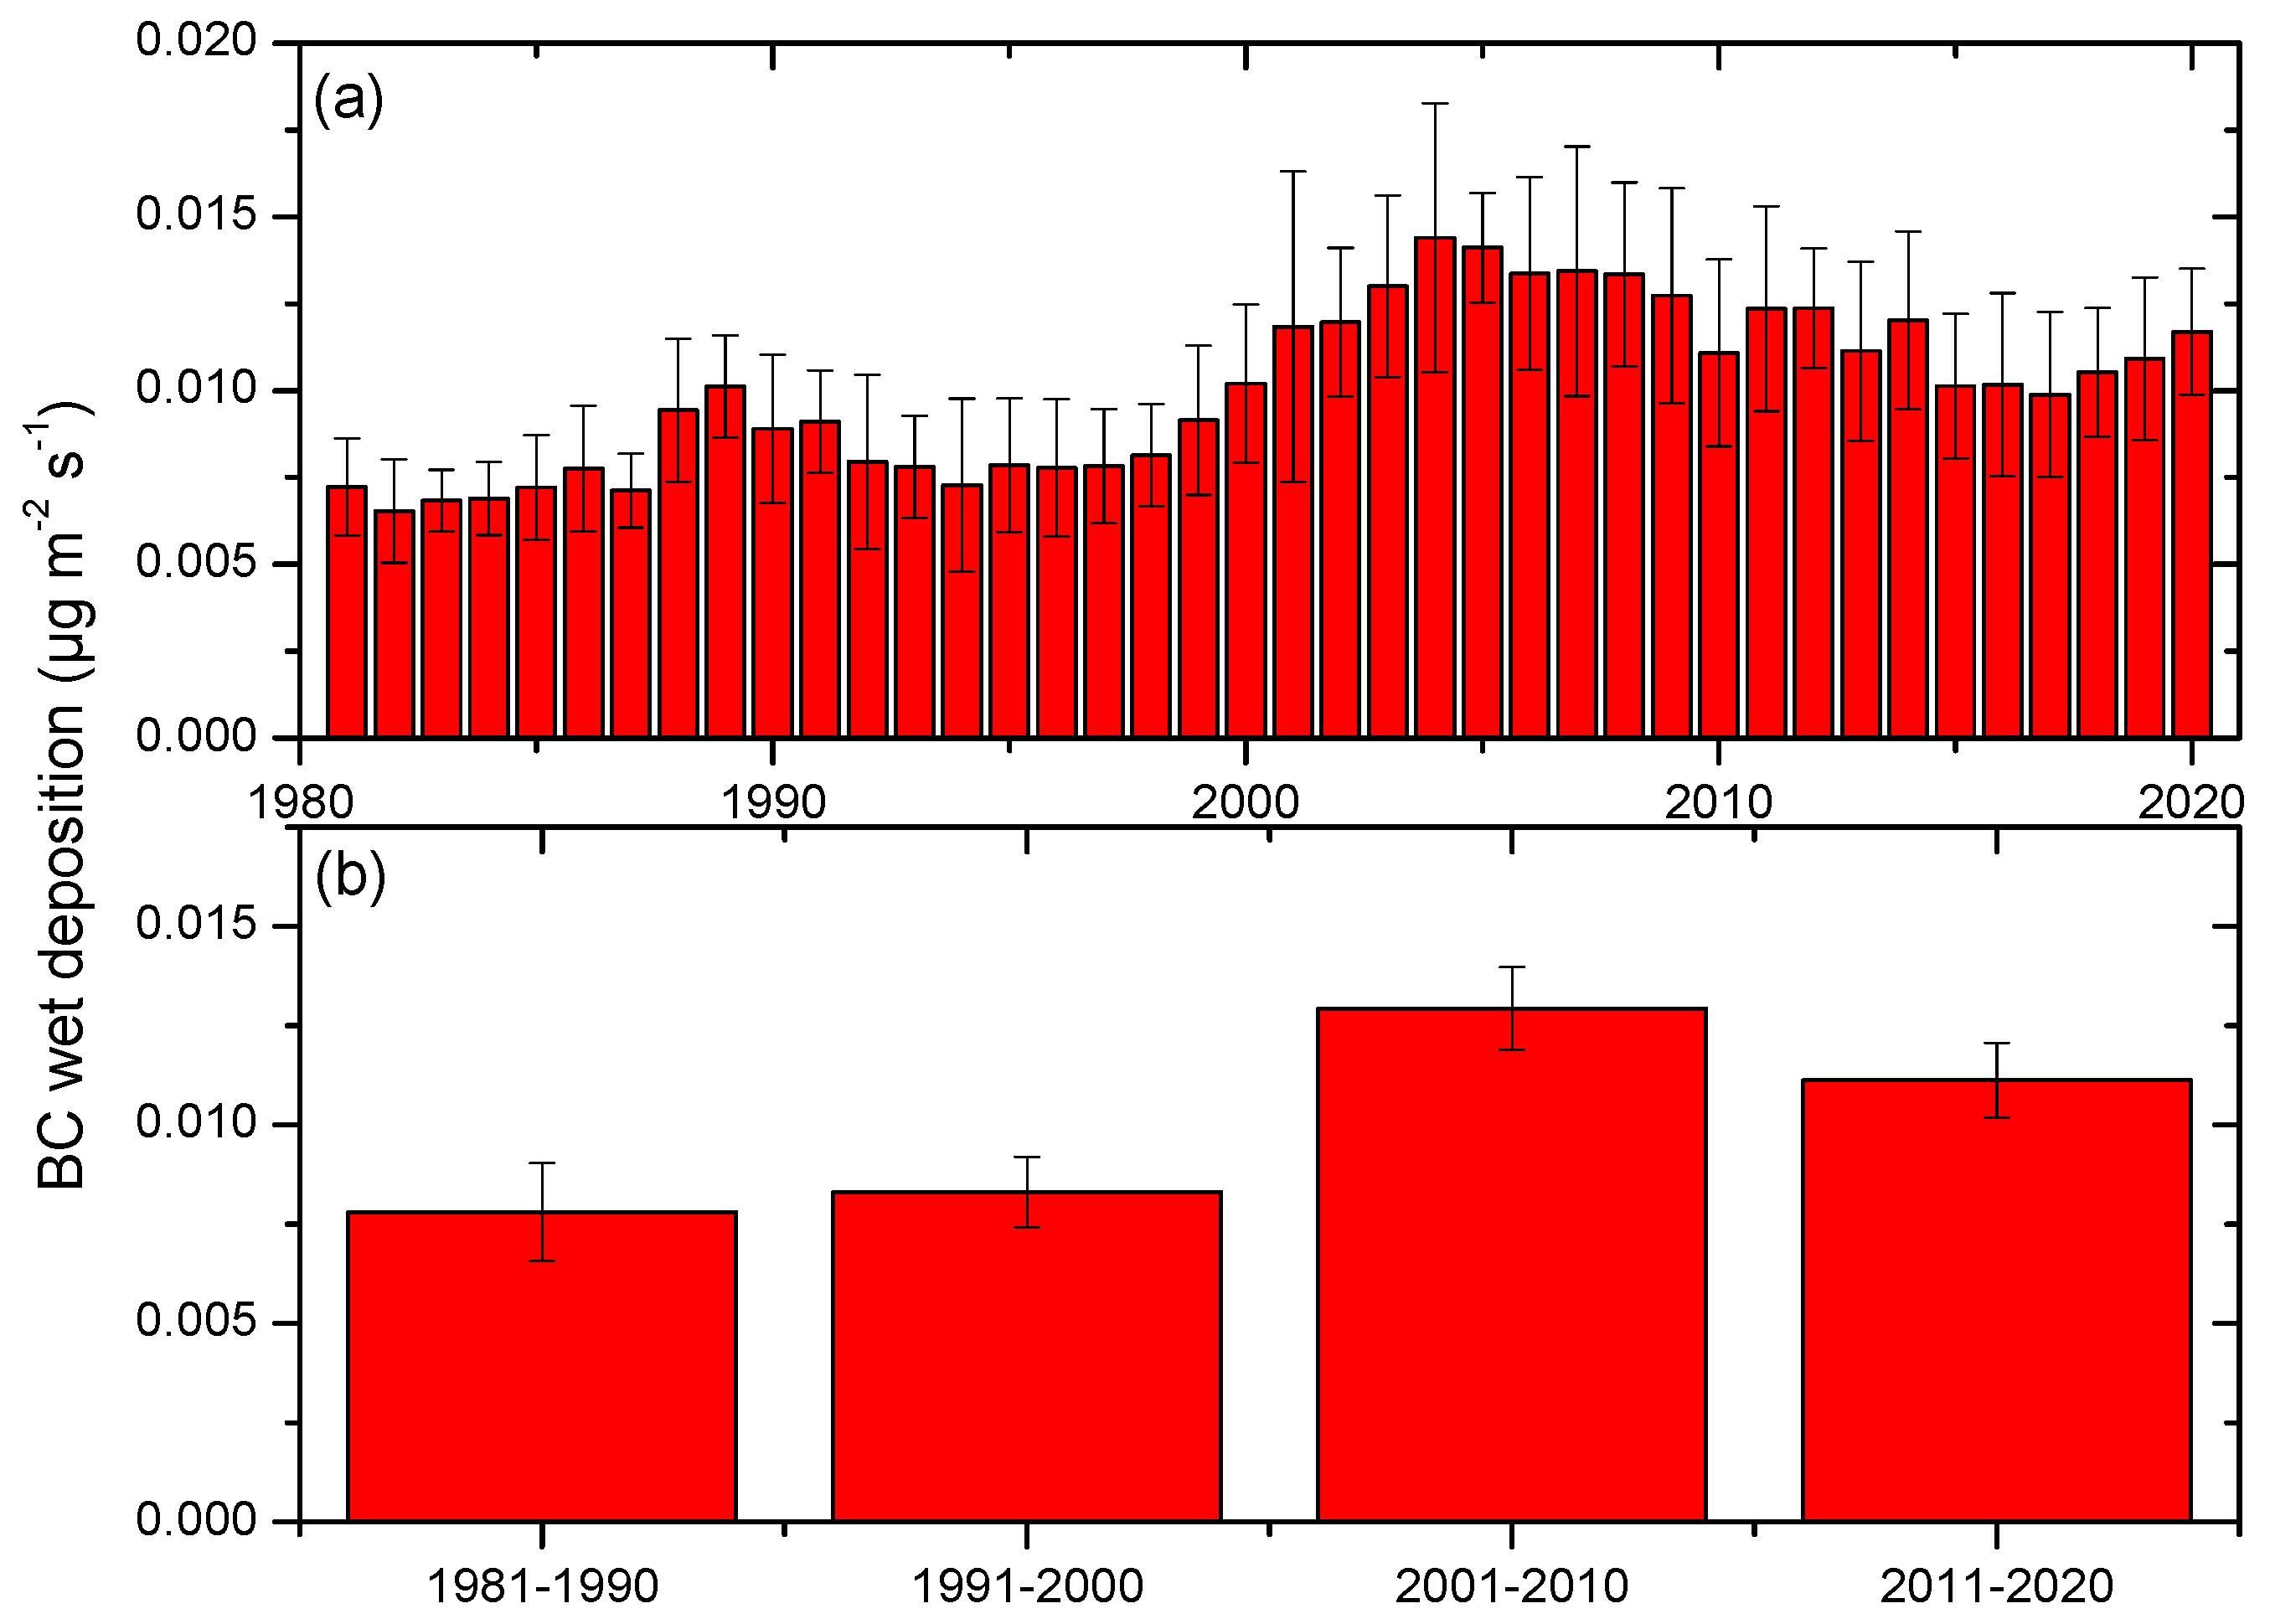
3.1. Annual Trends of BC Wet Deposition
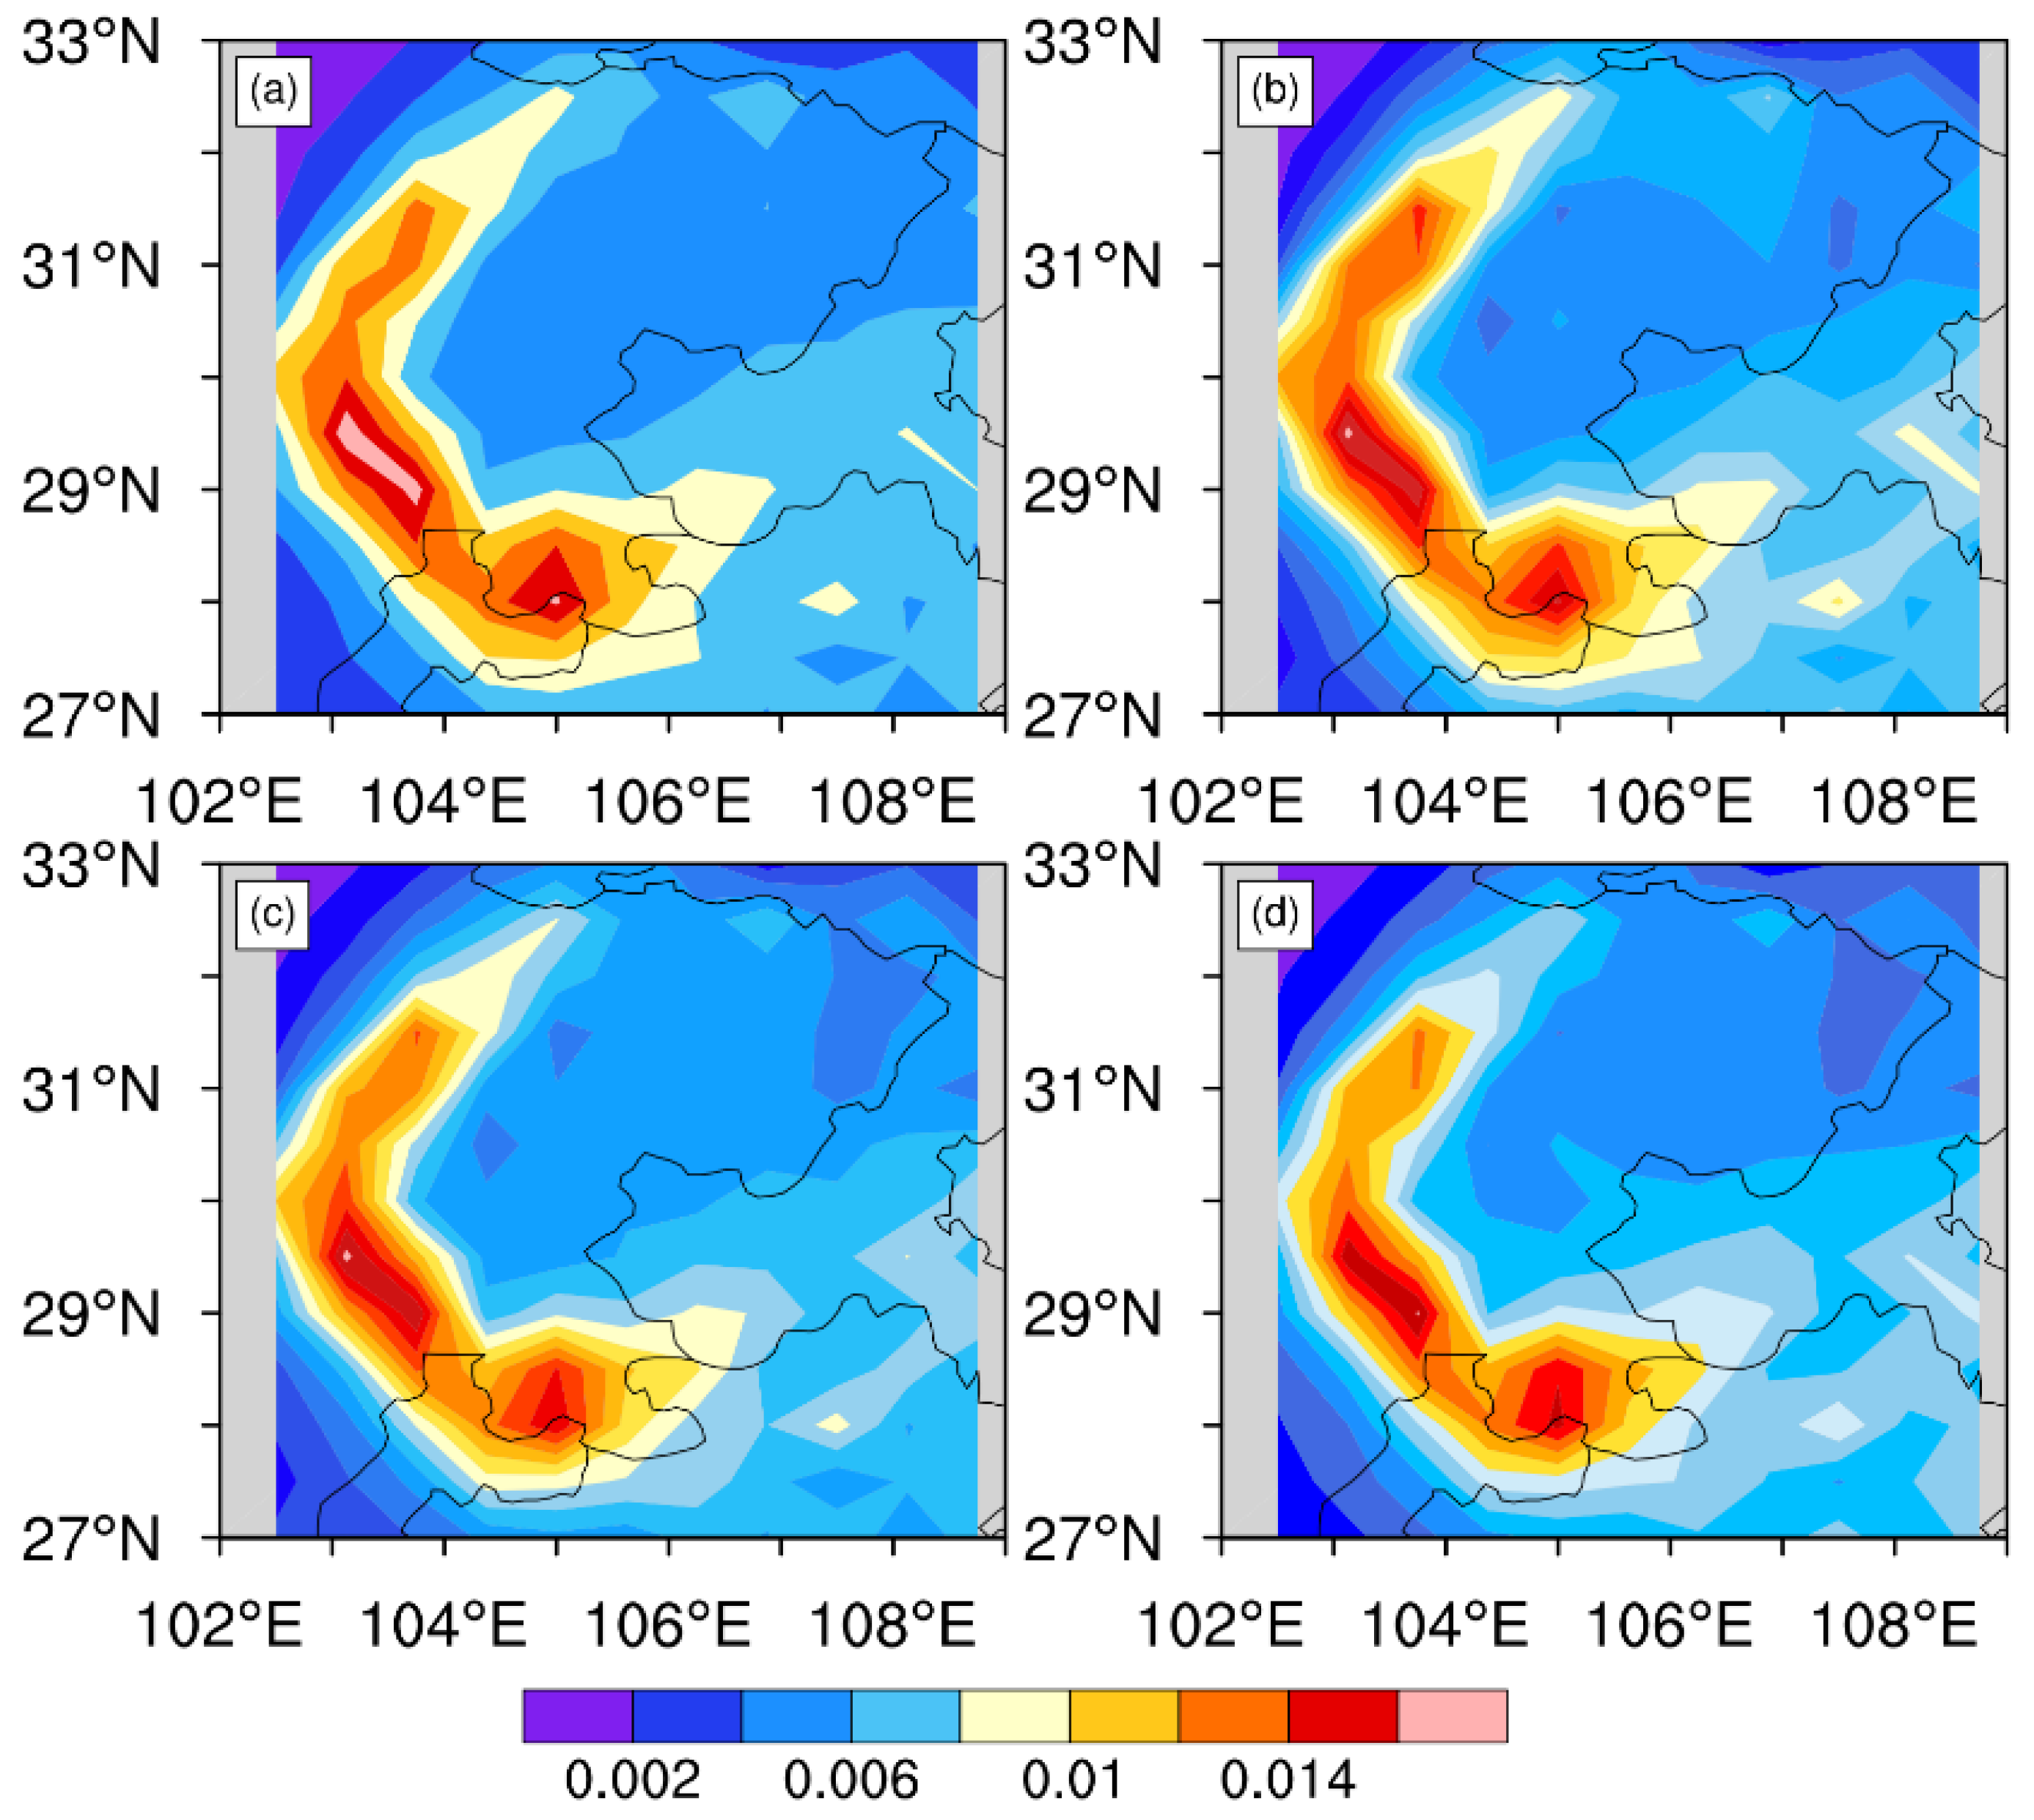
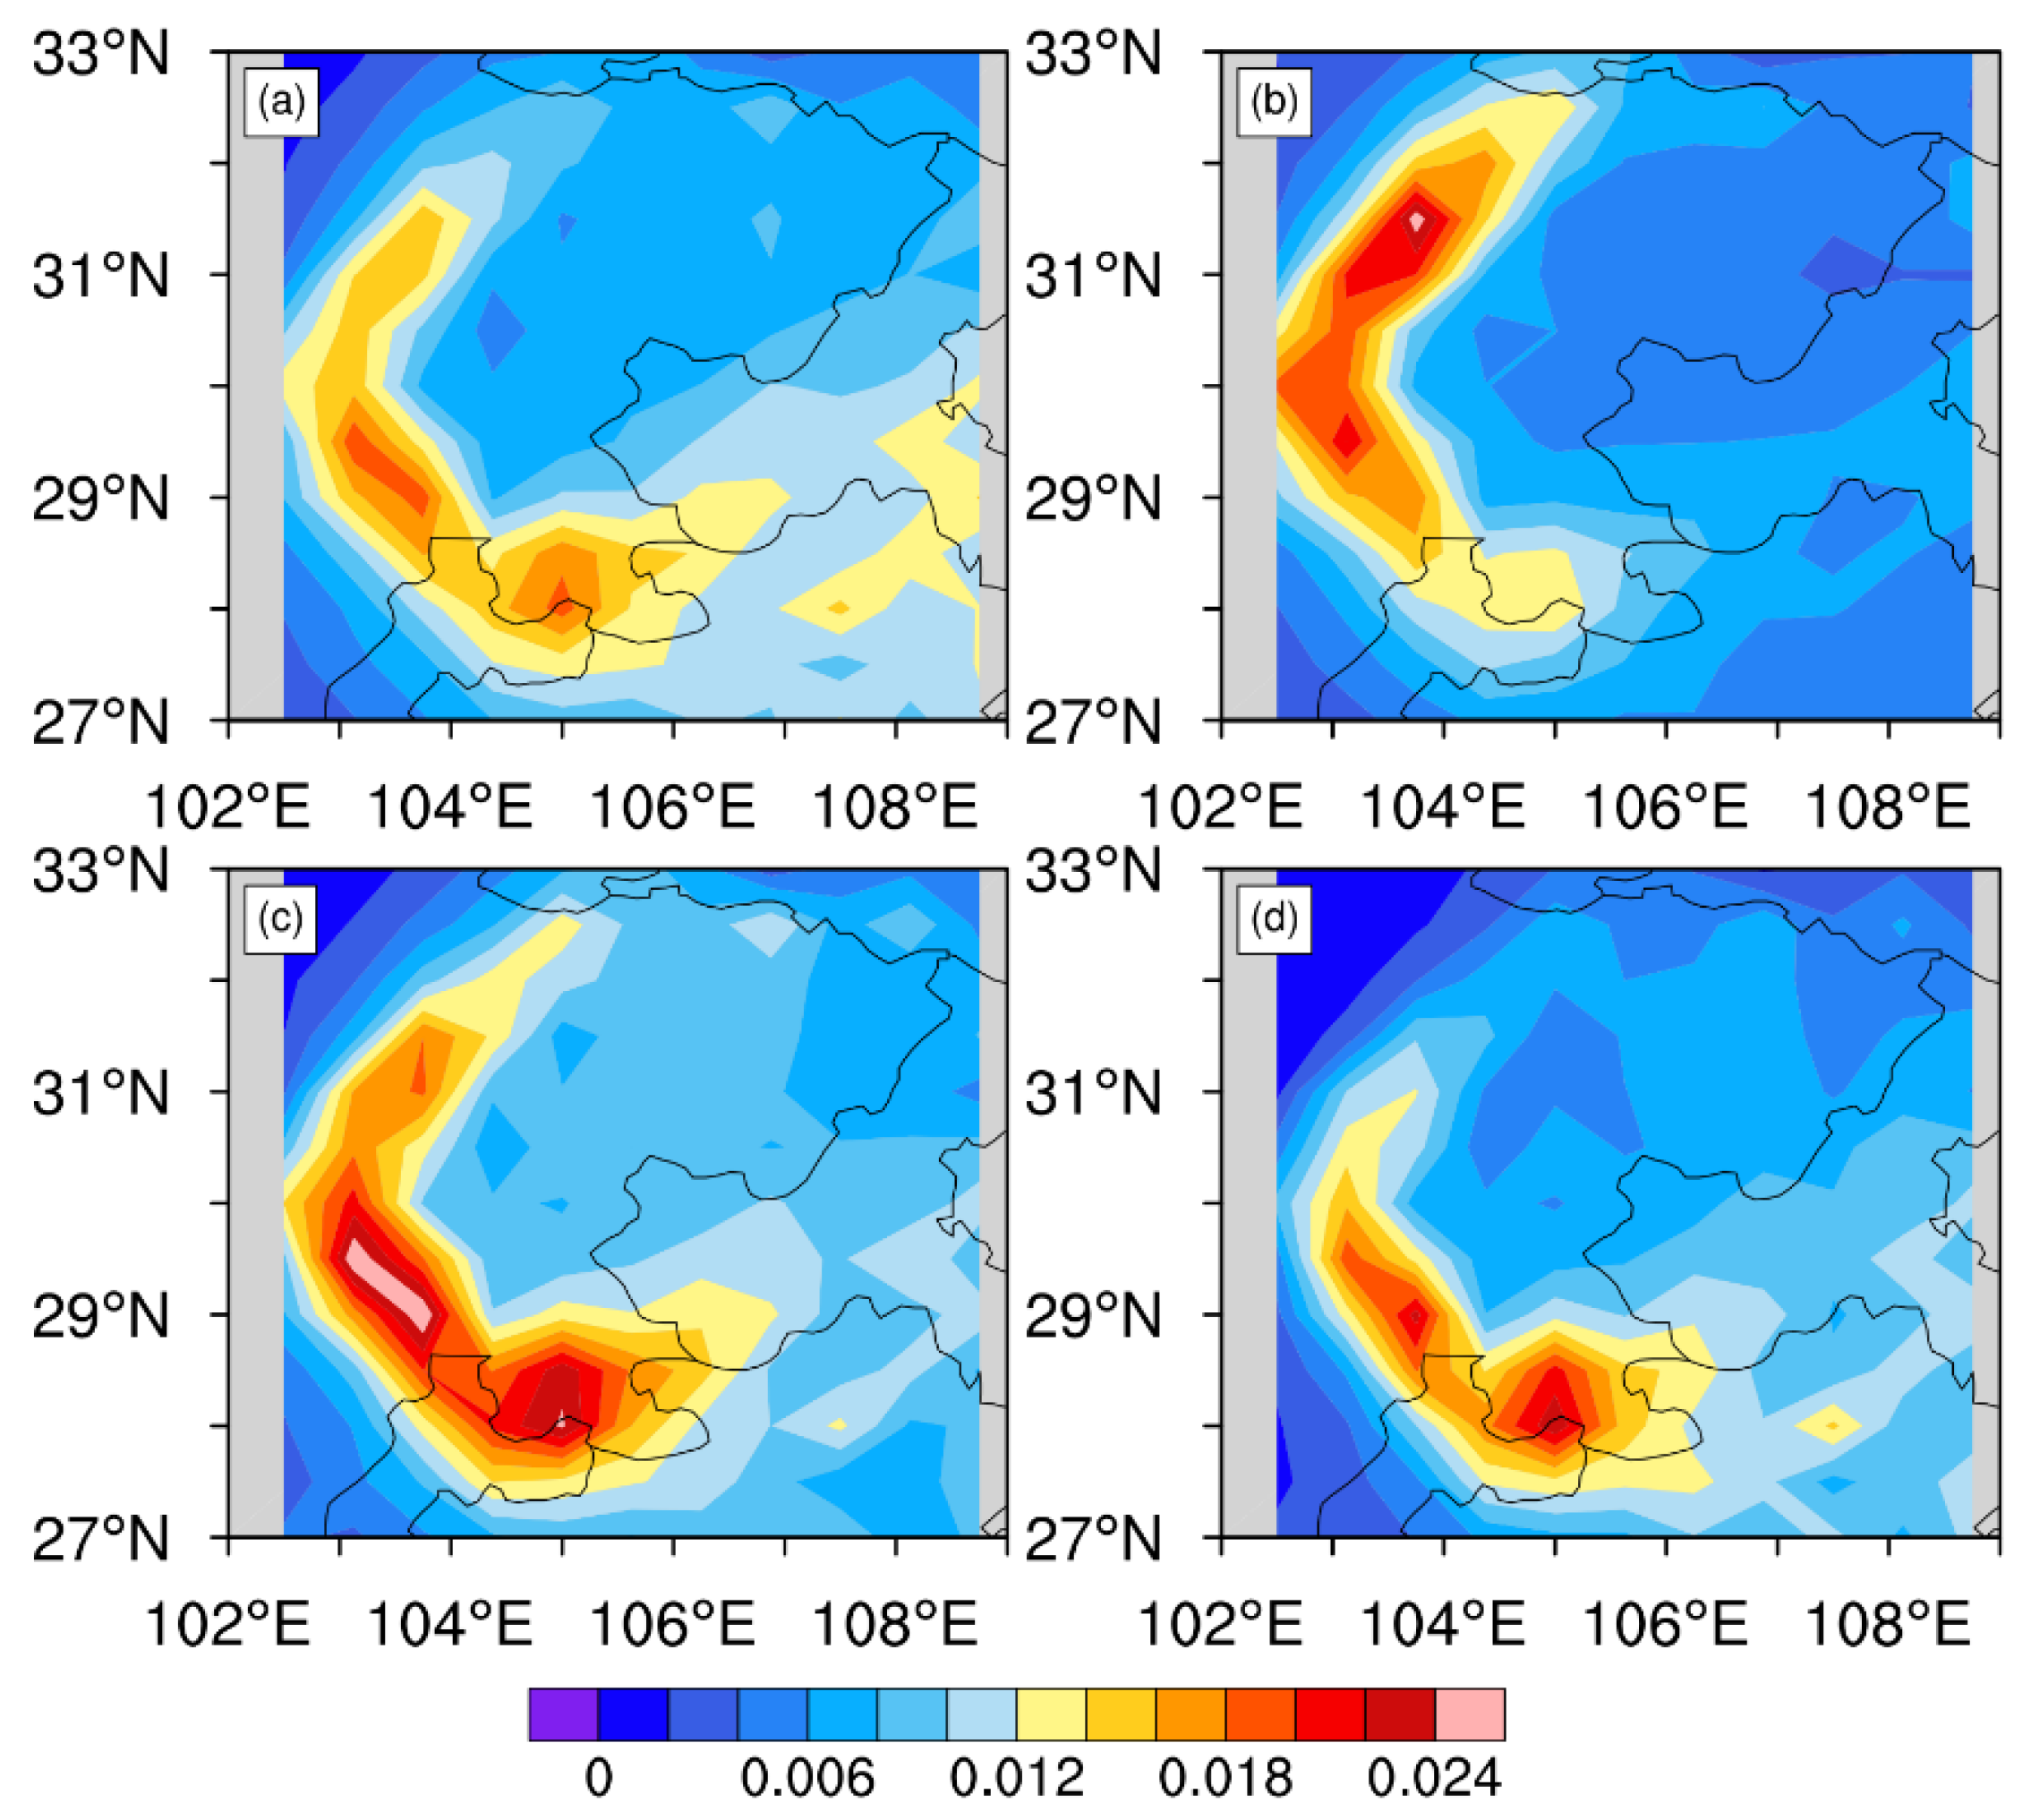
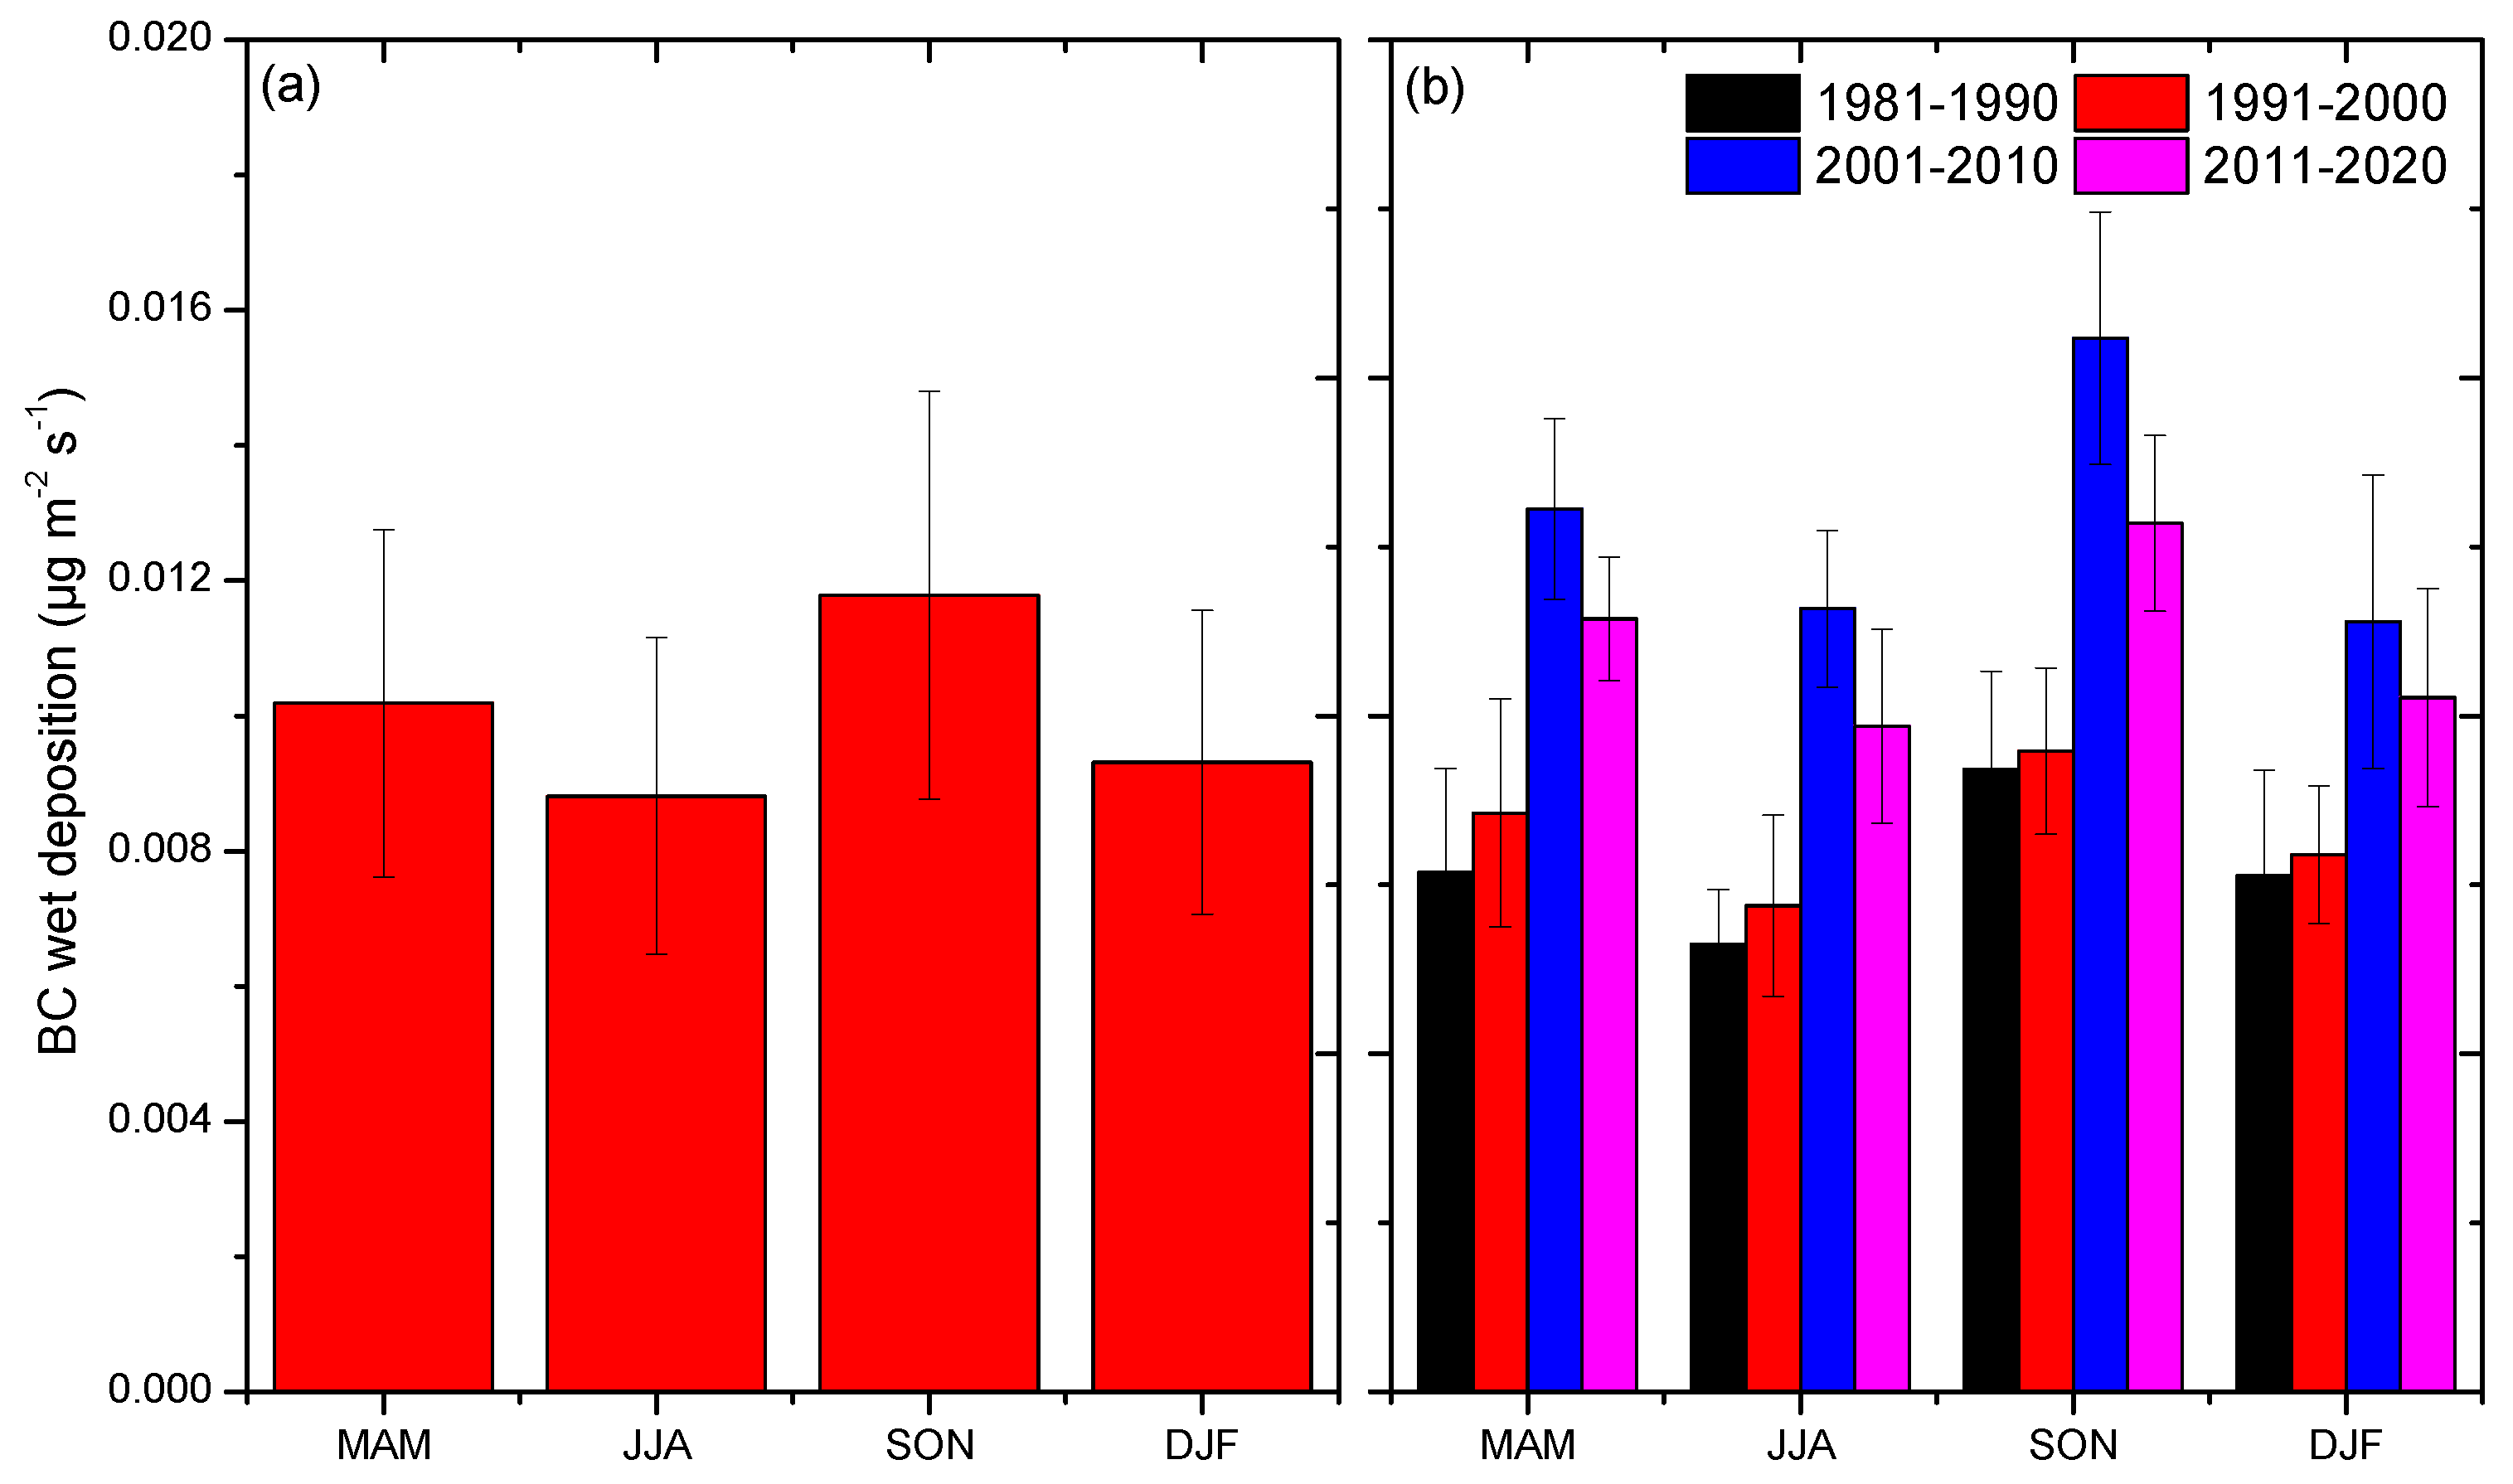
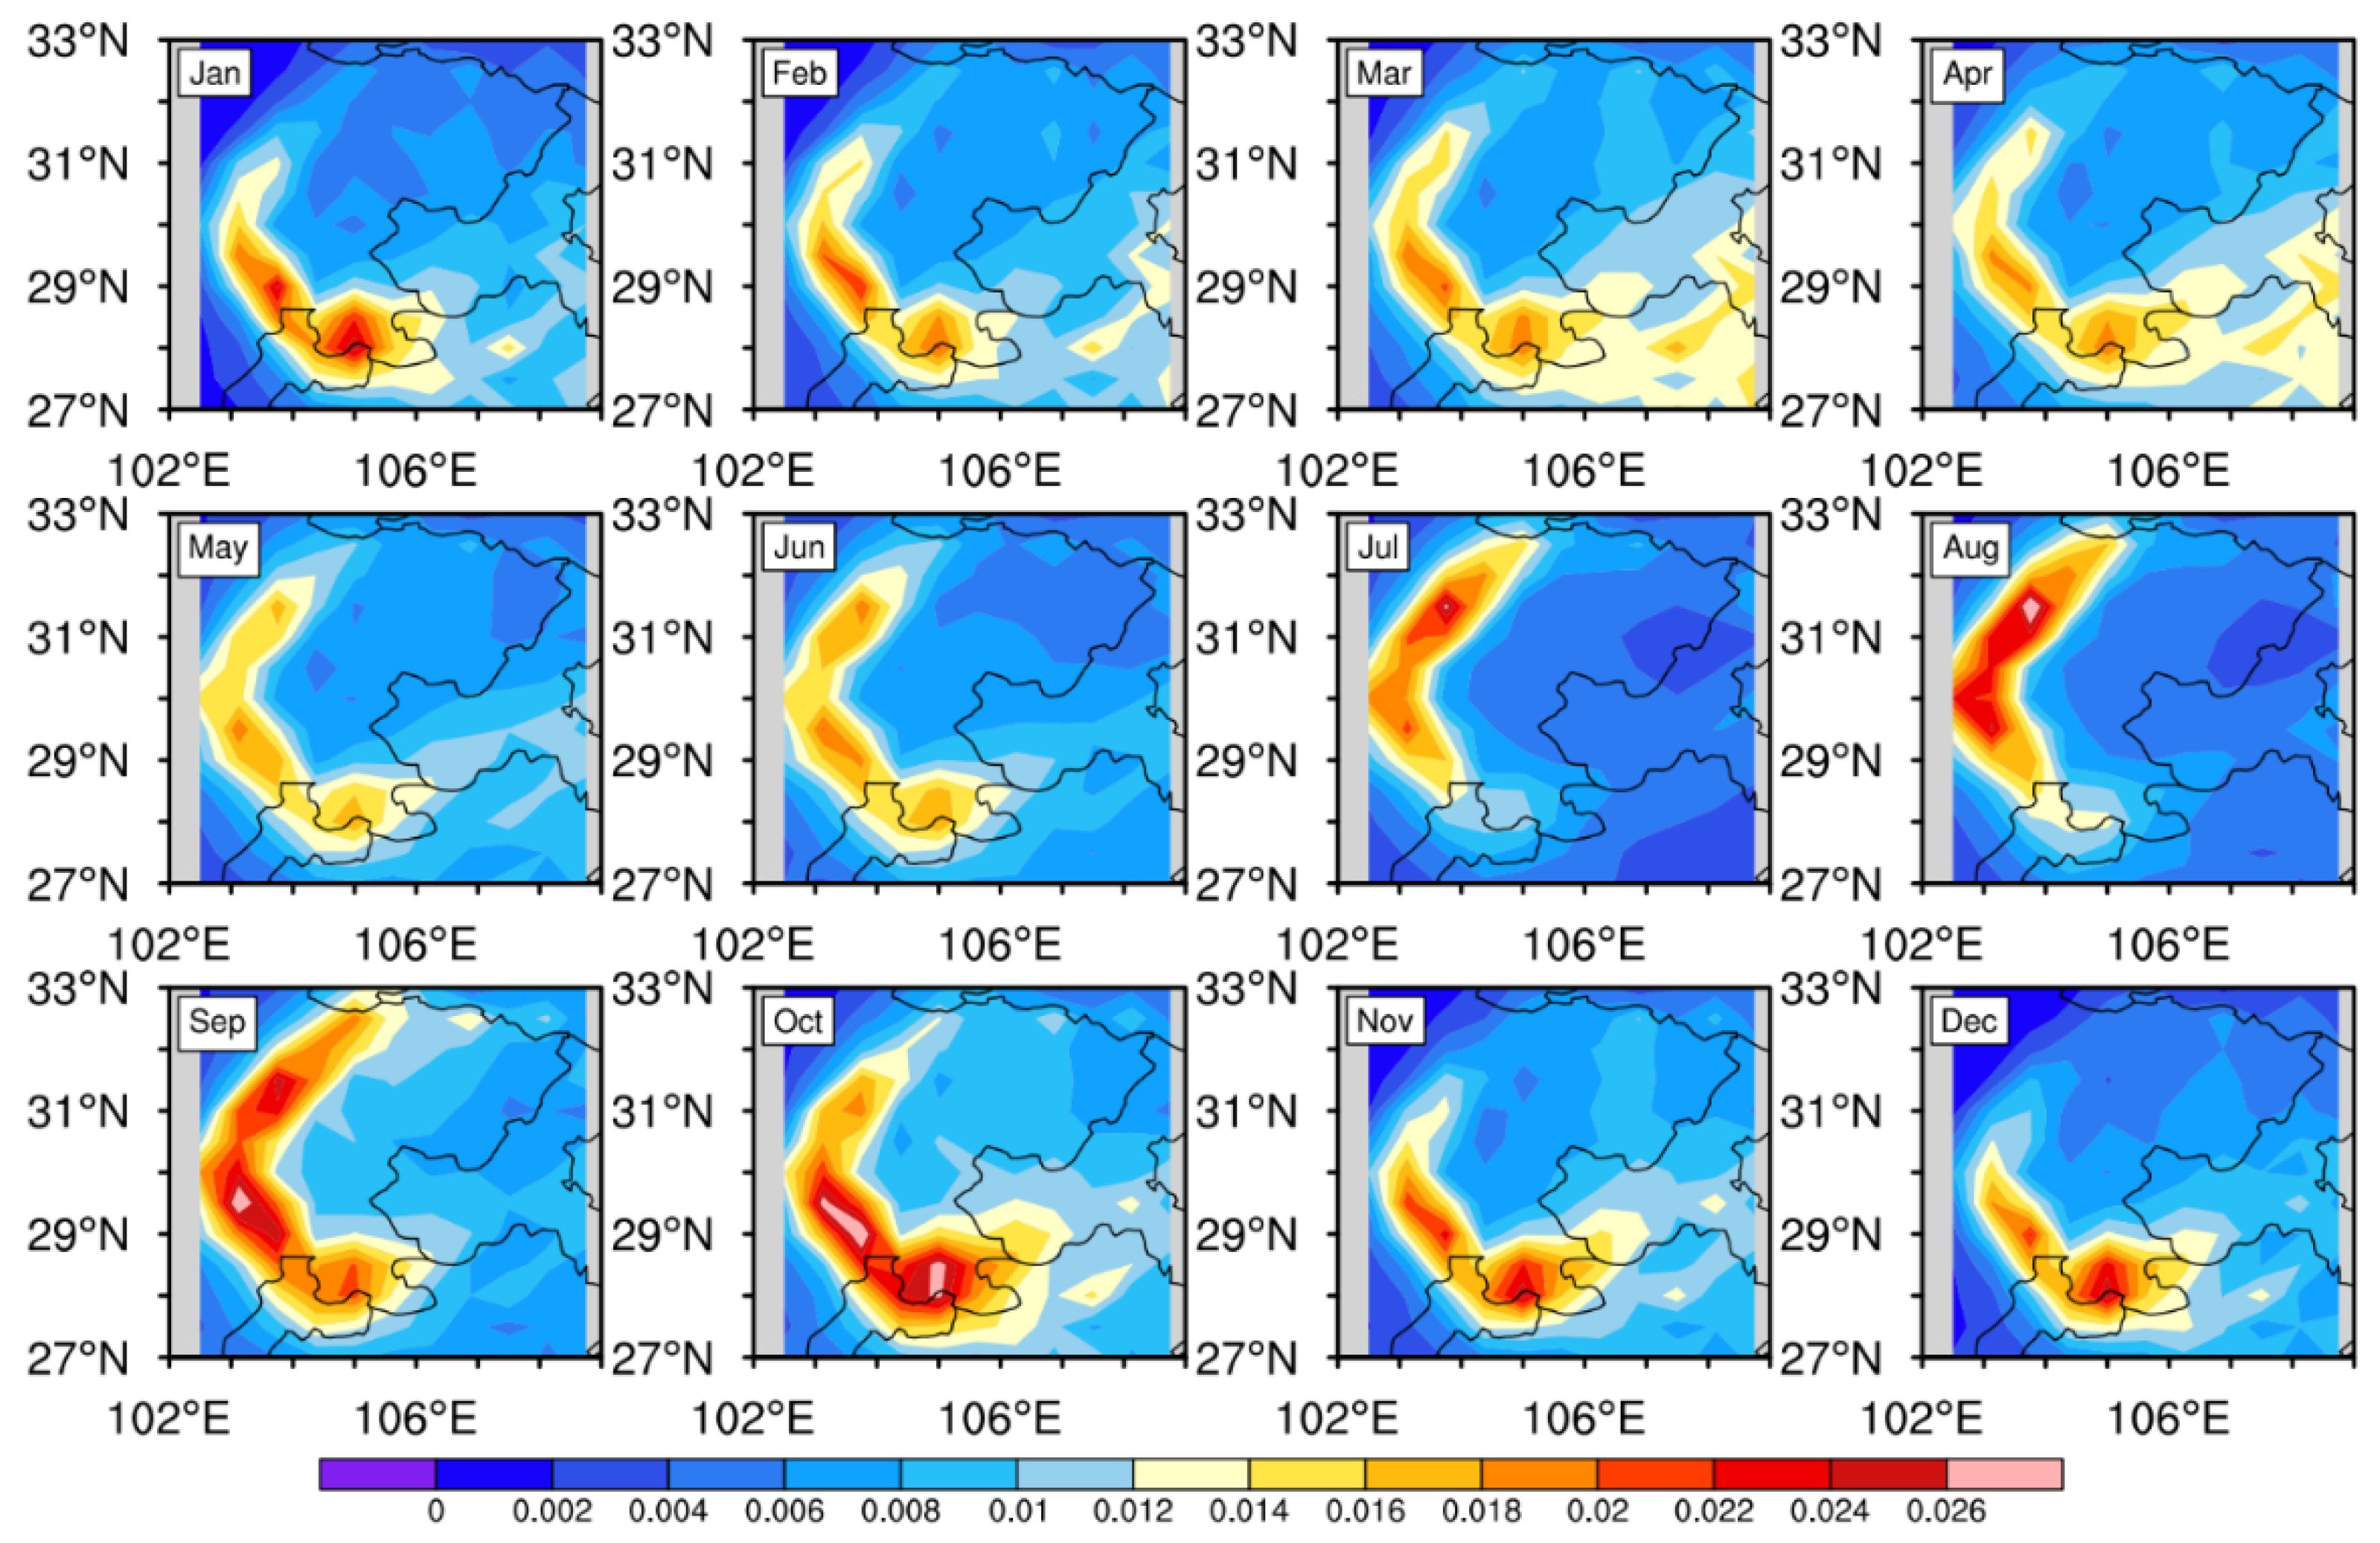
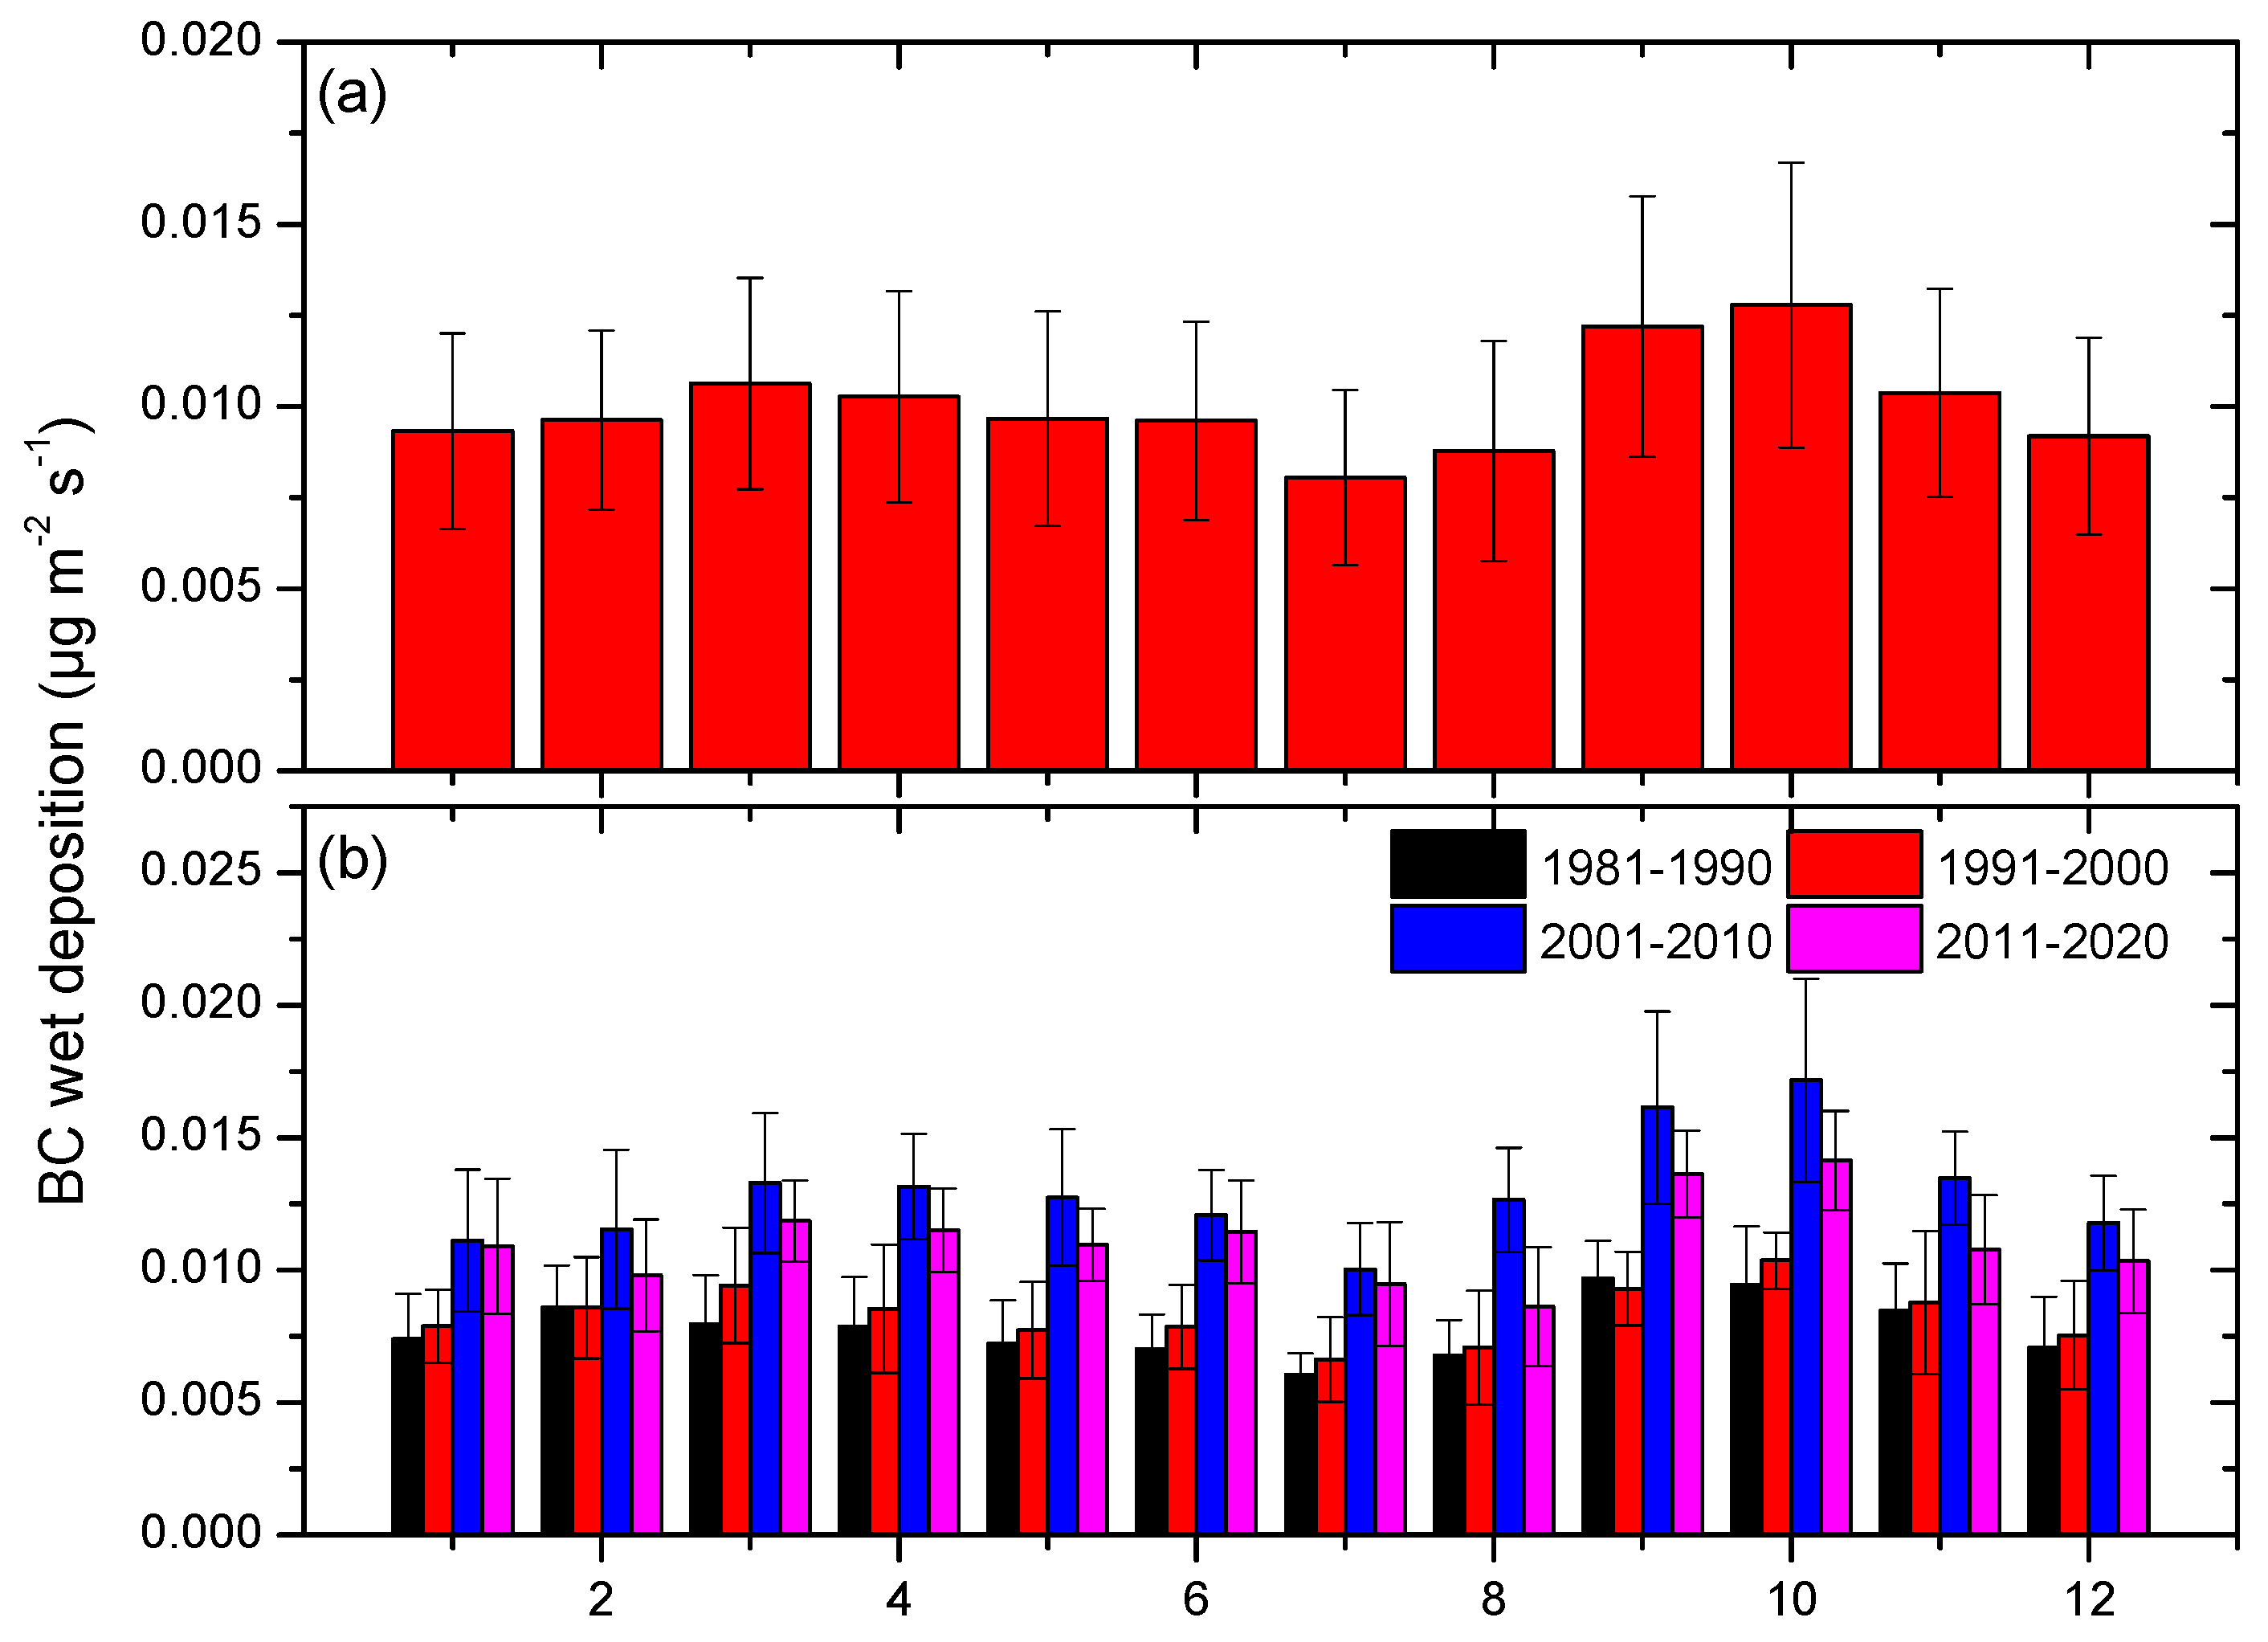
3.2. Seasonal and Monthly Patterns of BC Wet Deposition
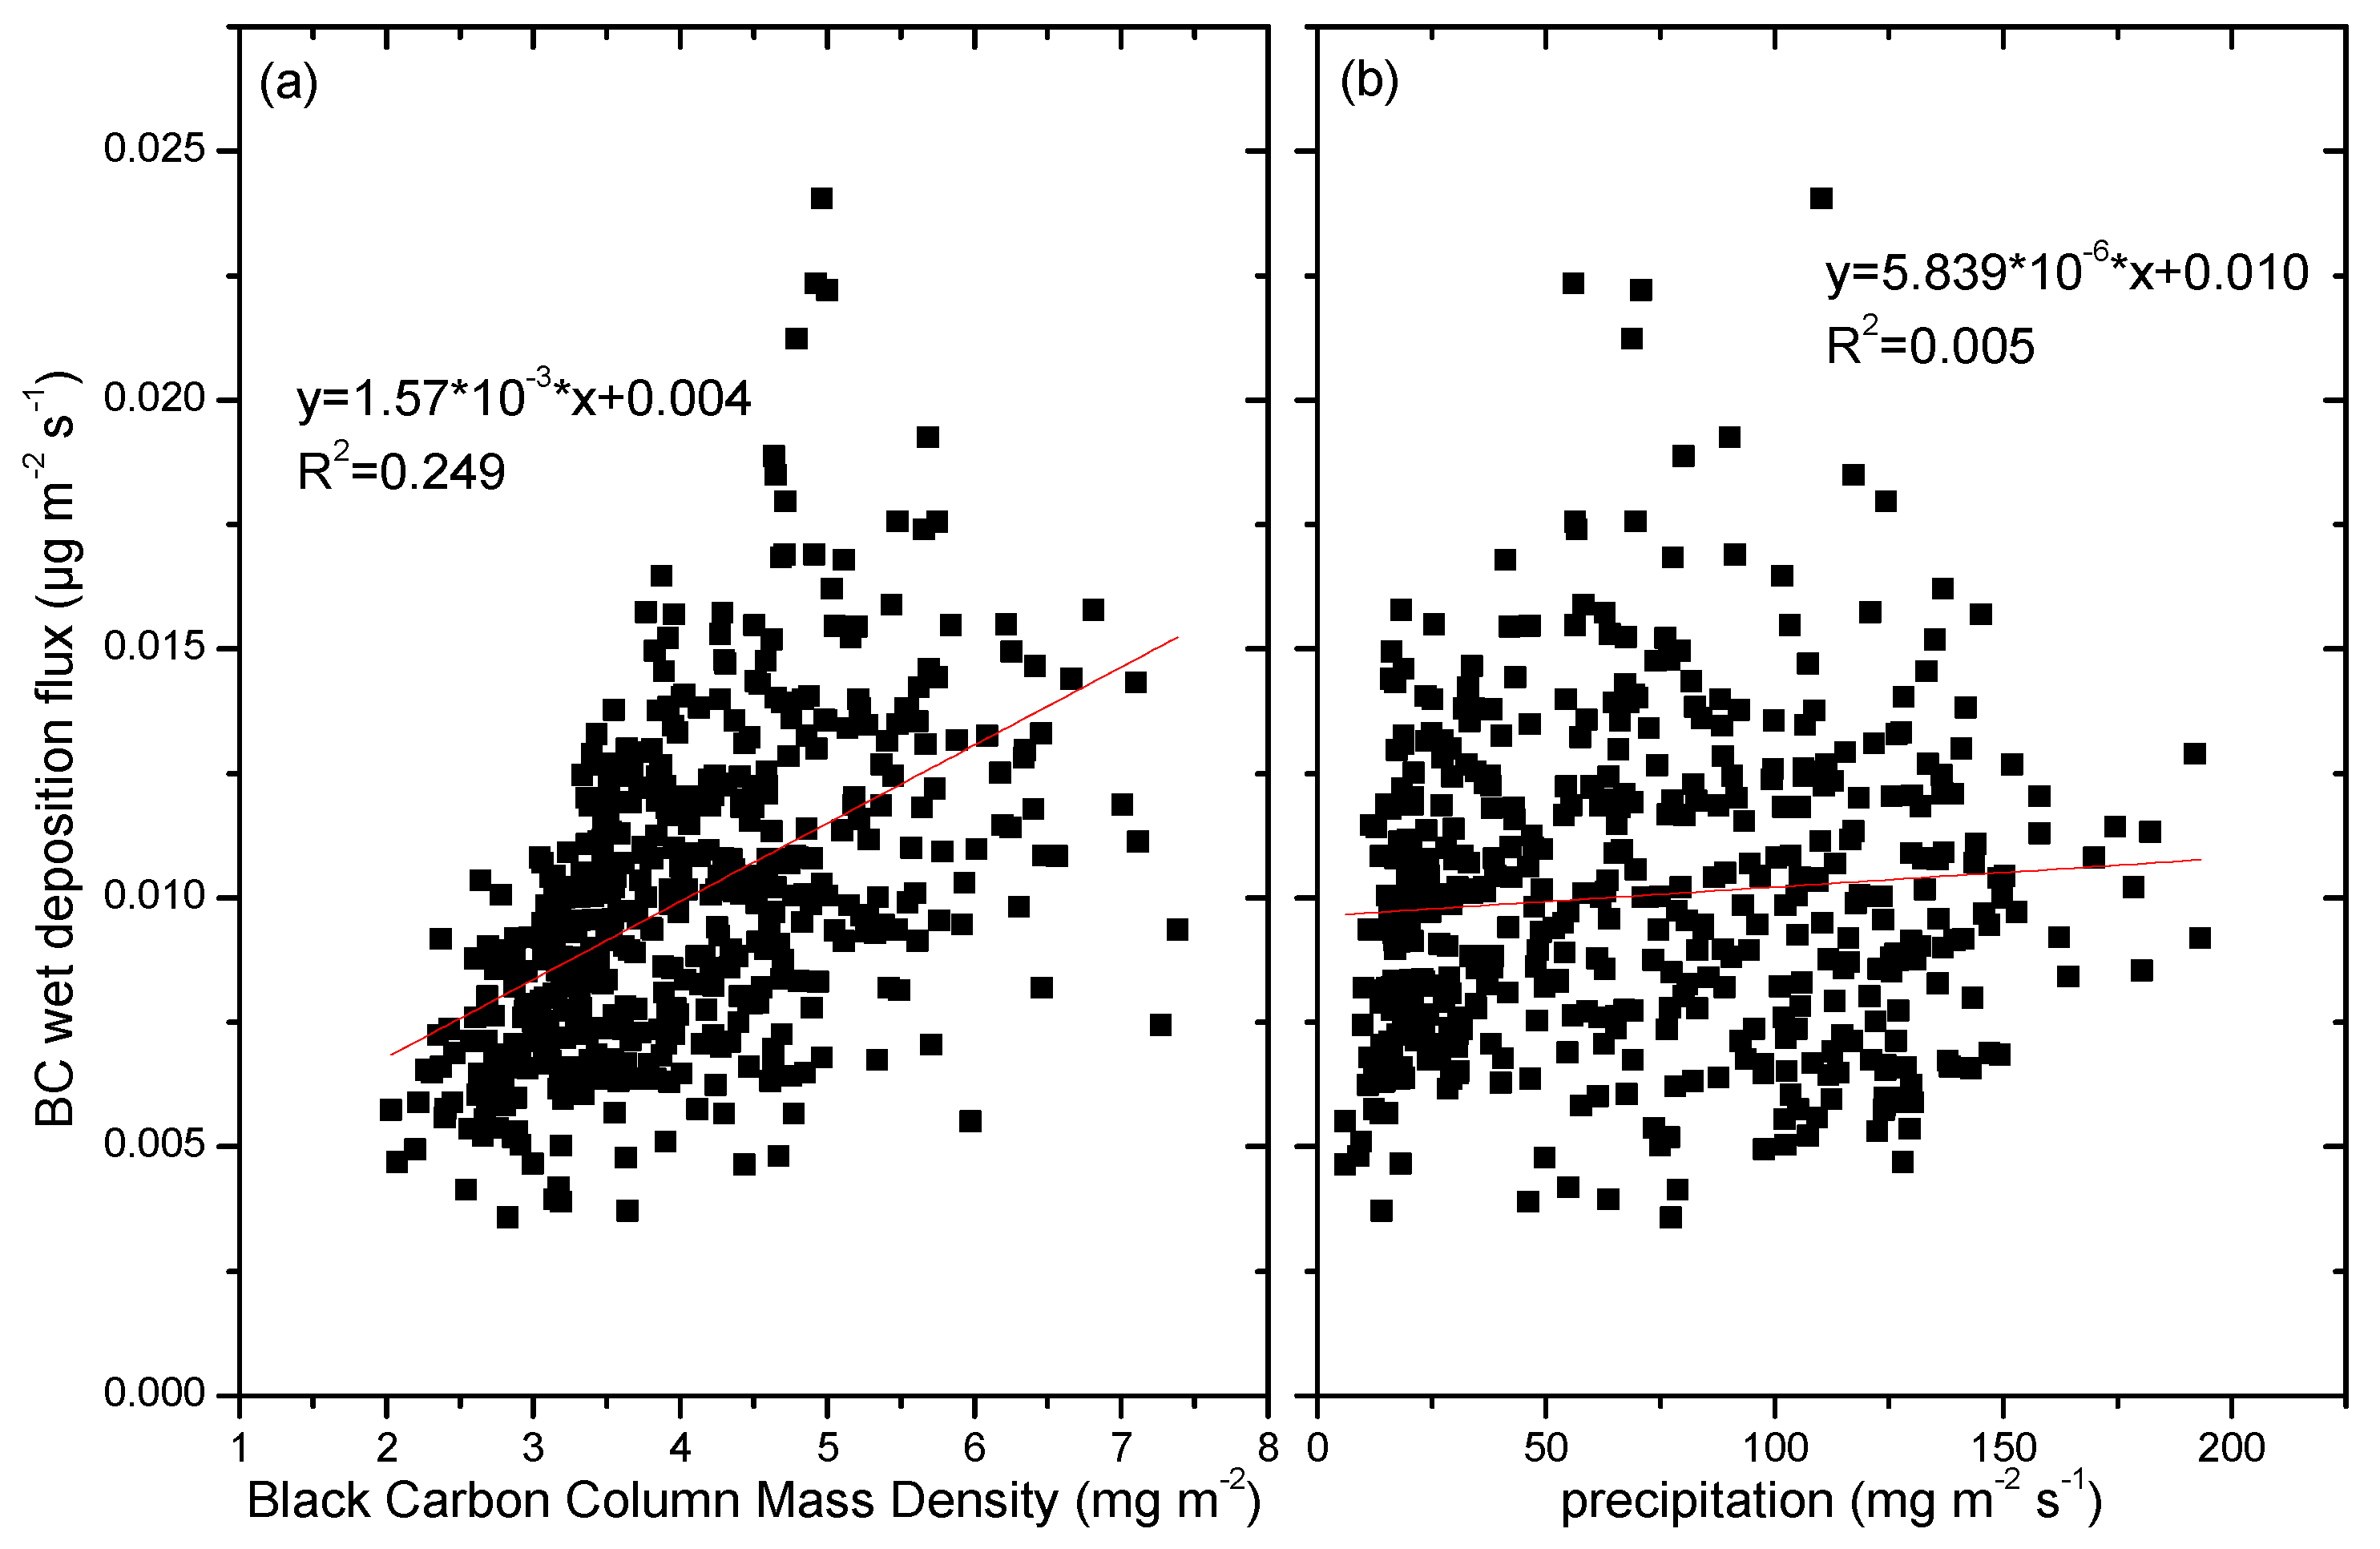
3.3. Factors Influencing BC Wet Deposition
4. Conclusions
Author Contributions
Funding
Institutional Review Board Statement
Informed Consent Statement
Data Availability Statement
Acknowledgments
Conflicts of Interest
References
- Bond, T.C.; Doherty, S.J.; Fahey, D.W.; Forster, P.M.; Berntsen, T.; DeAngelo, B.J.; Flanner, M.G.; Ghan, S.; Kärcher, B.; Koch, D.; et al. Bounding the role of black carbon in the climate system: A scientific assessment. J. Geophys. Res. Atmos. 2013, 118, 5380–5520. [Google Scholar] [CrossRef]
- Wang, Q.Y.; Huang, R.J.; Cao, J.J.; Tie, X.X.; Shen, Z.X.; Zhao, S.Y.; Han, Y.M.; Li, G.H.; Li, Z.Q.; Ni, H.Y.; et al. Contribution of regional transport to the black carbon aerosol during winter haze period in Beijing. Atmos. Environ. 2016, 132, 11–18. [Google Scholar] [CrossRef]
- Homann, K.H. Fullerenes and soot formation-new pathways to large particles in flames. Angew. Chem. Int. Ed. 1998, 37, 2434–2451. [Google Scholar] [CrossRef]
- Custodio, D.; Cerqueira, M.; Fialho, P.; Nunes, T.; Pio, C.; Henriques, D. Wet deposition of particulate carbon to the central North Atlantic Ocean. Sci. Total Environ. 2014, 496, 92–99. [Google Scholar] [CrossRef]
- Zhang, Y.L.; Cerqueira, M.; Salazar, G.; Zotter, P.; Hueglin, C.; Zellweger, C.; Pio, C.; Prevot, A.S.H.; Szidat, S. Wet deposition of fossil and non-fossil derived particulate carbon: Insights from radiocarbon measurement. Atmos. Environ. 2015, 115, 257–262. [Google Scholar] [CrossRef]
- Iavorivska, L.; Boyer, E.W.; DeWalle, D.R. Atmospheric deposition of organic carbon via precipitation. Atmos. Environ. 2016, 146, 153–163. [Google Scholar] [CrossRef] [Green Version]
- Sorokina, V.V.; Soier, V.G. Dry and wet atmospheric deposition of organic carbon in coastal and water areas of the northeastern part of the Sea of Azov. Oceanology 2016, 56, 733–741. [Google Scholar] [CrossRef]
- Wang, Q.; Feng, W.; Liu, M.; Xu, H. Atmospheric elemental carbon deposition from urban and suburban sites of Shanghai: Characteristics, sources and comparison with aerosols and soils. Atmos. Pollut. Res. 2021, 12, 193–199. [Google Scholar] [CrossRef]
- Warneck, P. Chemistry of the Natural Atmosphere, 2nd ed.; Academic Press: New York, NY, USA, 1999; p. 444. [Google Scholar]
- Cerqueira, M.; Pio, C.; Legrand, M.; Puxbaum, H.; Kasper-Giebl, A.; Afonso, J.; Preunkert, S.; Gelencsér, A.; Fialho, P. Particulate carbon in precipitation at European background sites. Aerosol Sci. 2010, 41, 51–61. [Google Scholar] [CrossRef] [Green Version]
- Kardel, F.; Wuyts, K.; Maher, B.A.; Samson, R. Intra-urban spatial variation of magnetic particles: Monitoring via leaf saturation isothermal remanent magnetization (SIRM). Atmos. Environ. 2012, 55, 111–120. [Google Scholar] [CrossRef]
- Yang, F.; Mitra, P.; Zhang, L.; Prak, L.; Verhertbruggen, Y.; Kim, J.S.; Sun, L.; Zheng, K.; Tang, K.; Auer, M. Engineering secondary cell wall deposition in plants. Plant Biotechnol. J. 2012, 11, 325–335. [Google Scholar] [CrossRef] [PubMed] [Green Version]
- Pan, Y.P.; Wang, Y.S. Atmospheric wet and dry deposition of trace elements at 10 sites in Northern China. Atmos. Chem. Phys. 2015, 15, 951–972. [Google Scholar] [CrossRef] [Green Version]
- Nho-Kim, E.; Michou, M.; Peuch, V. Parameterization of size-dependent particle dry deposition velocities for global modeling. Atmos. Environ. 2004, 38, 1933–1942. [Google Scholar] [CrossRef]
- Quérel, A.; Monier, M.; Flossmann, A.I.; Lemaitrea, P.; Porcherona, E. The importance of new collection efficiency values including the effect of rear capture for the below cloud scavenging of aerosol particles. Atmos. Res. 2014, 142, 57–66. [Google Scholar] [CrossRef]
- Sic, B.; Amraoui, L.E.; Marécal, V.; Josse, B.; Arteta, J.; Guth, J.; Joly, M.; Hamer, P.D. Modelling of primary aerosols in the chemical transport model MOCAGE: Development and evaluation of aerosol physical parameterizations. Geosci. Model Dev. 2015, 8, 381–408. [Google Scholar] [CrossRef] [Green Version]
- Zhu, J.X.; He, N.P.; Wang, Q.F.; Yuan, G.F.; Wen, D.; Yu, G.R.; Jia, Y.L. The composition, spatial patterns, and influencing factors of atmospheric wet nitrogen deposition in Chinese terrestrial ecosystems. Sci. Total Environ. 2015, 511, 777–785. [Google Scholar] [CrossRef]
- Luo, X.S.; Pan, Y.P.; Goulding, K.; Zhang, L.; Liu, X.J.; Zhang, F.S. Spatial and seasonal variations of atmospheric sulfur concentrations and dry deposition at 16 rural and suburban sites in China. Atmos. Environ. 2016, 146, 79–89. [Google Scholar] [CrossRef] [Green Version]
- Xu, W.; Zhao, Y.H.; Liu, X.J.; Dore, A.J.; Zhang, L.; Liu, L.; Cheng, M.M. Atmospheric nitrogen deposition in the Yangtze River basin: Spatial pattern and source attribution. Environ. Pollut. 2018, 232, 546–555. [Google Scholar] [CrossRef] [Green Version]
- Yan, F.; Wang, P.; Kang, S.; Chen, P.; Li, C. High particulate carbon deposition in Lhasa–a typical city in the Himalayan–Tibetan Plateau due to local contributions. Chemosphere 2020, 247, 125843. [Google Scholar] [CrossRef]
- Niu, Z.; Huang, Z.; Wang, S.; Feng, X.; Wu, S.; Zhao, H.; Lu, X. Characteristics and source apportionment of particulate carbon in precipitation based on dual-carbon isotopes (13C and 14C) in Xian, China. Environ. Pollut. 2022, 299, 118908. [Google Scholar] [CrossRef]
- Hegg, D.A.; Clarke, A.D.; Doherty, S.J.; Ström, J. Measurements of black carbon aerosol washout ratio on Svalbard. Tellus B Chem. Phys. Meteorol. 2011, 63, 891–900. [Google Scholar] [CrossRef] [Green Version]
- Mori, T.; Kondo, Y.; Ohata, S.; Moteki, N.; Matsui, H.; Oshima, N.; Iwasaki, A. Wet deposition of black carbon at a remote site in the East China Sea. J. Geophys. Res. Atmos. 2014, 119, 10485–10498. [Google Scholar] [CrossRef]
- Wang, Z.W.; Gallet, J.C.; Pedersen, C.A.; Zhang, X.S.; Ström, J.; Ci, Z.J. Elemental carbon in snow at Changbai Mountain, northeastern China: Concentrations, scavenging ratios, and dry deposition velocities. Atmos. Chem. Phys. 2014, 14, 14221–14248. [Google Scholar] [CrossRef] [Green Version]
- Hadley, O.L.; Corrigan, C.; Ramanathan, V. Measurements of Black Carbon in California Snow and Rain; California Energy Commission, PIER Energy-Related Environmental Research Program: Sacramento, CA, USA, 2007.
- Ohata, S.; Moteki, N.; Kondo, Y. Evaluation of a Method for measurement of the concentration and size distribution of black carbon particles suspended in rainwater. Aerosol Sci. Technol. 2011, 45, 1326–1336. [Google Scholar] [CrossRef] [Green Version]
- Willey, J.D.; Kieber, R.J.; Eyman, M.S.; Avery, G.B. Rainwater Dissolved Organic Carbon: Concentrations and Global Flux. Glob. Biogeochem. Cycles 2000, 14, 139–148. [Google Scholar] [CrossRef]
- Wu, M.X.; Liu, X.H.; Zhang, L.M.; Wu, C.L.; Lu, Z.; Ma, P.L.; Wang, H.L.; Tilmes, S.; Mahowald, N.; Matsui, H.; et al. Impacts of aerosol dry deposition on black carbon spatial distributions and radiative effects in the Community Atmosphere Model CAM5. J. Adv. Model. Earth Syst. 2018, 10, 1150–1171. [Google Scholar] [CrossRef] [Green Version]
- Matsumoto, K.; Kodama, S.; Sakata, K.; Watanabe, Y. Atmospheric deposition fluxes and processes of the water-soluble and water-insoluble organic carbon in central Japan. Atmos. Environ. 2022, 271, 118913. [Google Scholar] [CrossRef]
- Coelho, C.H.; Francisco, J.G.; Nogueira, R.F.P.; Campos, M.L.A.M. Dissolved Organic Carbon in Rainwater from Areas Heavily Impacted by Sugar Cane Burning. Atmos. Environ. 2008, 30, 7115–7121. [Google Scholar] [CrossRef]
- Zeng, J.; Yu, F.J.; Xia, M.; Wan, Z.J.; Wu, Q.X.; Qin, C.Q. Dissolved organic carbon in rainwater from a karst agricultural area of Southwest China: Variations, sources, and wet deposition fluxes. Atmos. Res. 2020, 245, 105140. [Google Scholar] [CrossRef]
- Niu, H.; Kang, S.C.; Shi, X.F.; Zhang, G.T.; Wang, S.J.; Pu, T. Dissolved organic carbon in summer precipitation and its wet deposition flux in the Mt. Yulong region, southeastern Tibetan Plateau. J. Atmos. Chem. 2019, 76, 1–20. [Google Scholar] [CrossRef]
- Zhao, H.H.; Chen, L.Q.; Yan, J.P.; Shi, P.; Li, Y.; Li, W. Characteristics of Particulate Carbon in Precipitation during the Rainy Season in Xiamen Island, China. Atmosphere 2016, 7, 140. [Google Scholar] [CrossRef] [Green Version]
- Pan, Y.P.; Wang, Y.S.; Xin, J.Y.; Tang, G.Q.; Song, T.; Wang, Y.H.; Li, X.R.; Wu, F.K. Study on Dissolved Organic Carbon in Precipitation in Northern China. Atmos. Environ. 2010, 44, 2350–2357. [Google Scholar] [CrossRef]
- Orlović-Leko, P.; Plavšić, M.; Bura-Nakić, E.; Kozarac, Z.; Ćosović, B. Organic Matter in the Bulk Precipitations in Zagreb and Šibenik, Croatia. Atmos. Environ. 2009, 43, 805–811. [Google Scholar] [CrossRef]
- Kanakidou, M.; Duce, R.A.; Prospero, J.M.; Baker, A.R.; Benitez-Nelson, C.; Dentener, F.J.; Hunter, K.A.; Liss, P.S.; Mahowald, N.; Okin, G.S. Atmospheric Fluxes of Organic N and P to the Global Ocean. Glob. Biogeochem. Cycles 2012, 26, 1–12. [Google Scholar] [CrossRef]
- Matsuda, K.; Sase, H.; Murao, N.; Fukazawa, T.; Khoomsub, K.; Chanonmuang, P.; Visaratana, T.; Khummongkol, P. Dry and wet deposition of elemental carbon on a tropical forest in Thailand. Atmos. Environ. 2012, 54, 282–287. [Google Scholar] [CrossRef]
- Jacobi, H.W.; Obleitner, F.; Da Costa, S.; Ginot, P.; Eleftheriadis, K.; Aas, W.; Zanatta, M. Deposition of ionic species and black carbon to the Arctic snowpack: Combining snow pit observations with modeling. Atmos. Chem. Phys. 2019, 19, 10361–10377. [Google Scholar] [CrossRef] [Green Version]
- Zhu, S.B.; Xiao, Z.S.; Che, H.Z.; Chen, Q.L. Impact of aerosols on warm clouds over the Sichuan Basin, China in winter based on the MERRA-2 reanalysis dataset. Atmos. Pollut. Res. 2022, 13, 101342. [Google Scholar] [CrossRef]
- Zhao, S.P.; Yu, Y.; Yin, D.Y.; Qin, D.H.; He, J.J.; Dong, L.X. Spatial patterns and temporal variations of six criteria air pollutants during 2015 to 2017 in the city clusters of Sichuan Basin, China. Sci. Total Environ. 2018, 624, 540–557. [Google Scholar] [CrossRef]
- Randles, C.A.; da Silva, A.M.; Buchard, V.; Colarco, P.R.; Darmenov, A.; Govindaraju, R.; Smirnov, A.; Holben, B.; Ferrare, R.; Hair, J.; et al. The MERRA-2 aerosol reanalysis, 1980 onward. Part I: System description and data assimilation evaluation. J. Clim. 2017, 30, 6823–6850. [Google Scholar] [CrossRef]
- Buchard, V.; Randles, C.A.; da Silva, A.M.; Darmenov, A.; Colarco, P.R.; Govindaraju, R.; Ferrare, R.; Hair, J.; Beyersdorf, A.J.; Ziemba, L.D.; et al. The MERRA-2 aerosol reanalysis, 1980 onward. Part II: Evaluation and case studies. J. Clim. 2017, 30, 6851–6872. [Google Scholar] [CrossRef]
- Gelaro, R.; McCarty, W.; Suárez, M.J.; Todling, R.; Molod, A.; Takacs, L.; Randles, C.A.; Darmenov, A.; Bosilovich, M.G.; Reichle, R.; et al. The Modern-Era retrospective analysis for research and applications, version 2 (MERRA-2). J. Clim. 2017, 30, 5419–5454. [Google Scholar] [CrossRef] [PubMed]
- Hung, W.T.; Lu, C.; Wang, S.H.; Chen, S.P.; Tsai, F.; Chou, C.K. Investigation of long-range transported PM2.5 events over Northern Taiwan during 2005–2015 winter seasons. Atmos. Environ. 2019, 217, 116920. [Google Scholar] [CrossRef]
- Global Modeling and Assimilation Office. Available online: https://gmao.gsfc.nasa.gov/reanalysis/MERRA-2/ (accessed on 3 July 2019).
- Chen, Y.T.; Gao, Y.; Wu, S.L.; Zhang, L.; Wang, Q.Q.; Yao, X.H.; Gao, H.W. Wet deposition of atmospheric selenium and sensitivity to emission and precipitation patterns. Sci. Total Environ. 2022, 835, 155402. [Google Scholar] [CrossRef]
- Huo, M.Q.; Sato, K.; Ohizumi, T.; Akimoto, H.; Takahashi, K. Characteristics of carbonaceous components in precipitation and atmospheric particle at Japanese sites. Atmos. Environ. 2016, 146, 164–173. [Google Scholar] [CrossRef]
- Zhang, X.Y.; Zhao, L.M.; Cheng, M.M.; Liu, H.L.; Wang, Z.; Wu, X.D.; Yu, H. Long-term changes in wet nitrogen and sulfur deposition in Nanjing. Atmos. Environ. 2018, 195, 104–111. [Google Scholar] [CrossRef]
- Cao, S.S.; Zhang, S.Q.; Gao, C.C.; Yan, Y.Y.; Bao, J.H.; Su, L.; Liu, M.Q.; Peng, N.N.; Liu, M. A long-term analysis of atmospheric black carbon MERRA-2 concentration over China during 1980–2019. Atmos. Environ. 2021, 264, 118662. [Google Scholar] [CrossRef]
- Yuan, X.; Zuo, J. Transition to low carbon energy policies in China—From the Five-Year Plan perspective. Energy Policy 2011, 39, 3855–3859. [Google Scholar] [CrossRef]
- Xu, X.F.; Yang, X.Y.; Zhu, B.; Tang, Z.W.; Wu, H.; Xie, L.F. Characteristics of MERRA-2 black carbon variation in east China during 2000–2016. Atmos. Environ. 2020, 222, 117140. [Google Scholar] [CrossRef]
- Wang, H.; Tian, M.; Chen, Y.; Shi, G.; Liu, Y.; Yang, F.; Zhang, L.; Deng, L.; Yu, J.; Peng, C.; et al. Seasonal characteristics, formation mechanisms and source origins of PM2.5 in two megacities in Sichuan Basin, China. Atmos. Chem. Phys. 2018, 18, 865–881. [Google Scholar] [CrossRef] [Green Version]
- Feng, X.; Wei, S.; Wang, S. Temperature inversions in the atmospheric boundary layer and lower troposphere over the Sichuan Basin, China: Climatology and impacts on air pollution. Sci. Total Environ. 2020, 726, 138579. [Google Scholar] [CrossRef]
- Yu, G.; Jia, Y.; He, N.; Zhu, J.; Chen, Z.; Wang, Q.; Piao, S.; Liu, X.; He, H.; Guo, X. Stabilization of atmospheric nitrogen deposition in China over the past decade. Nat. Geosci. 2019, 12, 424–429. [Google Scholar] [CrossRef]
- Yan, F.P.; He, C.L.; Kang, S.C.; Chen, P.F.; Hu, Z.F.; Han, X.W.; Gautam, S.; Yan, C.Q.; Zheng, M.; Sillanpaa, M.; et al. Deposition of Organic and Black Carbon: Direct Measurements at Three Remote Stations in the Himalayas and Tibetan Plateau. J. Geophys. Res. Atmos. 2019, 124, 9702–9715. [Google Scholar] [CrossRef]
- Zhou, W.B.; Xiang, W.H.; You, Y.Y.; Ouyang, S.; Zhao, Z.H.; Zhang, S.L.; Zeng, Y.L.; Li, J.R.; Wang, J.R.; Wang, K.L. Atmospheric Wet Deposition of Organic Carbon and Dissolved Nitrogen in City, Countryside and Nature Reserve of Subtropical China. J. Am. Water Resour. Assoc. 2020, 56, 1045–1058. [Google Scholar] [CrossRef]
- Zhang, X.; Huang, Y.; Rao, R. Aerosol characteristics including fumigation effect under weak precipitation over the southeastern coast of China. J. Atmos. Sol.-Terr. Phys. 2012, 84–85, 25–36. [Google Scholar] [CrossRef]
- Yang, F.; He, K.; Ye, B.; Chen, X.; Cha, S.H.; Cadle, S.H.; Chan, T.; Mulawa, P.A. One-year record of organic and elemental carbon in fine particles in downtown Beijing and Shanghai. Atmos. Chem. Phys. 2005, 5, 1449–1457. [Google Scholar] [CrossRef] [Green Version]
- Witkowska, A.; Lewandowska, A.; Falkowska, L.M. Parallel measurements of organic and elemental carbon dry (PM1, PM2.5) and wet (rain, snow, mixed) deposition into the Baltic Sea. Mar. Pollut. Bull. 2016, 104, 303–312. [Google Scholar] [CrossRef] [PubMed]
- Zhang, Q.Y.; Wang, Q.F.; Zhu, J.X.; Xu, L.; Chen, Z.; Xiao, J.F.; He, N.P. Spatiotemporal variability, source apportionment, and acid-neutralizing capacity of atmospheric wet base-cation deposition in China. Environ. Pollut. 2020, 262, 114335. [Google Scholar] [CrossRef] [PubMed]
- Yu, X.; Pan, Y.P.; Song, W.; Li, S.; Li, D.; Zhu, M.; Zhou, H.S.; Zhang, Y.L.; Li, D.J.; Yu, J.Z.; et al. Wet and Dry Nitrogen Depositions in the Pearl River Delta, South China: Observations at Three Typical Sites With an Emphasis on Water-Soluble Organic Nitrogen. J. Geophys. Res. Atmos. 2020, 125, e2019JD030983. [Google Scholar] [CrossRef]
- Chen, Z.L.; Huang, T.; Huang, X.H.; Han, X.X.; Yang, H.; Cai, Z.C.; Yao, L.; Han, X.; Zhang, M.G.; Huang, C.C. Characteristics, sources and environmental implications of atmospheric wet nitrogen and sulfur deposition in Yangtze River Delta. Atmos. Environ. 2019, 219, 116904. [Google Scholar] [CrossRef]
- Zhao, H.B.; Zheng, C.G. Monte Carlo solution of wet removal of aerosols by precipitation. Atmos Environ. 2006, 40, 1510–1525. [Google Scholar] [CrossRef]
- Wu, Y.N.; Liu, J.K.; Zhai, J.X.; Cong, L.; Wang, Y.; Ma, W.M.; Zhang, Z.M.; Li, C.Y. Comparison of dry and wet deposition of particulate matter in near-surface waters during summer. PLoS ONE 2018, 13, e0199241. [Google Scholar] [CrossRef] [PubMed]
- Yuan, L.; Zhang, X.L.; Che, Y.Z.; Xia, X.A.; Liu, X.; Zhao, T.L.; Song, M.H. Vertical profile and radiative forcing of black carbon in a winter pollution period over Chengdu, China. Atmos. Res. 2022, 265, 105896. [Google Scholar] [CrossRef]


Disclaimer/Publisher’s Note: The statements, opinions and data contained in all publications are solely those of the individual author(s) and contributor(s) and not of MDPI and/or the editor(s). MDPI and/or the editor(s) disclaim responsibility for any injury to people or property resulting from any ideas, methods, instructions or products referred to in the content. |
© 2023 by the authors. Licensee MDPI, Basel, Switzerland. This article is an open access article distributed under the terms and conditions of the Creative Commons Attribution (CC BY) license (https://creativecommons.org/licenses/by/4.0/).
Share and Cite
Zhou, Y.; Zhang, X.; Wang, Y. High Wet Deposition of Black Carbon over the Sichuan Basin of China. Atmosphere 2023, 14, 598. https://doi.org/10.3390/atmos14030598
Zhou Y, Zhang X, Wang Y. High Wet Deposition of Black Carbon over the Sichuan Basin of China. Atmosphere. 2023; 14(3):598. https://doi.org/10.3390/atmos14030598
Chicago/Turabian StyleZhou, Yu, Xiaolin Zhang, and Yuanzhi Wang. 2023. "High Wet Deposition of Black Carbon over the Sichuan Basin of China" Atmosphere 14, no. 3: 598. https://doi.org/10.3390/atmos14030598