Article

The Relationship between Ambient Fine Particulate Matter (PM2.5) Pollution and Depression: An Analysis of Data from 185 Countries

by
Ravi Philip Rajkumar
Department of Psychiatry, Jawaharlal Institute of Postgraduate Medical Education and Research (JIPMER), Puducherry 605 006, India
Atmosphere 2023, 14(3), 597; https://doi.org/10.3390/atmos14030597
Submission received: 20 February 2023 / Revised: 13 March 2023 / Accepted: 19 March 2023 / Published: 21 March 2023

Abstract

:
Several studies have identified a relationship between air pollution and depression, particularly in relation to fine particulate matter (PM2.5) exposure. However, the strength of this association appears to be moderated by variables such as age, gender, genetic vulnerability, physical activity, and climatic conditions, and has not been assessed at a cross-national level to date. Moreover, certain studies in this field have yielded negative results, and there are discrepancies between the results obtained in high-income countries and those from low- and middle-income countries. The current study examines cross-sectional and longitudinal associations between the incidence of depression in each country, based on Global Burden of Disease Study data, and the average national level of PM2.5 based on the World Health Organization’s database, over the past decade (2010–2019). The observed associations were adjusted for age, gender, level of physical activity, income, education, population density, climate, and type of depression. It was observed that while PM2.5 levels showed significant cross-sectional associations with the incidence of depression, longitudinal analyses were not suggestive of a direct causal relationship. These findings are discussed in the light of recent contradictory results in this field, and the need to consider the intermediate roles of a number of individual and environmental factors.

1. Introduction

Depression is the commonest mental disorder worldwide. Based on data from the Global Burden of Disease Study (2019), it is estimated that over 279 million people suffer from depression, and depression is the 13th leading cause of disease burden and disability at a global level [1]. The pathophysiology of depression is complex, and involves an interaction between genetic risk, mediated by multiple genes of small effect, and a wide range of environmental factors [2,3]. Much of the research on gene–environment interactions in depression has been focused on the harmful effects of psychological or social stress [4,5]. However, there is a rapidly expanding evidence base suggesting that various aspects of an individual’s living environment, such as access to green areas and exposure to various forms of pollution, are also significantly associated with depression [6]. Among these environmental factors, air pollution has been associated with depression most frequently and consistently. Air pollution, particularly exposure to fine particulate matter (PM2.5) and nitrogen oxides (NOx), has been associated with depression in youth [7], adults in the general population [8,9], women in the post-partum period [10,11], and the elderly [12]. Exposure to these forms of air pollution has also been associated with worse outcomes in patients with depression, such as suicide [13] and acute episodes or exacerbations of depression requiring contact with emergency health services [14].
There are several pathophysiological processes that may account for the increased rates of depression observed after exposure to various air pollutants. Exposure to PM2.5 has been associated with increased expression of genes involved in the immune inflammatory response [15], which is known to be associated with disease onset and severity and treatment outcomes in depression [16,17]. In animal models, PM2.5 exposure led to activation of microglia, leading to central nervous system inflammation and neuronal toxicity, which was associated with depressive-like behaviors [18]. These effects were associated with elevated release of tumor necrosis factor-alpha (TNF-α), which is also elevated in patients suffering from depression [19]. Specific air pollutants may also interact with innate genetic vulnerability factors to increase susceptibility to depression. These gene x environment interactions appear to lead to increased systemic inflammation and oxidative stress, thereby altering the functioning of specific brain circuits involved in memory, problem solving, and the ability to cope with stress [20]. Thus, air pollution may act synergistically with chronic psychological or social stress in the genesis of depression [21]. Over and above these brain-specific mechanisms, particulate matter exposure is associated with an increased risk of several chronic medical conditions, including cardiovascular, cerebrovascular, and respiratory illnesses. These chronic illnesses are themselves associated with an increased risk of depression [22].
However, two recent meta-analyses of the existing literature have reached divergent conclusions. In the first analysis, published in 2020, depression was associated with short-term exposure to nitrogen dioxide (NO2), but not with other forms of air pollution [23]. In the second analysis, published in 2022, depression was significantly associated with short-term and long-term exposure to PM2.5 as well as with exposure to nitrogen dioxide, sulfur dioxide, ozone, and carbon monoxide [24]. Similarly, some studies of the relationship between air pollution and depression in specific countries have yielded negative results [25]. A part of this variation may be due to the specific type of pollutant(s) (PM2.5, PM10, nitrogen oxides, sulfur dioxide, or ozone) included in the analysis, but much of the variability in these results can be ascribed to host-related factors. These factors include age, gender, vitamin D status, level of physical activity, income, education, population density, and physical health, as well as innate genetic variations [10,11,12,15,20,26,27,28]. Climatic conditions can also influence the impact of air pollution [29]. Finally, cross-sectional or retrospective associations are insufficient to establish a clear causal relationship between exposure to air pollution and depression. It is therefore possible that a more accurate picture of the relationship between air pollution and depression could be obtained if
(a)
At least some of these interacting or confounding factors were taken into account;
(b)
Individual pollutants were examined individually;
(c)
A longitudinal study design was adopted;
(d)
Data from low- and middle-income countries, where air pollution is often above acceptable levels, were included.
The research presented in this paper represents an initial step in this process. In this study, data on the levels of a specific pollutant (fine particulate matter with a diameter less than 2.5 microns, PM2.5) are examined in relation to the incidence of depression across 185 countries and territories, while attempting to account for the confounding effect of the variables enumerated above, over the period 2010–2019. Based on the results of earlier researchers, the following hypotheses were formulated:
Hypothesis 1 (H1).
Fine particulate matter pollution (PM2.5) is positively correlated with the incidence of depression across multiple countries and territories.
Hypothesis 2 (H2).
The correlation between PM2.5 and depression will remain significant after adjusting for the effects of age, gender, physical activity, income, and geographical location.
Hypothesis 3 (H3).
Longitudinal methods of analysis will demonstrate the possibility of a causal relationship between PM2.5 exposure and depression.

2. Materials and Methods

The current study is an ecological association study, using both cross-sectional and longitudinal methods of analysis, based on the most recently available data for 185 countries and regions. For the purpose of this study, atmospheric levels of fine particulate matter of diameter less than 2.5 microns (henceforth designated PM2.5) were selected as the exposure of interest, and the estimated incidence of depression for each country was taken as the dependent variable. PM2.5 was selected as the exposure for the following reasons:
  • Across research studies, PM2.5 has been one of the pollutants most consistently associated with the risk of depression [7,9,11,12,25].
  • There are biologically plausible mechanisms, identified through translational and clinical research, linking PM2.5 exposure with depression [15,18,20].
  • Reliable and recent cross-national data on levels of PM2.5 are available from a reliable source for the years 2010 and 2018 [30].

2.1. Data Sources

Information on the estimated levels of PM2.5 for each country was obtained from the World Health Organization’s Global Health Observatory (GHO). The GHO provides estimates of this parameter for a total of 185 countries and regions, and these values are available for the years 2010 and 2018. Data on average annual PM2.5 levels for each country for both of these years were used as the chief dependent variable in this study [30].
Depression is a chronic condition with an episodic course; therefore, examining associations between PM2.5 and the prevalence of this disorder could yield inaccurate results due to the confounding effects of the natural history of depression. Moreover, there is evidence that short-term PM2.5 exposure can trigger the onset of new episodes of depression [14]. Therefore, data on the incidence of depression (defined as the number of new cases of depression per unit population, expressed as a percentage) were retrieved through specific queries from the Global Burden of Disease Study database for the years 2010 and 2019 [31]. This database provides the most recent, nation-wide estimates of the incidence, prevalence, and disease burden associated with specific illnesses, based on the most recent epidemiological research [1,32]. Given the exploratory nature of the current study, data on the incidence of depression were retrieved (i) for the general population as a whole, and (ii) for men and women separately. The confounding effects of age were adjusted for by obtaining age-standardized estimates of the incidence of depression from the database. These estimates are adjusted for the age distribution of a “standard” population, and thereby control for variations in age distribution across countries.
Apart from age and gender, which were adjusted for in the manner described above, several other factors may influence the association between PM2.5 exposure and depression. These confounding variables, the rationale for their inclusion, and the data source for each of these variables are summarized in Table 1 below.

2.2. Data Analysis

All study variables were tested for normality prior to analysis using the Shapiro–Wilk test. The estimated incidence of depression conformed to an approximately Gaussian distribution. The other study variables deviated significantly from this distribution (p < 0.01, Shapiro–Wilk test) and were subjected to a natural logarithmic transformation prior to data analysis.
In the first phase of the data analysis, unadjusted bivariate correlations (Pearson’s r) were computed for the associations between the concentration of PM2.5 and the incidence of depressive disorder for both the years (2010 and 2019) for which data were available. To rule out the possibility of a Type I error involving H1, Bonferroni’s correction was applied to the correlation matrix, and both corrected and uncorrected p-values were mentioned in the relevant section of the Results. The magnitude of observed correlations was classified as poor (0.1 < r < 0.3), fair (0.3 ≤ r < 0.6), moderate (0.6 ≤ r < 0.8), or strong (r ≥ 0.8) based on standard guideline values for biomedical research [39]. These analyses were then repeated with adjustments for the confounding variables listed in Table 1, using Pearson’s partial r.
Next, the possibility of a threshold effect was also examined. According to the World Health Organization guidelines, a 24 h mean exposure level of 15 µg/m3 is considered “safe” for fine particulate matter (PM2.5) [40]. To examine this possibility, countries were classified as “safe” or “unsafe” based on an estimated PM2.5 of ≤15 µg/m3 and >15 µg/m3, respectively, and the incidence of depression was compared across these two groups using the independent samples t-test. As a confirmatory analysis, correlations between PM2.5 and the incidence of depression were computed separately for each group.
Finally, the possibility of a causal relationship between average PM2.5 levels and the incidence of depression was assessed using two longitudinal models: cross-lagged regression analysis and repeated measures analysis of covariance (RM-ANCOVA). In the first model, cross-correlations between PM2.5 levels and the incidence of depression for the years 2010 and 2019 were computed: a causal relationship could be inferred only if the correlation between PM2.5 (in 2010) and depression (in 2019) was significantly stronger than the correlation between depression (in 2010) and PM2.5 (in 2019) [41]. The second model involved two steps: first, a general linear model (repeated measures analysis of variance, RM-ANOVA) was carried out to see if the incidence of depression was significantly different across both time points. If this was the case, then PM2.5 levels were introduced as a covariate to test for an interaction effect.
All statistical tests were two-tailed, and a significance level of p < 0.05 was used for all bivariate analyses.

3. Results

Data were available for a total of 185 countries and regions. The mean estimated incidence of depression was 0.75 ± 0.22% in 2010, and 0.74 ± 0.21% in 2019. When incidence was examined by gender, estimates were 0.58 ± 0.19% (2010) and 0.57 ± 0.18% (2019) for men, and 0.92 ± 0.28% (2010) and 0.91 ± 0.26% (2019) for women.
The median (inter-quartile range) estimated concentration of PM2.5 for all the countries included in this study was 20.25 (17.73) µg/m3 in 2010, and 22.01 (24.63) µg/m3 in 2019.
Longitudinal comparisons of these variables revealed that the incidence of depression decreased in the period 2010–2019 (paired-samples t = −2.58, p = 0.011), but the magnitude of this decrease was small (Cohen’s d = 0.19). In contrast, average PM2.5 levels increased modestly during this period (Wilcoxon’s signed-rank test statistic = 5404.5, p < 0.001, effect size = 0.37).

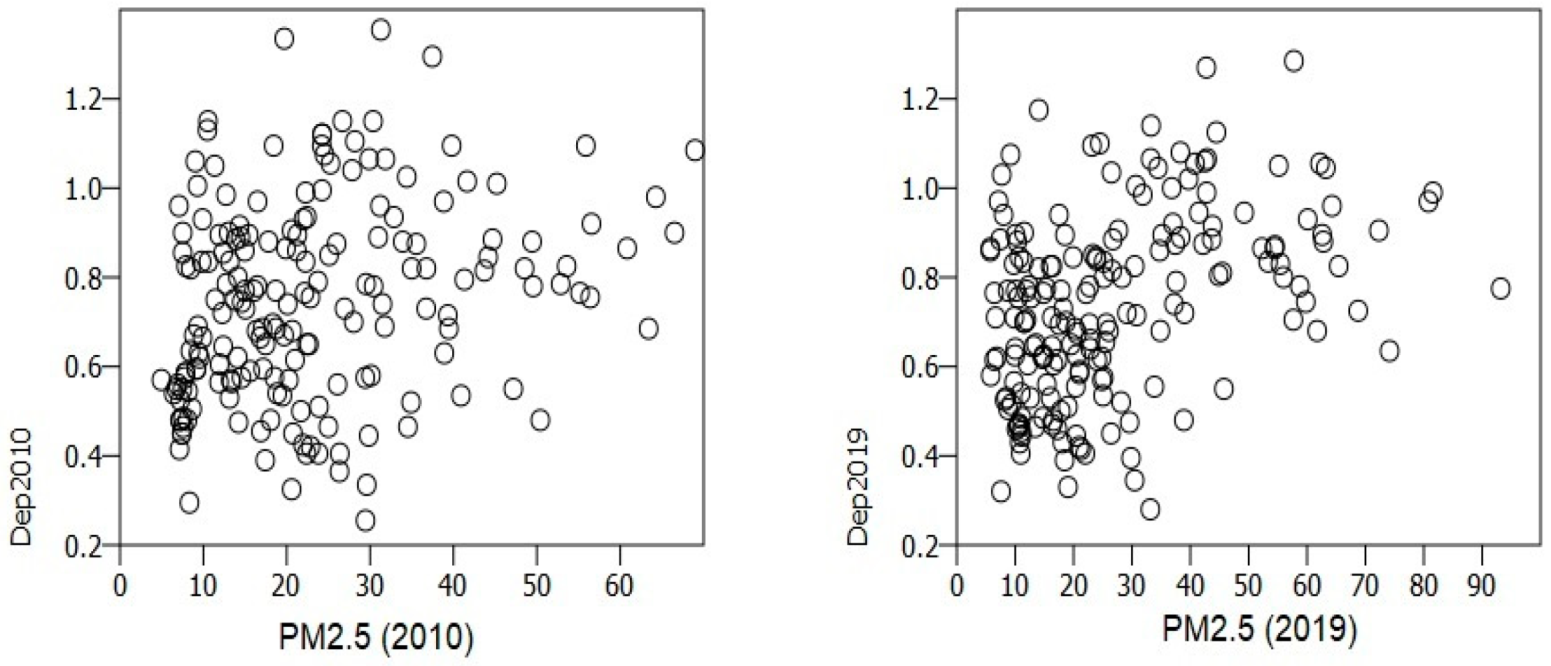
3.1. Bivariate Correlations between PM2.5 and the Incidence of Depression

The results of unadjusted and adjusted bivariate correlations between PM2.5 and the incidence of depression for the years 2010 and 2019 are presented in Table 2. In the unadjusted analyses (Table 2, Row 1), it can be observed that average PM2.5 levels were positively correlated with the occurrence of new episodes of depression, independent of gender. These associations remained significant after Bonferroni’s correction, but were poor to fair in strength. A visual inspection of the scatter plots suggests that the relationship between these variables was not entirely linear, with a slight reduction in the incidence of depression observed at higher PM2.5 levels. At lower levels of atmospheric PM2.5, there appears to be a linear or monotonic relationship; however, at levels of PM2.5 above 25–30 µg/m3 or so, this association was not observed (Figure 1).
In the adjusted analyses (Table 2, Row 1), PM2.5 levels remained significantly and positively correlated with the incidence of depression after adjusting for national income, population density, education, physical activity, and distance from the equator. The magnitude of these correlations was only slightly altered by these adjustments. However, when Bonferroni’s correction was applied, these findings remained significant for the year 2019, but not for 2010. Therefore, these results provide partial support for H1 at lower levels of PM2.5, but only inconsistent support for H2. Correlations between these confounding variables themselves and the incidence of depression are provided in Supplementary Table S1. In these supplementary analyses, only the level of adult education was significantly and negatively correlated with the incidence of depression.
All values are given as Pearson’s r (p-value). Results highlighted in bold indicate statistically significant findings after applying Bonferroni’s correction for a 5 × 5 table.

3.2. Evaluation of a Possible Threshold Effect

To examine whether the World Health Organization’s guideline cut-off for PM2.5 exposure (15 µg/m3) was significantly associated with depression, countries were classified as being above or below this threshold for each year of interest. In the year 2010, 120 countries were above the safety threshold; in 2019, 127 countries were above this threshold. Following this, the bivariate analyses reported in Table 2 were repeated for each sub-group for both years, and these results are presented in Table 3. It can be noted that in the year 2010, the association between PM2.5 and the incidence of depression was stronger in those countries below the guideline value for safety, though it was significant in both groups. On the other hand, in the year 2019, the association between PM2.5 and depression was stronger in countries above the guideline value, and was not significant in the remaining countries. In this context, it should be noted that in countries above the threshold, PM2.5 levels increased significantly over the study period, from a mean of 28.5 to 34.7 µg/m3 (t = 6.30, p < 0.001), while in countries below the threshold, PM2.5 levels decreased modestly but significantly in the same period, from a mean of 11.6 to 10.4 µg/m3 (t = −3.47, p = 0.001).
To extend these results from a longitudinal perspective, countries were classified according to whether or not their average annual PM2.5 levels had increased beyond the guideline values in the period 2010–2019. This phenomenon was observed in twenty countries; however, these countries did not differ significantly from the others in terms of the incidence of depression (independent-sample t = 0.26, p = 0.797). Moreover, the correlation between PM2.5 levels and depression in this subset of countries was not statistically significant (r = 0.21, p = 0.379). These inconsistent results suggest that there is no clear threshold effect for a link between PM2.5 and depression.

3.3. Longitudinal Associations between PM2.5 and the Incidence of Depression

3.3.1. Cross-Lagged Regression

The results of the cross-lagged regression analysis, both unadjusted and adjusted, are presented in Table 4. In these analyses, it can be observed that none of the cross-lagged regression coefficients were statistically significant. These results suggest that H3 should be rejected: in other words, there is no significant evidence for a causal relationship between PM2.5 levels and depression in the study period.

3.3.2. General Linear Model

As a second test of the possibility of a causal relationship between PM2.5 and depression, repeated measures analyses of covariance were carried out for the incidence of depression while taking the baseline (2010) PM2.5 level as a covariate. The results of these analyses are presented in Table 5. In these analyses, it can be observed that there was a slight but statistically significant decrease in the incidence of depression irrespective of gender. However, there was no significant interaction effect when PM2.5 levels were introduced as a covariate. These results also suggest that H3 should be rejected.

3.4. Additional Analyses

In light of the negative results obtained in Section 3.3, the bivariate correlation between the percentage of change in PM2.5 levels and the percentage of change in the incidence of depression between 2010 and 2019 was computed. This association was found to be statistically insignificant (r = 0.10, p = 0.197), and remained insignificant when adjusting for possible confounding variables (partial r = 0.03, p = 0.718).

4. Discussion

The results of the current study suggest that the association between atmospheric PM2.5 levels and the incidence of depression is significant cross-sectionally, but not longitudinally. In this study, the use of age-standardized incidence estimates and the inclusion of separate analyses for men and women were used to correct for the possible were of age and gender, and data from two time points ten years apart (2010 and 2019) was used to examine longitudinal associations and possible causality. The cross-sectional association between PM2.5 and depression remained significant in both genders, but retained its significance only partially after adjustment for the confounding variables identified by earlier researchers. In other words, this study was able to confirm H1, but was unable to provide full support for H2. In contrast, all the three methods used to assess longitudinal relationships and possible causality did not yield significant results; as a result, the study’s findings do not provide any consistent support for H3.
Examination of the data for a possible threshold effect did not yield consistent findings. Associations between PM2.5 levels and depression appeared to be stronger in countries with levels above the WHO safety threshold in 2010, but the reverse was observed in 2019. These results are difficult to interpret in terms of linear causation. The figures in the first row of Table 3 are consistent with earlier studies suggesting an effect of prolonged PM2.5 exposure on depression, with correlation coefficients increasing in strength over time; however, this explanation does not account for the figures in the second row, in which the correlation coefficients actually decreased in magnitude and significance at the second time point. It is of course possible that this could reflect a decrease in PM2.5 levels in the latter group of countries, many of which belong to the high-income category and may have implemented more efficient pollution control measures. This possibility is supported by the fact that mean levels of PM2.5 increased in the first group of countries over the study period, but decreased in the second group. Though this finding requires replication, it is potentially valuable, as it suggests that efforts to reduce atmospheric PM2.5 pollution may reduce the likelihood of depression over time.
These results suggest that the association between atmospheric PM2.5 levels and the incidence of depression, though statistically significant, is not of a direct causal nature. These results appear to be at variance with the large number of studies that suggest that such a causal relationship exists [7,8,9,10,11,12,13,14]. However, a closer look at the evidence suggests that the link between air pollution and depression is complex and influenced by several confounding factors. Meta-analyses of the available literature have yielded conflicting results. For example, a meta-analysis of all available studies up to the year 2019 failed to find a significant association between either short- or long-term exposure to PM2.5 and depression [23]. A subsequent meta-analysis published in 2022 estimated that the odds ratio for the relationship between PM2.5 and depression was 1.009 for short-term exposure and 1.074 for long-term exposure, suggesting modest effects [24]. Both these reviews highlighted the risk of publication bias in the existing literature, suggesting that negative results might not have received appropriate exposure.
More recent studies have underlined the complex and inconsistent nature of this relationship. For example, a study of the links between short-term PM2.5 exposure and depression suggested that this risk may be significantly elevated in specific populations, such as women and the elderly [42]. The results of a cohort study of elderly American adults reported a significant relationship between long-term PM2.5 exposure and depression, underling the possible age-specific nature of this relationship [43]. A retrospective analysis of data on over 100,000 adults from the United Kingdom suggested that PM2.5 exposure was modestly associated with a nonspecific increase in the risk of mental disorders, and not specifically depression; it was also observed that this risk was likely to be mediated by genetic factors [44]. A French study with a similar sample size found that the association between various air pollutants (including PM2.5) and depressive symptoms was strongest in adults with a personal history of social and economic disadvantage, characterized by a lower income, lower educational attainment, and living in deprived regions [45]. A study of 15,000 middle-aged and elderly Chinese adults found that the association between ambient PM2.5 and depression was not significant when taking into account the effects of alcohol consumption [46]. These findings suggest that a multitude of genetic and environmental factors can influence the relationship between PM2.5 and depression.
Two recent studies from China highlighted the key role played by psychological factors in the relationship between PM2.5 exposure and depression. In the first, subjective satisfaction with air quality was significantly associated with depressive symptoms in young and middle-aged adults, and this relationship was further influenced by individuals’ perception of their own health [47]. In the second, individual methods of coping with stress and trauma were found to influence the link between high levels of air pollution and depression [48]. The above results suggest that individual perceptions of, and reactions to, air quality may be as important as objective measures of air pollution in determining psychological outcomes such as depression. These findings are consistent with the cognitive theory of depression, in which negative cognitions related to the self and the external world or environment can lead to a depressed mood and associated behavioral changes [49].
It is also important to note that external air pollution is not the only likely source of pollution at play, especially in low- and middle- income countries. Several studies from these countries have highlighted the role of indoor air pollution, derived from cooking fuels, in triggering or worsening depression [50,51,52]. Likewise, in countries with few legal restrictions on tobacco use in public places, second-hand exposure to cigarette smoke may also be associated with depressive symptoms [53,54]. As data on the exact magnitude of these variables are difficult to collect at a cross-national level, it was not possible to incorporate them into the analysis. However, it remains plausible that the overall level of exposure to air pollution, both indoor and outdoor, may correlate more strongly with depression than measures of outdoor air pollution alone; this is supported by a recent report suggesting that controlling for indoor pollution weakens the apparent association between outdoor air pollutants and depression [55].
Another factor that could have contributed to the lack of a direct longitudinal association in this study is the difficulty in accounting for measures to reduce atmospheric pollution and their efficacy, as suggested above. While short-term exposure to PM2.5 could trigger episodes of depression, long-term effects due to prolonged exposure could be attenuated by effective pollution control strategies. The current study was not designed to address this specific hypothesis, but the comparisons of mean PM2.5 changes for the groups of countries in Table 3 are consistent with it.
The negative results in the current study could also be due to specific methodological issues which have been emphasized by recent research in this field. For example, levels of PM2.5 may vary significantly across a country, resulting in significant associations in some regions but not in others [56]. Second, the definition of the depressive phenotype has varied significantly across studies. Some researchers have measured depressive symptoms [10,45,46] which may or may not be clinically significant and which can be transiently experienced by many individuals, while others have used a more stringent definition based on syndromic criteria for depression [12,13,14,44]. As the data used in this study were based on the latter definition, this could account for some of the discrepancies in the reported associations. Third, phenomena such as air pollution do not exist in isolation. For example, in urban settings, air pollution may be accompanied by reduced green space availability, excessive exposure to artificial light, and noise pollution, which may independently contribute to the risk of depression [57,58]. Fourth, other climatic variables, such as ambient temperature and sunlight exposure, may influence the links between particulate matter exposure and depression [59,60,61]. Finally, apart from the psychological and social factors listed above, individual lifestyle variables such as diet and exercise can either enhance or attenuate the links between exposure to pollutants and depression [46,62].
It is also worth noting that most existing research on air pollution and depression is based on data from industrialized, high-income countries, with few studies from low- and middle-countries [9]. In the current dataset, there was a significant negative correlation between national income and PM2.5 levels which appeared to increase over time (r = −0.24, p < 0.001 in 2010; r = −0.47, p < 0.001 in 2019). This is consistent with existing data which suggest that the effects of air pollution may be more severe in lower-income countries, particularly where measures to reduce pollution are often absent or ineffective [63,64]. In contrast, in countries with low levels of outdoor air pollution and effective legislation to minimize this phenomenon, the associations between PM2.5 and depression may be weak or absent [25,65].
Overall, these results of the current study are consistent with the hypothesis advanced by Hu et al., which states that the relationship between air pollution and mental health outcomes, such as depression, is heterogeneous and influenced by a wide range of confounding factors [26]. This is illustrated in Figure 2, which highlights the large number of intermediate variables that can influence the relationship between a specific type of pollutant, such as PM2.5, and depression. It is worth noting that many of these factors can interact with each other. For example, an objective deterioration in air quality can lead to a subjective dissatisfaction with the environment, or ideas of helplessness concerning an individual’s capacity to change this situation, and this could lead to depression. Likewise, both air pollution and economic disadvantage could lead to a reduction in social capital, such as reduced contact between neighbors, and this could increase vulnerability to depression. Such interactions could be modeled in studies of individual subjects in the community, allowing for a better delineation of the relative contributions of each risk or protective factor to depression.
There are certain limitations of the current study which must be borne in mind when interpreting its results. First, they are based on country-level estimates, and cannot be directly extrapolated to individuals [66]. Second, there is a certain degree of uncertainty regarding the reliability of the estimates for the incidence of depression, particularly in lower-income countries [67]. Third, certain other confounding factors may also influence the link between PM2.5 and depression, as illustrated in Figure 2, but these could not be adjusted for in the current study due to a lack of cross-national data. Fourth, the association between PM2.5 and depression may not be specific; instead, prolonged PM2.5 exposure may be a non-specific risk factor for a number of mental illnesses, including anxiety disorders, bipolar disorder, and psychosis [68]. Fifth, only annual averages of PM2.5 levels for each country were available. Though such data have been used in earlier studies [69], their use is limited by the fact that more fine-grained analyses of weekly or monthly changes could not be carried out [70]. Additionally, as longitudinal data were available only for the period 2010–2019, it was not possible to examine the possible causal role of exposure to PM2.5 over a longer period of time. Sixth, this study examined PM2.5 levels because data were available on this variable; it was not possible to examine the effect of other relevant pollutants, such as nitrogen oxides and sulfur dioxide [23,24]. Seventh, due to a lack of relevant data, it was not possible to examine the effects of pollution control measures in each country over the study period. Finally, it was not possible to analyze the effects of relevant genetic variants on vulnerability to depression following PM2.5 exposure, as relevant data on allele frequencies are available only for a small number of countries.

5. Conclusions

Despite certain limitations and divergences from the existing evidence, the results presented in this paper are of importance, not just for healthcare professionals, but for all those involved in mitigating the health and environmental impacts of outdoor air pollution. The key results obtained from the current data suggest that
  • There is a cross-sectional, positive correlation between PM2.5 levels and the incidence of depression, but this relationship is of a linear or monotonic nature only to a limited extent, and was weakened after correcting for possible confounders;
  • The strength of the association between PM2.5 and depression increased over time in countries with a PM2.5 level above the WHO-recommended threshold of 15 µg/m3; these countries also experienced a significant increase in PM2.5 levels over the study period;
  • On the other hand, in countries with a PM2.5 level below this threshold, the relationship between PM2.5 and depression weakened over time; these countries showed a slight but significant reduction in PM2.5 over the study period;
  • Linear methods of analysis did not reveal a clear-cut longitudinal relationship between PM2.5 levels; however, these results should be interpreted in light of the preceding three findings.
The discrepancies between the cross-sectional and longitudinal results in this study suggest the need for a more critical and in-depth analysis of the links between PM2.5 exposure and depression, as has been pointed out by other researchers in this field [26,71,72]. The study findings also suggest that reductions in PM2.5 levels over time may reduce the strength of the association between PM2.5 exposure and depression in some cases. Given the personal, social, and economic burden associated with depression, particularly in low- and middle-income countries where patients with this disorder are often undiagnosed and untreated, prompt measures to prevent or at least mitigate the possible effects of PM2.5 on this disorder are required. Such measures would require effective changes in policy and a commitment to change by individuals, industries, and other non-state actors. In addition, measures should be taken to enhance resilience to the possible “depressogenic” effects of PM2.5 exposure: these could include individual-level strategies to enhance coping skills and stress management, attempts to improve educational achievement and to reduce economic deprivation and inequality within communities, and measures to reduce exposure to other inhaled toxins, such as second-hand smoke or indoor pollutants from cooking fuels.

Supplementary Materials

The following supporting information can be downloaded at: https://www.mdpi.com/article/10.3390/atmos14030597/s1, Table S1: Bivariate correlations between the incidence of depression and potential confounding factors.

Funding

This research received no external funding.

Institutional Review Board Statement

Not applicable.

Informed Consent Statement

Not applicable.

Data Availability Statement

All data used for the purpose of this study are in the public domain and have been referenced in the paper. A complete data sheet is available from the author on request.

Conflicts of Interest

The author declares no conflict of interest.

References

  1. GBD 2019 Mental Disorders Collaborators. Global, regional, and national burden of 12 mental disorders in 204 countries and territories, 1990–2019: A systematic analysis for the Global Burden of Disease Study 2019. Lancet Psychiatry 2022, 9, 137–150. [Google Scholar] [CrossRef] [PubMed]
  2. Howard, D.M.; Adams, M.J.; Clarke, T.; Hafferty, J.D.; Gibson, J.; Shirali, M.; Coleman, J.R.I.; Hagenaars, S.P.; Ward, J.; Wigmore, E.M.; et al. Genome-wide meta-analysis of depression identifies 102 independent variants and highlights the importance of the prefrontal brain regions. Nat. Neurosci. 2019, 22, 343–352. [Google Scholar] [CrossRef] [PubMed] [Green Version]
  3. Taylor, A.E.; Munafo, M.R. Triangulating meta-analyses: The example of the serotonin transporter gene, stressful life events and major depression. BMC Psychol. 2016, 4, 23. [Google Scholar] [CrossRef] [PubMed] [Green Version]
  4. Cristobal-Narvaez, P.; Haro, J.M.; Koyanagi, A. Perceived stress and depression in 45 low- and middle-income countries. J. Affect. Disord. 2020, 274, 799–805. [Google Scholar] [CrossRef]
  5. Bakusic, J.; Schaufeli, W.; Claes, S.; Godderis, L. Stress, burnout and depression: A systematic review on DNA methylation mechanisms. J. Psychosom. Res. 2017, 92, 34–44. [Google Scholar] [CrossRef]
  6. Rautio, N.; Filatova, S.; Lehtiniemi, H.; Miettunen, J. Living environment and its relationship to depressive mood: A systematic review. Int. J. Soc. Psychiatry 2018, 64, 92–103. [Google Scholar] [CrossRef] [Green Version]
  7. Latham, R.M.; Kieling, C.; Arseneault, L.; Rocha, T.B.; Beddows, A.; Beevers, S.D.; Danese, A.; De Oliveira, K.; Kohrt, B.A.; Moffitt, T.E.; et al. Childhood exposure to ambient air pollution and predicting individual risk of depression onset in UK adolescents. J. Psychiatr. Res. 2021, 138, 60–67. [Google Scholar] [CrossRef]
  8. Gladka, A.; Zatonski, T.; Rymaszewska, J. Association between the long-term exposure to air pollution and depression. Adv. Clin. Exp. Med. 2022, 31, 1139–1152. [Google Scholar] [CrossRef]
  9. Khosrorad, R.; Aval, H.E.; Najafi, M.L.; Rezai, H.; Dovlatabadi, A.; Estiri, E.H.; Hesari, M.H.; Behmanesh, M.; Miri, M. The association of exposure to air pollution and depression in women: A cross-sectional study of a middle-income country. Environ. Res. 2022, 215, 114266. [Google Scholar] [CrossRef]
  10. Duan, C.; Li, C.; Xu, J.; He, Y.; Xu, H.; Zhang, D.; Yang, J.; Yu, J.; Zeng, W.; Wang, Y.; et al. Association between prenatal exposure to ambient air pollutants and postpartum depressive symptoms: A multi-city cohort study. Environ. Res. 2022, 209, 112786. [Google Scholar] [CrossRef]
  11. Bastain, T.M.; Chavez, T.; Habre, R.; Hernandez-Castro, I.; Grubbs, B.; Toledo-Corral, C.M.; Farzan, S.F.; Lurvey, N.; Lerner, D.; Eckel, S.P.; et al. Prenatal ambient air pollution and maternal depression at 12 months postpartum in the MADRES pregnancy cohort. Environ. Health 2021, 20, 121. [Google Scholar] [CrossRef]
  12. Wu, M.; Xie, J.; Zhou, Z.; Wang, L.; Hu, Y.; Sun, Y.; Wang, Y.; Tian, Y. Fine particulate matter, vitamin D, physical activity, and major depressive disorder in elderly adults: Results from UK Biobank. J. Affect. Disord. 2022, 299, 233–238. [Google Scholar] [CrossRef]
  13. Hwang, I.Y.; Choi, D.; Kim, J.A.; Choi, S.; Chang, J.; Goo, A.J.; Ko, A.; Lee, G.; Kim, K.H.; Son, J.S.; et al. Association of short-term particulate matter exposure with suicide death among major depressive disorder patients: A time-stratified case-crossover analysis. Sci. Rep. 2022, 12, 8471. [Google Scholar] [CrossRef]
  14. Newbury, J.B.; Stewart, R.; Fisher, H.L.; Beevers, S.; Dajnak, D.; Broadbent, M.; Pritchard, M.; Shiode, N.; Heslin, M.; Hammoud, R.; et al. Association between air pollution exposure and mental health service use among individuals with first presentations of psychotic and mood disorders: Retrospective cohort study. Br. J. Psychiatry 2021, 219, 678–685. [Google Scholar] [CrossRef]
  15. Vlaanderen, J.; Vermeulen, R.; Whitaker, M.; Chadeau-Hyam, M.; Hottenga, J.; de Geus, E.; Willemsen, G.; Penninx, B.W.J.H.; Jansen, R.; Boomsma, D.I. Impact of long-term exposure to PM2.5 on peripheral blood gene expression pathways involved in cell signaling and immune response. Environ. Int. 2022, 168, 107491. [Google Scholar] [CrossRef]
  16. Mac Giollabhui, N.; Ng, T.H.; Ellman, L.M.; Alloy, L.B. The longitudinal associations of inflammatory biomarkers and depression revisited: Systematic review, meta-analysis, and meta-regression. Mol. Psychiatry 2021, 26, 3302–3314. [Google Scholar] [CrossRef]
  17. Gasparini, A.; Callegari, C.; Lucca, G.; Bellini, A.; Caselli, I.; Ielmini, M. Inflammatory biomarker and response to antidepressant in major depressive disorder: A systematic review and meta-analysis. Psychopharmacol. Bull. 2022, 52, 36–52. [Google Scholar]
  18. Ji, X.; Liu, R.; Guo, J.; Li, Y.; Cheng, W.; Pang, Y.; Zheng, Y.; Zhang, R.; Tang, J. Olfactory bulb microglia activation mediated neuronal death in real-ambient particulate matter exposure mice with depression-like behaviors. Sci. Total Environ. 2022, 821, 153456. [Google Scholar] [CrossRef]
  19. Osimo, E.F.; Pillinger, T.; Rodriguez, I.M.; Khandaker, G.M.; Pariante, C.M.; Howes, O.D. Inflammatory markers in depression: A meta-analysis of mean differences and variability in 5166 patients and 5083 controls. Brain Behav. Immun. 2020, 87, 901–909. [Google Scholar] [CrossRef]
  20. Li, Z.; Yan, H.; Zhang, X.; Shah, S.; Yang, G.; Chen, Q.; Han, S.; Zhang, D.; Weinberger, D.R.; Yue, W.; et al. Air pollution interacts with genetic risk to influence cortical networks implicated in depression. Proc. Natl. Acad. Sci. USA 2021, 118, e2109310118. [Google Scholar] [CrossRef]
  21. Fu, Z.; Liu, Q.; Liang, J.; Weng, Z.; Li, W.; Xu, J.; Zhang, X.; Xu, C.; Huang, T.; Gu, A. Air pollution, genetic factors and the risk of depression. Sci. Total Environ. 2022, 850, 158001. [Google Scholar] [CrossRef] [PubMed]
  22. Chen, J.; Hoek, G. Long-term exposure to PM and all-cause and cause-specific mortality: A systematic review and meta-analysis. Environ. Int. 2020, 143, 105974. [Google Scholar] [CrossRef] [PubMed]
  23. Fan, S.; Heinrich, J.; Bloom, M.S.; Zhao, T.; Shi, T.; Feng, W.; Sun, Y.; Shen, J.; Yang, Z.; Yang, B.; et al. Ambient air pollution and depression: A systematic review with meta-analysis up to 2019. Sci. Total Environ. 2020, 701, 134721. [Google Scholar] [CrossRef] [PubMed]
  24. Borroni, E.; Pesatori, A.C.; Bollati, V.; Buoli, M.; Carugno, M. Air pollution exposure and depression: A comprehensive updated systematic review and meta-analysis. Environ. Pollut. 2022, 292, 118245. [Google Scholar] [CrossRef]
  25. Petrowski, K.; Buhrer, S.; Strauβ, B.; Decker, O.; Brahler, E. Examining air pollution (PM10), mental health and well-being in a representative German sample. Sci. Rep. 2021, 11, 18436. [Google Scholar] [CrossRef]
  26. Hu, Q.; Feng, Y.; Xu, M. Are there heterogeneous impacts of air pollution on mental health? Front. Public Health 2022, 9, 780022. [Google Scholar] [CrossRef]
  27. Kim, H.-J.; Kim, H.-S.; Kim, S.; Hwang, J.; Lee, H.; Park, B.; Kim, B. Effects of vitamin D on associations between air pollution and mental health outcomes in Korean adults: Results from the Korea National Health and Nutrition Examination Survey (KNHANES). J. Affect. Disord. 2023, 320, 390–396. [Google Scholar] [CrossRef]
  28. Hautekiet, P.; Saenen, N.D.; Demarest, S.; Keune, H.; Pelgrims, I.; Van der Heyden, J.; De Clercq, E.M.; Nawrot, T.S. Air pollution in association with mental and self-rated health and the mediating effect of physical activity. Environ. Health 2022, 21, 29. [Google Scholar] [CrossRef]
  29. Bergmann, S.; Li, B.; Pilot, E.; Chen, R.; Wang, B.; Yang, J. Effect modification of the short-term effects of air pollution on morbidity by season: A systematic review and meta-analysis. Sci. Total Environ. 2020, 716, 136985. [Google Scholar] [CrossRef]
  30. SDG Indicator 11.6.2 Concentrations of Fine Particulate Matter (PM2.5). Available online: https://www.who.int/data/gho/data/indicators/indicator-details/GHO/concentrations-of-fine-particulate-matter-(pm2-5) (accessed on 25 November 2022).
  31. Global Burden of Disease Study 2019 (GBD 2019) Data Resources. Available online: https://ghdx.healthdata.org/gbd-2019 (accessed on 26 November 2022).
  32. Charlson, F.J.; Ferrari, A.J.; Flaxman, A.D.; Whiteford, H.A. The epidemiological modelling of dysthymia: Application for the Global Burden of Disease Study 2010. J. Affect. Disord. 2013, 151, 111–120. [Google Scholar] [CrossRef]
  33. GNI per Capita, PPP (Current International $)|The World Bank. Available online: https://data.worldbank.org/indicator/NY.GNP.PCAP.PP.CD (accessed on 25 November 2022).
  34. Average Years of Schooling, 2017|Our World in Data. Available online: https://ourworldindata.org/grapher/mean-years-of-schooling-long-run?tab=table&time=2017..latest (accessed on 26 November 2022).
  35. Prevalence of Insufficient Physical Activity among Adults Aged 18+ Years (Age-Standardized Estimate) (%). Available online: https://www.who.int/data/gho/data/indicators/indicator-details/GHO/prevalence-of-insufficient-physical-activity-among-adults-aged-18-years-(age-standardized-estimate)-(-) (accessed on 26 November 2022).
  36. Countries by Population Density|Countries by Density 2022. Available online: https://worldpopulationreview.com/country-rankings/countries-by-density (accessed on 26 November 2022).
  37. Hagenau, T.; Vest, R.; Gissel, T.N.; Poulsen, C.S.; Erlandsen, M.; Mosekilde, L.; Vestergaard, P. Global vitamin D levels in relation to age, gender, skin pigmentation and latitude: An ecologic meta-regression analysis. Osteoporos. Int. 2009, 20, 133–140. [Google Scholar] [CrossRef]
  38. Google Earth. Available online: https://www.google.com/earth/index.html (accessed on 28 November 2022).
  39. Akoglu, H. User’s guide to correlation coefficients. Turk. J. Emerg. Med. 2018, 18, 91–93. [Google Scholar] [CrossRef]
  40. Ambient (Outdoor) Air Pollution|World Health Organization. Available online: https://www.who.int/news-room/fact-sheets/detail/ambient-(outdoor)-air-quality-and-health (accessed on 28 November 2022).
  41. Petscher, Y.; Quinn, J.M.; Wagner, R.K. Modeling the co-development of correlated processes with longitudinal and cross-construct effects. Dev. Psychol. 2016, 52, 1690–1704. [Google Scholar] [CrossRef]
  42. Gao, X.; Jiang, W.; Liao, J.; Li, J.; Yang, L. Attributable risk and economic cost of hospital admissions for depression due to short-exposure to ambient air pollution: A multi-city time-stratified case-crossover study. J. Affect. Disord. 2022, 304, 150–158. [Google Scholar] [CrossRef]
  43. Qiu, X.; Shi, L.; Kubzansky, L.D.; Wei, Y.; Castro, E.; Li, H.; Weisskopf, M.G.; Schwartz, J.D. Association of long-term exposure to air pollution with late-life depression in older adults in the U.S. JAMA Netw. Open 2023, 6, e2253668. [Google Scholar] [CrossRef]
  44. Gao, X.; Jiang, M.; Huang, N.; Guo, X.; Huang, T. Long-term air pollution, genetic susceptibility, and the risk of depression and anxiety: A prospective study in the UK Biobank cohort. Environ. Health Perspect. 2023, 131, 17002. [Google Scholar] [CrossRef]
  45. Sakhvidi, M.J.Z.; Lafontaine, A.; Lequy, E.; Berr, C.; de Hoogh, K.; Vienneau, D.; Goldberg, M.; Zins, M.; Lemogne, C.; Jacquemin, B. Ambient air pollution exposure and depressive symptoms: Findings from the French CONSTANCES cohort. Environ. Int. 2022, 170, 107622. [Google Scholar] [CrossRef]
  46. Yao, Y.; Lu, T.; Liu, Y.; Qin, Q.; Jiang, J.; Xiang, H. Association of depressive symptoms with ambient PM2.5 in middle-aged and elderly Chinese adults: A cross-sectional study from the China Health and Retirement Longitudinal Study wave 4. Environ. Res. 2022, 203, 111889. [Google Scholar] [CrossRef]
  47. Niu, Z.; Zhai, M.; Dong, Y.; Wen, W.; Xue, L.; Aosiman, M.; Qin, W.; Duan, Z. Association between air quality satisfaction, family relationships, and depression symptoms among middle-aged and elderly Chinese people: The mediation role of perceived health status. BMC Public Health 2022, 22, 2439. [Google Scholar] [CrossRef]
  48. Zhu, Z.; Zhao, Y. Severe air pollution and psychological distress in China: The interactive effects of coping and perceived controllability. Front. Psychol. 2021, 12, 601964. [Google Scholar] [CrossRef]
  49. Clark, D.A.; Beck, A.T. Cognitive theory and therapy of anxiety and depression: Convergence with neurobiological findings. Trends Cogn. Sci. 2010, 14, 418–424. [Google Scholar] [CrossRef] [PubMed]
  50. Smith, L.; Veronese, N.; Sanchez, G.F.L.; Butler, L.; Barnett, Y.; Shin, J.I.; Lee, S.; Oh, J.W.; Soysal, P.; Oh, H.; et al. The association of cooking fuels with depression and anxiety symptoms among adults aged ≥ 65 years from low- and middle-income countries. J. Affect. Disord. 2022, 311, 494–499. [Google Scholar] [CrossRef] [PubMed]
  51. Li, G.; Zhou, Y.; Ding, L. Effects of long-term household air pollution exposure from solid fuel use on depression: Evidence from national longitudinal surveys from 2011 to 2018. Environ. Pollut. 2021, 283, 117350. [Google Scholar] [CrossRef] [PubMed]
  52. Du, X.; Li, X.; Qian, P.; Wu, H. Indoor air pollution from solid fuels use, inflammation, depression and cognitive function in middle-aged and older Chinese adults. J. Affect. Disord. 2022, 319, 370–376. [Google Scholar] [CrossRef] [PubMed]
  53. Erdsiek, F.; Brzoska, P. Is exposure to secondhand smoke associated with current depression (PHQ-8) among never-smokers? Results from a survey among German adults. BMC Public Health 2020, 20, 1880. [Google Scholar] [CrossRef]
  54. Noguchi, T.; Nakagawa-Senda, H.; Tamai, Y.; Nishiyama, T.; Watanabe, M.; Hosono, A.; Shibata, K.; Ichikawa, M.; Wakabayashi, R.; Nagaya, K.; et al. Association between second-hand smoke exposure and depressive symptoms among Japanese adults: A cross-sectional study. J. Epidemiol. 2020, 30, 566–573. [Google Scholar] [CrossRef] [Green Version]
  55. Zhang, H.; Xia, Y.; Cao, L.; Chang, Q.; Zhao, Y. Associations between long term exposure to outdoor air pollution and indoor solid fuel use and depression in China. J. Environ. Manag. 2022, 302, 113982. [Google Scholar] [CrossRef]
  56. Shi, W.; Li, T.; Zhang, Y.; Sun, Q.; Chen, C.; Wang, J.; Fang, J.; Zhao, F.; Du, P.; Shi, X. Depression and anxiety associated with exposure to fine particulate matter constituents: A cross-sectional study in North China. Environ. Sci. Technol. 2020, 54, 16006–16016. [Google Scholar] [CrossRef]
  57. Liao, Y.-A.; Garcia-Mondragon, L.; Konac, D.; Liu, X.; Ing, A.; Goldblatt, R.; Yu, L.; Barker, E.D. Nighttime lights, urban features, household poverty, depression, and obesity. Curr. Psychol. 2022, 16, 1–12. [Google Scholar] [CrossRef]
  58. Hao, G.; Zuo, L.; Xiong, P.; Chen, L.; Liang, X.; Jing, C. Associations of PM2.5 and road traffic noise with mental health: Evidence from UK Biobank. Environ. Res. 2022, 207, 112221. [Google Scholar] [CrossRef]
  59. Wei, F.; Wu, M.; Qian, S.; Li, D.; Jin, M.; Wang, J.; Shui, L.; Lin, H.; Tang, M.; Chen, K. Association between short-term exposure to ambient air pollution and hospital visits for depression in China. Sci. Total Environ. 2020, 724, 138207. [Google Scholar] [CrossRef]
  60. Wang, R.; Liu, Y.; Xue, D.; Yao, Y.; Liu, P.; Helbich, M. Cross-sectional associations between long-term exposure to particulate matter and depression in China: The mediating effects of sunlight, physical activity, and neighborly reciprocity. J. Affect. Disord. 2019, 249, 8–14. [Google Scholar] [CrossRef]
  61. Kim, S.Y.; Bang, M.; Wee, J.H.; Min, C.; Yoo, D.M.; Han, S.-M.; Kim, S.; Choi, H.G. Short- and long-term exposure to air pollution and lack of sunlight are associated with an increased risk of depression: A nested case-control study using meteorological data and national sample cohort data. Sci. Total Environ. 2021, 757, 143960. [Google Scholar] [CrossRef]
  62. Hu, J.; Liu, Y.; Ma, Y.; Gao, M.; Wan, N.; Li, L.; Liu, B.; Wen, D. Sweet foods dietary pattern enhances negative associations of perceived indoor air quality during pregnancy with postpartum depression. Indoor Air 2022, 32, e13124. [Google Scholar] [CrossRef]
  63. Sampson, L.; Ettman, C.K.; Galea, S. Urbanization, urbanicity, and depression: A review of the recent global literature. Curr. Opin. Psychiatry 2020, 33, 233–244. [Google Scholar] [CrossRef]
  64. Lin, H.; Guo, Y.; Kowal, P.; Airihenbuwa, C.O.; Di, Q.; Zheng, Y.; Zhao, X.; Vaughn, M.G.; Howard, S.; Schootman, M.; et al. Exposure to air pollution and tobacco smoking and their combined effects on depression in six low- and middle-income countries. Br. J. Psychiatry 2017, 211, 157–162. [Google Scholar] [CrossRef] [Green Version]
  65. Dores, A.K.; Fick, G.H.; MacMaster, F.P.; Williams, J.V.A.; Bulloch, A.G.M.; Patten, S.B. Outdoor air pollution and depression in Canada: A population-based cross-sectional study from 2011 to 2016. Int. J. Environ. Res. Public Health 2021, 18, 2450. [Google Scholar] [CrossRef]
  66. Kocot, K.; Zejda, J.E. The relationship between ambient air pollution and life expectancy—An ecological fallacy revisited. Przegl. Epidemiol. 2022, 76, 58–66. [Google Scholar] [CrossRef]
  67. Brhlikova, P.; Pollock, A.M.; Manners, R. Global Burden of Disease estimates of depression—How reliable is the epidemiological evidence. J. R. Soc. Med. 2011, 104, 25–35. [Google Scholar] [CrossRef] [Green Version]
  68. Braithwaite, I.; Zhang, S.; Kirkbride, J.B.; Osborn, D.P.J.; Hayes, J.F. Air pollution (particulate matter) exposure and associations with depression, anxiety, bipolar, psychosis and suicide risk: A systematic review and meta-analysis. Environ. Health Perspect. 2019, 127, 126002. [Google Scholar] [CrossRef] [Green Version]
  69. He, Y.; Liu, X.; Luo, Z.; Wang, Y.; Fan, K.; Tu, R.; Wu, X.; Chen, G.; Hou, J.; Mao, Z.; et al. Long-term exposure to ambient PM1 strengthened the association of depression/anxiety symptoms with poor sleep quality: The Henan Rural Cohort study. Ecotoxicol. Environ. Saf. 2021, 211, 111932. [Google Scholar] [CrossRef] [PubMed]
  70. Nguyen, A.-M.; Malig, B.J.; Basu, R. The association between ozone and fine particles and mental health-related emergency department visits in California, 2005–2013. PLoS ONE 2021, 16, e0249675. [Google Scholar] [CrossRef] [PubMed]
  71. Jorcano, A.; Lubczynska, M.J.; Pierotti, L.; Altug, H.; Ballester, F.; Cesaroni, G.; El Marroun, H.; Fernandez-Somoano, A.; Freire, C.; Hanke, W.; et al. Prenatal and postnatal exposure to air pollution and emotional and aggressive symptoms in children from 8 European birth cohorts. Environ. Int. 2019, 131, 104927. [Google Scholar] [CrossRef] [PubMed]
  72. Allaouat, S.; Yli-Tuomi, T.; Tiitanen, P.; Turunen, A.W.; Siponen, T.; Kukkonen, J.; Kangas, L.; Kauhaniemi, M.; Aarnio, M.; Ngandu, T.; et al. Long-term exposure to ambient fine particulate matter originating from traffic and residential wood combustion and the prevalence of depression. J. Epidemiol. Community Health 2021, 75, 1111–1116. [Google Scholar] [CrossRef] [PubMed]
Figure 1. Scatter plots of the relationship between average annual PM2.5 and the incidence of depression in 2010 and 2019.
Atmosphere 14 00597 g001
Figure 2. The complex nature of the relationship between PM2.5 and depression.
Atmosphere 14 00597 g002
Table 1. Confounding factors analyzed in the current study.
VariableRationale for InclusionData Source
Gross national income (GNI) per capitaIncome levels may mediate the link between air pollution and mental health [26]World Bank database [33]
Average years of education per adultWithin income groups, education may influence the link between air pollution and depression [26]Our World in Data [34]
Prevalence of insufficient physical activity in adults (%)Physical activity may moderate the impact of air pollution on depression [27]WHO Global Health Observatory [35]
Population densityPopulation density may influence the links between air pollution and mental health [26]World Population Review [36]
Distance from the equator (absolute value of the latitude)Climatic conditions can influence the impact of air pollution, and may also influence vitamin D levels [29,37]Google Earth [38]
Table 2. Bivariate correlations between average annual PM2.5 levels and the incidence of depression across countries.
VariableCorrelation with PM2.5
Levels, 2010
Correlation with PM2.5
Levels, 2019
Depression, incidence
(unadjusted)
Total
Male
Female
0.28 (<0.001)
0.27 (<0.001)
0.27 (<0.001)
0.37 (<0.001)
0.40 (<0.001)
0.32 (<0.001)
Depression, incidence
(adjusted) *
Total
Male
Female
0.21 (0.011)
0.21 (0.011)
0.19 (0.020)
0.33 (<0.001)
0.34 (<0.001)
0.29 (<0.001)
* Adjusted for gross national income, average adult education, population density, percentage of adults engaging in sufficient physical activity, and distance from the equator. Values marked in bold indicate statistically significant findings after Bonferroni’s correction.
Table 3. Bivariate correlations between average annual PM2.5 and the incidence of depression, grouped according to WHO safety guidelines.
VariableCorrelation with PM2.5
Levels, 2010
Correlation with PM2.5
Levels, 2019
Depression, incidence
(2010)
Total
Male
Female
0.22 (0.015)
0.21 (0.025)
0.21 (0.019)
0.38 (0.002)
0.39 (0.001)
0.35 (0.005)
Depression, incidence
(2019)
Total
Male
Female
0.48 (<0.001)
0.48 (<0.001)
0.43 (<0.001)
−0.13 (0.318)
−0.16 (0.238)
−0.11 (0.400)
All values are given as Pearson’s r (p-value). Results highlighted in bold indicate statistically significant findings after applying Bonferroni’s correction for a 5 × 5 table.
Table 4. Cross-lagged regression analyses between PM2.5 levels and the incidence of depression for the period 2010–2019.
VariableCorrelation with PM2.5
Levels, 2010
Correlation with PM2.5
Levels, 2019
Cross-Lagged Regression
Coefficient
Significance
Level
Depression, incidence (%)
Total
Male
Female
0.29 (<0.001)
0.28 (<0.001)
0.27 (<0.001)
0.34 (<0.001)
0.37 (<0.001)
0.30 (<0.001)
−0.051
−0.061
−0.018
0.491
0.409
0.807
Depression, incidence (%) *
Total
Male
Female
0.23 (0.006)
0.23 (0.005)
0.21 (0.013)
0.30 (<0.001)
0.31 (<0.001)
0.26 (0.001)
−0.068
−0.049
−0.055
0.357
0.507
0.457
* Adjusted for gross national income, average adult education, population density, percentage of adults engaging in sufficient physical activity, and distance from the equator.
Table 5. Repeated measures analyses of covariance of the relationship between PM2.5 and longitudinal changes in the incidence of depression.
VariableTest Statistic (F)Significance Level
Depression, total
Depression, total × PM2.5
Depression, male
Depression, male × PM2.5
Depression, female
Depression, female × PM2.5
6.66
0.26
7.76
0.03
4.95
0.49
0.011
0.610
0.006
0.986
0.027
0.483
Disclaimer/Publisher’s Note: The statements, opinions and data contained in all publications are solely those of the individual author(s) and contributor(s) and not of MDPI and/or the editor(s). MDPI and/or the editor(s) disclaim responsibility for any injury to people or property resulting from any ideas, methods, instructions or products referred to in the content.

