Article

The Effect of Abrupt Changes to Sources of PM10 and PM2.5 Concentrations in Three Major Agglomerations in Mexico

by
Jorge Méndez-Astudillo
1,* and
Ernesto Caetano
2
1
Institute of Economic Research, National Autonomous University of Mexico, Mexico City 04510, Mexico
2
Institute of Geography, National Autonomous University of Mexico, Mexico City 04510, Mexico
*
Author to whom correspondence should be addressed.
Atmosphere 2023, 14(3), 596; https://doi.org/10.3390/atmos14030596
Submission received: 26 January 2023 / Revised: 13 March 2023 / Accepted: 14 March 2023 / Published: 21 March 2023
(This article belongs to the Section Air Pollution Control)

Abstract

:
In the three major urban agglomerations in Mexico (Mexico City, Monterrey, and Guadalajara), a significant change to anthropogenic sources of air pollution happened in March–May 2020, when policies implemented to stop the spread of the COVID-19 virus in Mexico caused the reduction of some anthropogenic sources of air pollution. We study the effect of these significant changes to air pollution sources using satellite-retrieved aerosol optical depth (AOD) and particulate matter (PM10 and PM2.5) concentrations from ground stations. The Chow test was applied to study trend changes in PM concentrations from 1 January to 30 May 2020. The Mann–Whitney non-parametric test was then used to compare average PM concentrations in April and May pre-lockdown, during lockdown in 2020, and post-lockdown in 2021. The assessment was further performed by evaluating the exceedance of national air quality standard maxima. The trend analysis showed that PM10 concentrations were reduced during lockdown in Mexico City and Monterrey, whereas no change was found for PM10 in Guadalajara and PM2.5 in the three cities. Further analysis showed that in Mexico City and Guadalajara, average PM10 and PM2.5 concentrations decreased by 12% in April and May 2020. However, in Monterrey, average PM10 and PM2.5 concentrations increased by 2.76% and 11.07%, respectively, in April 2021 due to a severe drought that caused dry soils and dust around the city. The results of this research can be used to implement policies for reducing anthropogenic sources to improve the air quality in urban areas.

1. Introduction

Particulate matter (PM) is a pollutant of the air that comes from both natural and anthropogenic sources. PM is classified depending on its diameter size as PM10 (particles ≤ 10 μm in diameter), which are typically produced by dust, pollen, and other sources [1], and PM2.5 (size ≤ 2.5 μm), which are usually produced by combustion and on-road transportation [2]. The mix of PM and other gases in the atmosphere creates aerosols [3] that are monitored because the constant exposure and inhalation of aerosols is associated with adverse human health effects, such as respiratory diseases in individuals exposed to high PM2.5 concentrations [4,5]. Moreover, recent studies have shown that there is a potential role of aerosols in spreading the COVID-19 virus [6,7,8] and increasing mortality [9,10].
During the year 2020 as the COVID-19 pandemic spread around the world, lockdowns or mobility restrictions were enforced to stop the spread of the virus. Lockdowns stopped non-essential activities and non-essential travelling, which meant some anthropogenic sources of air pollution stopped emitting pollutants to the air. Under this situation, the effect of lockdowns on PM10 and PM2.5 has been studied in many cities around the world [11,12,13]. An overall reduction of PM concentrations has been reported around the world, however, some regions, such as Lombardy, Italy, have detected no significant changes in PM concentrations during the lockdown [14]. The effect of lockdowns needs to be studied, including other possible sources of air pollution active at the time, such as wildfires or dust, which are not affected by lockdowns. Furthermore, other sources of abrupt changes in air pollutants such as wildfires or soil erosion due to a drought happened around the same time as the lockdowns, thus presenting unique opportunities to study the effect of abrupt changes of PM concentrations due to policy intervention and unique events.
On 27 February 2020, the first imported case of COVID-19 was detected in Mexico City [15]. Then, on 11 March, the first imported case was detected in Monterrey. In Guadalajara, the first two imported cases of COVID-19 were detected on 14 March 2020. Local transmission officially started in Mexico City on 24 March 2020. That same day, the federal government enacted the first measures nationwide to contain the spread of the virus. The national lockdown was in place from 23 March to 30 May 2020, and during that time, restaurants, bars, and non-essential stores were closed, education moved online, work from home was encouraged, and massive events were cancelled [16]. After 30 May, every state enacted local measures, including mask-wearing mandates.
In this study, we assess the effect of a shock on anthropogenic sources of air pollutants using AOD and PM concentration data in three major agglomerations in Mexico. Data from the dry season (March, April, and May) were used because in June, the rainy season starts, and rain washes out air pollutants [17]. We propose the use of a structural change test to examine changes in PM concentrations caused by lockdowns and other contributions such as wildfires or soil erosion. Furthermore, we implement a robust statistical analysis to assess the effect of meteorological conditions and to quantify the changes of average PM concentrations during the dry season in 2020. Even though the effect of lockdowns on air quality has been studied in many cities around the world [12,18], the methodology applied in this paper has not been used before in air quality studies. Additionally, only one study about the effect of lockdowns on ozone in Mexico City was available [19] at the time of writing. Therefore, we intend to contribute to understanding the effect of lockdowns and the effect of other sources of air pollution such as wildfires and dust in three different Mexican urban agglomerations under different environmental conditions. This study is relevant because some of these effects will probably sharpen in the face of climate change.

2. Materials and Methods
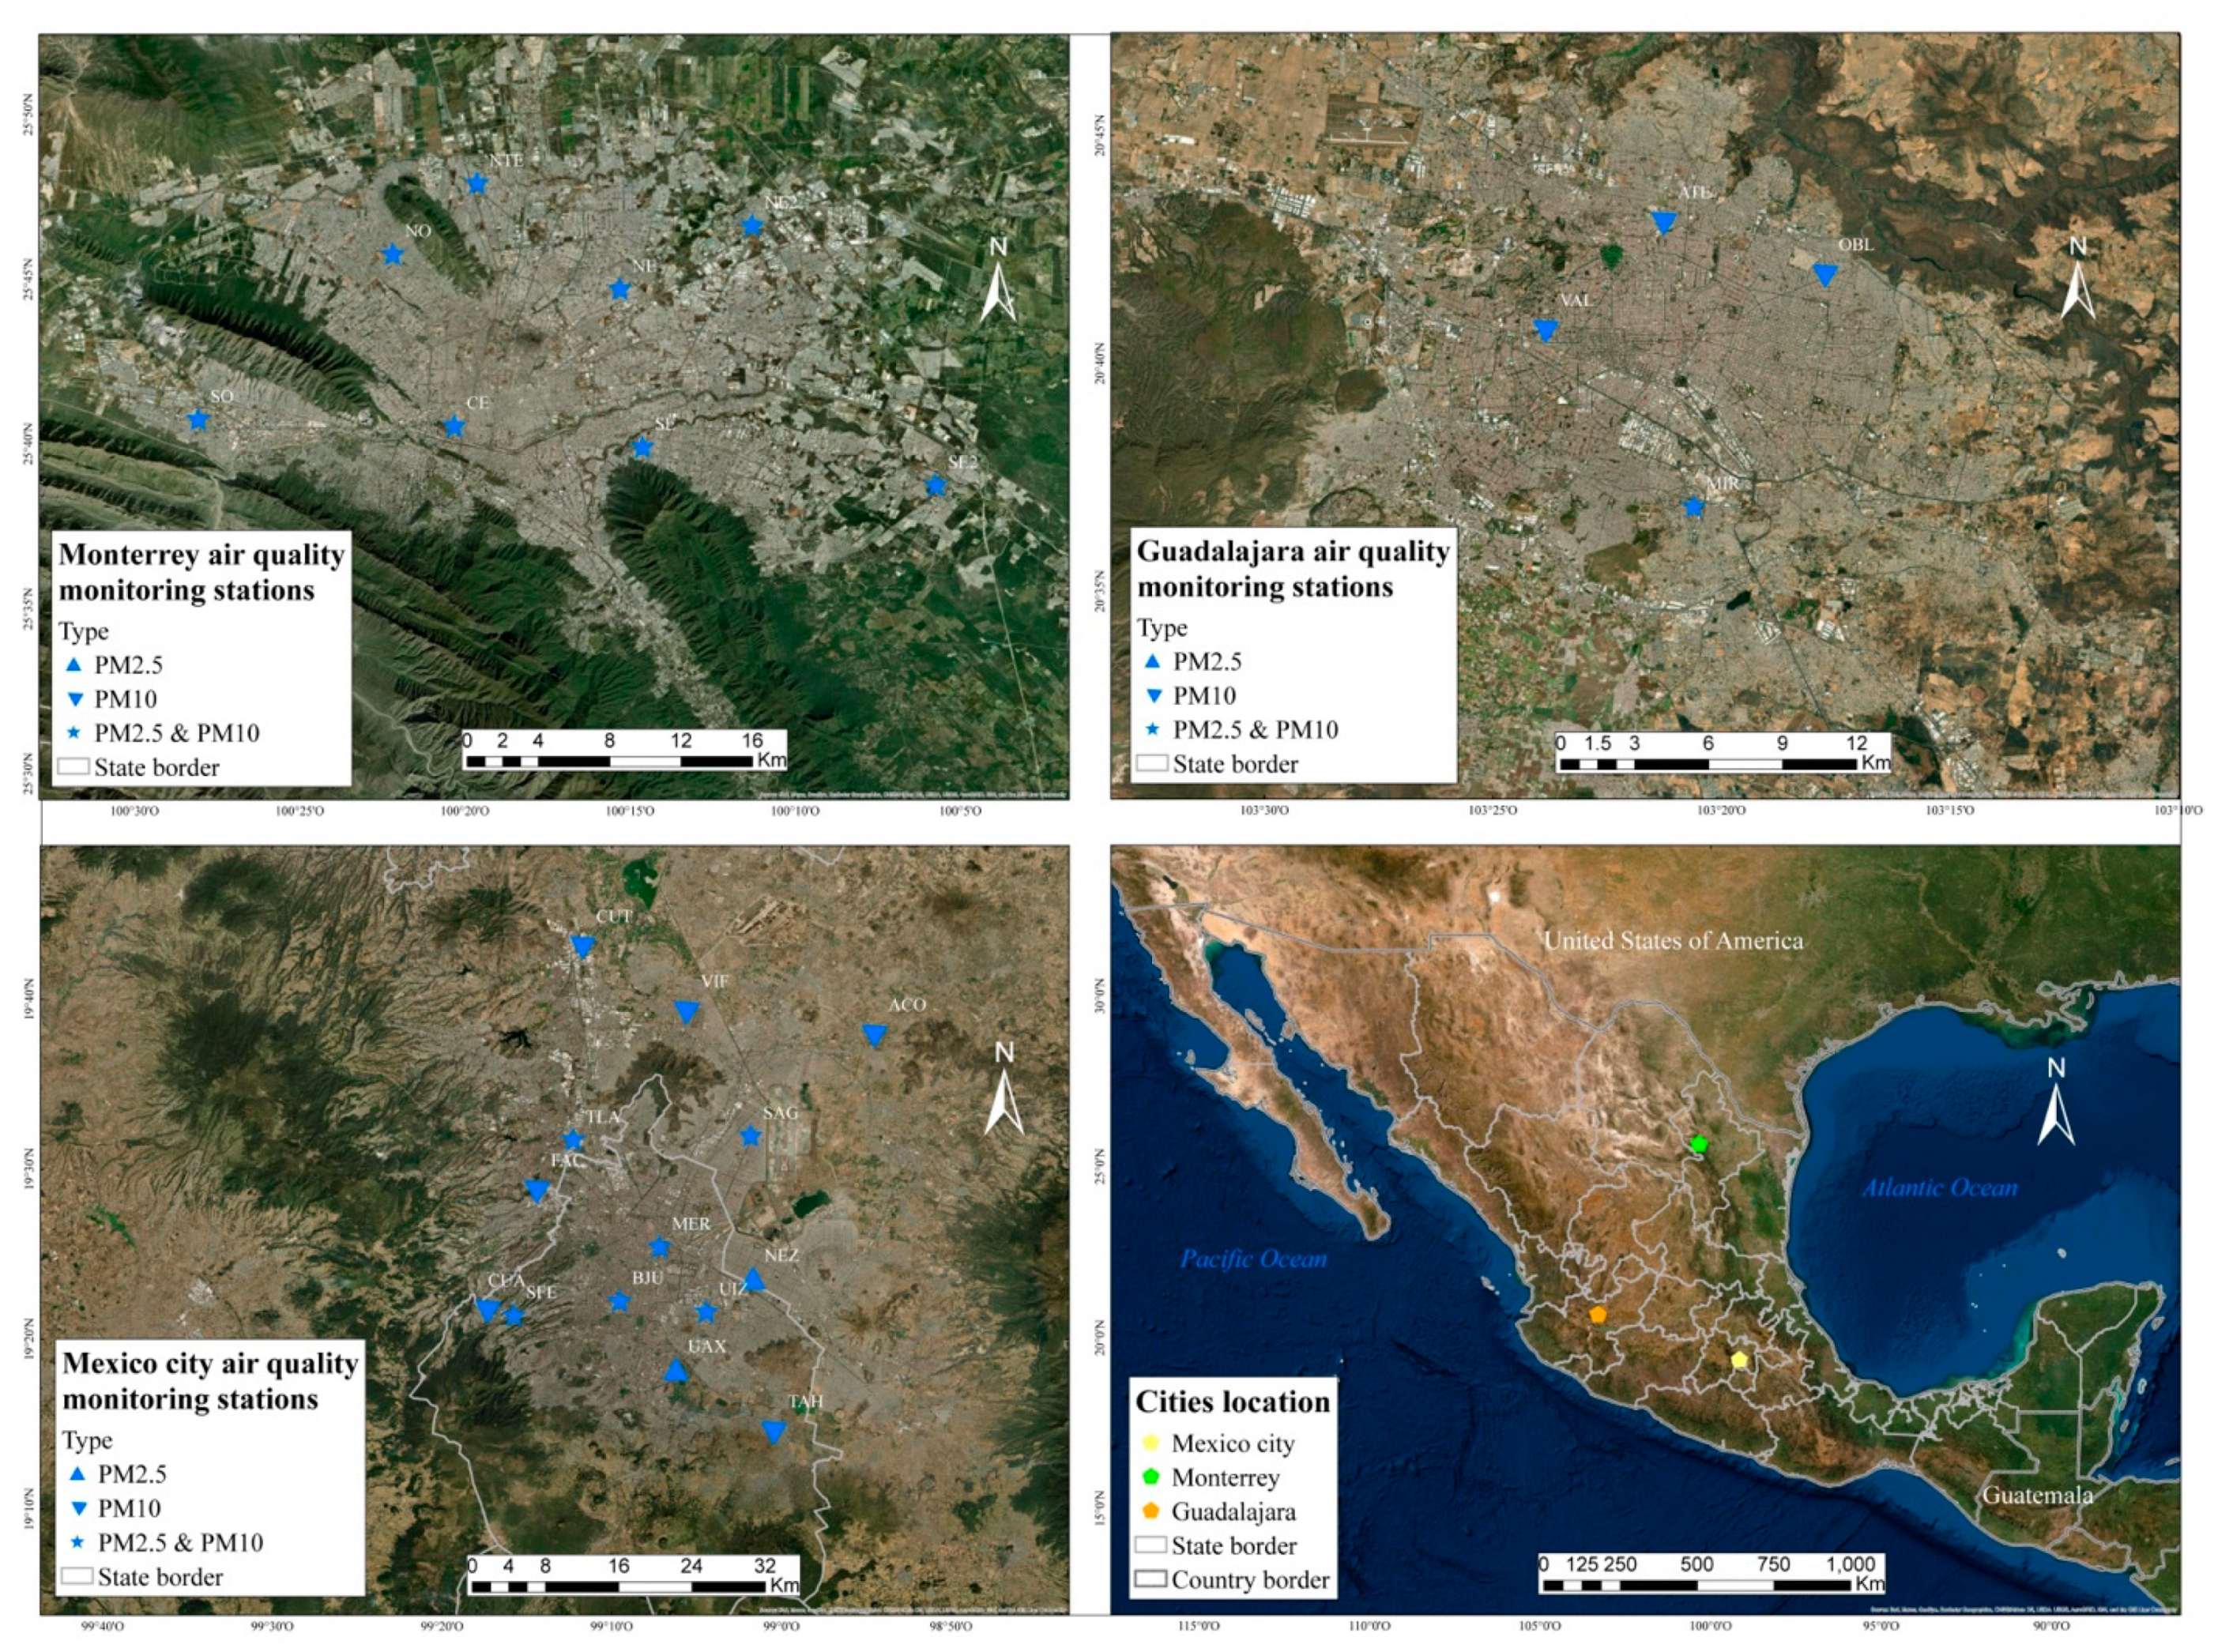
2.1. Study Areas

Mexico is located in North America and has a border to the north with the United States and to the south with Guatemala and Belize. In 2020, according to the census [20], Mexico had a population of 126 million people. There are three main urban agglomerations in Mexico: Greater Mexico City (GMC), home to 21.8 million people, the metropolitan area of Guadalajara (MAG), home to 5.1 million people, and the metropolitan area of Monterrey (MTY), with 5.3 million inhabitants. In total, 25.5% of Mexico’s population live in any of these three agglomerations. Figure 1 shows the locations of each of the urban agglomerations as well as the locations of meteorological and air quality stations used in this study.
We processed MODIS-derived aerosol optical depth (AOD), particulate matter (PM10 and PM2.5) concentrations measured with ground stations, and meteorological data collected at the same place as air quality monitoring stations. PM has been chosen due to the adverse effect it has on human health and because it is mainly produced by anthropogenic sources.

2.2. AOD Data

Aerosols are the blend of liquid droplets and small particles such as particulate matter and dust in a gas, such as the air. AOD is defined as the measure of aerosols distributed within a column of air from the Earth’s surface to the Top of Atmosphere (TOA) [3]. Previous research has shown that AOD has a strong correlation with PM2.5, measured with ground stations [21]. Therefore, AOD can be used as an indicator of PM2.5 concentrations in Mexico City, Guadalajara, and Monterrey.
The MODIS Terra and Aqua combined Multi-Angle Implementation of Atmospheric Correction (MAIAC) Land AOD at a 1 km pixel resolution [22] was used because its resolution is adequate for urban studies. Monthly averages of MAIAC-AOD centered in GMC, MAG, and MTY from April 2015 to 2022 and May 2015 to 2022 were processed with Google Earth Engine [23].

2.3. Greater Mexico City (GMC) Ground Stations’ Data

The Meteorological Monitoring Network REDMET reports the temperature, the relative humidity, the wind direction, and the wind speed every hour in 26 locations around GMC [24]. Hourly concentrations of PM10, PM2.5, O3, NO, and NO2 are measured by the Air Quality Monitoring Network RAMA in 25 locations around GMC [25]. Only stations with PM10 or PM2.5 data in April and May 2020 and 2021 were chosen (M1–M14 in Table A1). Meteorological and PM data from April and May 2015–2022 are described in Table A1 in the Appendix A.

2.4. Metropolitan Area of Guadalajara (MAG) Ground Stations’ Data

The secretary of environment and territorial development of the Jalisco state government manages the SIMAJ (Sistema de Monitoreo Atmosférico de Jalisco), which operates 10 ground stations that measure the air quality in MAG (SEMADET, 2021). The pollutants PM10, NO, CO, NO2, NOx, and O3 are measured every hour. For this study, only four stations: ATE, OBL, VAL, and MIR, shown in Figure 1, were chosen because they report PM10 in April and May 2015–2022, however data were only available until 2020. Only the station MIR reported PM2.5 in April and May 2019 and 2020. Meteorological data (air temperature, relative humidity, wind speed, and wind direction) are also reported by stations ATE, OBL, VAL, and MIR, as described in Table A1.

2.5. Metropolitan Area of Monterrey (MTY) Ground Stations’ Data
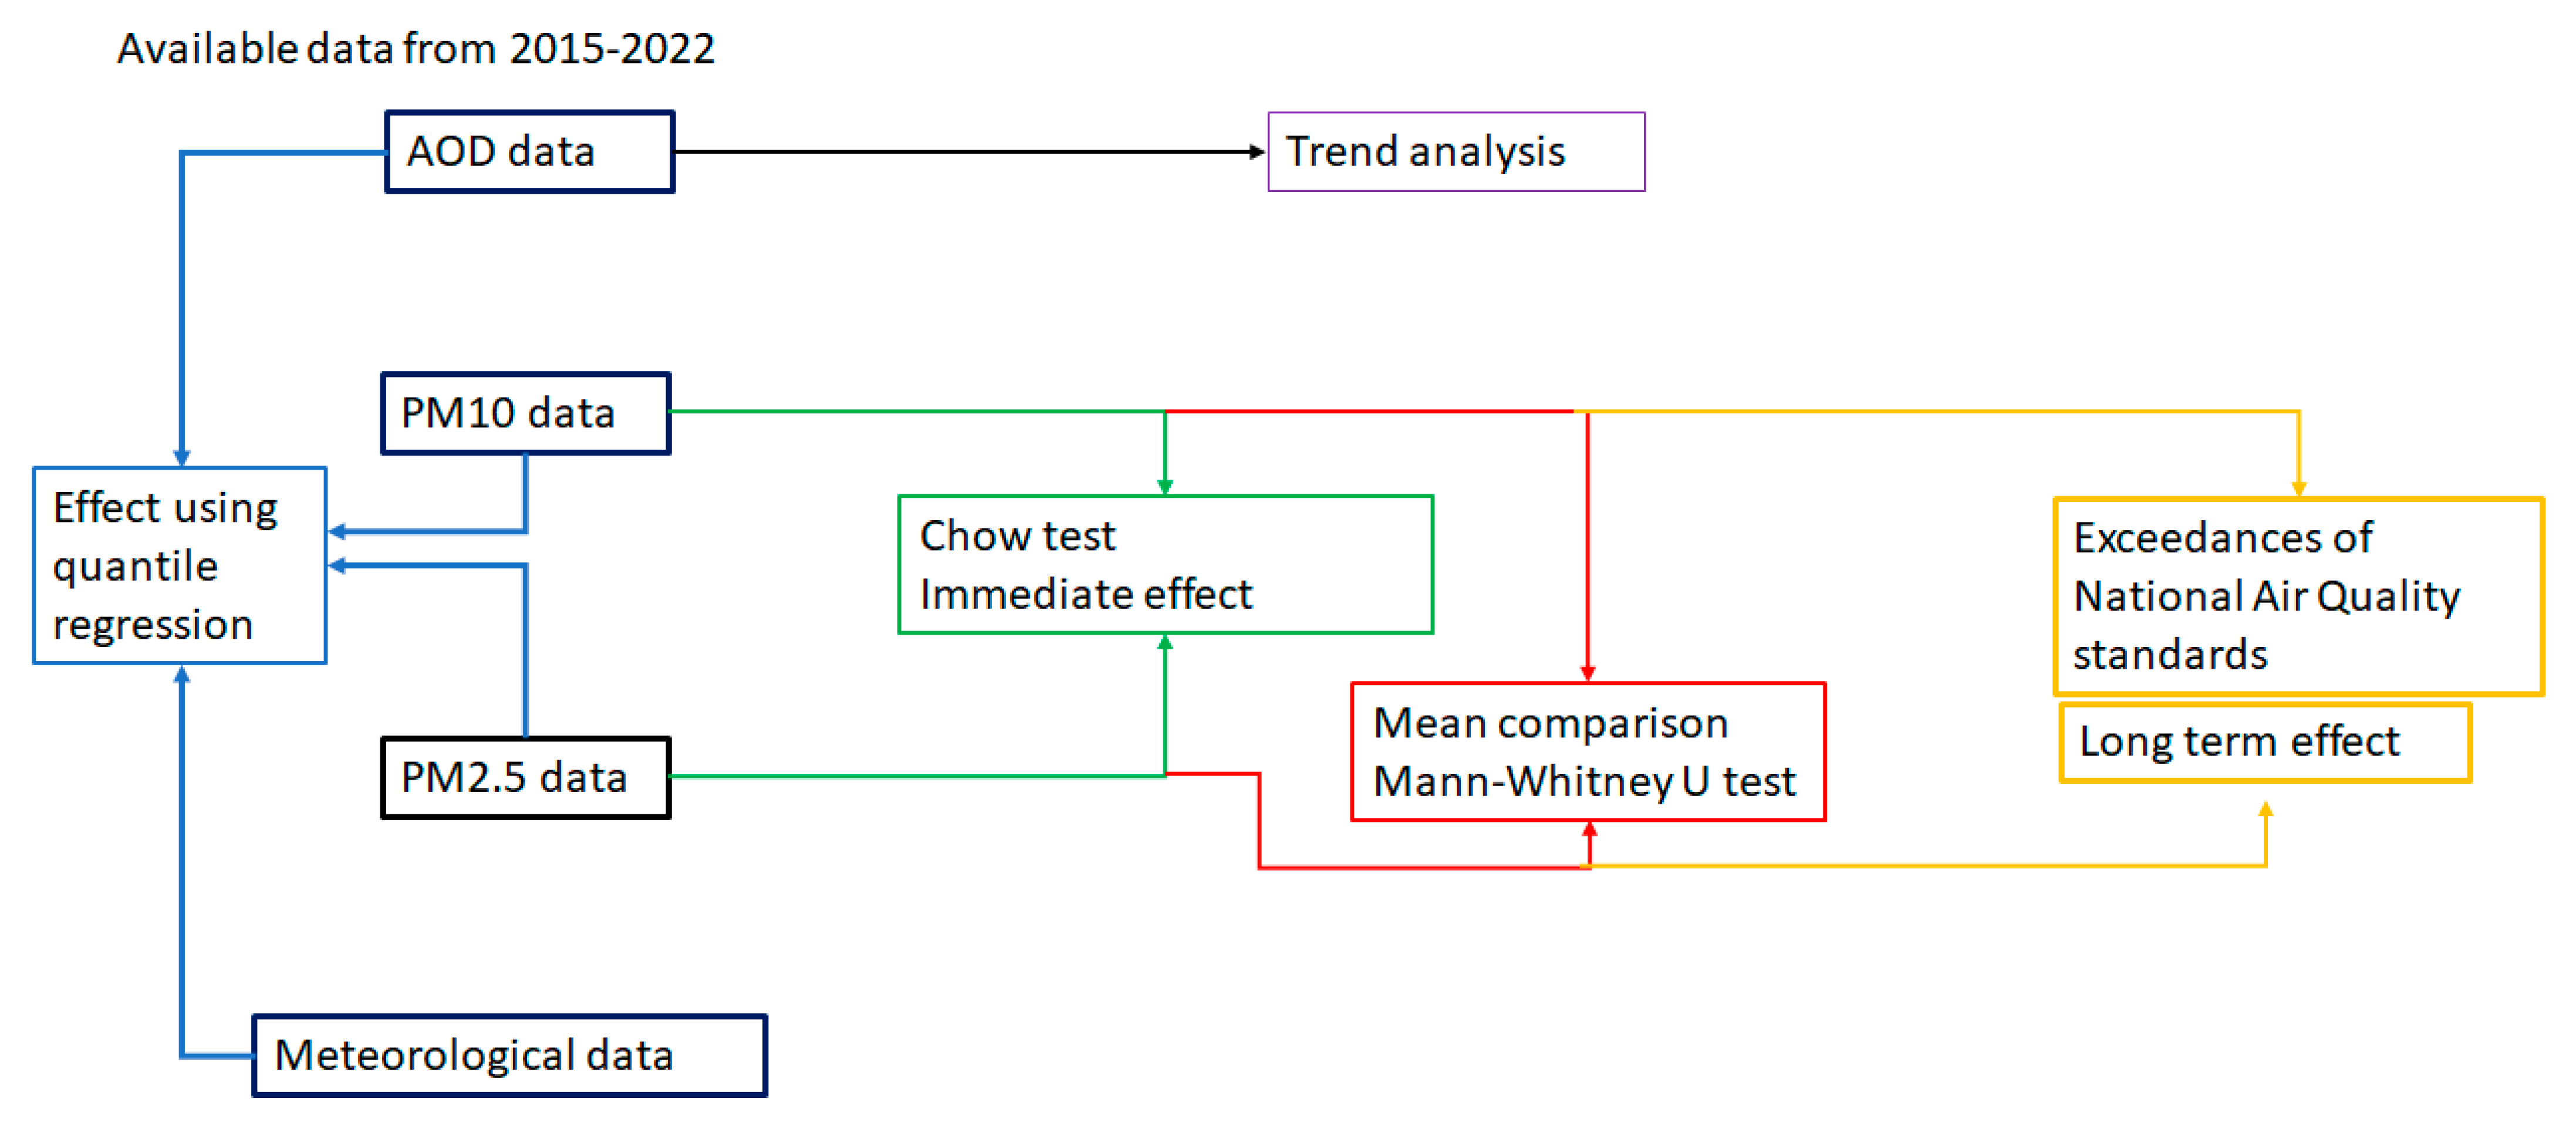
The secretary of environment of the Nuevo Leon state manages SIMA (Sistema Integral de Monitoreo Ambiental), with 14 ground stations in the MMA. Each station reports meteorological parameters such as air temperature, relative humidity, precipitation, wind speed, and wind direction. Furthermore, hourly concentrations of PM10, PM2.5, NO, CO, NO2, and O3 are also reported. Eight stations, described in Table A1 with no missing data from April and May 2020 and 2021, were chosen.

2.6. Methodology

The spatial distribution of AOD was observed with MODIS data from April and May 2015–2022. The concentrations of AOD were obtained at the centroids of the basic geographic area defined by INEGI [20]. Box plots were used to compare concentrations in that period in the three cities. Therefore, the effect of lockdowns on annual AOD concentrations was observed. The immediate effect of lockdowns on PM concentrations was assessed using the Chow test [26], which is used to test if a break takes place at a given period in a time series, typically used to study the effects of economic shocks or structural changes (a dramatic shift in the way an economy works). We consider lockdown restrictions as an external shock to PM emissions.
A multiple linear regression between meteorological variables (temperature, relative humidity (RH), wind speed, and wind direction), AOD, and PM (10 and 2.5) was performed to analyze the effect of meteorological variables to AOD and PM concentrations. In 90% of the models, wind speed and wind direction were statistically significant variables, whereas temperature and RH were not always statistically significant. Therefore, the effect of meteorological variables on PM concentrations was assessed using the quantile regression at 75% between wind speed and PM concentrations, which has been previously used to assess the effect of wind speed on aerosol optical depth [13].
The methodology of this study is depicted in Figure 2. The statistical significance of the differences in PM concentrations using monthly data was assessed using the non-parametric Mann–Whitney U test, which is frequently used in air quality studies comparing differences in pollutant levels [27,28]. A significance level of 95% (p < 0.05) was used. Finally, the effect of an abrupt change on anthropogenic sources of air pollution in yearly concentrations was determined using the number of days exceeding the national standard for air quality. In Mexico City, lockdown restrictions were the abrupt change, whereas in Monterrey, it was the drought, causing dust, and in Guadalajara, wildfires caused abrupt changes in sources of air pollution.

3. Results

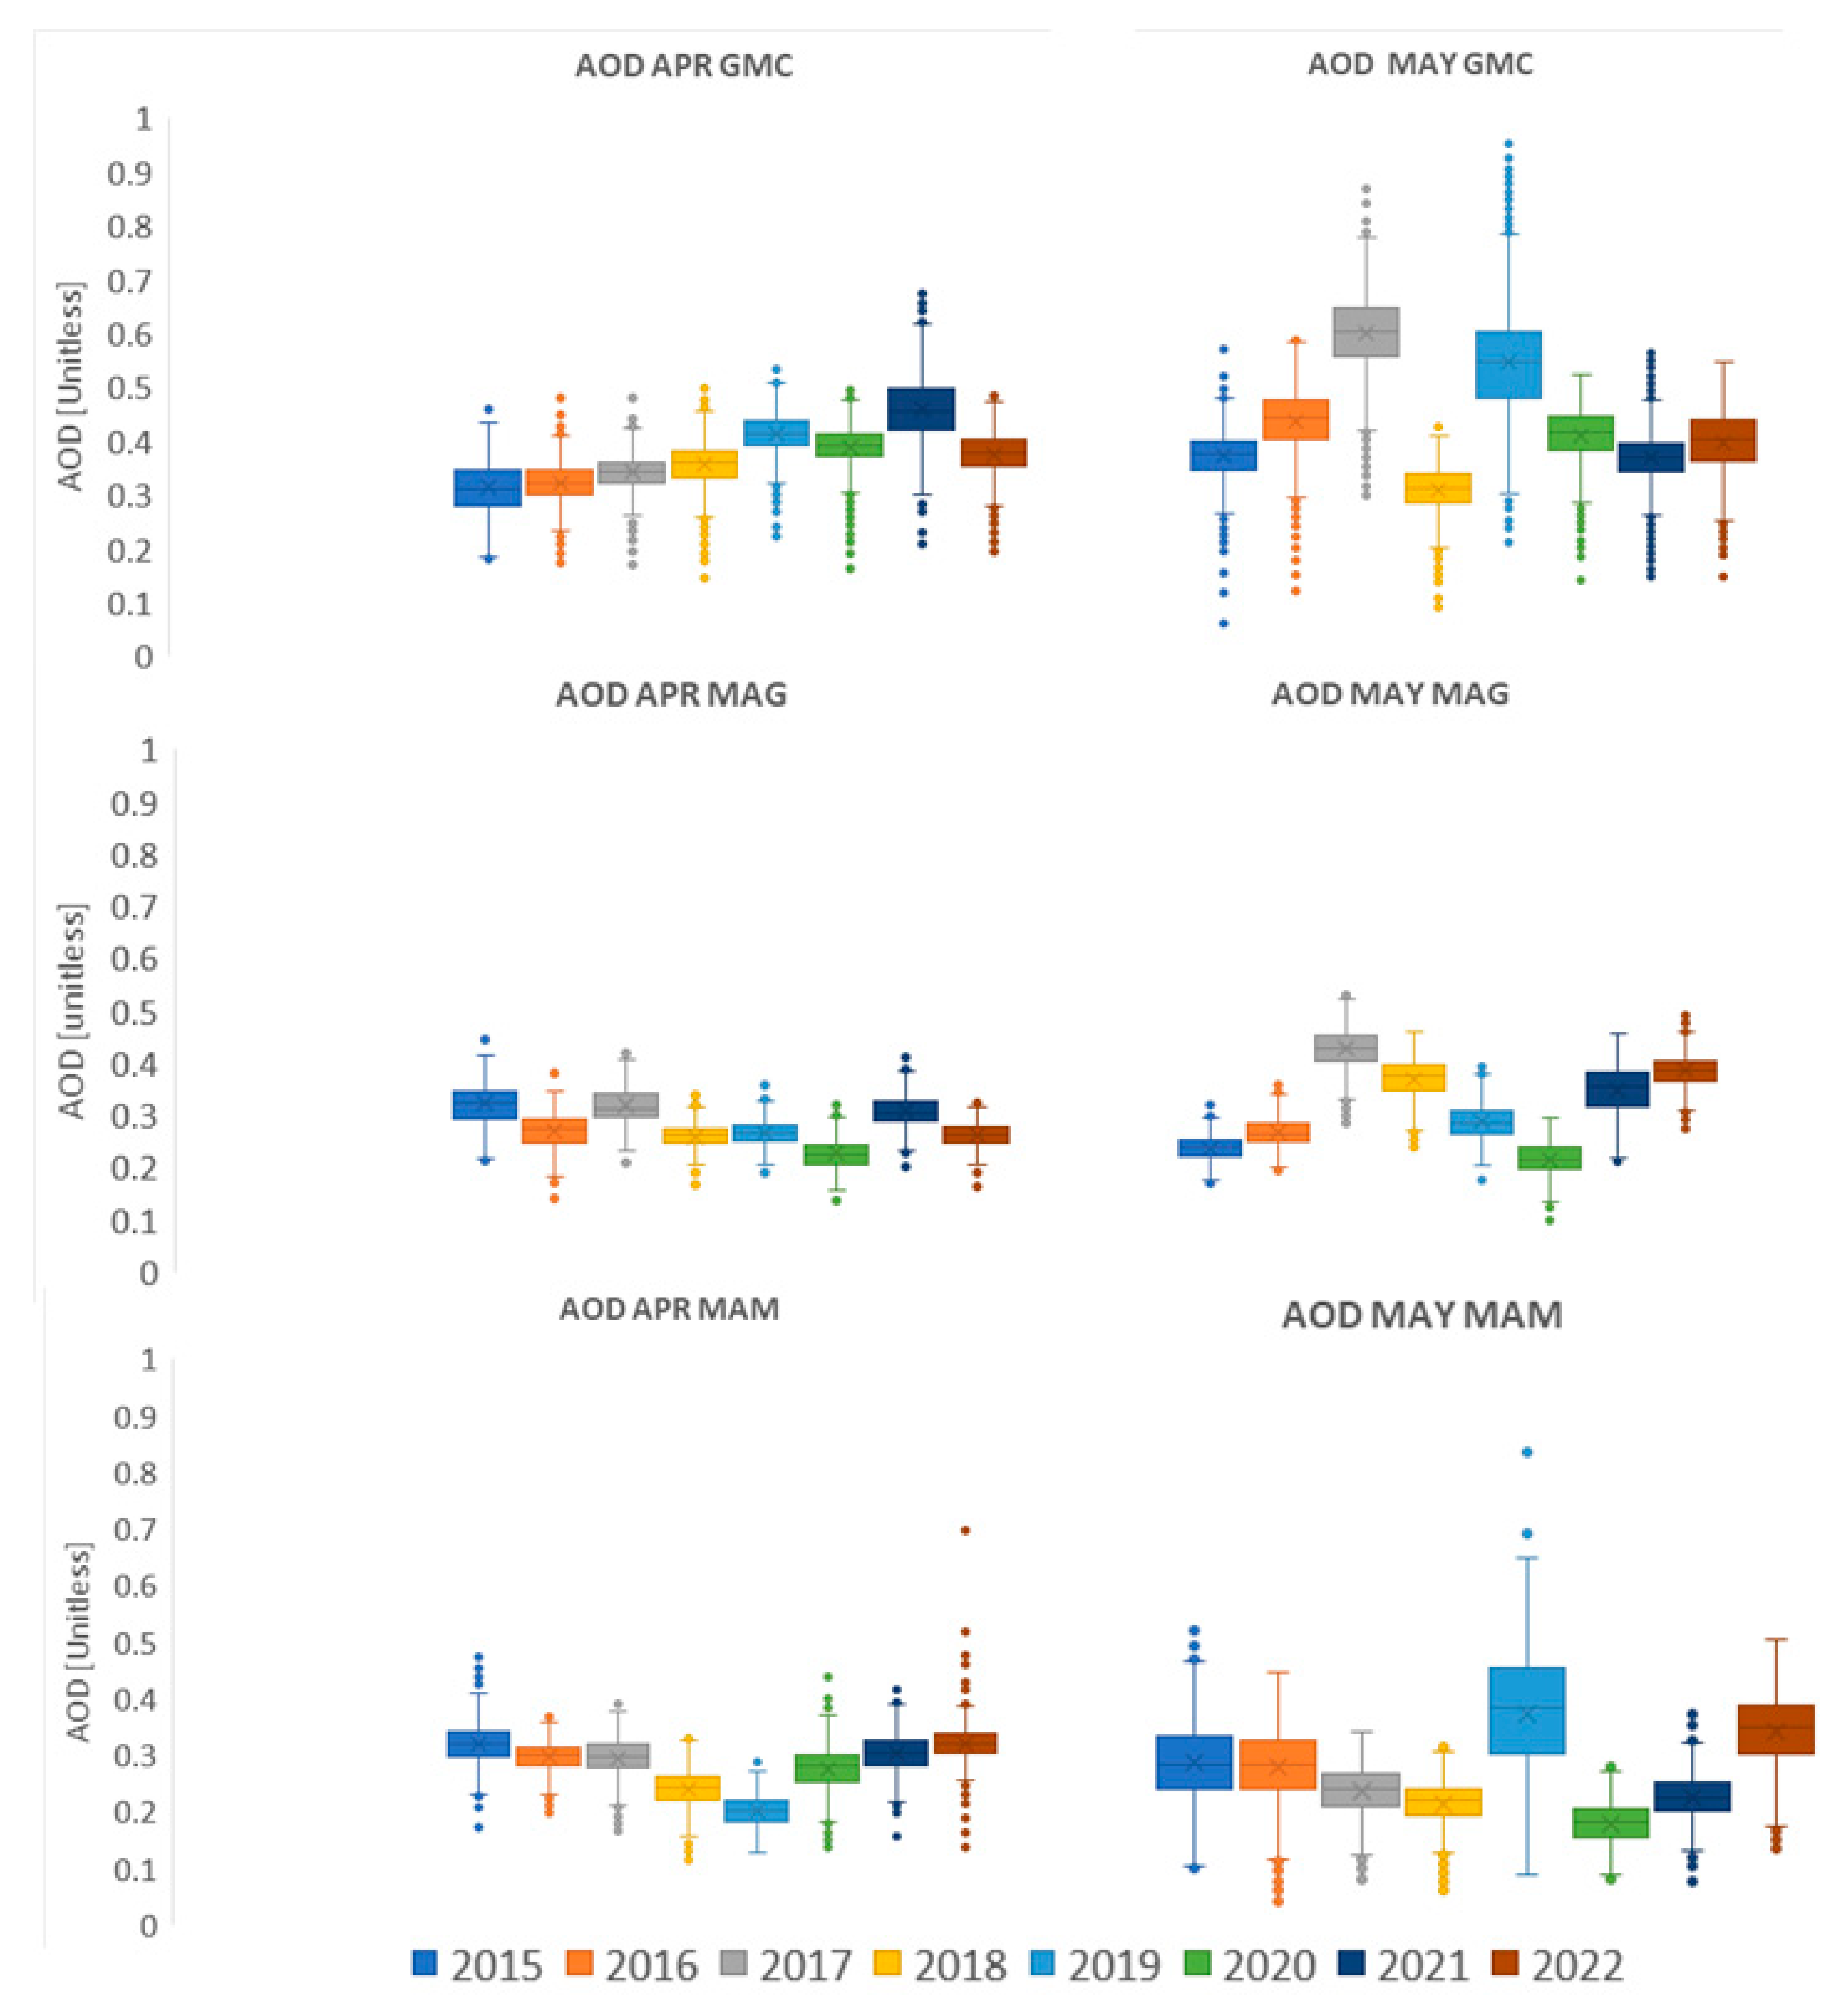
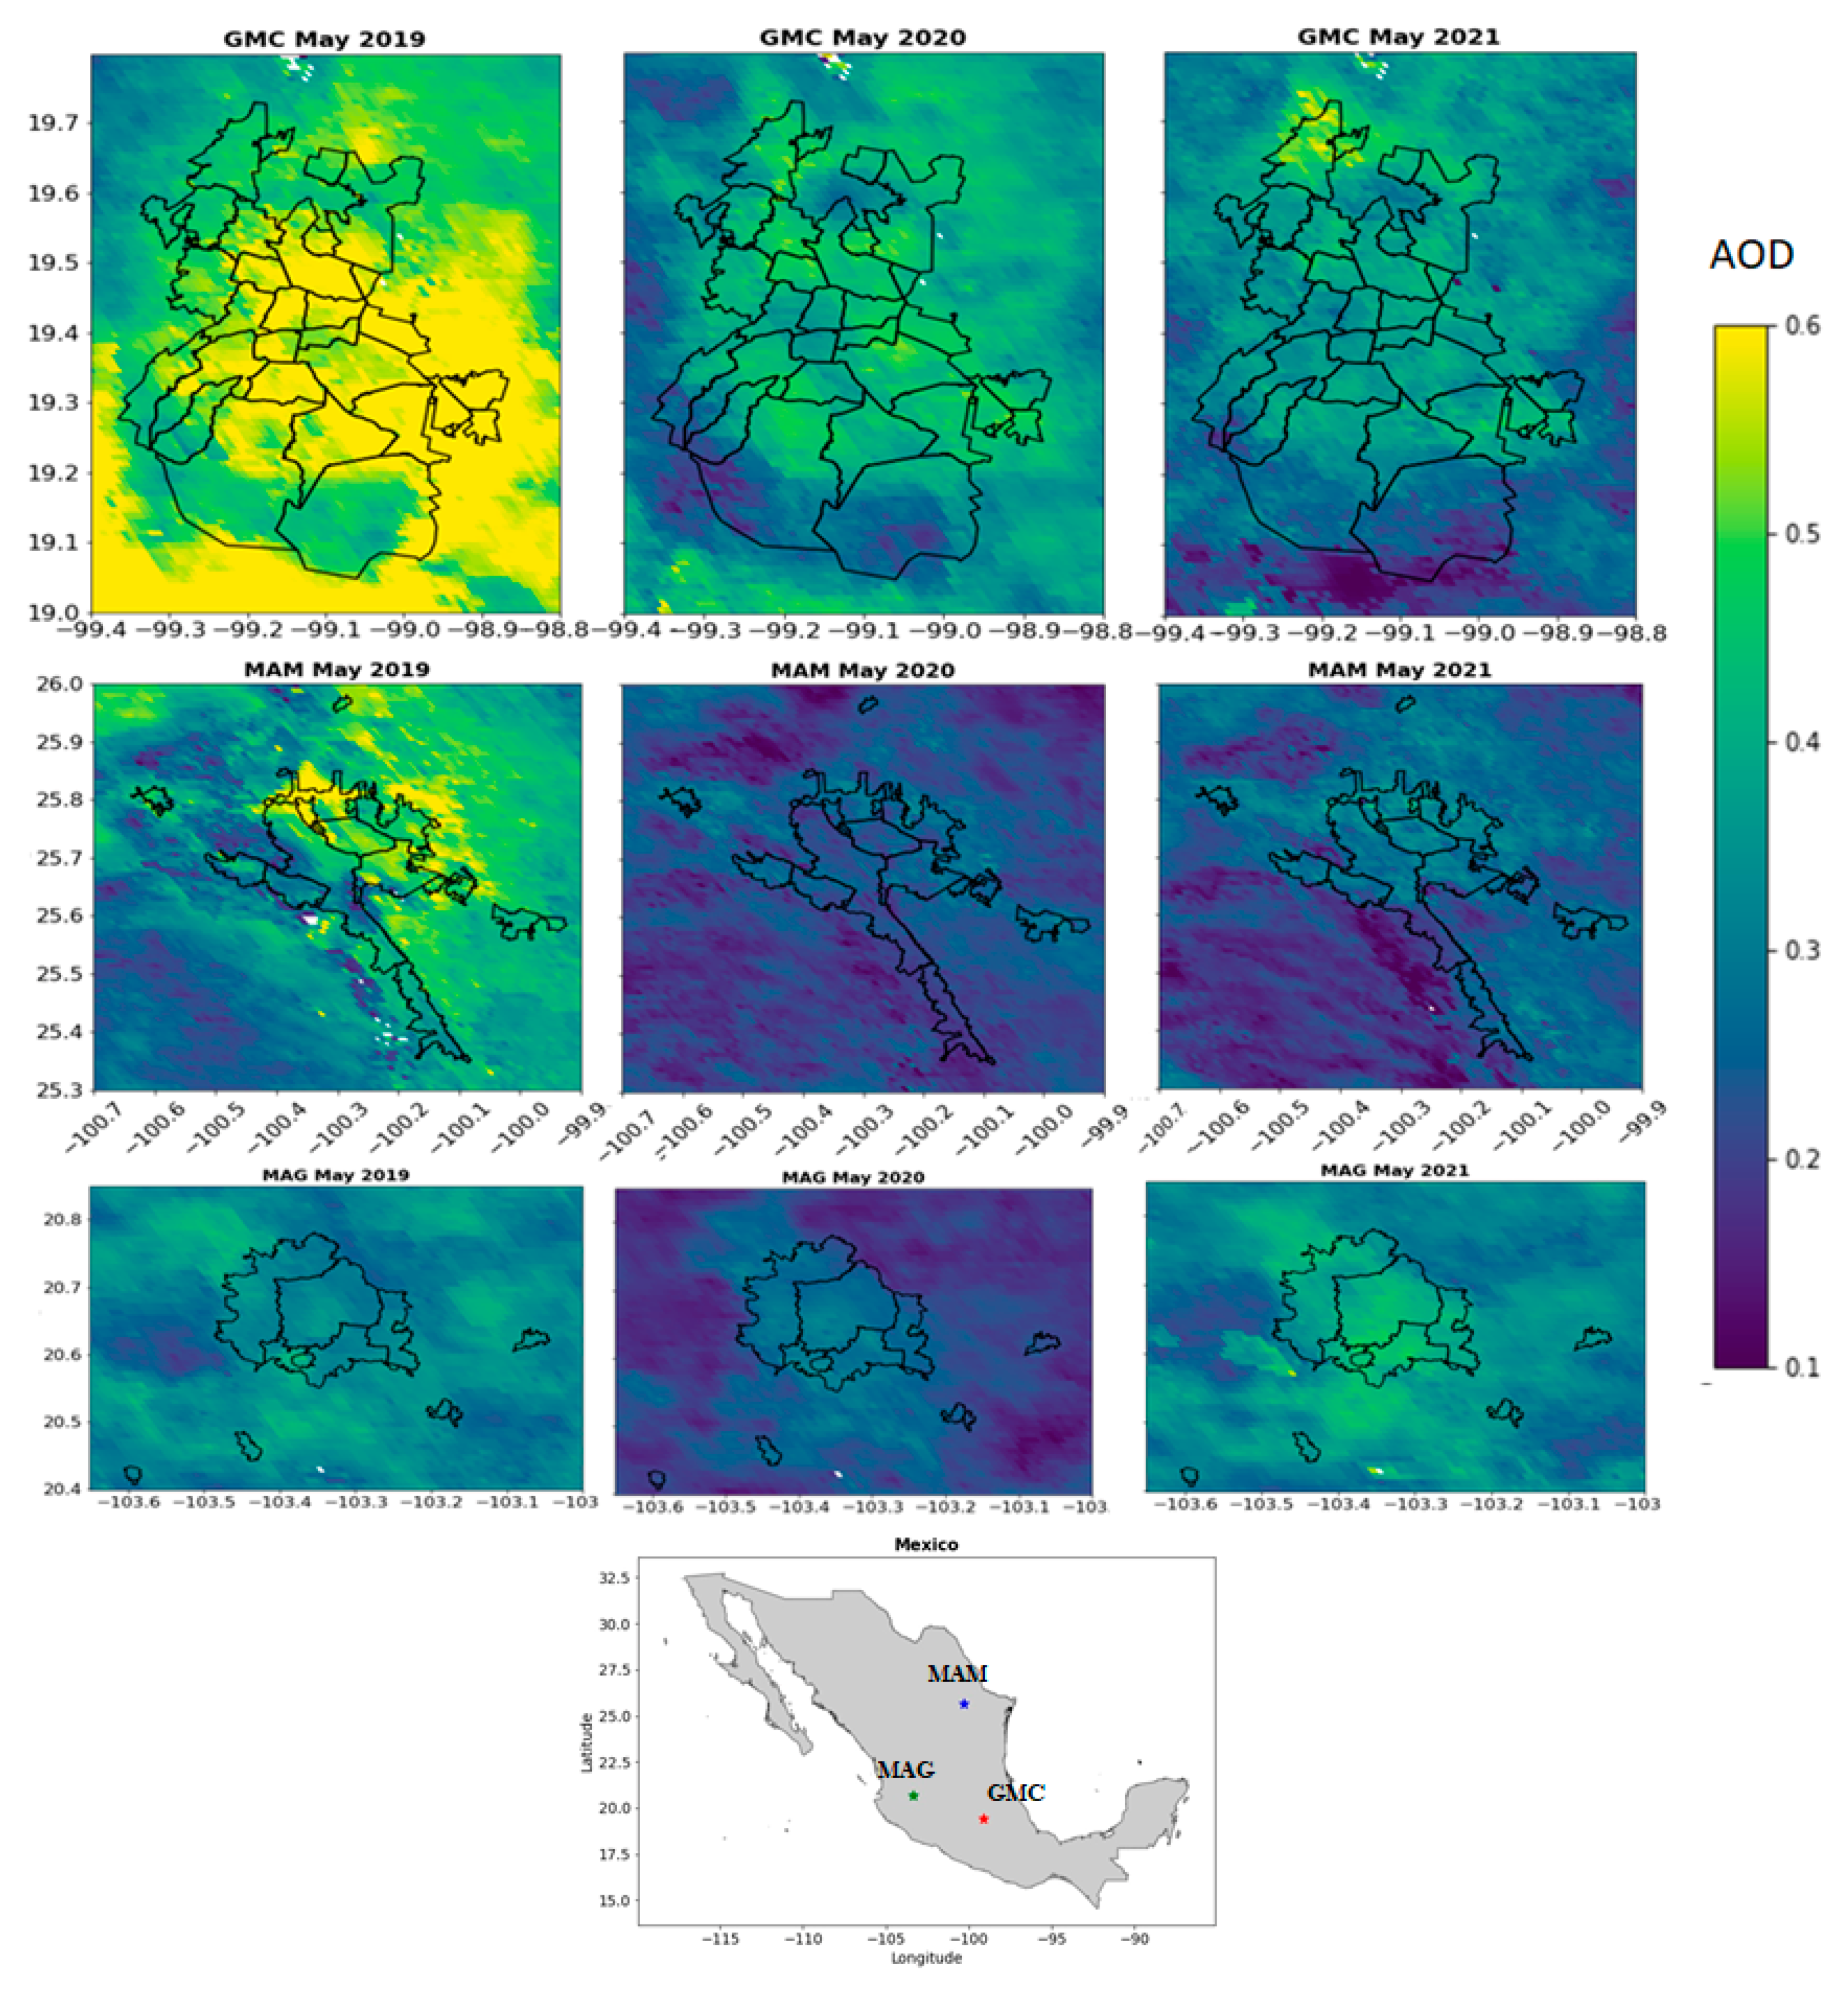
3.1. Aerosol Optical Depth (AOD)

The boxplots in Figure 3 show the distribution of AOD in Mexico City (GMC), Guadalajara (MAG), and Monterrey (MTY) in April and May 2015–2022. The spatial distribution in April and May 2019–2021 of AOD is shown in the Appendix B in Figure A1.
In Mexico City, in April 2015–2019, AOD had an increasing trend, and in 2019 the highest AOD values were measured. In contrast, in 2020, AOD dropped to the levels of 2018. In April 2021, AOD levels increased and were the highest in the period 2015–2022. In April 2022, AOD levels were similar to levels in April 2018. In May 2015–2017, an increasing trend was measured. In May 2018, high winds (higher than usual) were reported, and pollutants were dispersed across the city and AOD levels were low [29]. AOD levels in May 2020 were lower than in May 2017 and 2019. In May 2021, AOD levels were akin to levels in May 2015. In May 2022, AOD levels increased compared to the previous year.
In Guadalajara, in April and May 2020, AOD levels were the lowest measured in the period 2015–2022. In contrast, AOD levels in April and May 2021 were higher than the previous years. AOD levels in April 2022 were back to levels of previous years, such as 2018 and 2019, but in May 2022 AOD levels were on average higher than the previous year.
In Monterrey, in April 2015–2019, AOD levels had a decreasing trend, and the lowest levels were measured in April 2019. In April 2020–2022, AOD levels had an increasing trend, reaching maximum levels in April 2022. On average, AOD concentrations in May 2015–2018 decreased in Monterrey. However, in May 2019, the highest AOD levels ever were detected. AOD levels in May 2020 were low, with an increasing trend from May 2020 to 2022.

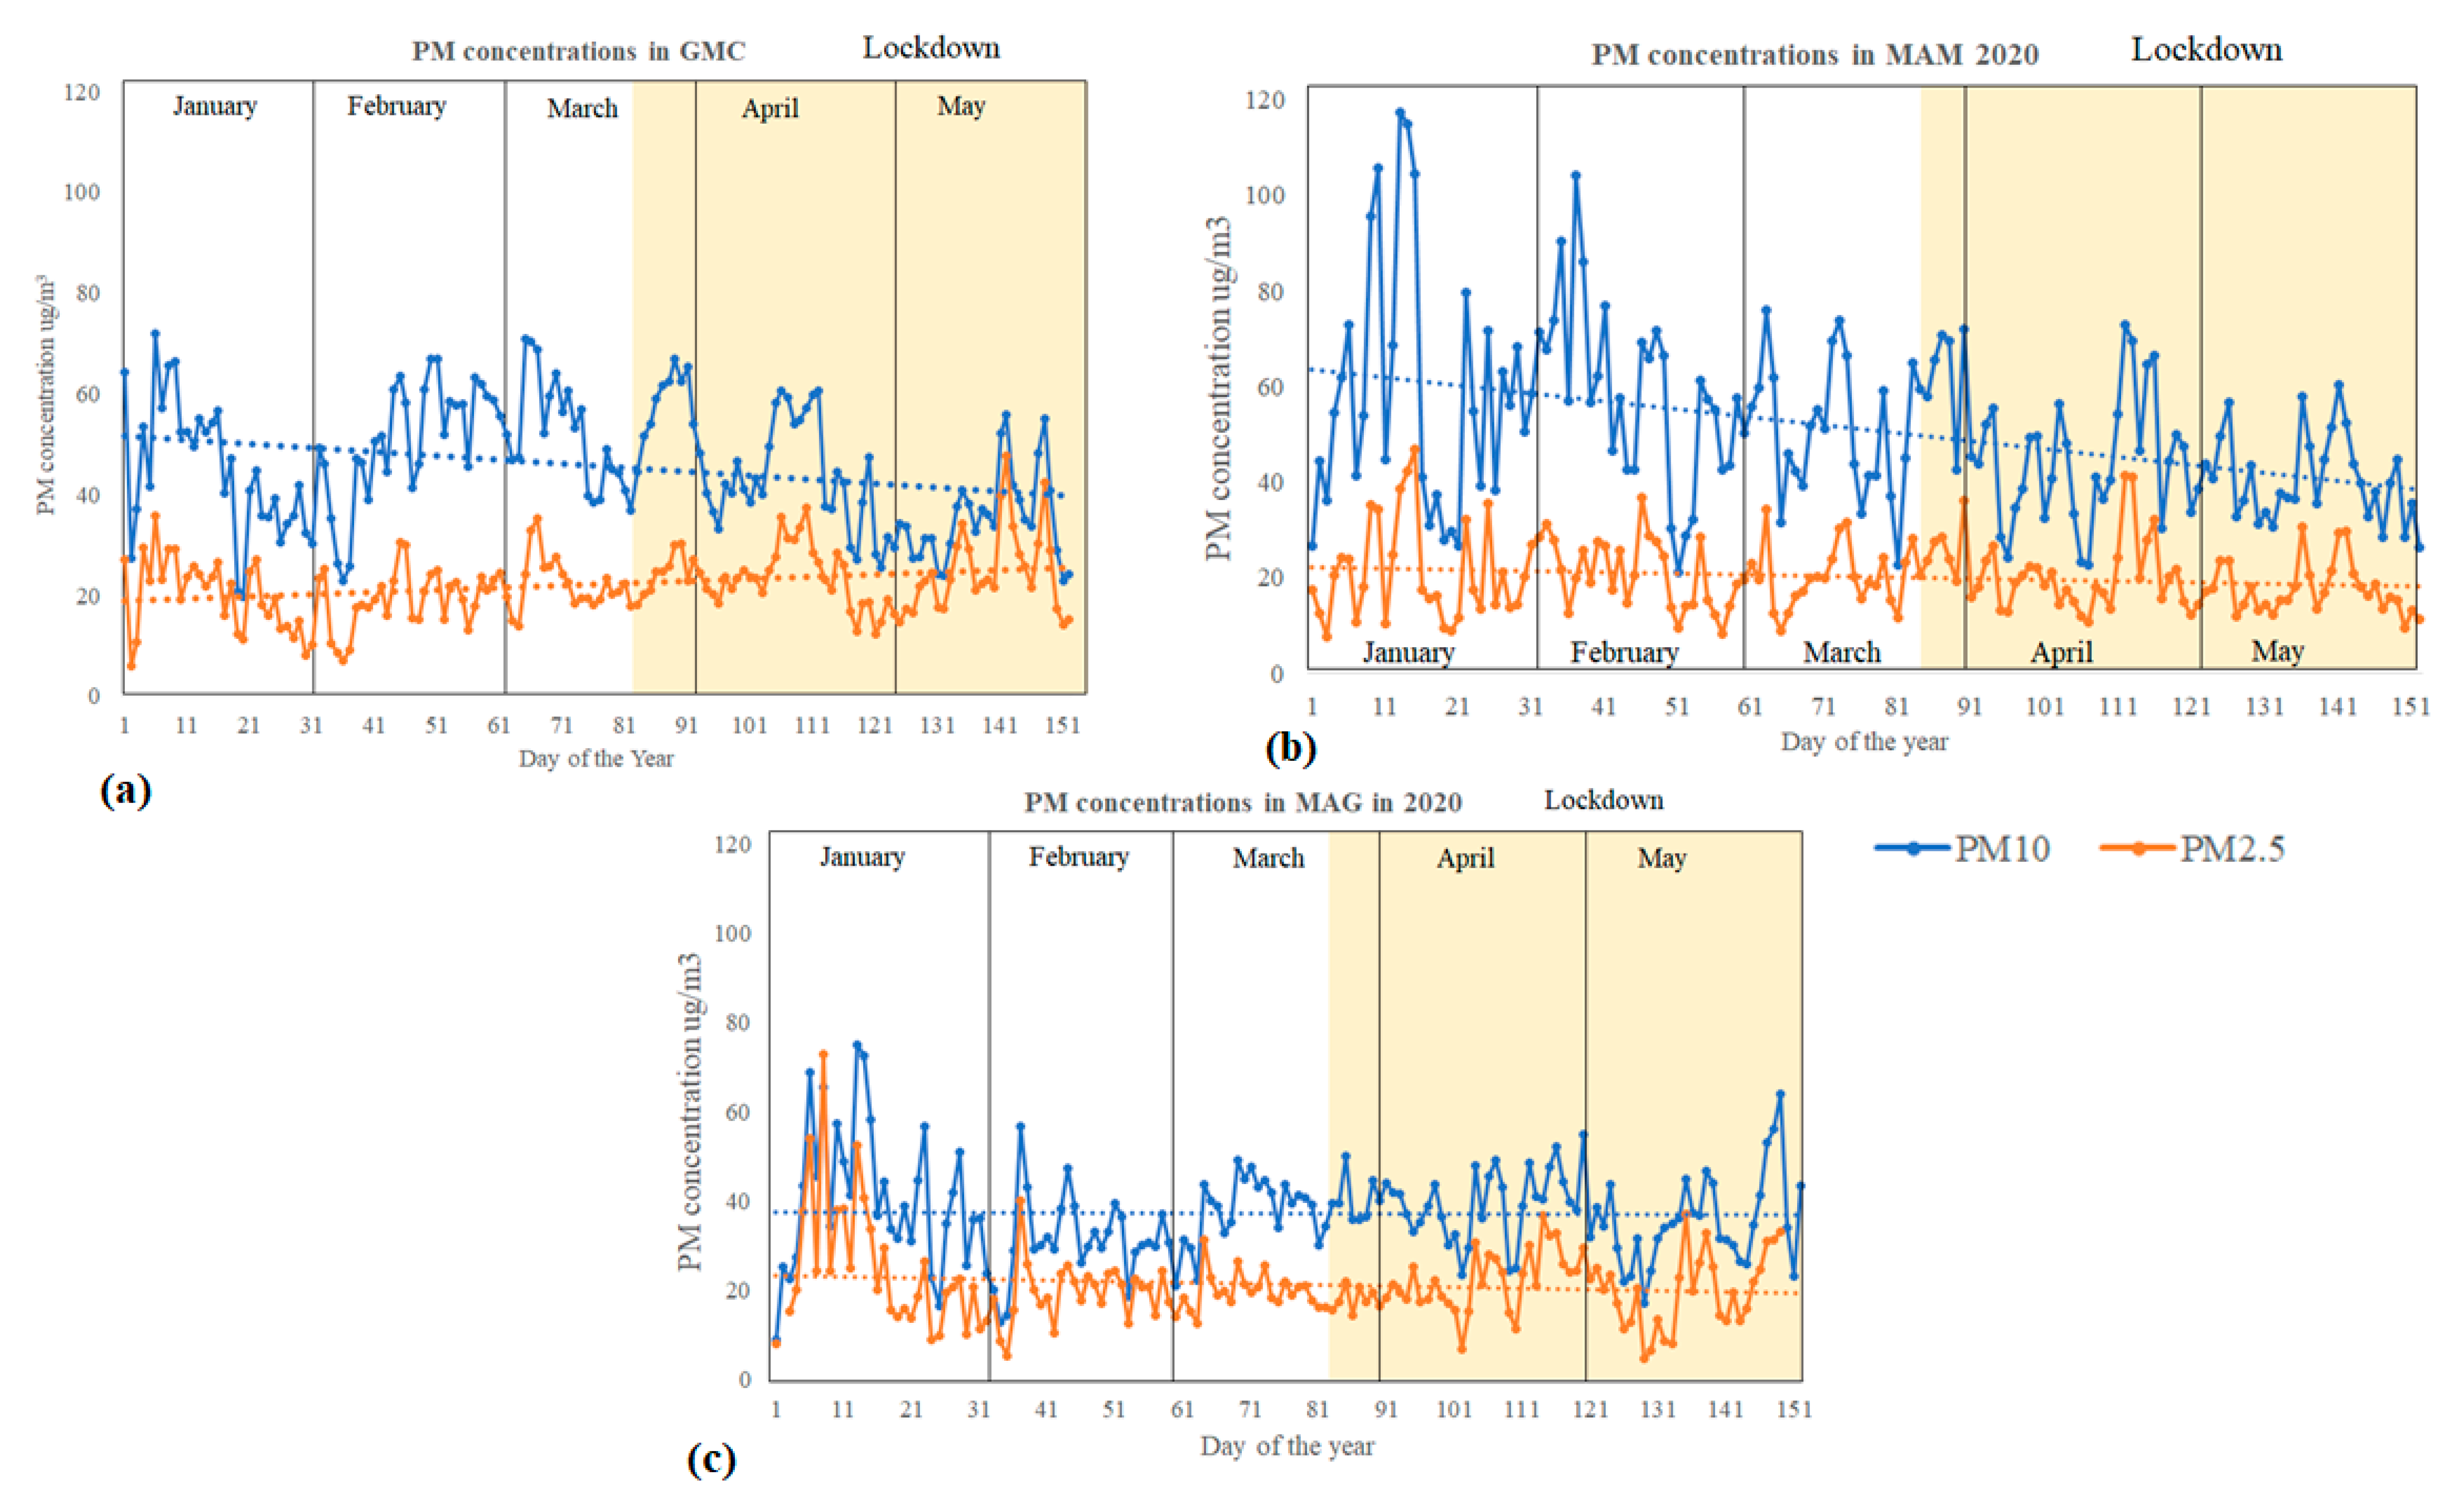
3.2. Effect of Lockdowns on PM (10 and 2.5) Concentrations

Figure 4 shows the time series of daily average PM concentrations from 1 January 2020 (Day of the Year (DOY) 1) to 31 May 2020 (DOY 152) at the three study sites.
Figure 4 shows a declining trend for PM10 in GMC and MTY and an increasing trend of PM2.5 in GMC. Furthermore, Figure 3 shows no trend for PM2.5 in MTY and no trend for PM concentrations in MAG. During the lockdown, mobility and non-essential industries were reduced, and therefore, it is assumed that less pollutants were present and a reduction in PM concentrations was expected.
The Chow test was applied to assess structural changes on the first day of the lockdown (23 March 2020) in the PM concentration time series. The results of the Chow test are shown in Table 1.
According to the results of the Chow test shown in Table 1, in Mexico City, a significant reduction of PM10 was found on 23 March 2020. Additionally, in Guadalajara, a significant reduction of PM2.5 was found on the same date. However, in Monterrey, no reduction was found at that time. Moreover, an inflection point was found at DOY 41 (10 February 2020) with data from Monterrey, which implies an effect on PM concentrations by a source different to mobility restrictions.

3.2.1. PM10 Mean Concentrations’ Comparison

The Mann–Whitney non-parametric test was used to assess particulate matter (10 and 2.5) concentration differences in April and May 2020 and 2021 compared to the average PM concentrations of the previous five years. The percentage changes in PM10 concentrations at stations around the three study sites are shown in Table 2.
In April 2020, most stations in the three agglomerations reported decreased PM10 concentrations compared to the average of the five previous years, except for stations CUA (GMC) and ATE (MAG) that reported no significant changes. Both stations are located near residential areas with green areas, and therefore, in those stations, PM10 is more likely from natural sources rather than anthropogenic sources. The comparison of the PM10 levels in April 2021 with average levels in April 2015–2019 yielded decreased concentrations in most stations except for ACO, FAC, and UIZ in GMC, SE and CE (increased) in MMA, BJU in GMC, and SO, NTE, NE2, and SE2 in MMA (no significant change).
In May 2020, PM10 concentrations decreased in the three metropolitan areas except for station CUA in Mexico City, where no significant change was detected in comparison to average levels from May 2015 to 2019. PM10 concentrations in May 2021 were lower than the average in May 2015–2019 before the pandemic in all stations in Mexico City. Stations FAC, SE, CE, NTE, and SE2 reported similar PM10 levels in May 2021 to pre-pandemic levels. PM10 in the three urban agglomerations is usually associated with anthropogenic sources such as road abrasion, land operations in rural areas [30], and dry soils [31].
Considering the changes in all stations in Mexico City, there was a decrease of 14.29% in PM10 concentrations during April 2020 and 3% in April 2021, in comparison to the previous five-year average. In May 2020, PM10 concentrations decreased by 27.5% and 23.94% in May 2021, compared to the average in May 2015–2019. In Monterrey, in April 2020, PM10 concentrations decreased by 33.62% and increased by 2.76% in April 2021 compared to the average in April 2015–2019. In May, PM10 decreased by 36.63% and 9.70% in 2020 and 2021, respectively, in comparison to the average in May 2015–2019. In Guadalajara, PM10 concentrations decreased by 8.18% in April 2020 and 19.58% in May 2020 compared to the previous five-year average.

3.2.2. PM2.5 Mean Concentration Comparison

The percentage changes in PM2.5 concentrations around GMC, MTY, and MAG are shown in Table 3.
As shown in Table 3, only stations BJU and NEZ reported an average increase of 13.81% and 18.85%, respectively, in PM2.5 concentration during April 2020 (strictest lockdown), in comparison to the average concentration of the previous five years. The biggest decrease of PM2.5 concentrations in Greater Mexico City in April was measured at station TLA in Tlalnepantla, where an industrial park is located. The lowest decrease (6.87%) was detected at station CCA at the National Autonomous University’s campus. In Monterrey, the concentration at station CE increased during 2020. This station is in the city center with many important avenues nearby. Therefore, the increase can be attributed to local sources of PM2.5.
Comparing PM2.5 concentrations during 2021 with the average PM2.5 concentration during 2015–2019 showed a decrease of concentration in most stations in Mexico City and an increase in most stations in Monterrey. Urban stations BJU and NEZ in Mexico City reported an increase of 10.86% and 12.59%, respectively, during April 2021. In Monterrey, only stations NO and NE2 reported a decrease of the PM2.5 concentration in April 2021, compared to the average PM2.5 concentration in April 2015–2019.
In May 2020, all stations reported a decrease in PM2.5 concentrations except for stations BJU (no significant change) and NEZ (16.8% increase) in Mexico City. Therefore, the mobility restrictions enacted to prevent the spread of COVID-19 helped to reduce the overall PM2.5 concentrations in the three agglomerations.
In May 2021, compared to the average concentrations from May 2015 to 2019, PM2.5 concentrations were significantly reduced in Mexico City and Monterrey, except for station BJU in Mexico City that did not have a significant change and station NEZ in Mexico City, whose PM2.5 concentration increased by 13.82%. The fewer restrictions still enacted during May 2021 caused a generalized decrease in PM2.5 concentrations in the three major Mexican agglomerations.
In general, considering all stations in Mexico City, PM2.5 decreased by 13.79% in April 2020 and by 8.34% in April 2021 compared to the average in April 2015–2019. In May 2020, the PM2.5 concentration in Mexico City decreased by 12.82% and in May 2021 decreased by 23.20% compared to the average in May 2015–2019. Considering all stations in Monterrey, the PM2.5 concentration decreased by 9.11% in April 2020 and increased by 11.07% in April 2021, in comparison to the average in April 2015–2019. In May 2020, the PM2.5 concentration decreased by 38.32%, and in May 2021 it decreased by 35.26%, in comparison to the average in May 2015–2019. In Guadalajara, the PM2.5 concentration decreased by 3.16% and 27.84% in April and May 2020, respectively. An explanation of these findings can be found in the Section 4.

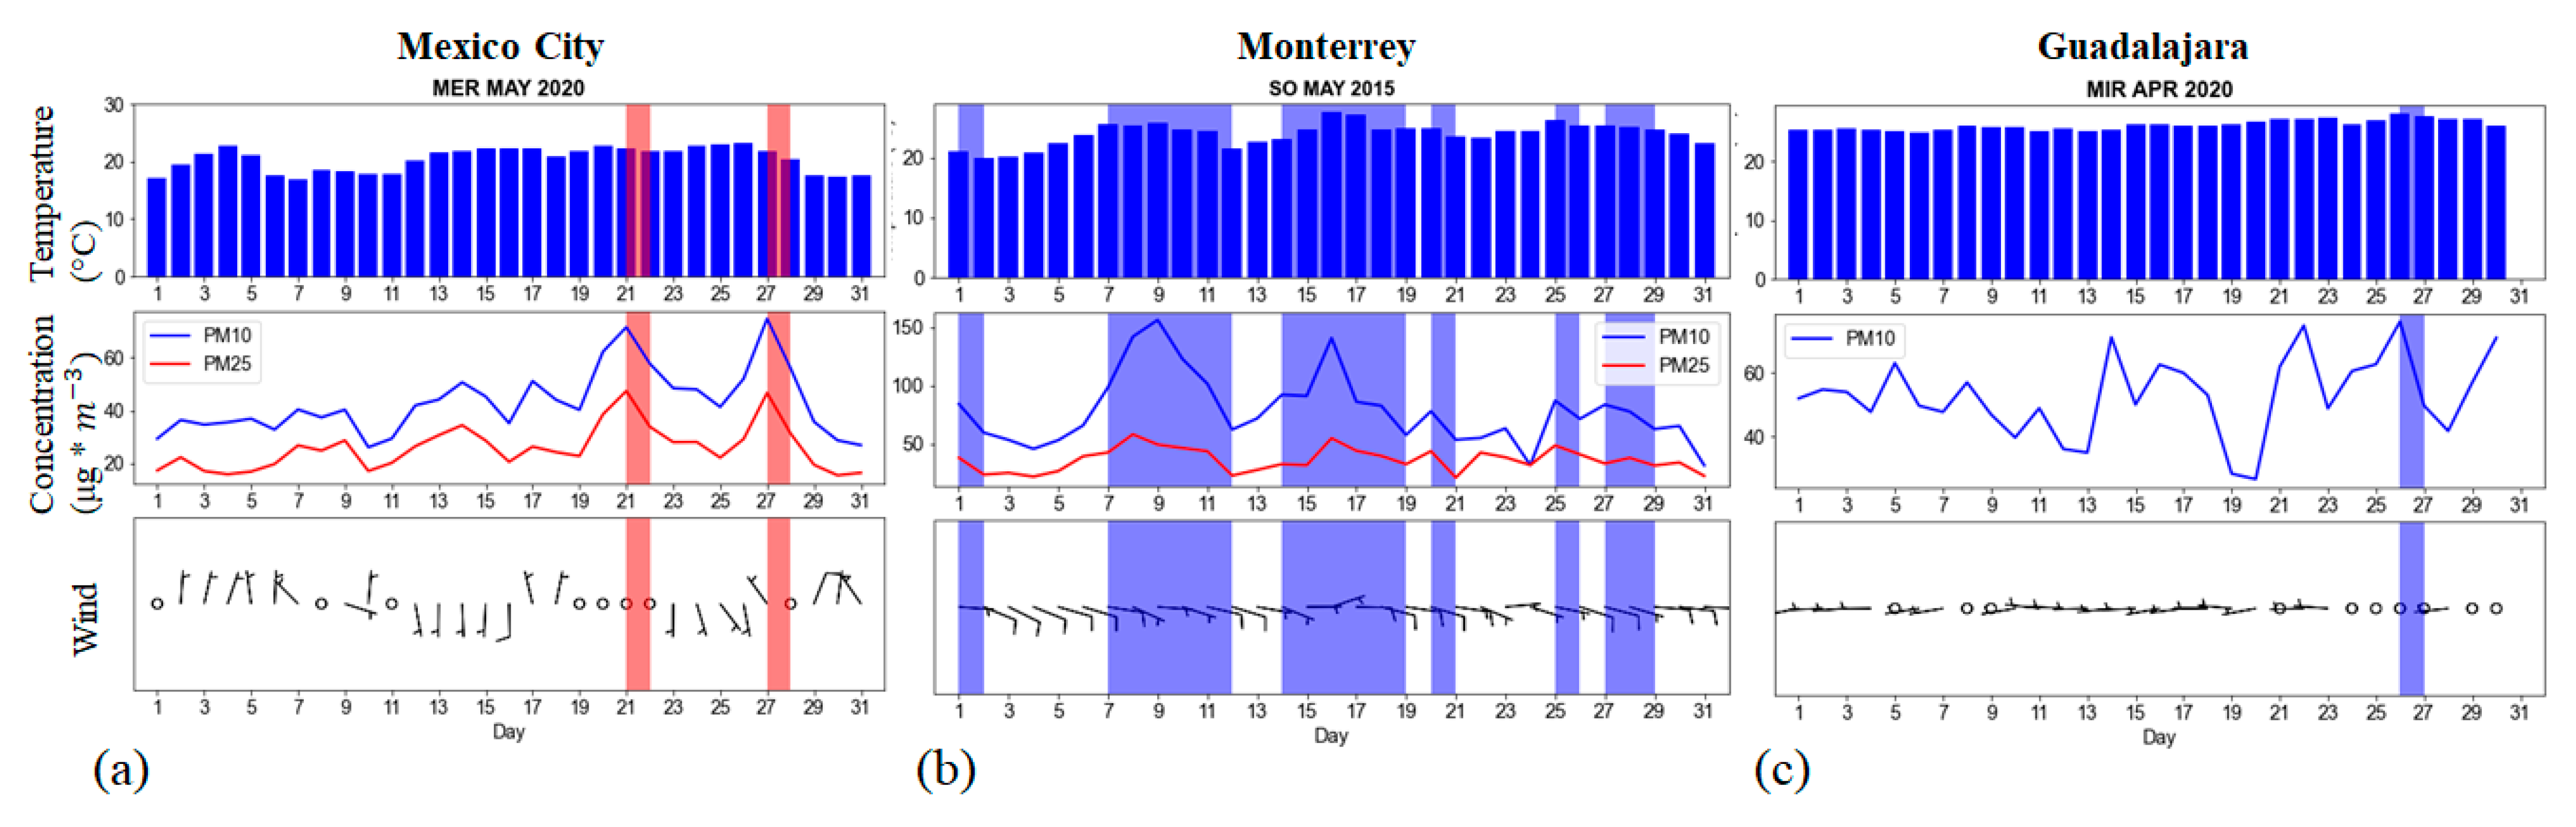
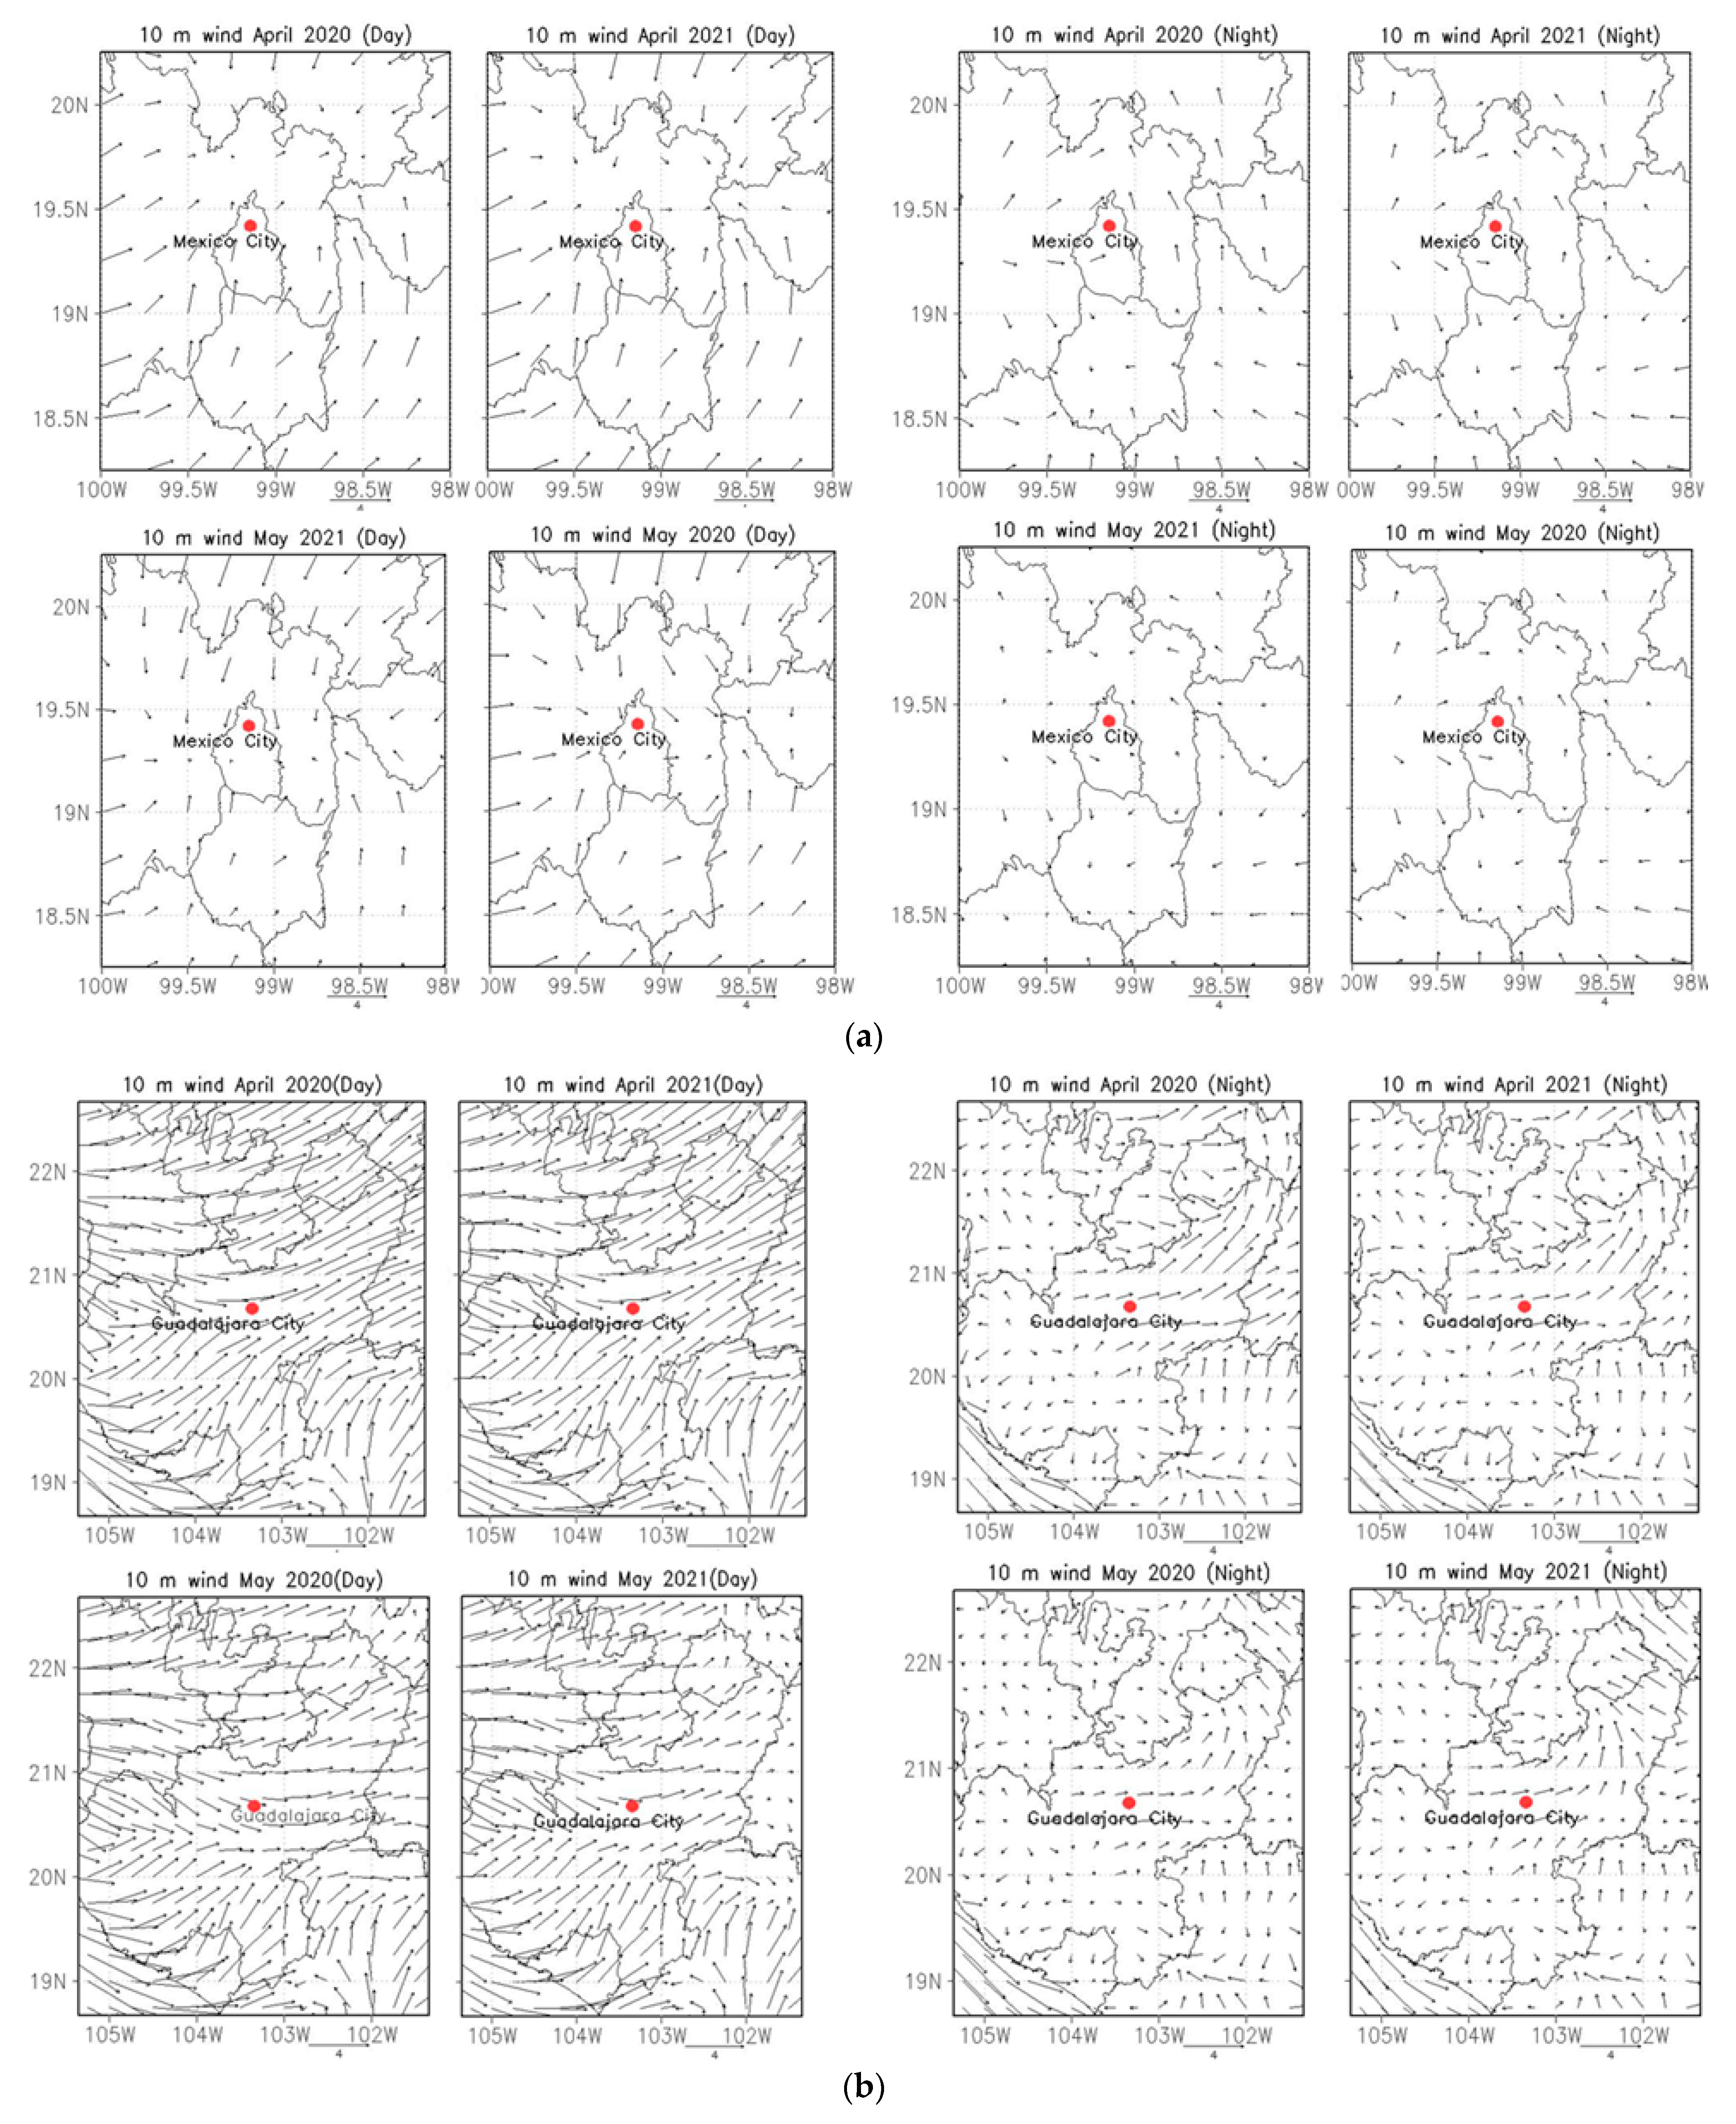
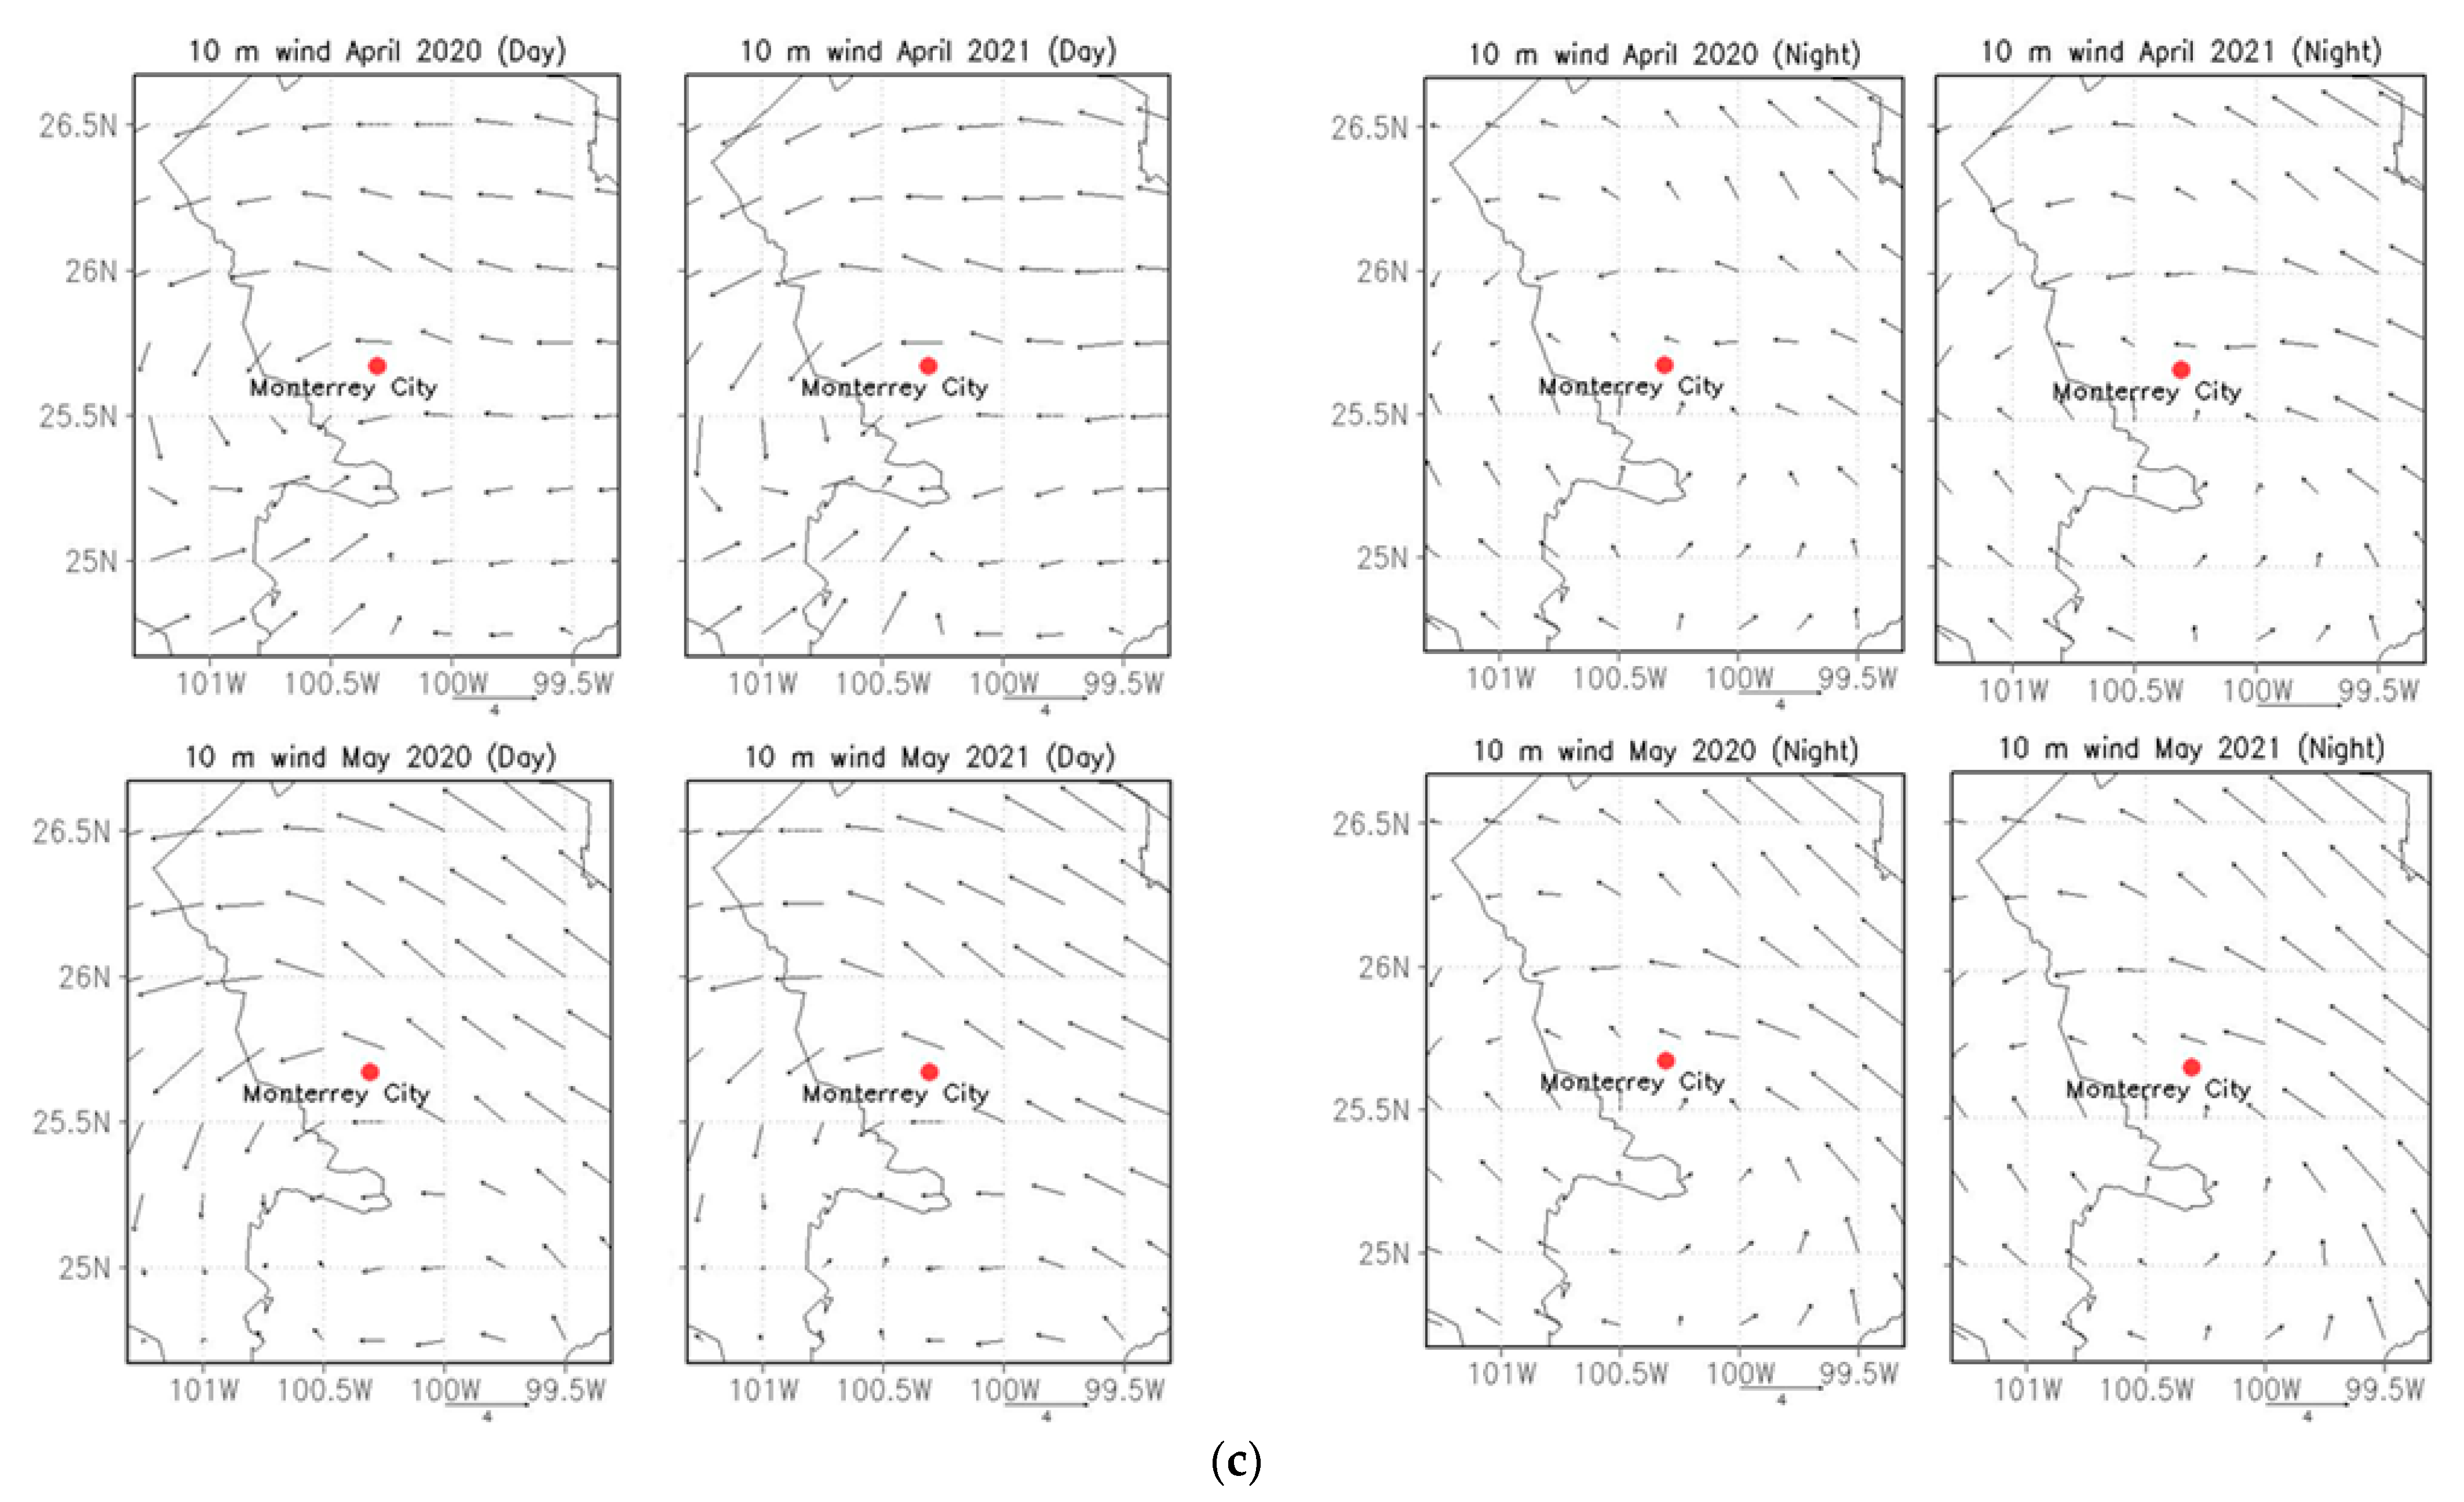
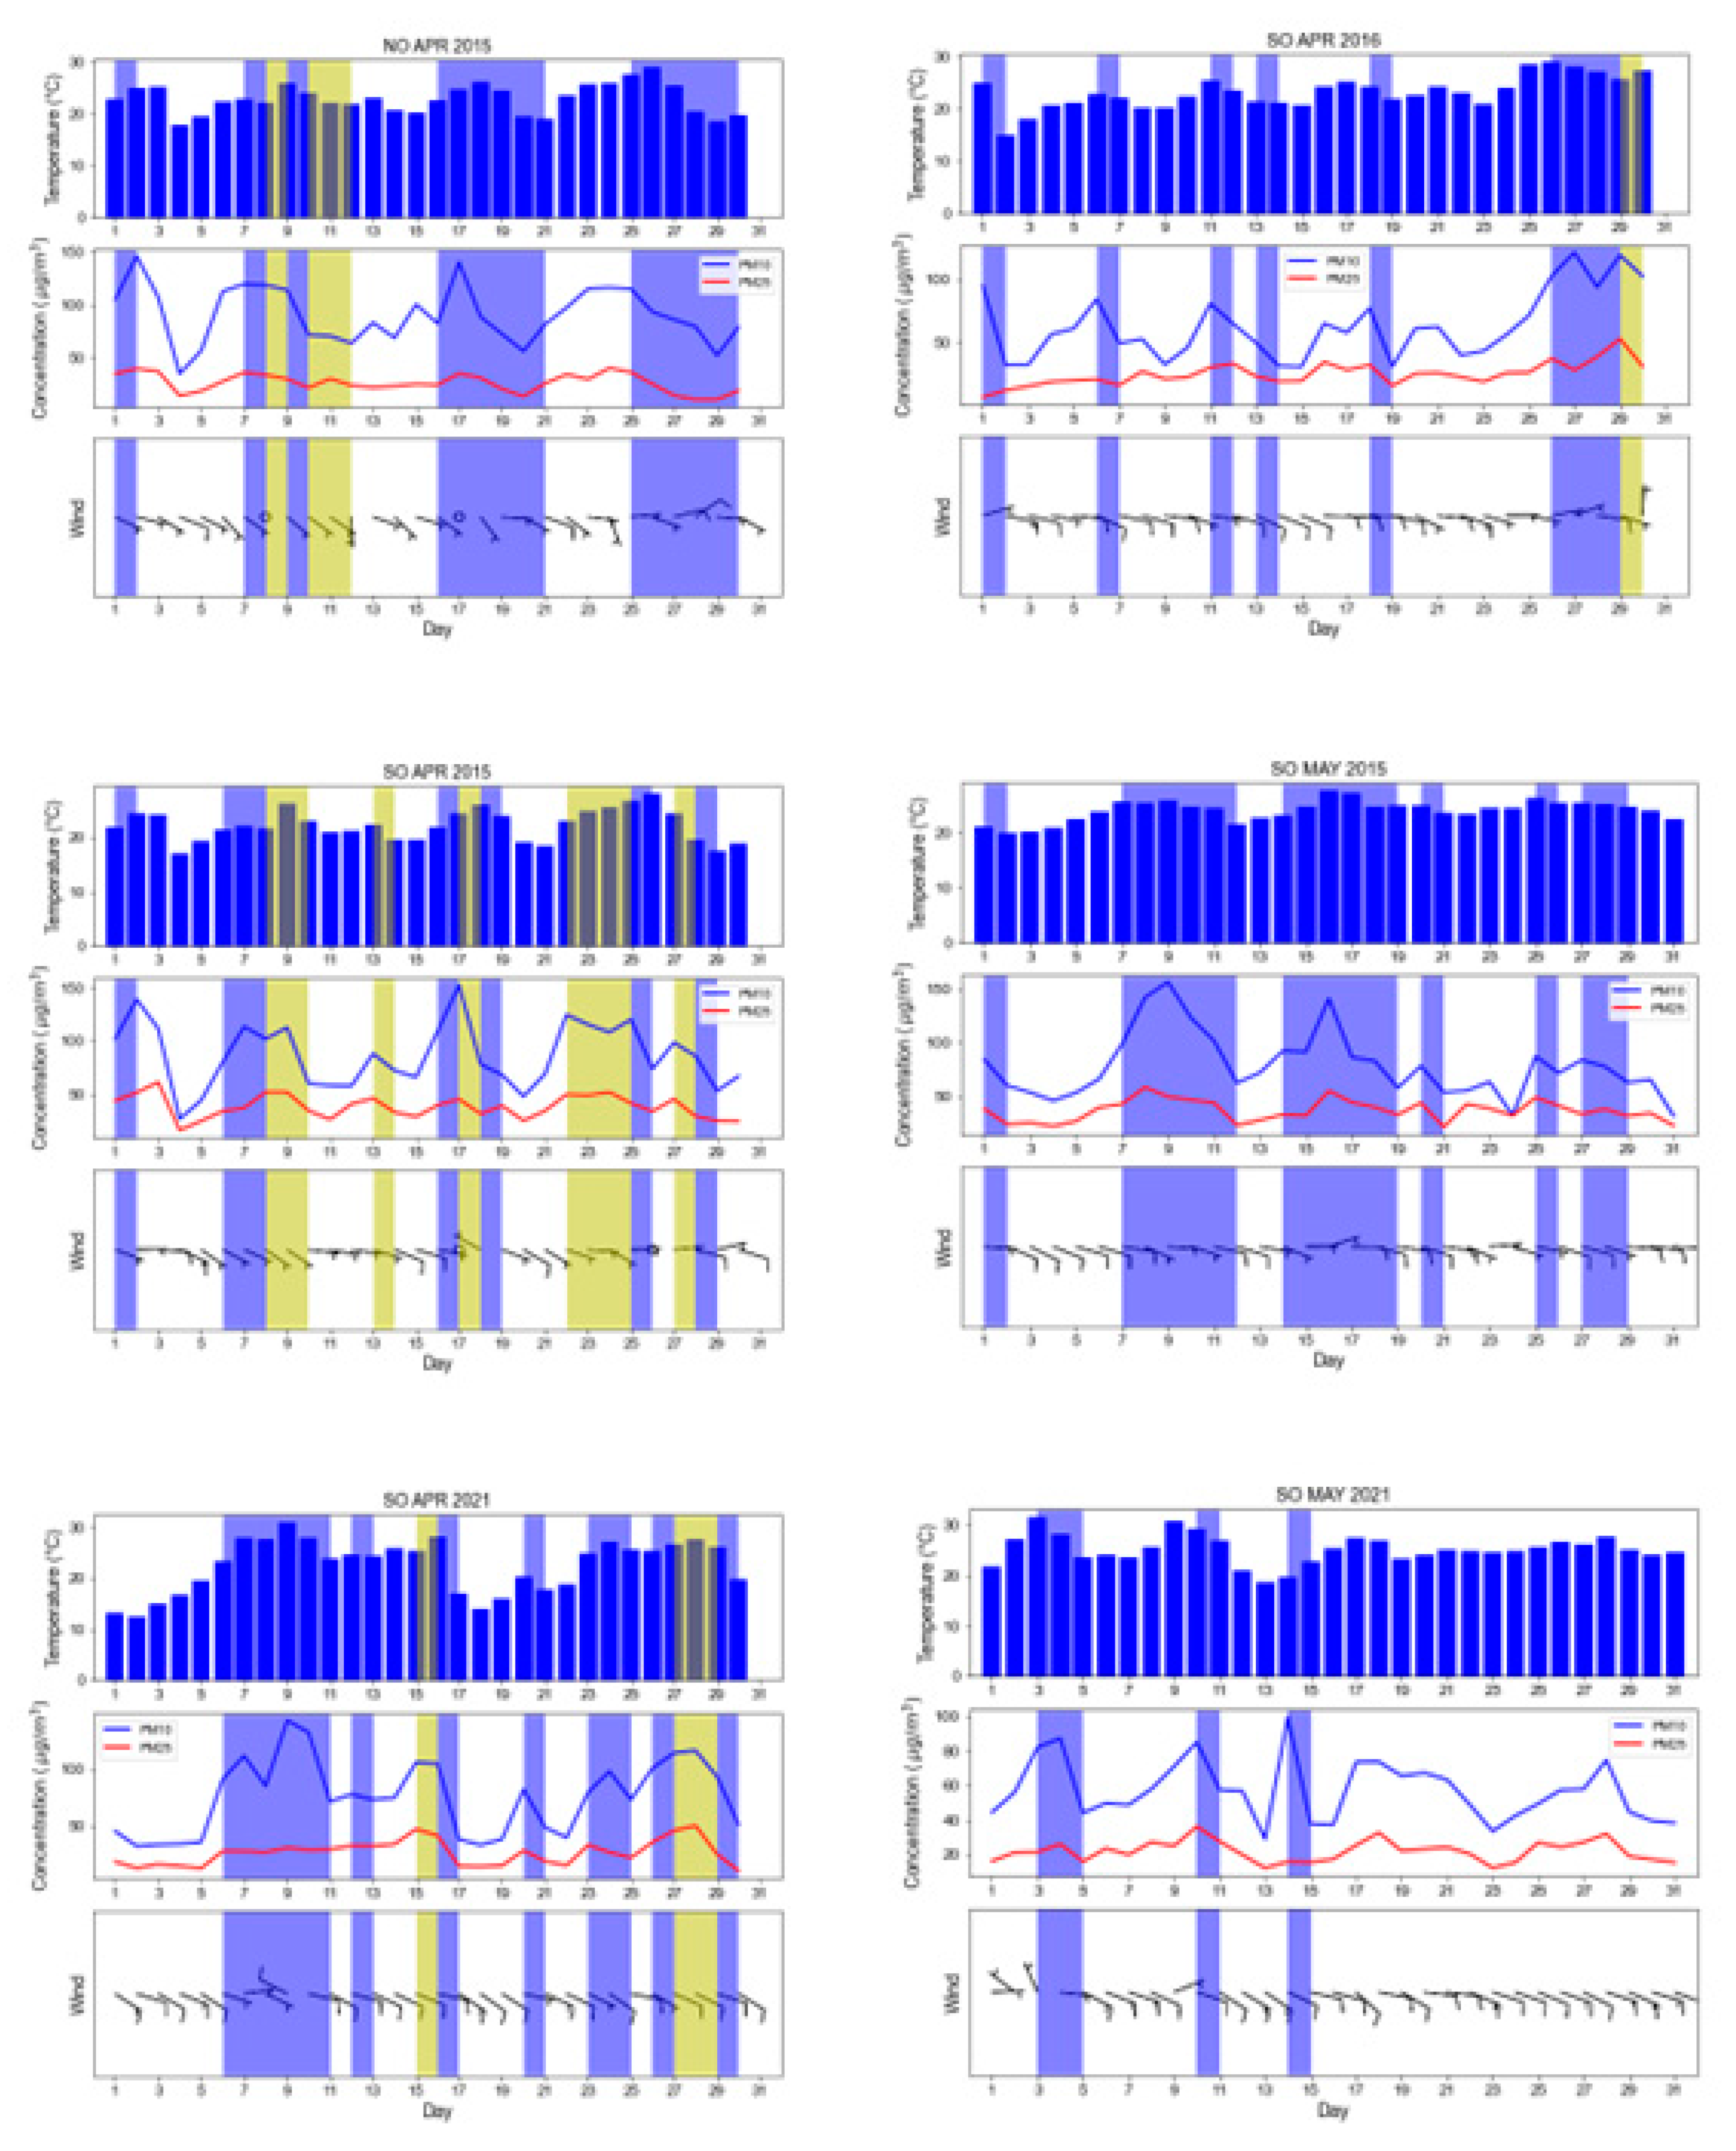
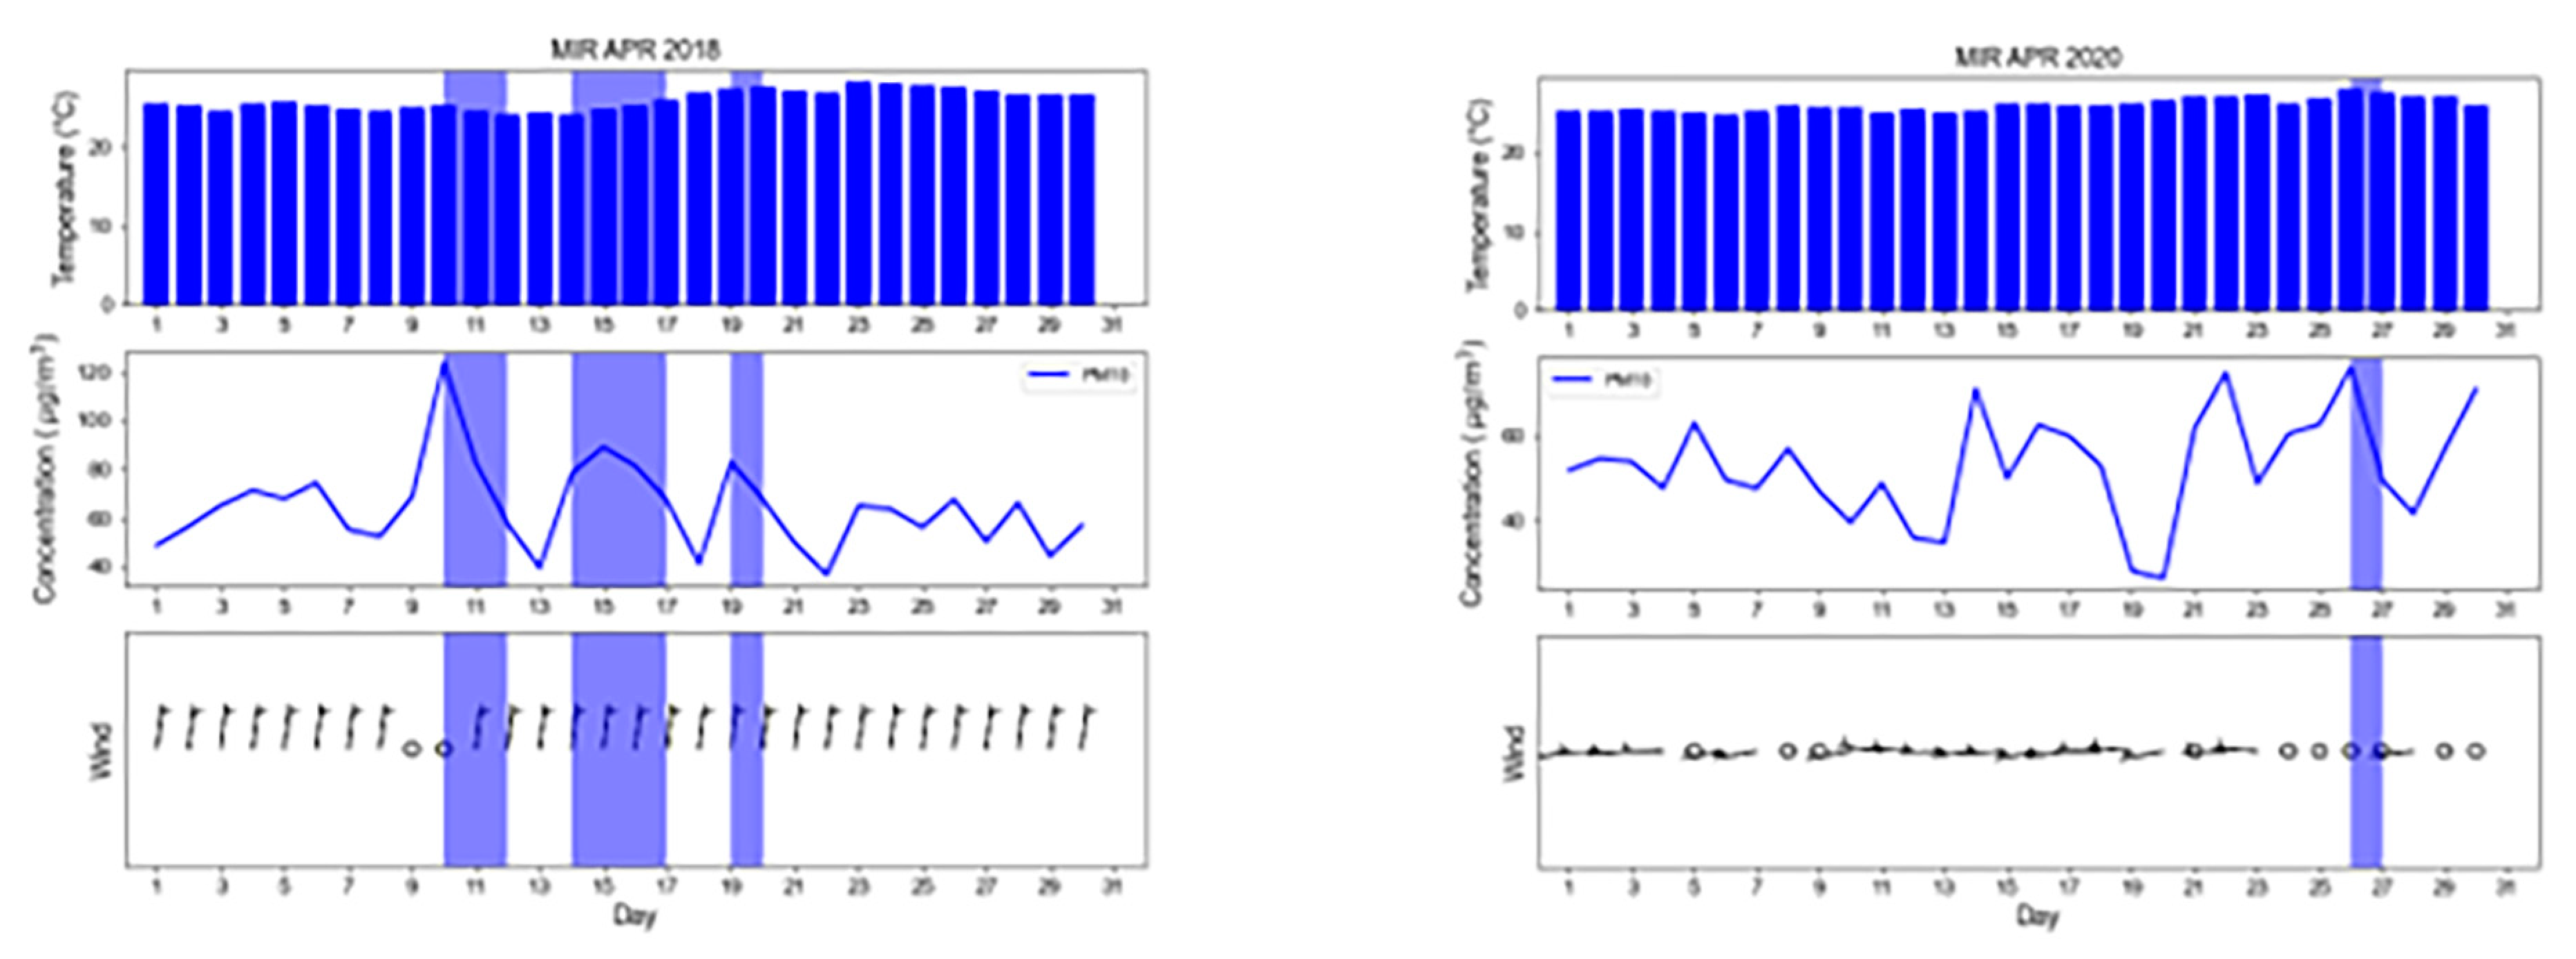
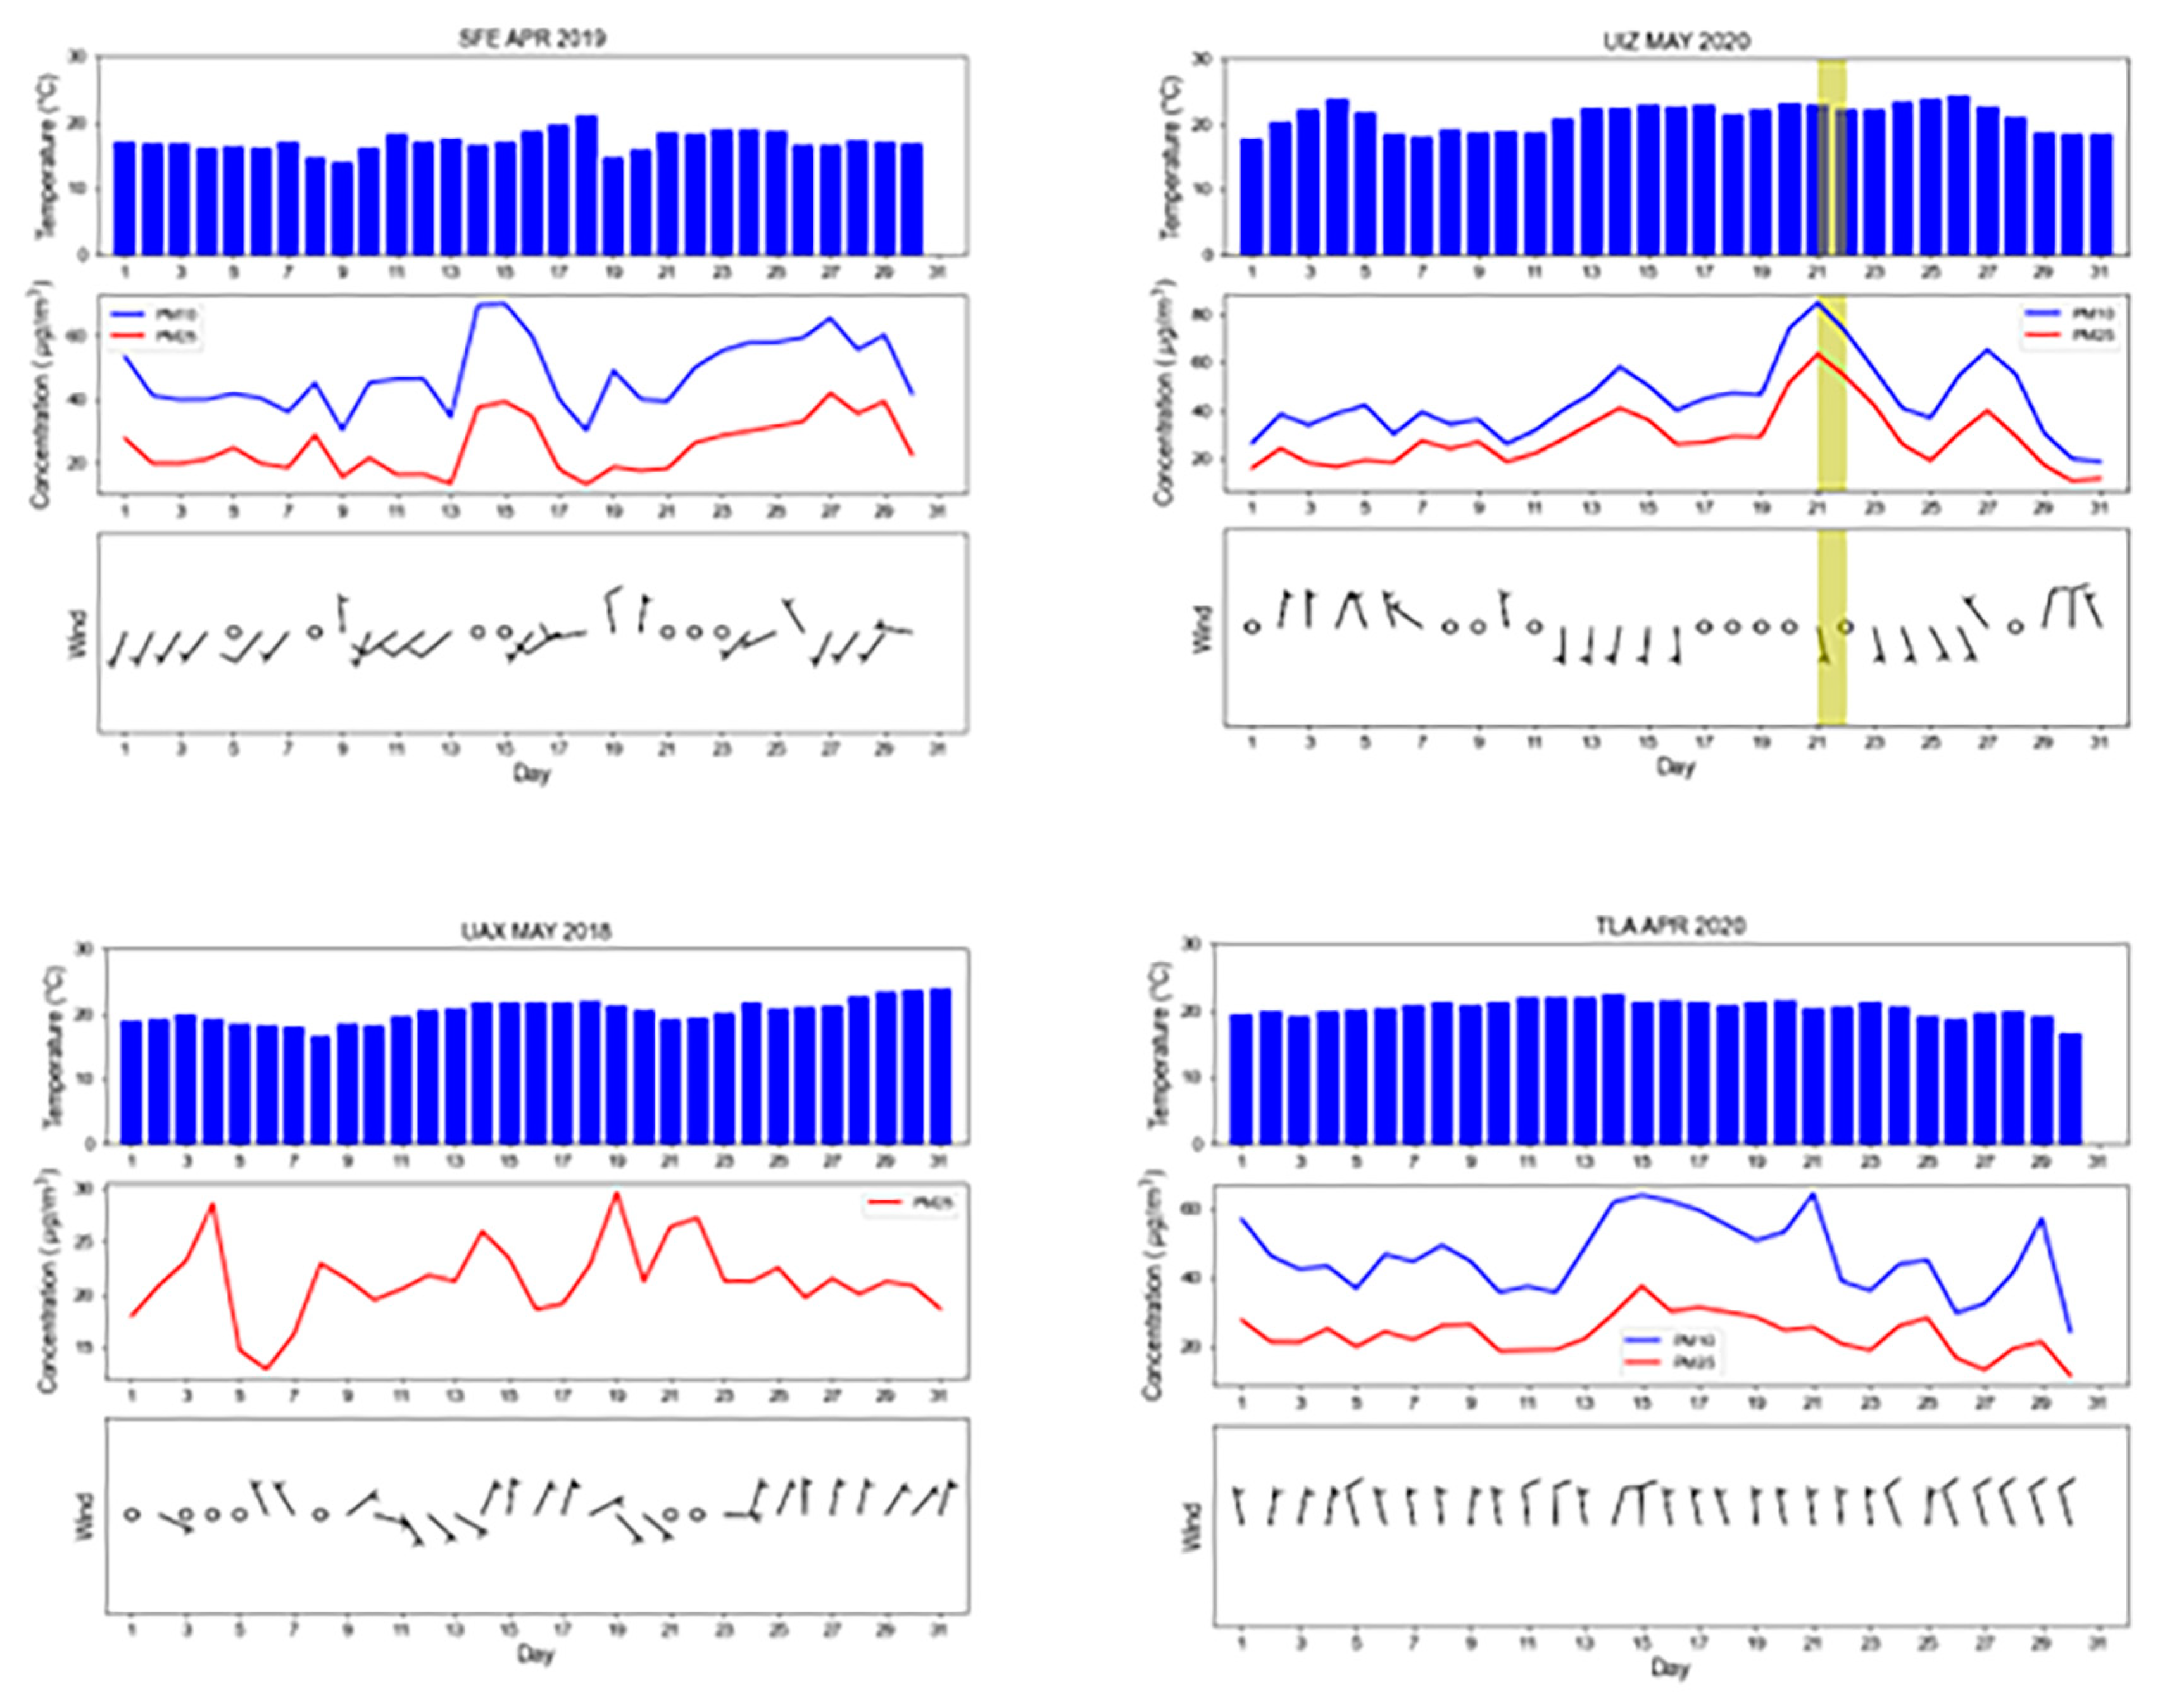
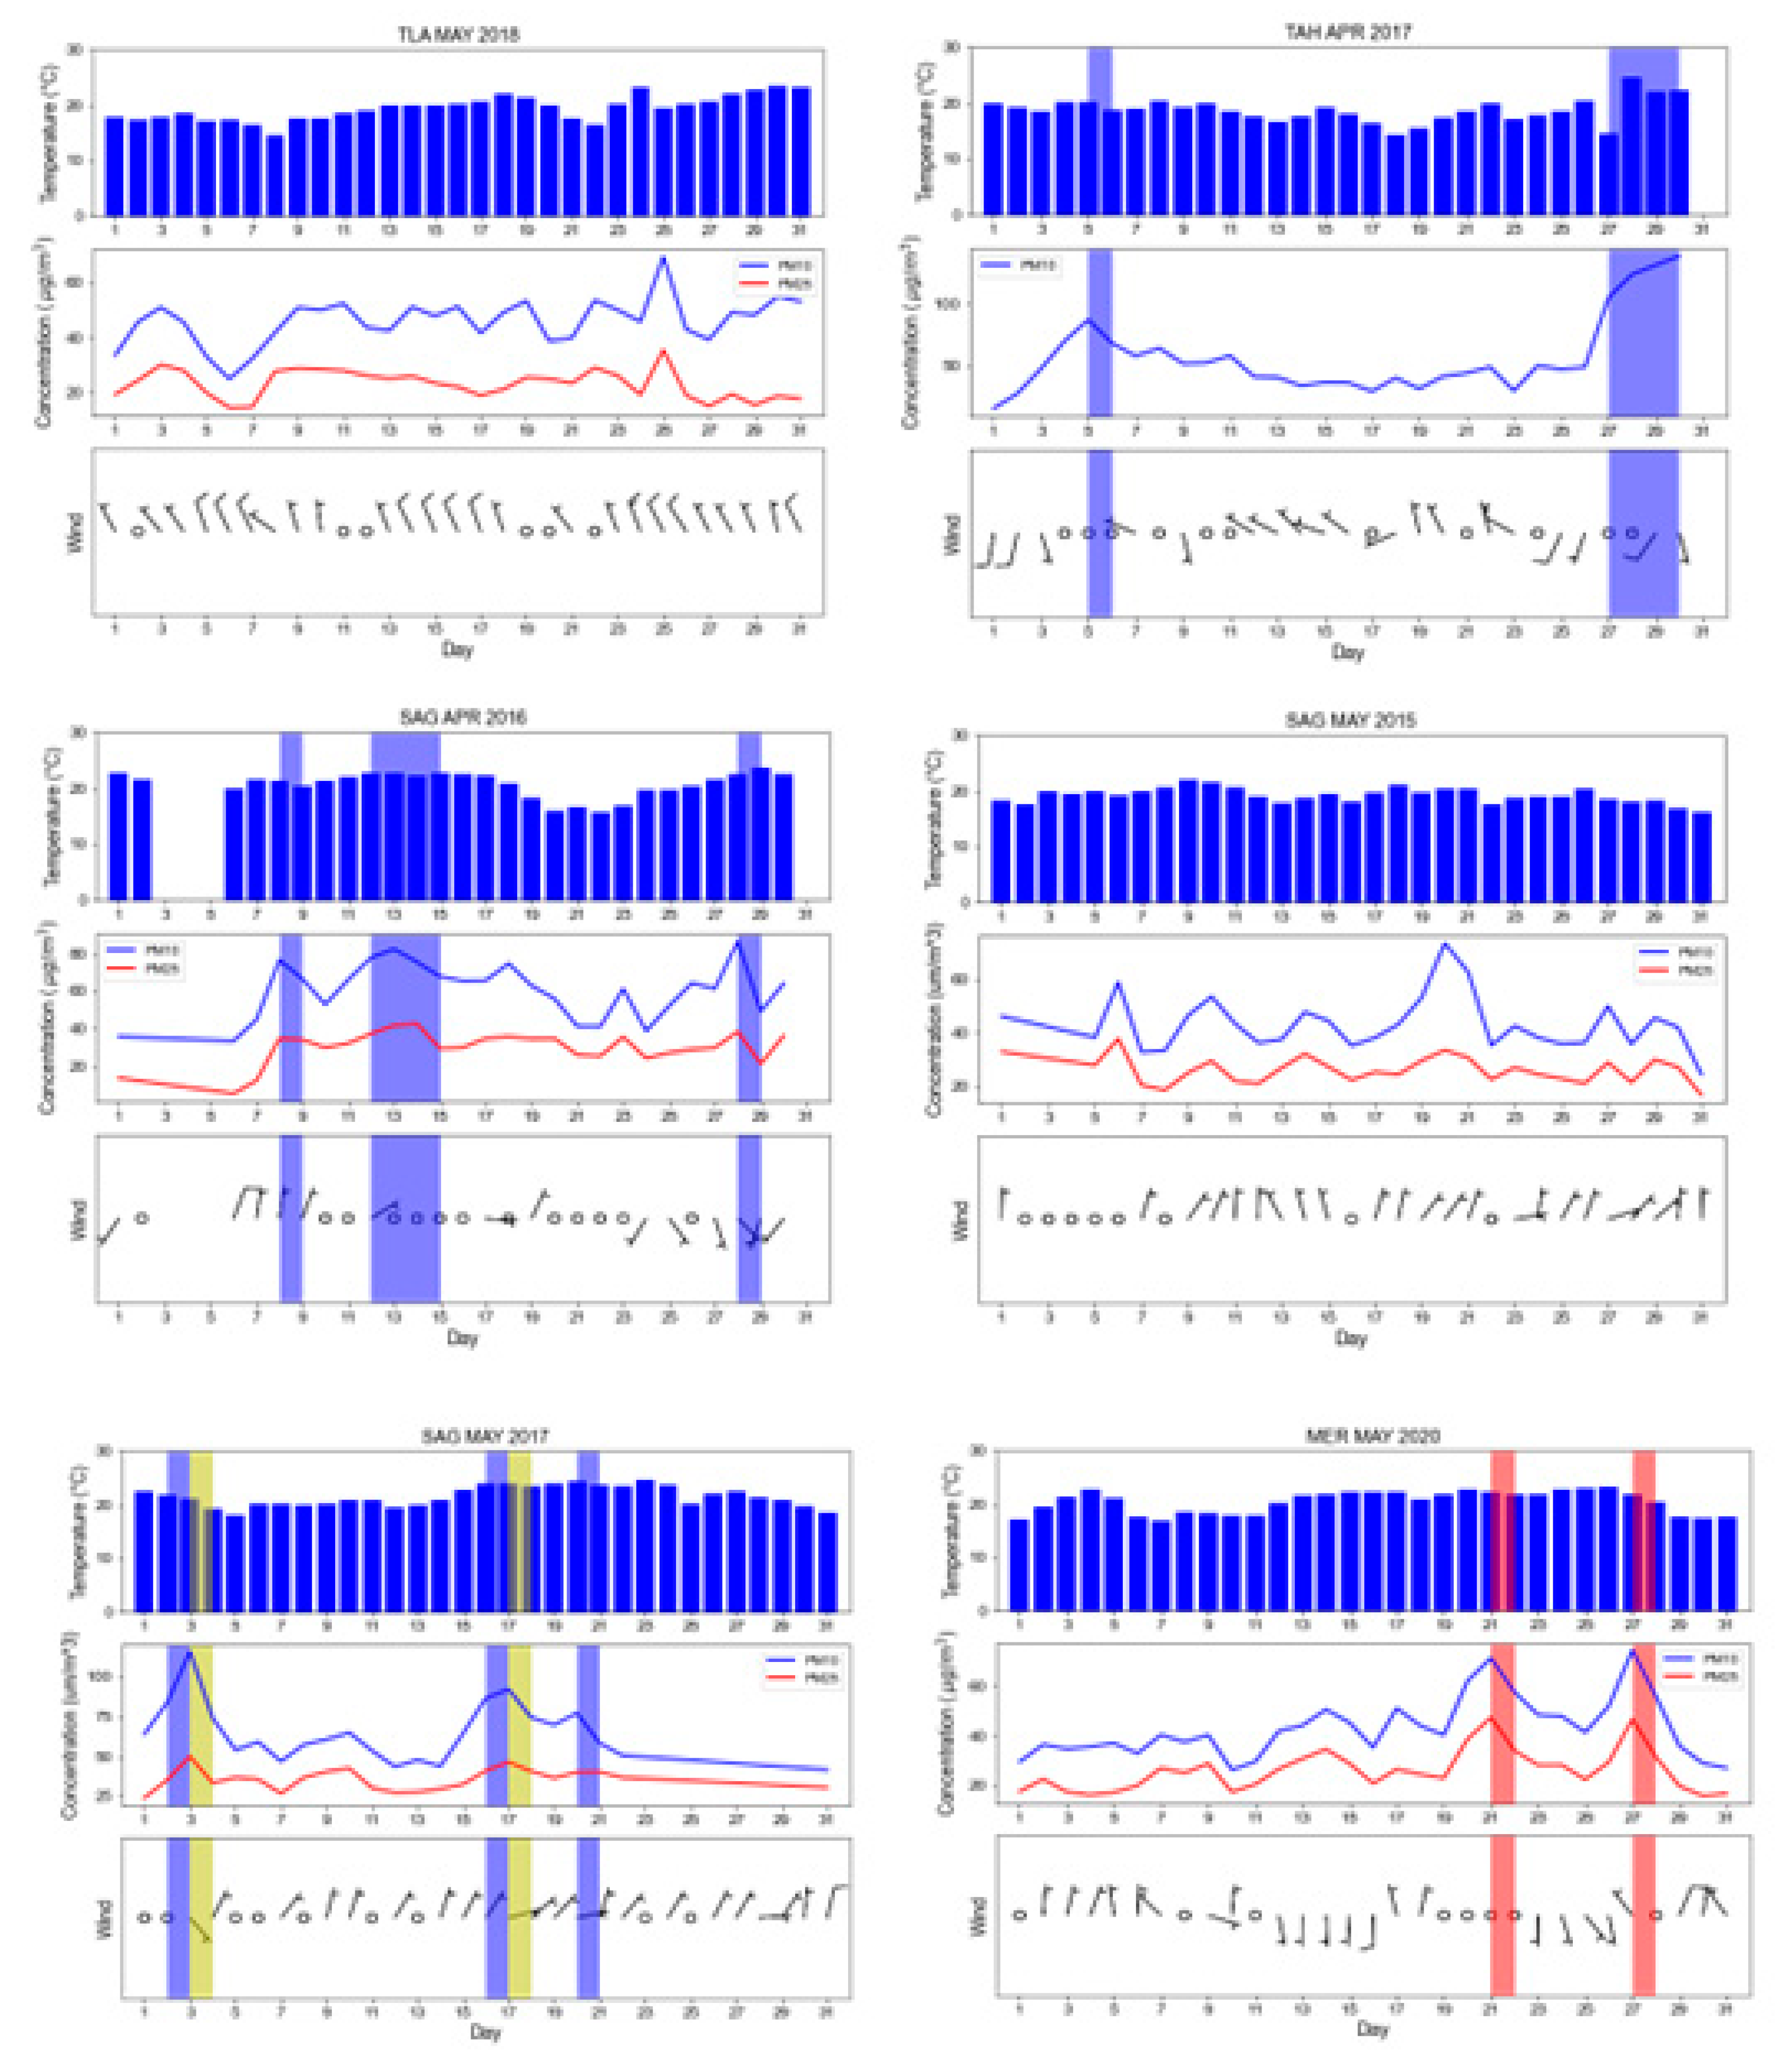
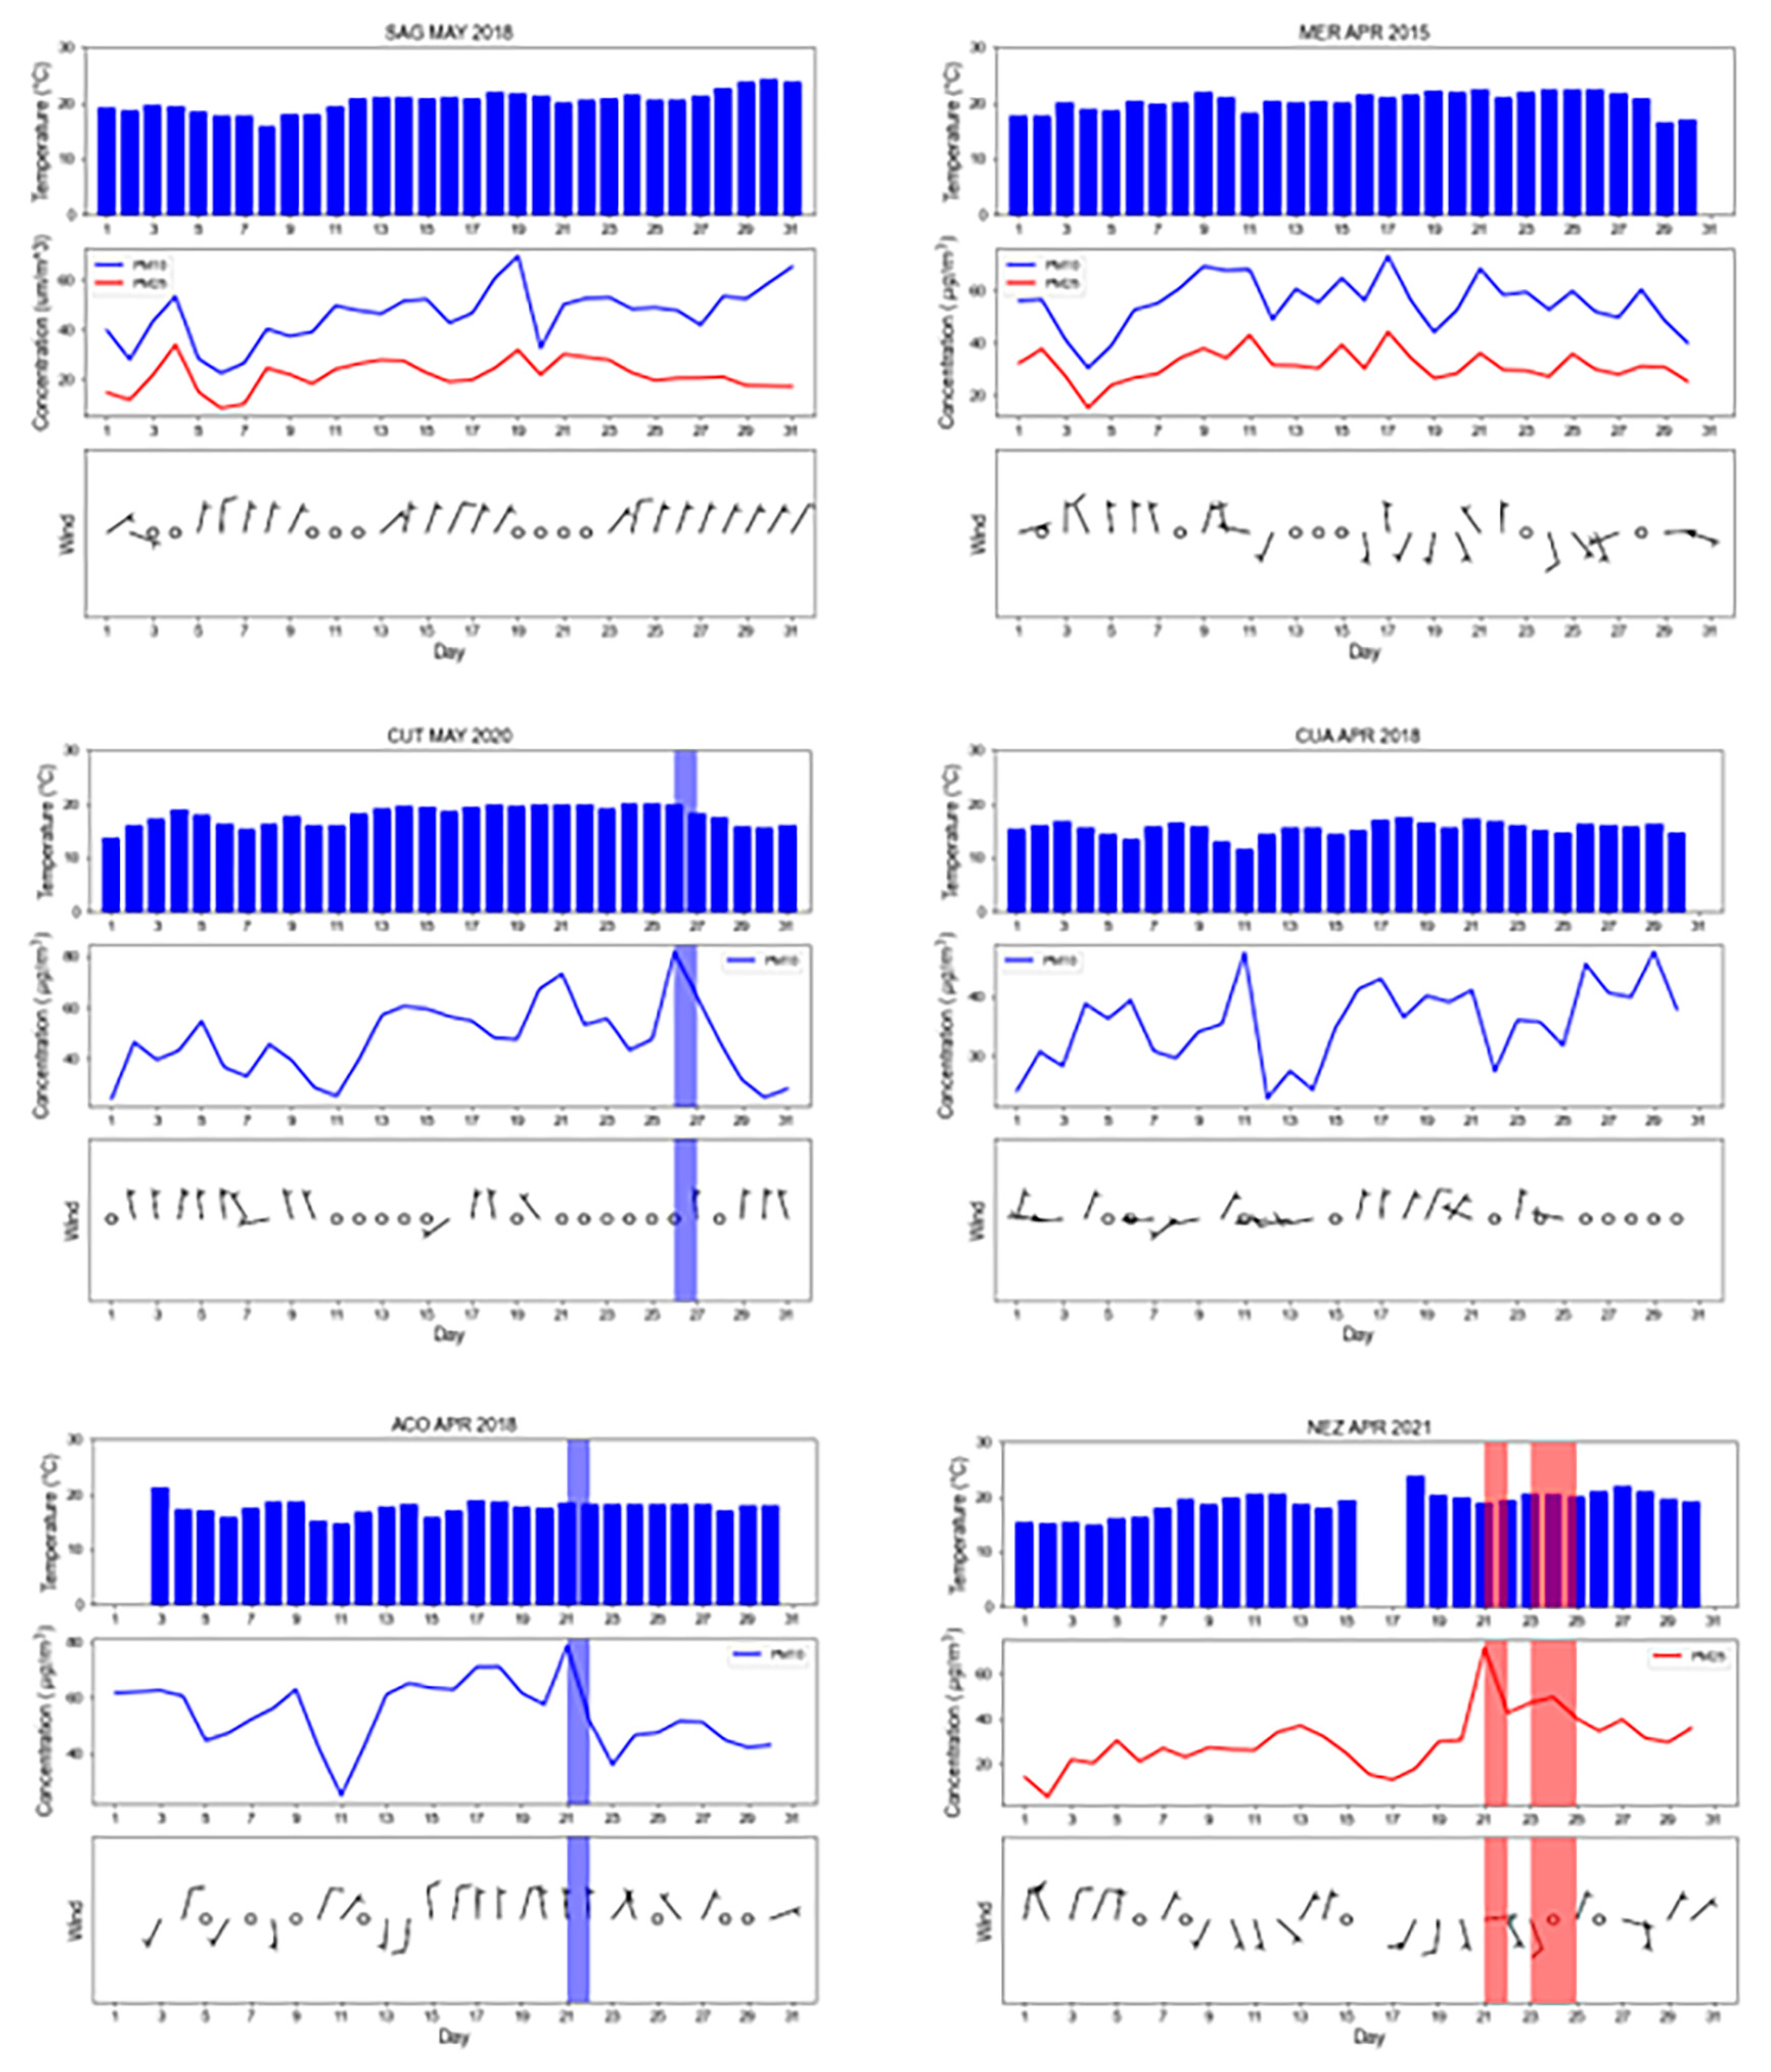
3.3. Effect of Winds on PM Concentrations

A multiple linear regression between meteorological variables (temperature, relative humidity (RH), wind speed, and wind direction) and PM (10 and 2.5) was performed to analyze the effect of meteorological variables on PM concentrations. In 90% of the models, wind speed and wind direction were statistically significant variables, whereas temperature and RH were not always statistically significant. Therefore, the effect of meteorological variables on PM concentrations was assessed using the quantile regression at 75% between wind speed and PM concentration. Previous studies have used quantile regression to assess the effect of wind speed on aerosol optical depth [13,32]. Statistically significant relations between wind speed and PM concentrations are summarized (p < 0.05) in Table 4. Furthermore, the surface wind maps of the three cities are available in the Appendix B, Figure A2.
Most stations in Monterrey lack wind speed data from 2017 and 2018. Only stations CE and NO have PM10 and all meteorological data from 2015 to 2021. In Guadalajara, only station OBL has PM10 and meteorological data from 2015 to 2020, while all the others have missing data. In Mexico City, almost all stations have missing wind speed data for at least one year, except for stations MER, SAG, UAX, and VIF, which report PM and meteorological data for the whole period.
Negative relations between wind speed and PM concentrations indicate that the more intense the winds, the lower the PM concentration; therefore, PM is locally produced, and intense near-surface winds help to “clean” the air. The positive relations indicate that PM is transported by the wind from other parts of the city. Stations reporting positive relations are in the suburbs, whereas stations reporting negative relations are mostly in urban areas due to anthropogenic sources such as transportation.
In Figure 5, the relations between wind speed and PM concentrations at stations in Monterrey, Guadalajara, and Mexico City are shown. Notice that the higher the wind, the lower the PM concentration is. Additionally, the monthly profiles of PM10 and PM2.5 are very similar at station MER in Mexico City. The meteograms of all stations with a significant relation between wind speed and PM concentration are shown in the Appendix B Figure A3, Figure A4 and Figure A5.

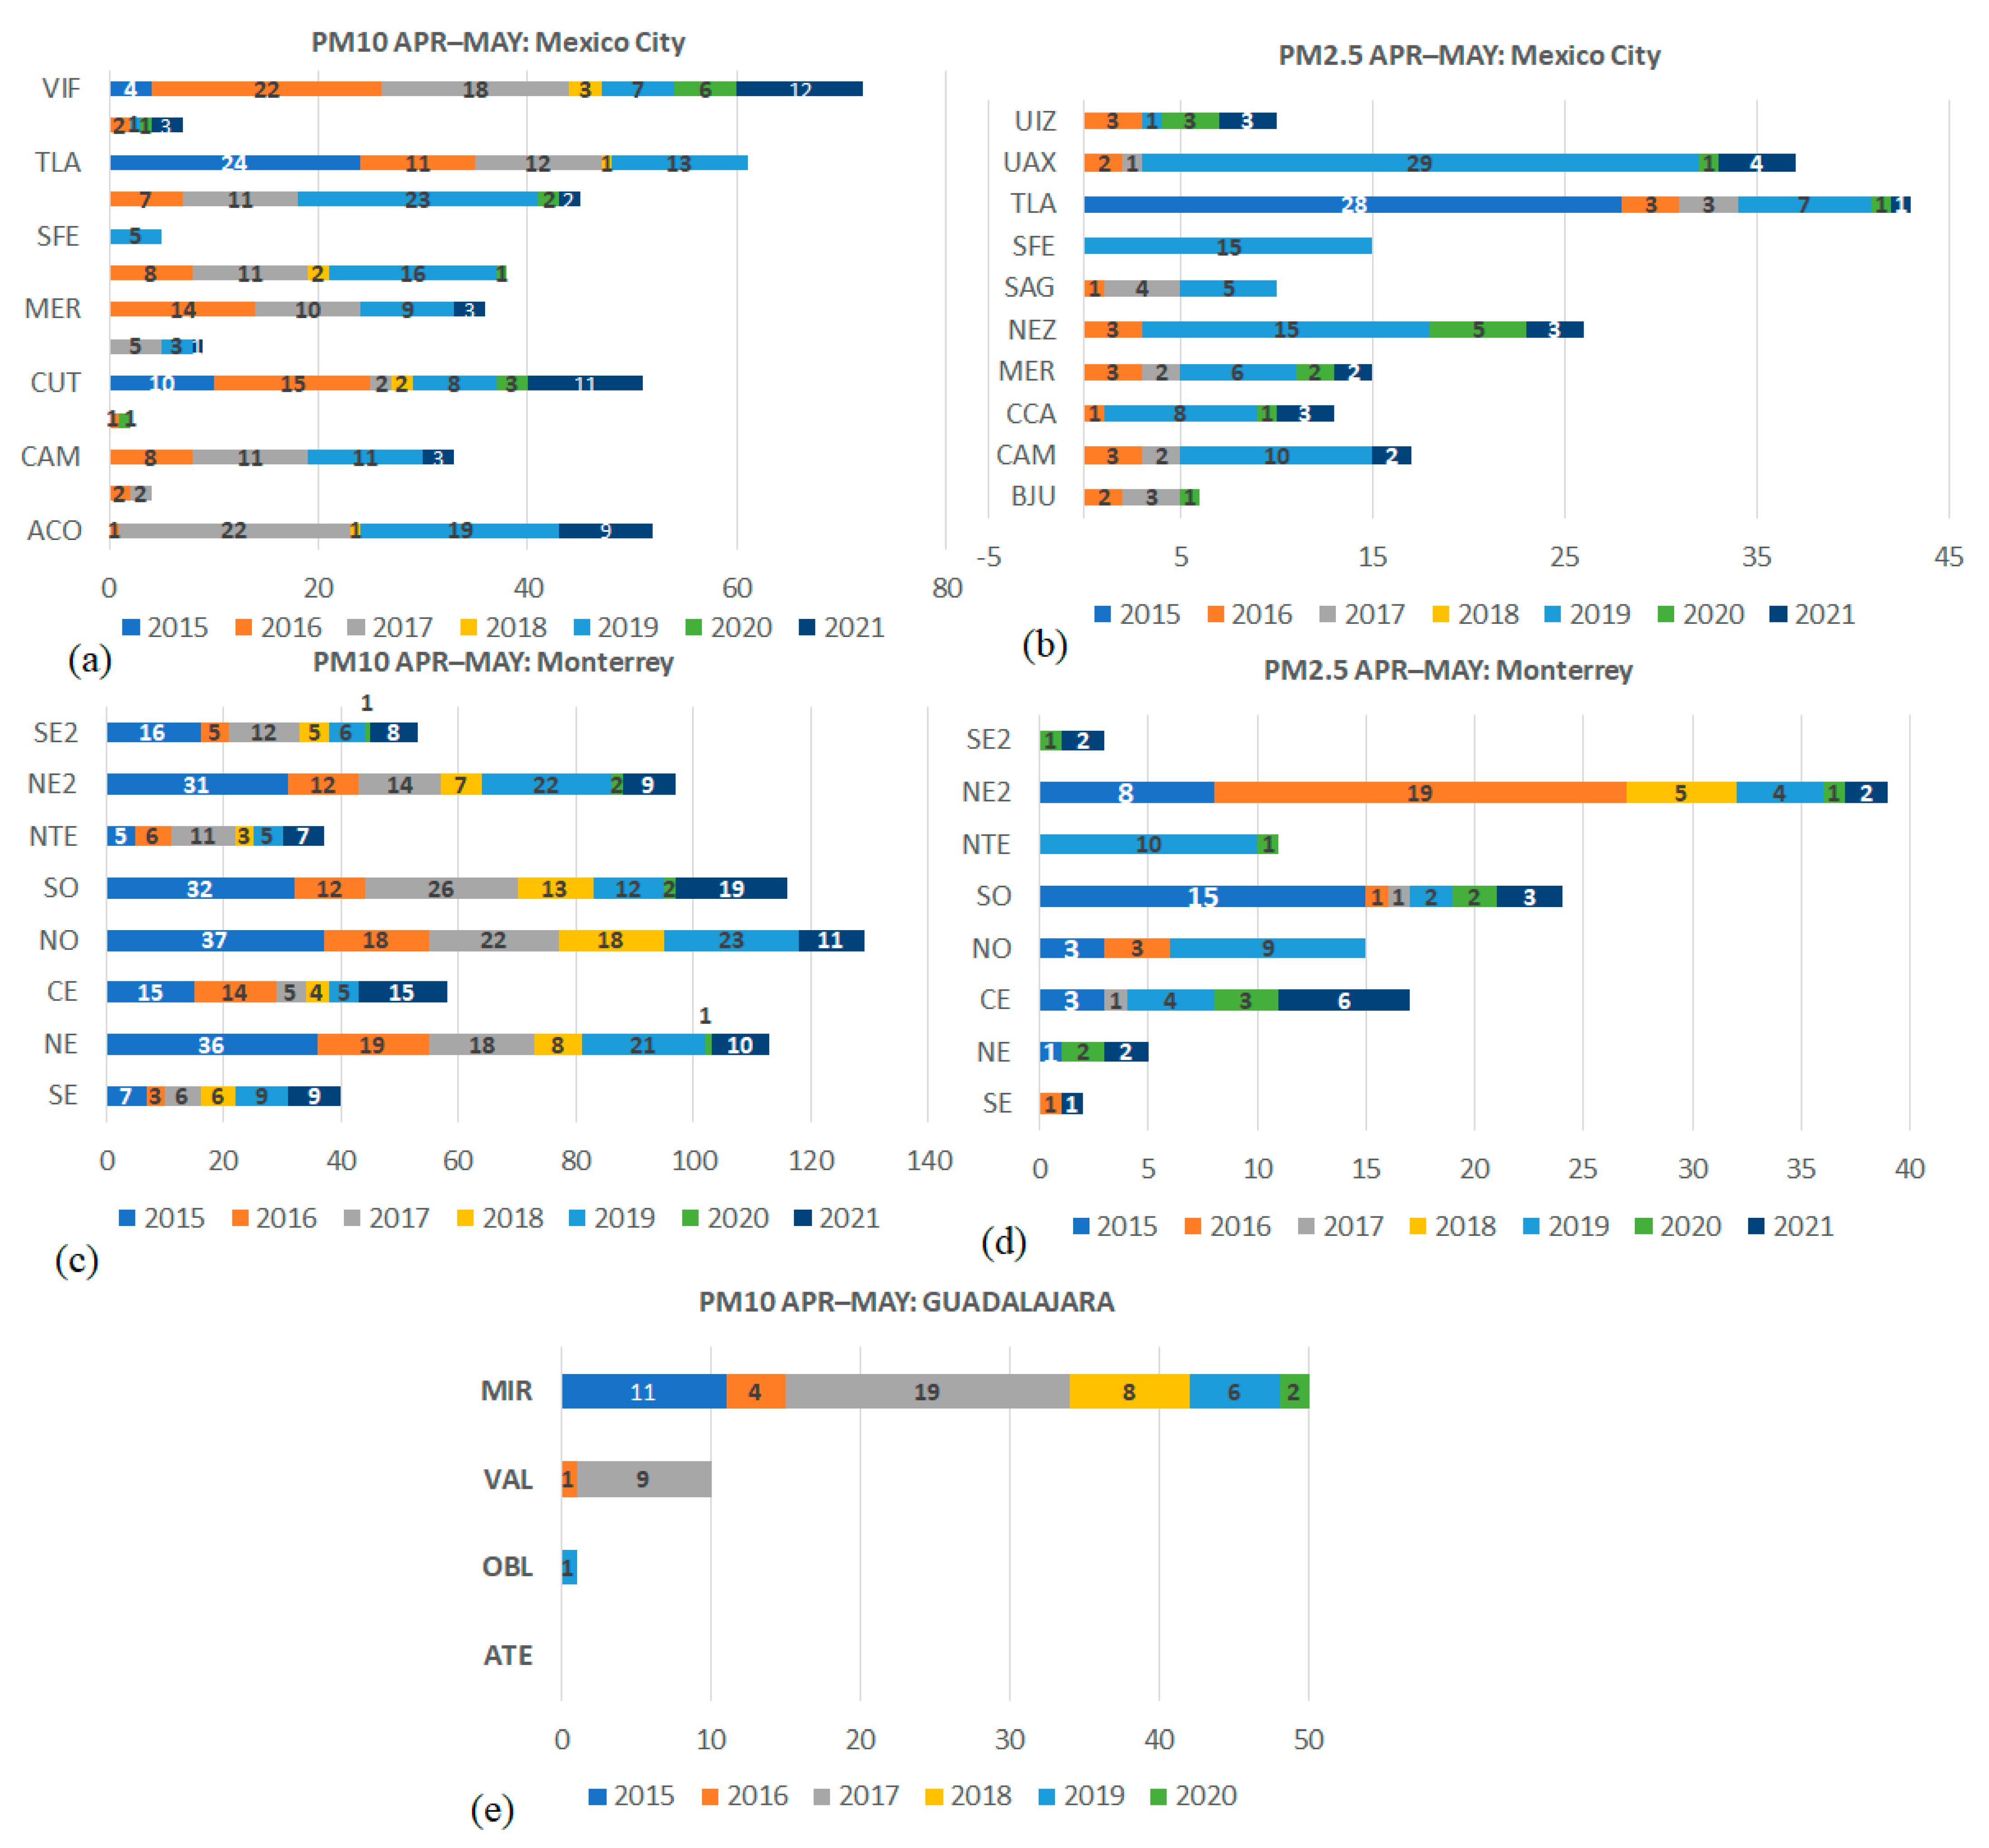
3.4. Days Exceeding Air Quality Norm

The effect of abrupt changes in anthropogenic sources of PM in monthly concentrations was assessed by computing the number of days of official “good air quality” in a month. In Mexico, the official Mexican Standard NOM (NOM-025-SSA1-2014), approved by all Mexican states in 2014, sets the maximum amounts of PM10 and PM2.5 considered as “good air quality levels” to a 24 h average maximum of 75 μg*m−1 for PM10 and a maximum 24 h average of 45 μg*m−1 for PM2.5. According to the World Health Organization (WHO), exceeding 2 or 3 days of the national standard is still considered as good air quality. The number of days that NOM-2014 was exceeded in the three agglomerations in April and May 2015–2021 is shown in Figure 6.

3.4.1. Exceedances of PM10

In Mexico City, stations CUT and TAH exceeded the NOM-2014 limit for PM10 twice and station VIF three times in April 2020. All these stations are in the outskirts of the city, in rural-like areas. In April 2021, the NOM for PM10 was exceeded 9 times in ACO, 10 times in CUT, once in FAC, 3 times in CAM, MER, and UIZ, twice in TAH, and 11 times in VIF. PM10 is associated with dry soils and little vegetation [31]. In March and April 2021, one of the worst droughts in Mexico occurred [33,34], which caused dry soil wind erosion in rural areas around Mexico City and contributed to the increase in PM10.
In Monterrey, stations NE and SE2 exceeded the recommended PM10 limit once, while SO and NE2 exceeded the limit twice in April 2020. The number of exceedances of the PM10 limit in April 2021 was similar to previous years: PM concentrations exceeded the limit 73 times, whereas in 2019 it exceeded the limit 62 times. In Guadalajara, the limit was exceeded only once at station MIR in April 2020. Therefore, strict lockdown measures helped to improve the air quality in the three agglomerations. However, the relaxation of lockdown measures enacted in April 2021 did not benefit air quality, especially in Monterrey where the times over the limit were particularly high. In addition, the 2021 drought was particularly severe in the north of the country, causing dry soils and dust in Monterrey’s surrounding areas.
In May 2020, the PM10 limit was exceeded seven times in Mexico City (CUA, CUT, SAG, and UIZ once each, and VIF three times) and none in Monterrey. In contrast, in May 2021, stations CUT and VIF exceeded the PM10 limit once each, whereas in Monterrey the limit was exceeded 15 times, once in SE, CE, and NTE, twice in NE2 and SE2, and 4 times in CE and SO, respectively. In Guadalajara, the limit was exceeded only once in May 2020. Mobility restrictions and closing non-essential businesses in Monterrey had a positive effect on air quality within the national recommended limits.

3.4.2. Exceedances of PM2.5

In April 2020, the PM2.5 limit was exceeded only once at NEZ station in Mexico City, and it was exceeded 10 times in Monterrey (once in NTE, NE2, and SE, twice in NE and SO, and 3 times in CE). Moreover, in Guadalajara, PM2.5 concentrations did not exceed the limit. In April 2021, in Mexico City, the limit was exceeded 18 times, and 16 times in Monterrey. Therefore, local anthropogenic sources seemed to be the largest emitters of PM2.5 into the air in April 2021.
In May 2020, the PM2.5 limit was exceeded 13 times in Mexico City and none in Monterrey and Guadalajara. In May 2021, the limit was not exceeded in any of the three cities. Thus, the effect of the COVID-19 lockdown in the three major urban agglomerations in Mexico helped to improve the air quality in May 2020 and 2021, more than in April of the same years.

4. Discussion

During the 2020 lockdown, anthropogenic air pollution sources were reduced due to mobility restrictions and some industrial shutdowns to stop the spread of the SARS-CoV-2 virus in Mexico. This shock to the sources of air pollution in Mexico was a unique opportunity for better understanding and identifying anthropogenic and natural sources of air pollution. As a result, better air quality improvement policies could be developed for Mexico City, Guadalajara, and Monterrey.
In Mexico City, AOD concentrations in April and May 2020 were similar to those of previous years. However, in April 2021, AOD concentrations were the highest since April 2015. This was due to wildfires in areas surrounding Mexico City. During the pandemic, the spatial distribution of AODs shifted towards the more densely populated areas of the city. According to the mobility plan of the local government, commuters usually move from the suburbs to the city center for work, however, during the lockdown, these commutes were significantly reduced, and thus, the spatial distribution of AOD changed. Studies in other regions of the world, such as New Delhi, have shown that there is a difference in aerosol concentrations between urban and rural areas; in this case, urban areas have higher aerosol concentrations [35], whereas in Mexico City, the rural areas surrounding the center tend to have higher aerosol concentrations due to the unique layout of the city. Therefore, it is important to consider the local physical, climatic, and economic characteristics of the region under study.
The trend analysis shown in Figure 3 shows that PM10 concentrations began to decrease at the beginning of the lockdown in Mexico City, where mostly, the soil in the rural areas is bare during the dry season, so wind abrasion causes an increase in PM10 in the form of dust. In addition, the Tula refinery complex is located 80 km northwest of the city. Wind patterns contribute to long-range transport of PM2.5 from the refinery to the city center [36]. During the closure, the refinery continued to operate as it was considered an essential industry. However, the PM2.5 reductions observed in Mexico City were mainly due to a reduction in vehicle traffic on the roads.
In Guadalajara, we measured a decrease in AOD in April and May 2020 which can be explained by lockdown measures, the reduction of vehicles on the roads, and the reduction of industrial production around the city of Guadalajara. According to the results presented in Table 1, the lockdown was not a very strong external shock to PM concentrations, however, it caused some reductions in PM concentrations. PM sources in Guadalajara are vehicles, industry in the suburbs, and natural sources from the naked soils in the suburbs, mostly used for agriculture. During the lockdown, agriculture was not halted but non-essential industries were stopped. Therefore, the decrease of PM concentrations in Guadalajara was due to less traffic and less industry operations. In contrast, a significant external shock to aerosol sources in Guadalajara happened in May 2017 when wildfires in the suburbs affected the air quality.
According to the analysis shown in Table 2 and Table 3, mobility restrictions in Guadalajara in 2020 did not seem to have a significant effect on the PM2.5 concentrations. Therefore, other sources of PM2.5 were considered as the main contributors to PM2.5 concentrations, namely forest fires. Previous studies with data from the USA in 2020 have shown that there were many wildfires in that year, and they are a main contributor to PM2.5 concentration exceeding the National Ambient Air Quality Standard [37]. A contribution of wildfires in 2020 in northern Colombia to PM2.5 concentrations was also found by Bolaño-Diaz et al. [38].
In 2020, a large forest fire in the forest to the east of the center of Guadalajara was reported in the news on 10 February 2020 [39]. According to the Risk Atlas of the Metropolitan Area of Guadalajara [40], during the dry season (February to May) in Guadalajara, winds blow from west to east, and at night the winds are more intense. Therefore, considering the direction of the winds, PM from forest fires would be transported towards the city, and this would explain the increase in PM2.5 concentrations detected by ground stations near the urban core of Guadalajara. The wind circulation in Guadalajara and the surrounding area is discussed in detail by Magaña et al. [40]. In Monterrey, AOD concentrations did not significantly decrease in April 2020. However, a reduction was detected in May 2020 which can be explained as a result of the mobility restrictions and the reduction of industrial activities in Monterrey. Table 1 shows that the lockdown did not cause a significant change in PM concentration trends. However, another external shock to PM sources was detected in Monterrey. The rural areas around Monterrey are used mostly for agriculture. Furthermore, the city is in a dry climate region that favors dust events from dry soils and high winds to be a major source of PM. Moreover, from June 2020 to June 2021, Monterrey was hit by a severe drought [33], which caused dryer soils and less agriculture production in the surrounding rural areas that, in combination with high winds, enhanced wind erosion. This could be the reason why PM concentrations were higher in 2020 and 2021 than in previous years. Table 3 shows an increase in AOD concentrations in the years 2020, 2021, and 2022, which may contribute to draughts and dust as aerosols enhance the absorption of solar radiation which is related to the suppression of rain [41,42]. In April and May 2020, the limit recommended by the NOM-2014 was exceeded several times in Mexico City. However, in Monterrey and Guadalajara, PM10 concentrations were within the recommended limits during these months. Consequently, lockdown measures improved the air quality in Monterrey and Guadalajara.
The relationship between wind and PM concentrations showed that in most cases, the high winds caused lower PM concentrations due to the transport of pollutants from the urban area to the outskirts of the city. This indicates that pollutants were produced locally. However, some stations showed a positive relation between wind speed and PM concentrations, which can be attributed to dust and dry soils in rural-like areas. In these cases, the wind contributes to the displacement of these particles into the city and PM concentrations cannot be reduced with lockdown measures [36].

5. Conclusions

The lockdown, as an external shock to air pollution sources, had different effects on air quality in the cities studied here. In Mexico City, it is clear that the reduction in mobility due to the lockdown improved the air quality; however, in Guadalajara, an external shock affecting the air quality was detected in 2017. The drought and extreme water stress in the north of Mexico in 2021 caused an increase in PM concentrations, so it can be considered a significant external shock to air pollution.
PM2.5, which is more related to anthropogenic sources, was significantly reduced during the lockdown in April and May 2020. However, one year later in April and May 2021, with some restrictions still in place, concentrations increased again, but in most cases, did not reach the levels of the pre-pandemic years. In order to design policies to improve the air quality in urban areas, anthropogenic and natural sources of air pollution need to be taken into account. Measures such as work-from-home could be helpful to reduce anthropogenic sources of air pollution, but it is necessary to consider environmental phenomena that cause wildfires and droughts when designing policies to permanently reduce PM concentrations and AOD in urban areas.

Author Contributions

Conceptualization, E.C.; methodology, J.M.-A.; software, J.M.-A.; validation, E.C.; formal analysis, E.C.; investigation, J.M.-A.; resources, E.C. and J.M.-A.; data curation, J.M.-A.; writing—original draft preparation, J.M.-A.; writing—review and editing, E.C.; visualization, J.M.-A.; supervision, E.C.; project administration, E.C.; funding acquisition, J.M.-A. and E.C. All authors have read and agreed to the published version of the manuscript.

Funding

This research received no external funding.

Institutional Review Board Statement

Not applicable.

Informed Consent Statement

Not applicable.

Data Availability Statement

MODIS data can be downloaded from NASA’s LAADS DAAC website: https://ladsweb.modaps.eosdis.nasa.gov/search/order/1. (accessed on 20 July 2022) PM and meteorological data from Mexico City are available from the Secretaría de Medio Ambiente de la Ciudad de México website: http://www.aire.cdmx.gob.mx/default.php (accessed on 20 July 2022). PM and meteorological data from Monterrey and Guadalajara are available from the corresponding author, J.M.-A., upon reasonable request.

Acknowledgments

The first author acknowledges UNAM’s postdoctoral fellowship and thanks Karla Pereyra for her help with the plots of the meteograms and wind maps. All authors acknowledge Tania Rodríguez for her help with the maps.

Conflicts of Interest

The authors declare no conflict of interest.

Appendix A

Table A1. Stations selected for this study in Mexico City, Guadalajara, and Monterrey.
Code in MapStationPM10PM2.5Meteorology 1LocationData Availability (%)
Greater Mexico CityPM10|PM2.5
M1ACOYesNoYesAcolman100
M2BJUYesYesYesBenito Juárez85.71|85.71
M3CUAYesNoYesCuajimalpa100
M4CUTYesNoYesCuautitlán100
M5FACYesNoYesFES Acatlán100
M6MERYesYesYesLa Merced100|100
M7NEZNoYesYesNezahualcóyotl100
M8SAGYesYesYesSan Agustín100|100
M9SFEYesYesYesSanta Fé85.71|100
M10TAHYesNoYesTláhuac100
M11TLAYesYesYesTlalnepantla100|100
M12UAXNoYesYesUAM Xochimilco100
M13UIZYesYesYesUAM Iztapalapa85.71|85.71
M14VIFYesNoYesVilla de las Flores100
Metropolitan Area of GuadalajaraPM10|PM2.5
G1ATEYesNoYesAtemajac88.98 *
G2OBLYesNoYesOblatos90.82 *
G3MIRYesYesYesMiravalle76.59|89.14 **
G4VALYesNoYesVallarta90.80 *
Metropolitan Area of MonterreyPM10|PM2.5
T1SEYesYesYesLa Pastora96.67|71.97 ***
T2NEYesYesYesSan Nicolás98.31|30.26 ***
T3CEYesYesYesObispado95.61|76.04 ***
T4NOYesYesYesSan Bernabé97.99|54.37 ***
T5SOYesYesYesSanta Catarina98.70|61.80 **
T6NTEYesYesYesEscobedo91.87|16.13 ***
T7NE2YesYesYesApodaca94.22|54.56 ***
T8SE2YesYesYesJuárez95.98|15.74 ***
* 2015–2020, ** 2019–2020, *** 2015–2021. 1 In all cases, meteorological data are available in the same percentage as PM10.

Appendix B

Aerosol optical depth in May 2019–2021.
Figure A1. AOD distribution in GMC, MTY, and MAG in May 2019–2021.
Atmosphere 14 00596 g0a1
Surface wind maps.
Figure A2. (a) Surface wind maps in Mexico City (red point) at daytime and nighttime. (b) Surface wind maps in Guadalajara (red point) at daytime and nighttime. (c) Surface wind maps in Monterrey (red point) at daytime and nighttime.
Atmosphere 14 00596 g0a2aAtmosphere 14 00596 g0a2b
Meteograms from Mexico City, Monterrey, and Guadalajara of stations with a significant relation (quantile regression) between wind speed and PM are shown in Figure A3, Figure A4 and Figure A5. In all cases, the blue line represents PM10 concentrations, and the red line represents PM2.5 concentrations.
Figure A3. Meteograms for stations in Monterrey with a significant relation between wind speed and PM concentrations. Blue bars represent days over the PM10 maximum established by the national standard for air quality. The yellow bars indicate exceeding both PM10 and PM2.5 maxima.
Atmosphere 14 00596 g0a3
Figure A4. Meteograms for stations in Guadalajara with a significant relation between wind speed and PM concentrations. Blue bars represent days over the PM10 maximum established by the national standard for air quality.
Atmosphere 14 00596 g0a4
Figure A5. Meteograms for stations in Mexico City with a significant relation between wind speed and PM concentrations. Blue bars represent days over the PM10 maximum established by the national standard for air quality. The yellow bars indicate exceeding both PM10 and PM2.5 maxima, and the red bars show days over the limit for PM2.5.
Atmosphere 14 00596 g0a5aAtmosphere 14 00596 g0a5bAtmosphere 14 00596 g0a5c

References

  1. Environmental Protection Agency. Particulate Matter (PM) Basics. Available online: https://www.epa.gov/pm-pollution/particulate-matter-pm-basics (accessed on 2 December 2022).
  2. Li, C.; Managi, S. Contribution of on-road transportation to PM2.5. Sci. Rep. 2021, 11, 21320. [Google Scholar] [CrossRef] [PubMed]
  3. Ranjan, A.K.; Patra, A.K.; Gorai, A.K. A Review on Estimation of Particulate Matter from Satellite-Based Aerosol Optical Depth: Data, Methods and Challenges Asia Pac. J. Atmos. Sci. 2021, 57, 679–699. [Google Scholar] [CrossRef]
  4. Cipolla, M.; Sorgenti, M.; Gentile, C.; Bishara, M.M. Air Pollution and lung diseases. In Clinical Handbook of Air Pollution-Related Deseases; Springer: New York, NY, USA, 2018; pp. 327–339. [Google Scholar]
  5. Oh, H.-J.; Ma, Y.; Kim, J. Human Inhalation Exposure to Aerosol and Health Effect: Aerosol Monitoring and Modelling Regional Deposited Doses. Int. J. Environ. Res. Public Health 2020, 17, 1923. [Google Scholar] [CrossRef] [Green Version]
  6. Khan, Z.; Ualiyeva, D.; Khan, A.; Zaman, N.; Sapkota, S.; Khan, A.; Ali, B.; Ghafoor, D. A correlation among the COVID-19 Spread, Particulate Matters, and Angiotensing-Converting Enzyme 1: A Review. J. Environ. Public Health 2021, 2021, 5524098. [Google Scholar] [CrossRef] [PubMed]
  7. Pansini, R.; Fornacca, D. Early Spread of COVID-19 in the Air-Polluted Regions of Eight Severly Affected Countries. Atmosphere 2021, 12, 795. [Google Scholar] [CrossRef]
  8. Donzelli, G.; Biggeri, A.; Tobias, A.; Nottmeyer, L.N.; Sera, F. Role of meteorological factors on SARS-CoV-2 infection incidence in Italy and Spain before the vaccination campaign. A multi-city time series study. Environ. Res. 2022, 211, 113134. [Google Scholar] [CrossRef]
  9. Wu, X.; Nethery, R.C.; Sabath, M.B.; Braun, D.; Dominici, F. Air pollution and COVID-19 motality in the United States: Strenghts and limitations of an ecological regression analysis. Sci. Adv. 2020, 6, eabd4049. [Google Scholar] [CrossRef]
  10. Liu, C.; Cai, J.; Chen, R.; Sera, F.; Guo, Y.; Tong, S.; Li, S.; Lavigne, E.; Correa, P.M.; Ortega, N.V. Coarse Particulate Air Pollution and Daily Mortality: A Global Study in 205 Cities. Am. J. Respir. Crit. Care. Med. 2022, 206, 999–1007. [Google Scholar] [CrossRef]
  11. Le, V.V.; Huynh, T.T.; Ölcer, A.; Hoang, A.T.; Le, A.T.; Nayak, S.K.; Pham, V.V. A remarkable review of the effect of lockdowns during COVID-19 pandemic on global PM emissions. Energy Sources Part A 2020. [Google Scholar] [CrossRef]
  12. Marinello, S.; Butturi, M.A.; Gamberini, R. How changes in human activities during the lockdown impacted ari quality parameters: A review. Environ. Prog. Sustain. Energy 2021, 40, e13672. [Google Scholar] [CrossRef]
  13. Rani, S.; Kumar, R.; Acharya, P.; Maharana, P.; Singh, R. Assesing the spatial distribution of aerosols and air quality over the Ganga River basin during COVID-19 lockdown phase-1. Remote Sens. Appl. Soc. Environ. 2021, 23, 100546. [Google Scholar] [CrossRef]
  14. Rovetta, A. The impact of COVID-19 Lockdowns on Particulate Matter Emissions in Lombardy and Italian’s Citizen’s Comsumption Habits. Front. Sustain. 2021, 2, 649715. [Google Scholar] [CrossRef]
  15. Suárez, C.; Quezada, M.S.; Ruiz, S.O.; de Jesús, E.R. Epidemiología de COVID-19 en México: Del 27 de febrero al 30 de abril de 2020. Rev. Clín. Esp. 2020, 220, 463–471. [Google Scholar] [CrossRef]
  16. Gobierno de la Ciudad de México. Gaceta Oficial de la Ciudad de México. Available online: https://data.consejeria.cdmx.gob.mx/portal_old/uploads/gacetas/182dba042c9d9530ccac4e8d99f81f73.pdf (accessed on 2 December 2022).
  17. Mendez-Astudillo, J.; Caetano, E.; Pereyra-Castro, K. Synergy between the Urban Heat Island and the Urban Pollution Island in Mexico City during the Dry Season. Aerosol Air Qual. Res. 2022, 22, 210278. [Google Scholar] [CrossRef]
  18. Morales-Solís, K.; Ahumada, H.; Rojas, J.P.; Urdanivia, F.R.; Catalán, F.; Claramunt, T.; Toro, R.A.; Manzano, C.A.; Leiva-Guzmán, M.A. The effect of COVID-19 lockdowns on the air pollution of urban areas of central and southern Chile. Aerosol Air Qual. Res. 2021, 21, 200677. [Google Scholar] [CrossRef]
  19. Peralta, O.; Ortínez-Alvarez, A.; Torres-Jardón, R.; Manuel, S.-L.; Castro, T.; Ruíz-Suárez, L.G. Ozone over Mexico City durinig the COVID-19 pandemic. Sci. Total Environ. 2021, 761, 143183. [Google Scholar] [CrossRef] [PubMed]
  20. INEGI. Censo 2020. Available online: https://www.inegi.org.mx/programas/ccpv/2020/default.html (accessed on 2 December 2022).
  21. Xu, X.; Zhang, C. Estimation of ground-level PM2.5 concentration using MODIS AOD and corrected regression model over Beijing, China. PLoS ONE 2020, 15, e0240430. [Google Scholar] [CrossRef] [PubMed]
  22. Lyapustin, A.; Wang, Y. MCD19A2 MODIS/Terra+Aqua Land Aerosol Optical Depth Daily L2G Global 1 km SIN Grid V006. 2018 [dataset]. Available online: https://doi.org/10.5067/MODIS/MCD19A2.006 (accessed on 15 March 2022).
  23. Gorelic, N.; Hancher, M.; Dixon, M.; Ilyushchenko, S.; Thau, D.; Moore, R. Google Earth Engine: Planetary-scake geospatial analysis for everyone. Remote Sens. Environ. 2017, 202, 18–27. [Google Scholar] [CrossRef]
  24. DGCA. Objetivos del Monitoreo de la Calidad del Aire de la Red Automática de Monitoreo Atmosférico RAMA. Available online: http://www.aire.cdmx.gob.mx/objetivos-redes/objetivos-monitoreo-calidad-aire-rama.html (accessed on 2 December 2022).
  25. DGCA. Red de Meteorología y Radiación Solar. Available online: http://www.aire.cdmx.gob.mx/objetivos-redes/objetivos-monitoreo-calidad-aire-redmet.html (accessed on 2 December 2022).
  26. Chow, G.C. Tests of equality between sets of coefficients in two linear regressions. Econometrica 1960, 28, 591–605. [Google Scholar] [CrossRef] [Green Version]
  27. Cerrato-Álvarez, M.; Miró-Rodríguez, C.; Pinilla-Gil, E. Effect of COVID-19 lockdown on air quality in urban and suburban areas of Extremadura, Southwest Spain: A case study in usually low polluted areas. Rev. Int. Contam. Ambient. 2021, 37, 237–247. [Google Scholar] [CrossRef]
  28. Thomas, J.; Jainet, P.J.; Sudheer, K.P. Ambient air quality of a less industrialized region of India (Kerala) during the COVID-19 lockdown. Anthropocene 2020, 32, 100270. [Google Scholar] [CrossRef]
  29. DGCA. Informe Anual del la Calidad del Aire. 2018. Available online: http://www.aire.cdmx.gob.mx/descargas/publicaciones/informe-anual-calidad-del-aire-2018.pdf (accessed on 2 December 2022).
  30. Klimont, Z.; Kupiainen, K.; Heyes, C.; Purohit, P.; Cofala, J.; Rafaj, P.; Borken-Kleefeld, J.; Wolfgang, S. Global anthropogenic emissions of particulate matter including black carbon. Atmos. Chem. Phys. 2017, 17, 8681–8723. [Google Scholar] [CrossRef] [Green Version]
  31. Padoan, E.; Maffia, J.; Balsari, P.; Ajmone-Marsan, F.; Dinuccio, E. Soil PM10 emission potential under specific mechanical stress and particles characteristics. Sci. Total Environ. 2021, 779, 146468. [Google Scholar] [CrossRef]
  32. Porter, W.C.; Heald, C.L.; Cooley, D.; Russell, B. Investigating the observed sensitivities of air-quality extremes to meteorological drivers via quantile regression. Atmos. Chem. Phys. 2015, 15, 10349–10366. [Google Scholar] [CrossRef] [Green Version]
  33. CONAGUA. Monitor de Sequía en México. Available online: https://smn.conagua.gob.mx/es/climatologia/monitor-de-sequia/monitor-de-sequia-en-mexico (accessed on 15 February 2022).
  34. ICAyCC. Sequía 2020-2021: La Seguda más Severa del Registro Reciente. Available online: https://www.atmosfera.unam.mx/sequia-2020-2021-la-segunda-mas-severa-del-registro-reciente/ (accessed on 15 February 2022).
  35. Bhardwaj, P.; Pandey, A.K.; Kumar, K.; Jain, V.K. Seasonal variability of aerosols and their characteristics in urban and rural locations of Delhi-NCR. Remote Sens. Technol. Appl. Urban Environ. II 2017, 10431, 31–37. [Google Scholar] [CrossRef]
  36. García-Escalante, J.S.; García-Reynoso, J.A.; Jazcilevich-Diamant, A.; Ruiz-Suárez, L.G. The influence of the Tula, Hidalgo complex on the air quality of the Mexico City Metropolitan Area. Atmosfera 2014, 27, 215–225. [Google Scholar] [CrossRef]
  37. Díaz-Nigenda, E.; Tatarko, J.; Jazcilevich-Diamant, A.; García, A.R.; Caetano, E.; Ruíz-Suarez, G. A modeling study of Aeolian erosion enhanced by surface wind confluences over Mexico Cit. Aeolian Res. 2010, 2, 61–70. [Google Scholar] [CrossRef]
  38. Li, Y.; Tong, D.; Ma, S.; Zhang, X.; Kondragunta, S.; Li, F.; Saylor, R. Dominance of wildfires impact on air quality exceedances during the 2020 record-breaking wildfire season in the United States. Geophys. Res. Lett 2021, 48, e2021GL094908. [Google Scholar] [CrossRef]
  39. Bolaño-Diaz, S.; Camargo-Caicedo, Y.; Bernal, F.T.; Bolaño-Ortiz, T.R. The Effect of Forest Fire Events on Air Quality: A Case Study of Northern Colombia. Fire 2022, 5, 191. [Google Scholar] [CrossRef]
  40. El Occidental 2020. Incendio Forestal en el Paraje las Canoas. Available online: https://www.eloccidental.com.mx/policiaca/se-registra-un-incendio-forestal-en-el-paraje-las-canoas-4817577.html (accessed on 15 February 2023). (In Spanish).
  41. Magaña-Rueda, V.O.; Pérez-Sánchez, T.; López-Arias, M.G.; Galván-Ortíz, G.; Palma, G. Atlas de Riesgos Hidrometeorológicos y Climáticos en el Área Metropolitana de Guadalajara;Institute of Geography, National Autonomous University of Mexico, Mexico City, Mexico. 2020. Available online: https://zapotlanejo.gob.mx/archivos/Atlas%20Metropolitano%20de%20RIESGOS%20del%20%C3%81rea%20Metroplolitana%20de%20Guadalajara.pdf (accessed on 15 February 2023). (In Spanish) (Executive Summary Version).
  42. Ramanathan, V.; Crutzen, P.; Kiehl, J.; Rosenfeld, D. Aerosols, Climate, and the Hydrological Cycle. Science 2001, 294, 2119–2124. [Google Scholar] [CrossRef] [PubMed] [Green Version]
Figure 1. Locations of Guadalajara, Monterrey, and Mexico City, and locations of the stations used in each city. The light grey areas are urban areas, whereas dark green areas are forest and/or mountains. All stations report meteorological and PM data. See Table A1 in the Appendix A for more information about the stations.
Atmosphere 14 00596 g001
Figure 2. Flow diagram of the methodology of this study.
Atmosphere 14 00596 g002
Figure 3. AOD (dimensionless) in GMC, MAG, and MTY in April and May 2015–2022.
Atmosphere 14 00596 g003
Figure 4. PM concentrations at (a) GMC, (b) MTY, and (c) MAG from 1 January to 31 May 2020. The lockdown period is marked in yellow (from 23 March 2020, DOY 83).
Atmosphere 14 00596 g004
Figure 5. Representative meteograms showing the relations between wind speed and PM at stations in (a) Mexico City, (b) Monterrey, and (c) Guadalajara. Red bars show days that the PM2.5 limit was exceeded, and blue bars show exceedance of the PM10 limit. In the figure, PM10 is represented by a blue line and PM2.5 by a red line. The wind speed and direction are shown in the bottom of each panel.
Atmosphere 14 00596 g005
Figure 6. Number of days that exceeded the PM10 and PM2.5 limits in Mexico City (a,b). Number of days that exceeded the PM10 and PM2.5 limits in Monterrey (c,d). Number of days that exceeded the PM10 limits in Guadalajara (e). In all cases, the period is April and May 2015–2021.
Atmosphere 14 00596 g006
Table 1. Chow test.
Table 1. Chow test.
At Day of the Year (DOY) 83, 23 March 2020
PM10PM2.5
Mexico CityF = 12.392, p-value = 1.06 × 10⁻⁵F = 0.88454, p-value = 0.4151
GuadalajaraF = 0.93567, p-value = 0.3946F = 4.2504, p-value = 0.01609
Monterrey **F = 0.17646, p-value = 0.8384F = 1.107, p-value = 0.3333
** There was an inflection point found at DOY 41 (10 February 2020) rather than at DOY 83.
Table 2. Changes in PM10 concentrations (%) in April and May 2020 and 2021 in GMC, MTY, and MAG. Red numbers indicate not statistically significant changes.
April (%)May (%)AprilMay
2020 vs. av2021 vs. av2020 vs. av2021 vs. avZ Score
Greater Mexico CityACO−14.7721.61−38.11−18.91−2.77 **−3.08 **−6.75 **−3.37 **
BJU−3.460−8.9−18.25−1.27 +−0.4 +−2.78 *−3.47 **
CAM−28.63−2.4−46.27−31.21−5.62 **−0.56 +−6.43 **−6.11 **
CUA0−3.250−5.98−0.12 +−1.2 +−0.15 +−1.06 +
CUT−6.22−2.47−10.14−20.58−1.42 +−1.07 +−1.87 *−3.43 **
FAC−28.7129.28−78.60−2.46 *−3.65 **−6.75 **−0.05 +
MER−17.69−12.3−23.06−53.52−3.61 **−2.44 *−4.4 **−6.72 **
SAG−10.79−21.46−4.23−12.53−1.98 *−5.68 **−0.67 +−1.14 +
SFE−18.51−15.69−28.37−35.2−3.61 **−3.96 **−5.02 **−6.08 **
TAH−7.53−5.81−77.95−41.15−1.58 +−0.28 +−6.16 **−5.96 **
TLA−32.62−37.9−27.67−50.97−5.87 **−6.09 **−5.19 **−6.72 **
UIZ−4.7617.55−7.79−18.71−1.23 +−2.89 **−2.22 *−2.98 **
VIF−12.12−6.88−6.55−4.21−2.87 **−0.12 +−0.87 +−0.91 +
Total−14.29−3.06−27.51−23.94
Monterrey Metropolitan AreaSE−30.0721.01−37.891.31−3.86 **−1.95 *−5.26 **−0.02 +
NE−36.71−17.86−37.38−33−5.49 **−2.44 *−6.01 **−5.4 **
CE−35.1318.07−42.814.15−5.15 **−2.35 *−5.88 **0.12 +
NO−56.44−23.28−53.93−30.01−6.58 **−3.4 **−6.75 **−4.99 **
SO−34.386.19−38−9.32−4.75 **0.01 +−5.71 **−1.77 *
NTE−31.749.73−25.32−2.01−4.93 **−0.41 +−5.01 **−0.67 +
NE2−20.93−2.17−33.73−11.08−2.57 **−0.64 +−5.37 **−2.87 **
SE2−23.5210.39−242.35−3.99 **−1.61 +−5.81 **−0.04 +
Total−33.622.76−36.63−9.70
Metropolitan Area of GuadalajaraATE0 −15.02 −0.32 + −3.6 **
MIR−15.29 −29.25 −3.6 ** −4.47 **
OBL−2.14 −14.43 −0.49 + −3.15 **
VAL−15.29 −19.64 −2.5 * −3.23 **
Total−8.18 −19.585
Statistical significance: + p > 0.05, * p < 0.05, ** p < 0.005.
Table 3. PM2.5 concentration changes in GMC, MTY, and MAG (p < 0.05 significance level). Numbers in red indicate no statistically significant change detected.
StationApril (%)May (%)AprilMay
Greater Mexico City 2020 vs. av2021 vs. av2020 vs. av2021 vs. avZ Score
BJU0−10.8600−1.49 **−1.6 +−3.2 **−5.12 **
CAM−29.210−31.32−29.66−5.31 **−0.7 +−4.8 **−5.36 **
CCA−6.87−17.86−14.75−26.4−2.07 *−1.9 *−2.6 **−4.15 **
MER−17.73−2.67−20.4−32.99−3.99 **−0.007 +−3.9 **−5.71 **
NEZ18.8512.5916.4813.82−2.89 **−1.45 +−1.16 +−1.99 *
SAG−15.89−5.53−7.49−25.99−3.57 **−0.007 +−1.54 +−3.98 **
SFE−17.63−23.95−25.69−41.16−3.45 **−6.09 **−4.42 **−6.26 **
TLA−40.02−24.56−22.79−33.93−6.36 **−4.42 **−4.46 **−5.75 **
UAX−16.7−5.34−17.89−26.35−3.8 **−1.11 +−2.8 **−4.2 **
UIZ−12.74−5.25−4.35−29.33−2.83 **−1.08 +−1.67 *−5.19 **
Total−13.79−8.34−12.82−23.20
Monterrey Metropolitan AreaSE7.6739.89−32.18−19.52−0.09 +−2.63 **−4.27 **−2.88 **
NE−9.293.43−21.23−27.23−2.07 *−0.27 +−3.57 **−4.25 **
CE43.4360.12−34.7−34.57−3.3 **−4.22 **−2.67 **−1.56 +
NO−42.75−14.6−54.55−46.53−5.31 **−2.23*−6.33 **−3.54 **
SO−20.10.63−37.32−23.18−3.96 **−0.05 **−5.39 **−4.2 **
NTE−30.23.19−58.76−52.51−3.51 **−0.03 +−6.26 **−6.15 **
NE2−30.86−20.86−44.72−42.95−1.64 *−2.84 +−6.06 **−6.03 **
SE29.2616.74−23.06−35.6−0.67 +−1.48 **−3.63 **−4.35 **
Total−9.1111.07−38.32−35.26
GuadalajaraMIR−3.16 −27.84 −0.4 + −2.68 **
Statistical significance: + p > 0.05, * p < 0.05, ** p < 0.005.
Table 4. Statistically significant relations between wind speed and PM concentrations. The relation can be positive (pos), negative (neg), or non-existent (no). Not available (na).
StationRelationPollutant
Greater
Mexico City
ACOPosPM10
BJUNona
CUANegPM10
CUTNegPM10
FACNona
MERNegPM2.5
NEZNegPM10
SAGNegPM2.5/PM10
SFENegPM2.5
TAHNegPM10
TLANegPM10
UAXNegPM2.5
UIZNegPM2.5
VIFPosPM10
Monterrey Metropolitan AreaSENona
NENona
CENona
NONegPM2.5
SONegPM10/PM2.5
NTENona
NE2PosPM10
SE2Nona
Metropolitan Area of GuadalajaraATENona
OBLNona
VALNona
MIRNegPM10/PM2.5
Disclaimer/Publisher’s Note: The statements, opinions and data contained in all publications are solely those of the individual author(s) and contributor(s) and not of MDPI and/or the editor(s). MDPI and/or the editor(s) disclaim responsibility for any injury to people or property resulting from any ideas, methods, instructions or products referred to in the content.

