Article

The Source Apportionment of Heavy Metals in Surface Dust in the Main District Bus Stops of Tianshui City Based on the Positive Matrix Factorization Model and Geo-Statistics

1
College of Environmental Engineering, Gansu Forest Polytechnic, Tianshui 741020, China
2
College of Resource and Environmental Engineering, Tianshui Normal University, Tianshui 741000, China
3
College of Geography and Tourism, Shaanxi Normal University, Xi’an 710119, China
*
Author to whom correspondence should be addressed.
Atmosphere 2023, 14(3), 591; https://doi.org/10.3390/atmos14030591
Submission received: 23 January 2023 / Revised: 10 March 2023 / Accepted: 15 March 2023 / Published: 20 March 2023

Abstract

:
For the pollution assessment and quantitative source apportionment of heavy metals in surface dust, a total of 52 surface dust samples were collected from bus stops in Tianshui City. The geoaccumulation index (Igeo) and potential ecological risk index (RI) were used to analyze the pollution levels caused by heavy metals. The Positive Matrix Factorization (PMF) of the receptor modeling and geo-statistics were employed to analyze the source of the heavy metals. The results were as follows. ① Except for Mn, Co and V, the mean concentrations of other heavy metals have exceeded the local background value of Gansu. The percentage of excessive concentrations of Cu, Zn, Sr, Ba and Pb in the samples was 100%, and that of Cr, Ni and As were 96.15%, 94.23%, and 96.15%, respectively. ② Semivariogram model fitting showed that the block-based coefficients of Cu, Zn, Sr, Ba, Pb, Cr, Ni, and As were between 0.25 and 0.75, indicating that they were mainly affected by human factors. The high values of Pb, Zn, Ni and As were mainly distributed in the eastern part of the study area, and the high values of Cu, Sr, Ba and Cr were distributed in a spot-like pattern in the study area. ③ The Igeo results showed that As, Cu, Zn, and Pb were the main contamination factors, and the optimized RI showed that the heavy metals were the overall ecological risk of intensity, among which Pb, As and Cu were the main ecological factors and should be taken as the priority control objects. ④ Based on the PMF, there are four main sources of eleven heavy metals. V, Mn, and Co were attributed to natural sources, accounting for 18.33%; Cu, Sr, and Ba were from mixed sources of pollution from transportation and industrial alloy manufacturing, accounting for 26.99%; Cr and Ni were from sources of construction waste pollution, accounting for 17.17%, As, Zn and Pb were mainly produced by coal-traffic mixed pollution emissions, accounting for 37.52%. Overall, the study area was dominated by coal-traffic emissions.

1. Introduction

Heavy metal pollution from surface dust deserves more attention because surface dust contains high levels of toxic heavy metals [1,2] and it is the source and sink of material exchange between the land and atmospheric system, which will pollute terrestrial and aquatic ecosystems when deposited [3,4]. Most publications about surface dust heavy metals were focused on materials pollution characteristics [5,6], spatial distribution patterns [7,8] and sources of identification [9,10]. In fact, traffic-source pollutants were still the main pollutants affecting human health and urban atmospheric environment quality [11]. By analyzing heavy metals in the dust of non-exhaust roads in Kuala Lumpur, and evaluating the heavy metal pollution degree of four different roads according to the pollution load index [12], it was found that the road dust of the asphalt expressway in Ulsan City, South Korea, was highly polluted with Cd, Zn, Cu, and Ni [13]. The concentration of heavy metals decreases with the increase of dust particle size, and Cd has the most bio-usable value and high migration ability in the road sediments in Beijing Olympic Park [14]. Cd in road dust exceeded the standard value significantly, and the coefficients of variation for Cd, Cr, and Cu were as high as 0.90, 0.89, and 0.74, indicating significant heavy metal pollution carried by human action [15].
Heavy metals carried by the surface dust of urban bus stops can enter the human body and endanger health through skin contact, respiratory inhalation, and hand-to-mouth intake. It is important to study the characteristics of metal elements in urban bus stop-surface dust and to analyze the source of the metal elements for understanding the urban ecological environment quality. At present, the study of heavy metals in the surface dust of bus stops mainly focuses on the concentration characteristics and spatial distribution, and the sources are basically absent. For example, the concentration of Cu, Zn, and Pb in the surface dust of Shijiazhuang bus stops was high, and Cu, Zn, and Pb in the urban dust were related to traffic [16]. The concentration of Cd, Cu, Pb, and Zn in the surface dust samples of Beijing bus stops was high, and the level of Cd pollution was classified as “serious to extreme pollution” [17]. The dust on the surface of the Fuzhou bus hub was mainly polluted by Pb and Cu, which was about twice as much as the dust on the roads of other cities in China [18]. Thus, it is necessary to quantitatively analyze the sources of pollution and draw a spatial distribution map.
The source apportionment of heavy metals in the atmosphere was investigated by an absolute principal component score-multiple linear regression (APCS-MLR), the positive matrix factorization (PMF), and the Unmix model [19,20]. These models can identify major pollution sources of heavy metals, such as agricultural, industrial, and natural sources [21,22]. The PMF 5.0 program recommended by US-EPA was used to realize the source analysis of heavy metals [23]. As a new source-analyzed receptor model, the PMF makes non-negative constraints on factor load and factor score in the process of solving and can use the standard deviation of data to optimize, which makes the factor load and score more interpretable [24]. At the same time, the PMF can assign uncertainty estimates related to each group of data when making non-negative constraints on factor loads and scores, making the analytical results of the model more consistent with reality [25]. Therefore, it has been gradually introduced into the source analysis of heavy metals in soil or dust in recent years [26]. However, the receptor model is a simple mathematical statistical model, which lacks the expression of spatial heterogeneity, so it is difficult to show the spatial distribution of heavy metal concentrations [21]. Moreover, surface dust has the characteristics of high spatial variation, so it is necessary to supplement the statistical system to describe the spatial structure and change the rule of heavy metal [27], and further explain the source of the high-value area of heavy metal concentrations. Thus, it is of great significance to establish a comprehensive characterization or comprehensive model of multiple source analysis methods in this study [28].
Above all, there were few studies on the pollution caused by heavy metals in the surface dust of bus stops [16,17,18,29]. However, the rapid industrialization and urbanization of small and medium-sized cities have diversified their environmental pollutants [30]. Due to the differences in geographical environment and economic level, the factors affecting the concentration of heavy metals in small and medium-sized cities are different, so the ecological environment pollution cannot be ignored [31,32]. Therefore, the main objectives of this study were: (1) to evaluate the concentrations characteristics and spatial distributions of heavy metals in surface dust of bus stops in the main district of Tianshui City; (2) to evaluate the pollution degree and potential ecological risk of heavy metal contamination in surface dust; (3) determine the pollution sources of heavy metals in surface dust.

2. Materials and Methods
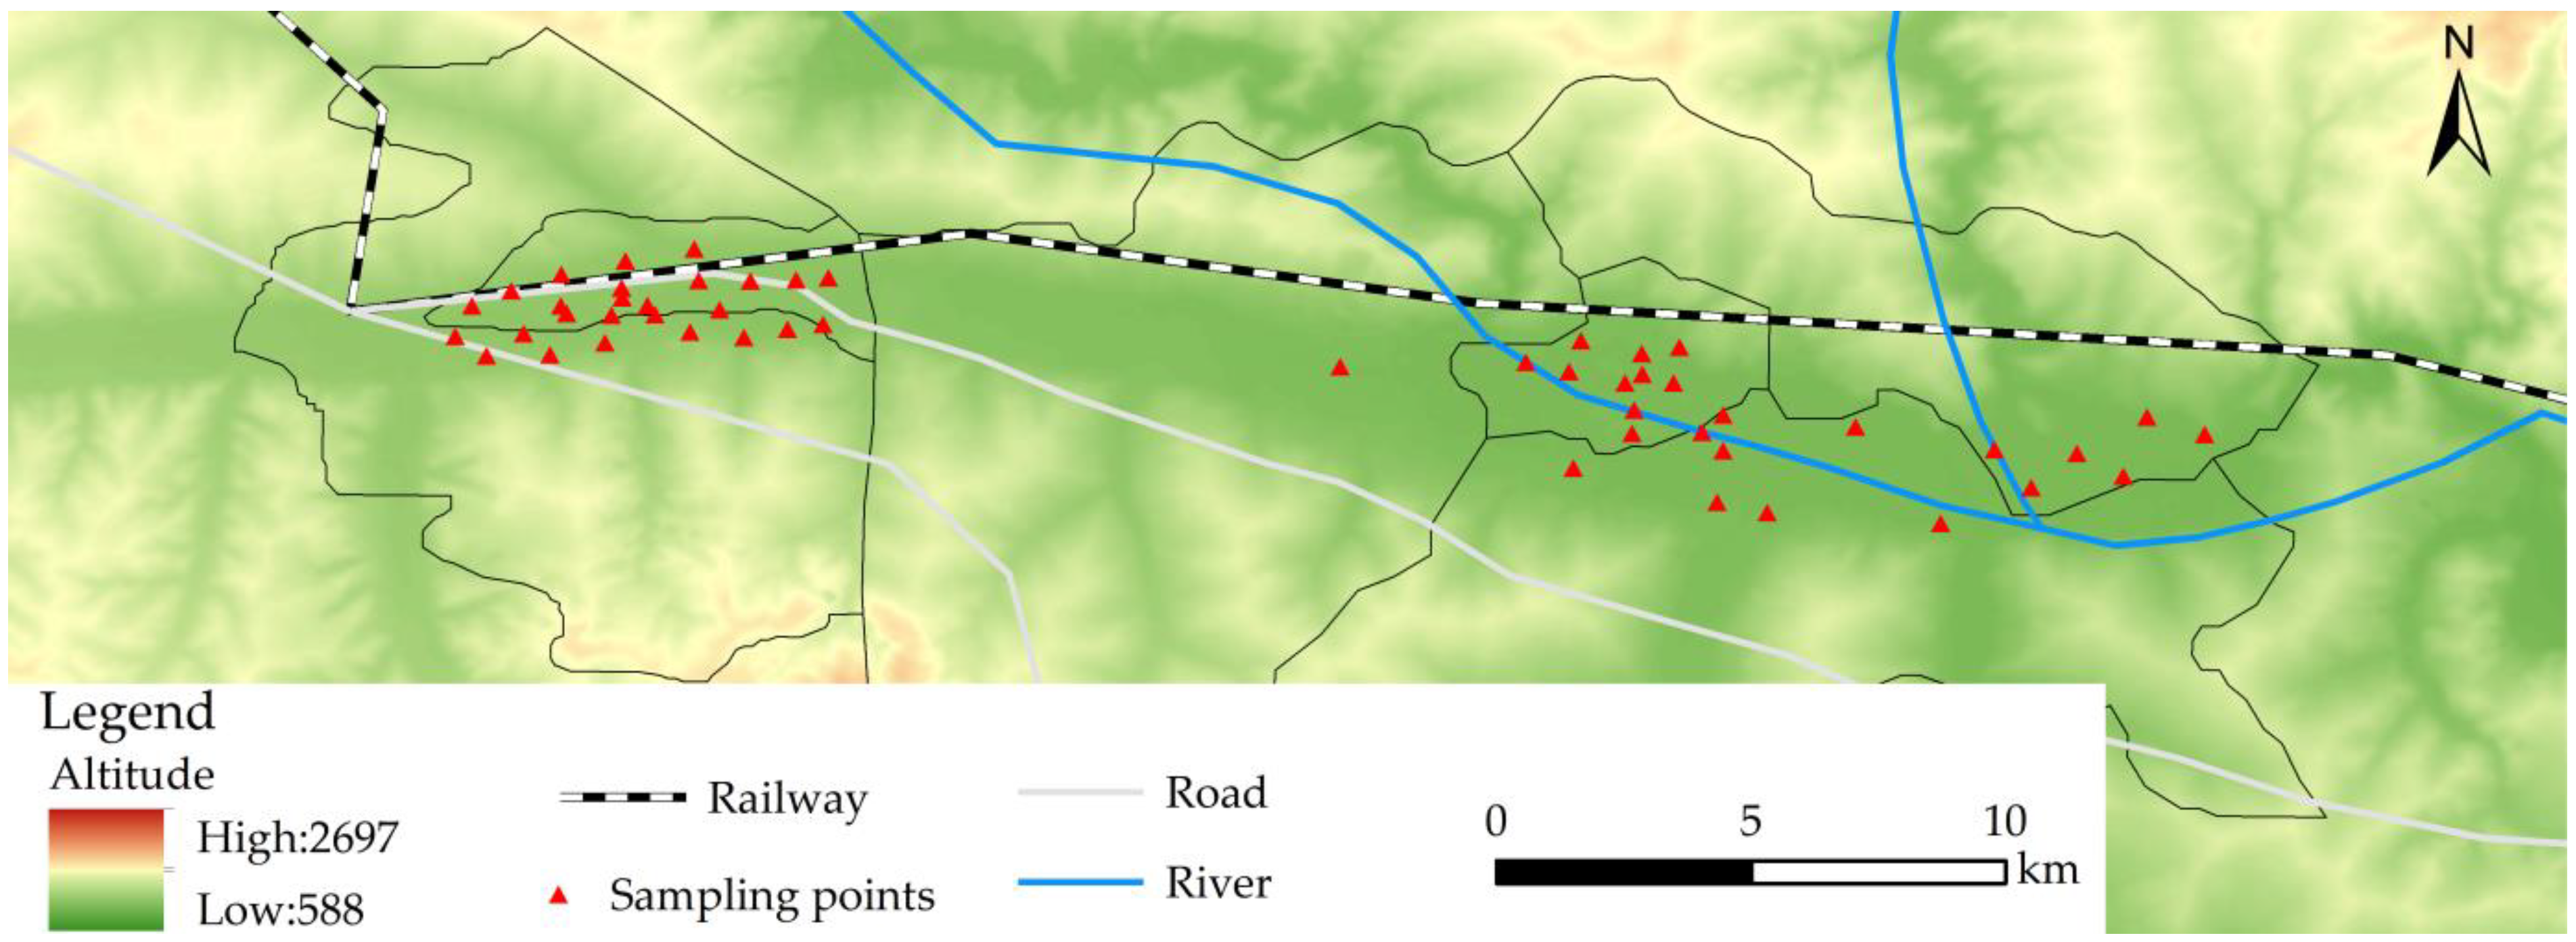
2.1. The Study Area

Tianshui City is located in the southeast of the Gansu Province (104°35′~106°44′ E, 34°05′~35°10′ N) and straddles the Yangtze River basin and the Yellow River Basin. It is a typical valley-type city of “two mountains sandwiched by a river”, and also an important node city of the “Guantian Economic Zone”. Tianshui is a typical temperate continental monsoon climate. The main urban area of Tianshui studied in this paper refers to the Qinzhou district and Maiji district, which are located in the east-west valley basin and are sandwiched by two mountains in the north and south. The average altitude in the area is about 1100 m, the east-west length is about 36 km, and the north-south width is about 1~3 km. Under the influence of the valley topography, the upper part of the main district is easy to form a temperature inversion layer, which is not conducive to the diffusion of pollutants, and the pollution events mainly particulate matter pollution are easy to form in winter. In addition, as one of the country’s old industrial bases and important equipment manufacturing bases, rapid urbanization and industrialization in recent decades have increased the discharge of environmental deposition pollutants, affecting the environmental quality and the health of urban residents [30]. In this paper, more than 5 bus stops in the study area were selected, and commercial centers, schools, hospitals and industrial enterprises are distributed around the sampling points. Pedestrians take buses to schools or jobs, which is the inevitable choice for most Tianshui citizens for their daily travel.

2.2. Sample Collection and Analysis

To ensure that the sample is representative and the measured data is reliable, the bus stops with more than 5 bus lines in the study area are selected as the sampling points. Sampling shall be carried out when there is no wind for more than three consecutive days, and the dust on the surface of the impervious ground at the bus stop and the surrounding area shall be collected with a brush and plastic shovel. To avoid local pollution, sampling should avoid obvious low-lying areas and clear pollution sources (such as garbage dumps). At the same time, four parallel sampling points were selected for each sampling point and mixed into one sample. A total of 52 samples were collected, each weighing about 50 g, and sealed in a self-sealing bag with labels. Finally, record the longitude and latitude coordinates of various points, the surrounding environment and the flow of people and vehicles in detail, and draw the schematic diagram of surface dust sample points in the study area (Figure 1).
After removing the impurities, the surface dust samples were screened with 0.15 mm copper and mixed. A fully automated sequential wavelength dispersive X-ray fluorescence spectrometer (AXIOS, PANalytical B.V., Almoro, The Netherlands) with a Super Sharp Tube of Rh-anode, 4.0 KW, 60 KV, 160 mA, 75μ UHT Be end Window was used for elemental analysis. The software is SuperQ Version 5. The accessories include a semi-auto press machine (ZHY-401A, Zhonghe Corporation, Beijing, China), a grinding mill with tungsten carbon (ZHM-1A, Zhonghe Corporation, Beijing) and a closed circuit cooling unit (BLK2-8FF-R, Zhonghe Corporation, Beijing). The materials were crushed to less than 75 µm using a multipurpose grinder and dried in an oven at 105 °C. 4 g of the dry powdered materials is pressed into a 32-mm-diameter pellet using 30-ton pressure, using the pressed powder pellet technique. The briquettes were then stored in desiccators. Calibration curves were established using the reference materials of rock (GBW07103- GBW07114 (GSR01-GSR12), GBW07120-GBW07122(GSR13-GSR15)), soil (GBW07401- GBW07408 (GSS01-GSS8), GBW0743-GBW07430(GSS9-GSS16)) and water sediment (GBW07301a-GBW07318 (GSD01-GSD14)). According to GB/T14506. 28–93 (Silicate Rocks-Determination of contents of major and minor elements-X-ray fluorescence spectrometric methods), measuring conditions of analyzed elements was determined. Cu, Zn, Mn, Co, Sr, Ba, Pb, V, Cr, Ni, and As was selected for analysis.

2.3. Methods

2.3.1. The Geoaccumulation Index

The geoaccumulation index method (Igeo) [33] has also been used to determine sediment contamination in recent years [34], and the calculation formula is as follows (Equation (1)):
I g e o = log 2 ( C i / k B i )
where Igeo is the geoaccumulation index, Ci is the measured heavy metals concentration (mg/kg), Bi is the geochemical background value of heavy metals ((mg/kg) the soil background values of Gansu province were used as the reference values of Bi [35]), and the value k is 1.5 in this paper. Its classification is as follows: extremely contaminated (Igeo ≥ 5), seriously contaminated to extremely contaminated (4 < Igeo ≤ 5), seriously contaminated (3 < Igeo ≤ 4), moderately contaminated to seriously contaminated (2 < Igeo ≤ 3), moderately contaminated (1 < Igeo ≤ 2), no-moderate pollution contaminated (0 < Igeo ≤ 1), uncontaminated (Igeo ≤ 0).

2.3.2. Potential Ecological Risk Index

The potential ecological risk index (RI) connects the ecological effects, environmental effects, and toxicology of heavy metals together. In this paper, the element with the largest toxicity coefficient (TrAs = 10) is taken as the basis for classification, and the classification standard is optimized based on the traditional risk index classification principle [36], and the RI classification value of unit toxicity coefficient is 1.13. Then, multiply the sum of the heavy metal toxicity coefficients by 1.13, and round up to get the first-classification RI value 42 (1.13 × 37 = 41.81 ≈ 42). The classification values of the other classifications are multiplied by 2 by the classification values of lower classification [37], and the calculation formula is as follows (Equation (2)):
R I = i = 1 n E r i = i = 1 n ( T r i × C i / B i )
where RI and Eri are the comprehensive ecological risk indices and the potential ecological hazard coefficient of single heavy metal pollution, respectively; Tir is the toxicity response coefficient of heavy metal. Moreover, based on the RI value, the overall pollution status of heavy metals could be divided into four classifications [37], namely, low risk (RI < 42), moderate risk (42 ≤ RI < 84), serious risk (84 ≤ RI < 168) and extremely serious risk (RI ≥ 168).

2.4. PMF

The PMF model obtained the optimal matrix G and F by constantly decomposing the original matrix X and finally minimized the objective function Q [23]; the following equation was used (Equation (3)):
X i j = k = 1 p G i k F k j + E i j
where X is the concentrations matrix of the sample, G is the source contribution matrix, F is the source component spectrum matrix, and E is the residual matrix.
Moreover, the optimal profiles and contributions that minimize the objective function Q can be derived with PMF (Equation (4)). The equation is as follows:
Q = i = 1 n j = 1 m c i j k = 1 p g i j f k i u i j 2 Q = i = 1 n j = 1 m e i j u i j 2
where Q is the objective function, i indicates the i-th sample, j indicates the j-th element, and k indicates the k-th potential source.
The PMF model does not need the detailed source component spectrum, but only needs to load the sample concentration data and the uncertainty data corresponding to the sample concentration. The uncertainty uij was calculated according to the following formula (Equations (5) and (6)):
For CijMDL,
u i j = 5 / 6 × M D L
For Cij > MDL,
u i j = R S D × c i j 2 + M D L 2
where RSD is the relative standard deviation, Cij is the concentration of the chemical element, and MDL is the species-specific method detection limit.

2.5. The Geostatistical Method

Semivariogram models are a unique function of geostatistics, which can accurately describe the spatial variation characteristics of regionalized variables and explain the phenomenon of heavy metal contamination [27]. Nuggets (nugget value), Range (range) and Sill (top value) are the important parameters of this function [28], and the formula is as follows (Equations (7) and (8)):
r ( h ) = 1 2 N ( h ) × i = 1 N ( h ) Z ( x i ) Z ( x i + h ) 2
Z ( x 0 ) = r i × Z ( x i )
where Z(xi) and Z (xi + h) are measured values of regional variables Z(x) at spatial locations xi and xi + h, r(h) is the semivariance function value, N(h) is the total number of point pairs when the sample point distance is h, Z(x0) is the value of unknown points, and Z(xi) is the value of known sampling points.

2.6. Statistical Analysis

The mean value, standard deviation and coefficient of variation, geoaccumulation index, and potential ecological risk assessment of dust heavy metal concentrations in the study area were collected by SPSS 23.0 and Microsoft Excel, and the geostatistical analysis was collected by GS+9.0 and ArcGIS 10.4, the analysis of heavy metal sources was completed using PMF 5.0.

3. Results

3.1. Descriptive Statistical of Heavy Metal Concentrations

Descriptive statistics of the concentrations of eleven heavy metals in surface dust are summarized in Table 1. The mean concentrations of all heavy metals were Ba > Zn > Mn > Sr > Pb> Cr > V> Cu > Ni > As > Co, among which the total amount of Zn has the largest extreme value gap and the ratio of maximum to minimum value is 25.21, and the difference of Co element is the smallest with the ratio of 1.93, indicating that Zn has many abnormal high values. Except for Mn, Co, V, and Ni, the mean concentrations of Cu, Zn, Sr, Ba, Pb, Cr, and As were 1.29~9.30 times higher than the background values. The point concentration of Cu, Zn, Sr, Ba, and Pb exceeded the background value by 100%; Cr, Ni, and As were 96.15%, 94.23%, and 96.15%, respectively; Mn, Co, and V did not exceed the local background values. The coefficients of variation (CV) of all heavy metals were Zn > Pb > As > Cu > Cr > Ni > Ba > Sr > Co > V > Mn, and the CV of Cu, Zn, As, and Pb was greater than 30%, indicating that the spatial variation and dispersion degree of Cu, Zn, As, and Pb were the largest, and the source is complex, which may be the most affected by anthropogenic activities. Cr, Ni, Ba, and Sr were between 16% and 30%, indicating a moderate intensity variability, which may be influenced by both local parent material and anthropogenic activities. Co, V, and Mn are below 16%, indicating weak variability and a relatively uniform spatial distribution [38]. It can be seen that heavy metals in the surface dust of the bus stops in the main district of Tianshui City exceed the standard to a certain extent, especially Cu, Zn, Sr, Ba, and Pb elements, and there is a risk of heavy metal pollution in the surface dust.
Comparing the concentration of surface dust in the study area with the concentration of surface dust and soil heavy metals in other large cities, the concentration of Co, V, and As was relatively high, Cr and Ni were in the middle, followed by Cu, Zn, Mn, and Pb. In general, except for some elements such as Co, V, and As, which were slightly lower than those in big cities, elements such as Cu, Zn, Mn, and Pb were more seriously polluted in big cities such as New York and London, and their emissions must be strictly controlled (Table 2).

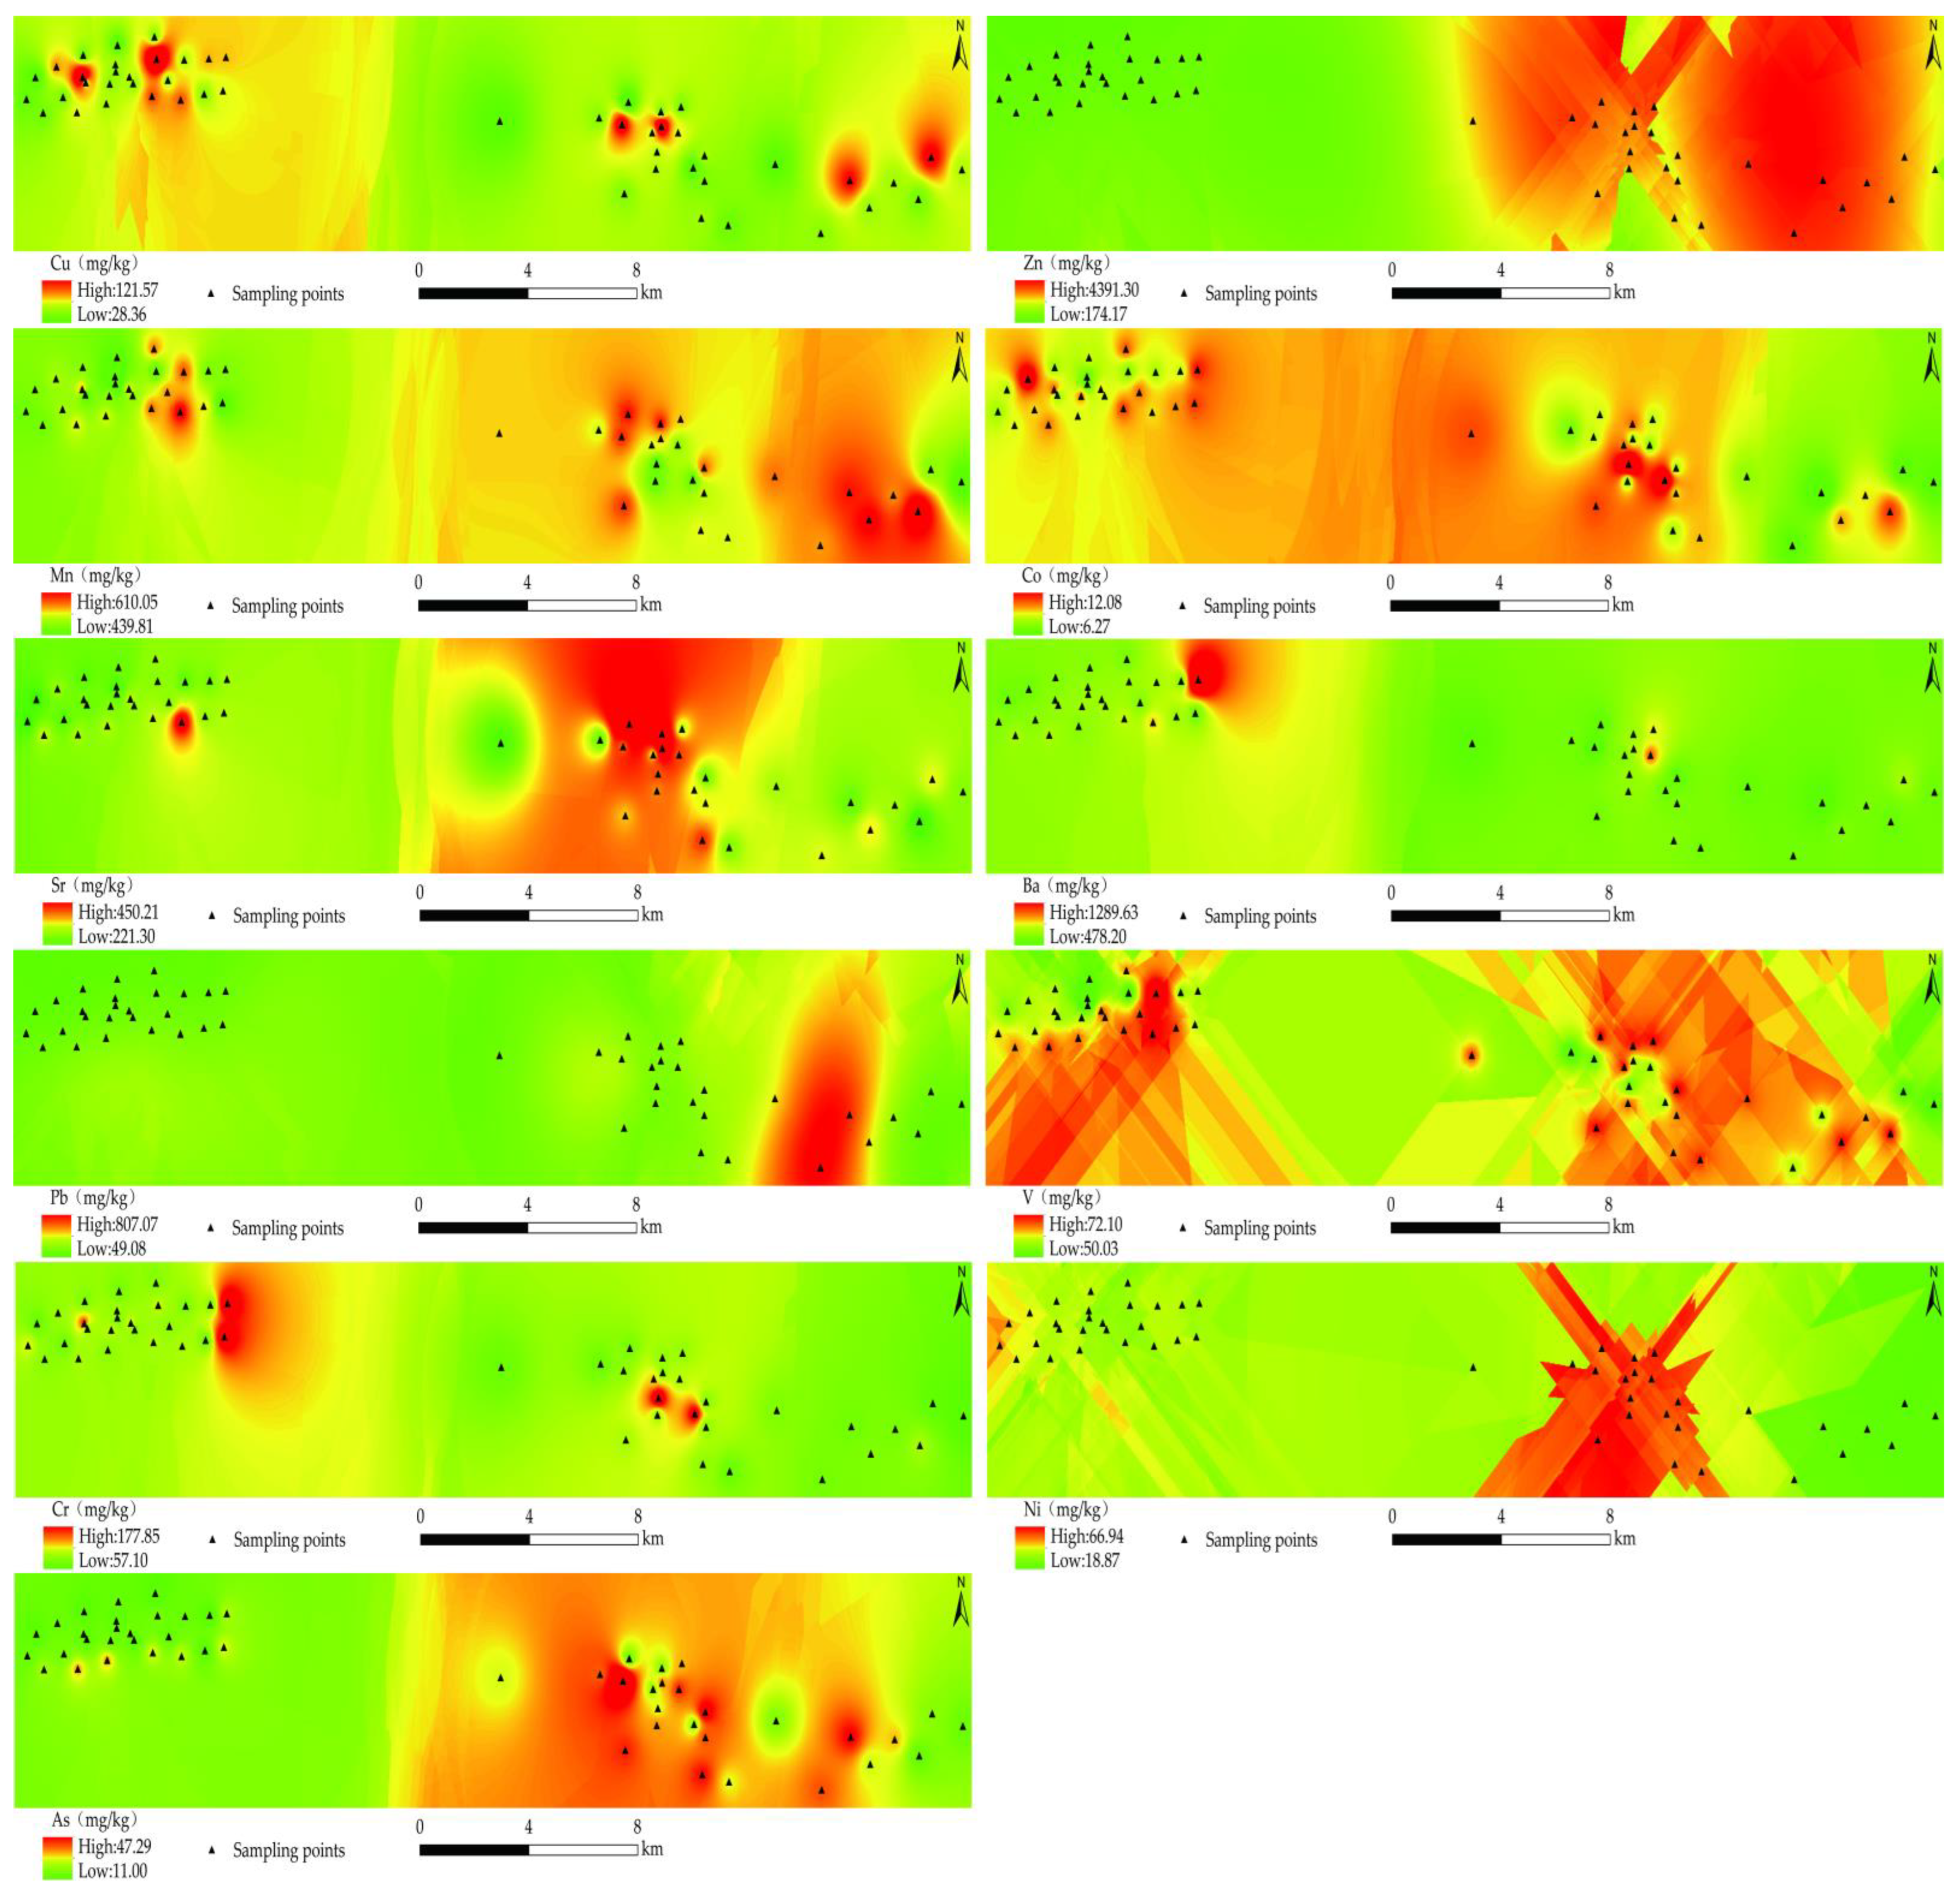
3.2. A Spatial Distribution of Heavy Metals

GS+9.0 geostatistical software was used to calculate and fit the variogram of 11 heavy metals in surface dust, and analyze the spatial structure of regional variables. The residual (RSS) and determination coefficients (R2) were used as the evaluation criteria for the optimal model. The closer the RSS was to 0 and R2 was to 1, indicates the better fitting model. C0/(C0 + C) was used to represent spatial autocorrelation. When C0/(C0 + C) < 0.25, it indicates that the spatial autocorrelation of the variable is strong, showing that the structural variation is mainly parent material, terrain and geology. When 0.25 ≤ C0/(C0 + C) < 0.75, the Table 3 shows that the spatial autocorrelation degree of variables is medium, and when C0/(C0 + C) ≥ 0.75, the spatial autocorrelation of the variables is weak [46]. Before the fitting, the Kolmogorov-Smirnov (K-S) method was used for the normality test. It was tested and fitted (Table 3). Cu, Ba, V, and As were fitted with the spherical model, Cr and Ni were fitted with the linear model, and Zn, Mn, Co, Sr, and Pb were fitted with the exponential model. The range of each variable was between 2375 m and 8210 m, and the coefficient of determination R2 was large, with a minimum value of 0.744, indicating that the selected model meets the requirements. The block-base ratio of all heavy metals ranges from 0.11 to 0.63, in the order of Zn > As > Ba > Cu > Cr > Sr > Ni > Pb > Mn > V > Co. The C0/(C0 + C) of Mn, V, and Co was less than 0.25, indicating that the spatial variability of these three heavy metals was mainly controlled by natural factors [27]. The C0/(C0 + C) of other heavy metals was between 0.25 and 0.75, and the spatial variation had a middle-scale correlation, indicating that it was mainly influenced by anthropogenic activities factors [28].
According to the semivariogram calculation and fitting model, the spatial variability of each heavy metal element was analyzed by using the ordinary Kriging method in the Arcgis10.4 software, and the spatial distribution map of the heavy metal concentration in the dust was drawn (Figure 2). It can be seen from Figure 2 that the spatial distribution characteristics of some heavy metals are similar. For example, the high-value areas of Pb, Zn, Ni, and As elements were mainly distributed in the eastern part of the study area, showing a distribution pattern of “low in the west and high in the east”, as the high-value samples were mainly distributed in the Maiji. The high-value samples of Cu, Sr, Ba, and Cr showed a spot-like distribution pattern in the study area, while the concentrations of Mn, Co, and V were relatively small in the whole study area, far less than the background values (644 mg/kg, 12.4 mg/kg, and 81.90 mg/kg), and the excessive rate of Mn, Co, and V were zero with weak variation; it can be considered that these three elements were not contaminated in the study area. Through investigation, it was found that the area with high heavy metal value distribution was the downtown area with convenient transportation and bustling commercial enterprises, with a large population density, frequent anthropogenic activities, and large traffic flow. It was mainly the bus stops near shopping centers, building materials markets, schools, auto repair and selling shops, machinery processing plants, and coal-fired boilers. Furthermore, the low-value distribution area of heavy metals is a residential area with few industrial and commercial enterprises, low population density, and a small traffic flow. In general, although the distribution of heavy metals in the surface dust in the study area showed different patterns, the areas with a high concentration of heavy metals were mainly a result of the comprehensive action of anthropogenic activities such as traffic and industry emissions.

3.3. The Pollution Assessment of Heavy Metals

The Geoaccumulation Index (Igeo) can identify the concentration of heavy metal contamination in the dust of bus stops in the study area (Table 4). The average values of Igeo in the surface dust of bus stops in the study area were: Pb (2.20) > Zn (1.88) > Cu (0.52) > As (0.03) > Ba (−0.02) > Sr (−0.03) > Cr (−0.17) > Mn (−0.69) > Ni (−0.83) > V (−0.90) > Co (−1.13), indicating that Pb, Zn, Cu, and As were the main contamination factors. Among them, Pb was moderately-seriously contaminated, and sampling points contaminated were dominated by moderately and moderately-seriously contaminated, accounting for 34.62% and 36.54% respectively; Zn was moderately contaminated, accounting for 44.23% and 30.77% of moderately contaminated, and moderately-seriously contaminated samples were 44.23% and 30.77% respectively; some samples were extremely contaminated, while Cu was mainly No-moderately contaminated, accounting for 76.92%, while Mn, Co, Sr, Ba, V, Cr, Ni, and As were mainly uncontaminated.
The results of the potential ecological risk index (RI) showed that (Figure 3), the mean value of heavy metal RI in surface dust in the study area was 95.41, which belonged to the serious risk category of ecological risk. The potential ecological risks of all heavy metals were Pb (46.50) > As (16.19) > Cu (11.13) > Zn (8.07) > Ni (4.04) > Co (3.23) > Cr (2.58) > V (1.48) > Ba (1.36) > Mn (0.82). Pb, As, and Cu were the main ecological factors, among which Pb contributed the most to RI and has reached a serious ecological risk, while Cu and As have reached a medium moderate risk. The RI of 54% of the samples were between 42 and 84, indicating a moderate ecological risk state; the RI of 40% of the samples were between 84 and 168, indicating a serious ecological risk state; only 6% of the samples had an RI higher than 168, indicating an extremely serious ecological risk. For example, samples 29, 44, and 50 were all large bus hubs in the study area with numerous stopping lines. They are located on the east main road of Chengji Avenue and the east main Road of Xihuang Avenue at the same time, with large traffic flow, schools, scrap stations, spray paint shops, and building materials companies distributed around them, and frequent pollution emitted by anthropogenic activities were the main reasons for the extremely serious ecological risk in the study area.

4. Discussion

4.1. The Correlation Analysis

The correlation analysis is of great help to the rationality of the PMF model analytical results and the judgment of the pollution source type [24]. Fe2O3 and MgO are the main products formed by the weathering of the soil parent material; elements with a high correlation with Fe2O3 and MgO are often judged as natural sources, while heavy metal elements from man-made sources have a low correlation with these elements [47]. As can be seen from Table 5, the correlation coefficients of Mn-Fe2O3, Co-MgO and V-Fe2O3 were relatively high, 0.82, 0.86 and 0.85 respectively, and passed the test at the level of 0.01. Moreover, as can be seen from Table 2, the excessive rate of the concentration of elements V, Mn, and Co was zero, indicating that the concentrations were greatly affected by each other and their sources were consistent. Therefore, it was preliminarily considered that these three elements were mainly affected by the parent material of soil formation. The correlation coefficients of Zn-As, Zn-Pb and As-Pb were 0.76, 0.74 and 0.65, respectively (p < 0.01), indicating that the pairwise correlation between the three heavy metals was high and the homology between the elements was strong, indicating that they may have the same source. The correlation coefficient of Cr-Ni was 0.66, and the correlation with Fe2O3 and MgO was high (p < 0.01), indicating that Cr-Ni may have the same source. In addition, the correlation between Cu, Sr, and Ba and the major elements of the parent material was low, and the correlation between the two was low, so it was difficult to judge the pollution sources by the correlation coefficient between the heavy metals and the specific sources need to be further analyzed.

4.2. The Quantitative Source with the PMF

In this paper, different pollution sources were tested in the PFM model. After importing the heavy metal concentrations data into the EPA PMF 5.0 software, the model was run 20 times. Four optimal factors were selected as the optimal results of the PMF model based on the minimum Q value; the signal-to-noise ratio (S/N) of all elements was greater than 2, and the Qrobust/Qtrue tended to converge. The residuals were between −3 and 3, indicating that the data quality was reasonable, so the analytical results obtained by the four factors have significant reliability. The source appointment results of the heavy metal concentrations are shown in Figure 4 and Figure 5.
As can be seen from Figure 4, the components of V, Mn, and Co are the highest in factor 1, Cu, Sr, and Ba were the highest in factor 2, Cr and Ni were the highest in factor 3, and As, Zn, and Pb were the highest in factor 4, indicating that they represent different pollution sources, respectively. Combined with the above correlation analysis results, the source analysis results of the PMF model showed that the contribution rate of factor 1 to V, Mn, and Co was 32.12%, 30.34%, and 33.37%, respectively, indicating that these three elements were mainly affected by factor 1. V and Mn were usually the indicator elements of the crust and were mainly affected by the loess in the recent Holocene. The source of Co was related to the lead-zinc ore and iron ore [48], but more studies have shown that Co was influenced by the soil parent material [49]. The contribution values of the four pollution factors at each sampling point were obtained through the analytic results of the PMF model, and the spatial distribution maps of different pollution sources in the study area were drawn according to the contribution values, as shown in Figure 5. The high-value sample of the factor 1 contribution was located at the foot of the Beishan in the Qinzhou District and the turning point of the Weihe River basin in the Maiji District, which may be due to the low overall terrain of the study area and because heavy metals are prone to being contamination by river impacts [48]. Meanwhile, according to the statistics of heavy metal concentration in the surface dust of the bus stop mentioned above, the concentration values of V, Mn, and Co elements in all sample points were lower than the background values, and the excessive rate was zero with weak variability and little influence by anthropogenic activities, indicating that the source was mainly related to the natural parent material, which was consistent with the research results of Yalcin [49]. Therefore, it can be considered that factor 1 is attributed to representing natural sources.
The contribution rates of factor 2 to Cu, Sr, and Ba are 51.50%, 36.62%, and 53%, respectively, indicating that these three elements are mainly affected by factor 2. Studies have shown that the open environment of the bus stop made the dust greatly affected by the external conditions. For example, atmospheric deposition was more likely to cause the accumulation of heavy metal pollutants, and the ultra-fine particles released by the friction of tires and brakes were an important reason for the high concentration of heavy metal pollutants [50]. Due to its corrosion resistance and good thermal conductivity, Cu can be used in the manufacture of automotive brake system pipelines and radiators, which may come from the wear of automotive parts, lubricating oil additives and anti-oxidation materials [51]. The excessive rate of Sr concentration was 100%, and the CV was moderately variable, indicating that it was closely related to anthropogenic activities; relevant studies have shown that Sr was mainly used in alloy manufacturing and all kinds of lamps and that the source of the Sr element was related to the manufacturing of industrial alloys [52]. The concentration excessive rate of Ba was 100%. Ba is also widely used in alloy manufacturing, which can be used to make barium salt, alloy, and fireworks. In addition, Ba is also an excellent deoxygenating agent in copper refining, so Ba can also be regarded as an identifying element of industrial discharge [53]. According to Figure 5, high-value areas of factor 2 were concentrated in the vicinity of major traffic lines in the Qinzhou District, such as the junction of Jihe North Road-Dazhong Middle Road, Jihe Sorth Road-Tianqing Road, Yingbin Road-Minshan Road, and Chengji Avenue West Road-Luoyu Road, among others, with dense bus lines and large traffic flow. In addition, Tianshui has a good industrial foundation, with equipment manufacturing as the main body, and the electronic control system of the oil drilling rig has a high reputation in the country. In the high-value area of factor 2, fur factories, building materials stores, lamp sales centers, drilling stores, auto repair, auto parts centers, and pharmaceutical equipment companies are also distributed. In the process of unloading, handling, and selling, Sr and Ba with different concentrations were released, which were contaminated in the bus stops with dust, which was consistent with the research results of Krishna [52]. Therefore, factor 2 can be considered as the mixed pollution source caused by traffic-industrial alloy manufacturing.
The contribution rate of factor 3 to Cr and Ni are 45.06% and 44.70%, respectively. Studies have shown that Cr and Ni exist widely in nature and are mainly affected by the parent material [53]. However, the above analysis showed that the concentration exceeding the background value rate of Cr and Ni were 96.15% and 94.23%, respectively, and both have moderate intensity variability. It indicated that Cr and Ni are not controlled by natural factors and are mainly affected by frequent anthropogenic activities. Several studies have confirmed that due to their excellent corrosion resistance, Cr and Ni were mainly used in the production of stainless steel, electroplating synthesis, and other building materials. It was also an important component in the production of the roadbed and real estate building materials such as concrete, bricks, and glass [54]. Cr pollution in the urban environment may be related to the wear and tear of Cr alloy parts exposed to high temperatures, and Ni mainly comes from urban social and economic activities, such as construction waste generated during demolition and decoration projects [55]. Combined with Figure 5, it was found that the high-value samples of factor 3 were concentrated in the middle of the study area, where there is a large area of road renovation, demolition of old buildings, and a large number of building activities under construction, so in the process of repairing urban roads, building under construction and demolition of old residential areas, processing, transportation and use of building materials will also produce waste materials. For example, through a leaching experiment, heavy metals As, Cr, Hg, and Ni were detected in concrete and cement mixtures, and it was pointed out that the pollution characteristics of heavy metals in construction waste largely depended on the source of construction waste [55]. In conclusion, the surface dust Cr and Ni pollution of the bus stops in the study area was caused by the settlement of dust particles from construction, so factor 3 was considered as the source of construction waste pollution.
The contribution rate of factor 4 to As, Zn, and Pb are 49.89%, 71.02%, and 75.25%, respectively. The research showed that As in urban surface sediments was mainly related to the burning of fossil fuels such as coal [56], which releases a large amount of soot into the air. The heavy metals in the soot diffuse and settle in the surface environment with the airflow. In this study, the excess rate of As was 96.15%; combined with the field survey, coal is used as an important supply of energy in metal smelting and winter heating in the study area, so As may come from the atmospheric deposition of flue gas generated by fuel combustion. The element combination of Zn-Pb was regarded as a major indicator of traffic emissions [57]; among the 11 heavy metals analyzed, the coefficient of variation of Zn was the largest (129%), indicating that it was more influenced by anthropogenic activities. In Addition, Zn was a material used as a hardener for automobile tires, and the Zn-containing dust after tire wear was deposited on the nearby building platform on both sides of the road, resulting in the accumulation of Zn at the bus stops [58]. Pb is added to batteries, wheel balance blocks, aluminum alloys, and other automotive parts, while gasoline often adds tetraethyl lead as an explosion-proof agent in gasoline combustion. Most of the tetraethyl lead decomposes into inorganic lead salt and lead oxides, with the atmospheric deposition causing impervious ground contamination. Although the production, sale, and use of leaded gasoline has been banned since 2000, lead-free gasoline is gasoline with lead concentration below 0.013 g/L, and so still contains some lead. The concentration of Pb particles in automobile exhausts can be as high as 20~50 μg/L, and the half-life of Pb is as long as several hundred years, and it still accumulates in the surface environment [59]. As can be seen from Figure 5, the high-value area of factor 4 is mainly concentrated in the Maiji area, with many central traffic arteries, including national roads, railways, and highways running through the city. Meanwhile, the start and stop frequency of people and cars near the bus stops is high, and the released pollutants settle on the surface of the atmosphere. Therefore, factor 4 can be considered a mixed source of pollution from coal burning and traffic emissions.
In conclusion, the PMF results are natural sources (18.33%), transport-industrial alloy manufacturing mixed sources (26.99%), construction waste pollution sources (17.17%), and coal-traffic mixed sources (37.52%), respectively. In several studies, Cu-Zn-Pb was regarded as a major indicator of traffic emissions [60], while correlation analysis and geo-statistical analysis show that Mn, Co, and V come from the natural environment. Therefore, the analysis results of the three methods are consistent, and the indicative statistical analysis, multivariate statistical analysis, and PMF model can complement each other and verify the analysis of the surface dust heavy metal source, indicating that the results of this study are reliable.

4.3. Limitations and Impacts

Due to the limited budget, the number of samples in this study was limited. In subsequent studies, seasonal sampling, in-bus sampling, and atmospheric dust sampling can be combined for a comprehensive analysis, to study the temporal and spatial variation of dust pollutants in bus stops, and to further assess the health risks of bus stop pollutants to citizens and the ecological environment risks of local air and surface runoff in detail. The ecological risk assessment of heavy metals in the surface dust of bus stops adopts the traditional potential ecological risk assessment method, which determines the toxicity response coefficient of heavy metals, was not reasonable [61]. With the development and maturity of the measurement methods of form and bioavailability in the future, the bioavailability of heavy metals should be integrated into this method. In addition, the source appointment of the pollutants in urban surface dust is an extremely complex problem [62,63,64]. Thus, it is necessary to comprehensively verify the sources of heavy metal pollution by combining the field health situation and environmental pollution investigation, and to determine the health risks of the city bus stops surface dust pollution to citizens and the ecological environment risks to the atmosphere and water body.

5. Conclusions

Based on this study, certain main conclusions were obtained.
(1)
The sampling points exceeding the rate of Cu, Zn, Sr, Ba, and Pb were 100%. Cr, Ni, and As were 96.15%, 94.23% and 96.15%, respectively. The high-value areas of Pb, Zn, Ni, and As were mainly distributed in the eastern part of the study area. The high values of Cu, Sr, Ba, and Cr showed a spot-like distribution pattern, while Mn, Co, and V did not contaminate the study area.
(2)
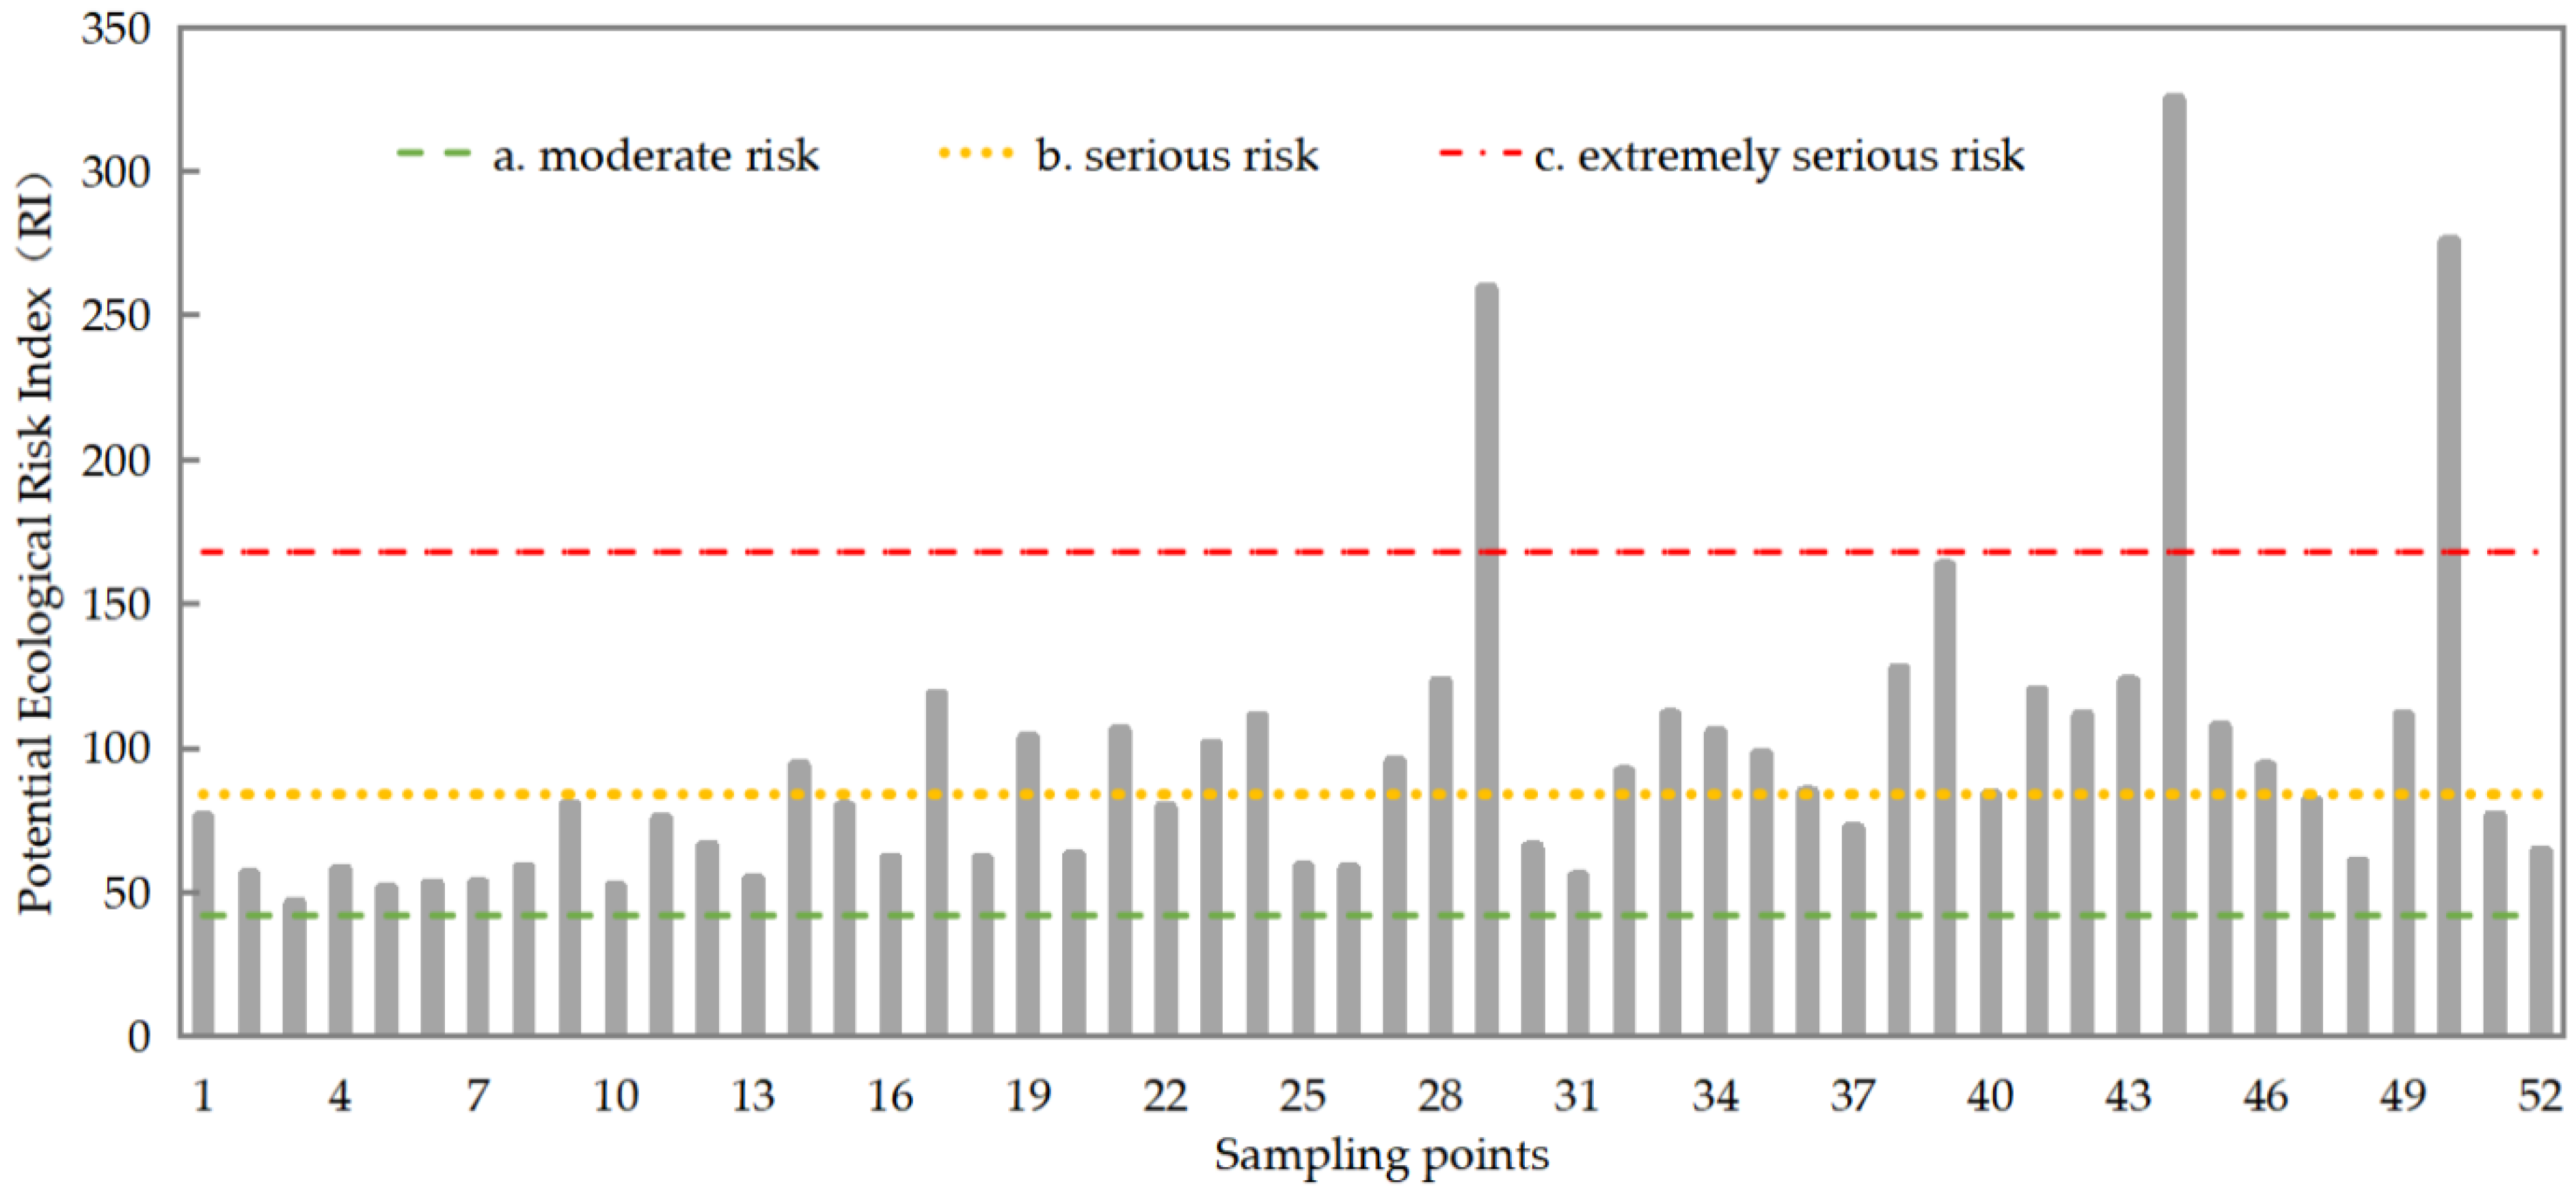
The Igeo results showed that As, Cu, Zn, and Pb were the main contamination factors. The RI was a serious ecological risk, with Pb, As, and Cu as the main ecological factors. The RI of 54% of the samples was a moderate ecological risk, 40% of samples were a serious ecological risk, and only 6% of samples were an extremely serious ecological risk.
(3)
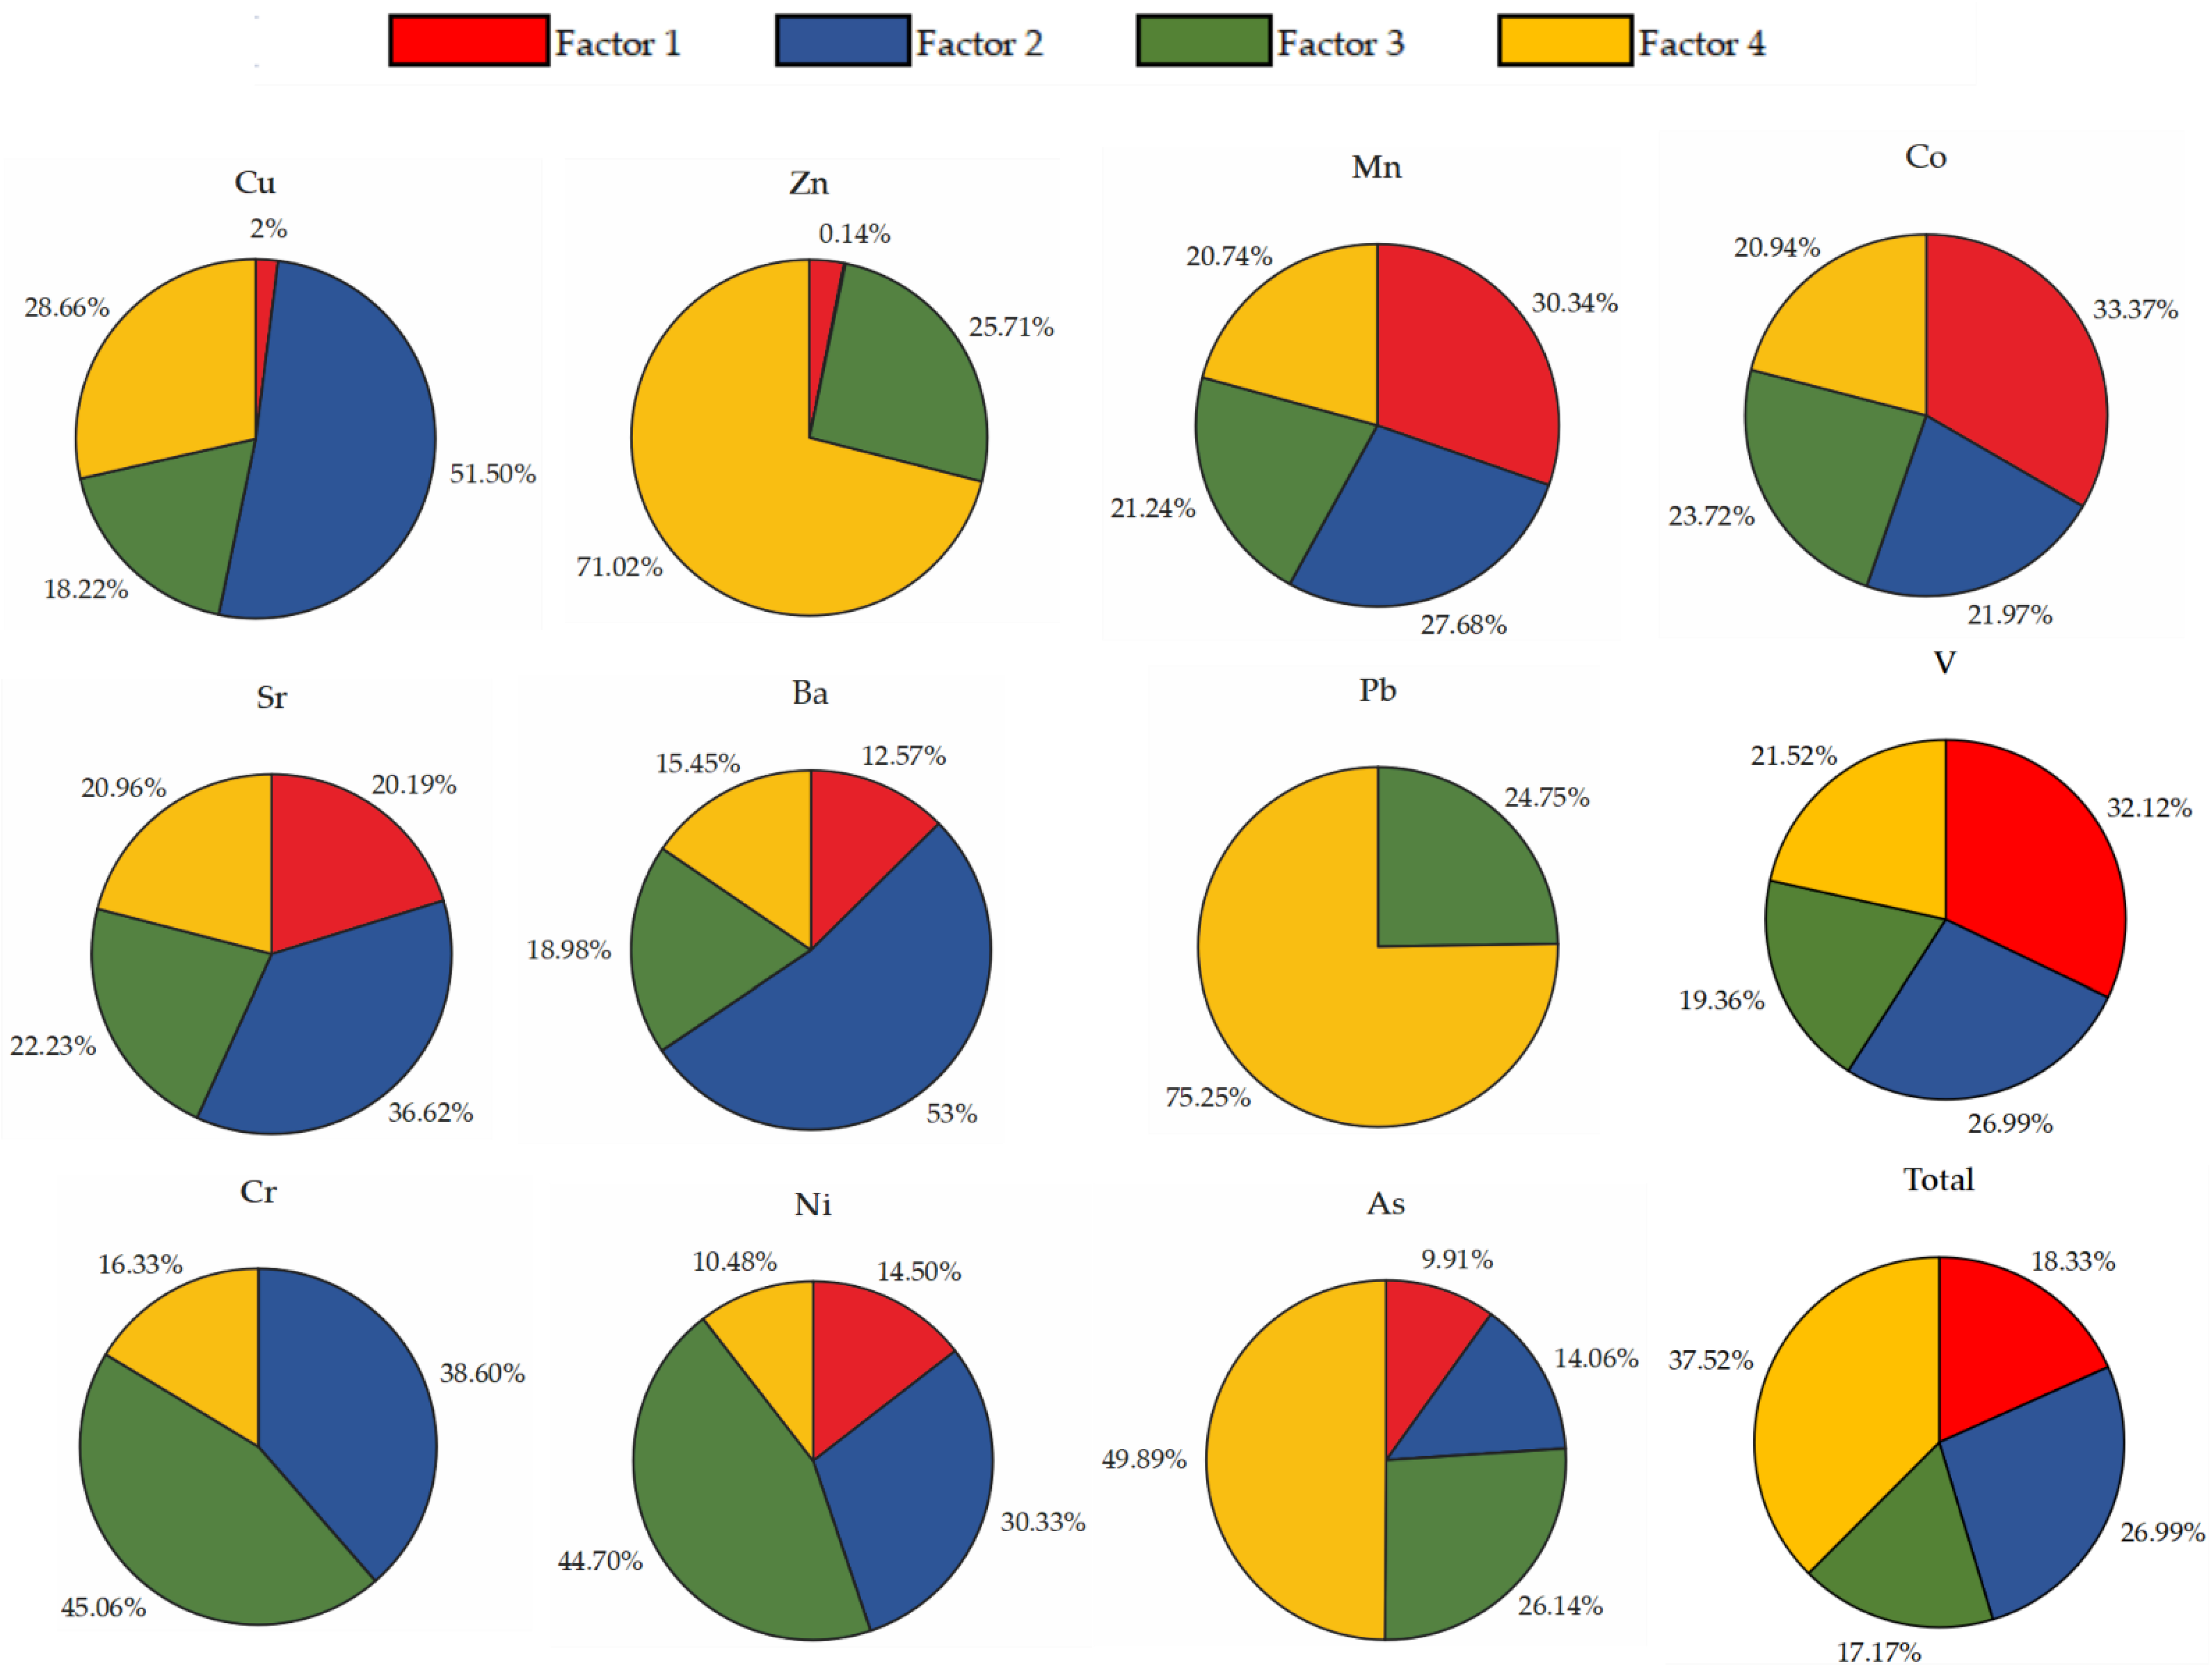
The PMF source analysis results showed that natural sources accounted for 18.33%, the proportion of mixed pollution sources from transportation and industrial alloy manufacturing was 26.99%, the construction waste pollution sources accounted for 17.17%, and the coal-traffic mixed pollution sources accounted for 37.52%.
The results indicate that the local geological background, coal-traffic emissions, construction waste and metallurgy-related industrial activities are mainly responsible for the accumulation of heavy metals, so it is necessary to strictly control the emission of artificial sources of heavy metal pollution. Additionally, all the results showed that the theoretical semivariogram models and PMF methods could complement each other in the identification of the sources of heavy metals in surface dust in the study area. The use of multiple source apportionment models can help governments make targeted control strategies for heavy metal dispersion. In the future study, more elements and models will be selected to be analyzed and compared, so that the source assignment is more objective.

Author Contributions

Conceptualization, C.L. and X.W.; methodology, C.L. and X.W.; software, S.X.; validation, C.L. and H.W.; writing—review and editing, C.L.; funding acquisition, S.X. and H.W. All authors have read and agreed to the published version of the manuscript.

Funding

This research was funded by the National Natural Science Foundation of China (grant numbers 41771220), the Education Science and Technology Innovation Fund of Gansu Province (grant numbers 2022B-350).

Data Availability Statement

Not applicable.

Conflicts of Interest

The authors declare no conflict of interest.

References

  1. Day, J.P.; Hart, M.; Robinson, M.S. Lead in urban street dust. Nature 1975, 253, 343–345. [Google Scholar] [CrossRef]
  2. Kolesar, K.R.; Schaaf, M.D.; Bannister, J.W.; Schreuder, M.D.; Heilmann, M.H. Characterization of potential fugitive dust emissions within the Keeler Dunes, an inland dune field in the Owens Valley, California, United States. Aeolian Res. 2021, 54, 100765. [Google Scholar] [CrossRef]
  3. Shi, D.; Lu, X.; Xu, X.; Han, X. Study on heavy metal pollution and sources of suspended dust on roads in Baotou city. Environ. Sci. Technol. 2019, 42, 16–23. [Google Scholar]
  4. Wu, F.; Kong, S.; Yan, Q.; Wang, W.; Liu, H.; Wu, J.; Zheng, H.; Zheng, S.; Cheng, Y.; Niu, Z.; et al. Sub-type source profiles of fine particles for fugitive dust and accumulative health risks of heavy metals: A case study in a fast-developing city of China. Environ. Sci. Pollut. Res. 2020, 27, 16554–16573. [Google Scholar] [CrossRef] [PubMed]
  5. Chen, H.; Lu, X.W.; Li, L.Y.; Gao, T.; Chang, Y. Metal contamination in campus dust of Xi’an, China: A study based on multivariate statistics and spatial distribution. Sci. Total Environ. 2014, 484, 27–35. [Google Scholar] [CrossRef] [PubMed]
  6. Li, X.P.; Feng, L.N.; Huang, C.C.; Yan, X.Y.; Zhang, X. Chemical characteristics of atmospheric fallout in the south of Xi’an during the dust episodes of 2001–2012 (NW China). Atmos. Environ. 2014, 83, 109–118. [Google Scholar] [CrossRef]
  7. Tang, R.L.; Ma, K.M.; Zhang, Y.X.; Mao, Q. The spatial characteristics and pollution levels of metals in urban street dust of Beijing, China. Appl. Geochem. 2013, 35, 88–98. [Google Scholar] [CrossRef]
  8. Bucse, A.; Dan, V.; Balan, S.; Parvulescu, O.C.; Dobre, T. Heavy metalspatial distribution and pollution assessment in the surface sediments of the north western black sea shelf. Rev. Chim. Buchar. Orig. Ed. 2020, 71, 155–170. [Google Scholar] [CrossRef]
  9. Kumar, M.; Furumai, H.; Kurisu, F.; Kasuga, I. Tracing source and distribution of heavy metals in road dust, soil and soakaway sediment through speciation and isotopic fingerprinting. Geoderma 2013, 211–212, 8–17. [Google Scholar] [CrossRef]
  10. Lee, P.; Youm, S.; Jo, H.Y. Heavy metal concentrations and contamination levels from Asian dust and identification of sources: A case-study. Chemosphere 2013, 91, 1018–1025. [Google Scholar] [CrossRef]
  11. Kelly, F.J.; Zhu, T. Transport solutions for cleaner air. Science 2016, 352, 934–936. [Google Scholar] [CrossRef] [PubMed] [Green Version]
  12. Wahab, M.I.A.; Abd Razak, W.M.A.; Sahani, M.; Khan, M.F. Characteristics and health effect of heavy metals on non-exhaust road dusts in Kuala Lumpur. Sci. Total Environ. 2020, 703, 135535. [Google Scholar] [CrossRef]
  13. Duong, T.T.; Lee, B.K. Determining contamination level of heavy metals in road dust from busy traffic areas with different characteristics. J. Environ. Manag. 2011, 92, 554–562. [Google Scholar] [CrossRef]
  14. Li, H.; Shi, A.; Zhang, X. Particle size distribution and characteristics of heavy metals in road-deposited sediments from beijing olympic park. J. Environ. Sci. 2015, 32, 228–237. [Google Scholar] [CrossRef] [PubMed]
  15. Sun, Z.; Zhou, J.; Hu, B.; Wang, Z.; Meng, W.; Wang, Z. Characteristics of heavy metal pollution in urban street dust of Tianjin. Ecol. Environ. Sci. 2014, 23, 157–163. [Google Scholar]
  16. Wang, K.; Zuo, S.; Li, K.; Hua, Z.; Chen, L.; He, Y. Bioaccessibility and health risk assessment of heavy metals in the dusts in bus stops in Shijiazhuang City. Sci. Technol. Eng. 2020, 20, 14737–14742. [Google Scholar]
  17. Zheng, X.; Zhao, W.; Yan, X.; Shu, T.; Xiong, Q.; Chen, F. Pollution Characteristics and Health Risk Assessment of Airborne Heavy Metals Collected from Beijing Bus Stations. Int. J. Environ. Res. Public Health 2015, 12, 9658–9671. [Google Scholar] [CrossRef] [PubMed] [Green Version]
  18. Li, X.; Chen, Z.; Zhang, Y.; Chen, Z. Concentrations, Sources and health risk assessments of heavy metals in ground surface dust from urban bus terminals of Fuzhou City. Res. Environ. Sci. 2013, 26, 906–912. [Google Scholar]
  19. Li, H.Y.; Zhang, Q.; Chen, C.R.; Wang, L.T.; Wei, Z.; Zhou, S.; Parworth, C.; Zheng, B.; Canonaco, F.; Prévôt, A.S.H.; et al. Wintertime aerosol chemistry and haze evolution in an extremely polluted city of the North China Plain: Significant contribution from coal and biomass combustion. Atmos. Chem. Phys. 2017, 17, 4751–4768. [Google Scholar] [CrossRef] [Green Version]
  20. Wu, D.; Liao, B.T.; Wu, M.; Chen, H.Z.; Wang, Y.C.; Liao, X.N.; Sun, D. The long-term trend of haze and fog days and the surface layer transport conditions under haze weather in North China. Acta Sci. Circumstantiae 2014, 34, 1–11. [Google Scholar]
  21. Kim, S.; Kim, T.-Y.; Yi, S.-M.; Heo, J. Source apportionment of PM2.5 using positive matrix factorization (PMF) at a rural site in Korea. J. Environ. Manag. 2018, 214, 325–334. [Google Scholar] [CrossRef] [PubMed]
  22. Chai, L.; Wang, Y.; Wang, X.; Ma, L.; Cheng, Z.; Su, L.; Liu, M. Quantitative source apportionment of heavy metals in cultivated soil and associated model uncertainty. Ecotoxicol. Environ. Saf. 2021, 215, 112150. [Google Scholar] [CrossRef]
  23. Guan, Q.; Wang, F.; Xu, C.; Pan, N.; Luo, H. Source apportionment of heavy metals in agricultural soil based on pmf: A case study in hexi corridor, northwest china. Chemosphere 2017, 193, 189–197. [Google Scholar] [CrossRef] [PubMed]
  24. Li, Y.; Zhou, S.; Liu, K.; Wang, G.; Wang, J. Application of apca-mlr receptor model for source apportionment of char and soot in sediments. Sci. Total Environ. 2020, 746, 141165. [Google Scholar] [CrossRef]
  25. Lu, X.; Hu, W.; Huang, B.; Zu, Y.; Zhan, F.; Kuang, R. Source apportionment of heavy metals in farmland soils around mining area based on unmix model. Environ. Sci. 2017, 39, 1421–1429. [Google Scholar]
  26. Hu, M.; Li, C.; Li, N.; Ji, T.; Zheng, D. Using the matter-element extension model to assess heavy metal pollution in topsoil in parks in the main district park of lanzhou city. J. Environ. Sci. 2021, 42, 2457–2468. [Google Scholar]
  27. Webster, R.; Oliver, M.A. Statistics for earth and environmental scientists. In Geostatistics for Environmental Scientists, 2nd ed.; John Wiley & Sons: Hoboken, NJ, USA, 2008. [Google Scholar]
  28. Wang, Y.Q.; Bai, Y.R.; Wang, J.Y. Distribution of soil heavy metal and pollution evaluation on the different sampling scales in farmland on yellow river irrigation area of Ningxia: A case study in Xingqing county of Yinchuan city. Environ. Sci. 2014, 35, 2714. [Google Scholar]
  29. Xiao, J.; Wang, L.; Deng, L.; Jin, Z. Characteristics, sources, water quality and health risk assessment of trace elements in river water and well water in the chinese loess plateau. Sci. Total Environ. 2018, 650, 2004–2012. [Google Scholar] [CrossRef]
  30. Wang, F.; Li, Z.; Yang, H.; Wang, F.; You, X.; Zhang, M.; Zhang, X.; Zhou, Q. Study on atmospheric particulate matter transport channel and pollution source area in Tianshui City. Environ. Chem. 2020, 9, 2371–2383. [Google Scholar]
  31. Wei, B.G.; Jiang, F.Q.; Li, X.M.; Mu, S.Y. Spatial distribution and contamination assessment of heavy metals in urban road dusts from Urumqi, NW China. Microchem. J. 2009, 93, 147–152. [Google Scholar] [CrossRef]
  32. Wei, B.G.; Yang, L.S. A review of heavy metal contamination in urban soils, urban road dusts and agricultural soils from China. Microchem. J. 2010, 94, 99–107. [Google Scholar] [CrossRef]
  33. Muller, G. Index of geoaccumulation in sediments of the rhine river. GeoJournal 1969, 2, 109–118. [Google Scholar]
  34. Zhang, Z.; Shao, T.; Wei, P. Assessment of heavy metal pollution and potential ecological hazards in atmospheric dust in kaifeng city. J. Arid Land Resour. Environ. 2019, 33, 156–162. [Google Scholar]
  35. Zhang, Z.; Abuduwaili, J.; Jiang, F. Heavy metal contamination, sources, and pollution assessment of surface water in the tianshan mountains of china. Environ. Monit. Assess. 2015, 187, 4191. [Google Scholar] [CrossRef] [PubMed]
  36. Hakanson, L. An ecological risk index for aquatic pollution control.a sedimentological approach. Water Res. 1980, 14, 975–1001. [Google Scholar] [CrossRef]
  37. Zhao, Y.; Deng, R.; Liang, Y.; Dang, Y. Pollution Characteristic and Ecological Risk Evaluation of Heavy Metals in Duliu River; Pearl River: Neshoba County, MI, USA, 2016. [Google Scholar]
  38. Xu, X.; Zhang, X.; Peng, Y.; Li, R.; Zhao, Y. Spatial distribution and source apportionment of agricultural soil heavy metals in a rapidly developing area in east china. Bull. Environ. Contam. Toxicol. 2021, 106, 33–39. [Google Scholar] [CrossRef]
  39. Wu, J.; Fang, F.; Yao, Y. Bioaccessibility and spatial distribution of heavy metals in dust from different activity areas of elementary schools in Huainan City. Acta Sci. Circumstantiae 2017, 37, 1287–1296. [Google Scholar]
  40. Xiang, L.; Li, Y.; Shi, J. Investigation of heavy metal and polycyclic aromatic hydrocarbons contamination in street dusts in urban Beijing. Environ. Sci. 2010, 31, 159–167. [Google Scholar]
  41. Wang, G.; Chen, Y.; Xia, D. Magnetic property of urban topsoil and its implication of heavy metal pollution in Shanghai. Acta Sci. Circumstantiae 2018, 38, 3302–3312. [Google Scholar]
  42. Shi, D.; Lu, X. Contamination levels and source analysis of heavy metals in the Finer particles of urban road dust from Xi’an, China. Environ. Sci. 2018, 39, 3126–3133. [Google Scholar]
  43. Zhang, H.; Ren, Q.; Wei, J. Analysis on the heavy metal pollutants in atmospheric dust in different regions of Urumqi and its sources apportionment. Environ. Pollut. Control 2014, 36, 19–23. [Google Scholar]
  44. Guo, W.; Sun, W.; Zhao, R. Characteristic and evaluation of soil pollution by heavy metal in different functional zones of Hohhot. Environ. Sci. 2013, 34, 1561–1567. [Google Scholar]
  45. Fergusson, J.E.; Ryan, D.E. The elemental composition of street dust from large and small urban areas related to city type, source and particle size. Sci. Total Environ. 1984, 34, 101–116. [Google Scholar] [CrossRef]
  46. Wang, T.; Wang, G. Spatial distribution of water quality parameters in lake Kuncheng. Acta Sci. Circumstantiae 2007, 27, 1384–1390. [Google Scholar]
  47. Wilson, M.J. Weathering of the primary rock-forming minerals: Processes, products and rates. Clay Miner. 2004, 39, 233–266. [Google Scholar] [CrossRef] [Green Version]
  48. Yang, Z.; Lu, W.; Liu, X.; Xin, X. Heavy metal identification for near-surface urban dust in Changchun city. J. Arid Land Resour. Environ. 2010, 24, 155–160. [Google Scholar]
  49. Yalcin, M.G.; Battaloglu, R.; Ilhan, S. Heavy metal sources in sultan marsh and its neighborhood, Kayseri, Turkey. Environ. Geol. 2007, 53, 399–415. [Google Scholar] [CrossRef]
  50. Yang, X.; Chen, Y.; Xu, D.; He, T.; Nie, C. Characteristics of heavy metal pollution and health risk assessment in subway dust in beijing. China Environ. Sci. 2011, 31, 944–950. [Google Scholar]
  51. Yang, Y.; Yan, H.; Mude, M. Characteristic and evaluation of soil pollution by heavy metal in different greenbelts of Hohhot. North. Hortic. 2019. [Google Scholar]
  52. Gasmi, T.; Khouni, I.; Ghrabi, A. Assessment of heavy metals pollution using multivariate statistical analysis methods in wadi el bey (Tunisia). Desalination Water Treat. 2016, 57, 22152–22165. [Google Scholar] [CrossRef]
  53. Pereira, P.; Vieira, C.; Lopes, M. Characterization of Construction and Demolition Wastes (C&DW)/Geogrid Interfaces; Taylor & Francis: London, UK, 2015. [Google Scholar]
  54. Wei, X.; Wu, P.; Zhang, H.; Fan, M.; Gao, C. Spatial distribution and source identification of heavy metals in soils on the alluvial islands in the Anhui section of Yangtze river. Acta Sci. Circumstantiae 2017, 37, 1921–1930. [Google Scholar]
  55. Chen, L.; Zhou, S.; Wu, S.; Wang, C.; Li, B.; Li, Y. Combining emission inventory and isotope ratio analyses for quantitative source apportionment of heavy metals in agricultural soil. Chemosphere 2018, 204, 140. [Google Scholar] [CrossRef] [PubMed]
  56. Zhong, W.; Tao, D.; Wang, G.; Li, Q.; Jiang, M. Structure of international iron flow: Based on substance flow analysis and complex network. Resour. Conserv. Recycl. 2018, 136, 345–354. [Google Scholar] [CrossRef]
  57. Swab, C.; Lmcab, C.; Hhw, D.; Jie, L.A.; Qsw, A.; Xie, L.A. Spatial distribution and source apportionment of heavy metals in soil from a typical county-level city of Guangdong province, china. Sci. Total Environ. 2019, 655, 92–101. [Google Scholar]
  58. Zheng, Y.; Song, B.; Chen, T.; Zheng, G.; Huang, Z. Zinc accumulation and pollution risk in soils under different land use types in Beijing. J. Nat. Res. 2006, 21, 64–72. [Google Scholar]
  59. Chen, T.; Chang, Q.; Liu, J.; Clevers, J.G.P.W.; Kooistra, L. Identification of soil heavy metal sources and improvement in spatial mapping based on soil spectral information: A case study in northwest china. Sci. Total Environ. 2016, 565, 155–164. [Google Scholar] [CrossRef]
  60. Chen, F.; Chen, X.; Zhu, F.; Sun, Q. Distribution characteristics and pollution assessment of heavy metals in sediments of Zhushan bay. IOP Conf. Ser. Earth Environ. Sci. 2019, 358, 022025. [Google Scholar] [CrossRef] [Green Version]
  61. Karim, Z.; Qureshi, B.A.; Mumtaz, M. Geochemical baseline determination and pollution assessment of heavy metals in urban soils of Karachi, Pakistan. Ecol. Indic. 2015, 48, 358–364. [Google Scholar] [CrossRef]
  62. Mi, W.X.; Xie, B. Research on reducing the pollutants in urban surface runoff by the urban Greenland. Shanghai Chem. Ind. 2007, 32, 2. [Google Scholar]
  63. Jrlskog, I.; Strmvall, A.M.; Magnusson, K.; Galfi, H.; Andersson-Skld, Y. Traffic-related microplastic particles, metals, and organic pollutants in an urban area under reconstruction. Sci. Total Environ. 2021, 774, 145503. [Google Scholar] [CrossRef]
  64. Wang, H.; Zhao, Y.; Walker, T.R.; Wang, Y.; Wang, X. Distribution characteristics, chemical speciation and human health risk 1 assessment of metals in surface dust in Shenyang city, China. Appl. Geochem. 2021, 131, 105031. [Google Scholar] [CrossRef]
Figure 1. A schematic map of the study area and sampling points location.
Atmosphere 14 00591 g001
Figure 2. The spatial distribution of the concentrations of heavy metals.
Atmosphere 14 00591 g002
Figure 3. The ecological risk index of heavy metals at different sampling points.
Atmosphere 14 00591 g003
Figure 4. The contribution rates of different sources by the PMF model.
Atmosphere 14 00591 g004
Figure 5. The factor contribution rates of heavy metals are calculated by the PMF.
Atmosphere 14 00591 g005
Table 1. The statistical results of the heavy metals concentrations in bus stop surface dust (mg/kg).
Horizontal DimensionCuZnMnCoSrBaPbVCrNiAs
Min28.36174.17439.816.27221.30478.2049.6850.0357.1018.8711.00
Max121.574391.3610.0512.08450.211289.63807.0772.10177.8566.9447.29
Mean52.11540.78530.728.02262.94598.09166.4860.4189.2427.7918.95
Standard deviation18.37698.2037.130.9642.54112.25146.864.6625.607.646.78
Coefficientofvariation(%)351297121619888292736
Excessive Rate (%)10010000100100100096.1594.2396.15
Background Value [35]23.467.064412.418744017.981.969.334.411.7
Note: The excessive rate refers to the percentage of sampling points that exceed the local background value.
Table 2. A comparison of heavy metal contents in the dust of different cities (mg/kg).
CityCuZnMnCoPbVCrNiAs
Huainan [39]42.5511.0997.2180.1523.99
Beijing [40]78.30248.5069.6085.0041.10
Shanghai [41]186.40687.30765.19212.90218.9064.90
Xi’an [42]46.60169.20337.609.8097.4057.10177.5029.30
Urumqi [43]59.05806.00403.0033.9466.0548.79151.50
Hohhot [44]30.0789.93589.4211.6354.7516.476.40
London [45]191.001176.002008112.00
New York [45]335.001811.002583
Edinburgh [39]57.00213.00118.0016.0015.00
Amossio [39]26.40387.9836.1511.154.70
This study52.11540.78530.728.02166.4860.4189.2427.7918.95
Table 3. The results of the semivariance function analysis of heavy metal elements in the dust.
ElementTheoretical ModelNugget (C0)Sill (C0 + C)[C0/(C0 + C)]%]Range/mRSSR2
CuSpherical0.23 0.52 0.45 55000.014 0.912
ZnExponential0.43 0.69 0.63 53560.072 0.814
MnExponential0.19 0.96 0.20 75000.057 0.842
CoExponential0.06 0.59 0.11 45000.047 0.821
SrExponential0.24 0.61 0.40 33000.015 0.821
BaSpherical0.31 0.67 0.46 82100.036 0.744
PbExponential0.20 0.59 0.34 61520.062 0.843
VSpherical0.16 0.91 0.18 51000.027 0.752
Crlinear0.35 0.85 0.41 23750.015 0.845
Nilinear0.30 0.86 0.35 39000.016 0.862
AsSpherical0.25 0.46 0.54 62300.025 0.840
Table 4. A summary of the statistics related to the proportion of dust samples at different geoaccumulations (pollution (%)).
ClassIgeoCuIgeoZnIgeoMnIgeoCoIgeoSrIgeoBaIgeoPbIgeoVIgeoCrIgeoNiIgeoAs
Mean0.521.88−0.69−1.13−0.03−0.022.20−0.90−0.17−0.830.03
uncontaminated11.543.8598.0898.0882.6990.383.8598.0886.5494.2351.92
No-moderate contaminated76.9211.540015.387.695.77011.543.8544.23
Moderate contaminated9.6244.2301.920034.620001.92
Moderate-serious contaminated030.77000036.54001.920
Serious contaminated05.77000013.460001.92
Serious-extreme contaminated1.92000003.851.921.9200
Extremely contaminated03.851.9201.921.921.920000
Table 5. The correlation coefficients among heavy metals.
ElementsCuZnMnCoSrBaPbVCrNiAsFe2O3MgO
Cu1
Zn0.271
Mn0.040.34 *1
Co−0.11−0.220.081
Sr0.080.090.34 *0.091
Ba0.14−0.21−0.170.10.071
Pb0.160.74 **0.33 *−0.30 *0.03−0.181
V−0.30 *−0.120.68 **0.220.17−0.05−0.051
Cr0.18−0.09−0.220.67 **0.060.41 **−0.09−0.101
Ni−0.02−0.09−0.010.89 **0.20 0.03−0.140.030.66 **1
As0.190.76 **0.32 *−0.090.21−0.080.65 **0.030.01−0.021
Fe2O30.060.210.82 **0.69 **0.35 *0.30 *0.210.85 **0.47 **0.30 *0.35 *1
MgO−0.13−0.200.090.86 **0.25−0.01−0.240.270.49 **0.75 **−0.060.32 *1
Note: * significantly correlated at p < 0.05; ** significantly correlated at p < 0.01.
Disclaimer/Publisher’s Note: The statements, opinions and data contained in all publications are solely those of the individual author(s) and contributor(s) and not of MDPI and/or the editor(s). MDPI and/or the editor(s) disclaim responsibility for any injury to people or property resulting from any ideas, methods, instructions or products referred to in the content.

