
Characteristics of Heat Waves in Mainland China since 1961 Based on Absolute and Relative Methods

Abstract
:1. Introduction
2. Data and Methods
2.1. Data
2.2. Methods
2.2.1. Absolute Method
2.2.2. Relative Methods
2.2.3. Locally Weighted Scatterplot Smoother
3. Results
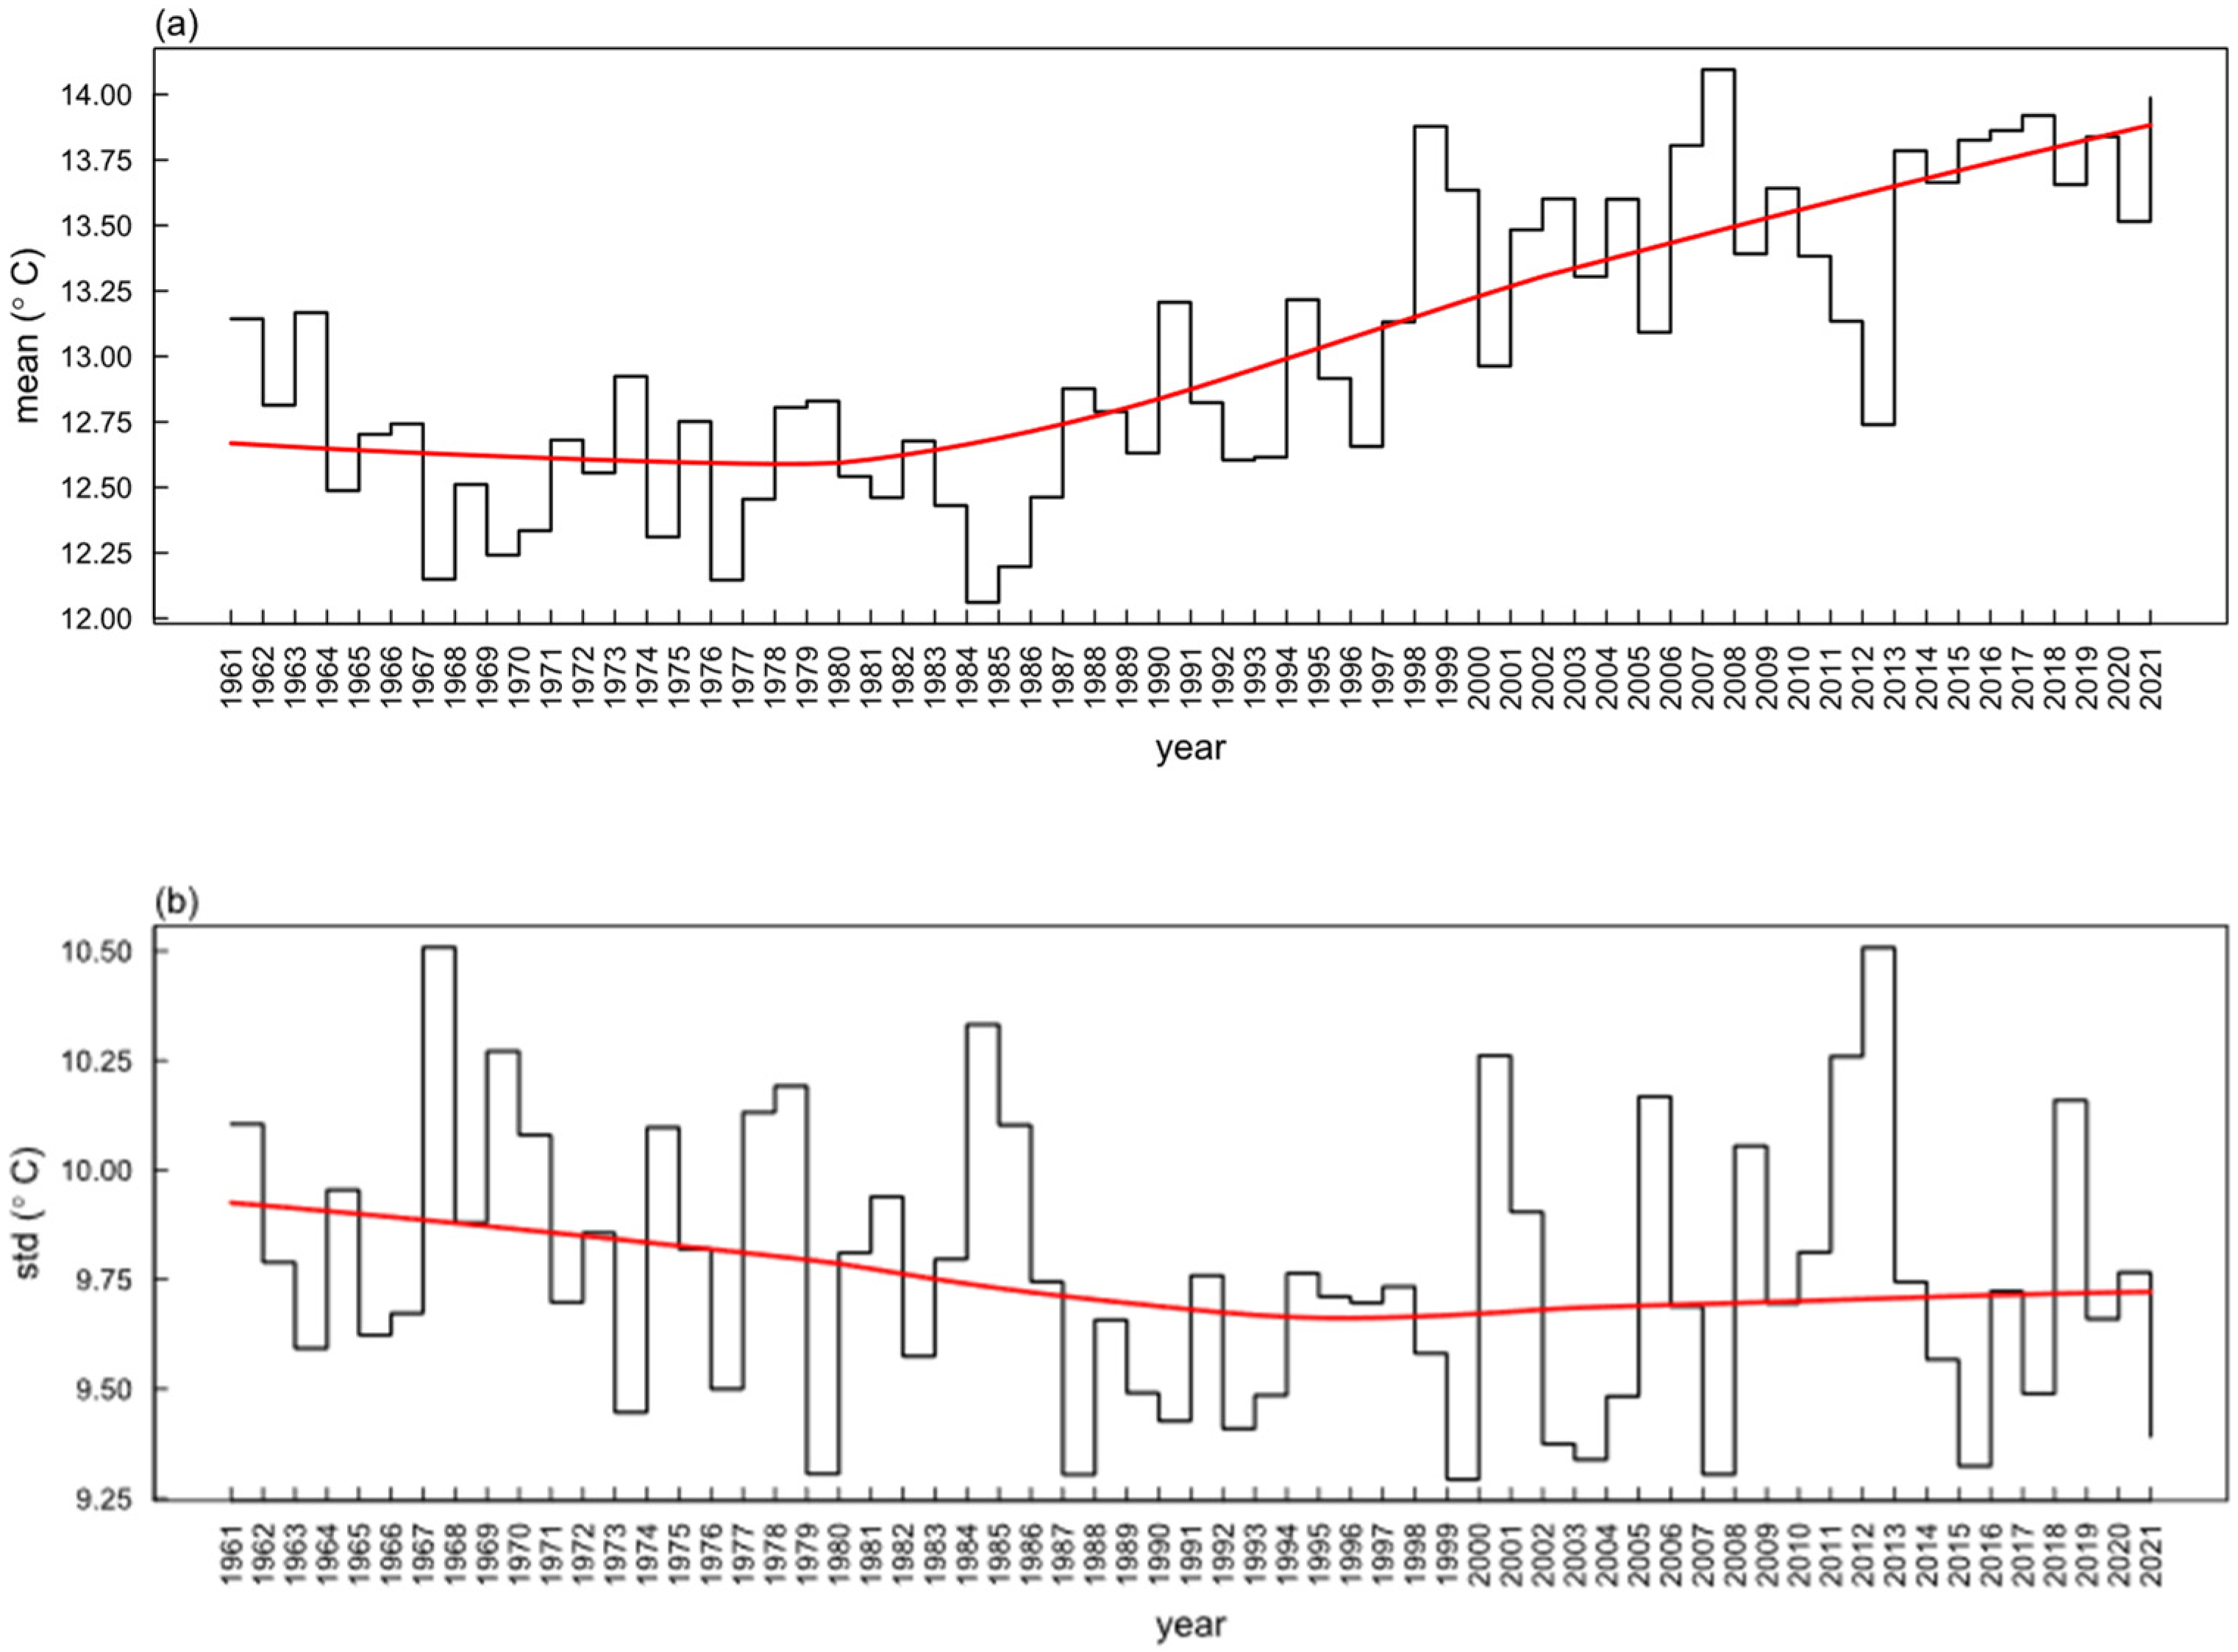
3.1. Analysis of Temperature Change in China from 1961 to 2020
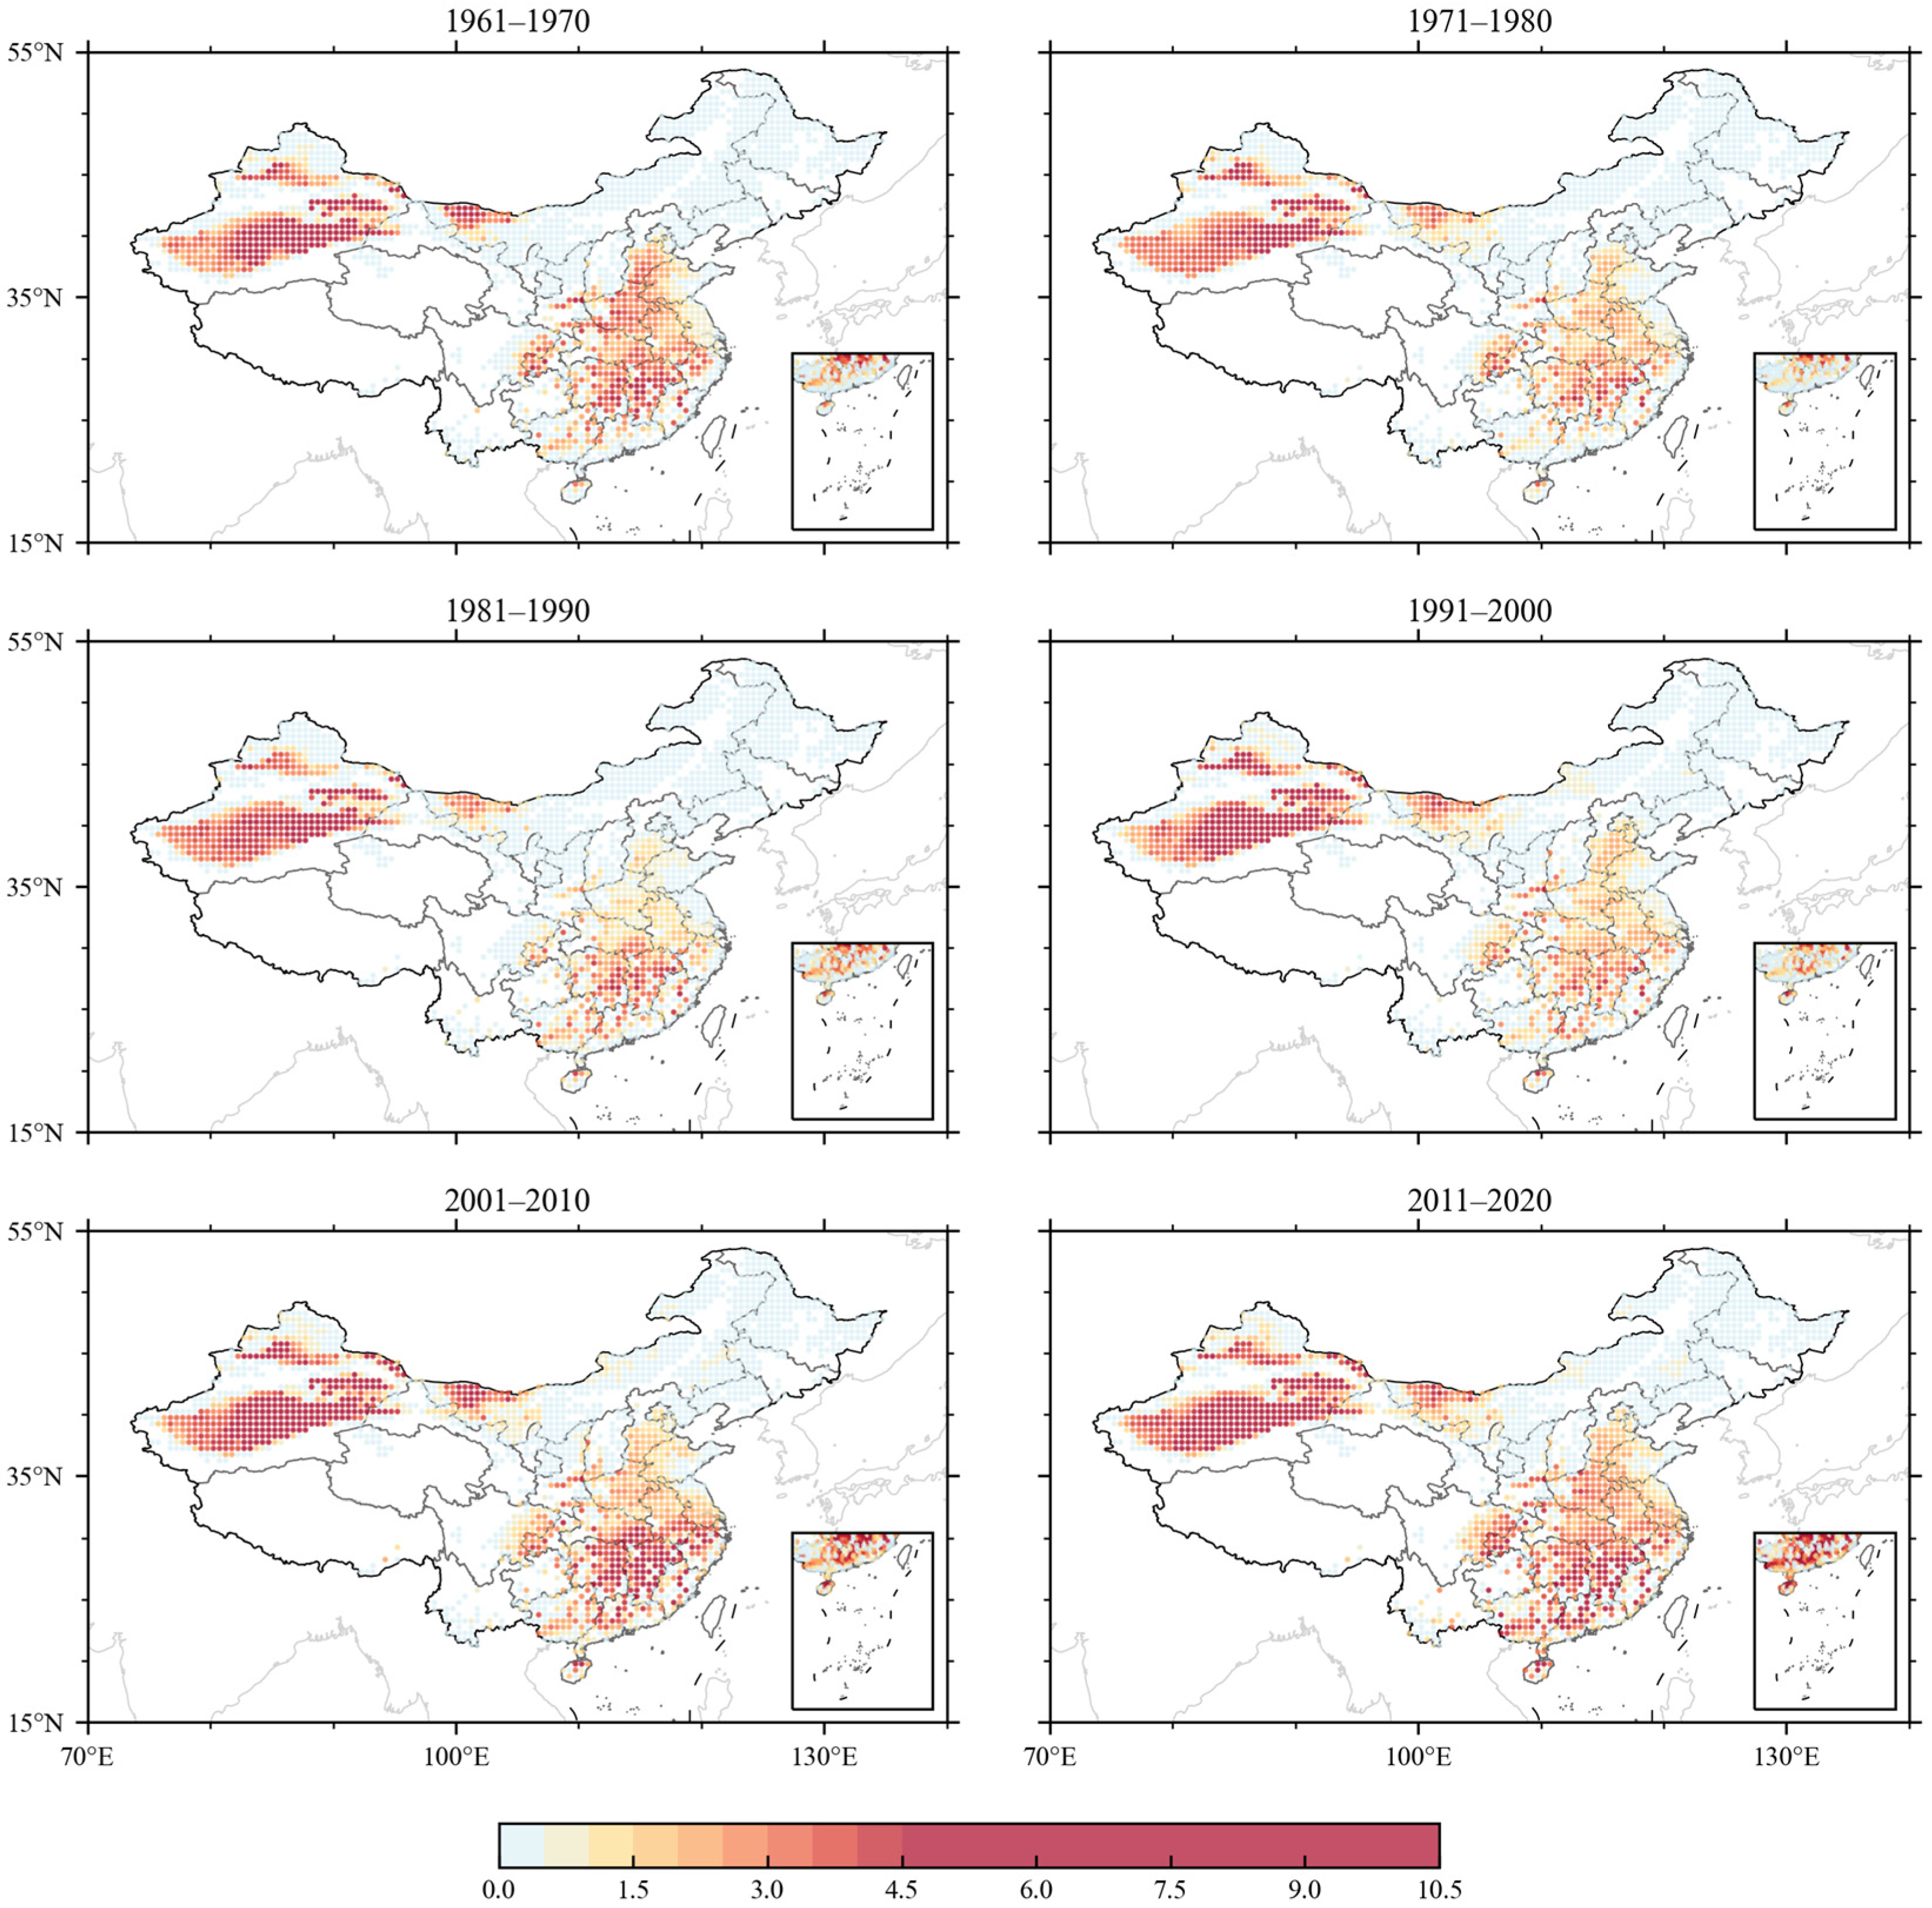
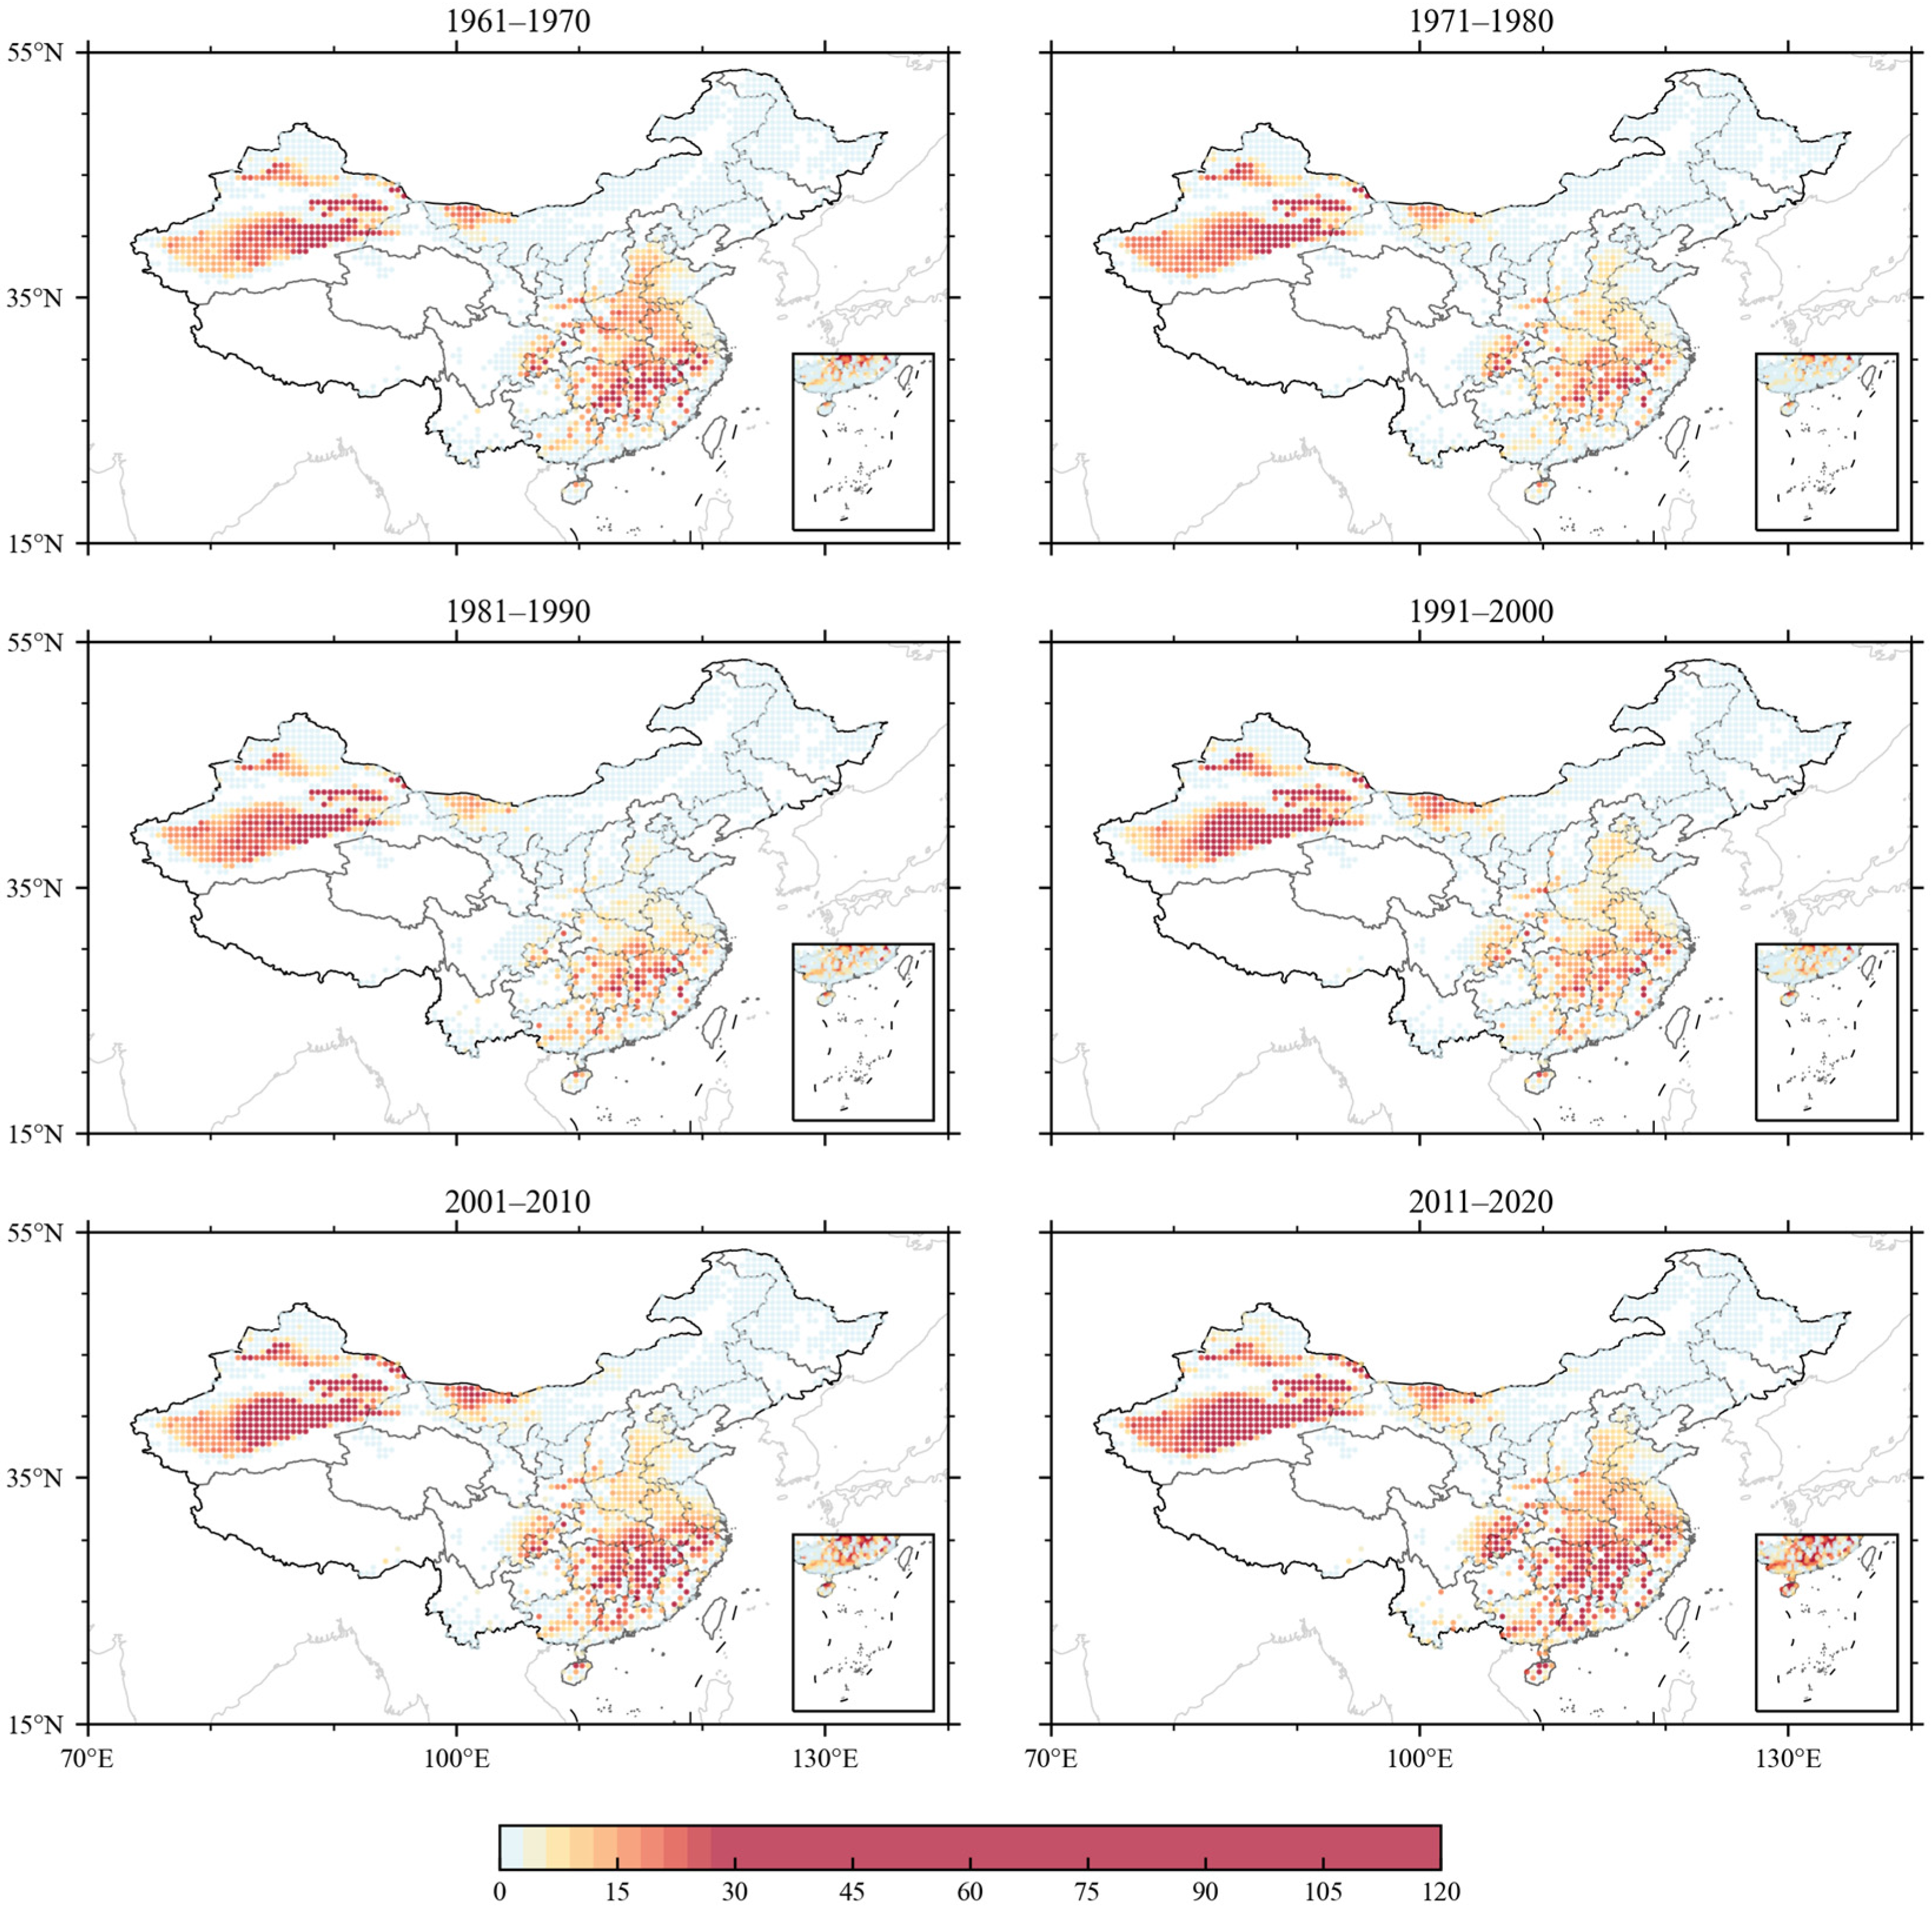
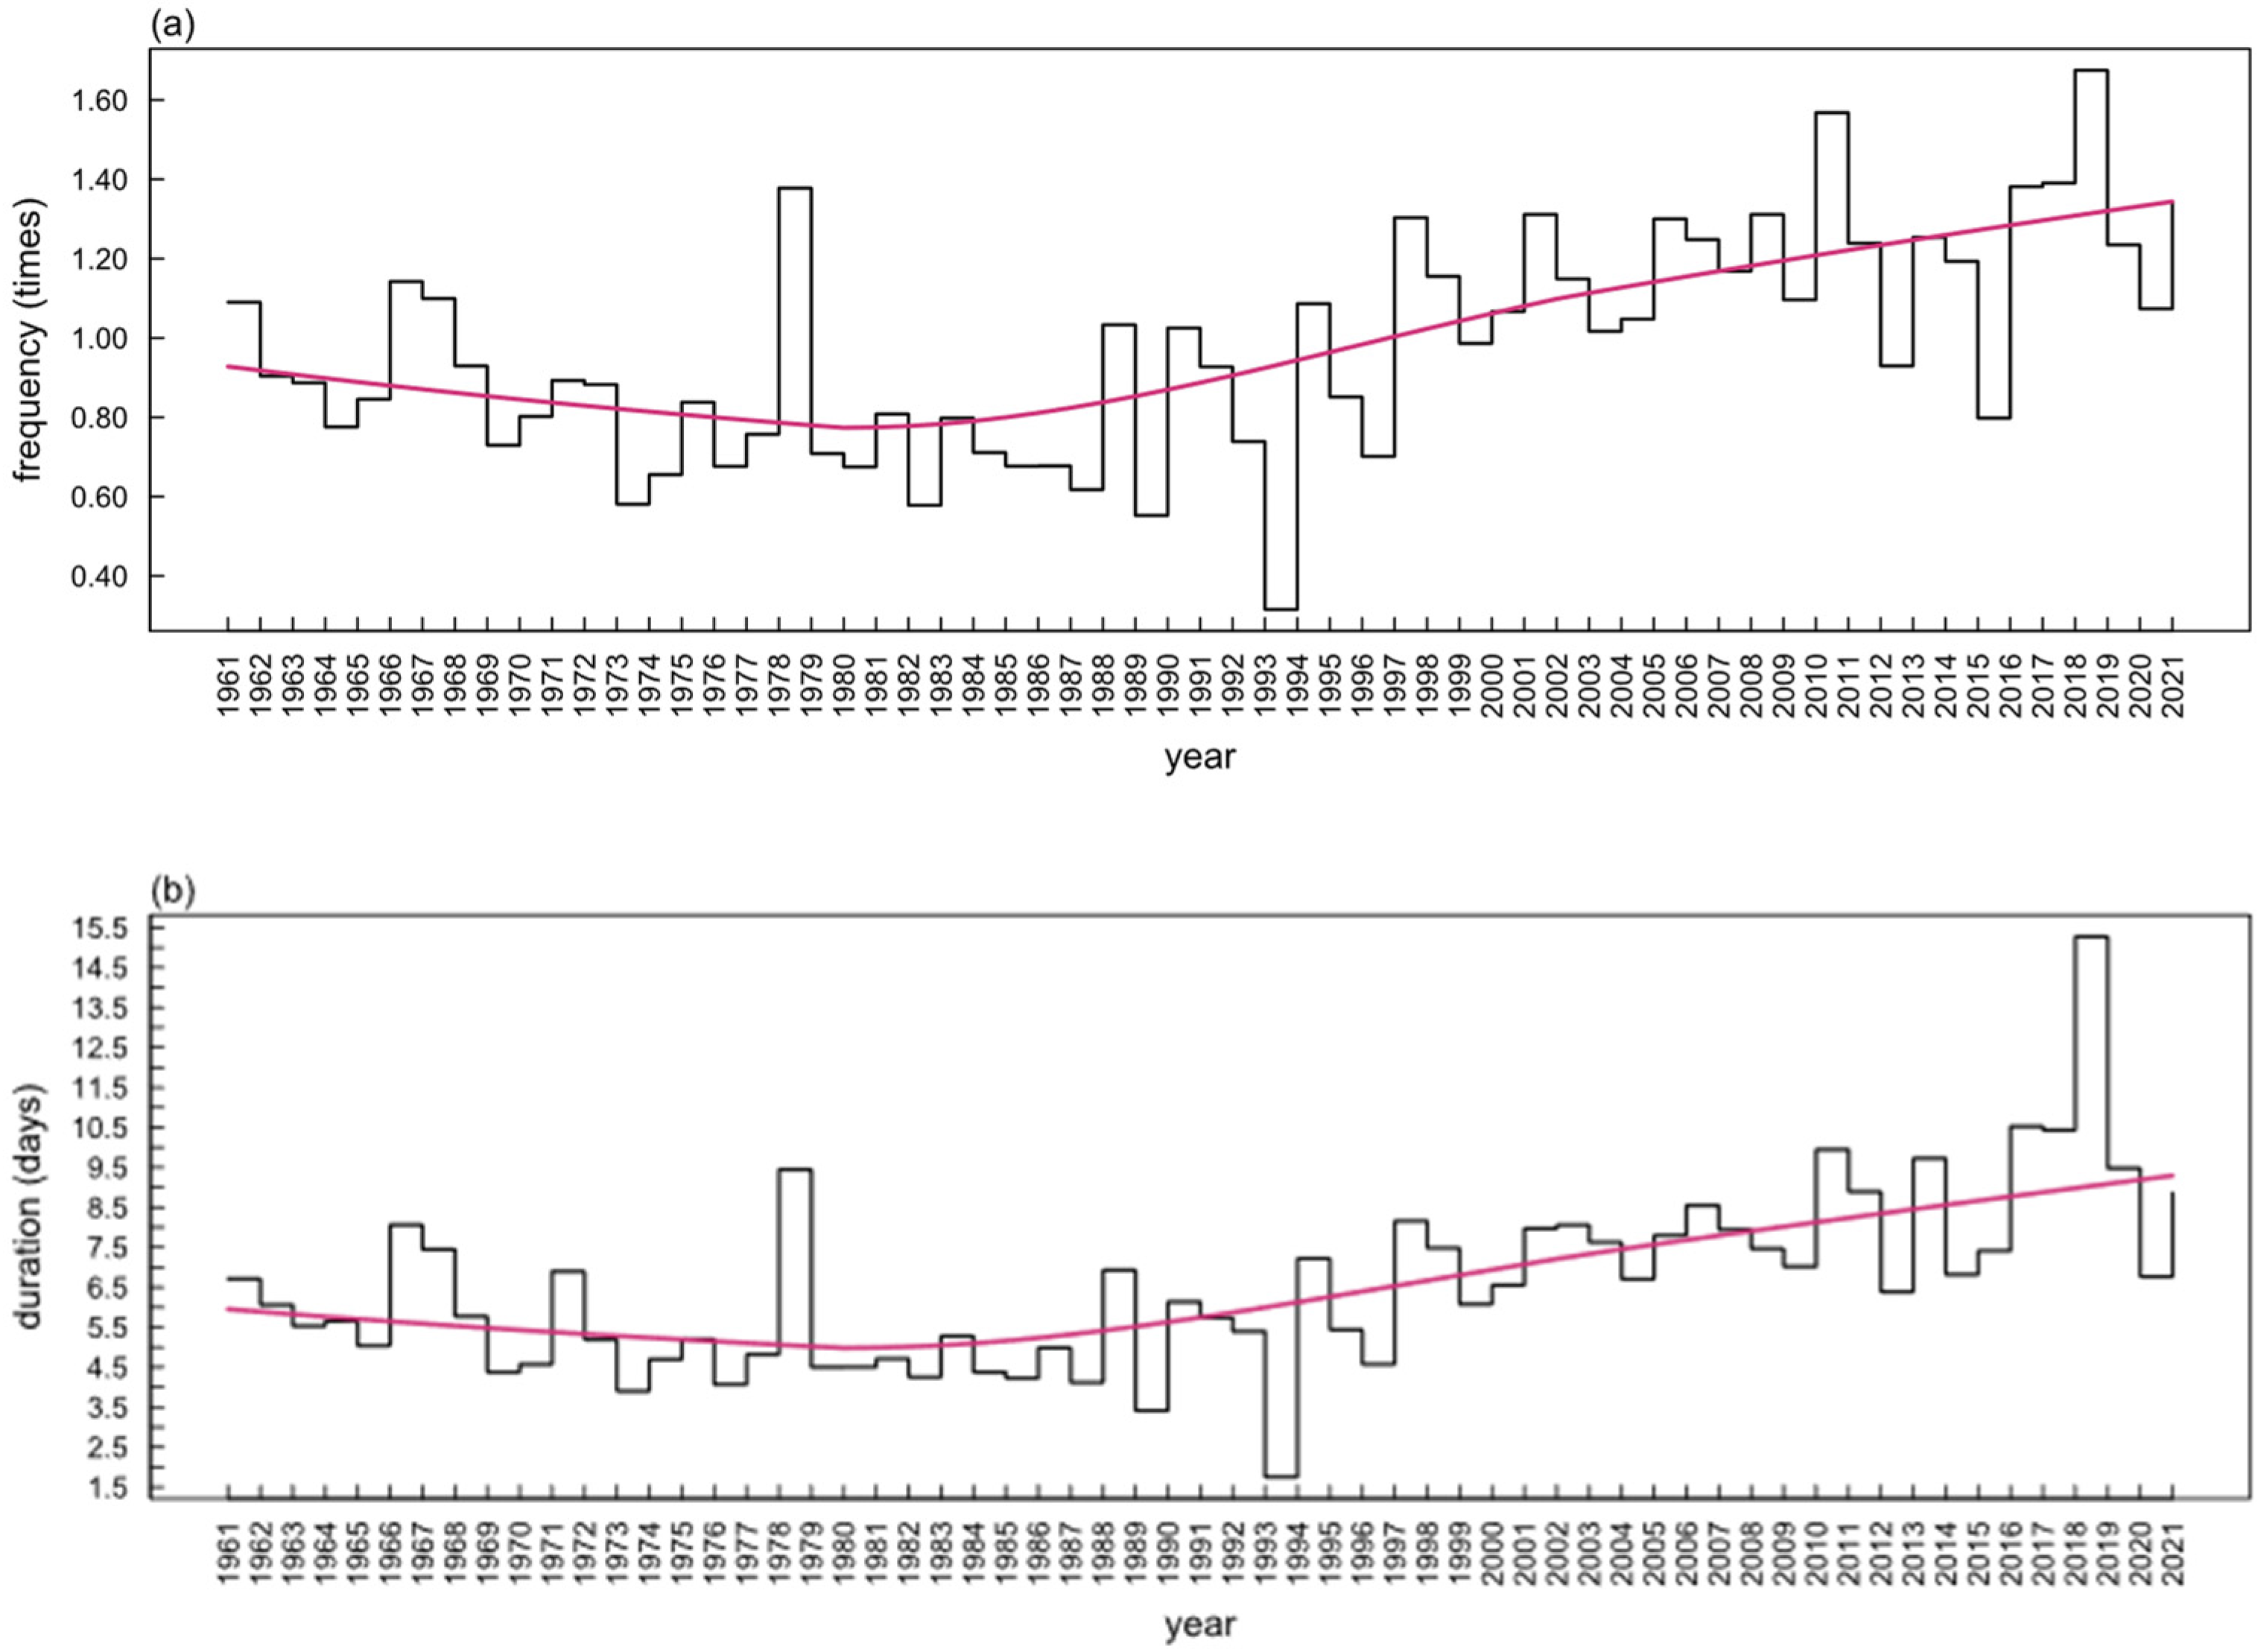
3.2. Analysis of Decadal Variation of Heat Wave Characteristics in China from 1961 to 2020
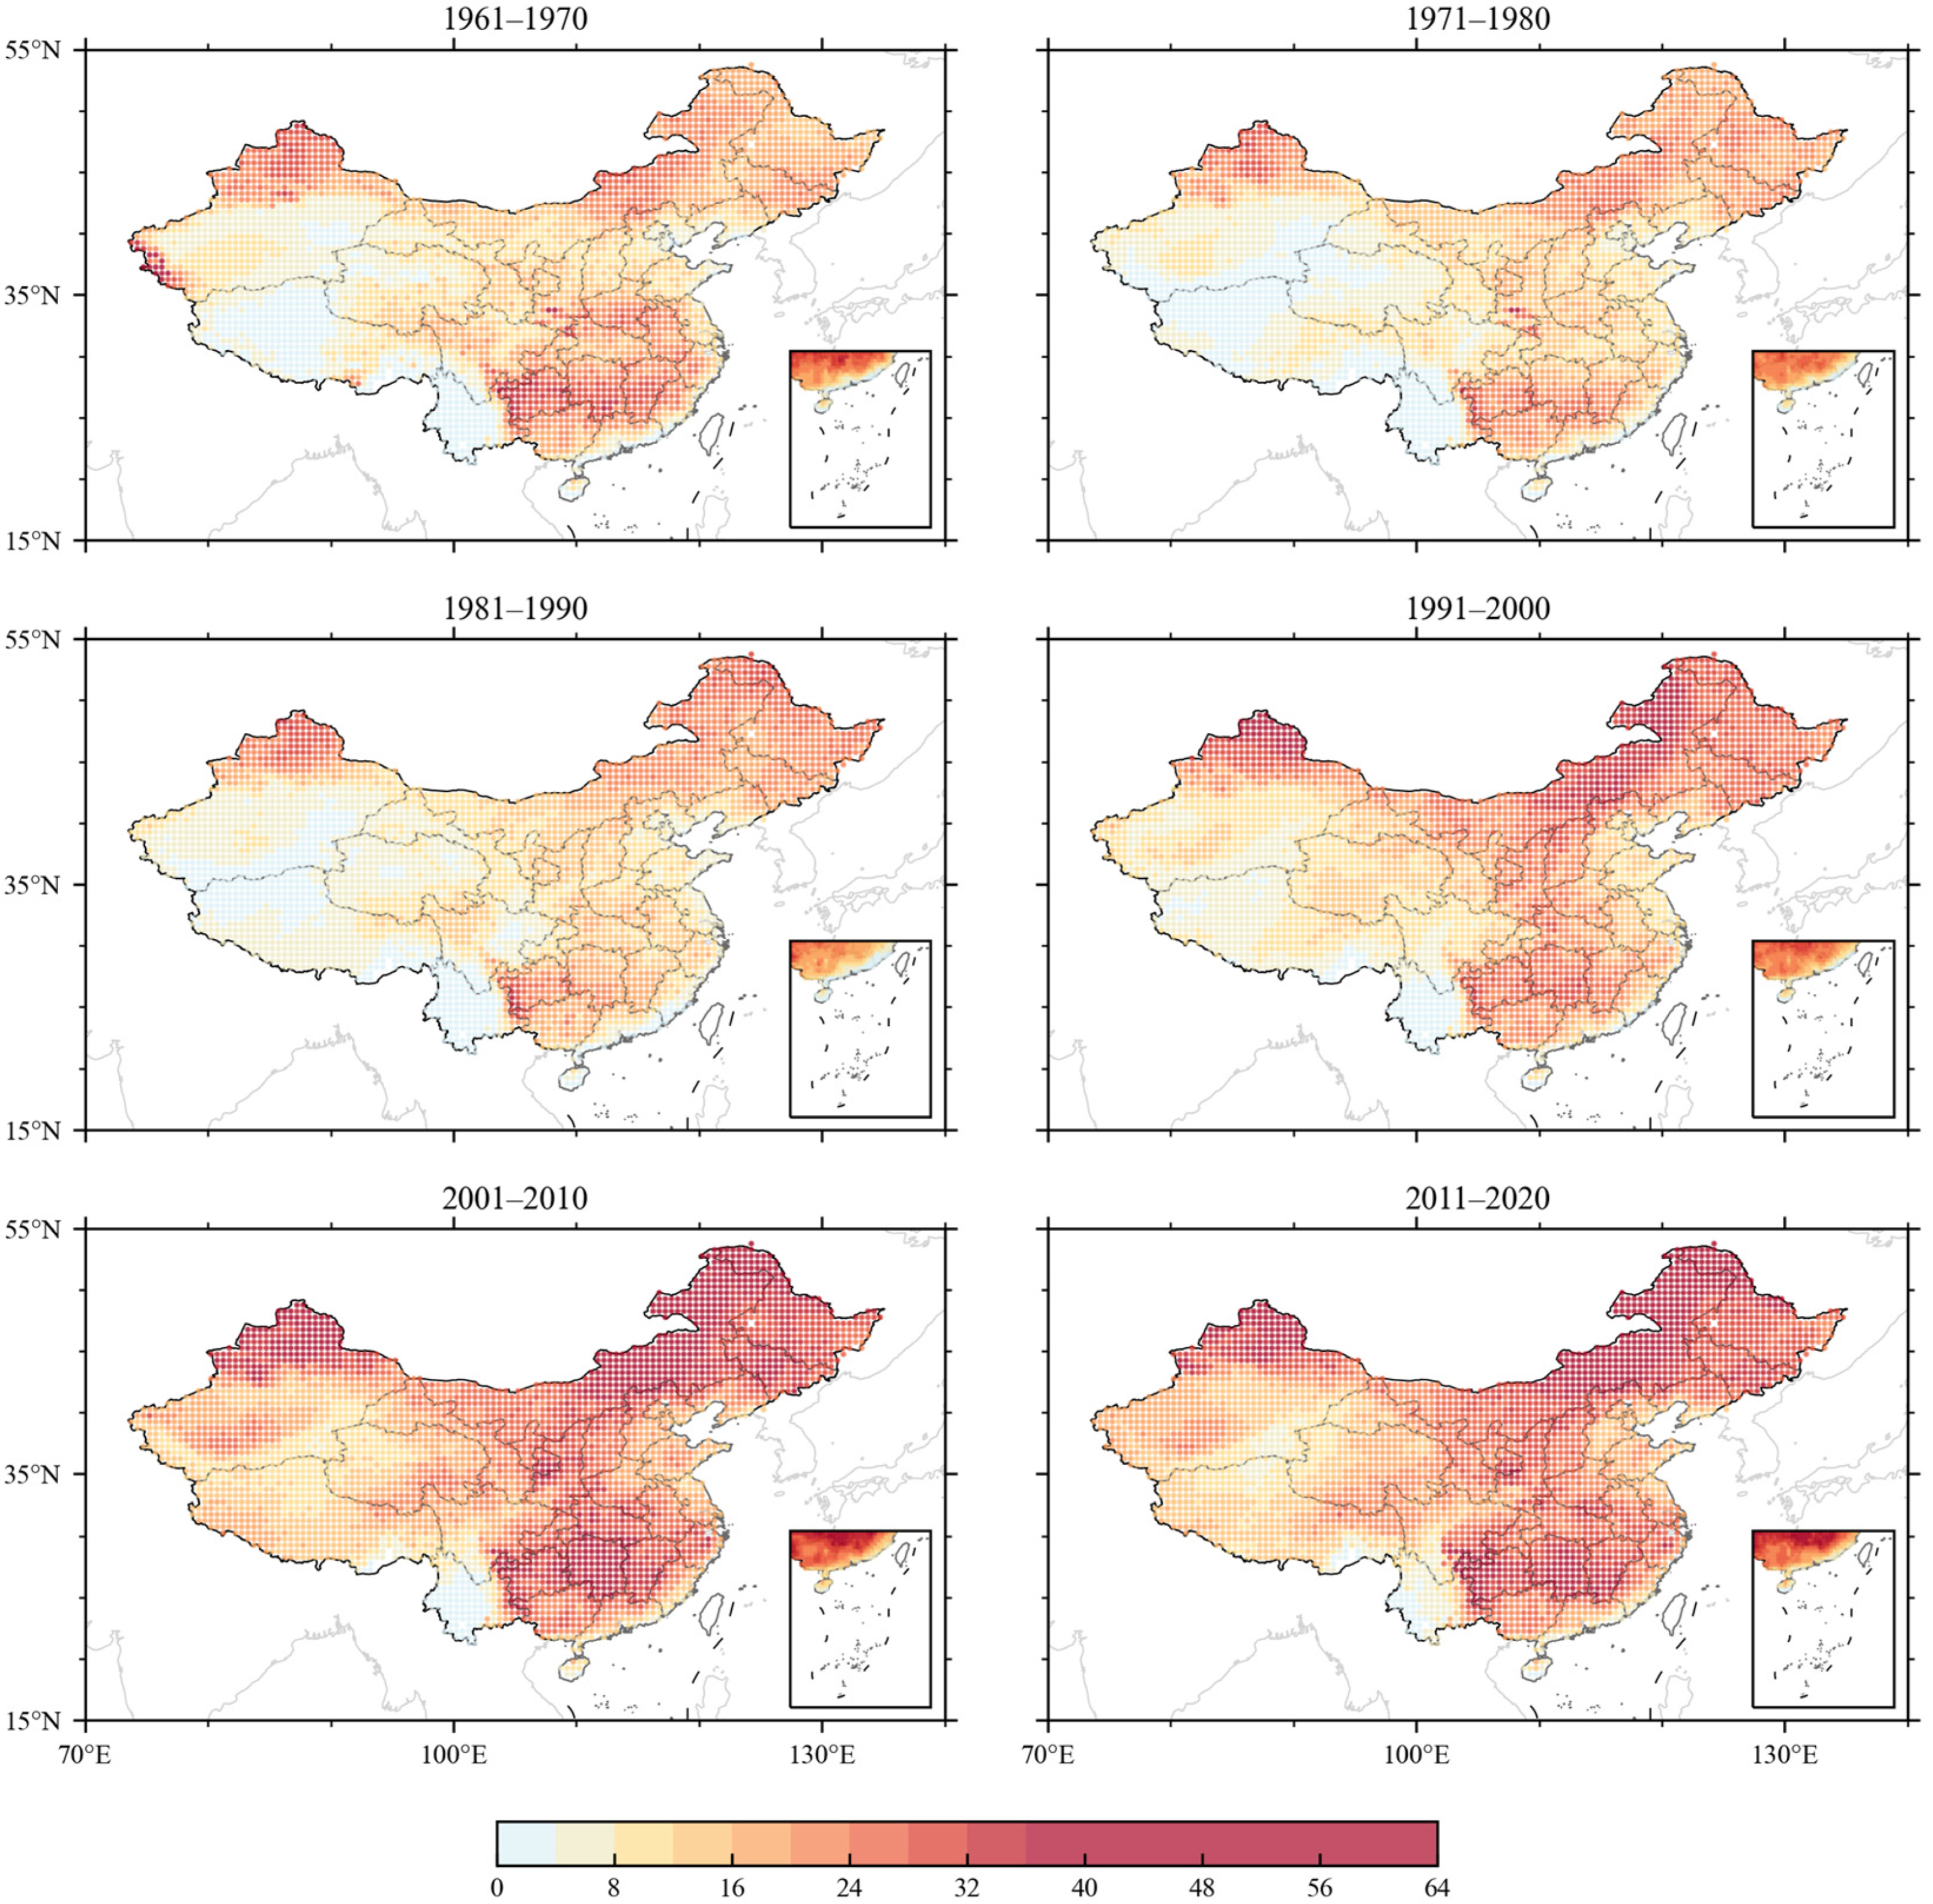
3.2.1. Results Based on Absolute Method
- (1)
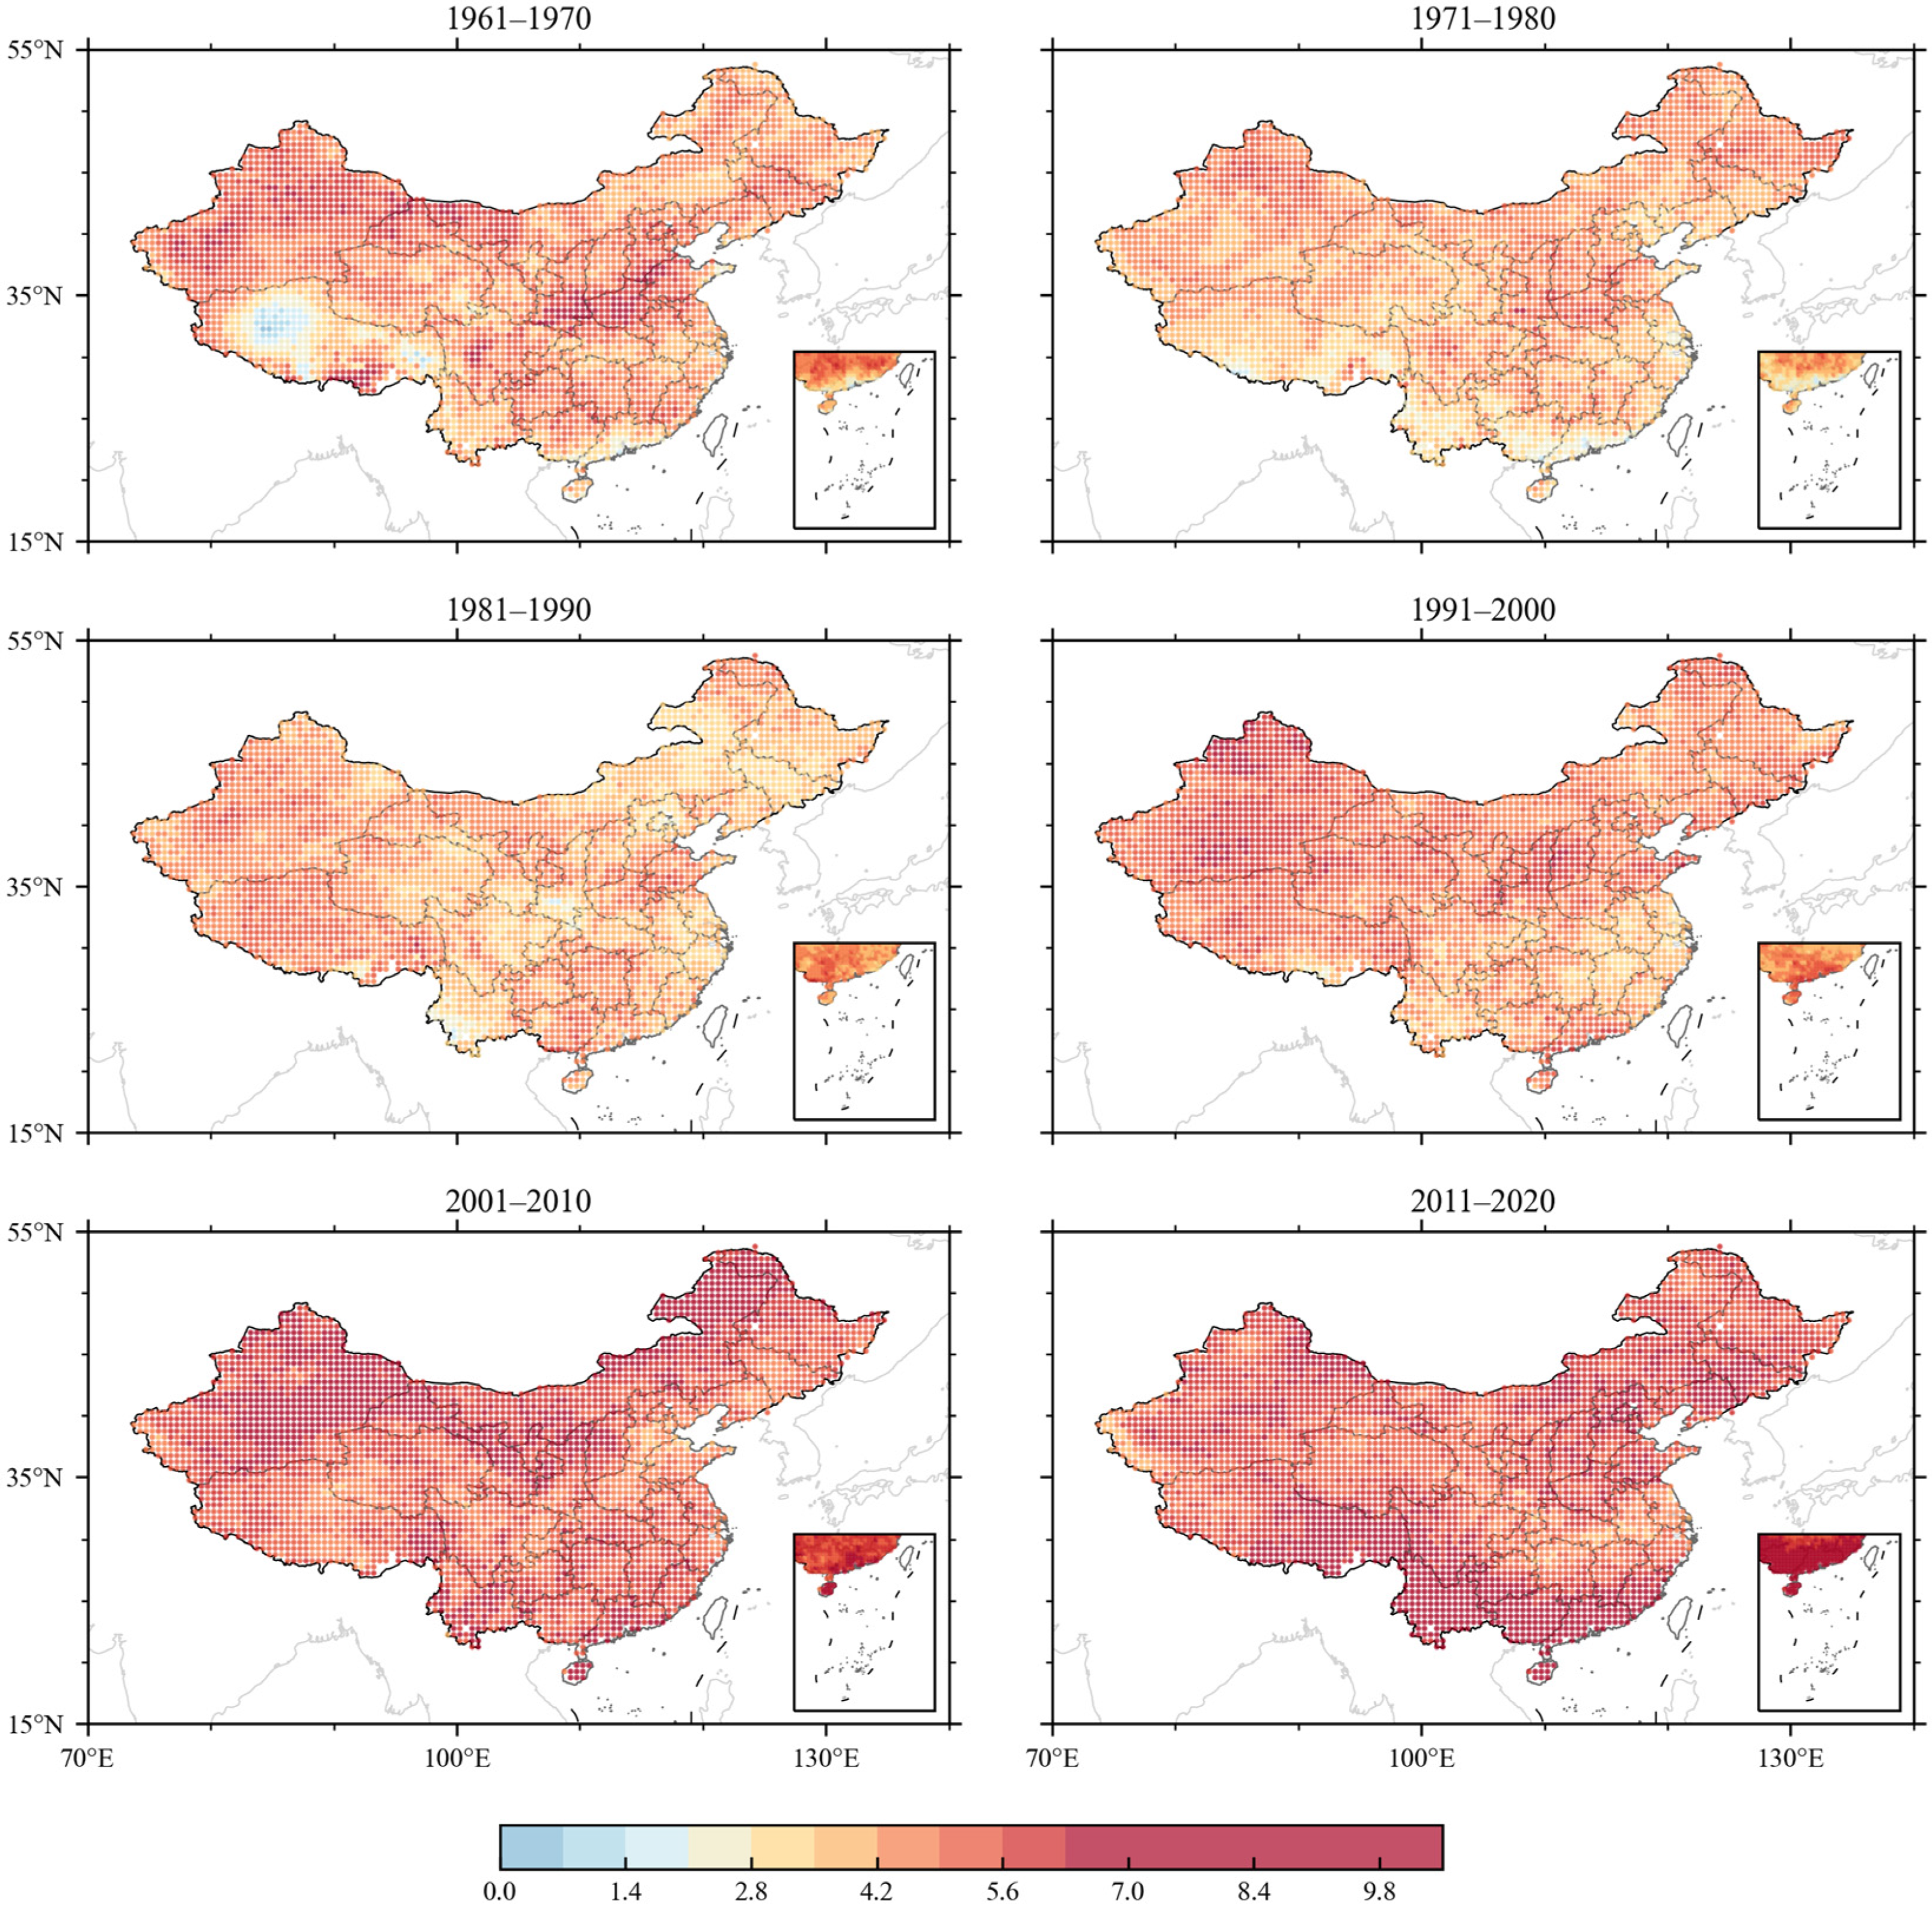
- Frequency and Intensity
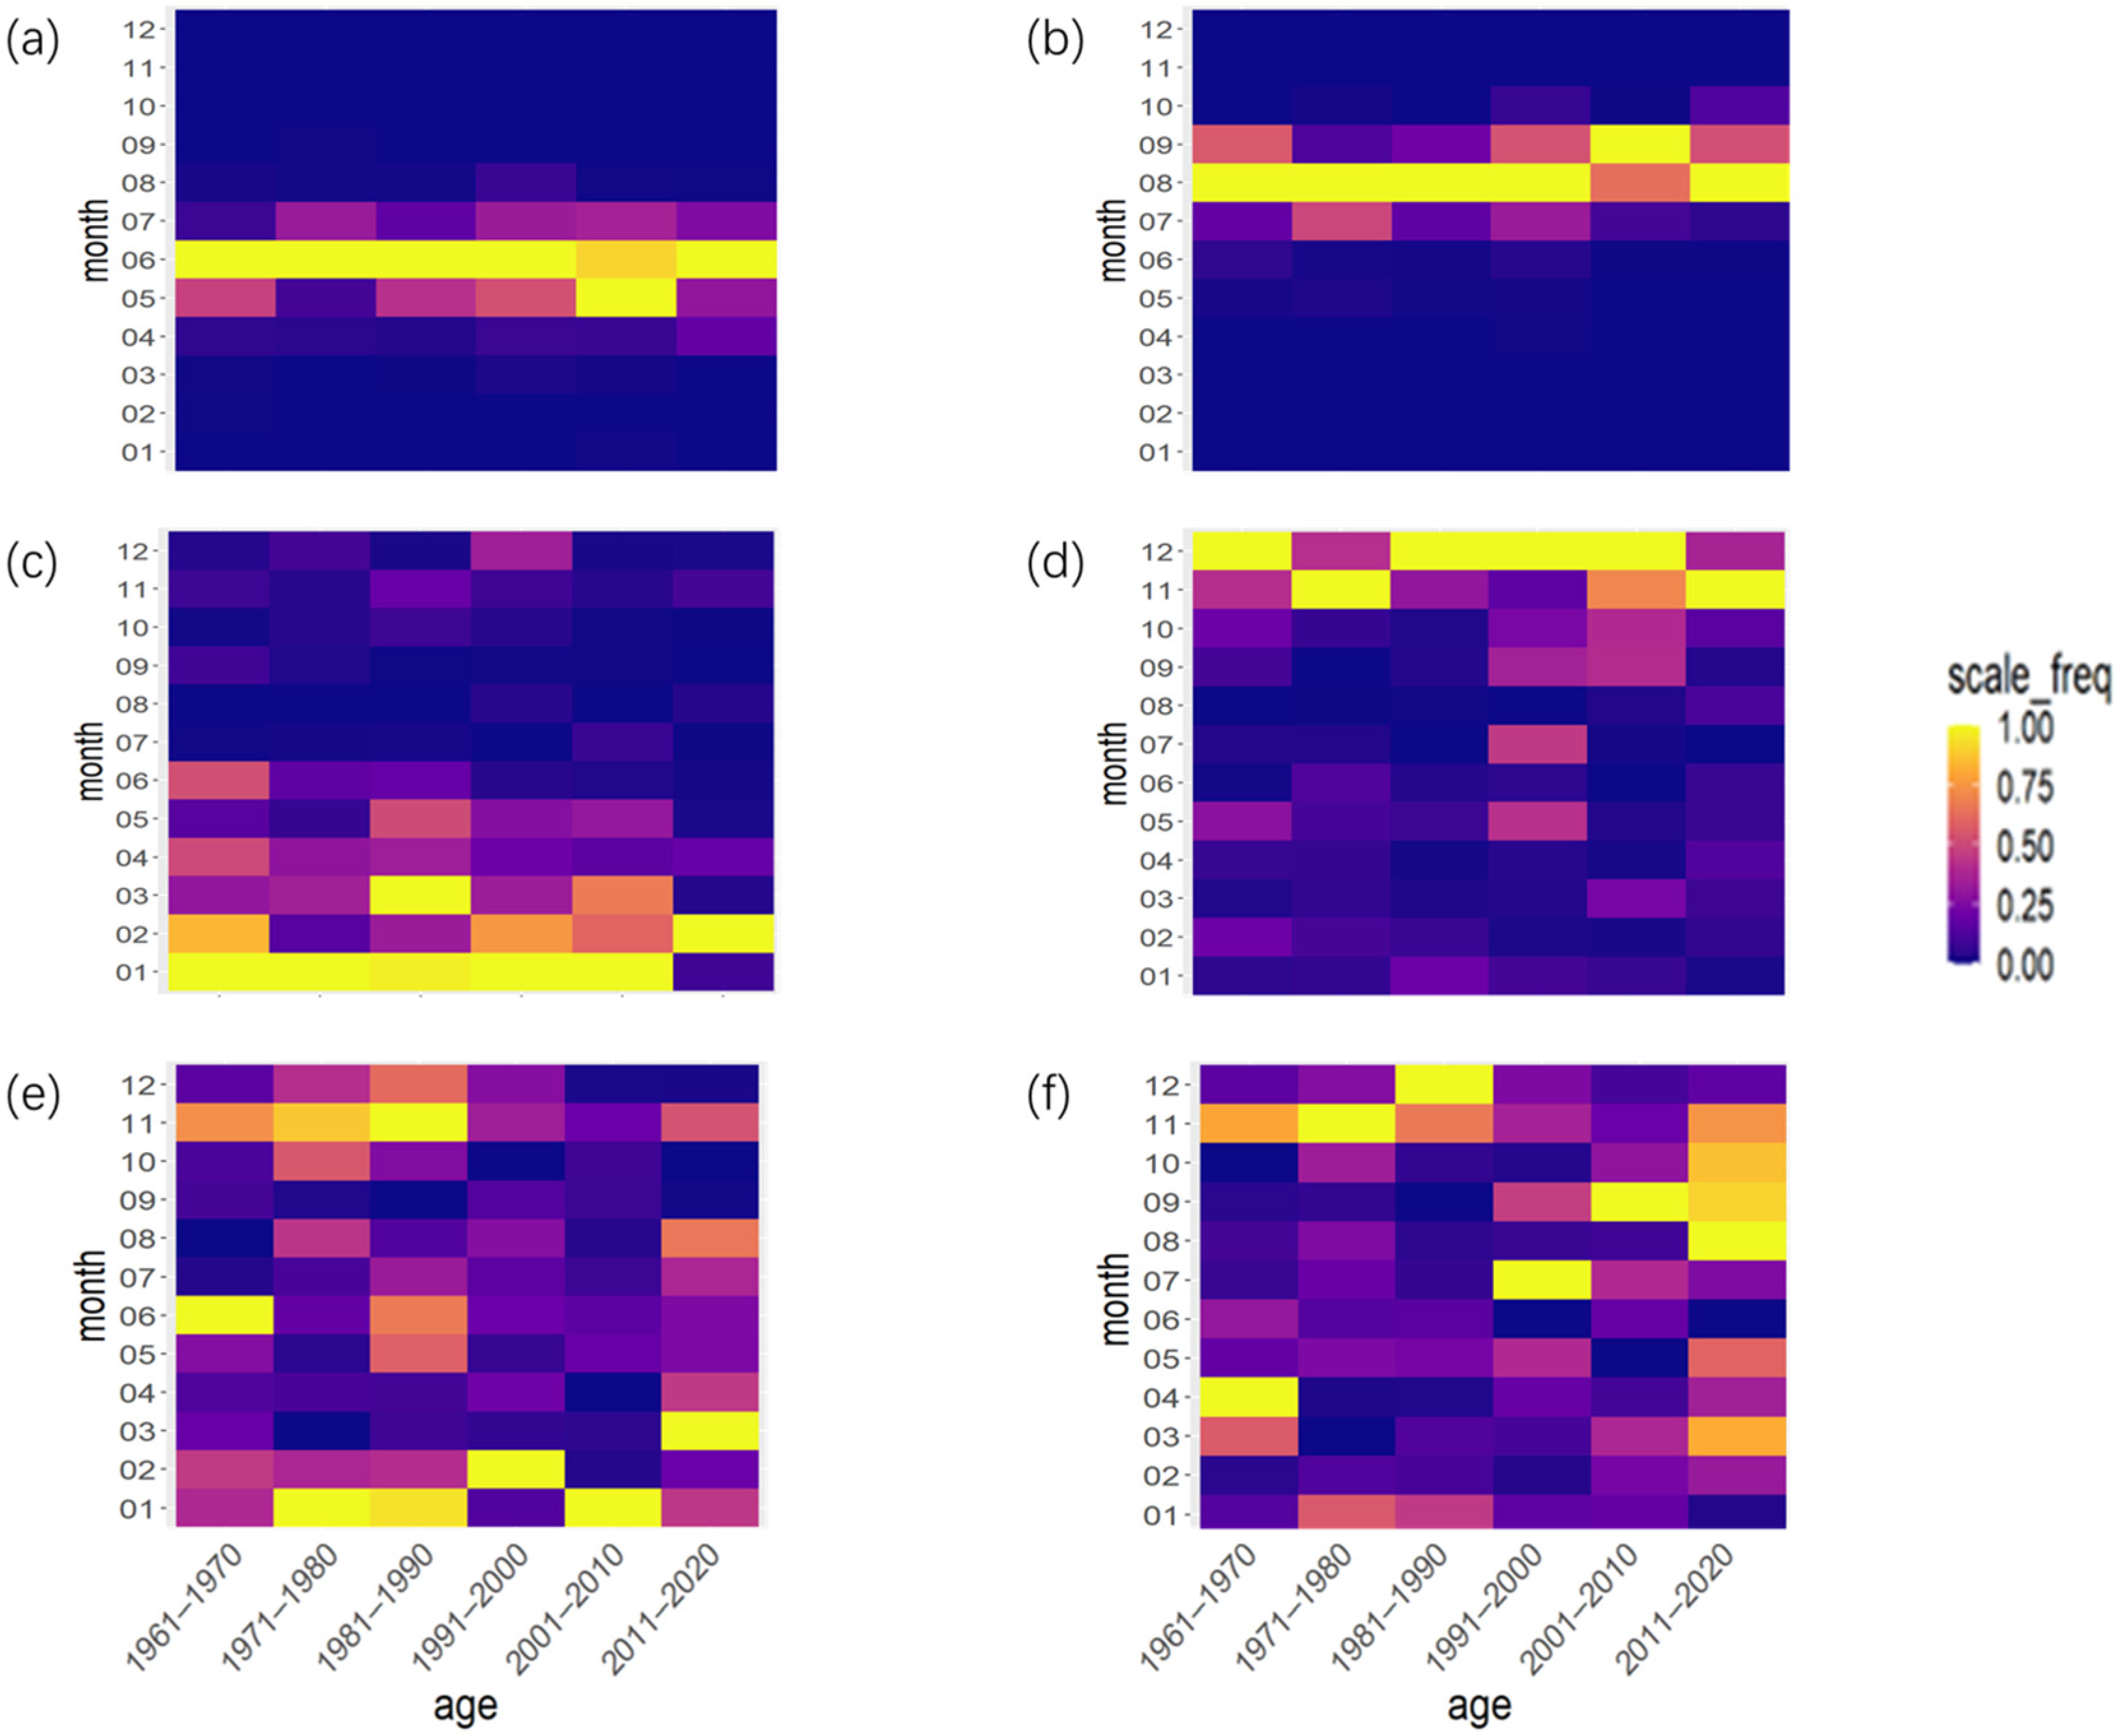
- (2)
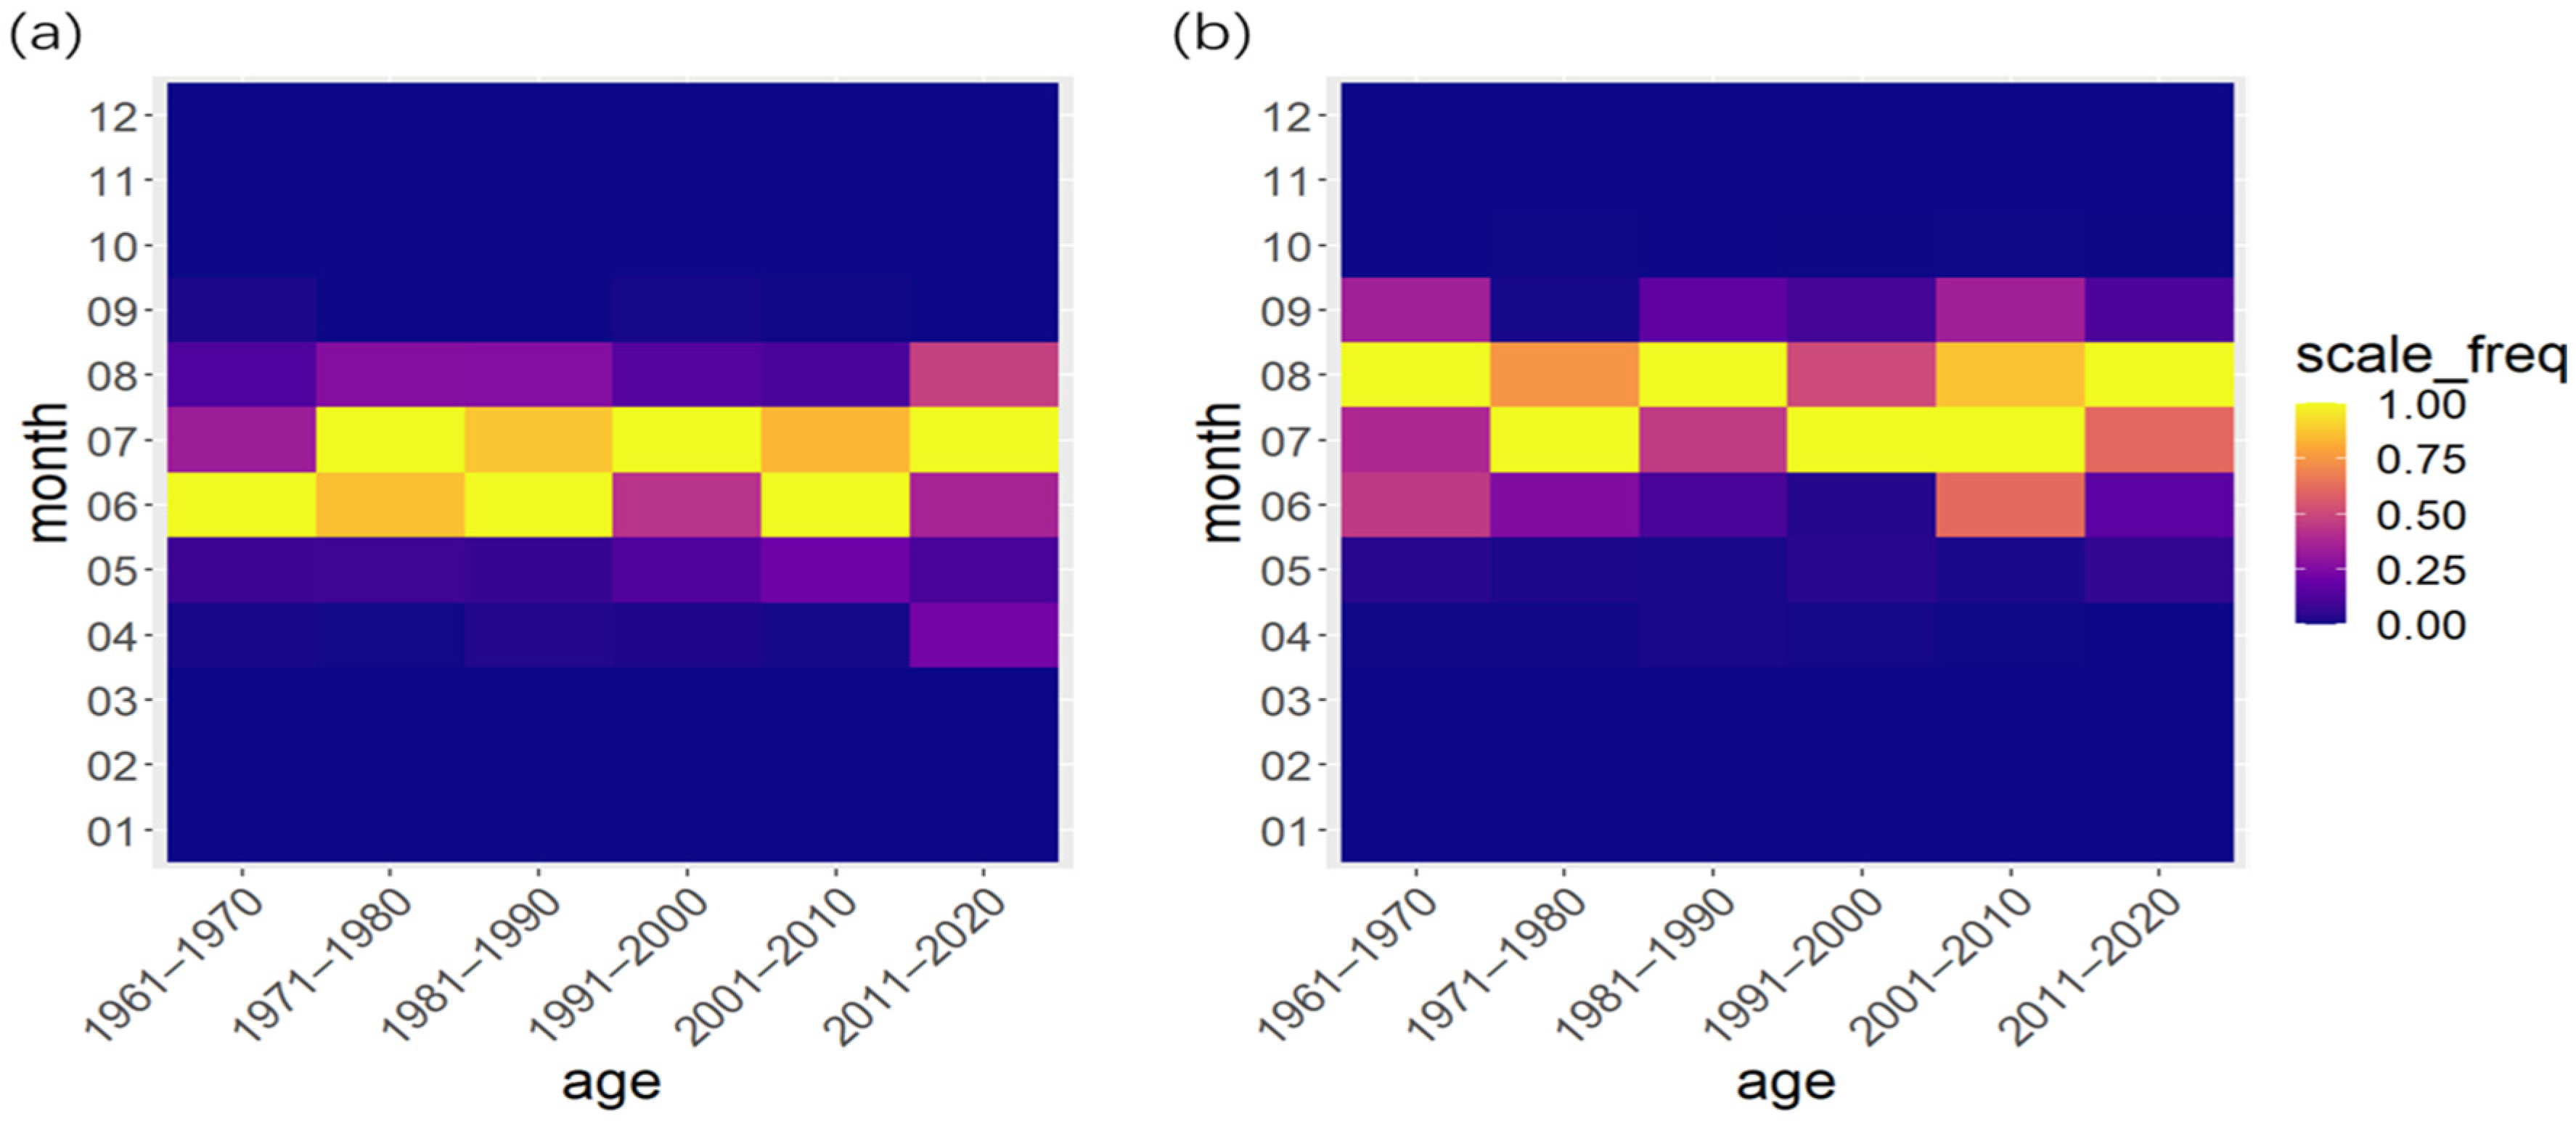
- Earliest Date of Appearance and Latest Date of Extinction
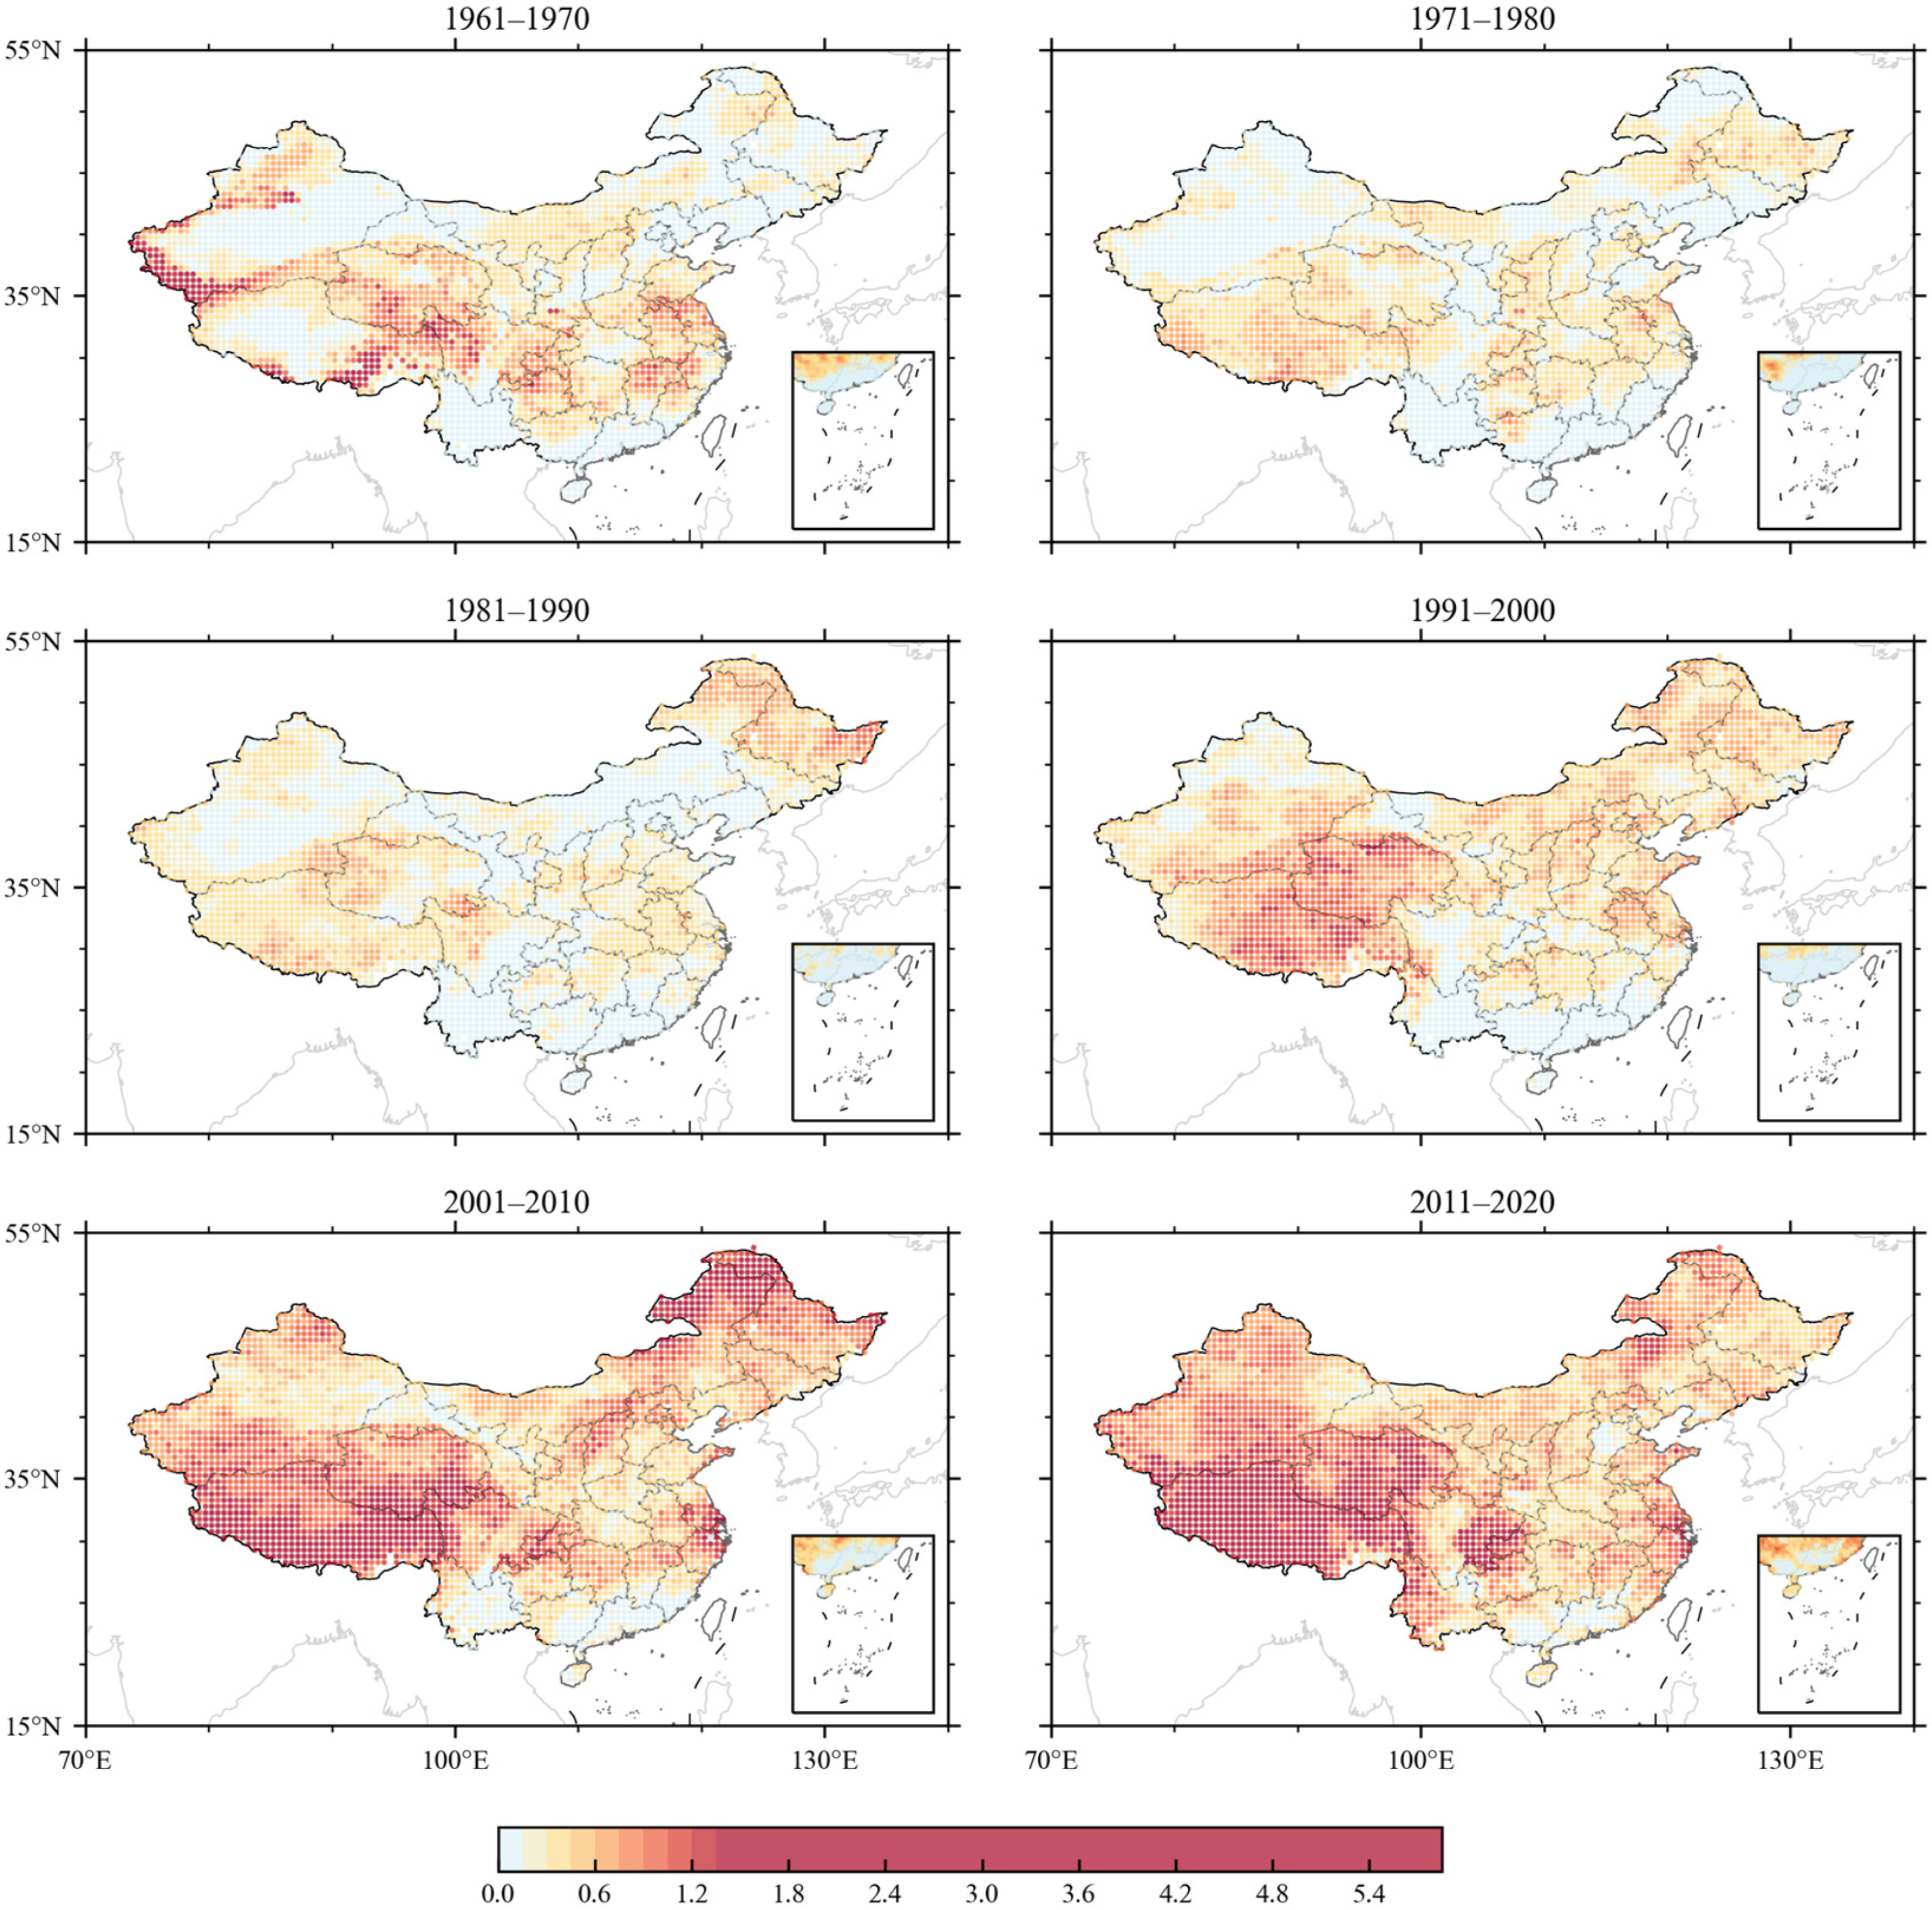
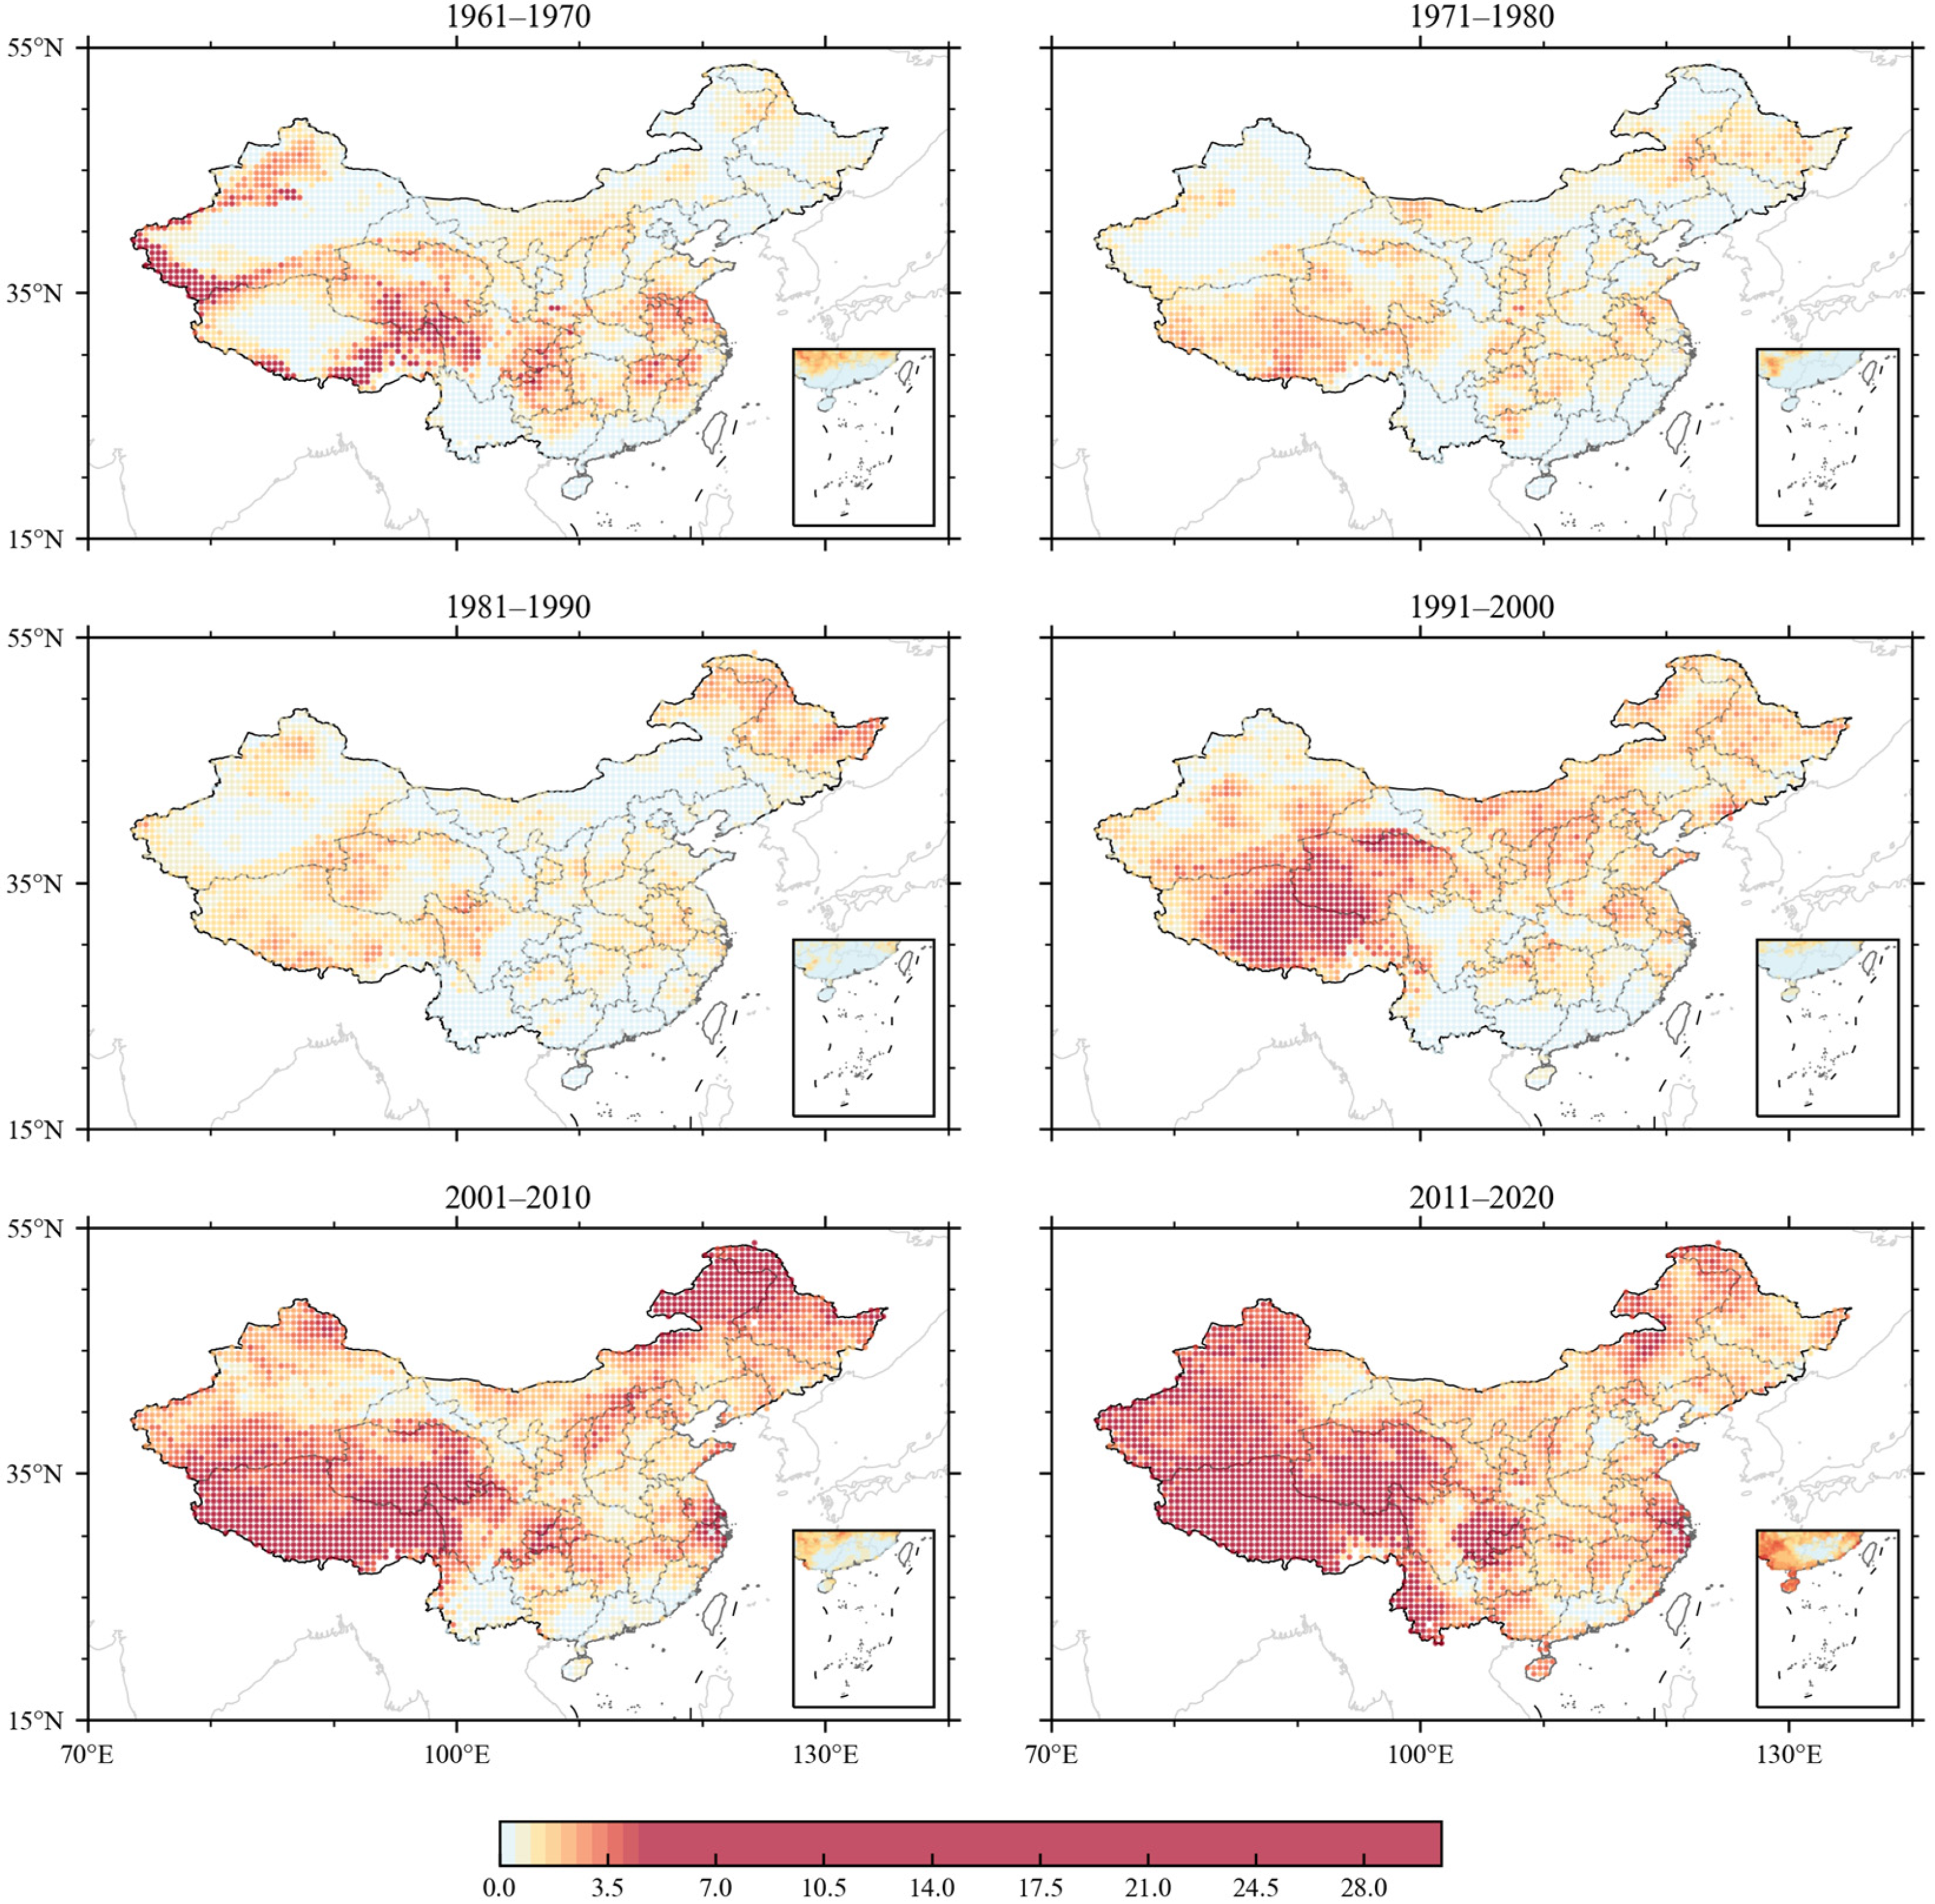
3.2.2. Results Based on Relative Methods
- (1)
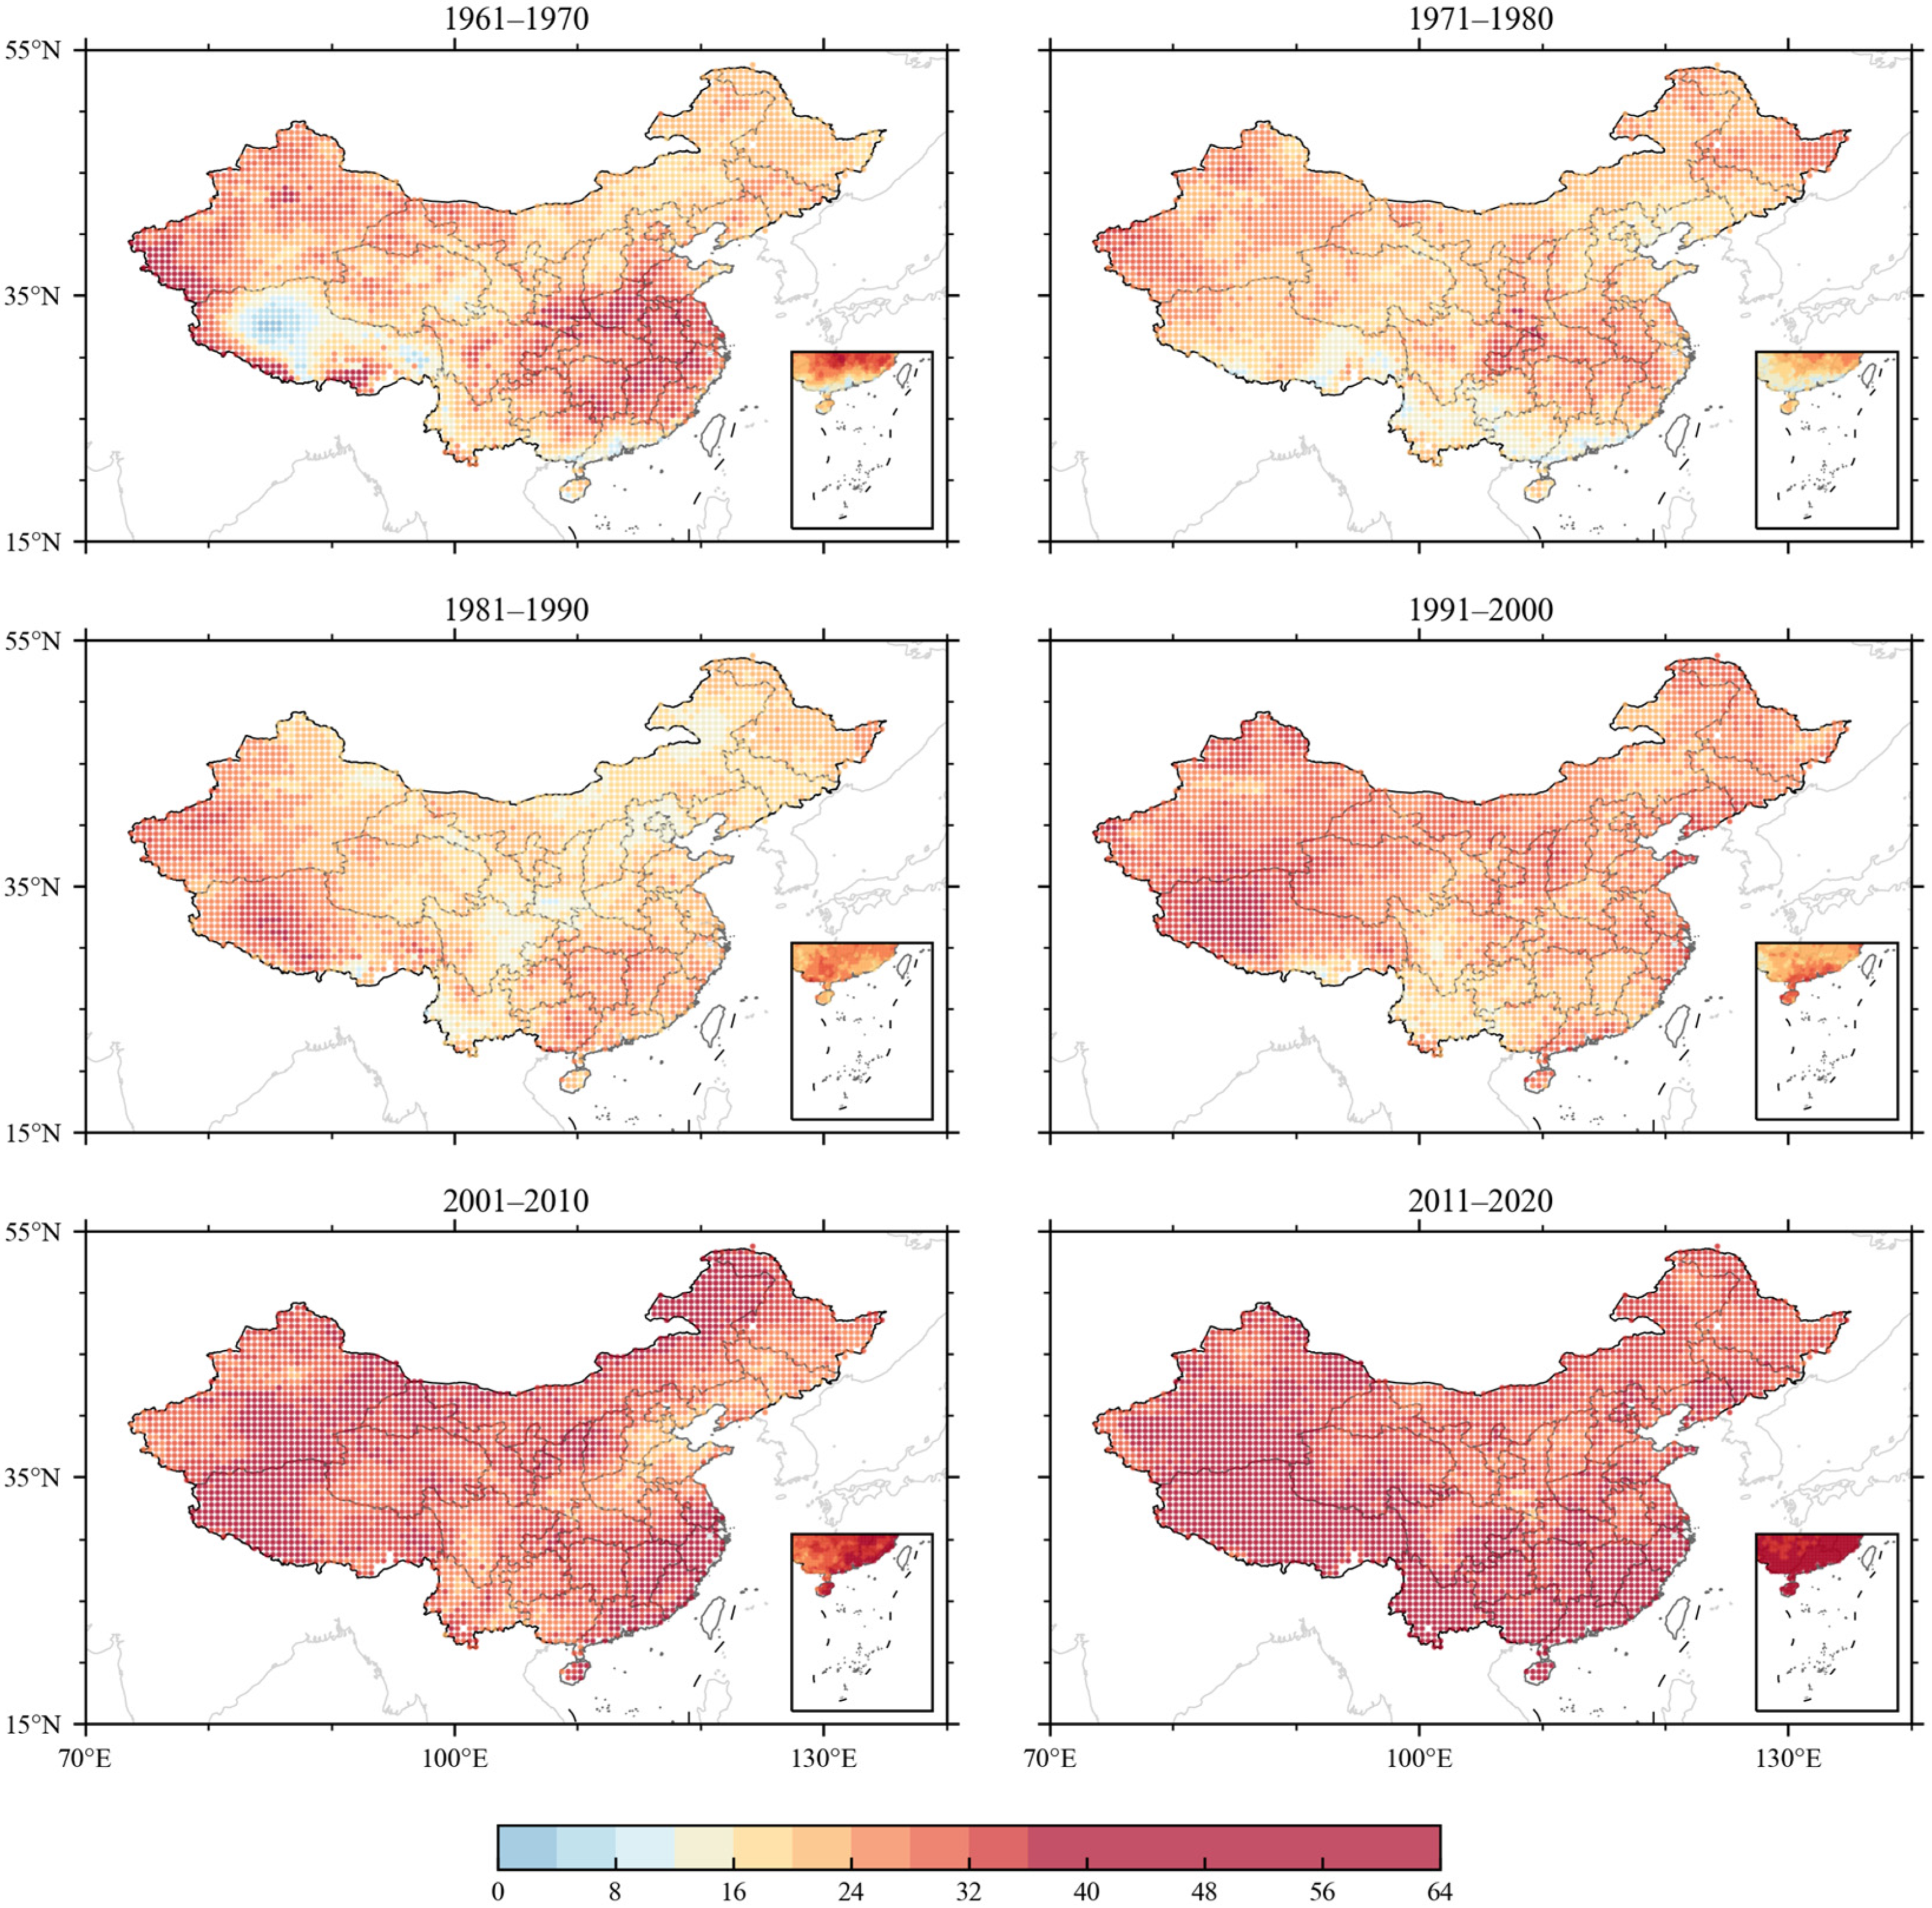
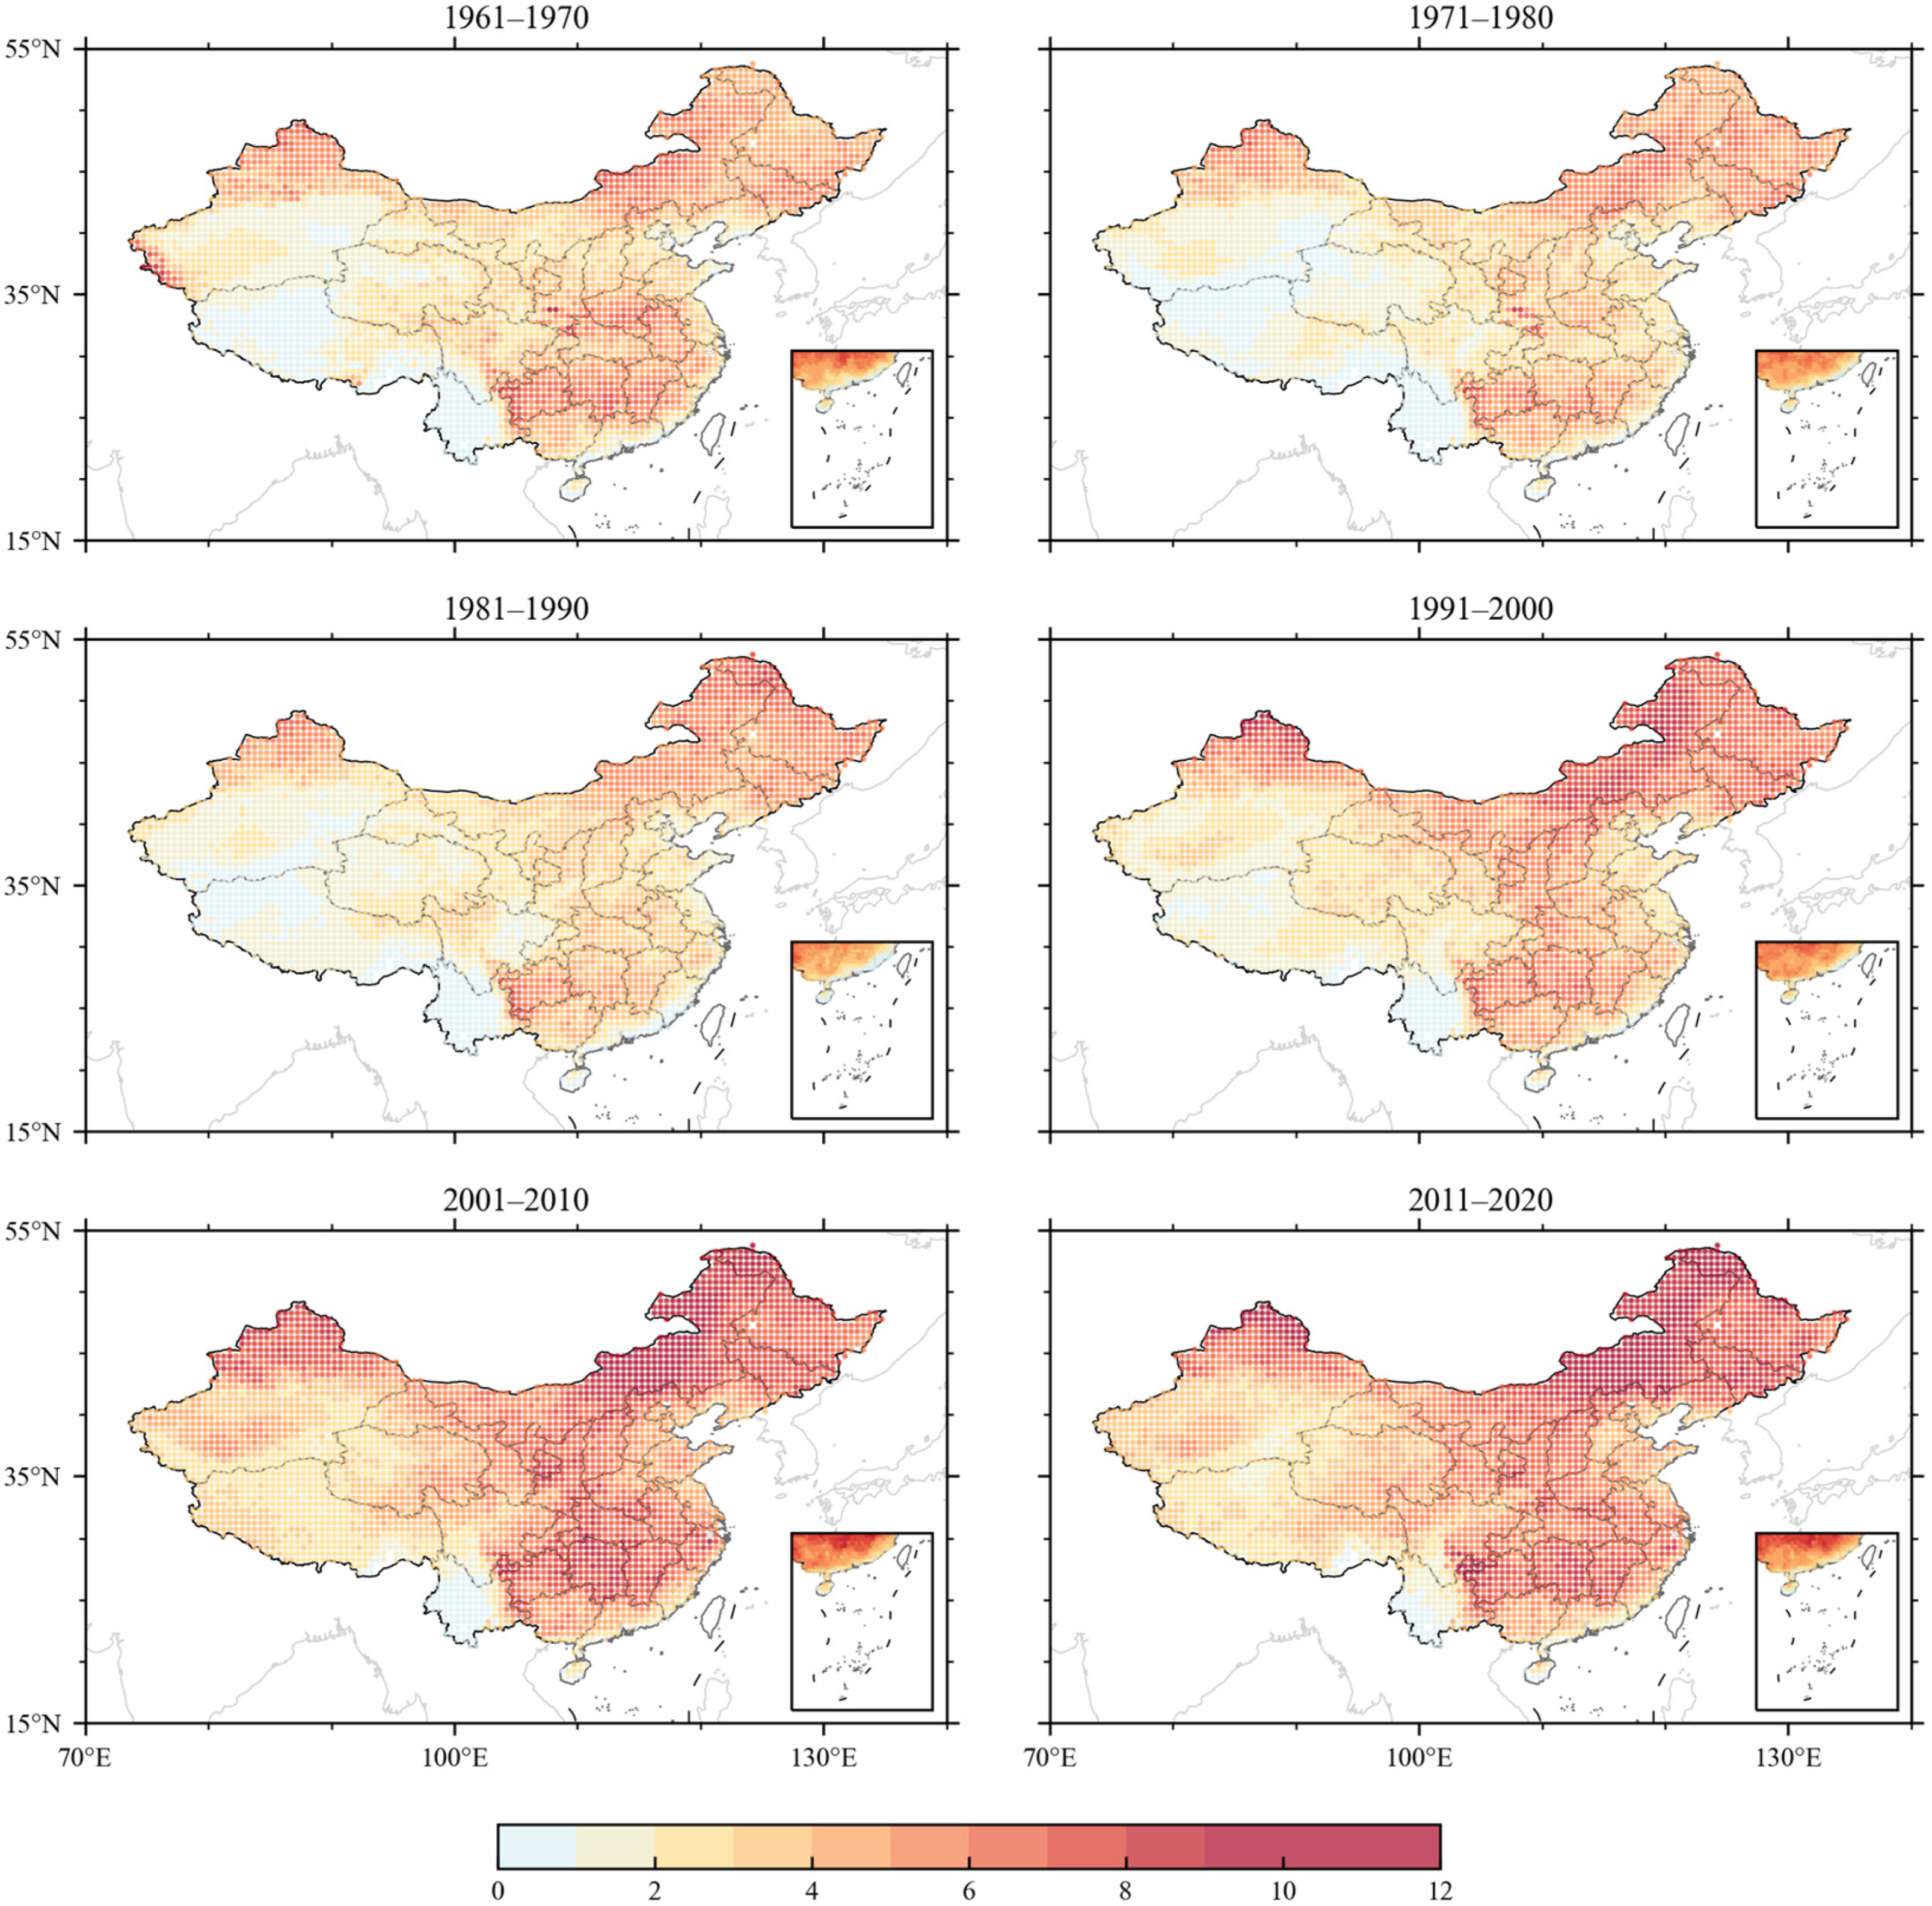
- Frequency and Intensity
- (2)
- Earliest Date of Appearance and Latest Date of Extinction
4. Conclusions and Discussion
Author Contributions
Funding
Institutional Review Board Statement
Informed Consent Statement
Data Availability Statement
Acknowledgments
Conflicts of Interest
References
- Masson-Delmotte, V.; Zhai, P.; Pirani, A.; Connors, S.L.; Péan, C.; Berger, S.; Caud, N.; Chen, Y.; Goldfarb, L.; Gomis, M.I.; et al. IPCC, 2021: Summary for Policymakers. In Climate Change 2021: The Physical Science Basis. Contribution of Working Group I to the Sixth Assessment Report of the Intergovernmental Panel on Climate Change; Cambridge University Press: Cambridge, UK; New York, NY, USA, 2021; pp. 3–32. [Google Scholar]
- Erdenebat, E.; Sato, T. Recent increase in heat wave frequency around Mongolia: Role of atmospheric forcing and possible influence of soil moisture deficit. Atmos. Sci. Lett. 2016, 17, 135–140. [Google Scholar] [CrossRef] [Green Version]
- Perkins, S.E.; Alexander, L.V.; Nairn, J.R. Increasing frequency, intensity and duration of observed global heatwaves and warm spells. Geophys. Res. Lett. 2012, 39, 10. [Google Scholar] [CrossRef]
- Mora, C.; Dousset, B.; Caldwell, I.R.; Powell, F.E.; Geronimo, R.C.; Coral, R.B.; Counsell, C.W.W.; Dietrich, B.S.; Johnston, E.T.; Louis, L.V.; et al. Global risk of deadly heat. Nat. Clim. Chang. 2017, 7, 501–506. [Google Scholar] [CrossRef] [Green Version]
- Russo, S.; Sillmann, J.; Sterl, A. Humid heat waves at different warming levels. Sci. Rep. 2017, 7, 7477. [Google Scholar] [CrossRef] [Green Version]
- Sun, Y.; Zhang, X.; Zwiers, F.W.; Song, L.; Wan, H.; Hu, T.; Yin, H.; Ren, G. Rapid increase in the risk of extreme summer heat in Eastern China. Nat. Clim. Chang. 2014, 4, 1082–1085. [Google Scholar] [CrossRef]
- Wang, Y.; Zhou, B.; Qin, D.; Wu, J.; Gao, R.; Song, L. Changes in mean and extreme temperature and precipitation over the arid region of northwestern China: Observation and projection. Adv. Atmos. Sci. 2017, 34, 289–305. [Google Scholar] [CrossRef]
- Wang, W.; Zhou, W.; Li, Y.; Wang, X.; Wang, D. Statistical modeling and CMIP5 simulations of hot spell changes in China. Clim. Dyn. 2014, 44, 2859–2872. [Google Scholar] [CrossRef]
- Robine, J.M.; Cheung, S.L.; Le Roy, S.; Van Oyen, H.; Griffiths, C.; Michel, J.P.; Herrmann, F.R. Death toll exceeded 70,000 in Europe during the summer of 2003. Comptes Rendus Biol. 2008, 331, 171–178. [Google Scholar] [CrossRef]
- Trigo, R.M.; Ramos, A.M.; Nogueira, P.J.; Santos, F.D.; Garcia-Herrera, R.; Gouveia, C.; Santo, F.E. Evaluating the impact of extreme temperature based indices in the 2003 heatwave excessive mortality in Portugal. Environ. Sci. Policy 2009, 12, 844–854. [Google Scholar] [CrossRef]
- Barriopedro, D.; Fischer, E.M.; Luterbacher, J.; Trigo, R.M.; García-Herrera, R. The hot summer of 2010: Redrawing the temperature record map of Europe. Science 2011, 332, 220–224. [Google Scholar] [CrossRef] [Green Version]
- Katsafados, P.; Papadopoulos, A.; Varlas, G.; Papadopoulou, E.; Mavromatidis, E. Seasonal predictability of the 2010 Russian heat wave. Nat. Hazards Earth Syst. Sci. 2014, 14, 1531–1542. [Google Scholar] [CrossRef] [Green Version]
- Quandt, L.-A.; Keller, J.H.; Martius, O.; Jones, S.C. Forecast Variability of the Blocking System over Russia in Summer 2010 and Its Impact on Surface Conditions. Weather Forecast. 2017, 32, 61–82. [Google Scholar] [CrossRef]
- Xia, J.; Tu, K.; Yan, Z.; Qi, Y. The super-heat wave in eastern China during July-August 2013: A perspective of climate change. Int. J. Climatol. 2016, 36, 1291–1298. [Google Scholar] [CrossRef]
- Sánchez-Benítez, A.; García-Herrera, R.; Barriopedro, D.; Sousa, P.M.; Trigo, R.M. June 2017: The Earliest European Summer Mega-heatwave of Reanalysis Period. Geophys. Res. Lett. 2018, 45, 1955–1962. [Google Scholar] [CrossRef]
- Ahn, K.H. Interannual variability of heat waves over the Korean Peninsula based on integrated approach. Sci. Total Environ. 2022, 826, 154153. [Google Scholar] [CrossRef]
- Baldwin, J.W.; Dessy, J.B.; Vecchi, G.A.; Oppenheimer, M. Temporally Compound Heat Wave Events and Global Warming: An Emerging Hazard. Earth’s Future 2019, 7, 411–427. [Google Scholar] [CrossRef] [Green Version]
- Cherchi, A.; Annamalai, H.; Masina, S.; Navarra, A. South Asian Summer Monsoon and the Eastern Mediterranean Climate: The Monsoon–Desert Mechanism in CMIP5 Simulations. J. Clim. 2014, 27, 6877–6903. [Google Scholar] [CrossRef] [Green Version]
- Stanojevic, G.; Spalević, A.B.; Kokotović, V.M.; Stojilković, J.N. Does Belgrade (Serbia) need heat health warning system? Disaster Prev. Manag. 2014, 23, 494–507. [Google Scholar] [CrossRef]
- Wang, J.; Feng, J.; Yan, Z.; Chen, Y. Future Risks of Unprecedented Compound Heat Waves over Three Vast Urban Agglomerations in China. Earth’s Future 2020, 8, e2020EF001716. [Google Scholar] [CrossRef]
- Schauberger, B.; Archontoulis, S.; Arneth, A.; Balkovic, J.; Ciais, P.; Deryng, D.; Elliott, J.; Folberth, C.; Khabarov, N.; Muller, C.; et al. Consistent negative response of US crops to high temperatures in observations and crop models. Nat. Commun. 2017, 8, 13931. [Google Scholar] [CrossRef] [Green Version]
- Ban, J.; Xu, D.; He, M.Z.; Sun, Q.; Chen, C.; Wang, W.; Zhu, P.; Li, T. The effect of high temperature on cause-specific mortality: A multi-county analysis in China. Environ. Int. 2017, 106, 19–26. [Google Scholar] [CrossRef] [Green Version]
- Moraes, S.L.; Almendra, R.; Barrozo, L.V. Impact of heat waves and cold spells on cause-specific mortality in the city of Sao Paulo, Brazil. Int. J. Hyg. Environ. Health 2022, 239, 113861. [Google Scholar] [CrossRef]
- Russo, S.; Dosio, A.; Graversen, R.G.; Sillmann, J.; Carrao, H.; Dunbar, M.B.; Singleton, A.; Montagna, P.; Barbola, P.; Vogt, J.V. Magnitude of extreme heat waves in present climate and their projection in a warming world. J. Geophys. Res. Atmos. 2014, 119, 12500–12512. [Google Scholar] [CrossRef] [Green Version]
- Guo, X.; Huang, J.; Luo, Y.; Zhao, Z.; Xu, Y. Projection of heat waves over China for eight different global warming targets using 12 CMIP5 models. Theor. Appl. Climatol. 2016, 128, 507–522. [Google Scholar] [CrossRef]
- Sun, Y.; Hu, T.; Zhang, X. Substantial Increase in Heat Wave Risks in China in a Future Warmer World. Earth’s Future 2018, 6, 1528–1538. [Google Scholar] [CrossRef] [Green Version]
- Wang, P.; Hui, P.; Xue, D.; Tang, J. Future projection of heat waves over China under global warming within the CORDEX-EA-II project. Clim. Dyn. 2019, 53, 957–973. [Google Scholar] [CrossRef]
- Ding, T.; Qian, W.; Yan, Z. Changes in hot days and heat waves in China during 1961–2007. Int. J. Climatol. 2010, 30, 1452–1462. [Google Scholar] [CrossRef]
- Perkins-Kirkpatrick, S.E.; Lewis, S.C. Increasing trends in regional heatwaves. Nat. Commun. 2020, 11, 3357. [Google Scholar] [CrossRef]
- Tong, S.; Wang, X.Y.; FitzGerald, G.; McRae, D.; Neville, G.; Tippett, V.; Aitken, P.; Verrall, K. Development of health risk-based metrics for defining a heatwave: A time series study in Brisbane, Australia. BMC Public Health 2014, 14, 435. [Google Scholar] [CrossRef] [Green Version]
- Bador, M.; Terray, L.; Boe, J.; Somot, S.; Alias, A.; Gibelin, A.-L.; Dubuisson, B. Future summer mega-heatwave and record-breaking temperatures in a warmer France climate. Environ. Res. Lett. 2017, 12, 074025. [Google Scholar] [CrossRef]
- Chen, Y.; Li, Y. An Inter-comparison of Three Heat Wave Types in China during 1961–2010: Observed Basic Features and Linear Trends. Sci. Rep. 2017, 7, 45619. [Google Scholar] [CrossRef] [Green Version]
- Chen, R.; Wen, Z.; Lu, R. Evolution of the Circulation Anomalies and the Quasi-Biweekly Oscillations Associated with Extreme Heat Events in Southern China. J. Clim. 2016, 29, 6909–6921. [Google Scholar] [CrossRef]
- Tan, J.; Huang, J. The Impacts of Heat Waves on Human Health and Its Research Methods. Clim. Environ. Res. 2004, 9, 680–686. [Google Scholar]
- Huynen, M.-M.; Martens, P.; Schram, D.; Weijenberg, M.P.; Kunst, A.E. The impact of heat waves and cold spells on mortality rates in the Dutch population. Environ. Health Perspect. 2001, 109, 463–470. [Google Scholar] [CrossRef]
- Pan, Y.Z.; Wang, J.A.; Gong, D.Y. Changes in extreme daily mean temperatures in summer in eastern China during 1955–2000. Theor. Appl. Climatol. 2004, 77, 25–37. [Google Scholar] [CrossRef]
- Shi, J.; Tang, X.; Cui, L. Climatic characteristics of high temperature in East China during 1961–2005. J. Geogr. Sci. 2008, 18, 283–294. [Google Scholar] [CrossRef]
- Tan, J.; Zheng, Y.; Song, G.; Kalkstein, L.S.; Kalkstein, A.J.; Tang, X. Heat wave impacts on mortality in Shanghai, 1998 and 2003. Int. J. Biometeorol. 2007, 51, 193–200. [Google Scholar] [CrossRef]
- Li, K.; Amatus, G. Spatiotemporal changes of heat waves and extreme temperatures in the main cities of China from 1955 to 2014. Nat. Hazards Earth Syst. Sci. 2020, 20, 1889–1901. [Google Scholar] [CrossRef]
- Purich, A.; Cowan, T.; Perkins, S.; Pezza, A.; Boschat, G.; Sadler, K. More Frequent, Longer, and Hotter Heat Waves for Australia in the Twenty-First Century. J. Clim. 2014, 27, 5851–5871. [Google Scholar] [CrossRef]
- Ding, T.; Qian, W. Geographical patterns and temporal variations of regional dry and wet heatwave events in China during 1960–2008. Adv. Atmos. Sci. 2011, 28, 322–337. [Google Scholar] [CrossRef]
- Zimmer, J.; Tong, S.; Wang, X.Y.; Barnett, A.G. Assessment of Heat-Related Health Impacts in Brisbane, Australia: Comparison of Different Heatwave Definitions. PLoS ONE 2010, 5, e12155. [Google Scholar] [CrossRef] [Green Version]
- Zhou, Y.; Ren, G. Change in extreme temperature event frequency over mainland China, 1961–2008. Clim. Res. 2011, 50, 125–139. [Google Scholar] [CrossRef] [Green Version]
- Ding, T.; Ke, Z. Characteristics and changes of regional wet and dry heat wave events in China during 1960–2013. Theor. Appl. Climatol. 2014, 122, 651–665. [Google Scholar] [CrossRef]
- Wang, P.; Tang, J.; Sun, X.; Wang, S.; Wu, J.; Dong, X.; Fang, J. Heat Waves in China: Definitions, Leading Patterns, and Connections to Large-Scale Atmospheric Circulation and SSTs. J. Geophys. Res. Atmos. 2017, 122, 10679–10699. [Google Scholar] [CrossRef]
- You, Q.; Jiang, Z.; Kong, L.; Wu, Z.; Bao, Y.; Kang, S.; Pepin, N. A comparison of heat wave climatologies and trends in China based on multiple definitions. Clim. Dyn. 2016, 48, 3975–3989. [Google Scholar] [CrossRef] [Green Version]
- Wang, J.; Yan, Z. Rapid rises in the magnitude and risk of extreme regional heat wave events in China. Weather. Clim. Extrem. 2021, 34, 100379. [Google Scholar] [CrossRef]
- Perkins, S.E. A review on the scientific understanding of heatwaves—Their measurement, driving mechanisms, and changes at the global scale. Atmos. Res. 2015, 164–165, 242–267. [Google Scholar] [CrossRef]
- Cleveland, W.S. Robust Locally Weighted Regression and Smoothing Scatterplots. J. Am. Stat. Assoc. 1979, 74, 829–836. [Google Scholar] [CrossRef]
- Wang, P.; Tang, J.; Wang, S.; Dong, X.; Fang, J. Regional heatwaves in China: A cluster analysis. Clim. Dyn. 2017, 50, 1901–1917. [Google Scholar] [CrossRef]
- Kong, D.; Gu, X.; Li, J.; Ren, G.; Liu, J. Contributions of Global Warming and Urbanization to the Intensification of Human-Perceived Heatwaves Over China. J. Geophys. Res. Atmos. 2020, 125, e2019JD032175. [Google Scholar] [CrossRef]
- Liu, Q.; Zhou, T.; Mao, H.; Fu, C. Decadal Variations in the Relationship between the Western Pacific Subtropical High and Summer Heat Waves in East China. J. Clim. 2019, 32, 1627–1640. [Google Scholar] [CrossRef]
- Li, J.; Ding, T.; Jia, X.; Zhao, X. Analysis on the Extreme Heat Wave over China around Yangtze River Region in the Summer of 2013 and Its Main Contributing Factors. Adv. Meteorol. 2015, 2015, 706713. [Google Scholar] [CrossRef] [Green Version]
- Wang, W.; Zhou, W.; Li, X.; Wang, X.; Wang, D. Synoptic-scale characteristics and atmospheric controls of summer heat waves in China. Clim. Dyn. 2015, 46, 2923–2941. [Google Scholar] [CrossRef]


Disclaimer/Publisher’s Note: The statements, opinions and data contained in all publications are solely those of the individual author(s) and contributor(s) and not of MDPI and/or the editor(s). MDPI and/or the editor(s) disclaim responsibility for any injury to people or property resulting from any ideas, methods, instructions or products referred to in the content. |
© 2023 by the authors. Licensee MDPI, Basel, Switzerland. This article is an open access article distributed under the terms and conditions of the Creative Commons Attribution (CC BY) license (https://creativecommons.org/licenses/by/4.0/).
Share and Cite
Ji, H.; Feng, A.; Zhao, Y.; Liao, J.; Zhang, Z.; Gu, C.; Feng, A. Characteristics of Heat Waves in Mainland China since 1961 Based on Absolute and Relative Methods. Atmosphere 2023, 14, 544. https://doi.org/10.3390/atmos14030544
Ji H, Feng A, Zhao Y, Liao J, Zhang Z, Gu C, Feng A. Characteristics of Heat Waves in Mainland China since 1961 Based on Absolute and Relative Methods. Atmosphere. 2023; 14(3):544. https://doi.org/10.3390/atmos14030544
Chicago/Turabian StyleJi, Honghua, Aiqing Feng, Yufei Zhao, Jie Liao, Zhisen Zhang, Changgui Gu, and Aixia Feng. 2023. "Characteristics of Heat Waves in Mainland China since 1961 Based on Absolute and Relative Methods" Atmosphere 14, no. 3: 544. https://doi.org/10.3390/atmos14030544