Article

Investigating the Incorporation of Idle, High Idle, and Driving Acceleration NOx Emissions Tests into the Periodic Technical Inspection Procedures

1
3DATX Corporation, Buffalo, NY 14228, USA
2
Opus Bilprovning, 162 12 Vällingby, Sweden
*
Author to whom correspondence should be addressed.
Atmosphere 2023, 14(3), 536; https://doi.org/10.3390/atmos14030536
Submission received: 31 January 2023 / Revised: 5 March 2023 / Accepted: 6 March 2023 / Published: 10 March 2023
(This article belongs to the Special Issue Vehicle Emissions: New Challenges and Potential Solutions)

Abstract

:
NOx pollution is one of the greatest air quality issues that urban areas face today, particularly within the European Union (EU), yet currently this pollutant is only controlled through the homologation process. There is currently no periodic technical inspection (PTI) process for NOx emissions within the EU, leaving a weakness in the legislation that is currently allowing high polluters to negatively impact air quality. Work needs to be performed to incorporate a simple, quick, inexpensive, and representative test to accurately identify these high emitters within the on-road vehicle fleet. This paper investigates options for the incorporation of a NOx test into the EU PTI test procedures. In a trial constituting over 600 vehicles, a 3DATX parSYNC was used to measure the NOx emissions over a series of short test types. These are an idle test, two types of high idle test (a constant high idle and a rapid high idle), and an on-road driving dynamic acceleration test. The repeatability of all three test types was good. The NOx concentrations have strong correlations to the mass emissions for each test type, with the use of mean concentrations being deemed more representative than the use of maximum concentrations. The mean results across the tested fleet are calculated and used to define pass/fail thresholds for different vehicle types. The findings of this work show that multiple test methods have the potential to characterize NOx emissions from a vehicle, but in order to catch high emitters on a PTI test, the unloaded idle and high idle test types are not suitable substitutes for a dynamic acceleration test, particularly for petrol vehicles.

1. Introduction

The pollutants of the greatest air quality concern in the European Union (EU) today are nitrogen dioxide (NO2) and particulate matter (PM) [1]. NO2 is an irritant and oxidant, associated with a range of respiratory and cardiovascular diseases [2]. NO2 is primarily a secondary pollutant, with the majority being produced by the oxidation of NO emitted from combustion sources, though primary NO2 is also emitted directly, particularly from diesel vehicles [1]. Nitrogen oxide (NOx) emissions also have environmental impacts such as contribution to acidification and eutrophication as well as the generation of tropospheric ozone [3] and secondary PM [4].
NOx is created when nitrogen and oxygen exist at high temperatures, and so are strongly associated with combustion engines [5,6]. The road transport sector is the largest contributor to NOx emissions in the EU [1,7], and this makes NOx emissions of particular concern, with a large proportion of EU Member States failing to comply with the average annual ambient NO2 limits [8]. A series of related factors have led to the higher ambient NO2 levels: (1) increased uptake of diesel engine technologies, which are more prone to produce NOx [1,9], due to historically more cost-effective diesel fuelling costs compared with petrol vehicles; (2) diesel vehicles having a higher type approval threshold of allowed NOx emissions [10]; (3) most diesel vehicles emitting higher levels of NOx in real-world driving conditions compared with during type approval or as expected of their Euro standard (even after accommodating for the conformity factor); (4) the Dieselgate scandal [11,12] of 2015 where certain manufacturers were using defeat devices that led to 10–40 times higher emissions in real-world driving; and (5) tampering of the after-treatment system by vehicle owners (discussed later).
Both petrol and diesel vehicles have technologies installed to abate NOx emissions. For petrol vehicles this takes the form of a three-way catalytic converter (TWC) whereas diesel vehicles have a range of different technologies that can be used. The use of exhaust gas recirculation (EGR) reduces the excess oxygen in the combustion process and cools the combustion temperatures, both of which decrease the amount of NOx that is formed [13]. However, EGR alone is not enough to meet recent homologation type approval limits. NOx traps or selective catalytic reduction (SCR) are used by diesel vehicles to reduce the amount of NOx in the exhaust after combustion. NOx traps are less effective than SCRs, and usually only used with smaller engines [14,15]. Increasingly stringent NOx limits at type approval have prompted increased use of SCR technologies in passenger vehicles, though it has been shown that SCR is sometimes ineffective in urban traffic where the worst health dangers from NOx exist [16,17,18].
There are many different reasons why a vehicle may be high emitting. These are mainly associated with inappropriate maintenance or operation, vehicle tampering, and component defects [11]. EGR faults can be, for example, a malfunction or blockage of the EGR valve, while SCR and NOx trap faults can include malfunctioning of urea dosing, damaged catalytic coatings, or mechanical damage to the system [1]. A big problem is the tampering of the urea dosing system to reduce urea consumption and hence save money. There are electronic devices available on the market that can achieve this. A large proportion of the NOx released into the atmosphere comes from a very small proportion of high-emitting vehicles [19,20,21]. It is therefore very important for air quality and the environment to identify and control the emissions from these vehicles [7].
Currently, exhaust emissions of in-use vehicles are checked through different legislative methods: in-service conformity checks, market surveillance [22], and periodic in-service roadworthiness technical inspection (PTI) [23]. In-service conformity and market surveillance, requiring the repetition of the type approval tests, have the objective of checking the compliance of specific models with the exhaust emissions legislative requirements. The vehicle type approval tests consist of measuring exhaust emissions in a laboratory-based test under well-controlled conditions as well as, since 2017, in on-road tests [24]. In both cases, the needed equipment is complex and expensive while the tests require well-trained operators and are time consuming [25].
The periodic technical inspection (PTI) aims instead at a large-scale check of the performance of the in-use vehicles and therefore the tests must be quick and simple in order to be carried out by the PTI services [10]. The PTI has not thus far included a NOx test; today this is considered a very urgent requirement for several reasons, particularly to avoid losing a large part of the benefits linked to the very low emissions of the latest generation of vehicles which rely on the proper functioning of sophisticated emission control technologies.
Work is therefore under way to investigate options for the incorporation of a NOx test into the EU PTI test procedures, to detect high emitters of NOx due to tampering or malfunction [26]. This is not as straightforward as for some other pollutant emissions such as solid particles [25]. When considering possible NOx tests, most of the options broadly fall into four categories: unloaded tests (at low/idle or higher engine speeds); loaded steady state power dynamometer tests; loaded transient power dynamometer tests; and on-road transient tests. The EU PTI directive states that testing should be relatively simple, quick, and inexpensive, which puts those test types involving a dynamometer at a disadvantage due to the economics involved. It has been stated that unloaded tests are not suitable for identification of some high NOx emitters due to the temperature dependence on load and hence NOx production, and this must be accounted for when designing tests for NOx emissions [7]. It is difficult to evaluate NOx emissions in a reliable and repeatable manner whist fulfilling the needs for a quick, simple, and cheap PTI test [8]. In 2011, the International Motor Vehicle Inspection Committee (CITA) published the TEDDIE study [1], which analysed different systems for NOx measurement in the context of PTI testing, and deemed those which use electrochemical and non-dispersive ultraviolet (NDUV) technologies as the best combination of accuracy and stability when weighed against the cost. NDUV is more accurate, but also higher cost. Fernández et al. [26] confirmed that electrochemical sensors can perform adequately to meet the needs of PTI inspections.
Some countries outside the EU have already incorporated a NOx test into their inspection and maintenance programs. The loaded transient tests such as the Australian DT60/DT80 and USA IM240 tests are long, costly, and require skilled staff, making their PTI procedures more complicated and lending themselves to centralisation [1]. The current inspection and maintenance program in Beijing, China, uses a free acceleration test in certain cases [27], though it has been noted previously that there can be a risk to the engine from such unloaded testing [1], in addition to questions over the representativity of an unloaded test for NOx quantification [7].
Some research has already focused on the incorporation of a NOx test into EU PTI procedures. The TEDDIE project [1] concluded in 2011 without successfully defining a NOx procedure or NOx threshold limits, and encouraged further research to that end. The project did, however, state that from a theoretical point of view, a method involving a dynamometer or real road driving might be the best to identify vehicles with emission-related problems. In 2015 the SET Project [28] recommend to define an inexpensive test method to measure NOx and to determine applicable threshold limits. In 2017, the SET II project [10] pursued this, but no straightforward NOx method was selected. The SET II Project charter stated that the combination of a loaded test ASM 2050 with an unloaded test for EGR may be a more thorough approach, while they also said that the short test drive is a promising alternative to loaded dynamometer testing, but needed further investigation including research into the application of measurement sensors which are used on vehicles (e.g., a miniPEMS test).
Several research groups and organizations independent of CITA have conducted their own research into applicable PTI methods for NOx emissions. Pucher and Gruber found from their trial [29] of a short NOx test that tailpipe sampling of vehicles in engine idle state can be a viable option, while the Joint Research Centre (JRC) promote a hot idle test [30] for NOx integration into PTI. In 2022, CITA published the results of another attempt to define a NOx protocol in the form of a position paper [7], whereby they reviewed and ranked various methods that had been presented by different groups. Their conclusions were that, of the methods reviewed, those that seemed most promising in the long term were the so-called QNOx method, and a method involving on board monitoring (OBM) [31]. However, these two methods require changes to the type approval test legislation and so would only be possible for future vehicles (please refer to [7] for more information). TNO also investigated options for use of OBD data for NOx monitoring at PTI, and they concluded that NOx monitoring via in-vehicle (ECU) signals is currently not an accurate method to assess the NOx emission performance. They did not propose a PTI NOx test methodology. In the short term, a static idling load test as described in Fernández et al. [8] was deemed most suitable by CITA [7] because it can be implemented immediately as it does not require any special provisions or innovations in technology.
In 2022 GOCA Flanders published a report [32] investigating options for the development of a NOx emission test for use during PTI. They selected the following concepts for further research: Operation of the EGR valve based on CO2 and O2 measurements, based on a study by Norris [33]; a stationary NOx measurement used to screen possible truck fraudsters, according to the study by Janssen and Hagberg [34]; NOx measurement with several free accelerations as proposed by the company Knestel [35]; a procedure to compare the NOx sensor with the results of an exhaust test [36]; two different procedures for the idling measurement of NOx in combination with the read engine load, described by Fernández et al. [8] and the company Spheretec [32], respectively; and the concept of the corrected NOx/CO2 ratio, derived by GOCA Flanders from the paper by Yang et al. [37] on calibration in remote sensing devices. They did not further investigate the Knestel concept because many vehicles are limited in free acceleration (8.33% for Euro 4 vehicles, rising to 51.06% for Euro 6 vehicles). They concluded that though the NOx sensor concept is a possible simple test for the future provided that new vehicles are equipped as described, reading the NOx sensor was now impossible for any vehicle so did not further investigate this method. In their report, GOCA Flanders identifies two promising concepts that can be applied within the inspection process in Flanders, namely the corrected NOx/CO2 ratio, derived from the paper by Yang et al. [37], and the NOx calculation as described by Fernández et al. [8].
In 2022 TNO published a report into the possible approaches for detecting high NOx emissions of aged petrol cars at PTI [19]. This focused on new tests to detect malfunctioning TWC. One option was to tighten the lambda limit value of the PTI test, while another was to perform an additional test of the mounted lambda sensor. Both options require minimal development. The report concluded that an additional cold start test shows the most promise, but requires the further development of applicable test procedure.
The ‘Emission Check 2020’ project proposed stricter limits than those then provided for in Directive 2009/40/EC (amended by 2010/48/EU) [32]. The SET II Project charter investigated the options for the incorporation of a NOx test into PTI criteria, including the definition of pass/fail thresholds. They state that an acceptable threshold should consider the dispersion for the same homologated vehicle, with each vehicle tested several times in the ideal test conditions. The average value would depend on the aftertreatment systems installed on the vehicle, its Euro class, the emission strategy, etc. A safety margin should be added on to the average value to allow for the dispersion and uncertainties such as the equipment, environmental conditions, and differences between drivers. López et al. [25] also suggested to differentiate the threshold for rejection based on fuel type and Euro standard, but did not quantify these thresholds in their study. If the thresholds are to be seen in correlation to the type approval limits, then a reference value measured during type approval would be helpful for the evaluation of new vehicles in the future, while for older vehicles, an average of in-use vehicle measurements can be used to form a representative sample to calculate an acceptable standard [10]. Alternatively, a ‘politically acceptable’ rejection rate can instead be implemented [10]. To date, no firm suggested thresholds have been found in the available literature, though Fernández et al. [8] proposed a 5% fail rate for NOx as suggested by the European Commission.
From this review of current research, it is clear that there is room for more investigation of options to incorporate a NOx test into the EU PTI procedures. The precise form of the NOx test is being debated, so any new research on this topic will help regulators to decide on the test procedures. This includes the conditioning requirements, the precise protocol of the test itself, and the thresholds for pass/fail at PTI.
The aims of this paper are to investigate different options for the integration of a NOx emission test into the EU PTI procedures. The simplest and cheapest approach would be to utilise test types that are already performed for current PTI testing, as this requires minimal changes to staff training, procedures, and equipment. To this end, the NOx emissions on idle, high idle, and free acceleration test types already implemented at PTI are investigated, alongside an alternative on-road dynamic driving test type. An investigation into the repeatability of these different test types is performed. The ability of different kinds of reporting metric to represent the actual mass emissions on each test type are investigated, alongside the agreement between different test types and reporting metrics. Based on an extensive dataset, potential threshold limits for the different types of tests are presented, and the agreement of pass/fail results for vehicles across different test types are quantified for the first time in the literature. To the best of the authors’ knowledge, this is the largest trial involving static and real-world driving tests performed on a random sample of vehicles arriving at a PTI station that has been conducted thus far in the quest for integration of NOx into PTI procedures.

2. Materials and Methods

The trial of an enhanced PTI emissions test was conducted at the Opus Bilprovning PTI test centre in Borås, Sweden. The trial ran from January 2021 to June 2022, and involved the testing of over 600 vehicles in total.

2.1. Test Equipment

The equipment used for the enhanced PTI emissions test was a 3DATX parSYNC miniPEMS [38] with a sample probe placed at the tailpipe for emissions sampling. This device measures carbon dioxide (CO2) and carbon monoxide (CO) using a non-dispersive infrared (NDIR) spectrometer, and NO and NO2 using three-electrode electrochemical sensors. Particle mass and particle number (PN) values are calculated using data from three sensors: ionization, scattering, and opacity. Only the NOx functionality was utilized in the present study. The NO sensor has a measurement range from 0 to 5000 ppm NO, a T90 response time of less than 5 s, and a resolution of 1–2 ppm. The NO2 sensor has a measurement range of 0–300 ppm, a T90 response time of less than 35 s, and a resolution of 0.1 ppm.
The miniPEMS equipment also recorded a range of engine control unit (ECU) parameters using a HEM Data OBD Mini Logger. These parameters included vehicle speed, engine speed, lambda, mass air flow, engine coolant temperature, catalyst temperatures, engine load, and EGR rate information.

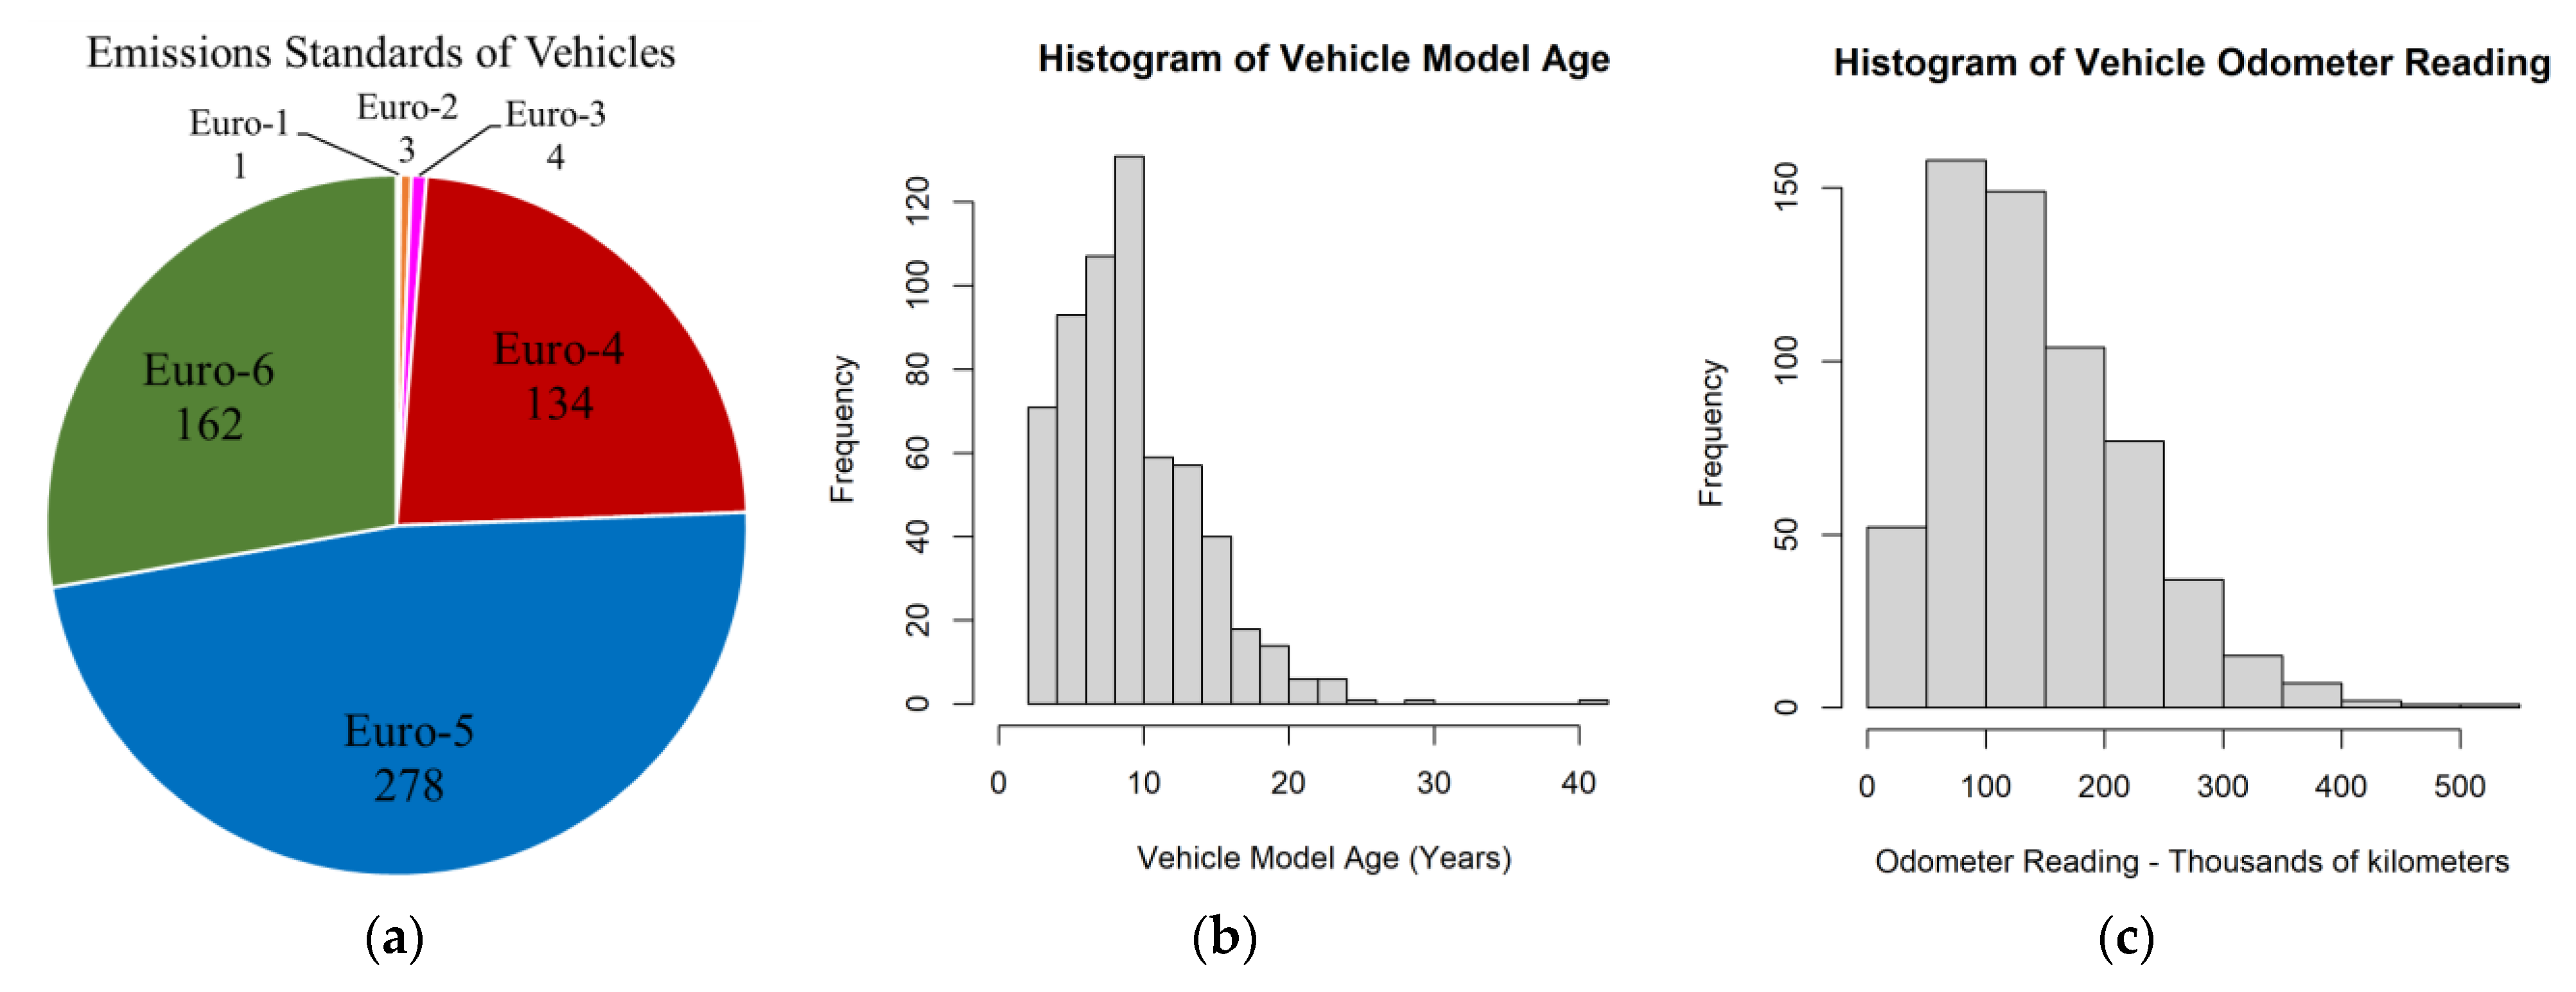
2.2. Test Vehicles and Fuel

A total of 606 passenger vehicles were employed in this study, with a fuel-based split of 309 diesel and 297 petrol. These vehicles were privately owned by Swedish residents and were brought into the Borås PTI test centre for standard PTI testing. All owners provided permission for the enhanced PTI test to be performed on their vehicles in addition to the standard PTI checks required by law. The vehicles can therefore be considered as broadly representative of the vehicle fleet in Sweden. The vehicles ranged from model years 1979 to 2019, with odometer readings 14,000–522,000 km, spanning the European emission standards Euro 1 to Euro 6 (with some pre-Euro standard vehicles), and included gasoline and diesel engines of 0.9–5 L and 40–426 kW. The distribution of Euro standards, model ages, and odometer readings can be seen in Figure 1, while detailed vehicle information for all passenger vehicles tested can be found from the source referenced in the Data Availability Statement below. Of these vehicles, 162 were Euro 6, 278 were Euro 5, 134 were Euro 4, 4 were Euro 3, 3 were Euro 2, 1 was Euro 1, and 24 vehicles were of pre-Euro or unknown Euro standard. The analysis presented in this paper focuses on the vehicles of Euro standards 4–6. All vehicles were tested with the same fuel that they had in their tank when they arrived at the test centre (presumably the market gasoline and diesel publicly available in the vicinity of the test centre at the time of testing) to be most representative of a real PTI test.

2.3. Test Procedures

An enhanced PTI protocol procedure was designed to be incorporated into the current PTI test procedures. The enhanced protocol consisted of idle, high idle, and dynamic driving acceleration sections for most of the vehicles tested. The protocol, including the style and ordering of different test sections, underwent some changes during the course of the trial, which are summarised in Table 1. These changes were all made either to broaden the scope of the trial, or to reduce the additional time taken to perform the test at the test centre alongside standard PTI procedures. Additionally, some diesel vehicles from protocol versions V03–V05 were unable to conduct the high idle test in the manner required for their protocol version (i.e., a free acceleration smoke opacity test up to the desired engine speed of 2/3 of the maximum engine rpm) due to the action of rev limiters or other reasons. These vehicles (around 34% of applicable vehicles in this trial, rising from 17% for Euro 4 to 46% for Euro 6) instead performed a single free acceleration test up to the lower engine speed of approximately 2500 rpm. The analysis presented in the results section accounts for these protocol differences, with only applicable vehicle tests processed to provide certain results. When a selection was made, this is detailed where those results are presented.
All versions of the protocol commenced with the preparation of the emission measurement system, with the equipment calibrated and operated according to manufacturer instructions. The parSYNC was warmed up on the morning of the test days, then for each vehicle test, it was zeroed using HEPA-filtered ambient air and placed into the boot of the vehicle. The sample probe was then attached to the tailpipe, and the HEM OBD Mini Logger was plugged into the OBD port of the vehicle. The vehicle test was then performed, with the equipment running continuously, sampling at 1 Hz. After the vehicle test was completed, the equipment was removed from the vehicle. The parSYNC then sampled clean air for at least 60 s before being re-zeroed. The vehicle was conditioned only in accordance with the current EU PTI legislation. As a result of this and the varying ambient temperatures over the course of the trial, the vehicle engine coolant and catalyst temperatures varied from vehicle to vehicle. However, no significant effect of temperature on NOx emissions was identified from the test data.
The idle test for protocol versions V01 and V02 was performed as 3 consecutive tests, each 30 s in duration. This was the first test of the protocol. For protocol versions V03–V05 this was divided into two tests, one was the first test of the protocol, and one was the last test of the protocol. Each was one minute in duration. The high idle test changed form during the trial. Test protocol V01 did not incorporate a high idle section, while V02 had three repetitions of a 5 s hold at 2500 rpm engine speed (hereby named the “constant high idle” test) separated by 10 s at low idle engine speed, which was performed directly following the idle test. Protocol versions V03 to V05 incorporated a high idle test section adhering to the high idle section of the PTI CO test for petrol vehicles (also named the “constant high idle” test in the rest of this paper). Protocol versions V03 to V05 incorporated a high idle test section adhering to the free acceleration smoke opacity section of the PTI test for diesel vehicles, or, if this was not possible due to manufacturer rev limiters, etc., then a single engine acceleration up to approximately 2500 rpm (both are hereby named the “rapid high idle” test). These high idle tests were performed following the first idle test, after a short drive). The on-road driving dynamic “acceleration” test section consisted of 3 identical repetitions of a smooth acceleration up to 30 km/h and back down to standstill for protocol versions V01 and V02, and for protocol version V03–V05 this acceleration test was only performed once, though with two other on-road drives of different dynamic properties elsewhere in the protocol to allow for more thorough examination of dynamic drive property effects on pollutant emissions in subsequent work (one occurred between the idle and high idle protocol as mentioned above, the other occurred between the end of the acceleration test and the final idle test). Gear shifting was at the discretion of the vehicle driver, as this was deemed the most reliable way to replicate real-world conditions. For the whole duration of the enhanced PTI test, the auxiliary equipment was left in the operating mode of the vehicle owner, or in the manner most suitable for the ambient conditions at the time of testing.

2.4. Data Processing

The data were collated from the different sources. The HEM ECU data were time-aligned to the parSYNC emissions data via alignment of pollutant concentrations to engine speed [39]. A NOx concentration was calculated as the sum of the NO and NO2 concentrations. The mass emission of pollutants was calculated as the product of the mass air flow rate from the ECU and the pollutant concentration from the parSYNC. Therefore, only vehicles for which the MAF was available to the OBD reader could have their mass emissions calculated. The different test sections were demarcated in the data by the operator through a ‘bag numbering’ system in the parSYNC software. The high idle and dynamic acceleration sections of the test were isolated from their bag sections for the calculation of mean pollutant concentrations by the selection of data from those sections with engine speed greater than 1000 rpm and vehicle speed greater than 0 m/s, respectively. For protocols V01 and V02 where there are repeated measurements, the mean values of the repeats were first calculated for each vehicle individually, before any fleet-average data were calculated, to avoid introducing any bias. In addition to mean values, the maximum values of the pollutant concentrations were also recorded, allowing the analysis of test data in the absence of the ECU information required for the isolation described above. For the idle sections, the mean values could be calculated from that section for each vehicle regardless of ECU data availability.
Various dynamic properties of the acceleration test were calculated from the data where data availability made this possible. The calculation equations for these are provided in this paragraph. The vehicle-specific power (VSP) is provided in Equation (1).
VSP = v [1.1 a + 9.81 (r/100) + 0.132] + 0.000302 v3,
where VSP is the calculated vehicle-specific power (kW/ton), v is the vehicle speed (m/s), a is the vehicle acceleration (m/s2), and r is the road grade (%). In this case, the road grade was deemed negligible and so r = 0. The relative positive acceleration (RPA) is provided in Equation (2).
RPA = i = 1 n a i v i Δ t s
where ai is the acceleration at time step i if ai is greater than 0 m/s2, vi is the vehicle speed at time step i (m/s), Δt is the time increment, and s is the distance travelled (m).
A range of statistical parameters were also calculated from the data. The calculation equations for these are provided in this paragraph. The standard deviation is provided in Equation (3).
σ = x i - µ 2 n
where σ is the population standard deviation, xi is each value from the population, µ is the population mean, and n is the size of the population. The standard error is provided in Equation (4).
SE = σ n
where SE is the standard error, σ is the population standard deviation, and n is the size of the population. The coefficient of variation is provided in Equation (5).
COV = σ µ
where COV is the coefficient of variation, σ is the population standard deviation, and µ is the population mean.

3. Results

The results are divided into four sections. First, the repeatability of the test methods is discussed, then the NOx results from different test methods are investigated. Next, the fleet-average NOx values are presented alongside suggested pass/fail threshold values, before the agreement in pass/fail results between vehicles on the different test types is quantified.

3.1. Investigation into the Repeatability of the Test Methods

It is important to ensure that the tests conducted can be repeated. The protocol versions V01 and V02 had each test type performed in triplicate for each vehicle, and so these are used in this section to perform a statistical analysis into the repeatability of the test methods. Table 2 provides the average value across vehicles of various statistical parameters for different test characteristics, as well as the mean value for context. This analysis cannot be performed for the rapid high idle test, as each vehicle that performed this test type only performed one iteration. The idle test and high idle test NOx emission concentrations had around 20% coefficients of variation, while the acceleration test had a 33% coefficient of variation. The load and engine speed of the idle and high idle tests have coefficients of variation of up to a few percent, while the acceleration test has coefficients of variation around 10%. The coefficient of variation in EGR is 45% for the idle test, 34% for the constant high idle test, and 23% for the acceleration test. Some vehicles changed their EGR strategy during the idle or high idle test, which is the reason for higher variation. This behaviour should be taken into consideration if this type of test is used for NOx measurement at PTI; the EGR rate should have stabilised before the measurement is taken. For the acceleration test, additional dynamic parameters were also studied; the average and maximum values of VSP, the 95th percentile of the product of velocity and positive acceleration (vapos 95), and the RPA all have between 20 % and 30% coefficient of variation.

3.2. Investigation into NOx Test Types and Reporting Metrics

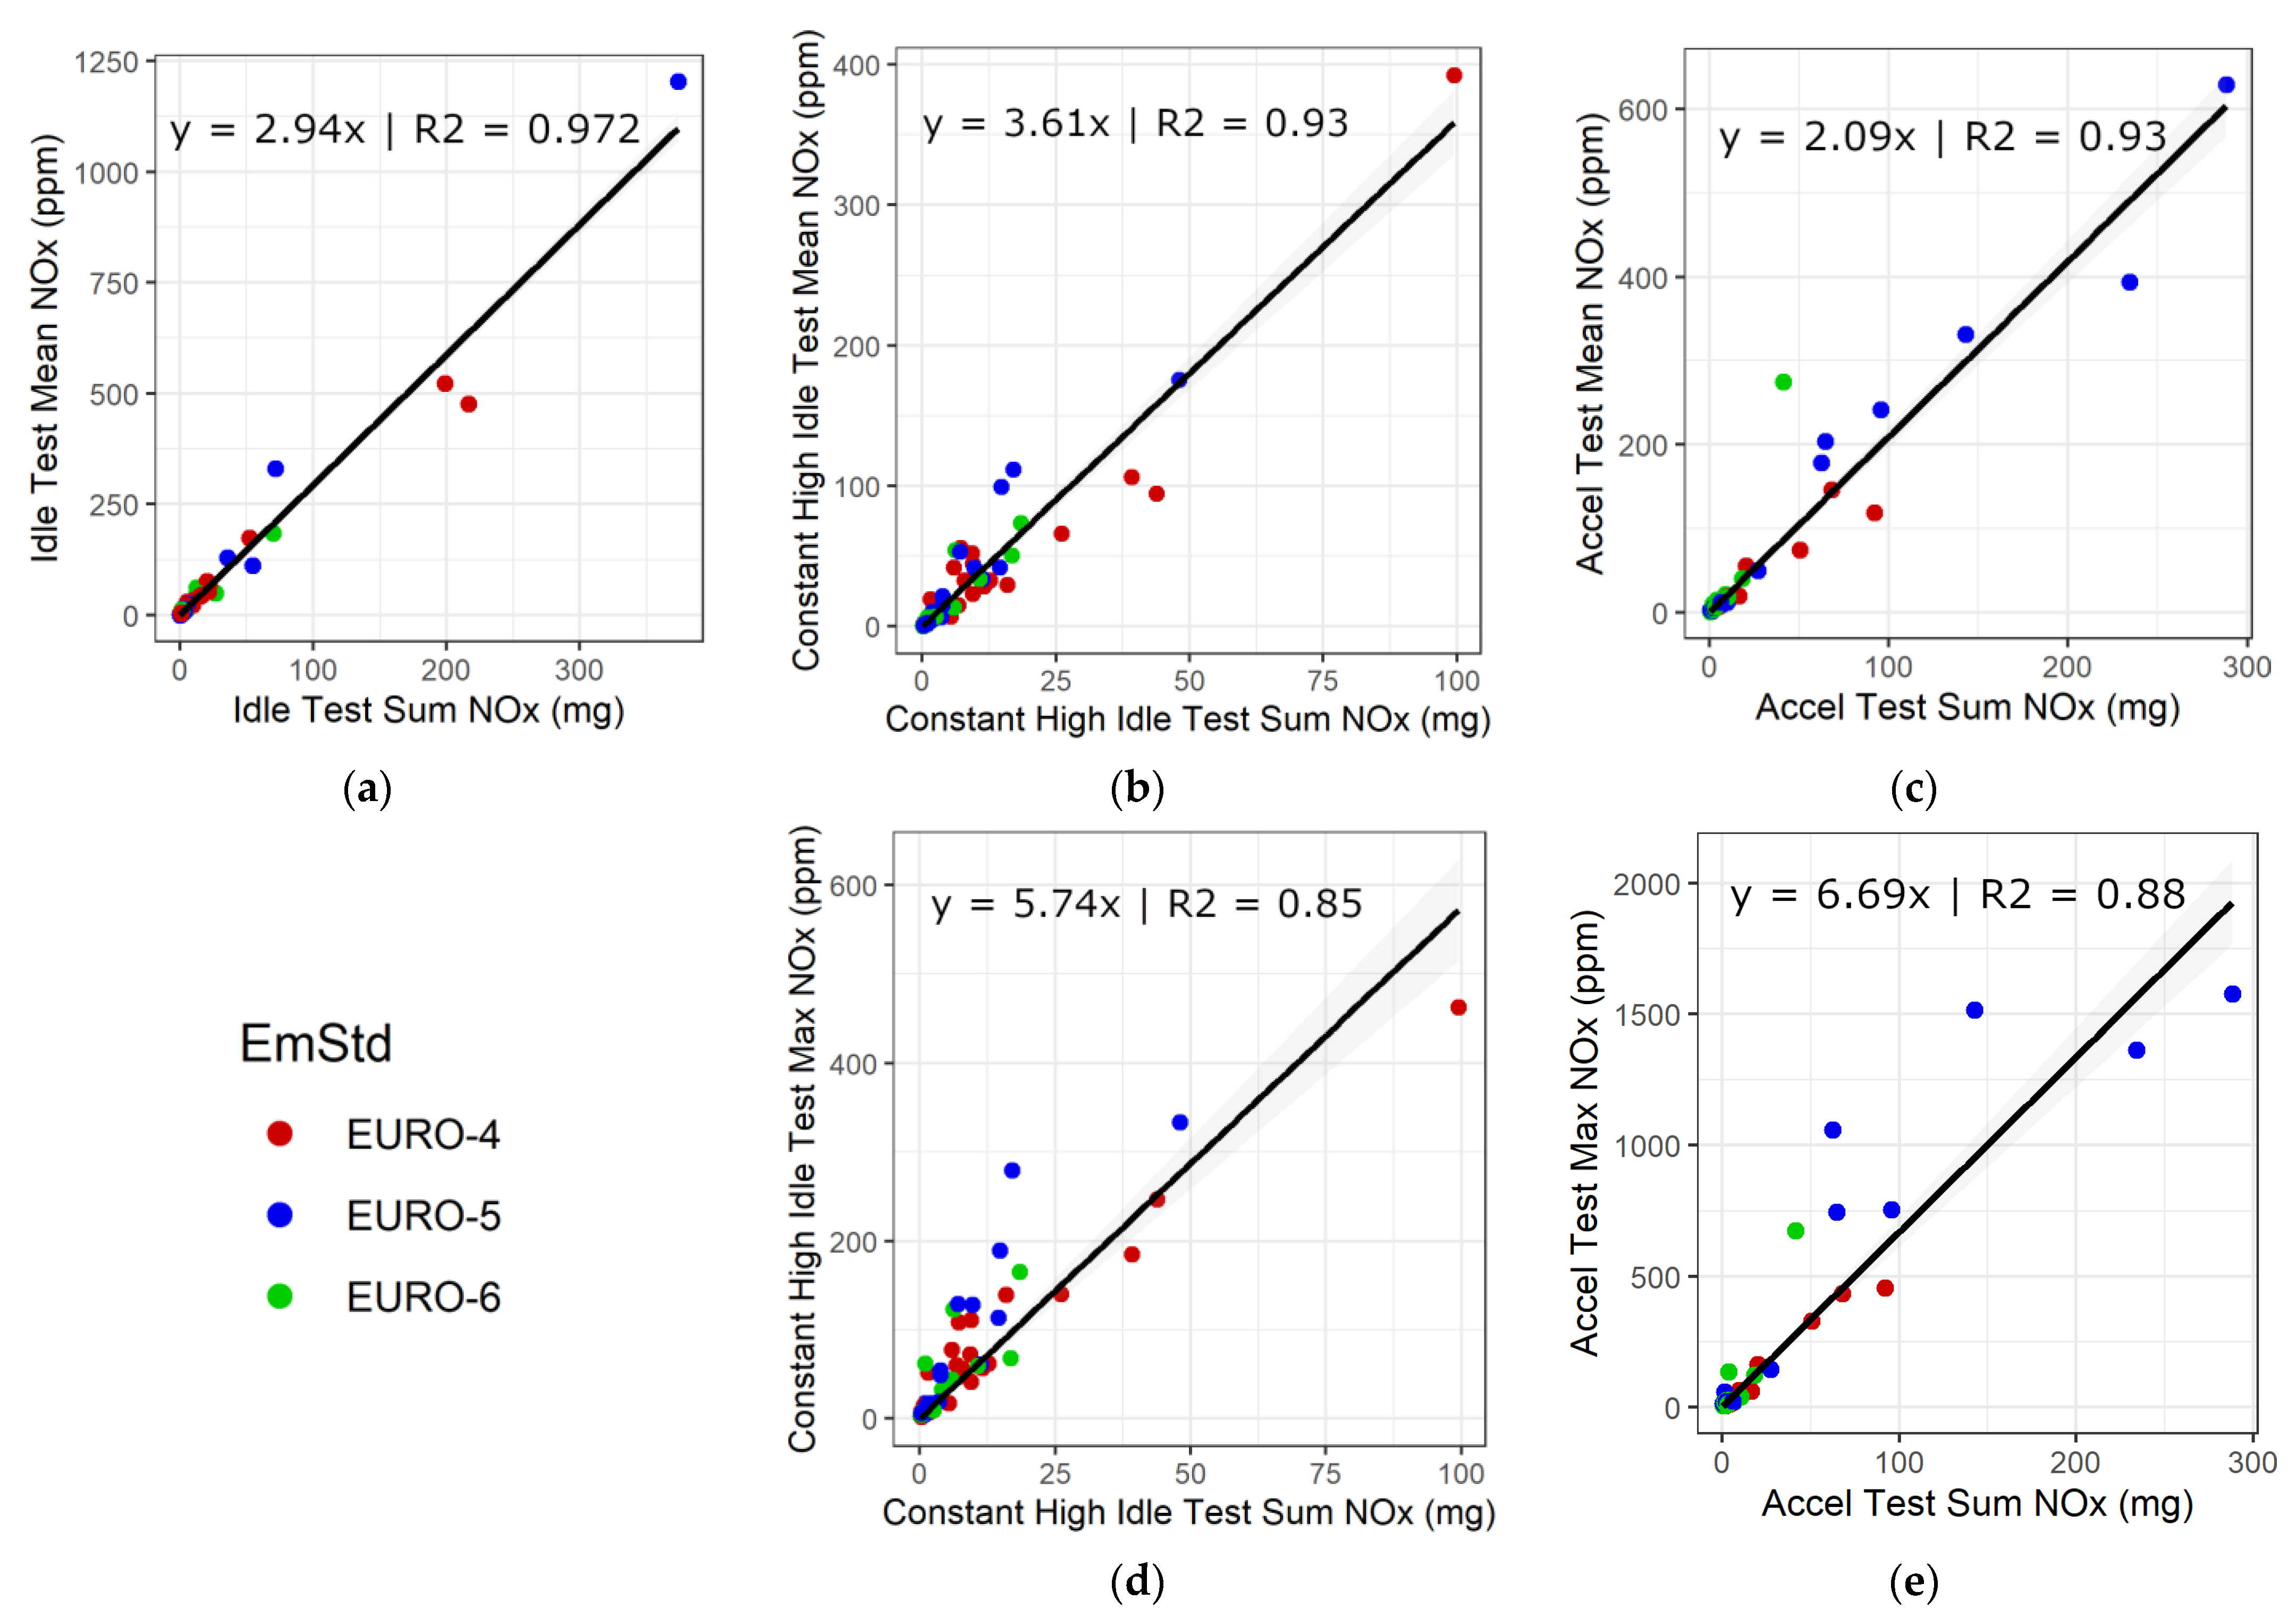
3.2.1. Concentration Metrics for Emissions Reporting

Air quality and emissions inventories are affected by total tailpipe emission rates, which are commonly reported on a mass/time basis, rather than only as tailpipe exhaust pollutant concentrations. However, measuring only tailpipe exhaust concentrations, and not simultaneously measuring exhaust flow rates, means significantly lower time and cost per test. For PTI, the objective is only to identify malfunctioning or high-emitting vehicles, and not to quantify their total mass-based emissions. This section evaluates the suitability of using NOx concentrations as a surrogate for NOx total emissions. Test concentrations can be reported as total sum, mean, or maximum, and historically mean or maximum have been used, so those are evaluated here.
Figure 2 shows the mean and maximum NOx concentrations plotted against the total NOx mass emissions for each diesel vehicle test type. As two different types of high idle test were performed during the course of the trial, these were analysed separately. Only the mean NOx concentration value was used for the idle test, while for the high idle and acceleration tests, both the mean and maximum concentrations were investigated. Each dot represents the results of one diesel vehicle tested. Only vehicles of Euro standard 4–6 are plotted. The correlation equations and coefficient of determination (R2) values are stated on the scatterplots. The stronger the correlation between concentration and mass emissions, the higher the R2 value.
The correlation was strongest on the idle and acceleration tests, and weakest on the constant and rapid high idle tests. The use of the mean value provides a stronger correlation on all test types, except for the constant high idle test, where the mean and maximum values provide the same R2 value. Comparing the two types of high idle test performed, the use of the mean NOx concentration value provides a similar strength of correlation to the mass emissions for both test types, as does the use of the maximum value on the constant high idle test. However, the correlation between the maximum value on the rapid high idle test and mass emissions is slightly weaker.
Figure 3 shows the mean and maximum NOx concentrations plotted against the total NOx mass emissions for each petrol vehicle test type. Each dot represents the results of one petrol vehicle tested. Only vehicles of Euro standard 4–6 are plotted. The correlation equations and R2 values are stated on the scatterplots. The correlation was strongest on the idle test, being slightly less strong on the high idle and acceleration tests. Only the mean NOx concentration value was used for the idle test, while for the high idle and acceleration tests, both the mean and maximum concentrations were investigated. The use of the mean value provides a stronger correlation than the maximum value on the both the high idle and the acceleration tests for these petrol vehicles.

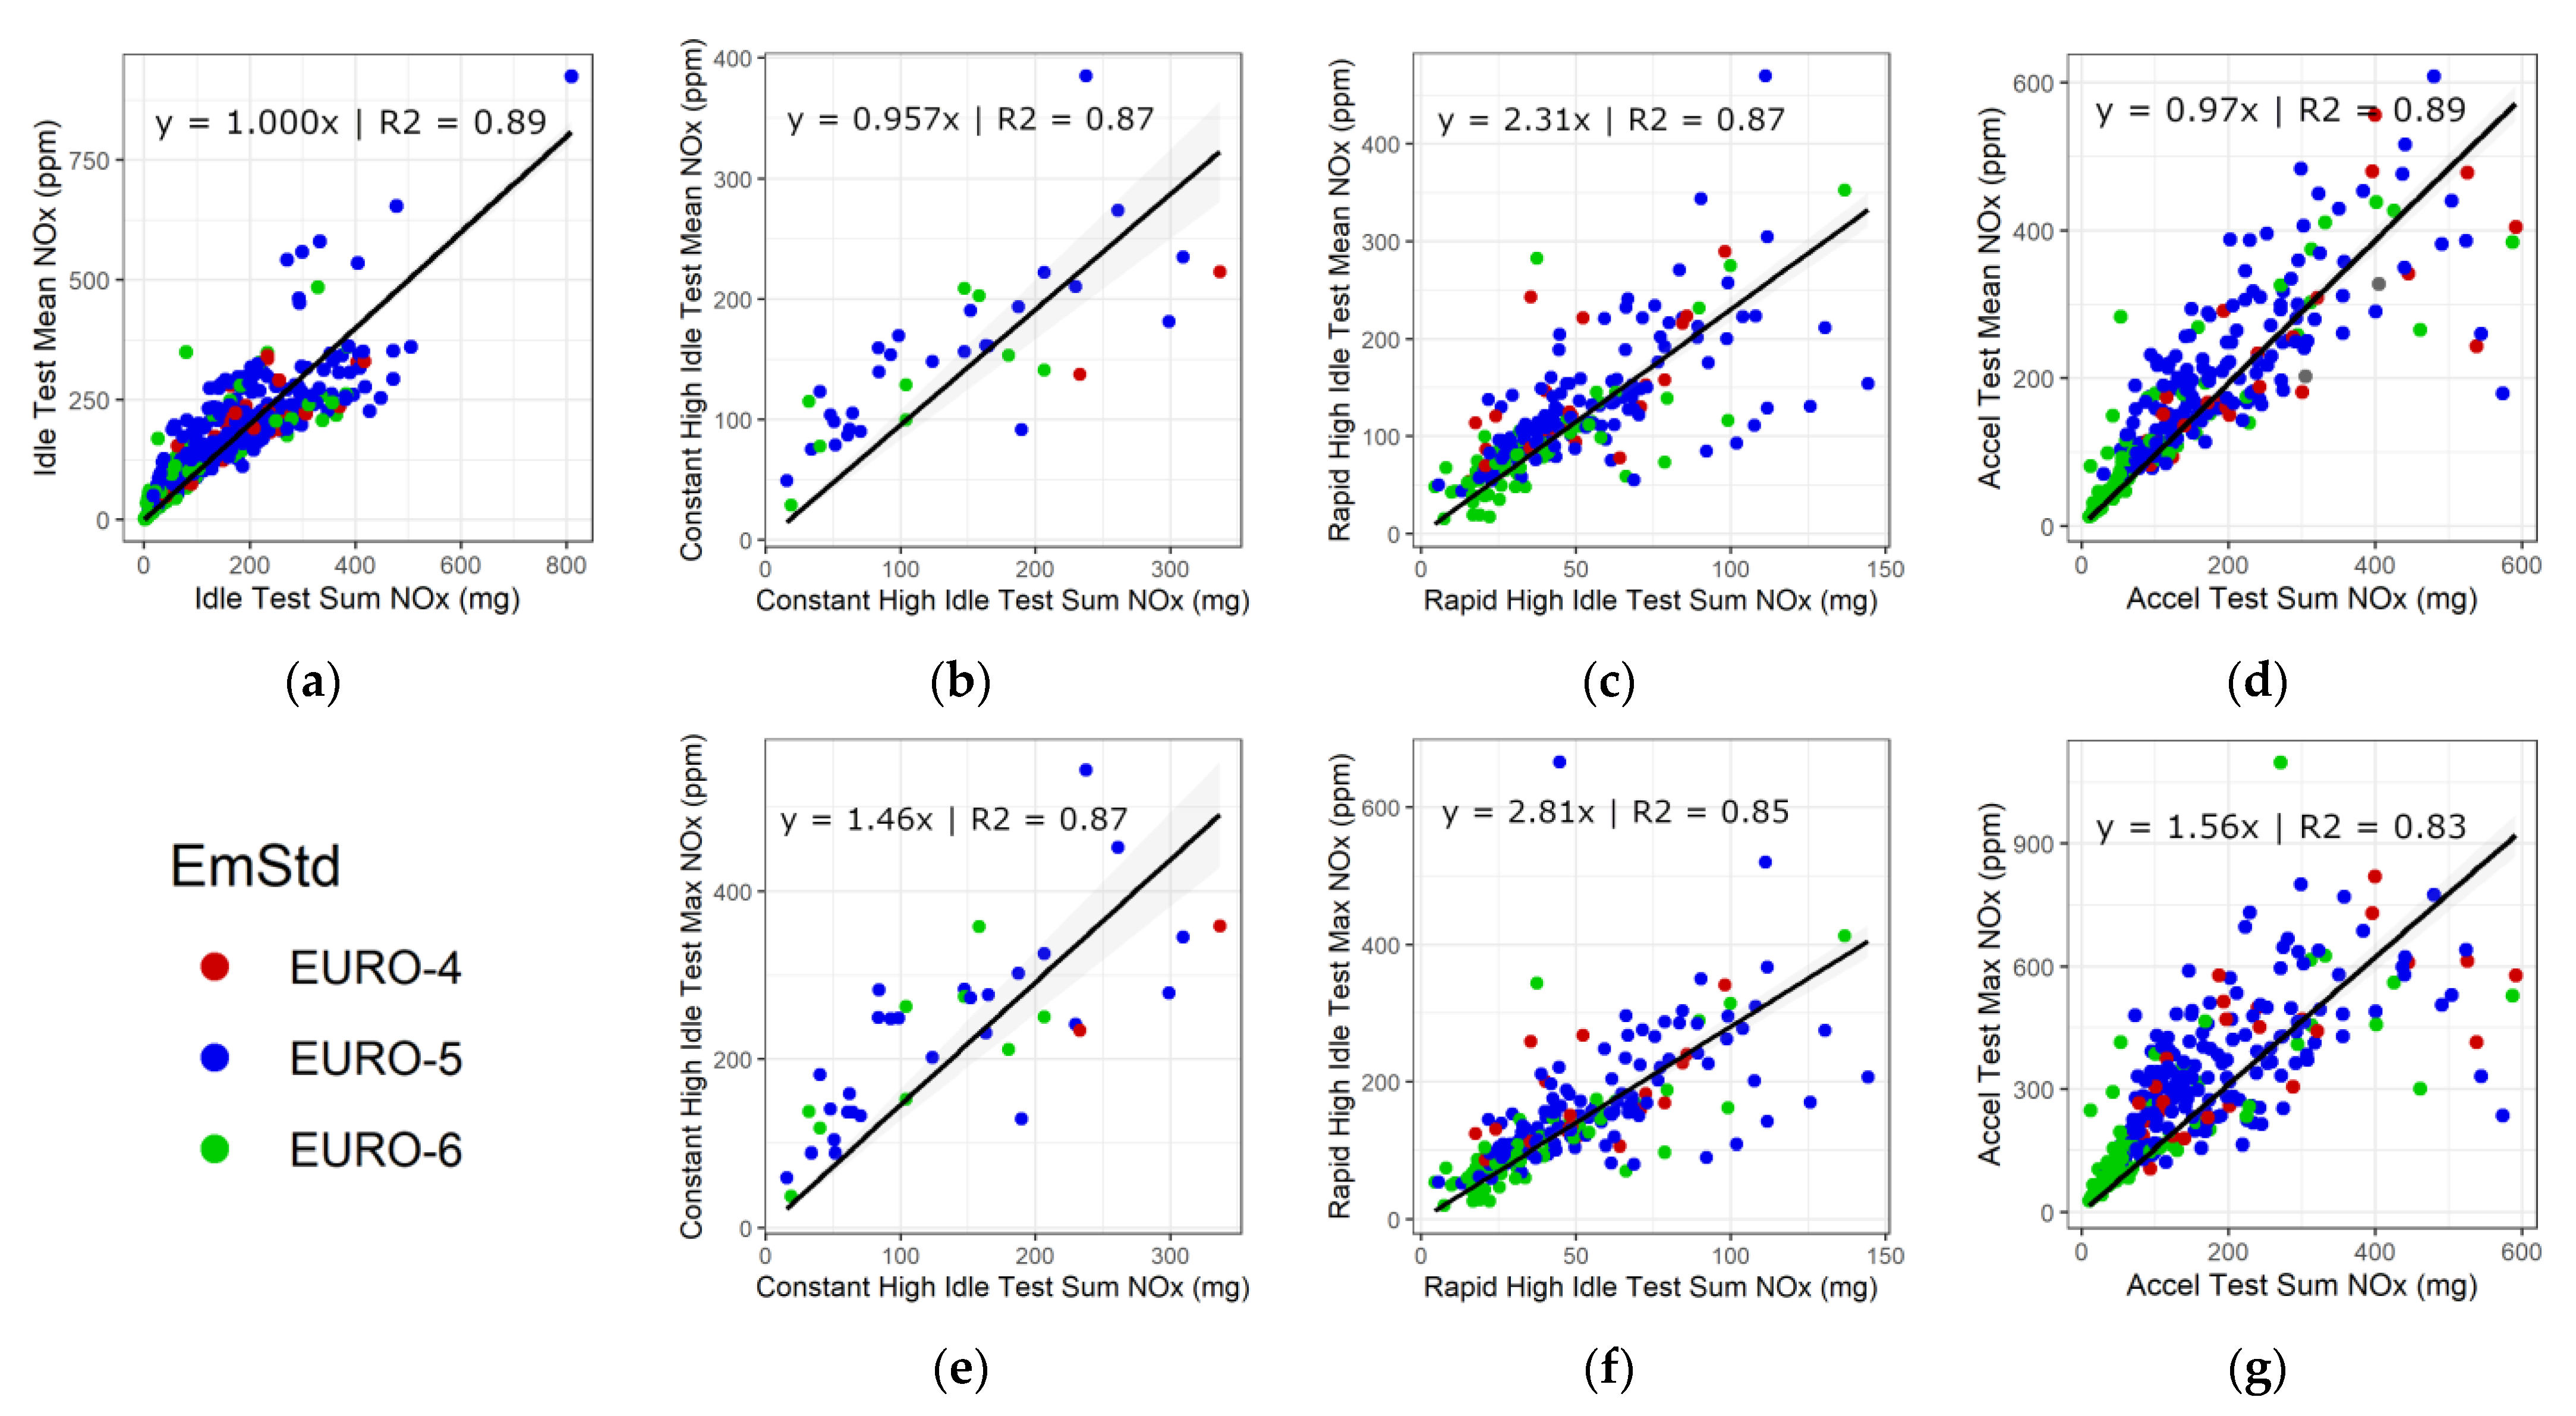
3.2.2. Comparing Maximum Concentrations to Mean Concentrations

The previous section indicates that the use of mean concentration values is more representative of total mass emissions than maximum concentration values for the tests performed in this study. However, as discussed in the methodology section, the use of the mean value requires isolation of the appropriate test section, necessitating engine speed and vehicle speed information for the high idle and acceleration tests, respectively. As this information may not be readily available on all test vehicles, it is important to see whether there is a good correlation between the use of the mean value and the maximum value, as this indicates whether the maximum value can be used if the mean value cannot be calculated.
Figure 4 displays the correlation between maximum NOx concentration and mean NOx concentration for the high idle and acceleration tests, plotted separately for diesel vehicles on the top panel and petrol vehicles on the bottom panel. Strong correlations are seen for all, indicating that either metric may be suitable for adoption into a NOx PTI test, as long as the pass/fail thresholds applied take consideration of the choice of metric. However, the correlations are noticeably stronger for the diesel vehicles than petrol vehicles.

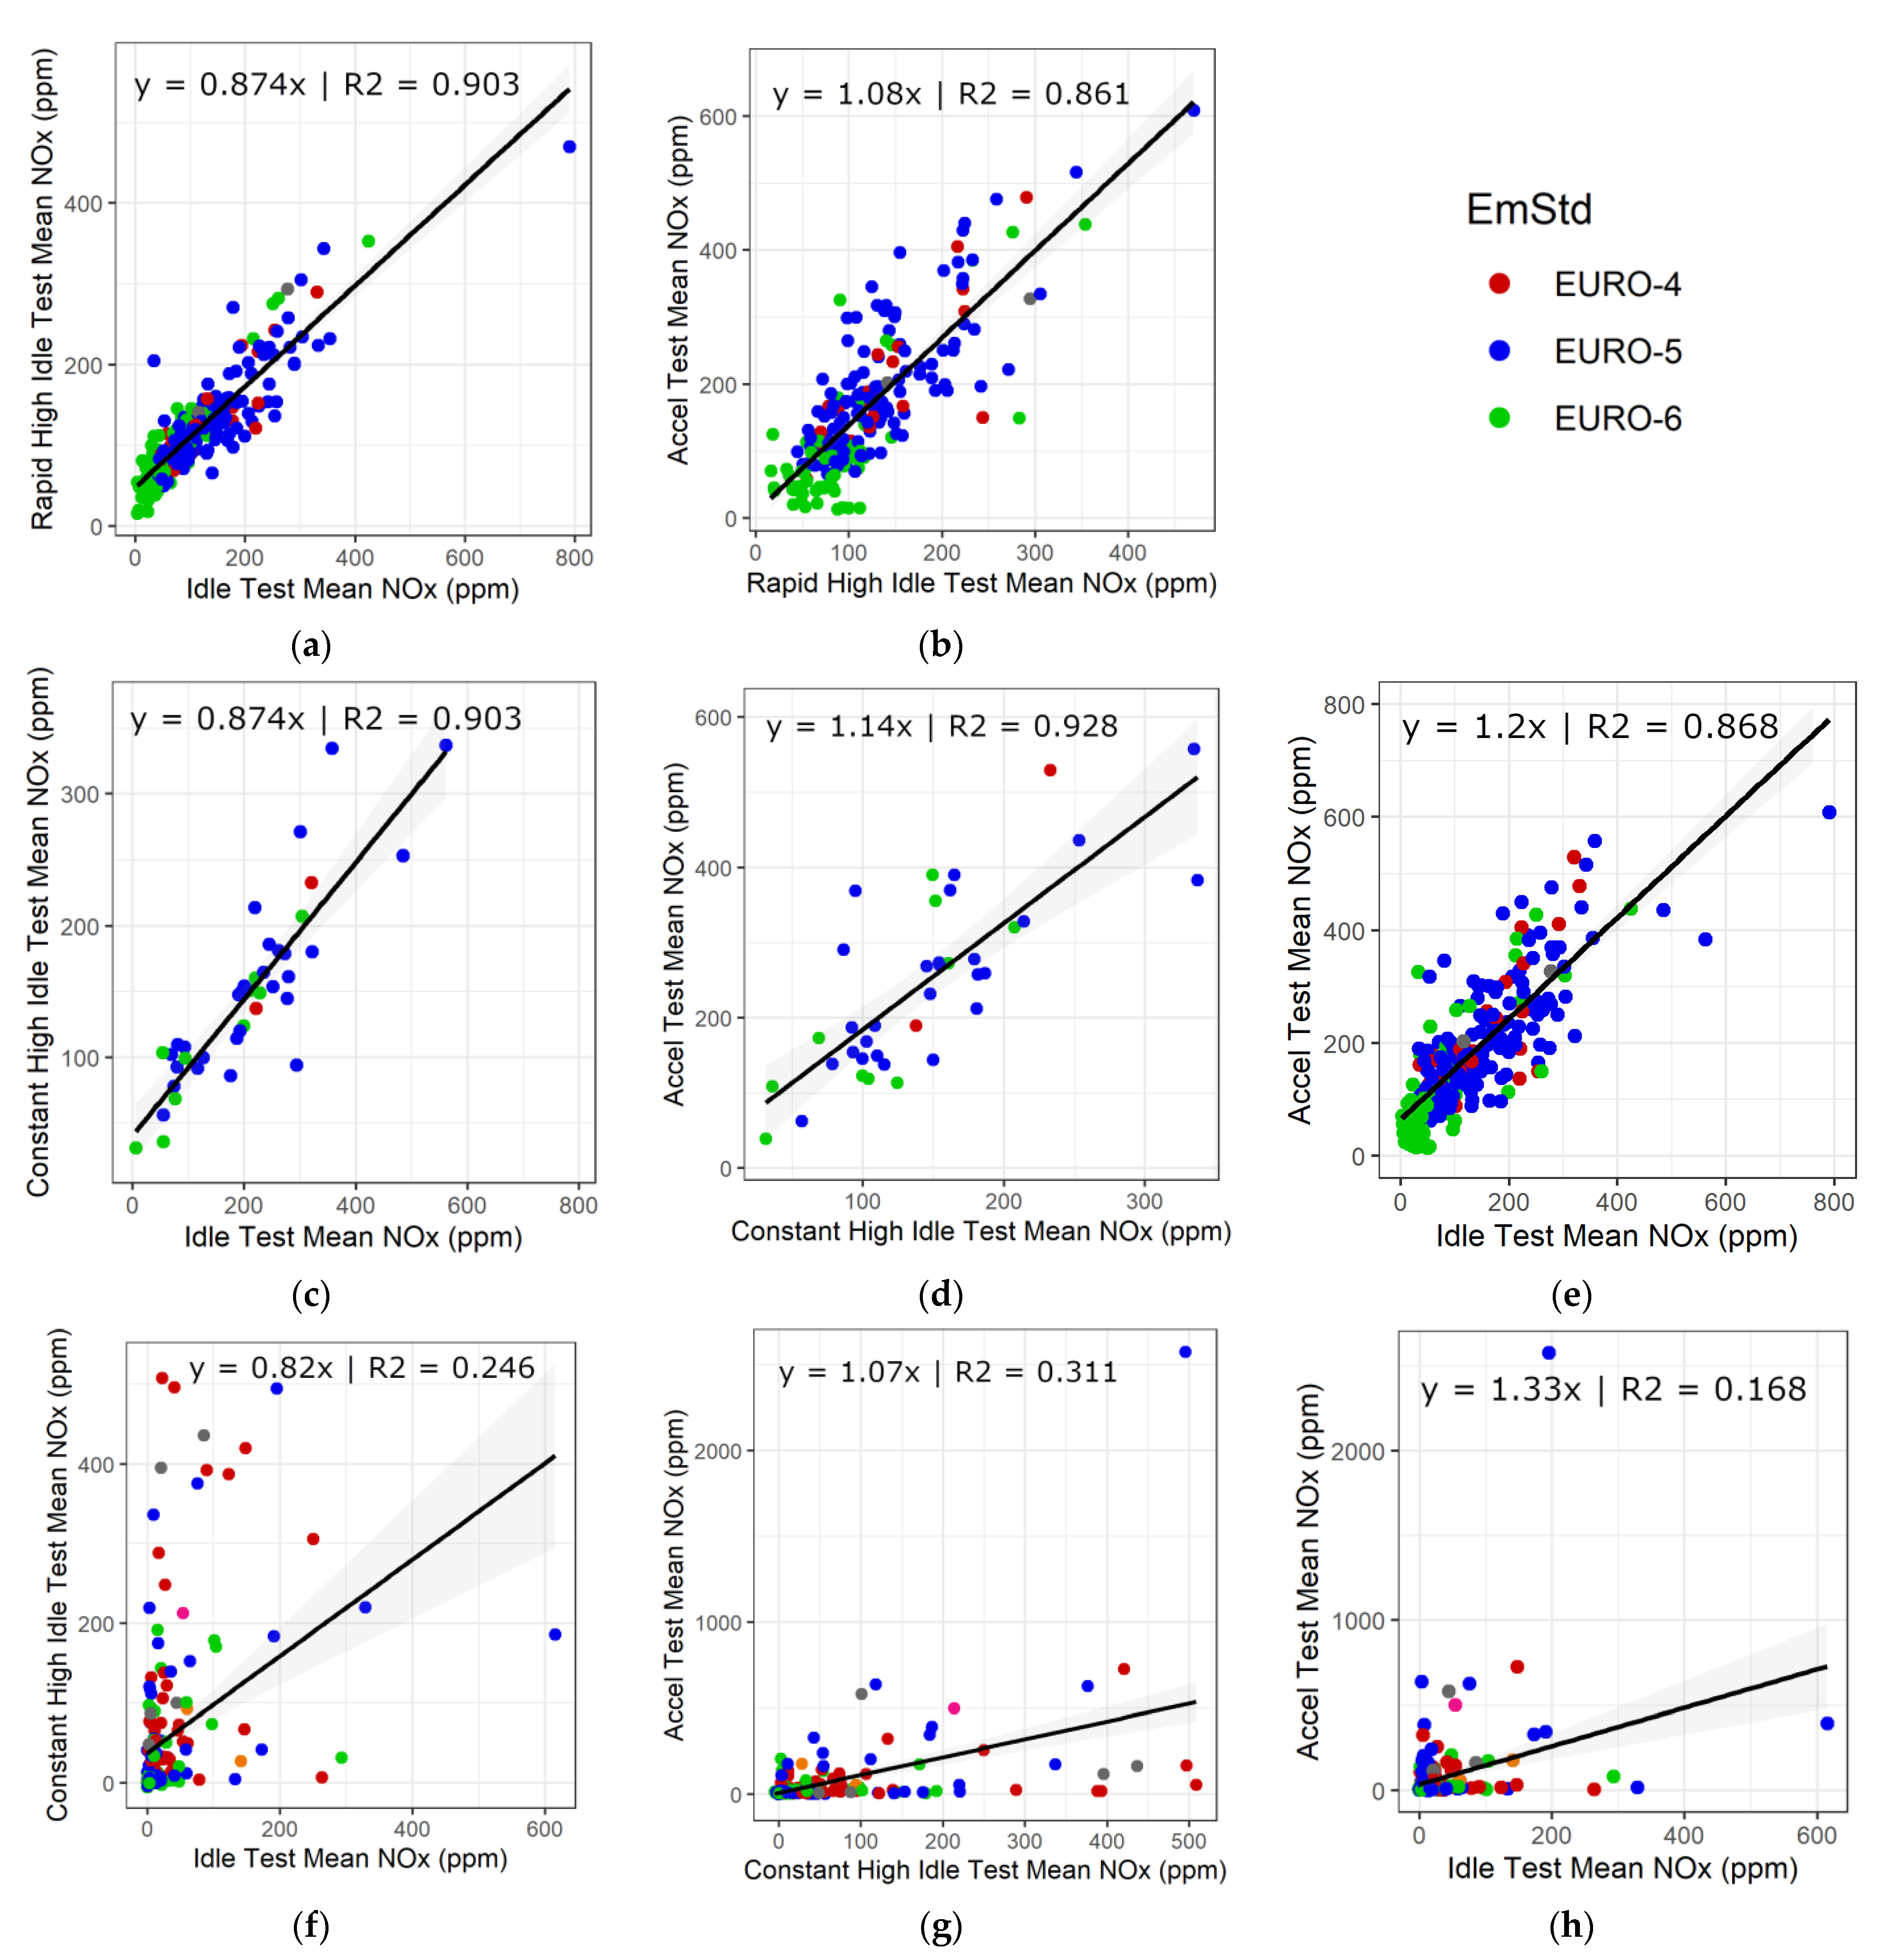
3.2.3. Comparing between Test Types

A range of test types were trialled for incorporation of NOx into the PTI test procedures, but not all tests may be possible to perform throughout the EU under current PTI practices. For example, some countries do not allow the vehicle to be driven during the PTI testing, which would eliminate the option of a dynamic acceleration style test. It is therefore of interest to see how much agreement there is between each type of test for individual vehicles.
Figure 5 compares the NOx concentrations for the three test types against each other. This is performed for diesel vehicles on the top two panel rows and petrol vehicles on the bottom panel row. Following from the conclusions of Section 3.2.1, the mean concentration values for all tests are used. A much stronger correlation between the test types is shown for diesel vehicles than for petrol vehicles, indicating that if a diesel vehicle has relatively high emissions on one test type, it is more likely to also have relatively high emissions on the other test types. Petrol vehicles may have relatively high emissions on one test type but low emissions on another. The correlations are strongest between the idle and high idle test types (compared with acceleration and either of the idle or high idle). The correlation between acceleration and high idle test types is stronger than between acceleration and idle test types. For the diesel vehicles, the constant high idle test has stronger correlations to the other test types than the rapid high idle test.
It is also worth noting that we evaluated the possibility of using the CO results or smoke opacity results as surrogates for NOx emissions and found no discernible agreement between NOx concentration and PTI equipment smoke opacity for diesel vehicles on the rapid high idle test, or between NOx and PTI equipment CO for petrol vehicles on the idle test, but there was a small correlation between NOx and PTI equipment CO for petrol vehicles on the constant high idle test. However, due to low numbers of applicable vehicles, the agreement is not reliable. No vehicle failed the PTI smoke opacity test. Three vehicles failed the PTI CO test, and these all had high NOx emissions too. However, these were all old vehicles (pre-Euro 3) and so irrelevant for this work on PTI NOx.

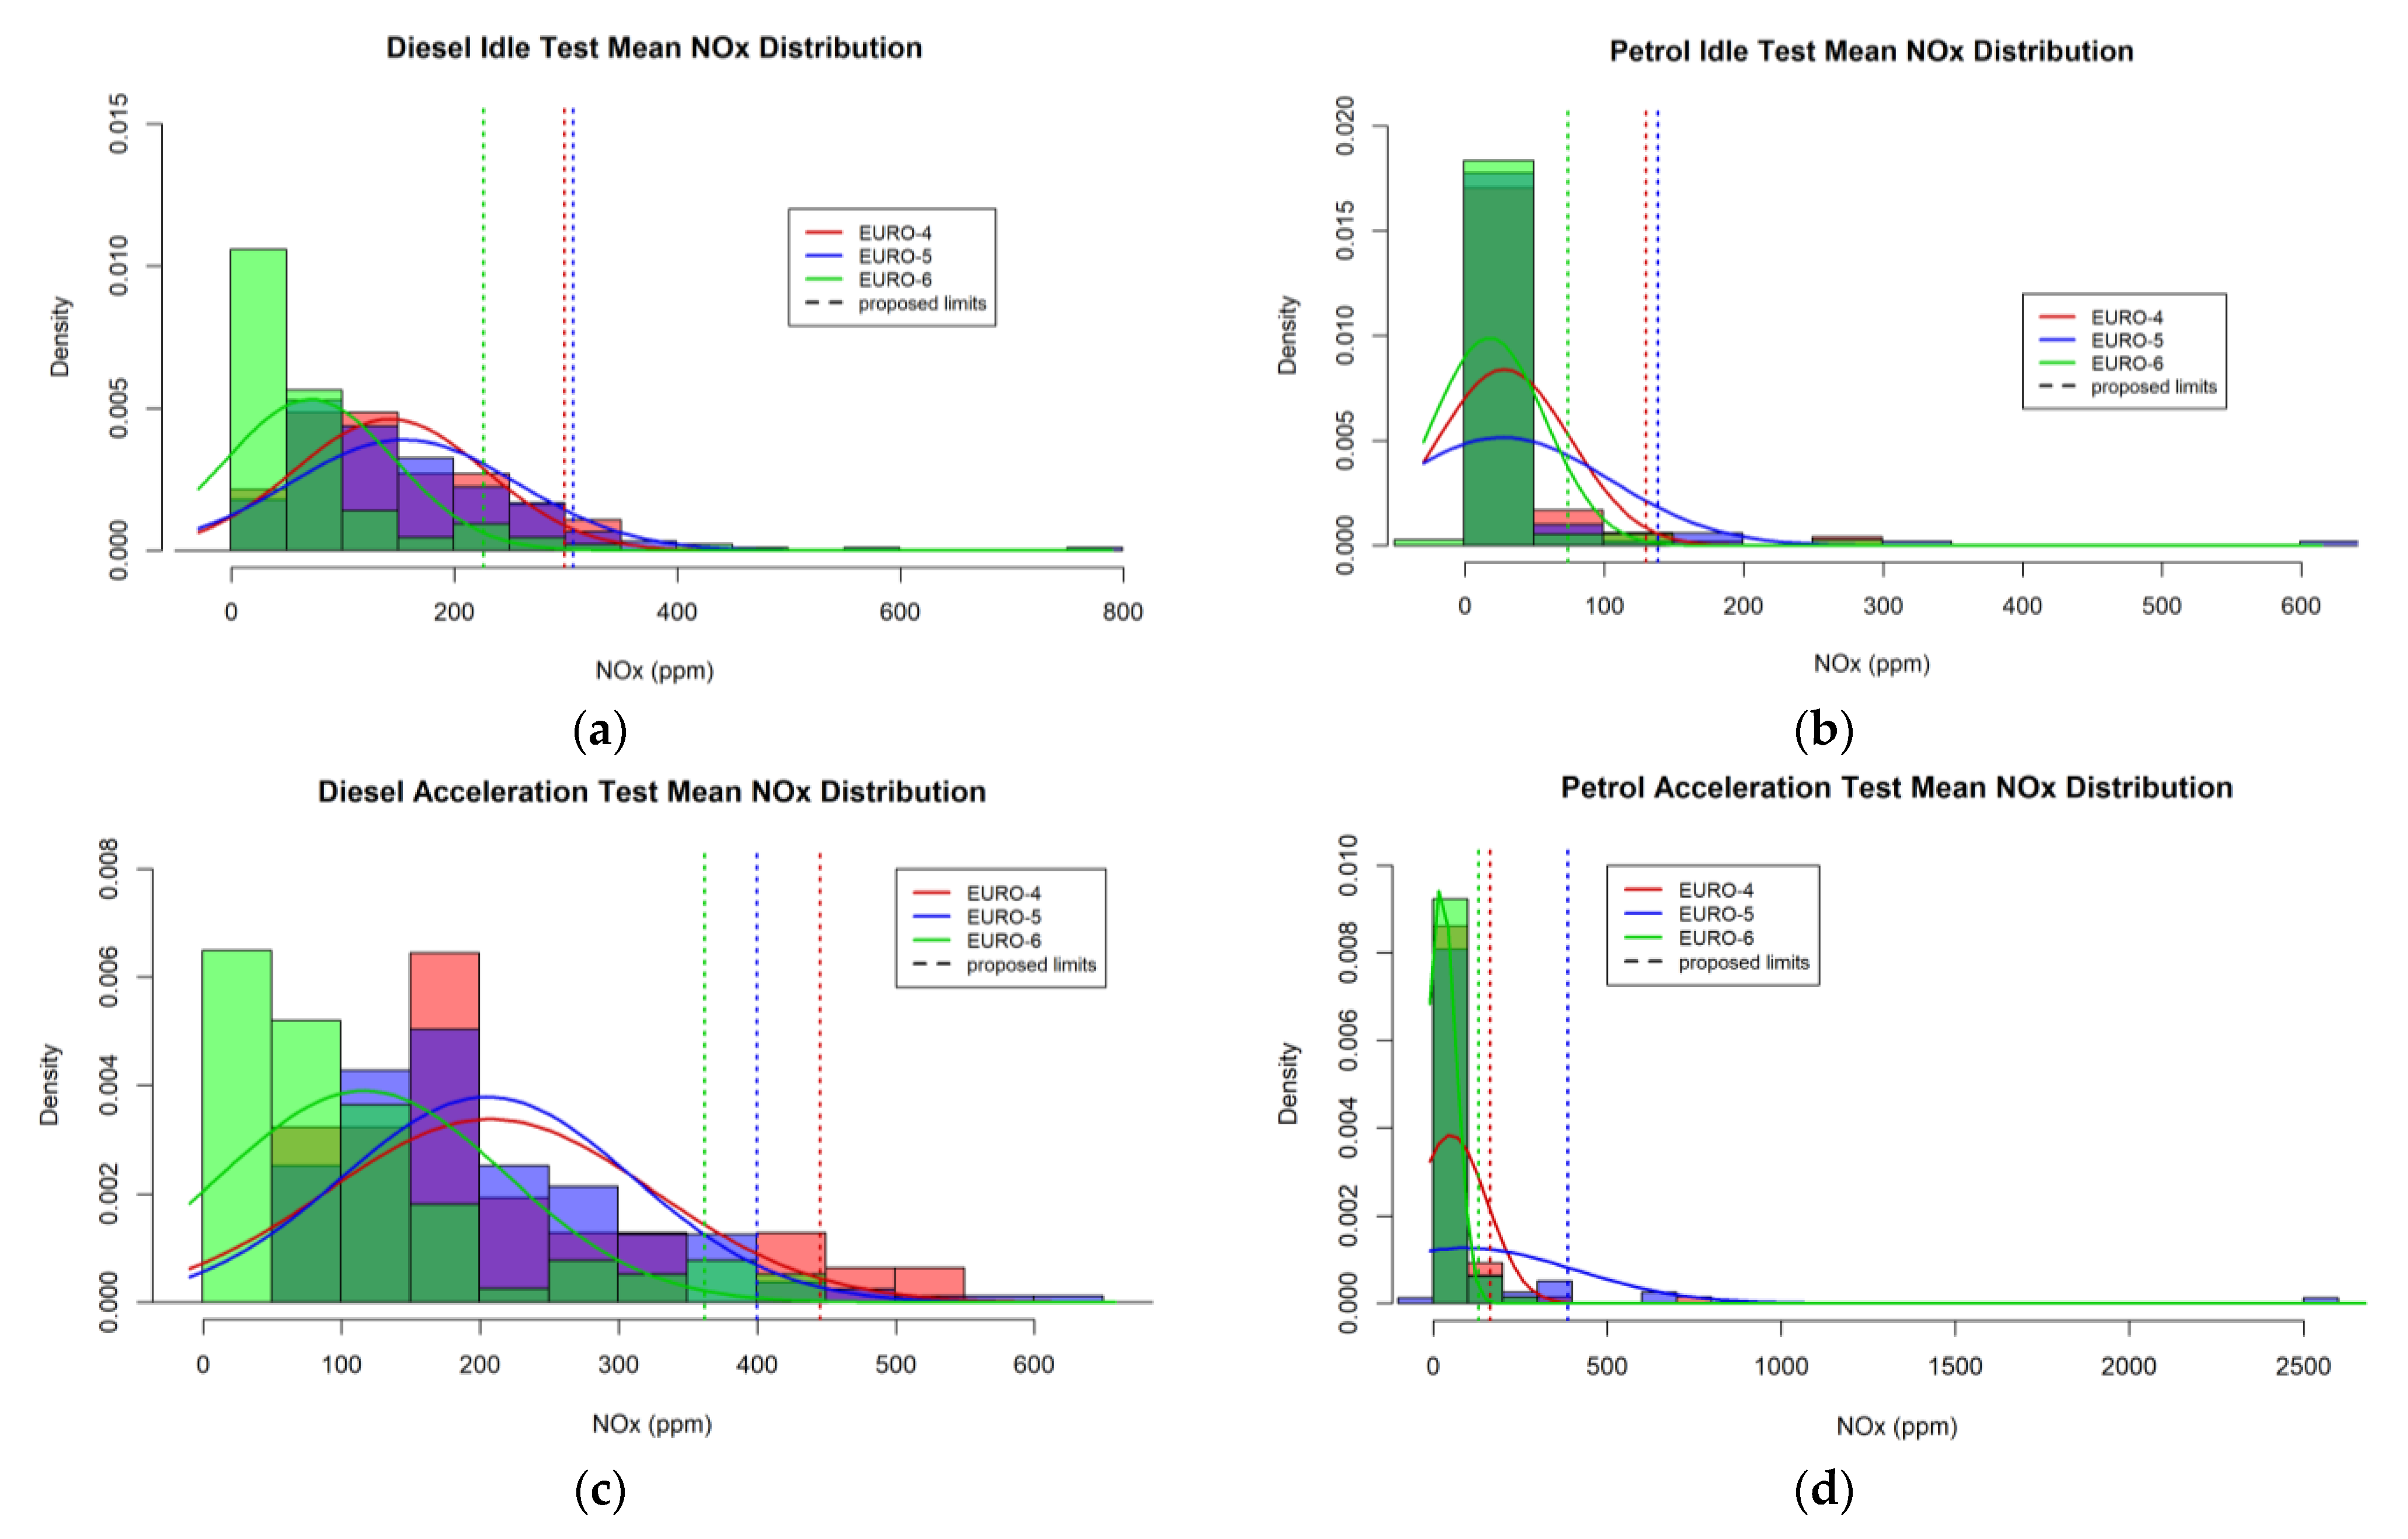
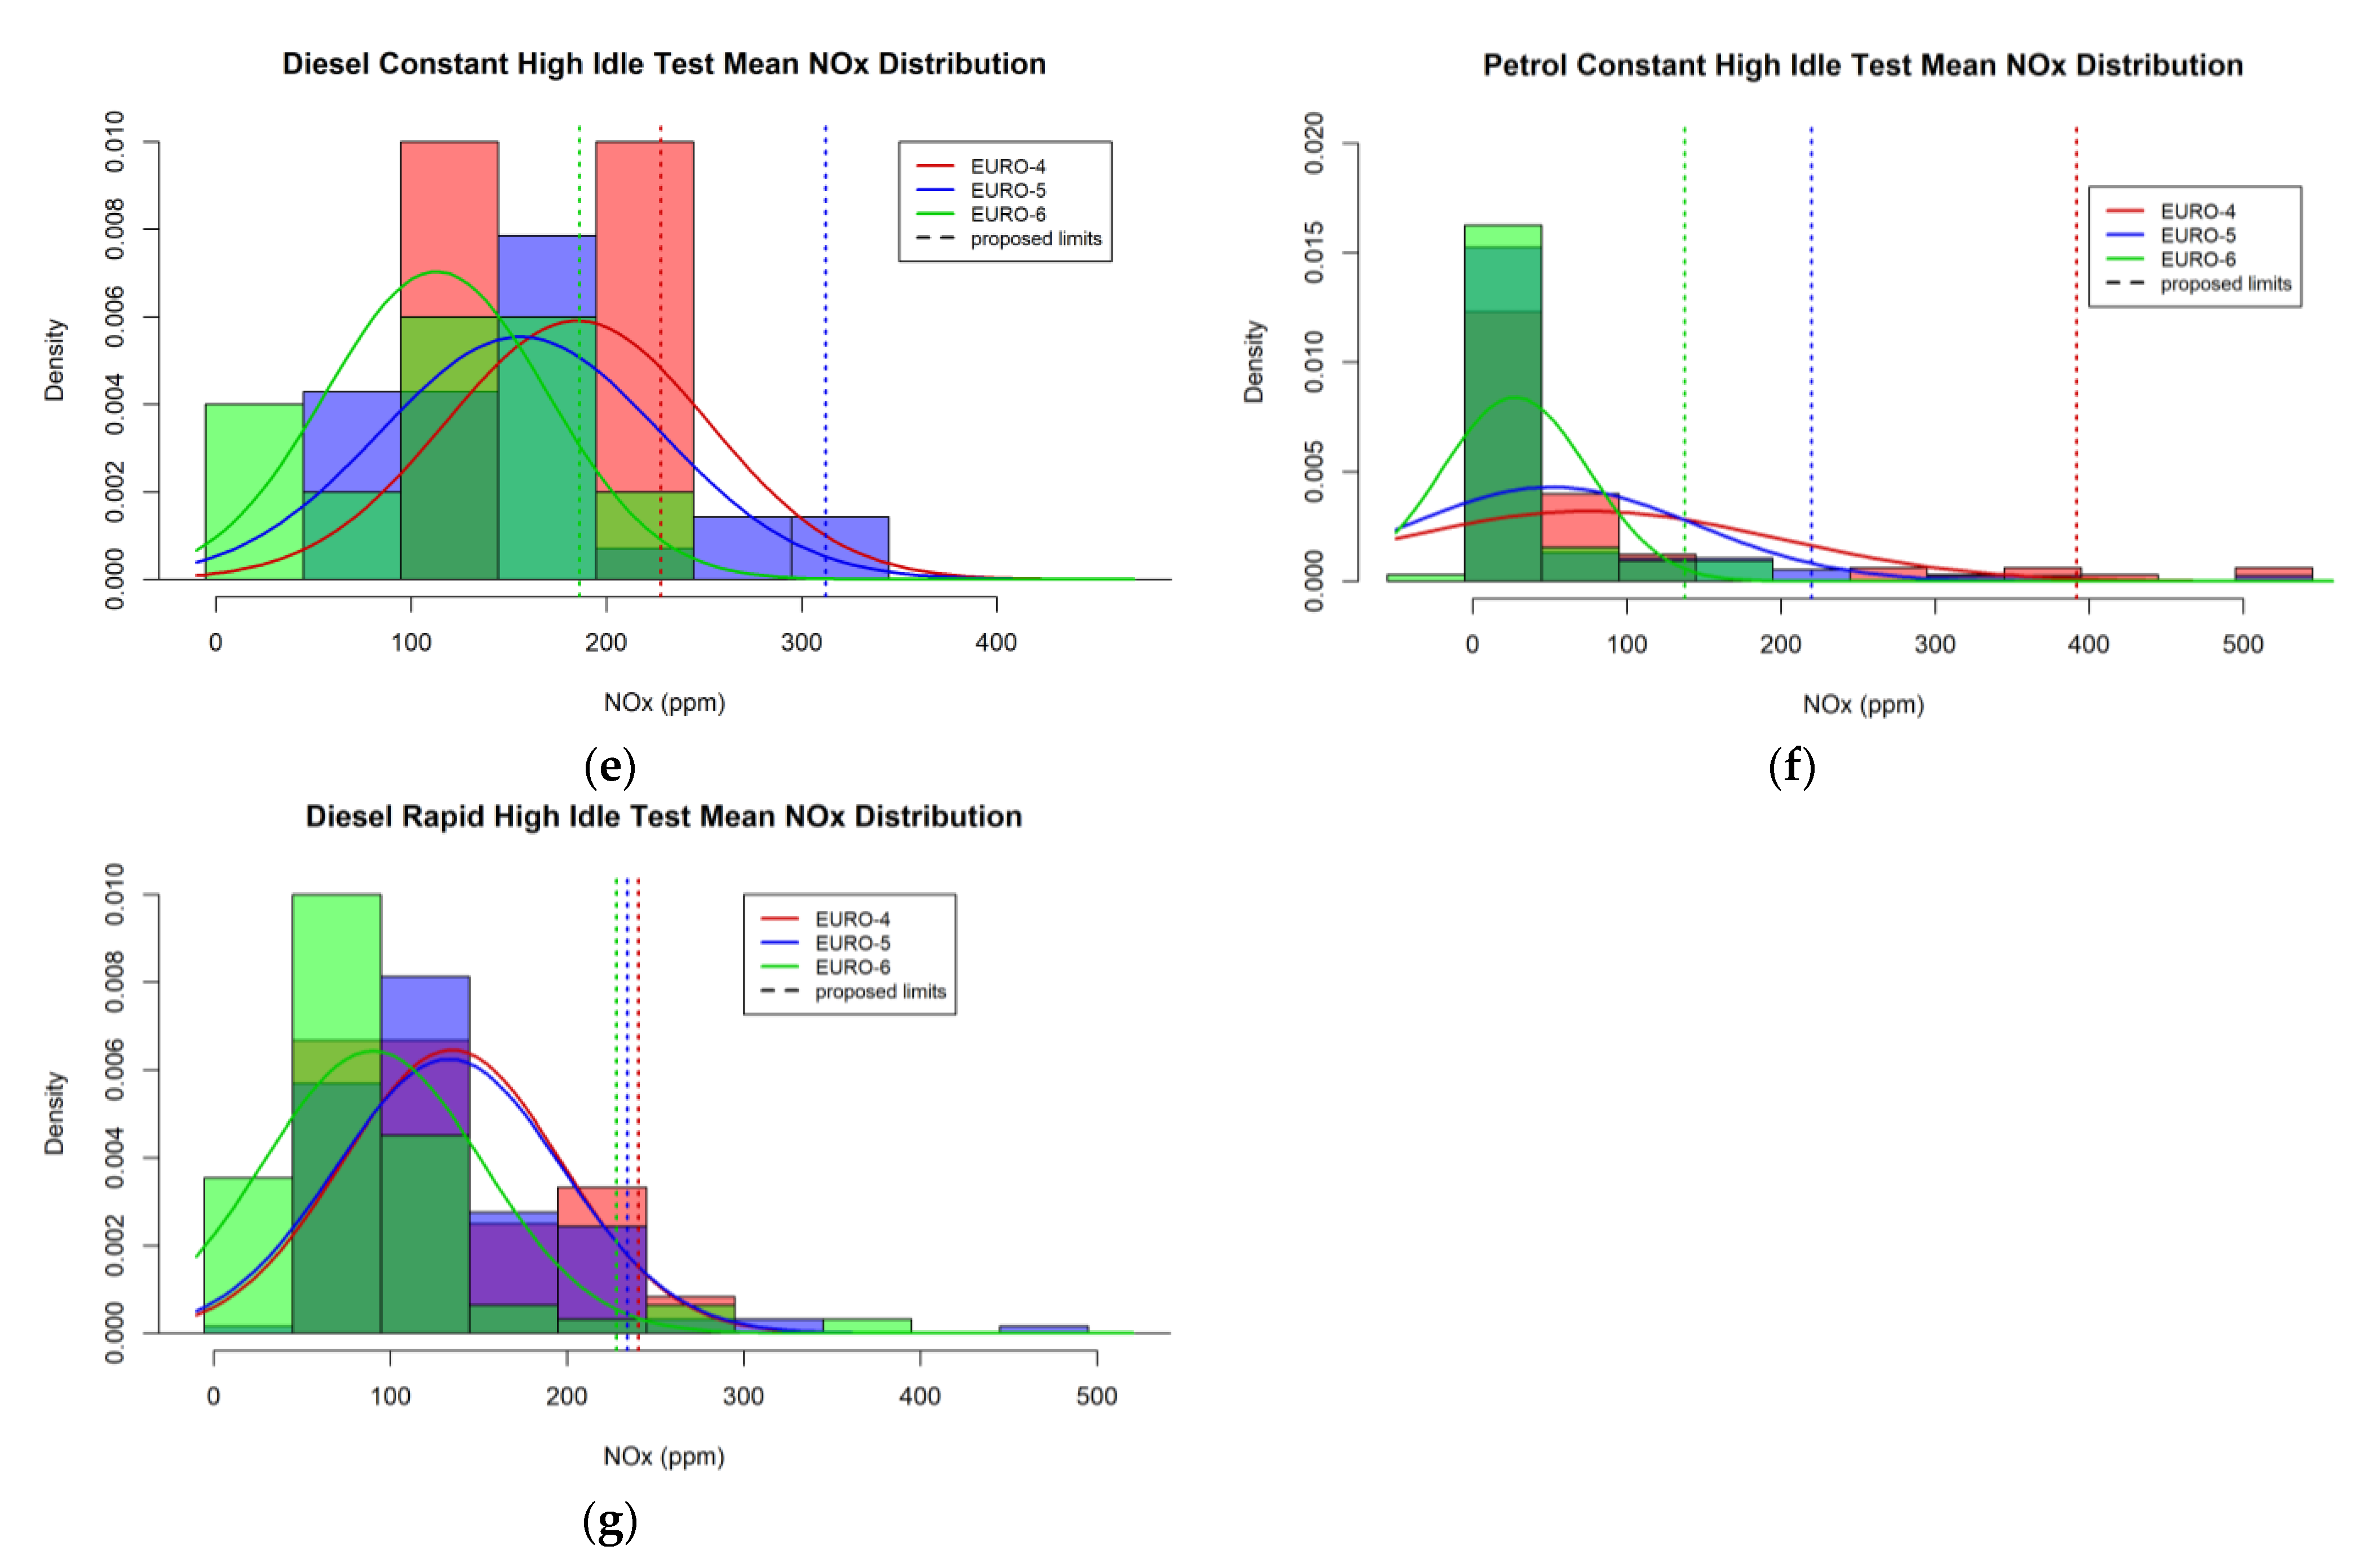
3.3. Fleet-Average Results and Options for Pass/Fail Thresholds

As outlined in the introduction, the authors found no literature to date suggesting NOx pass/fail threshold values for vehicles incorporating a NOx test into the EU PTI procedures. Some research and position papers have, however, suggested defining the threshold based on a statistical methodology. The very large number of vehicles that were tested in the research presented currently allows this to be performed. So, in this section, Table 3 presents the fleet-average NOx concentration results and a range of possible pass/fail threshold values, based on different statistical thresholds from the data for the various test types. These are separated by fuel type and Euro standard. Only Euro standards 4–6 were deemed of a statistically significant sample number to calculate results from.
If 5% of vehicles are to fail the PTI test as suggested by Fernández et al. [8], then on a rapid high idle test of the type described in the current work, diesel Euro 4, 5, and 6 vehicles can have NOx concentration thresholds of 240 ppm, 234 ppm, and 228 ppm, respectively. Diesel Euro 4, 5, and 6 vehicles on a constant engine speed (CO PTI style) high idle test can have NOx concentration thresholds of 228 ppm, 312 ppm, and 186 ppm, respectively, while petrol Euro 4, 5, and 6 vehicles on this test type can have NOx concentration thresholds of 392 ppm, 220 ppm, and 138 ppm, respectively. On an acceleration test of the dynamic properties described above, diesel Euro 4, 5, and 6 vehicles can have NOx concentration thresholds of 445 ppm, 400 ppm, and 362 ppm, respectively, while petrol Euro 4, 5, and 6 vehicles can have NOx thresholds of 163 ppm, 387 ppm, and 132 ppm, respectively.
Considering the tests employed in the current study, if all vehicles are working properly, one may expect an approximately gaussian (normal) distribution about the mean value within the sample of tested vehicles. However, if there are high emitters, these would be expected to fall outside the normal distribution at higher concentration values. It is therefore useful to view the proposed thresholds on the distribution of results for each test type, to see if they are capturing these results outside of the normal distribution without capturing too great-a fraction of the normal distribution. Figure 6 displays histograms of the diesel and petrol vehicle distributions on all three test types. Each figure is divided into Euro 4, Euro 5, and Euro 6 vehicles, with curves indicating the normal distribution of each sample, and vertical dashed lines marking the 95th percentile pass/fail thresholds.
Looking at the histograms, we see some of the high NOx emitter results sitting at values outside the normal distribution. Where this is the case, the thresholds tend to capture these while excluding the majority of the normal distribution that occurs at lower concentration values. However, when this is not the case, such as the diesel vehicle acceleration and constant high idle test results, the threshold eliminates a larger proportion of the normal distribution, which may mean that some vehicles can be incorrectly penalised by these thresholds. We recognise that the normal distribution is not the best fit for all cases and for some the log-normal might be better, but we chose to use only one fit across various test types and fuels. Further, while some cases can possibly end up as bi-modal with second mode as the pass/fail threshold, there was not enough evidence in this dataset to support that approach across all cases.

3.4. Agreement between Pass/Fail Results for Individual Vehicles

It is useful to know whether a vehicle that fails on one test type is also likely to fail on another test type. Table 4 compares the percentage of agreement between test pass/fail results using the previously defined pass/fail thresholds as calculated in Section 3.3. The top section looks at overall agreement (i.e., if a vehicle passes on one test type, it passes on the other, or if it fails on one test type, it fails on the other), while the bottom section only considers the agreement in fail result (i.e., if a vehicle fails on one test type, it fails on the other test type). This analysis was performed for all vehicles, and separately for diesel and petrol vehicles.
The agreement between test types is poor; a fail on one test type is not well-correlated to a fail on another test type. Assuming that the dynamic acceleration test type is the most adequate to identify high emitters on the road, this indicates that an idle or high idle test may not be a representative enough test to identify high emitters. The percentage agreement between test types is greater for diesel vehicles than petrol vehicles, indicating that high-emitting diesel vehicles have a greater chance of being detected by the simpler unloaded test types than petrol vehicles. The strongest agreement to acceleration test results for diesel vehicles is with the idle test type, while for petrol vehicles the strongest agreement to the acceleration test is with the high idle test type. Part of the reason for this low agreement is the high threshold for pass/fail that is being used. If the lower threshold for pass/fail of one standard deviation is used instead of the 95th percentile for the unloaded tests, then they have success rates at identifying high emitters on the acceleration test (using 95th percentile threshold) of 92% and 91.3% for diesel idle and high idle tests, respectively, and 80% and 84% for petrol idle and high idle tests, respectively.

4. Discussion

This paper explored different options for the incorporation of a NOx emission measurement element into the EU PTI test procedures. Three main different test types were investigated to this end: a low idle test, a high idle test (of two forms: one constant high idle hold such as is currently used for PTI CO emissions testing, for some diesel and all petrol vehicles; one a rapid high idle free acceleration snap up to a high rpm value such as is currently used for PTI smoke opacity testing, for some diesel vehicles), and a dynamic acceleration test. The SET II project [10] stated that more investigation is required into the application of measurement sensors such as miniPEMS for use in enhanced PTI testing. In the current work, a miniPEMS was successfully used on a very large scale; testing was performed for over a year on over 600 vehicles in a real, in-use PTI test centre. This is a good indication that it would be possible to employ miniPEMS for enhanced PTI testing in European PTI test centres.
The authors wanted to investigate options for a combined methodology to check the NOx emissions at PTI, measuring the emission concentrations on all three test types to determine if a vehicle shall pass or fail the PTI test for NOx. To save test time and expense, the authors wanted to see if this could be performed sequentially, starting with the idle test as it is the simplest test type (and is already performed for petrol vehicles as part of their CO emissions check, and already performed/soon to be performed for some diesel vehicles as part of a PN emissions check). If the vehicle emissions exceed a pre-determined threshold, then the vehicle could proceed to the high idle test type (which again is already performed for petrol vehicles as part of their CO emissions check and for diesel vehicles the rapid (free acceleration) high idle test is already performed as a smoke opacity check). If the vehicle fails this high idle check, it can proceed to the dynamic acceleration test type to check for high NOx emissions. One factor that should be considered when designing the NOx PTI test is the increasing prevalence of engine speed rev limiters on diesel vehicles, rendering the rapid high idle test type more difficult to perform on newer vehicles. Further research should be conducted into the real impacts of such testing on engines, and then only if it is deemed dangerous to the engine should regulations allow vehicle manufacturers to place rev limiting restrictions on their vehicles.
In Section 3.1 the repeatability of the tests was investigated through the calculation of relevant statistical parameters for various test properties. The load and engine speed of the idle and high idle tests have coefficients of variation (R2) of up to a few percent, while the acceleration test has coefficients of variation around 10%. A 10% coefficient of variation is generally considered acceptable. The idle test and high idle test NOx emission concentrations had around 20% coefficients of variation, while the acceleration test had 33%. This increase in variation from the acceleration test is not surprising, given the dynamic nature of this test type. The variability of the mass emissions is always slightly higher than that of the concentration values, which is unsurprising given that the calculation of mass adds an extra variable (mass air flow) into the list of influencing factors. The variation is considered acceptable for the application of PTI testing. Comparing against the same statistical parameters presented by Fernández et al. [8] for NOx concentration and engine load from their test data, the variability of the tests appears comparable, with similar values where it is appropriate to directly compare tests. Fernández et al. [8] deemed the variability of these values to be acceptable. The SET II project [10] suggested that a combination of a loaded ASM 2050 dynamometer test with an unloaded test for EGR is a thorough approach, while a short test drive was a promising alternative to the dynamometer test. The findings of this section indicate that a short test drive can indeed be used with high enough repeatability to be a viable alternative to dynamometer testing. The current work also shows how it can be integrated with an unloaded test to enable the capture of a greater number of high emitters.
An important point to check when considering the incorporation of a NOx test into the PTI procedures is whether the use of concentration values can meaningfully signify the mass emission on a vehicle test. This is particularly true where the action of EGR may alter the measured concentrations and for transient types of testing where the mass air flow rate can change dramatically. Another question for transient types of testing is whether it is more accurate to use mean values or maximum values of NOx concentration as the reporting metric, and so in Section 3.2.1, both of these metrics were compared against the total mass emissions for both the high idle test sections and the acceleration test section. The mean value was already deemed the most applicable to the idle test. For the diesel vehicle tests, the coefficient of determination (R2 value) between the NOx concentration and the mass emissions was between 0.8 and 0.9. When using the mean value as the metric, these were between 0.87 and 0.89 for all tests. For the petrol vehicles, the coefficient of determination between the mean NOx concentration and the mass emissions was between 0.93 and 0.97, while the coefficient of determination between the maximum NOx concentration and the mass emissions on the high idle and acceleration tests was between 0.86 and 0.87. The agreement for both petrol and diesel vehicles was greatest for the idle test. Diesel vehicles had better agreement on the acceleration test than the high idle test, while petrol vehicles had equal agreement on both test types. This is explained by the fact that the idle test is steady state, so is not affected by instrument response times and time alignment. Of the transient tests, the rapid high idle test is the one that would be most affected by these factors. It should be noted and considered that this only indicates how well the concentration values represent the mass emissions for that test type, and not how accurately a certain test type represents the mass emissions of a vehicle in the real world more generally.
So, based on the results of the previous paragraph, the decision was taken that the use of mean concentration values provided a more accurate portrait of the vehicle emissions on the tests. However, the downside to the use of mean values on the high idle and acceleration tests is that it requires isolation of the test section, which in turn requires engine speed and vehicle speed data as outlined in Section 2.1. Though the equipment at PTI centres generally records engine speed data, it was deemed prudent to ascertain whether, if this method was not readily possible, the maximum values can instead be used, requiring a lower level of data processing. Section 3.2.2. investigates this by comparing the maximum concentrations against the mean concentrations for each test and fuel type combination. The coefficients of correlation are between 0.94 and 0.96 for all diesel vehicles, and between 0.80 and 0.86 for all petrol vehicles. This indicates that the maximum value can instead be used if required, though less reliably for petrol vehicles than diesel vehicles. The correlation equations were also presented and can be used to infer how the pass/fail thresholds would need to be altered if the reporting metric was changed in this manner.
For the above proposed method of measuring NOx on an idle, high idle, and acceleration test sequentially and only proceeding to the next test type if high emissions are found on the previous test type, there would need to be a high level of correlation between high emitters on one test type and another test type. To investigate this, Section 3.2.3 directly compares the mean concentrations between test types for each vehicle tested. The results show generally strong correlations between test types for diesel vehicles (coefficients of correlation above 0.9 for all test type combinations except for free acceleration style high idle test versus acceleration test, which had an R2 value of 0.87). The petrol vehicles, however, had poor coefficients of correlation, being lower than 0.31 for all test type combinations. Therefore, petrol vehicles may require measurement of NOx emissions on all three tests as standard, rather than using a sequential method as appears to be possible for diesel vehicles.
Section 3.3. summarises the mean emission concentrations for both diesel and petrol vehicles of Euro standards 4–6 for each test type. The first and second standard deviations of the distributions from these mean values are also presented, as well as the 95th percentile. The 95th percentile of each Euro standard–fuel–test type combination was then selected as the NOx PTI pass/fail threshold for that vehicle-test type as suggested by Fernández et al. [8]. If 5% of vehicles are to fail the PTI test, then on a high idle test of the type described in the current work, diesel Euro 4, 5, and 6 vehicles on a free acceleration style high idle test can have NOx concentration thresholds of 240 ppm, 234 ppm, and 228 ppm, respectively. Diesel Euro 4, 5, and 6 vehicles on a constant engine speed (i.e., the CO PTI style) high idle test can have NOx concentration thresholds of 228 ppm, 312 ppm, and 186 ppm, respectively, while petrol Euro 4, 5, and 6 vehicles on this test type can have NOx concentration thresholds of 392 ppm, 220 ppm, and 138 ppm, respectively. On an acceleration test of the dynamic properties described above, diesel Euro 4, 5, and 6 vehicles can have NOx concentration thresholds of 445 ppm, 400 ppm, and 362 ppm, respectively, while petrol Euro 4, 5, and 6 vehicles can have NOx thresholds of 163 ppm, 387 ppm, and 132 ppm, respectively. As expected, we see that the thresholds for Euro 6 are lower than Euro 4 and 5. Euro 5 and 6 have mixed relative positions depending on the test type, an indication of the issues with Euro 5 vehicles not fulfilling the emissions performance aspirations of the type approval standards partly due to the Dieselgate scandal. The large differences between thresholds for various fuel type and Euro standards calculated from these data indicate that the suggestion to perform the analysis for individual fuel types and Euro standards in the SET II project final report [10] and López et al. [25] was appropriate, and leads to more suitable thresholds for the different vehicle types.
The distributions of the results, along with the 95th percentile thresholds, were then plotted as histograms. Some of the vehicle results are sitting at values outside the normal distribution, as one would expect for high emitters. Where this is the case, the thresholds tend to capture these while excluding the majority of the normal distribution that occurs at lower concentration values. However, when this is not the case, the threshold eliminates a larger proportion of the normal distribution, which may mean that some vehicles can be incorrectly penalised by these thresholds. It is therefore important to attain an even larger database of tested vehicles, which incorporates a greater number of high emitters, before the final thresholds to be used at PTI are calculated. The 5% fail rate suggested by Fernández et al. [8] does, however, appear to be appropriate from the data collected in the current study.
Section 3.4 brings together the findings of Section 3.2 and Section 3.3 to assess the agreement between individual test types using the 95th percentile thresholds calculated from the data. The percentage agreement between pass/fail results from each test type combination for individual vehicles is calculated. The agreement between test types is relatively poor generally; a fail on one test type is not always well-correlated to a fail on another test type with these thresholds. Assuming that the acceleration test type is the most adequate to identify high emitters on the road, this indicates that an idle or high idle test with 95th percentile threshold may not be a representative enough test to identify high emitters, meaning the loaded test is able to identify high emitters missed by the unloaded test types. This is in agreement with the general consensus in the literature (e.g., [7,8,10]). The percentage agreement between test types is greater for diesel vehicles than petrol vehicles, indicating that high-emitting diesel vehicles have a greater chance of being detected by the simpler unloaded test types than petrol vehicles. This is in agreement with the findings of Section 3.2.3. The strongest agreement to acceleration test results for diesel vehicles is with the idle test type, while for petrol vehicles the strongest agreement to the acceleration test is with the high idle test type. This indicates that if one of the simpler test types to the acceleration test is chosen for diesel vehicles, this should be an idle test, whereas for petrol vehicles this should be a high idle test (though particularly for petrol vehicles, this is not advised). The findings of Section 3.2.3. do, however, indicate that there is potential to increase this agreement if a lower pass/fail threshold is used on the unloaded test types, which was shown to be the case when the threshold for pass/fail was lowered to be one standard deviation from the mean value of the fleet: the idle test type identified high emitters on the acceleration test at a 92% success rate for the diesel vehicles and the high idle test identified high emitters on the acceleration test at a 84% success rate for the petrol vehicles. In this way, these simpler tests can be used as preliminary scanning tools to identify potential high emitters for the more thorough dynamic acceleration testing.

5. Conclusions

This paper presented the results of over 600 vehicles performing a series of short tests to quantify NOx emissions. These tests were a low idle test, two types of high idle test (a constant high idle 2500 rpm hold such as is currently used for petrol vehicle PTI CO testing, and a rapid high idle free acceleration style such as is currently used for diesel vehicle smoke opacity testing), and a driving dynamic acceleration test. To the best of the authors’ knowledge, this is the largest trial involving static and real-world driving tests performed on a random sample of vehicles arriving at a PTI station that has been conducted thus far in the quest for integration of NOx into PTI procedures. The findings of this work show that these multiple test methods have the potential to characterize NOx emissions from a vehicle, with the use of NOx concentration values on the different test types being a good representation of the mass emissions on those tests. The repeatability of all three test types is good, with sufficiently low coefficients of variation in the NOx emissions and relevant vehicle and engine characteristics from repeated testing. Where either is applicable, the mean concentration values are generally more representative than the maximum concentration values. In order to catch high emitters on the road from a PTI test, however, the unloaded idle and high idle test types are not suitable substitutes for a dynamic acceleration test, particularly for petrol vehicles. This is demonstrated by the poor agreement between the test types. The mean results across the tested fleet are presented and used to define pass/fail thresholds for different vehicle types for the first time in the literature. If all three test types are performed on each vehicle, then a 95th percentile threshold seems to be appropriate to catch high emitters, while if a simpler test type with lower thresholds is to be used as a preliminary scanning method, then it appears that either an idle or high idle test with a lower pass/fail threshold can be used for diesel vehicles with over 90% success, while for petrol vehicles the high idle test can be used with 84% success.
There is further work that can be performed to expand on the findings presented in this paper. In order to infer more robust thresholds, an even wider dataset is required, particularly one that includes a greater number of faulty or manipulated vehicles constituting the high emitters. Additionally, the repeatability work should be broadened to include multiple different vehicle operators, as this is a source of variability at PTI that was not replicated in the trial. More work is also required to investigate the possible impact of vehicle conditioning and ambient weather conditions on vehicle emission results. Finally, using the extra dynamic acceleration test sections, a deeper analysis into dynamic properties and the impacts on measured emissions can be performed.

Author Contributions

Conceptualization, G.S.S., T.N. and D.T.; methodology, G.S.S., D.T. and S.B.; software, D.T. and G.S.S.; validation, D.T.; formal analysis, D.T.; investigation, S.B.; resources, G.S.S. and T.N.; data curation, D.T.; writing—original draft preparation, D.T.; writing—review and editing, G.S.S.; visualization, D.T.; supervision, G.S.S.; project administration, D.T. All authors have read and agreed to the published version of the manuscript.

Funding

This research received no external funding.

Institutional Review Board Statement

Not applicable.

Informed Consent Statement

Not applicable.

Data Availability Statement

The data presented in this study may be available on request from the corresponding author, depending on intended use. Meta data for each tested vehicle and their 1 Hz time-series charts for tailpipe emissions and ECU data are available at https://3datx.com/ptipilot/ (accessed on 30 December 2022).

Conflicts of Interest

The authors declare no conflict of interest.

References

  1. Boulter, P.; Buekenhoudt, P.; Nolte, C.; Ost, T.; Schulz, W.H.; Weitz, K.-U.; Afflerbach, G.; Förster, C.; Stricker, P.; Mäurer, H.-J.; et al. CITA TEDDIE A New Roadworthiness Emission Test for Diesel Vehicles Involving NO, NO 2 and PM Measurements; CITA: Brussels, Belgium, 2011; pp. 1–105. Available online: https://citainsp.org/studies/4274-2/ (accessed on 11 February 2021).
  2. Committee on the Medical Effects of Air Pollutants (COMEAP). Statement on the Evidence for the Effects of Nitrogen Dioxide on Health; Public Health England: London, UK, 2015; pp. 1–10. Available online: https://assets.publishing.service.gov.uk/government/uploads/system/uploads/attachment_data/file/411756/COMEAP_The_evidence_for_the_effects_of_nitrogen_dioxide.pdf (accessed on 16 January 2023).
  3. Finlayson-Pitts, B.J.; Pitts, J.N. Atmospheric Chemistry of Tropospheric Ozone Formation: Scientific and Regulatory Implications. Air Waste 1993, 43, 1091–1100. [Google Scholar] [CrossRef]
  4. Jonson, J.E.; Borken-Kleefeld, J.; Simpson, D.; Nyíri, A.; Posch, M.; Heyes, C. Impact of Excess NOx Emissions from Diesel Cars on Air Quality, Public Health and Eutrophication in Europe. Environ. Res. Lett. 2017, 12, 094017. [Google Scholar] [CrossRef] [Green Version]
  5. Zeldovich, J.B. Oxidation of Nitrogen in Combustion and Explosion. Comptes Rendus–Académie Sci. URSS 1946, 51, 217–220. [Google Scholar]
  6. Heywood, J.B. Internal Combustion Engine Fundamentals, 1st ed.; McGraw-Hill Mechanical Engineering Series; McGraw-Hill: New York, NY, USA, 1988; ISBN 0-07-028637-X. [Google Scholar]
  7. CITA. Monitoring of NOx Emissions as Part of the PTI; International Motor Vehicle Inspection Committee (CITA): Brussels, Belgium, 2022; pp. 1–51. Available online: https://citainsp.org/2022/05/11/monitoring-of-nox-emissions-as-part-of-the-pti/ (accessed on 11 May 2022).
  8. Fernández, E.; Valero, A.; Alba, J.J.; Ortego, A. A New Approach for Static NOx Measurement in PTI. Sustainability 2021, 13, 13424. [Google Scholar] [CrossRef]
  9. Hooftman, N.; Messagie, M.; Van Mierlo, J.; Coosemans, T. A Review of the European Passenger Car Regulations—Real Driving Emissions vs Local Air Quality. Renew. Sustain. Energy Rev. 2018, 86, 1–21. [Google Scholar] [CrossRef]
  10. Buekenhoudt, P.; Müller, G.; Mäurer, H.-J.; González, A.S.; Stephenson, J.; Multari, A.; Pettelet, G.; Schulz, W.H. SET II Project—Sustainable Emission Test for Diesel Vehicles Involving NOx Measurements; International Motor Vehicle Inspection Committee (CITA): Brussels, Belgium, 2019; pp. 1–87. Available online: https://citainsp.org/2019/04/01/the-new-cita-set-ii-project/ (accessed on 16 July 2022).
  11. Posada, F.; Yang, Z.; Muncrief, R. Review of Current Practices and New Developments in Heavy-Duty Vehicle Inspection and Maintenance Programs; The International Council on Clean Transportation (ICCT): Washington, DC, USA, 2015; pp. 1–51. Available online: http://www.theicct.org/sites/default/files/publications/HDV%20insp-maint%20White%20Paper%20v2.pdf (accessed on 30 December 2022).
  12. Jereb, S.; Henderson, K.; Vrabic, J.; Bain, M.; Dolezal, J.; Roessing, E.; Dos Santos, J.N.C.; Simeonova, R.; Otto, J. The EU’s Response to the “Dieselgate” Scandal; European Court of Auditors: Luxembourg, 2019; Available online: https://www.eca.europa.eu/lists/ecadocuments/brp_vehicle_emissions/brp_vehicle_emissions_en.pdf (accessed on 3 March 2023).
  13. Sher, E. Handbook of Air Pollution from Internal Combustion Engines: Pollutant Formation and Control; Academic Press: Boston, MA, USA, 1998; ISBN 978-0-12-639855-7. [Google Scholar]
  14. Sanchez, F.P.; Bandivadekar, A.; German, J. Estimated Cost of Emission Reduction Technologies for Light-Duty Vehicles; The International Council on Clean Transportation (ICCT): Washington, DC, USA, 2012; Available online: https://theicct.org/wp-content/uploads/2021/06/ICCT_LDVcostsreport_2012.pdf (accessed on 1 March 2023).
  15. Majewski, W.A. NOx Adsorber Applications. Available online: https://dieselnet.com/tech/cat_nox-trap_applications.php (accessed on 1 March 2023).
  16. Morimune, T.; Yamaguchi, H.; Yasukawa, Y. Study of Catalytic Reduction of NOx in Exhaust Gas from a Diesel Engine. Exp. Therm. Fluid Sci. 1998, 18, 220–230. [Google Scholar] [CrossRef]
  17. Johnson, T.V. Vehicular Emissions in Review. SAE Int. J. Engines 2012, 5, 216–234. [Google Scholar] [CrossRef] [Green Version]
  18. Johannessen, T.; Schmidt, H.; Svagin, J.; Johansen, J.; Oechsle, J.; Bradley, R. Ammonia Storage and Delivery Systems for Automotive NOx Aftertreatment; SAE International: Warrendale, PA, USA, 2008; Available online: https://www.sae.org/publications/technical-papers/content/2008-01-1027/ (accessed on 1 March 2023).
  19. Ligterink, N.E.; Elstgeest, M.; Frateur, T.; de Ruiter, J.M.; Paschinger, P. Approaches for Detecting High NOx Emissions of Aged Petrol Cars during the Periodic Technical Inspection; TNO: The Hague, The Netherlands, 2022; pp. 1–19. Available online: http://resolver.tudelft.nl/uuid:b5d127c3-303c-4013-b1ac-c9ac01f66e2d (accessed on 8 December 2022).
  20. Kadijk, G.; Elstgeest, M.; Vroom, Q.; Paalvast, M.; Ligterink, N.; van der Mark, P. On Road Emissions of 38 Petrol Vehicles with High Mileages; TNO: The Hague, The Netherlands, 2020; pp. 1–88. Available online: https://publications.tno.nl/publication/34637926/q4zWim/TNO-2020-R11883.pdf (accessed on 16 January 2023).
  21. Chen, Y.; Borken-Kleefeld, J. NOx Emissions from Diesel Passenger Cars Worsen with Age. Environ. Sci. Technol. 2016, 50, 3327–3332. [Google Scholar] [CrossRef] [PubMed] [Green Version]
  22. Regulation (EU) 2018/858 of the European Parliament and of the Council of 30 May 2018 on the Approval and Market Surveillance of Motor Vehicles and Their Trailers, and of Systems, Components and Separate Technical Units Intended for Such Vehicles, Amending Regulations (EC) No 715/2007 and (EC) No 595/2009 and Repealing Directive 2007/46/EC (Text with EEA Relevance.). 2018. Available online: http://data.europa.eu/eli/reg/2018/858/oj/eng (accessed on 1 March 2023).
  23. Directive 2014/45/EU of the European Parliament and of the Council of 3 April 2014 on Periodic Roadworthiness Tests for Motor Vehicles and Their Trailers and Repealing Directive 2009/40/EC (Text with EEA Relevance). 2014. Available online: http://data.europa.eu/eli/dir/2014/45/oj/eng (accessed on 1 March 2023).
  24. European Commission. Commission Regulation (EU) 2017/1151 of 1 June 2017. 2017. Available online: http://data.europa.eu/eli/reg/2017/1151/oj/eng (accessed on 1 March 2023).
  25. López, V.D.; Sánchez, S.S.; Santamaria, E.O.; Cuadros, S.S. PTI Methodology for Inspection of NOx and Particle Matter Emissions; Universidad Carlos III de Madrid: Getafe, Spain, 2022; pp. 1–35. Available online: https://aeca-itv.com/wp-content/uploads/2022/06/PTI-METHODOLOGY-INSPECTION-NOx-AND-PARTICLE-vf-eng-GB_DocEjec.pdf (accessed on 4 August 2022).
  26. Fernández, E.; Ortego, A.; Valero, A.; Alba, J.J. Suitability Assessment of NOx Emissions Measurements with PTI Equipment. Vehicles 2022, 4, 917–941. [Google Scholar] [CrossRef]
  27. Yang, L. China’s Vehicle Emissions Inspection and Maintenance Program; The International Council on Clean Transportation (ICCT): Washington, DC, USA, 2020; Available online: https://theicct.org/wp-content/uploads/2021/06/China-IM-policy-update-dec2020.pdf (accessed on 4 January 2023).
  28. Barlow, T.; Müller, G.; Mäurer, H.-J.; Buekenhoudt, P.; Schulz, W.H.; Geis, I.; Multari, A.; Petelet, G.; Petelet, G. SET I—Final Report: Sustainable Emission Test; International Motor Vehicle Inspection Committee (CITA): Brussels, Belgium, 2015; p. 103. Available online: https://citainsp.org/studies/4259-2/ (accessed on 16 July 2020).
  29. Pucher, E.; Gruber, A. New Universal Short Test Procedure for NOx and Particle Number at Periodic Technical Inspection. Presented at the CITA Working Group 2, ÖAMTC, Vienna. 2019. Available online: http://hdl.handle.net/20.500.12708/95302 (accessed on 1 March 2023).
  30. Joint Research Centre. PTI–DeNOx Systems Monitoring. Presented at the CITA Task Force on Emissions on 1 February 2023, Web/Online Meeting. 2023. Available online: https://citainsp.org/ (accessed on 2 March 2023).
  31. Institut Teknologisk. Application of OBD Equipment for Inspection of Heavy Trucks; Institut Teknologisk: Ribe, Denmark, 2021; Available online: https://fstyr.dk/en/-/media/FSTYR-lister/Publikationer/Application-of-OBD-final.pdf (accessed on 16 January 2023).
  32. Buekenhoudt, P.; Meyer, P.D.; Emanuel, S.; Stevens, M.; Cornelis, E.; Bouazzaoui, Y.; Vanhout, S.; Vaneerdeweg, R. Ontwikkeling van een NOx-Emissietest Voor Gebruik Tijdens de Technische Voertuigkeuring; Vlaamse Milieumaatschappij: Aalst, Belgium, 2022; Available online: https://www.vmm.be/publicaties/ontwikkeling-van-een-nox-emissietest-voor-gebruik-tijdens-de-technische-voertuigkeuring (accessed on 31 January 2023).
  33. Norris, J. Low Emission Diesel Research. 2005. Available online: http://www.transportoffice.gov.uk/crt/repository/Low%20Emission%20Diesel%20Research.pdf (accessed on 16 February 2023).
  34. Janssen, J.A. Stationary_NOx_Measurements—A Way to Detect High NOx Emitting Vehicles. 2020. Available online: https://www.fstyr.dk/da/-/media/FSTYR-lister/Publikationer/200707_Stationary-NOxMeasurements—A-way-to-detect-high-NOx-emitting-vehicles_ROHA_FINAL.pdf (accessed on 16 February 2023).
  35. KNESTEL. Kick-Down-NOx Method for PTI NOx Measurement. TRACE-GAS. 2021. Available online: https://www.trace-gas.com/kick-down-nox-method-for-pti-nox-measurement-by-knestel/ (accessed on 25 March 2022).
  36. Lipp, S.; Blassnegger, J. New Procedure of NOx Emission Test (AU) in a Future Periodic Technical Inspection (PTI); FVT and ÖAMTC: Graz, Austria, 2021; Available online: https://graz.pure.elsevier.com/en/publications/new-procedure-of-nox-emission-test-au-in-a-future-periodic-techni (accessed on 1 March 2023).
  37. Yang, L.; Bernard, Y.; Dallmann, T. Technical Considerations for Choosing a Metric for Vehicle Remote-Sensing Regulations; The International Council on Clean Transportation (ICCT): Washington, DC, USA, 2019; Available online: https://theicct.org/publication/technical-considerations-for-choosing-a-metric-for-vehicle-remote-sensing-regulations/ (accessed on 23 February 2023).
  38. 3DATX Corp ParSYNC® PLUS. Available online: https://3datx.com/parsync/ (accessed on 31 January 2023).
  39. Sandhu, G.S.; Frey, H.C. Effects of Errors on Vehicle Emission Rates from Portable Emissions Measurement Systems. Transp. Res. Rec. 2013, 2340, 10–19. [Google Scholar] [CrossRef]
Figure 1. Fleet characteristics: (a) pie chart of vehicle emission standards (24 vehicles had pre-Euro or unknown Euro standard so are not represented here); (b) histogram of fleet model ages; (c) histogram of fleet odometer readings.
Atmosphere 14 00536 g001
Figure 2. Diesel vehicle mean and maximum NOx concentration vs. total mass emissions over each test section: (a) idle test mean NOx; (b) constant high idle test mean NOx; (c) rapid high idle test mean NOx; (d) acceleration test mean NOx; (e) constant high idle test maximum NOx; (f) rapid high idle test maximum NOx; (g) acceleration test maximum NOx.
Atmosphere 14 00536 g002
Figure 3. Petrol vehicle mean and maximum NOx concentration vs. total mass emissions over each test section: (a) idle test mean NOx; (b) high idle test mean NOx; (c) acceleration test mean NOx; (d) high idle test maximum NOx; (e) acceleration test maximum NOx.
Atmosphere 14 00536 g003
Figure 4. Petrol and diesel maximum NOx concentration versus mean NOx concentration for high idle and acceleration test sections: (a) diesel vehicle rapid high idle test; (b) diesel vehicle constant high idle test; (c) diesel vehicle acceleration test; (d) petrol vehicle constant high idle test; (e) petrol vehicle acceleration test.
Atmosphere 14 00536 g004
Figure 5. Diesel and petrol vehicle NOx concentrations compared between test types: (a) diesel vehicle rapid high idle test mean NOx versus idle test mean NOx; (b) diesel vehicle rapid high idle test mean NOx versus acceleration test mean NOx; (c) diesel vehicle constant high idle test mean NOx versus idle test mean NOx; (d) diesel vehicle constant high idle test mean NOx versus acceleration test mean NOx; (e) diesel vehicle acceleration test mean NOx versus idle test mean NOx; (f) petrol vehicle constant high idle test mean NOx versus mean idle test NOx; (g) petrol vehicle constant high idle test mean NOx versus acceleration test mean NOx; (h) petrol vehicle acceleration test mean NOx versus idle test mean NOx.
Atmosphere 14 00536 g005
Figure 6. Diesel and petrol probability density distribution histograms for different test types, distributed into separate Euro standards (red bars—Euro 4, blue bars—Euro 5, green bars—Euro 6; colours are translucent to allow visualisation of all three Euro standards simultaneously), with 5% fail rate (i.e., 95th percentile) thresholds for each Euro standard marked by dashed lines: (a) diesel idle test; (b) petrol vehicle idle test; (c) diesel vehicle acceleration test; (d) petrol vehicle acceleration test; (e) diesel vehicle constant high idle test; (f) petrol vehicle constant high idle test; (g) diesel vehicle rapid high idle test.
Atmosphere 14 00536 g006aAtmosphere 14 00536 g006b
Table 1. Evolution of the enhanced PTI protocol over the course of the trial.
Vehicle ID RangeProtocol Version (Time Taken)IdleHigh IdleAcceleration
B0001–B0027
(27 vehicles)
V01 (15 min)3 consecutive
identical repetitions
-3 similar, consecutive short drives
B0028–B0105
(78 vehicles)
V02 (20 min)3 consecutive
identical repetitions
3 consecutive identical
repetitions
3 similar, consecutive short drives
B0106–B0376
(271 vehicles)
V03 1 (5 min)2 non-consecutive
identical repetitions
1, as per PTI requirements,
for diesel or petrol vehicles
3 non-similar, non-
consecutive short drives 2
B0377–B0592
(216 vehicles)
V04 1 (5 min)2 non-consecutive
identical repetitions
1, as per PTI requirements,
for diesel or petrol vehicles
3 non-similar, non-
consecutive short drives 2
B0593–B0607
(15 vehicles)
V05 1 (7 min)2 non-consecutive
identical repetitions
1, as per PTI requirements,
for diesel or petrol vehicles
3 non-similar, non-
consecutive short drives 2
1 For the purposes of this paper, Protocols V03, V04, and V05 can be considered identical, and of 5 min duration. 2 Only the acceleration test up to 30 km/h is discussed further in this paper.
Table 2. Summary of statistical parameters (and mean NOx value, for context) for different characteristics, from the tests that were performed in triplicate for each vehicle (Protocols V01 and V02).
TestQuantityMean ValueStd. DeviationStd. ErrorCoef. of Variation
IdleAverage NOx (ppm)75.2514.318.2918.65%
NOx (mg)118.9214.398.4125.70%
Average Engine RPM807.212.051.180.24%
Average Load (%)24.901.230.724.70%
Average Commanded EGR (%)18.753.261.9644.71%
Constant High IdleAverage NOx (ppm)81.8212.927.4621.04%
NOx (mg)107.3814.458.3525.67%
Average Engine RPM2331.6677.0144.493.30%
Average Load (%)19.391.160.676.42%
Average Commanded EGR (%)19.891.340.7734.32%
AccelerationAverage NOx (ppm)183.8143.5225.1433.30%
Maximum NOx (ppm)351.2590.8452.4731.16%
NOx (mg)139.0256.7032.7343.51%
Average Engine RPM1361.79123.2171.4410.76%
Maximum Engine RPM2066.35172.88100.749.62%
Average Load (%)32.204.152.4017.31%
Maximum Load (%)65.696.994.0412.36%
Average Commanded EGR (%)22.252.571.4823.44%
Maximum Commanded EGR (%)41.663.982.3012.40%
Average VSP_pos (kW/tonne)30.778.945.1728.73%
Maximum VSP_pos (kW/tonne)69.8516.999.8324.37%
vapos 95 (m2/s3)58.8015.569.0026.53%
RPA (m/s2)2.920.580.3420.32%
Abbreviations: RPM—revolutions per minute; EGR—exhaust gas recirculation; VSP—vehicle-specific power; vapos 95—95th percentile of the product of velocity and positive acceleration; RPA—relative positive acceleration.
Table 3. Fleet-average NOx results over each test, alongside the first and second standard deviations from the mean value, and the 95th percentile value. In keeping with the results presented in Section 3.2.1, the mean NOx concentration is the chosen metric for all test types.
Fuel TypeEmission StandardMetricIdle Test Mean NOx (ppm)Constant High Idle Test Mean NOx (ppm) 1Rapid High Idle Test Mean NOx (ppm) 2Acceleration Mean Test NOx (ppm)
DieselEuro 4Mean142185135207
1 Std. Deviation228253197326
2 Std. Deviation315320258444
95th Percentile298228240445
Euro 5Mean154156133205
1 Std. Deviation257228197311
2 Std. Deviation359300261416
95th Percentile306312234400
Euro 6Mean7111390116
1 Std. Deviation146170152218
2 Std. Deviation221227214321
95th Percentile226186228362
PetrolEuro 4Mean2775NA52
1 Std. Deviation74199NA155
2 Std. Deviation121324NA259
95th Percentile130392NA163
Euro 5Mean2649NA93
1 Std. Deviation103141NA406
2 Std. Deviation180232NA719
95th Percentile138220NA387
Euro 6Mean1724NA24
1 Std. Deviation5669NA66
2 Std. Deviation95115NA108
95th Percentile74138NA132
1 Mean NOx value calculated only for diesel vehicles on protocol V02, i.e., those performing a 5 s hold at 2500 rpm as their high idle test, along with all petrol vehicles. 2 Mean NOx value calculated only for diesel vehicles on protocols V03–V05, i.e., those performing the free acceleration smoke opacity test as their high idle test, and no petrol vehicles.
Table 4. Summary of the percentage of agreement between results from different test types for individual vehicles. Total number of vehicles from which the percentages are calculated are represented in brackets beside each. Top section is for all test results (agreement for passes and fails), whereas the bottom section is only for agreement between vehicle fail results (i.e., if a vehicle fails on one of the test types, the percentage likelihood of it failing on the other test type).
QuantityTest Type CombinationTotalDieselPetrol
Overall agreement (i.e., pass/pass or fail/fail) between results for different test type combinationsIdle and constant high idle92.7% (245)92.5% (40)92.7% (205)
Idle and rapid high idle95.7% (209)95.7% (209)NA (0)
Idle and acceleration94.7% (475)96.6% (267)92.3% (208)
Constant high idle and acceleration91.0% (245)85.0% (40)92.2% (205)
Rapid high idle and acceleration95.7% (209)95.7% (209)NA (0)
Agreement between fail results only (i.e., fail/fail) for different test type combinationsIdle and constant high idle33.3% (27)57.1% (7)25.0% (20)
Idle and rapid high idle40.0% (15)40.0% (15)NA (0)
Idle and acceleration35.9% (39)52.6% (19)20.0% (20)
Constant high idle and acceleration28.0% (25)33.3% (6)26.3% (19)
Rapid high idle and acceleration46.7% (15)46.7% (15)NA
Disclaimer/Publisher’s Note: The statements, opinions and data contained in all publications are solely those of the individual author(s) and contributor(s) and not of MDPI and/or the editor(s). MDPI and/or the editor(s) disclaim responsibility for any injury to people or property resulting from any ideas, methods, instructions or products referred to in the content.

