Article

City-Level CH4 Emissions from Anthropogenic Sources and Its Environmental Behaviors in China’s Cold Cities

1
State Key Laboratory of Urban Water Resource and Environment, School of Environment, Harbin Institute of Technology, Harbin 150090, China
2
Harbin Ecological and Environmental Monitoring Center, Harbin 150076, China
3
Meteorological Observation Center, China Meteorological Administration, Beijing 100081, China
4
Longfengshan Regional Background Station, China Meteorological Administration (CMA), Harbin 150200, China
*
Author to whom correspondence should be addressed.
Atmosphere 2023, 14(3), 535; https://doi.org/10.3390/atmos14030535
Submission received: 6 February 2023 / Revised: 24 February 2023 / Accepted: 8 March 2023 / Published: 10 March 2023

Abstract

:
Distinguished features of cities influence the characteristics of CH4 emissions. A city-level emission inventory represents the characteristics of CH4 on a smaller scale, according to the special factors in each city. A city-level emission inventory was established to reveal the characteristics and source profile of CH4 emissions in the coldest province, which is a typical provincial cold region in northeast China. The dominant sources were identified for targeted cities. Rice cultivation, coal mining, oil and gas exploitation, and livestock are the dominant emission sectors. Emissions from other sectors, including wastewater disposal, biomass burning, landfill, etc. were also estimated. The provincial CH4 emissions increased gradually from 2003 to 2012, up to 2993.26 Gg with an annual increase rate of 2.85%; the emissions were 2740.63 in 2020. The emissions of CH4 in Harbin, Daqing, Jiamusi, and Hegang cities were higher than in the other nine cities, which were 337.23 Gg, 330.01 Gg, 328.55 Gg, and 307.42 Gg in 2020, respectively. Agriculture, including the rice cultivation, livestock, and biomass burning sectors contributed to 51.24–62.12% of total emissions, and the contributions increased gradually. Coal mining, oil and gas exploration, and fossil fuel combustion are energy-related sources, which contributed up to 37.91% of the total emissions, and the proportion kept decreasing to 23.87% in 2020. Furthermore, meteorological factors are especially relevant to the region, by which the differences of ambient temperature are over 60 °C (±30 °C). In the summer, CH4 emissions from the rice cultivation, biomass burning, livestock, and landfill sectors are obviously distinct from the heating period (winter), while few differences in CH4 emissions are found from wastewater disposal and the fossil fuel production sectors.

1. Introduction

Methane (CH4) is responsible for 1.2 Wm2 of radiative effects both directly and indirectly [1]. The global warming potential of methane (CH4) is about 28 times higher than carbon dioxide (CO2) over a 100-year time frame [2]. The atmospheric methane concentration has almost tripled since 1750 [3,4]. The lifetime of CH4 is about a decade, which is relatively short. Reducing CH4 emissions is an efficient approach to lower radiative forcing in the short term [5,6]. Hence, the control of CH4 emissions would mitigate the effects of climate change at a short time scale [7,8], and gain more time for CO2 reductions.
The continuous increase in emissions makes CH4 the second largest greenhouse gas after CO2. CH4 emissions are strongly correlated to human activities. The dominant anthropogenic sources include rice cultivation, livestock, wastewater treatment, domestic waste landfill, fossil fuel production and consumption, biomass burning, etc. [9,10]. Global anthropogenic CH4 emissions were approximately 356.89 Tg in 2021 [11]. Agriculture, energy, and waste are dominant sources that contributed to 97.96% of the global anthropogenic CH4 emissions, and their contributions were 39.61%, 37.89%, and 20.45%, respectively. The source profile varied by regions, by which the energy sector is the dominant source in Russia and Caspian, the Middle East, and North America; the agriculture sector is the largest emission source of Central and South America, Europe, Asia Pacific, and Africa. Understanding the levels and trends of anthropogenic CH4 emissions could help the implementation of super-emitter control.
An increasing number of studies have made great efforts regarding the estimation of CH4 emissions for its important sectors in China. A previous study revealed that the coal mining and agriculture sectors are dominant sources in China, by which increased CH4 emissions from rice cultivation over east and central China were detected [12]. The largest emission source of CH4 changed from agriculture to coal mining since the 2010s [Jg], and the emissions from coal mining increased to 16.41 Tg in 2016 [13]. The CH4 emissions from the wastewater sector grow over time, because of the increase in water consumption. The emissions of the wastewater sector would be overestimated, if the recovery of CH4 from wastewater is not considered [14].
Economic growth makes the differences of features of cities, hence, the sources of CH4 are variable as well (Peng, 2016) [14]. Distinguishing features of cities influence the characteristics of CH4 emissions. The city-level emission inventory represents the characteristics of CH4 on a smaller scale, according to the features of each city, corresponding to the rapid spatial-temporal changes of CH4. It not only provides feasible scientific data for global and national inventory, but also the key scale of future climate change mitigation and targeted emission control activities.
This study takes the coldest region in northeast China as a target region and illustrates the special factors regarding CH4 emissions in the region to arouse feasible methods of analyzing CH4 emissions in other regions. Cities in Heilongjiang province are strong in agriculture, with special meteorological conditions. Energy productions are also important sources of CH4. Because of the cold weather in the heating period (down to −50 °C), it is important to calculate and analyze the CH4 emissions based on the detailed feature information collected from each city in the region. Activity data of cities are collected corresponding to major sectors, including rice cultivation, livestock, biomass burning, coal mining, oil and gas exploitation, wastewater disposal, and landfill. Then, a long-term consistent annual CH4 emission inventory is established. The research provides methods of city-level CH4 emission inventory and scientific data, aiming to provide useful information for policy making to reduce CH4 emissions in city scale.

2. Methodology

2.1. Target Region

Heilongjiang province is China’s largest agriculture province that contributed to 56% of China’s agriculture production, located in northeast China (121°11′–135°05′, 43°26′–53°33′), with distinguished meteorological conditions. Cold weather in the Heilongjiang province lasts for about 6 months, with ambient temperature differences of more than 60 °C. The lowest temperature is about −50 °C.

2.2. City-Level CH4 Emission Inventory

A city-level CH4 emission inventory is built based on emission sectors, according to the availability of local activity data. The emission sectors of CH4 include rice cultivation, coal mining, oil and gas exploration, biomass burning, wastewater disposal, livestock, landfill, and fossil fuel combustion. In this study, activity data are mainly adapted from the Heilongjiang Province Statistical Year Book. Emission factors are adapted from IPCC 2006 [15] and previous studies.

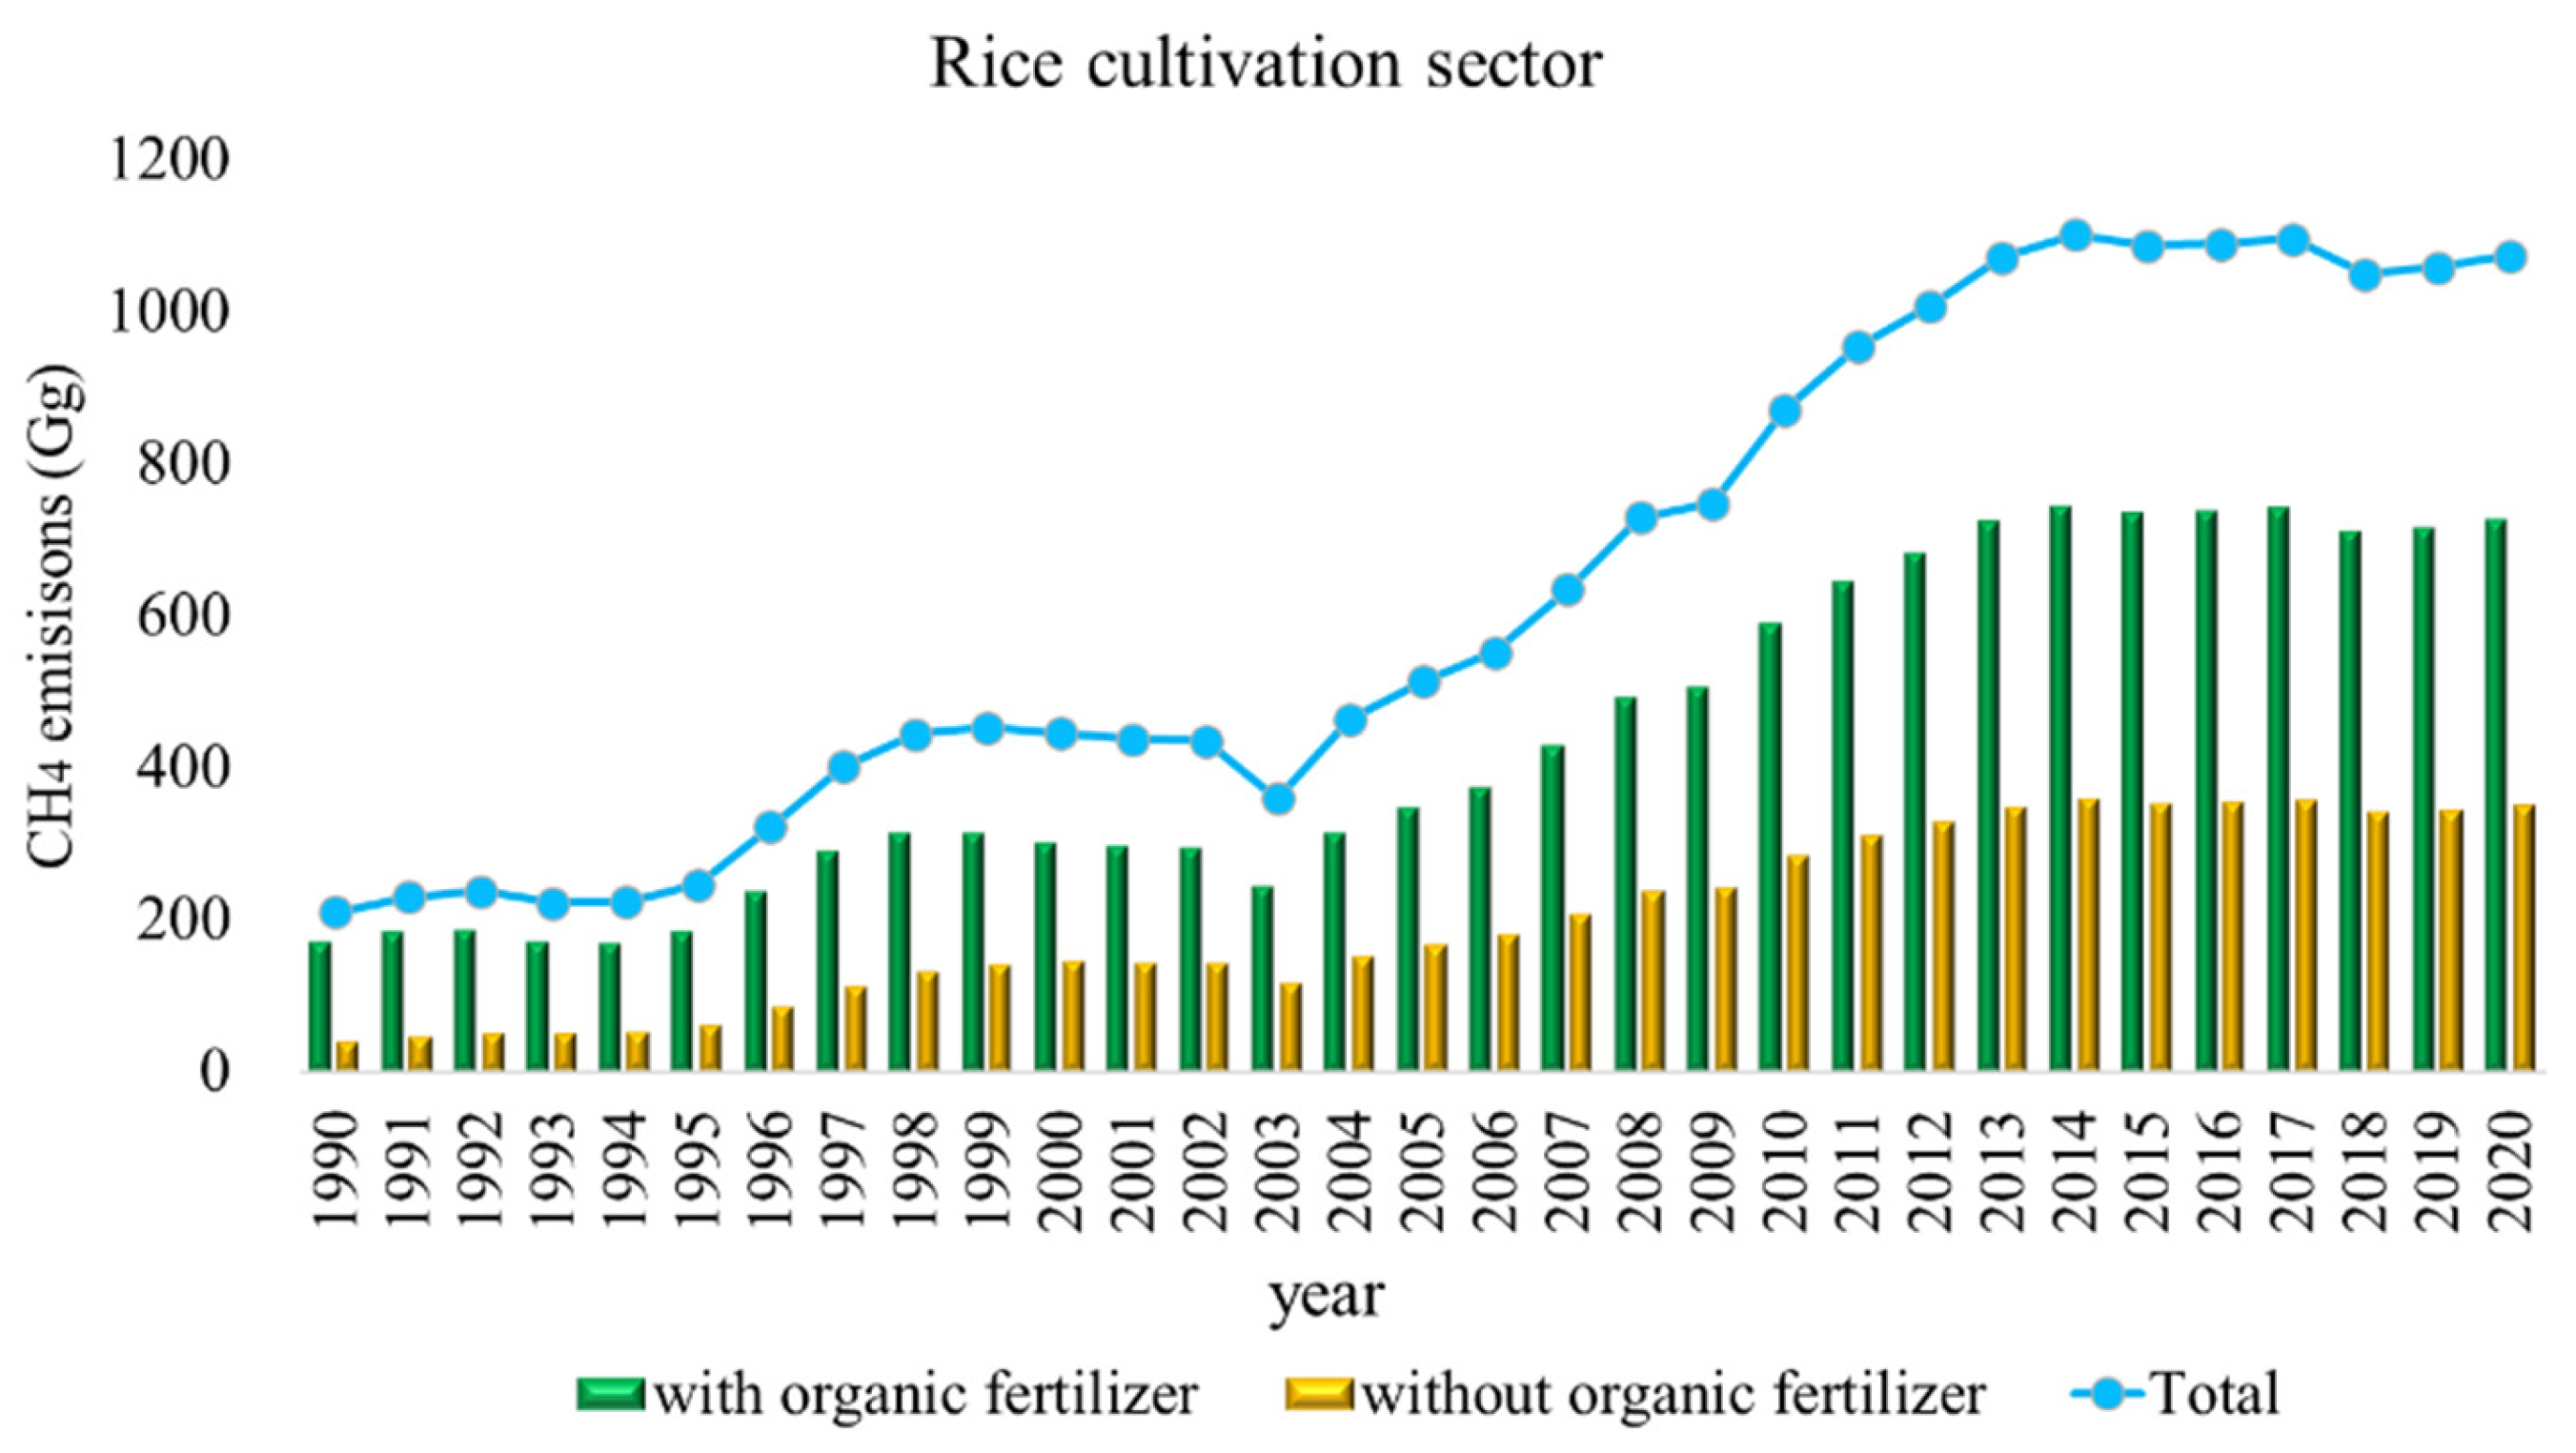
2.2.1. Rice Cultivation Sector

Rice cultivation is the main contributor of agriculture-related sector, owing to the high CH4 production from paddy flooding [16]. During the rice cultivation process, organic matter and root residues in paddy soil are decomposed to produce methane, owing to the metabolic action of certain anaerobic microorganisms. The irrigating period creates a reducing anaerobic environment for the soil, promoting the metabolic activities of anaerobic microorganisms, thus accelerating the CH4 emissions in rice fields [17]. The CH4 is discharged into the atmospheric through three main routines, which are molecular diffusion, air bubbles and plant ventilation tissue.
The rice planting area is divided into two sections: with or without organic fertilizer. The calculations of with organic fertilizer rice cultivation have larger levels of uncertainty [17], which is related to local economic development and policy. Since 2000, the amount of organic fertilizer has maintained a growth trend, but in order to improve the sustainable use of paddy soil, the recycling of straw and other organic fertilizer became popularized again, so the area of rice fields with organic fertilizer is relatively stable [17]. The annual CH4 emissions of rice cultivation is related to the growth duration of rice. In the Heilongjiang province, the rice cultivation period is from mid-April to mid-September [18]. In this study, the average annual growth duration of rice planting was 150 days.
E i = i E F i × A D i
where, Ei represents CH4 emissions of rice cultivation sector; i is with or without organic fertilizer of rice cultivation sector; ADi refers to the areas of rice field; EFi is the emission factors of rice cultivation sector (NBSC 2000–2021).

2.2.2. Livestock Sector

The CH4 emissions of the livestock sector are mainly from enteric fermentation and manure management.
  • Enteric fermentation
Methanogens in rumen and the intestinal tract can convert carbon dioxide, hydrogen, formic acid, and acetate through various reactions to produce methane [19,20,21].
E p = p E F p × A E p
where, Ep represents CH4 emissions of enteric fermentation; p is livestock species of livestock sector; AEP refers to the amount of enteric fermentation sector for species p; EFp is the emission factors of enteric fermentation sector for species i.
  • Manure management
Livestock manure management modes are diverse, in which the anaerobic fermentation process of liquid management mode has great potential for CH4 emissions [22]. Manure is recycled into a biological digester as used as a biogas. In this study, we assume that 15% of the CH4 production from manure management is used in the Heilongjiang province, due to the lack of data sources in the Heilongjiang province [23].
E e = e ( E F e × A M e R e e )
where, Ee represents CH4 emissions of manure management; e is livestock species of livestock sector; AMe refers to the amount of manure management sector for species e; EFe is the emission factors of manure management sector for species e; Ree refers to the amount of CH4 recovery from manure management sector for species e.

2.2.3. Biomass Burning Sector

The CH4 emissions of biomass burning are mainly from the burning of rice, wheat, corn, and beans. A more accurate assessment of CH4 emissions from biomass combustion is crucial, as it is a prerequisite for assessing its contribution and emission reduction potential. Activity datasets are built based on national and local statistical yearbooks, including the production of straw and wood.
R B c r o p = R c × N c × F × θ
where, RBcrop represents production of strew or stalk of biomass burning sector; c is grain types; Rc refers to the output of grain c; Nc is the ratios of grain to strew; F refers to the ratios of biofuel and open fire burning; θ is the burning efficiency [24,25].

2.2.4. Coal Mining

CH4 escapes from the process of mining activities (surfaced or underground mining) in the coal mining sector [26]. With the improvement of the socio-economic level and mining safety technology, the escaped CH4 recovery rate keeps increasing. We assume that the methane recovery rate increases from 0.4% to 12.8% [27,28].
E u = E F u × A C u × 1 R e
E i = E u + i E F i × A C i
where, Eu represents amount of CH4 escape from underground mining; Ei represents the amount of CH4 escape from surfaced mining; u is underground mining; i is surfaced mining; EFu refers to the emission factors of underground mining [28]; EFi is the emission factors of surfaced mining; ACu refers to the coal output of underground mining; ACi is the coal output of surfaced mining [27,28,29,30,31]; Re refers to the amount of CH4 recovery.

2.2.5. Oil and Gas Exploitation

CH4 escape from the process of drilling, exploitation, and processing in the oil and gas exploitation sector.
E j = j E F j × A O j
where, Ej represents CH4 emissions of oil and gas exploitation; j is types of fossil fuel (oil, nature gas); EFj refers to the emission factors of oil or nature gas [32,33]; AOj refers to the amount of surfaced exploitation; EFj is the emission factors of underground exploitation [32].

2.2.6. Wastewater Sector

The CH4 emissions were mainly from the treatment process of domestic and industrial wastewater in the wastewater treatment plant, which directly discharged into the water body. The methane discharge of the wastewater disposal process is calculated as follows [27]:
E = C O D × B 0 × M C F s
where, E represents CH4 emissions from wastewater; COD is chemical oxygen demand; B0 refers to the potential of max CH4 emissions; MCFs refers to the correction factor of wastewater CH4 emission [34,35].

2.2.7. Landfill

The CH4 emissions in the landfill sector were calculated based on the quality conservation method, adapted from the Compilation Guide of Provincial Greenhouse Gas List [36]. The assumption is that the emission is discharged in a year, without considering the first-level attenuation, and the calculation results were slightly higher than the real-world value.
E = M S W T × M S W F × L 0 R e × 1 O X
where, E represents CH4 emissions from landfill; MSWT is production of waste; MSWF refers to the efficiency of waste treatment by landfill; L0 refers to the potential of different types of landfill technology; Re refers to CH4 recovery; OX refers to oxidation factor.
L 0 = M C F l × D O C × D O C F × F × 16 12
where, L0 represents potential of CH4 emissions from various types of landfills; MCFl is the correction factor of wastewater CH4 emission; F refers to the fraction of landfill types; DOC refers to the ratio of biodegradable organic carbon in solid waste; DOCF refers to the fraction of DOC; f refers to the ratio of CH4 in the landfill gas; 16/12 is ratio of CH4/C.

2.3. Emission Factors

Emission factors of CH4 are the emissions per unit in the rice cultivation area, unit weight of coal mining, oil and gas exploitation, or unit COD weight of wastewater disposal, etc. The adapted emission factors in this study combined the recent studies of CH4 emissions [14,15,20,25,26,31] and upgraded IPCC guideline, illustrated in Table 1.

3. Results and Discussion

3.1. Total CH4 Emissions in 2003–2020

Heilongjiang is a typical agricultural province in China’s cold region, which is famous for its grain output. The lowest ambient temperature could be −50 °C in certain areas. In the Heilongjiang province, CH4 is mainly emitted from sectors consisting of rice cultivation, coal mining, oil and gas exploration, biomass burning, wastewater disposal, livestock, landfill, and fossil fuel combustion. The activity data of emission sources have been collected since 2003. Emissions of CH4 increased from 2003 to 2012, up to 2993.26 Gg. The annual increase rate was 2.85%. From 2016 to 2019, CH4 emissions were lower than during the period of 2011–2015, owing to the lower emissions of the wastewater disposal sector (Figure 1).
CH4 emissions varied in different seasons. Heilongjiang has the coldest heating periods in China. The period of heating lasted for 6 months each year, while spring and autumn are very short. The farming processes start when the heating is stopped, until a month before the heating starts again. In the study, the comparisons of CH4 emissions at different times of the year were represented as “heating” and “non-heating” periods. According to the investigation results, few differences in CH4 emissions were found from the wastewater disposal and fossil fuel production sectors [37]; while CH4 emissions from rice cultivation, biomass burning, livestock, and landfill sectors were obviously distinct [38]. In 2020, the CH4 emissions in the non-heating period were 1943.54 Gg, which is 930.48 Gg higher than heating period (Figure 2); the annual trend in Heilongjiang province is consistent with that of national scale emissions [39]. The dominant source of CH4 in the non-heating period is the rice cultivation sector, which contributed to 56% of total emissions in the period. During the heating period, without rice cultivation, CH4 emissions were mainly from biomass burning, livestock, wastewater disposal, and coal mining.
Cities are the key units of provincial regions. The features of a city are significantly associated with CH4 emissions. In the Heilongjiang province, the CH4 emissions of cities are impacted by the differences in dominant emission sources (Figure 3). The emissions of CH4 in Harbin, Daqing, Jiamusi, and Hegang were higher than in other cities, which were 337.23 Gg, 330.01 Gg, 328.55 Gg, and 307.42 Gg in 2020, respectively. Harbin is the capital of Heilongjiang province, which is a synthetic city; rice cultivation, wastewater disposal, livestock, and landfill are the main sources of the CH4 emissions. Daqing is famous for oil and gas exploration; it contributed to 69.39% of Daqing’s CH4 emissions. Rice cultivation is the main source in Jiamusi, which contributed to 87.96% of Jiamusi’s CH4 emissions. Biomass burning, rice cultivation, and coal mining were the main sources in Hegang, which contributed to 98.17% of Jiamusi’s CH4 emissions. Qiqihaer, Jixi, and Shuangyashan had relative higher CH4 emissions too, which were 266.85 Gg, 260.95 Gg, and 225.65 Gg in 2020, respectively. Rice cultivation, livestock, and biomass burning were the main sources in Qiqihaer. Jixi and Shuangyashan are famous for coal mining. The CH4 emissions in the rest of the cites were very low.

3.2. Contributions of Emission Sectors

Rice cultivation, biomass burning, and livestock are agriculture-related sources of CH4 emissions, which contributed to 51.24–62.12% of total emissions, and the contribution rate increased gradually (Figure 4). Coal mining, oil and gas exploration, and fossil fuel combustion are energy-related sources, which contributed up to 37.91% of total emissions, and the proportion kept decreasing to 23.87% in 2020. Wastewater disposal is an important emission source of CH4 too, which contributed to 8.04–11.9% of total emissions, which rose gradually owing to the increased consumption of water.
Rice cultivation and coal mining are the dominant emission sources of CH4 in the Heilongjiang province in different periods. Before 2007, coal mining was the dominant source of CH4 emissions. The emissions from the coal mining sector started declining from 2013. Rice cultivation became the biggest emission source of CH4 in 2008. Emissions from the rice cultivation sector increased rapidly, contributing to 39.2% of the total emissions in 2020.

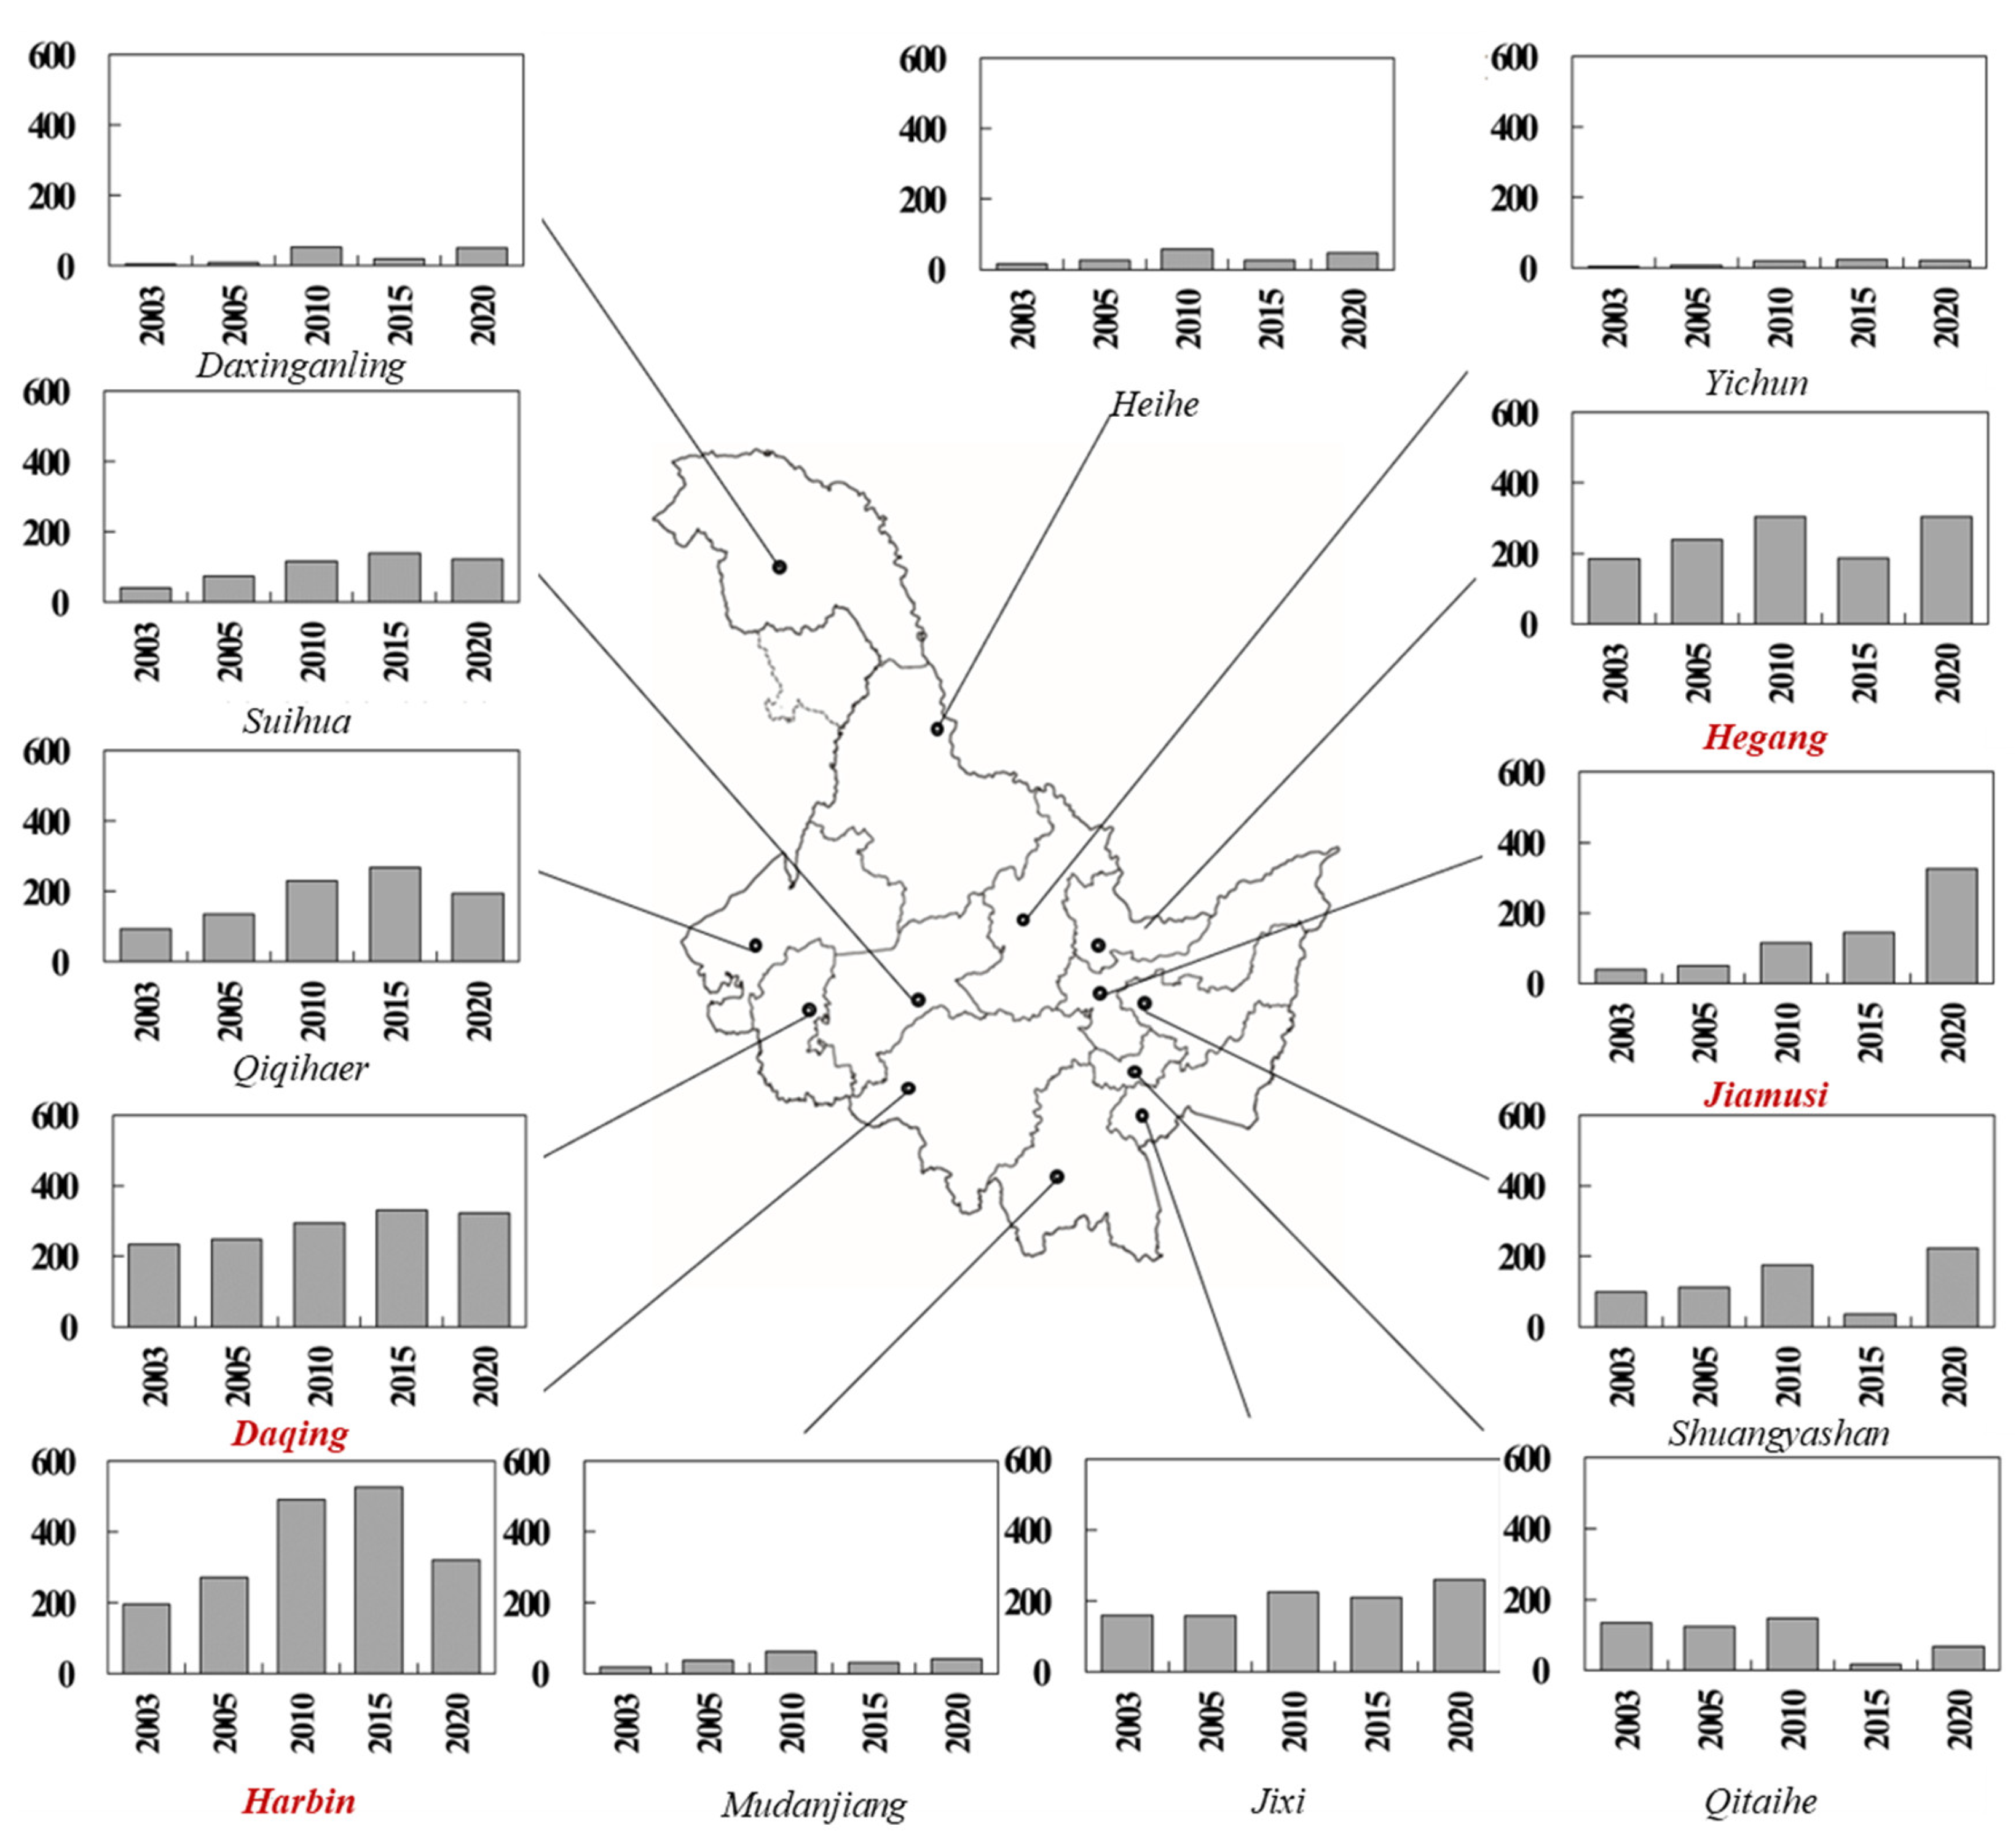
3.2.1. Agriculture Related Sectors

  • CH4 emissions from rice cultivation.
The Heilongjiang province ranks first in rice production in China, where agricultural acreage was 38,720 km2 and 28.96 million tons were produced in 2020. In the study, the emissions of CH4 were calculated based on the data of 13 cities and the General Bureau of State farms in Heilongjiang Province. The total CH4 emissions have been increasing rapidly since 2003, up to 1101 Gg. Since 2014, emissions stopped rising and have been maintained at a certain level (Figure 5). According to different methods of rice cultivation, emissions from organic fertilized fields were approximate double those of fields without organic fertilizer.
City-level emissions of CH4 have changed over time. In 1990, Suihua and Jiamusi were the dominant contributors, which contributed to 29% and 22% of total emissions, respectively; followed by Mudanjiang and Qiqihar, while the contribution rate of other cities was less than 10%; the contributions of the Daxinganling and Daqing were close to 0. In 2000, Harbin became the biggest emitter of the sector, with a contribution rate of approximate 30%. The contributions of Suihua, Jiamusi, and Qiqihar decreased, but were still important sources. In 2020, Jiamusi was the biggest emission source, which contributed to about 30% of the total emission of the sector. The contributions of Harbin, Qiqihar, Jixi, Shuangyashan, Suihua, and Hegang were similar, by which the contribution rates were 7–15%.
  • CH4 emissions from livestock.
The CH4 emissions from livestock are estimated as the sum of enteric fermentation sector and manure management sector. Enteric fermentation is the dominant sector, which contributed to 92.9–94.76% of the total CH4 emissions from livestock (Figure 6). CH4 emissions from livestock were lower in the colder season [39], by which the differences between heating and non-heating periods were 26.46 Gg.
The trend of annual CH4 emissions from enteric fermentation depends on the amount of livestock rearing. In 1990–1993, the average annual growth rate of CH4 emission was about 4.67% (Figure 4). It grew rapidly from 1993 to 1996, and was relatively stable from 1996 to 2001, with an average annual emission of about 250 Gg. Emissions were of rapid growth in 2001–2005, up to 440 Gg. Since 2006, emissions fluctuated slightly until 2015, and a downward trend was observed to about 260 Gg in 2018. Since then, emissions rose to 290 Gg in 2020.
The largest contributor to CH4 emissions of enteric fermentation is non-dairy cattle in the Heilongjiang province. The annual contribution rates were more than 50%, and the highest contribution rate was 70.17%. The contribution of cows ranks second, with a contribution rate between 15.12% and 36.85%. The contribution of horses decreased by time, which was 14.29% in 1985 and decreased to 0.43% in 2020. The contribution rates of sheep and pigs were about 5~7% and 1.5~3%, respectively.
Harbin, Qiqihar, and Daqing ranked the top three in the Heilongjiang province, and their contributions were on the rise. The summed contribution rate of the three cities reached 85~90% in 2013–2014. In Harbin, the CH4 emissions from enteric fermentation increased to 73.36–82.24 Gg, contributing about 33.96% from 1995 to 1996. It evenly increased to 108.3 Gg in 2015, with an average annual growth rate of 3.54%, and decreased to 55.9 Gg in 2016. In Qiqihar, the CH4 emissions rose evenly to a peak of 103 Gg in 2014, and dropped to 83 Gg in 2016. The contribution rate of Qiqihar to the overall emissions in the sector were 14–20% from 1992 to 2007, and reached a peak of 34.85% in 2013. The emissions and contribution rates of Daqing were lower than that of Harbin and Qiqihar. Before 2008, the contribution rate was from 6% to 10% and afterward the contribution rates were increased to 12–20%, and the highest emission rate reached 58.8 Gg in 2012.
For the manure management sector, emission factors of different livestock were small, hence, the CH4 emissions of livestock were significantly influenced by activity data (the amount of manure). Compared with enteric fermentation, the CH4 emissions of manure management sector was 1~2 orders of magnitude smaller. The main reason is that the emission rate of manure management is small, and some of the emissions were recycled as biogas. Pigs, dairy cows and non-dairy cattle contributed more than other livestock. The contribution rates of pigs and dairy cows were up to 50%. The contribution rate of non-dairy cattle ranked third, in the range of 10~18%. The influence of sheep on emissions is stable, where the contribution rate is around 1.5%. The contributions of horses decreased over time; the contribution rate decreased from 11.73% in 1985 to 0.35% in 2020. Goats, donkeys, and mules, all contributed less than 1%. Harbin, Qiqihar and Daqing contributed to more than 90% of the total emissions of manure management in 2014.
  • CH4 emissions from biomass burning.
Straw and firewood are the main fuels used in the biomass burning sector. Cultivated grain includes rice, wheat, corn, and beans in the Heilongjiang province. The consumption of firewood is 1~2 orders of magnitude less than the straws annually, hence, its impact on the whole emissions of the sector is little. Corn stalk burning is the most important contributor to the total emissions. The annual contribution rates ranged from 45% to 70%, which was 1.5~2 times more than the summed emissions of other crops. The contribution rates of rice straw burning were between 20 and 28%. The impact of bean stalk burning ranked the second in 2007 with a concentration rate of 20%, which reduced to 10% after 2007. The contribution rates of wheat and firewood were less than 1%.
Since 2006, the CH4 emissions from biomass burning rapidly increased annually until 2015, up to 324.48 Gg. After 2015, emissions stopped rising, mainly because of the straw burning ban policy established in the Heilongjiang province. The emissions in 2020 were 315.14 Gg. Hegang emitted the largest amount of CH4, contributing to 38~46% of the sectoral emissions. Harbin ranked the second, with a contribution rate of about 16~20%. Qiqihar and Suihua ranked third and fourth, contributing 15% and 10%, respectively, while the rest of the cities accounted for less than 5%.

3.2.2. Energy-Related Sectors

The four major coal-producing cities in Heilongjiang Province are Jixi, Hegang, Shuangyashan, and Qitaihe. The CH4 emissions are mainly owing to the gaseous escape from coal mining. The total contribution of the four major coal-producing cities ranged from 80% to 93%. The contribution rates of Jixi, Hegang, and Qitaihe were all about 20%, and the contribution rates of Shuangyashan ranged from 17% to 20%.
For the oil and gas exploitation sector, the CH4 emissions were mainly due to the methane escape from oil and gas exploitation systems. In the Heilongjiang province, the CH4 emissions from oil and gas system are basically equal to the summed methane escape from Daqing oil and gas exploitation system. The CH4 emissions oil exploitation system decreased over time, and the CH4 emissions decreased to 96.59 Gg in 2020. The CH4 emissions from natural gas exploitation systems increased gradually, to 133.56 Gg in 2020.

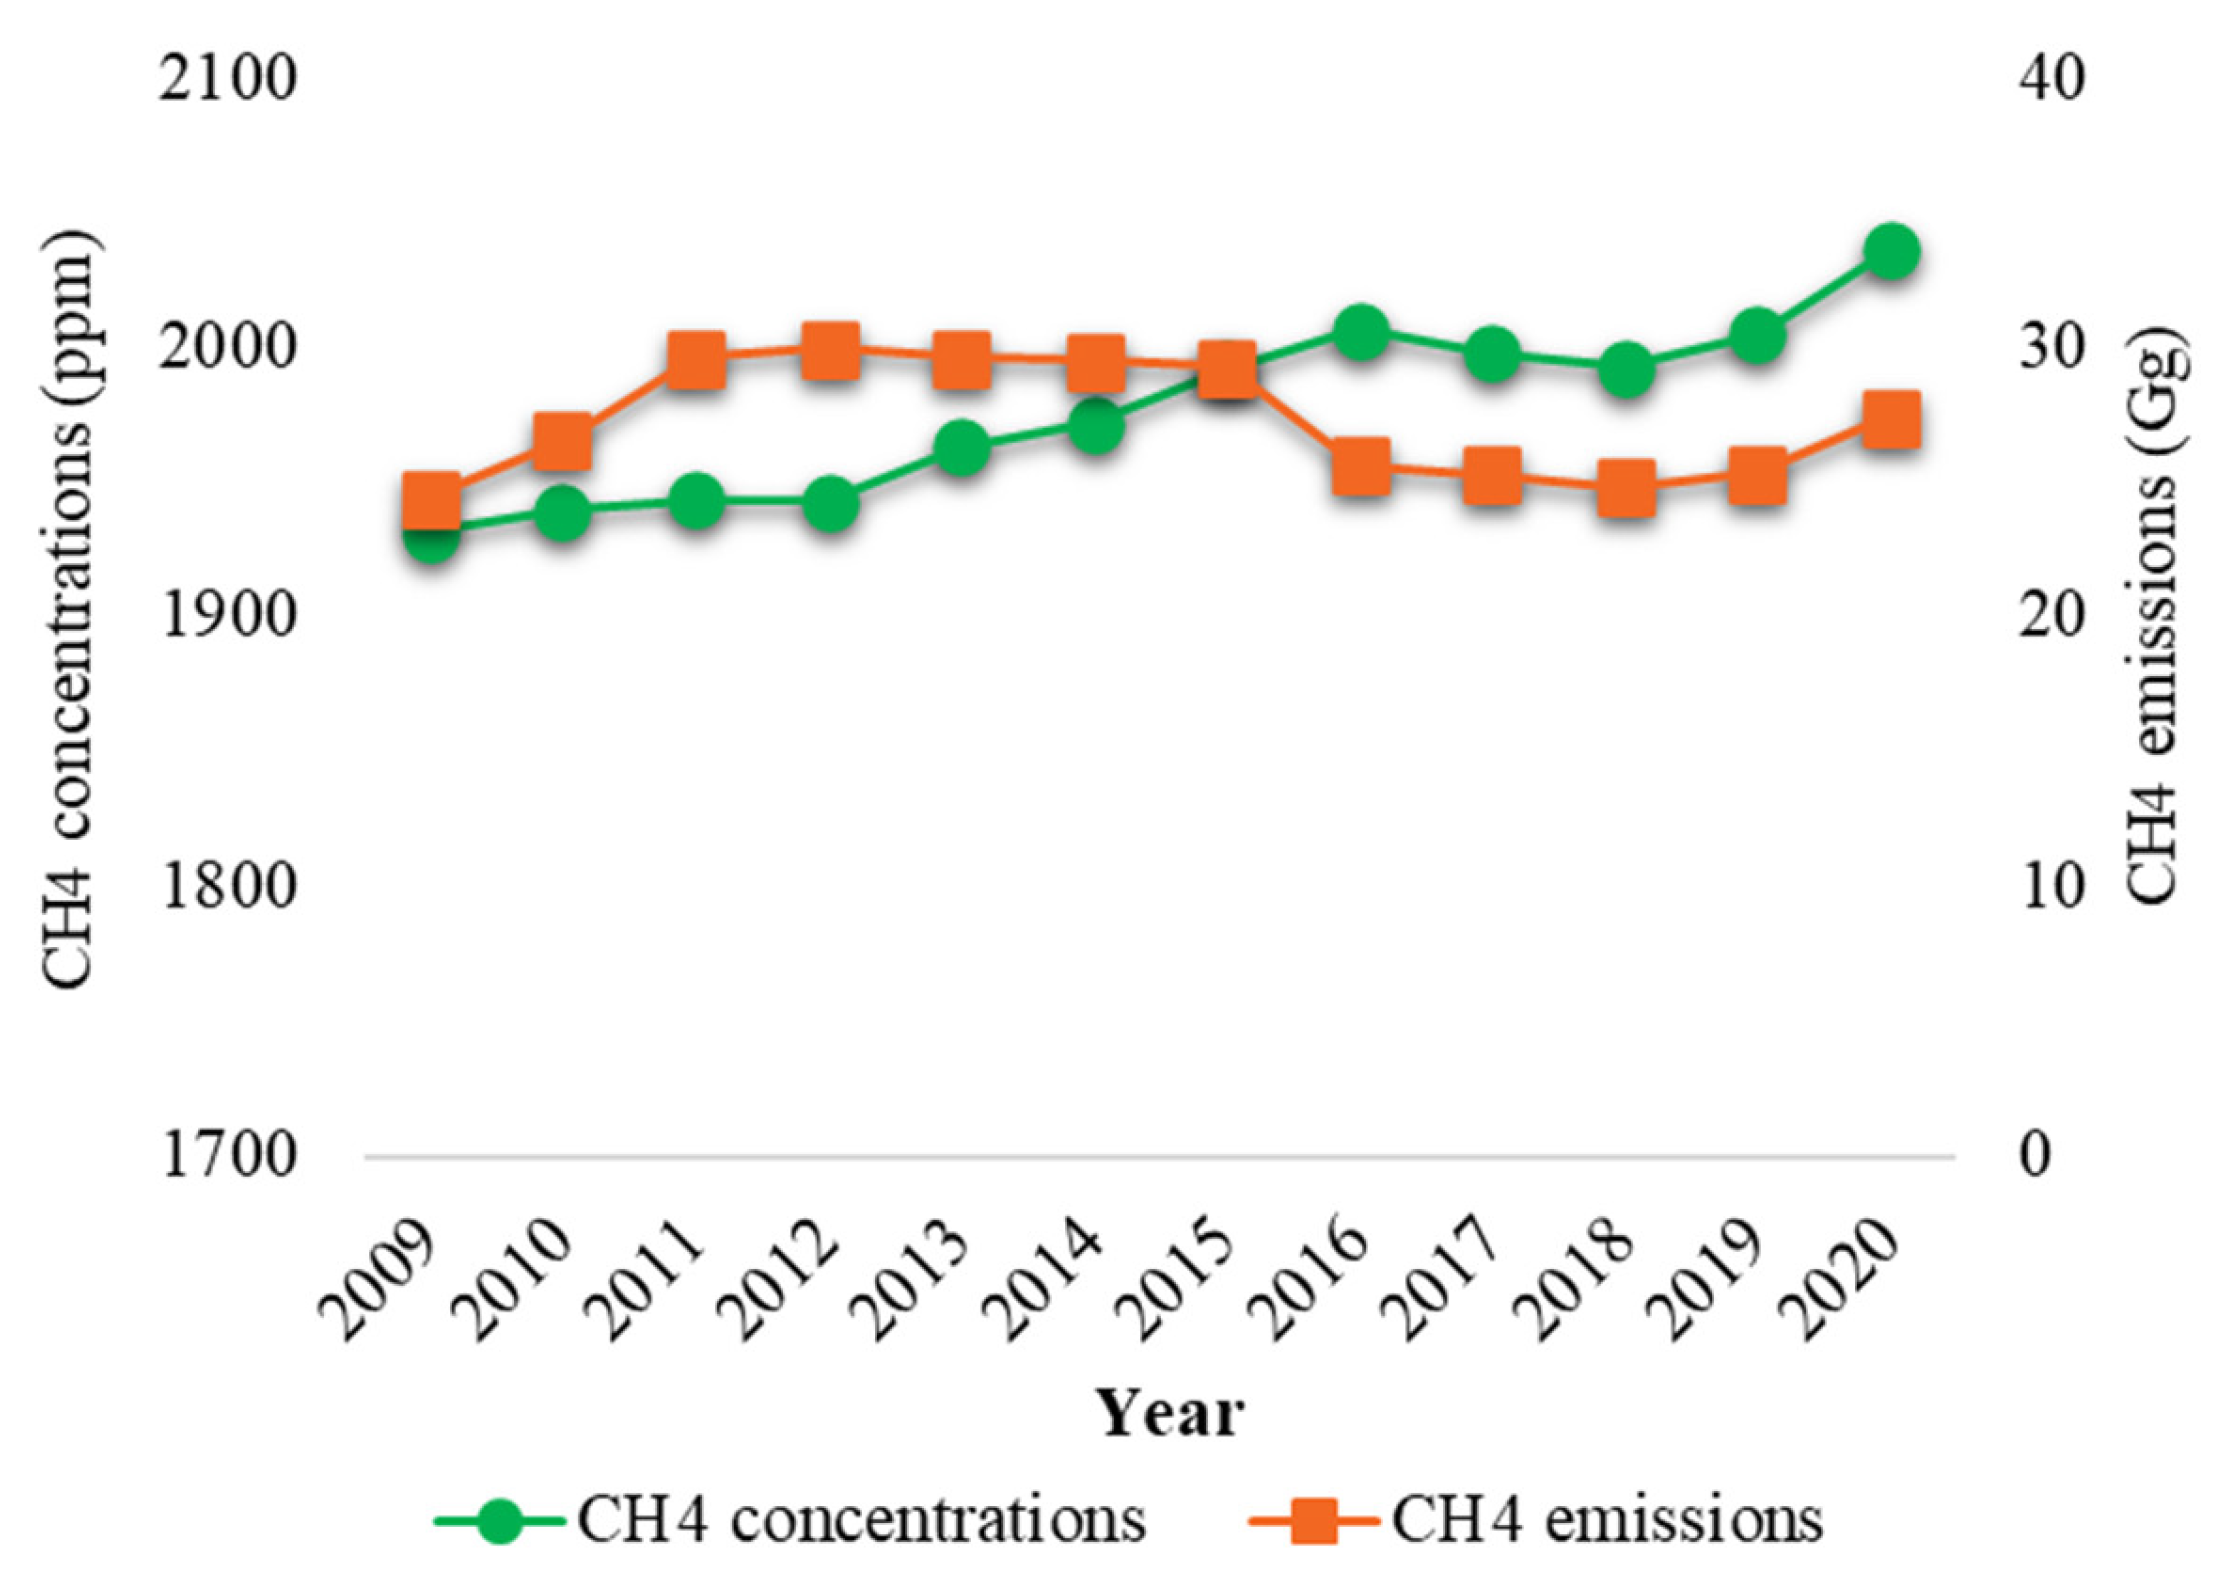
3.3. Impacts of Dominant Anthropogenic Emissions to Ambient CH4

CH4 mixing ratios of the in situ measurements at Longfengshan Background Station (44.73 N, 127.6 E, 331 a.s.l.) in the Heilongjiang province, which is the only WMO/GAW station in the northeastern China plain, observed atmospheric greenhouse gases. The atmospheric CH4 mole fractions were continuously measured by a Cavity Ring Down Spectrometer (CRDS; Picarro Inc., Santa Clara, CA, USA) [40]. We used a robust local regression mathematic procedure to distinguish mixing ratio in background and polluted conditions [41]. The long-term trends were estimated based on linear curve fitting of the CH4 background mixing ratios.
The annual means of CH4 concentrations were raising gradually until 2016, with an annual growth rate of 8.8 ppm/year in the Heilongjiang province. During the period, emissions increased rapidly from 2009 to 2011, and were maintained at a higher level until 2015. Since 2015, the trend of CH4 concentrations and emissions has been consistent (Figure 7).

3.4. Contribution of CH4 to Local GHGs Emissions

Although total methane emissions are nearly two orders of magnitude less than carbon dioxide, methane is the second most important greenhouse gas, for the global warming potential (GWP) of methane far exceeds that of CO2. Previous studies have projected that the GWP of methane is equal to 25 times on a 100-year scale [15]. We utilized the data from previous studies to calculate the CO2 equivalent of methane (Figure 8) [38,39]. The area of each part of the sectors in the bottom two rows represents its CO2 equivalent of CH4 and actual CO2 emissions.
Emission sources of CH4 and CO2 were different in both the non-heating period and heating period. In the non-heating period, agriculture is the dominant sector that causes differences in emission levels. The differences of CH4 and CO2 emissions between the heating period and non-heating period from agriculture were 105.8 Gg and 33.1 million tons, respectively. However, because the freezing-cold weather limited agriculture activities, the emissions of rice fades away in the heating period. Hence, the emissions of CH4 in the non-heating period are much higher than that of the heating period. Moreover, heating is a special sector of CO2 emission in the heating period, accounting for up 34% of the total CO2 emissions of the heating period’s emissions, but only a small amount of CH4 was emitted from heating.
Compared to agriculture and heating, seasonal differences in other emission sources are much less significant. For instance, the CH4 emissions from livestock in the non-heating period and heating period account for 53% and 47%, respectively [39].
The CO2 absorption was 412.9 million tons in 2019. The absorption was about an order of magnitude higher than that of the Yunnan province (20.31 million tons) in 2015 [42]. Hence, the Heilongjiang province would provide a considerable regional carbon sink.

3.5. Conclusions

The study represents the characteristics of CH4 emissions in China’s coldest region. An emission inventory is established according to the features of cities in the region. A spatial-temporal distribution of emissions showed the trend of CH4 variation by time associated with the development of the economy. Before 2007, coal mining was the dominant source of CH4 emissions in the Heilongjiang province; while since 2008, rice cultivation has been the biggest emission source of CH4. Emissions from the rice cultivation sector increased rapidly, contributing to 39.2% of total emissions in 2020.
Feasible factors of cities should be taken into account when establishing emission inventory of various scales (global, regional, national, local, etc.). In this study, meteorological factors are specially considered in the region, by which the differences of ambient temperature are over 60 °C (±30 °C). CH4 emissions from the rice cultivation, biomass burning, livestock, and landfill sectors are obviously distinct in the heating period, while few differences of CH4 emissions are found from the wastewater disposal and fossil fuel production sectors. The total emissions of the non-heating period were approximately two times higher than in the heating period. Hence, thinking of the features of targeted regions when establishing an inventory is very important, which provides more information than the uniform emission data.
The dominant sectors varied across different cities, which was associated to the landscape and development of economy, which makes a significant difference regarding CH4 emissions. For instance, Harbin is the capital city of the Heilongjiang province, which is a synthetic city. The CH4 was emitted from many sectors, including rice cultivation, wastewater disposal, livestock, and landfill. Other cities, e.g., Daqing, which is famous for oil and gas exploration, contributed to 69.39% of Daqing’s CH4 emissions. Rice production of Jiamusi ranks the first of the province in city-level, which contributed to 87.96% of Jiamusi’s CH4 emissions. So, the investigation of city-level emissions of CH4 would support the applications corresponding to abatement technologies or forming local strategies.
The comprehensive analysis of dominant GHGs emitters in the Heilongjiang province indicated that agriculture and heating are the feasible emission sectors in the non-heating period and heating period in the Heilongjiang province, respectively. Rice cultivation is the dominant source of CH4 in the non-heating period. Heating is a special sector of CO2 emissions in the heating period, accounting for 34% of CO2 emissions in the heating period’s, but only a small amount of CH4 was emitted from heating.
For the perspective of city-level emissions, scaled inventories can provide opportunities to estimate the reliability and sensitivity of the results of bottom-up emission inventory, and facilitate implementing the projections. An integrated control strategy would be provided based on the characteristics of CH4 emissions in cities.

Author Contributions

Writing—original draft preparation, W.S., W.Y., Y.Z. and R.C.; writing—review and editing, M.W. and W.S.; investigation, W.Y. and C.L.; data curation, Z.Z., D.Y. and M.L.; methodology, Z.Z., W.Y. and Z.G.; supervision, W.S. and D.Y. All authors have read and agreed to the published version of the manuscript.

Funding

This research was funded by the National Natural Science Foundation of China (51778181), and Open Project of State Key Laboratory of Urban Water Resource and Environment, Harbin Institute of Technology (No. ES201908), the Heilongjiang Provincial Natural Science Foundation of China (No. LH2021D021).

Institutional Review Board Statement

Not applicable.

Informed Consent Statement

Not applicable.

Data Availability Statement

Not applicable.

Conflicts of Interest

The authors declare no conflict of interest.

References

  1. Szopa, S.; Naik, V.; Adhikary, B.; Artaxo, P.; Berntsen, T.; Collins, W.D.; Fuzzi, S.; Gallardo, L.; Kiendler-Scharr, A.; Klimont, Z.; et al. Climate change 2021: The physical science basis. In Contribution of Working Group I to the Sixth Assessment Report of the Intergovernmental Panel on Climate Change; Masson-Delmotte, V., Zhai, P., Pirani, A., Connors, S.L., Péan, C., Berger, S., Caud, N., Chen, Y., Goldfarb, L., Gomis, M.I., et al., Eds.; Cambridge University Press: Cambridge, UK, 2021. [Google Scholar]
  2. Gunnar, M.; Drew, S.; Julia, P. Anthropogenic and Natural Radiative Forcing. In Climate Change 2013—The Physical Science Basis; Intergovernmental Panel on Climate Change; Thomas, S., Ed.; Cambridge University Press: Cambridge, UK, 2014; pp. 659–740. ISBN 9781107057999. [Google Scholar]
  3. Ciais, P.; Sabine, C.; Bala, G.; Bopp, L.; Brovkin, V.; Canadell, J.; Chhabra, A.; DeFries, R.; Galloway, J.; Heimann, M.; et al. Carbon and Other Biogeochemical Cycles. In Climate Change 2013—The Physical Science Basis; Intergovernmental Panel on Climate Change; Heinz, C., Tans, P., Vesala, T., Eds.; Cambridge University Press: Cambridge, UK, 2014; pp. 465–570. ISBN 9781107057999. [Google Scholar]
  4. Ghosh, A.; Patra, P.K.; Ishijima, K.; Umezawa, T.; Ito, A.; Etheridge, D.M.; Sugawara, S.; Kawamura, K.; Miller, J.B.; Dlugokencky, E.J.; et al. Variations in Global Methane Sources and Sinks during 1910–2010. Atmos. Chem. Phys. 2015, 15, 2595–2612. [Google Scholar] [CrossRef] [Green Version]
  5. Montzka, S.A.; Dlugokencky, E.J.; Butler, J.H. Non-CO2 Greenhouse Gases and Climate Change. Nature 2011, 476, 43–50. [Google Scholar] [CrossRef] [PubMed]
  6. Shindell, D.; Kuylenstierna, J.C.I.; Vignati, E.; van Dingenen, R.; Amann, M.; Klimont, Z.; Anenberg, S.C.; Muller, N.; Janssens-Maenhout, G.; Raes, F.; et al. Simultaneously Mitigating Near-Term Climate Change and Improving Human Health and Food Security. Science 2012, 335, 183–189. [Google Scholar] [CrossRef] [PubMed] [Green Version]
  7. Höglund-Isaksson, L. Global Anthropogenic Methane Emissions 2005–2030: Technical Mitigation Potentials and Costs. Atmos. Chem. Phys. 2012, 12, 9079–9096. [Google Scholar] [CrossRef] [Green Version]
  8. Saunois, M.; Jackson, R.B.; Bousquet, P.; Poulter, B.; Canadell, J.G. The Growing Role of Methane in Anthropogenic Climate Change. Environ. Res. Lett. 2016, 11, 120207. [Google Scholar] [CrossRef] [Green Version]
  9. Bruhwiler, L.; Dlugokencky, E.; Masarie, K.; Ishizawa, M.; Andrews, A.; Miller, J.; Sweeney, C.; Tans, P.; Worthy, D. CarbonTracker-CH4: An Assimilation System for Estimating Emissions of Atmospheric Methane. Atmos. Chem. Phys. 2014, 14, 8269–8293. [Google Scholar] [CrossRef] [Green Version]
  10. Menon, S.; Denman, K.L.; Brasseur, G.; Chidthaisong, A.; Ciais, P.; Cox, P.M.; Dickinson, R.E.; Hauglustaine, D.; Heinze, C.; Holland, E.; et al. Couplings between Changes in the Climate System and Biogeochemistry; Lawrence Berkeley National Lab: Berkeley, CA, USA, 2007; 90p.
  11. IEA. Methane Tracker; IEA: Paris, France, 2022; Available online: https://www.iea.org/data-and-statistics/data-tools/methane-tracker (accessed on 2 February 2022).
  12. Zhang, Y.; Fang, S.; Chen, J.; Lin, Y.; Chen, Y.; Liang, R.; Jiang, K.; Parker, R.J.; Boesch, H.; Steinbacher, M.; et al. Observed Changes in China’s Methane Emissions Linked to Policy Drivers. Proc. Natl. Acad. Sci. USA 2022, 119, e2202742119. [Google Scholar] [CrossRef]
  13. Wang, K.; Zhang, J.; Cai, B.; Liang, S. Estimation of Chinese City-Level Anthropogenic Methane Emissions in 2015. Resour. Conserv. Recycl. 2021, 175, 105861. [Google Scholar] [CrossRef]
  14. Peng, S.; Piao, S.; Bousquet, P.; Ciais, P.; Li, B.; Lin, X.; Tao, S.; Wang, Z.; Zhang, Y.; Zhou, F. Inventory of Anthropogenic Methane Emissions in Mainland China from 1980 to 2010. Atmos. Chem. Phys. 2016, 16, 14545–14562. [Google Scholar] [CrossRef] [Green Version]
  15. IPCC. 2006 IPCC Guidelines for National Greenhouse Gas Inventories, Prepared by the National Greenhouse Gas Inventories Programme; Eggleston, H.S., Buendia, L., Miwa, K., Ngara, T., Tanabe, K., Eds.; IGES: Hayama, Japan, 2006. [Google Scholar]
  16. Carlson, K.M.; Gerber, J.S.; Mueller, N.D.; Herrero, M.; MacDonald, G.K.; Brauman, K.A.; Havlik, P.; O’Connell, C.S.; Johnson, J.A.; Saatchi, S.; et al. Greenhouse Gas Emissions Intensity of Global Croplands. Nat. Clim. Change 2017, 7, 63–68. [Google Scholar] [CrossRef]
  17. Yan, X.; Ohara, T.; Akimoto, H. Development of Region-Specific Emission Factors and Estimation of Methane Emission from Rice Fields in the East, Southeast and South Asian Countries. Glob. Change Biol. 2003, 9, 237–254. [Google Scholar] [CrossRef]
  18. Zhang, H.; Ye, X.; Cheng, T.; Chen, J.; Yang, X.; Wang, L.; Zhang, R. A Laboratory Study of Agricultural Crop Residue Combustion in China: Emission Factors and Emission Inventory. Atmos. Environ. 2008, 42, 8432–8441. [Google Scholar] [CrossRef]
  19. Liu, Y.; Whitman, W.B. Metabolic, Phylogenetic, and Ecological Diversity of the Methanogenic Archaea. Ann. N. Y. Acad. Sci. 2008, 1125, 171–189. [Google Scholar] [CrossRef]
  20. Zhou, J.B.; Jiang, M.M.; Chen, G.Q. Estimation of Methane and Nitrous Oxide Emission from Livestock and Poultry in China during 1949–2003. Energy Policy 2007, 35, 3759–3767. [Google Scholar] [CrossRef]
  21. Chen, R.R.; Wang, Y.M.; Hu, J.L.; Lin, X.G. Methane emission and mitigation strategies in animal manure management system. Acta Pedol. Sin. 2012, 49, 815–823. (In Chinese) [Google Scholar]
  22. Xu, D. Studies on Relationship between Water and Fertilizer Managements and Greenhouse Gas Emissions from Black Soil Rice Field in Cold Area. Ph.D. Thesis, Northeast Agricultural University, Harbin, China, 2016; pp. 2–47. (In Chinese). [Google Scholar]
  23. Tong, C.; Wang, W.-Q.; Zeng, C.-S.; Marrs, R. Methane (CH4) Emission from a Tidal Marsh in the Min River Estuary, Southeast China. J. Environ. Sci. Health 2010, 45 Pt A, 506–516. [Google Scholar] [CrossRef]
  24. Ma, C.M.; Dai, E.F.; Liu, Y.C.; Wang, Y.H.; Wang, F. Methane fugitive emissions from coal mining and post-mining activities in China. Resour. Sci. 2020, 42, 311–322. [Google Scholar] [CrossRef]
  25. NDRC (The National Development and Reform Commission). The People’s Republic of China National Greenhouse Gas Inventory; China Environmental Press: Beijing, China, 2014. [Google Scholar]
  26. Zheng, S.; Wang, Y.A.; Wang, Z.Y. Methane emissions to atmosphere from coal mine in China. Saf. Coal Mines 2006, 36, 29–33. (In Chinese) [Google Scholar]
  27. Tian, H.; Zhao, D.; Wang, Y. Emission inventories of atmospheric pollutants discharged from biomass burning in China. Acta Sci. Circumstantiae 2011, 31, 349–357. [Google Scholar]
  28. Jia, X.Q. Study on Environment Impact and Landscape Change of the Open-Pit Coal Mining Area Along Gulian River. Ph.D. Thesis, China University of Geoscience, Beijing, China, 2011. (In Chinese). [Google Scholar]
  29. Xu, Z. Research on Deep Resources Mining Scheme of Yilan Open Pit Coal Mine. Ph.D. Thesis, Liaoning Project Technology University, Shenyang, China, 2013. (In Chinese). [Google Scholar]
  30. Schwietzke, S.; Griffin, W.M.; Matthews, H.S.; Bruhwiler, L.M.P. Global Bottom-Up Fossil Fuel Fugitive Methane and Ethane Emissions Inventory for Atmospheric Modeling. ACS Sustain. Chem. Eng. 2014, 2, 1992–2001. [Google Scholar] [CrossRef] [Green Version]
  31. Schwietzke, S.; Griffin, W.M.; Matthews, H.S.; Bruhwiler, L.M. Natural Gas Fugitive Emissions Rates Constrained by Global Atmospheric Methane and Ethane. Environ. Sci. Technol. 2014, 48, 7714–7722. [Google Scholar] [CrossRef] [PubMed]
  32. Yang, Y. Study on Optimization Model and Performance Evaluation System of Urban Sewage Treatment in Northeast China. Ph.D. Thesis, HIT (Harbin Institute of Technology), Harbin, China, 2015. (In Chinese). [Google Scholar]
  33. Du, W. Primary Study on Greenhouse Gas—CH4 Emission from MSW Landfill. Master’s Thesis, Nanjing University of Information Science and Technology, Nanjing, China, 2006. (In Chinese). [Google Scholar]
  34. Liu, Z.; Guan, D.; Wei, W.; Davis, S.J.; Ciais, P.; Bai, J.; Peng, S.; Zhang, Q.; Hubacek, K.; Marland, G.; et al. Reduced Carbon Emission Estimates from Fossil Fuel Combustion and Cement Production in China. Nature 2015, 524, 335–338. [Google Scholar] [CrossRef] [PubMed] [Green Version]
  35. Gao, Q.X.; Du, W.P.; Lu, S.Q.; Zhang, Z.G.; Zhang, E.S.; Wu, J.G.; Ren, Z.H. Methane Emission from Municipal Solid Waste in China. Adv. Clim. Chang. Res. 2006, 2, 269–272. [Google Scholar]
  36. Hook, S.E.; Wright, A.-D.G.; McBride, B.W. Methanogens: Methane Producers of the Rumen and Mitigation Strategies. Archaea 2010, 2010, 945785. [Google Scholar] [CrossRef] [Green Version]
  37. Yan, Z.C.; Xie, T.Y.; Wang, R.; Tan, Z.L. Differences of Enteric Methane Emissions from Dairy Cows between Winter and Spring. Hunan Agric. Sci. 2015, 2, 50–54. (In Chinese) [Google Scholar]
  38. Ge, P. Methane oxidation capacity of landfill cover loess and its impact factors. China Environ. Sci. 2015, 2, 484–492. [Google Scholar]
  39. Gong, S.; Shi, Y. Evaluation of Comprehensive Monthly-Gridded Methane Emissions from Natural and Anthropogenic Sources in China. Sci. Total Environ. 2021, 784, 147116. [Google Scholar] [CrossRef]
  40. Fang, S.; Tans, P.P.; Yao, B.; Luan, T.; Wu, Y.; Yu, D. Study of Atmospheric CO2 and CH4 at Longfengshan WMO/GAW Regional Station: The Variations, Trends, Influence of Local Sources/Sinks, and Transport. Sci. China Earth Sci. 2017, 60, 1886–1895. [Google Scholar] [CrossRef]
  41. Ruckstuhl, A.F.; Henne, S.; Reimann, S.; Steinbacher, M.; Vollmer, M.K.; O’Doherty, S.; Buchmann, B.; Hueglin, C. Robust Extraction of Baseline Signal of Atmospheric Trace Species Using Local Regression. Atmos. Meas. Tech. 2012, 5, 2613–2624. [Google Scholar] [CrossRef] [Green Version]
  42. Li, M.; Liu, S.; Wu, X.; Sun, Y.; Hou, X.; Zhao, S. Temporal and spatial dynamics in the carbon footprint and its influencing factors of farmland ecosystems in Yunnan Province. Acta Ecol. Sin. 2018, 38, 8822–8834. [Google Scholar] [CrossRef]
Figure 1. Total CH4 emissions in the Heilongjiang province.
Atmosphere 14 00535 g001
Figure 2. CH4 emissions during the heating and non-heating periods in 2020.
Atmosphere 14 00535 g002
Figure 3. Spatial distribution of CH4 emissions.
Atmosphere 14 00535 g003
Figure 4. CH4 emissions by sectors: contribution rates of sectors.
Atmosphere 14 00535 g004
Figure 5. CH4 emissions from rice cultivation, 1990–2020.
Atmosphere 14 00535 g005
Figure 6. CH4 emissions from livestock sector, 1990–2020.
Atmosphere 14 00535 g006
Figure 7. CH4 concentrations and emissions in Heilongjiang province, 2009–2019.
Atmosphere 14 00535 g007
Figure 8. Contribution of CH4 to local GHGs emissions (heating period vs. non-heating period).
Atmosphere 14 00535 g008
Table 1. Emission factors of sectors.
SectorsEmission FactorsUnits
Rice cultivationWith organic input0.25g CH4 m−2 day−1
Without organic input0.12
LivestockSpeciesEnteric FermentationManure Management
Dairy cattle65.39.0kg CH4 head−1 year−1
Nondairy cattle45.20.8
Buffalo60.81.5
Sheep3.10.1
Goats2.70.1
Swine 0.50.8
Horse13.50.9
Donkey7.50.5
Mule7.50.5
Biomass BurningCorn StrawOpen Burning3.62 ± 2.20kg CH4 t−1
Biomass Fuel3.89 ± 2.20
Fuel Wood2.77 ± 1.80
Coal MiningUnderground Mining8.7636kg CH4 t−1
Strip Mining1.675
Handling & Processing Transportation0.8308
Oil and Gas
Exploitation
Oil2.9 kg CH4 m−3
Gas0.35 kt CH4 PJ−1
Landfill 0.018
Wastewater sectorB0MCFs
0.25 kg CH4 (kg COD)−10.165
0.467
0.1
Disclaimer/Publisher’s Note: The statements, opinions and data contained in all publications are solely those of the individual author(s) and contributor(s) and not of MDPI and/or the editor(s). MDPI and/or the editor(s) disclaim responsibility for any injury to people or property resulting from any ideas, methods, instructions or products referred to in the content.

