
Surface Wave Mixing Modifies Projections of 21st Century Ocean Heat Uptake
by
 , ,
, ,
Joshua Kousal
1,2,3,
Kevin J. E. Walsh
2,*,
Zhenya Song
4,5,6,
Qingxiang Liu
1,7,
Fangli Qiao
4,5,6 and
Alexander V. Babanin
1 1
Department of Infrastructure Engineering, University of Melbourne, Melbourne, VIC 3010, Australia
2
School of Earth Sciences, University of Melbourne, Melbourne, VIC 3010, Australia
3
ARC Centre of Excellence for Climate Extremes, University of New South Wales, Sydney, NSW 2052, Australia
4
The First Institute of Oceanography, Ministry of Natural Resources, Qingdao 266061, China
5
Laboratory for Regional Oceanography and Numerical Modeling, National Laboratory for Marine Science and Technology, Qingdao 266237, China
6
Key Laboratory of Marine Science and Numerical Modeling, Ministry of Natural Resources and Shandong Province, Qingdao 266061, China
7
Physical Oceanography Laboratory, Ocean University of China, Qingdao 266100, China
*
Author to whom correspondence should be addressed.
Atmosphere 2023, 14(3), 532; https://doi.org/10.3390/atmos14030532
Submission received: 30 January 2023
/
Revised: 23 February 2023
/
Accepted: 7 March 2023
/
Published: 10 March 2023
(This article belongs to the Special Issue Climate Change on Ocean Dynamics)
Abstract
:Climate models do not explicitly account for the smaller scale processes of ocean surface waves. However, many large-scale phenomena are essentially coupled with the waves. In particular, waves enhance mixing in the upper ocean and thereby accelerate the ocean response to atmospheric changes. Here, we introduced a representation of wave-induced turbulent mixing into the one-way coupled ACCESS-OM2-025 ocean model to study its effect on ocean heat content throughout the 21st century under the RCP4.5 scenario. We made two projections on ocean heat uptake for the end of the century: one which accounts for wave-induced mixing (the ‘modified’ projection) and the other which does not (the ‘standard’ projection). Both projections showed upper ocean heat content to increase by more than 2.2 × 10²² J. This projected ocean heat uptake was reduced by about 3% in the modified projection. Whilst the inclusion of wave-induced mixing reduces projected ocean heat uptake globally, some areas are expected to warm considerably faster, particularly the North Atlantic sub-tropics, the Tasman Sea, the Sea of Japan, and parts of the South Atlantic.
1. Introduction
Earth is experiencing a net warming at an unprecedented rate, predominantly due to anthropogenic causes [1]. This is dominated by ocean warming, which accounts for approximately 93% of the global energy change [2,3], with about 64% of this confined to the upper 700 m [3]. Understanding upper-ocean mixing, and thereby the movement of this heat energy, is crucial for accurate projections of not just ocean temperatures, but also atmospheric temperatures as 2–3 m of ocean water have the same heat capacity as the entire dry atmosphere [4,5].
Assuming the ocean has no internal (or benthic) heat sources or sinks, ocean heat content can be used to identify heat uptake through the surface. Ocean heat content (OHC) can be defined as
where θ is potential temperature, ρ is ocean water density and cp is specific heat capacity, x and y are horizontal, and z is vertical coordinates, respectively. Here, we assume density and specific heat capacity constant (ρ = 1025 kg m−3 and cp = 4186 J kg−1 K−1, respectively).
Recently, there was a pronounced increase in OHC in upper levels [3,6,7], with increases also observed in sub-thermocline [8,9] and into abyssal depths [10,11]. This increase in OHC had effects on almost all facets of global climate. One of the most important is global sea level rise, to which increasing OHC and the associated thermosteric expansion is a substantial contributor [2,12]. Sea level rise has widespread negative implications for many aspects of human society, including loss of agriculture land, salinization of soil and ground water, and damage to property and infrastructure [13]. Other important impacts of an increase in OHC include ocean acidification, reduction in extent of polar summer sea ice, and reduction in oceanic oxygen availability [14].
Surface waves play a key role in heat and other exchanges at the atmosphere–ocean interface [15]. Among these, waves can modify vertical mixing processes through providing additional turbulence in the upper layers of the ocean at the vertical scale of the wavelength (the depth scale of wave orbital motion). There are a number of mechanisms for such wave-turbulence production, the most general perhaps being the enhancement (instability) of pre-existing turbulence due to the wave orbital motion [16] and Langmuir turbulence [17]. The former, known as the Benilov mechanism, relies on the wave orbital motion which imparts energy into the turbulence by stretching vortex lines. The Langmuir turbulence is the fully turbulent flow associated with Langmuir circulation. Both predict that the intensity of wave turbulence increases depending on wave height, and in this study, we used experimental parameterizations [18,19] based on observations of such turbulence.
Recent inclusion of parameterizations of wave-orbital-induced mixing (hereafter “wave-induced mixing”) dramatically improved the accuracy of general circulation models [20,21,22] and demonstrated the ability of this mechanism to facilitate wave-turbulence related phenomena in other large-scale models such as sediment suspension [23], hurricane mixing through the thermocline [24], reduction in mixed layer depth biases [25,26], increased accuracy in the simulation of the seasonal cycle of Antarctic sea ice coverage [27], and increased accuracy in global sea surface temperature simulation [28].
Phase 6 of the Coupled Model Intercomparison Project (CMIP6) is the collection of models and climate projections which currently inform our best prediction of how the climate system may evolve throughout the 21st century [29]. Despite the important role that waves play in the upper ocean, there are only two CMIP6 contributions (of a total of more than 100) that include a wave model: FIO-ESM v2.0 and CESM2 [30,31]. Wave effects are not ignored completely in the remaining CMIP6 contributions, but rather implicitly accounted for in model tuning. Using these models for climate projections implicitly assumes a stationarity of wave climate. Wave height is increasing globally [32]; this is particularly true for extreme wave heights [33]. The wave climate is also projected to continue to change throughout the 21st century [34,35]. It is, therefore, possible that waves will contribute long term changes in atmospheric–ocean energy exchange. Is this something we can afford to ignore in our climate projections for the 21st century? To investigate this, we simulated two climate projections: one which accounted for wave-induced mixing and one which did not. We limited our focus here to the upper 200 m of the ocean, the region in which wave-induced mixing is most active.
2. Materials and Methods
The model used was ACCESS-OM2-025, a global coupled ocean-circulation and sea-ice model, comprised of the ocean component MOM5.1 and the sea-ice component CICE5. OASIS3-MCT passes information between the ocean and ice to form a coupled system. ACCESS-OM2-025 used 0.25° lateral resolution at the equator. The grid was tripolar (poles at 65° N, −100° E, 65° N, 80° E and the South Pole) using a Mercator projection between 65° N and 65° S (meridional grid spacing held constant south of 65° S), with 50 vertical levels [36]. The ocean is initialized with a 3-dimensional temperature and salinity field of January climatology at a resolution of 1° from the World Ocean Atlas (2009). The data were based upon in situ observations and can be obtained from the U.S. National Oceanographic Data Center at http://data.nodc.noaa.gov/woa/WOA09/ (accessed on 1 September 2018).
The vertical mixing within ACCESS-OM2-025 was represented by the one-dimensional General Ocean Turbulence Model (GOTM) [37], which also included the mixing contribution from surface waves using the parameterization of Ghantous and Babanin [38]. This observation-based parameterization represented the way in which the orbital motion of these waves can amplify pre-existing turbulence and was verified through its reduction in mixed layer depth biases [25], increase in global sea surface temperature accuracy [28], and increased accuracy in the seasonal cycle of Antarctic sea ice coverage [27]. The orbital motion was included as an extra term in the shear production (P) equation of the k-ε turbulence model setup within GOTM [39]. The parameterized form of shear production in GOTM is
where η is turbulent viscosity, M is shear frequency, α N2 is a parameterization of internal wave breaking and W is the new wave-induced mixing term, where W is parameterized as
where b is an empirical constant set to 0.0014 following Young et al. [40], k is wavenumber, ωp is peak angular frequency and HS is significant wave height. Peak angular frequency (hereafter ωp) refers to the spectral frequency of maximum wave power and is indicative of wave power and propagation speed.
The atmospheric forcings used in this study were produced using the First Institute of Oceanography—Earth System Model (FIO-ESM) of China, with a horizontal resolution of 2.875°, and a temporal resolution of 6 h [41]. FIO-ESM was run from 2006 to 2100 under emissions consistent with the RCP4.5 scenario. The atmospheric component used within FIO-ESM was version 3.0 of the Community Atmosphere Model (CAM 3.0). CAM 3.0 is the fifth generation of the global atmosphere model developed by the National Center for Atmospheric Research [42].
The wave data used in this study were produced using WAVEWATCH III [43] (hereafter WW3) forced with winds from the FIO-ESM climate run. WW3 was run at a spatial and temporal resolution of 1° and 6 h, respectively. For representation of sources and sinks of wave energy in WW3, the source term package ST6 was used [44]. This source-term package represents the physical processes of wind-wave interaction, whitecapping (dissipation due to breaking) and wave-turbulence interaction (swell dissipation) and has its roots in field and laboratory observations and experiments.
We examined whether the inclusion of wave-induced mixing would change the projections of future climate. Four simulations were run: present-day climate without wave-induced mixing (M1A), present-day climate with wave-induced mixing (M1B), future climate without wave-induced mixing (M2A), and future climate with wave-induced mixing (M2B). The first years of each simulation were discarded to ensure adequate model spin up (7 for the present-day climate simulations; 20 for the future climate simulations), allowing upper-ocean temperatures and global average turbulent kinetic energy to stabilize. Each simulation was then run for 20 years.
Note that this was only one-way coupling: atmosphere and waves directly influence ocean and ice, but ocean and ice do not affect atmosphere or waves, meaning no feedback between the ocean, atmosphere and surface waves.
3. Results
Table 1 shows the climatological mean of each of these four simulations, whilst Table 2 identifies the changes in OHC due to wave-induced mixing, i.e., the wave-induced heat. For the present-day climate period, we observed that inclusion of wave-induced mixing increased OHC by 5.58 × 10²² J, corresponding to an increase of about 0.1% of the total OHC. This increased OHC in the upper ocean was consistent with the results of Stoney et al. and Chen et al. [26,28], the latter of which used a two-way coupled ocean model, showing that this phenomenon is not unique to the one-way coupled ocean models.
We find the ocean to be similarly sensitive to wave-induced mixing in the future climate period, with an OHC increase of 5.52 × 10²² J. Comparing Table 1 and Table 2, we observed that the change in OHC due to changes in future climate (e.g., M2A minus M1A) is about 2.3 × 10²² J, while the change in OHC due to the introduction of wave-induced mixing was about three times as large (e.g., M1B minus M1A). This implied that it might be unwise to ignore wave-induced mixing as a component of the OHC energy balance.
Figure 1 shows the distribution of this additional heat, as well as the mixed layer depth for the winter and summer seasons for the control and the simulation with wave-induced mixing. Wave-induced mixing deepens the mixed layer in almost all areas (cf. purple and black lines in Figure 1). This was most prominent in the summer hemisphere mid-latitudes 40°–60° (the area where waves are largest and mixing is not dominated by winter hemisphere convective processes). The position of the additional wave-induced heat appeared to be dictated by the depth of the new summer mixed layer (purple dashed line in the SH; purple solid line in the NH), with almost all additional heat sitting below its base. It is worth reiterating here that the wave-induced mixing was active to depths of order 100 m. Whilst the wave-inducing mixing did not necessarily deepen the mixed layer to these depths, it could certainly have enhanced heat fluxes here. This lead to the considerable additional heat accumulation that we observed for the 25–100 m depth range, most pronounced in the latitudes 40° S–20° S. Neglecting to account for wave-induced mixing results in a substantially different ocean. This then begged the question: how does including wave-induced mixing modify projections of future climate?
In Table 3, we determined the climate change signal with wave-induced mixing (M2B − M1B; hereafter the ‘modified’ projection) and that without wave-induced mixing (M2A − M1A; hereafter the ‘standard’ projection). In both cases, there was projected increase in OHC of ~2.2 × 10²² J or ~0.03% by the end of the 21st century. The magnitude of this climate change signal was approximately one third the size of the wave-induced mixing signal (2.2 × 10²² J c.f. the 5.5 × 10²² J from Table 2). The difference between these two projections in ocean heat uptake was −6.00 × 10²⁰ J (the modified projection minus the standard projection). This was approximately 3% of the climate change signal, meaning that we observed 3% less ocean heat uptake in the modified projection. This heat may then remain in the atmosphere and could have implications for atmospheric temperatures. The amount of energy required to raise the temperature of the atmosphere by 1 °C is 5.95 × 10²¹ J, meaning that this additional heat in the atmosphere would lead to an additional ~0.1 °C atmospheric warming relative to current projections.
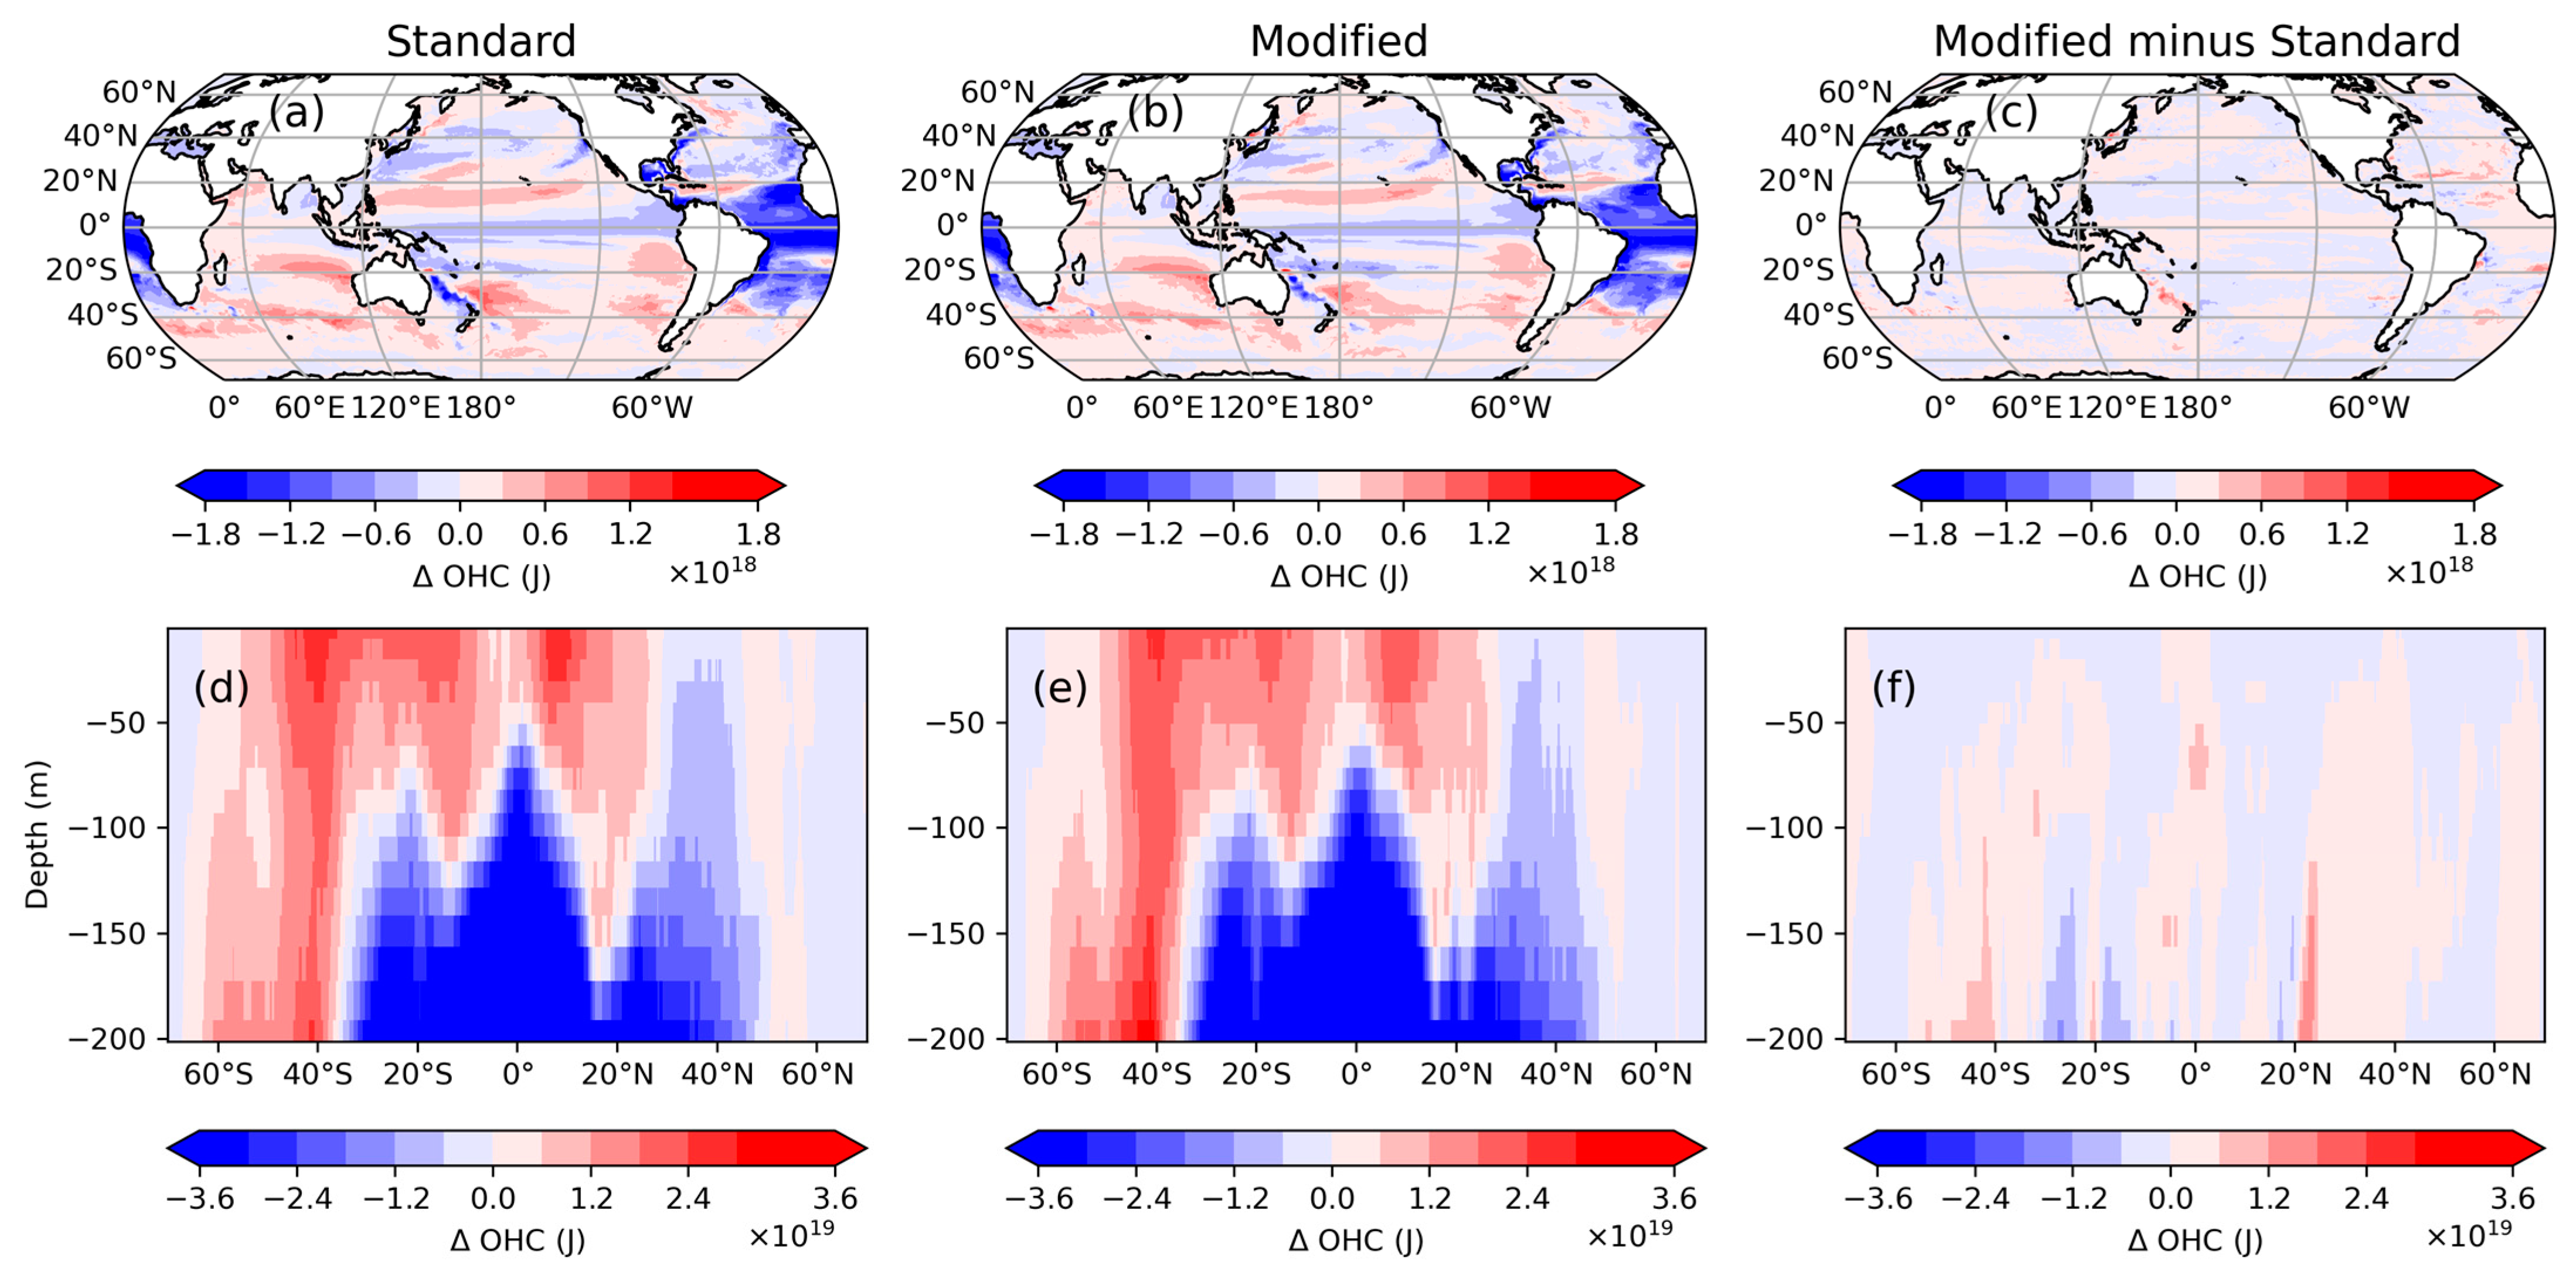
Figure 2a,b shows the geographical distribution of the OHC changes in the standard and modified projections. Both showed a warming throughout most of the global ocean, largest in the Southern Hemisphere mid-latitudes, especially within the Indian Ocean. Both projections also showed cooling about the equator, which was most pronounced in the Atlantic. The difference between these two projections is shown in Figure 2c. This was the effect of wave-induced mixing. The signal was somewhat mixed, with some regions showing a reduction in OHC uptake for the modified projection, and others showing an increase. The increases appeared more concentrated and of higher magnitude than the reductions. Areas of particular note here were the North Atlantic sub-tropics, the South Atlantic around the tip of South Africa, the Tasman Sea, and the Sea of Japan.
Figure 2d,e show how these projected changes were distributed vertically. Both the standard and modified projections showed a warming throughout the upper 100 m of most of the global ocean, most prominently in the mid-latitudes and tropics. This warming extended throughout the full 200 m in the Southern Hemisphere high latitudes. Underlying this surface warming, we observed strong cooling in the tropics and sub-tropics. This indicates that the Atlantic cooling seen in Figure 2a,b was confined to the 100–200 m depth range. Figure 2f shows the difference between these two projections (i.e., the effect of the wave-induced mixing). The warm spike between the depths of 100 to 200 m at approximately 20° N was associated with the feature previously noted in the North Atlantic in Figure 2c. We observed additional wave-induced heat throughout the column at approximately 40° S. This corresponded with the South Atlantic wave-induced warming seen in Figure 2c. We also noted that the wave-induced mixing lead almost exclusively to a cooling (albeit relatively weak) across the top 25 m of the ocean in the modified projection.
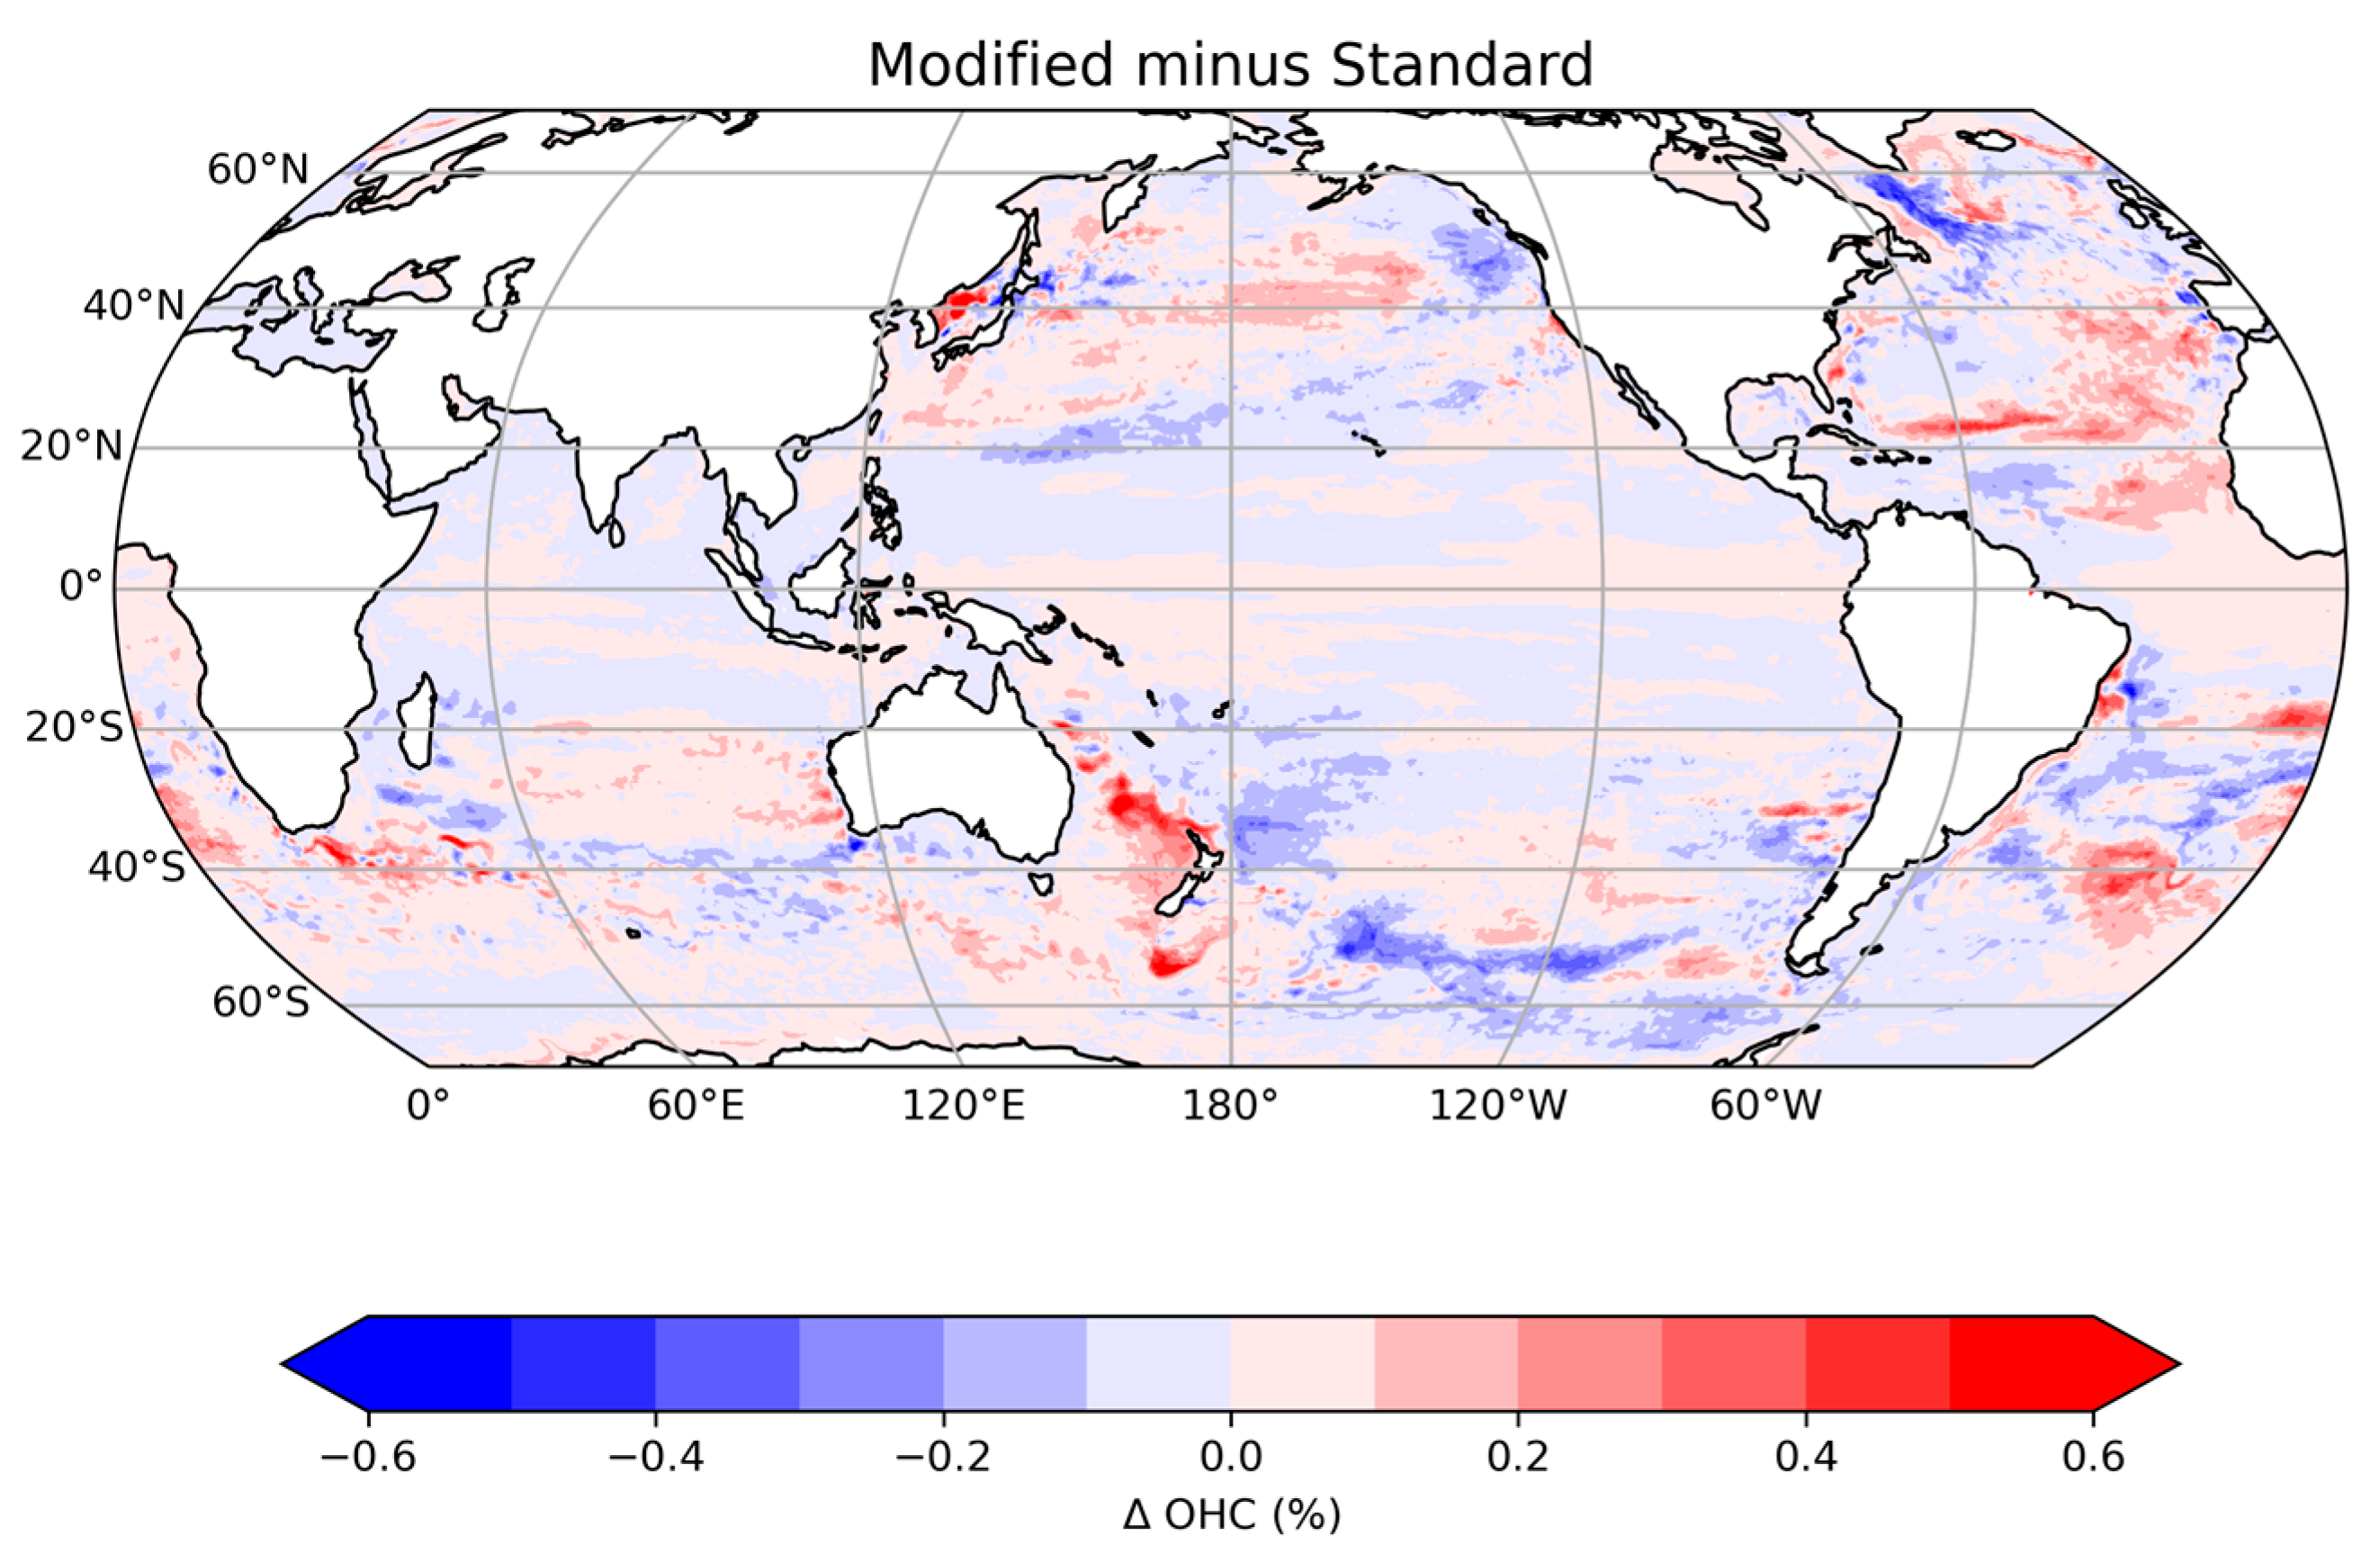
As in Figure 2c, Figure 3 shows the difference in OHC between the standard and modified projections but normalized as a percentage of present day OHC. The OHC changed due to wave-induced mixing being small in the tropics and large in the mid-latitudes. This was consistent with the global wave climatology: waves are small in the tropics and large in the mid-latitudes. In the South and North Atlantic mid-latitudes, there were widespread regions of OHC increases more than 0.2%. The effect of wave-induced mixing was even more prominent in the waters to the north and south of New Zealand with increases between 0.4% and 0.6%. There were increases of similar magnitude within the confined region of the Sea of Japan. There were fewer regions with large OHC decreases. The mid-latitude South Pacific was the most prominent with some decreases of 0.1% to 0.2%.
4. Conclusions and Discussion
Wave-induced mixing was introduced into the one-way coupled ACCESS-OM2-025 ocean model to study its effect on larger-scale ocean-atmosphere processes. First, we noted that wave-induced mixing substantially changed the mean-state of the upper ocean: the mixed layer deepened and a substantial amount of heat was brought down into its interior, most notably between the depths of 25–100 m and the latitudes 40° S–20° S. Upper Ocean Heat Content (OHC) increases by approximately 5.6 × 10²² J, or ~0.1%. This was three times the size of the expected climate change signal by the end of the 21st century under the RCP4.5 scenario.
To integrate wave-induced mixing into projections of 21st century ocean heat uptake, we considered two projections: the standard projection, which did not account for wave-induced mixing, and the modified projection, which did. Both projections showed an increase in OHC by the end of the 21st century of more than 2.2 × 10²² J. The modified projection, however, showed about 3% less ocean heat uptake than the standard. If this heat was to remain in the atmosphere, it would equate to an additional ~0.1 °C warming relative to current projections of atmospheric temperatures for the end of the 21st century. Although wave-induced mixing results in reduced global ocean heat uptake, there were regions in which OHC substantially increased, particularly the North Atlantic sub-tropics, the South Atlantic around the tip of South Africa, the Tasman Sea, and the Sea of Japan. Neglecting to account for wave-induced mixing may underestimate regionally stronger oceanic warming by the end of the century.
This was a sensitivity study using a one-way coupled ocean-atmosphere model, thereby neglecting feedbacks between ocean and atmosphere. The magnitude of the wave-induced mixing effect would be more accurately assessed by a two-way coupled ocean-atmosphere model.
With the two exceptions of FIO-ESM v2.0 and CESM2 [30,31], waves are routinely neglected in the more than 100 contributions to CMIP6. The CMIP project encompasses the state-of-the-art in 21st century climate projections. Such climate projections can only be relied upon if we are faithful to the underlying physics. This means explicit representations of waves and wave effects. Without this, we in the climate modelling community are assuming that waves and their effects will not change throughout this period. The wave climate is changing already [32,33], and is projected to continue to do so throughout the 21st century [34,35]. In this study, we showed that wave-induced mixing is a non-negligible part of the global heat and energy balance at these time scales.
This is the first study to investigate the importance of waves on 21st century climate projections. We limited our study here to wave-induced mixing. This is just one of the seven dominant ways in which waves play an important role in the climate system outlined in Cavaleri et al. [15]. These are listed here for completeness: (1) affecting momentum budget aloft, (2) wave-induced currents, (3) wave-induced mixing, (4) heat fluxes, (5) mass flux, (6) albedo, and (7) sea ice.
It is likely that the other six wave effects will have comparable impacts on 21st century climate projections to that shown here for wave-induced mixing. We, therefore, stress the importance of the inclusion of waves in 21st century climate projections and strongly encourage all contributors to the next phase of the CMIP project (CMIP7) to include a wave model and coupled wave effects.
Author Contributions
Conceptualization, A.V.B.; methodology, A.V.B. and K.J.E.W.; validation, J.K.; formal analysis, J.K.; investigation, J.K.; resources, A.V.B. and K.J.E.W.; data curation, Q.L., Z.S. and F.Q.; writing—original draft preparation, J.K.; writing—review and editing, J.K., A.V.B. and K.J.E.W.; visualization, J.K.; supervision, K.J.E.W. and A.V.B.; project administration, A.V.B.; funding acquisition, A.V.B. and K.J.E.W. All authors have read and agreed to the published version of the manuscript.
Funding
J.K. gratefully acknowledges the support of the Australia Research Council Centre of Excellence for Climate Extremes through an honours scholarship. A.V.B., Q.L., Z.S., and F.Q. acknowledge the support from the DISI Australia–China Centre through grant ACSRF48199, the U.S. Office of Naval Research Grant N00014-17-1-3021, and the National Natural Science Foundation of China Grant 41821004.
Data Availability Statement
All data produced during this work, including the files necessary to reproduce the result, can be obtained on request ([email protected]).
Acknowledgments
The authors would like to thank the Consortium for Ocean-Sea Ice Modelling in Australia (cosima.org.au, accessed on 1 February 2023) for the use of their 0.25° lateral resolution ocean model, ACCESS-OM2-025. This research was undertaken with the assistance of resources from the National Computational Infrastructure (NCI), which is supported by the Australian Government.
Conflicts of Interest
The authors declare no conflict of interest.
References
- IPCC. Climate Change 2014: Synthesis Report. Contribution of Working Groups I, II and III to the Fifth Assessment Report of the Intergovernmental Panel on Climate Change; Core Writing Team, Pachauri, R., Meyer, L., Eds.; IPCC: Geneva, Switzerland, 2014; 151p. [Google Scholar]
- Church, J.A.; White, N.J.; Konikow, L.F.; Domingues, C.M.; Graham Cogley, J.; Rignot, E.; Gregory, J.M.; van den Broeke, M.R.; Monaghan, A.J.; Velicogna, I. Revisiting the Earth’s Sea-Level and Energy Budgets from 1961 to 2008. Geophys. Res. Lett. 2011, 38. [Google Scholar] [CrossRef] [Green Version]
- Rhein, M.; Rintoul, S.R.; Aoki, S.; Campos, E.; Chambers, D.; Feely, R.A.; Gulev, S.; Johnson, G.C.; Josey, S.A.; Kostianoy, A.; et al. Observations: Ocean. In Climate Change 2013: The Physical Science Basis. Contribution of Working Group I to the Fifth Assessment Report of the Intergovernmental Panel on Climate Change; Stocker, T.F., Qin, D., Plattner, G.K., Tignor, M., Allen, S.K., Boschung, J., Nauels, A., Xia, Y., Bex, V., Midgley, P.M., Eds.; Cambridge University Press: Cambridge, UK; New York, NY, USA, 2013. [Google Scholar]
- Gill, A.E. Atmosphere–Ocean Dynamics; Elsevier: Amsterdam, The Netherlands, 1982. [Google Scholar]
- Soloviev, A.; Lukas, R. The Near-Surface Layer of the Ocean: Structure Dynamics and Applications; Springer: Berlin/Heidelberg, Germany, 2006. [Google Scholar]
- Domingues, C.M.; Church, J.A.; White, N.J.; Gleckler, P.J.; Wijffels, S.E.; Barker, P.M.; Dunn, J.R. Improved Estimates of Upper-Ocean Warming and Multi-Decadal Sea-Level Rise. Nature 2008, 453, 1090–1093. [Google Scholar] [CrossRef]
- Cheng, L.; Abraham, J.P.; Hausfather, Z.; Trenberth, K.E. How Fast Are the Oceans Warming? Science 2019, 363, 128–129. [Google Scholar] [CrossRef]
- Von Schuckmann, K.; Le Traon, P.Y. How Well Can We Derive Global Ocean Indicators from Argo Data? Ocean Sci. 2011, 7, 783–791. [Google Scholar] [CrossRef] [Green Version]
- Levitus, S.; Antonov, J.I.; Boyer, T.P.; Baranova, O.K.; Garcia, H.E.; Locarnini, R.A.; Mishonov, A.V.; Reagan, J.R.; Seidov, D.; Yarosh, E.S.; et al. World Ocean Heat Content and Thermosteric Sea Level Change (0–2000m), 1955–2010. Geophys. Res. Lett. 2012, 39. [Google Scholar] [CrossRef] [Green Version]
- Purkey, S.G.; Johnson, G.C. Warming of Global Abyssal and Deep Southern Ocean Waters between the 1990s and 2000s: Contributions to Global Heat and Sea Level Rise Budgets. J. Clim. 2010, 23, 6336–6351. [Google Scholar] [CrossRef] [Green Version]
- Kouketsu, S.; Doi, T.; Kawano, T.; Masuda, S.; Sugiura, N.; Sasaki, Y.; Toyoda, T.; Igarashi, H.; Kawai, Y.; Katsumata, K.; et al. Deep Ocean Heat Content Changes Estimated from Observation and Reanalysis Product and Their Influence on Sea Level Change. J. Geophys. Res. Ocean. 2011, 116, 1–16. [Google Scholar] [CrossRef]
- Church, J.; Clark, P.; Cazenave, A.; Gregory, J.; Jevrejeva, S.; Levermann, A.; Merrifield, M.; Milne, G.; Nerem, R.; Nunn, P.; et al. Sea Level Change. In Climate Change 2013: The Physical Science Basis. Contribution of Working Group I to the Fifth Assessment Report of the Intergovernmental Panel on Climate Change; Stocker, T.F., Qin, D., Plattner, G.K., Tignor, M., Allen, S.K., Boschung, J., Nauels, A., Xia, Y., Bex, V., Midgley, P.M., Eds.; Cambridge University Press: Cambridge, UK; New York, NY, USA, 2013; pp. 1137–1215. [Google Scholar]
- Oppenheimer, M.; Glavovic, B.; Hinkel, J.; van de Wal, R.; Magnan, A.; Abd-Elgawad, A.; Cai, R.; Cifuentes-Jara, M.; DeConto, R.; Ghosh, T.; et al. Sea Level Rise and Implications for Low-Lying Islands, Coasts and Communities. In IPCC Special Report on the Ocean and Cryosphere in a Changing Climate; Pörtner, H.O., Roberts, D.C., Masson-Delmotte, V., Zhai, P., Tignor, M., Poloczanska, E., Mintenbeck, K., Alegría, A., Nicolai, M., Okem, A., et al., Eds.; 2019; in press. [Google Scholar]
- Hoegh-Guldberg, O.; Jacob, D.; Taylor, M.; Bindi, M.; Brown, S.; Camilloni, I.; Diedhiou, A.; Djalante, R.; Ebi, K.; Engelbrecht, F.; et al. Impacts of 1.5 °C Global Warming on Natural and Human Systems. In Global Warming of 1.5 °C. An IPCC Special Report on the Impacts of Global Warming of 1.5 °C above Pre-Industrial Levels and Related Global Greenhouse Gas Emission Pathways, in the Context of Strengthening the Global Response to the Threat of Climate Change, Sustainable Development, and Efforts to Eradicate Poverty; Masson-Delmotte, V., Zhai, P., Pörtner, H.O., Roberts, D., Skea, J., Shukla, P.R., Pirani, A., Moufouma-Okia, W., Péan, C., Pidcock, R., et al., Eds.; 2018; in press. [Google Scholar]
- Cavaleri, L.; Fox-Kemper, B.; Hemer, M.A. Wind Waves in the Coupled Climate System. Bull. Am. Meteorol. Soc. 2012, 93, 1651–1661. [Google Scholar] [CrossRef]
- Benilov, A.Y. On the Turbulence Generated by the Potential Surface Waves. J. Geophys. Res. Ocean. 2012, 117. [Google Scholar] [CrossRef] [Green Version]
- McWilliams, J.C.; Sullivan, P.P.; Moeng, C.H. Langmuir Turbulence in the Ocean. J. Fluid Mech. 1997, 334, 1–30. [Google Scholar] [CrossRef] [Green Version]
- Babanin, A.V.; Ganopolski, A.; Phillips, W.R.C. Wave-Induced Upper-Ocean Mixing in a Climate Model of Intermediate Complexity. Ocean Model. 2009, 29, 189–197. [Google Scholar] [CrossRef]
- Ghantous, M.; Babanin, A.V. Ocean Mixing by Wave Orbital Motion. Acta Phys. Slovaca 2014, 64, 1–56. [Google Scholar] [CrossRef]
- Qiao, F.; Yuan, Y.; Yang, Y.; Zheng, Q.; Xia, C.; Ma, J. Wave-Induced Mixing in the Upper Ocean: Distribution and Application to a Global Ocean Circulation Model. Geophys. Res. Lett. 2004, 31. [Google Scholar] [CrossRef]
- Shu, Q.; Qiao, F.; Song, Z.; Xia, C.; Yang, Y. Improvement of MOM4 by Including Surface Wave-Induced Vertical Mixing. Ocean Model. 2011, 40, 42–51. [Google Scholar] [CrossRef]
- Huang, C.J.; Qiao, F.; Shu, Q.; Song, Z. Evaluating Austral Summer Mixed-Layer Response to Surface Wave-Induced Mixing in the Southern Ocean. J. Geophys. Res. Ocean. 2012, 117, 1–10. [Google Scholar] [CrossRef] [Green Version]
- Pleskachevsky, A.; Dobrynin, M.; Babanin, A.V.; Günther, H.; Stanev, E. Turbulent Mixing Due to Surface Waves Indicated by Remote Sensing of Suspended Particulate Matter and Its Implementation into Coupled Modeling of Waves, Turbulence, and Circulation. J. Phys. Oceanogr. 2011, 41, 708–724. [Google Scholar] [CrossRef]
- Toffoli, A.; McConochie, J.; Ghantous, M.; Loffredo, L.; Babanin, A.V. The Effect of Wave-Induced Turbulence on the Ocean Mixed Layer during Tropical Cyclones: Field Observations on the Australian North-West Shelf. J. Geophys. Res. Ocean. 2012, 117, 1–8. [Google Scholar] [CrossRef] [Green Version]
- Walsh, K.J.E.; Govekar, P.; Babanin, A.V.; Ghantous, M.; Spence, P.; Scoccimarro, E. The Effect on Simulated Ocean Climate of a Parameterization of Unbroken Wave-Induced Mixing Incorporated into the k-Epsilon Mixing Scheme. J. Adv. Model. Earth Syst. 2017, 9, 1–24. [Google Scholar] [CrossRef]
- Chen, S.; Qiao, F.; Huang, C.; Song, Z. Effects of the non-breaking surface wave-induced vertical mixing on winter mixed layer depth in subtropical regions. J. Geophys. Res. Oceans 2018, 123, 2934–2944. [Google Scholar] [CrossRef] [Green Version]
- Thomas, S.; Babanin, A.V.; Walsh, K.J.E.; Stoney, L.; Heil, P. Effect of Wave-Induced Mixing on Sea Ice in a High-Resolution Ocean Model. Ocean Dyn. 2019, 69, 737–746. [Google Scholar] [CrossRef]
- Stoney, L.; Walsh, K.J.E.; Thomas, S.; Spence, P.; Babanin, A.V. Changes in Ocean Heat Content Caused by Wave-Induced Mixing in a High-Resolution Ocean Model. J. Phys. Oceanogr. 2018, 48, 1139–1150. [Google Scholar] [CrossRef]
- Eyring, V.; Bony, S.; Meehl, G.A.; Senior, C.A.; Stevens, B.; Stouffer, R.J.; Taylor, K.E. Overview of the Coupled Model Intercomparison Project Phase 6 (CMIP6) experimental design and organization. Geosci. Model Dev. 2016, 9, 1937–1958. [Google Scholar] [CrossRef] [Green Version]
- Bao, Y.; Song, Z.; Qiao, F. FIO-ESM version 2.0: Model description and evaluation. J. Geophys. Res. Oceans 2020, 125, e2019JC016036. [Google Scholar] [CrossRef]
- Danabasoglu, G.; Lamarque, J.-F.; Bacmeister, J.; Bailey, D.A.; DuVivier, A.K.; Edwards, J.; Emmons, L.K.; Fasullo, J.; Garcia, R.; Gettelman, A.; et al. The Community Earth System Model Version 2 (CESM2). J. Adv. Model Earth Syst. 2020, 12, e2019MS001916. [Google Scholar] [CrossRef] [Green Version]
- Young, I.R.; Zieger, S.; Babanin, A.V. Global Trends in Wind Speed and Wave Height. Science 2011, 332, 451–455. [Google Scholar] [CrossRef] [PubMed]
- Young, I.R.; Ribal, A. Multi-Platform Evaluation of Global Trends in Wind Speed and Wave Height. Science 2019, 364, 548–552. [Google Scholar] [CrossRef]
- Hemer, M.A.; Fan, Y.; Mori, N.; Semedo, A.; Wang, X.L. Projected future changes in wind-wave climate in a multi-model ensemble. Nat. Clim. Chang. 2013, 3, 471–476. [Google Scholar] [CrossRef]
- Meucci, A.; Young, I.R.; Hemer, M.; Trenham, C.; Watterson, I.G. 140 Years of Global Ocean Wind-Wave Climate Derived from CMIP6 ACCESS-CM2 and EC-Earth3 GCMs: Global Trends, Regional Changes, and Future Projections. J. Clim. 2023, 36, 1605–1631. [Google Scholar] [CrossRef]
- Kiss, A.E.; Hogg, A.M.; Hannah, N.; Boeira Dias, F.; Brassington, G.B.; Chamberlain, M.A.; Chapman, C.; Dobrohotoff, P.; Domingues, C.M.; Duran, E.R.; et al. ACCESS-OM2: A Global Ocean-Sea Ice Model at Three Resolutions. Geosci. Model Dev. 2020, 13, 401–442. [Google Scholar] [CrossRef] [Green Version]
- Umlauf, L.; Burchard, H. Second-Order Turbulence Closure Models for Geophysical Boundary Layers. A Review of Recent Work. Cont. Shelf Res. 2005, 25, 795–827. [Google Scholar] [CrossRef]
- Ghantous, M.; Babanin, A.V. One-Dimensional Modelling of Upper Ocean Mixing by Turbulence Due to Wave Orbital Motion. Nonlinear Process. Geophys. 2014, 21, 325–338. [Google Scholar] [CrossRef] [Green Version]
- Umlauf, L.; Bolding, K.; Burchard, H. GOTM scientific documentation, Version 4.0. Available online: www.gotm.net (accessed on 1 February 2023).
- Young, I.R.; Babanin, A.V.; Zieger, S. The Decay Rate of Ocean Swell Observed by Altimeter. J. Phys. Oceanogr. 2013, 43, 2322–2333. [Google Scholar] [CrossRef]
- Qiao, F.; Song, Z.; Bao, Y.; Song, Y.; Shu, Q.; Huang, C.J.; Zhao, W. Development and Evaluation of an Earth System Model with Surface Gravity Waves. J. Geophys. Res. Ocean. 2013, 118, 4514–4524. [Google Scholar] [CrossRef]
- Collins, W.D.; Rasch, P.J.; Boville, B.A.; Hack, J.J.; McCaa, J.R.; Williamson, D.L.; Kiehl, J.T.; Briegleb, B. Description of the NCAR Community Atmosphere Model (CAM 3.0). NCAR Technol. Note 2004, 226, 1326–1334. [Google Scholar] [CrossRef]
- Tolman, H.L.; The WAVEWATCH III Development Group. User Manual and System Documentation of WAVEWATCH III Version 5.16; Environmental Modeling Center, Marine Modeling and Analysis Branch, National Centers for Environmental Prediction: College Park, MD, USA, 2016.
- Liu, Q.; Rogers, W.E.; Babanin, A.V.; Young, I.R.; Romero, L.; Zieger, S.; Qiao, F.; Guan, C. Observation-Based Source Terms in the Third-Generation Wave Model WAVEWATCH III: Updates and Verification. J. Phys. Oceanogr. 2019, 49, 489–517. [Google Scholar] [CrossRef]
Figure 1.
Wave-induced Ocean Heat Content (OHC) for present-day climate, shown by the difference between the control simulation and the wave-induced mixing simulation (wave-induced mixing minus control). Red indicates a wave-induced increase in OHC; blue indicates a decrease. Lines show the depth of the seasonal mixed layer: black lines are used for the control, purple lines are used for the wave-induced mixing simulation, dashed lines are used for the DJF months and solid lines are used for the JJA months. OHC is accumulated over all longitudes globally and mixed layer depth is a zonal average.

Figure 2.
(a) Projected change in climatological mean Ocean Heat Content (OHC) for the simulation without wave-induced mixing (M2A − M1A; Standard). OHC is accumulated over the upper 200 m. (b) Projected change in climatological mean OHC for the simulation with wave induced mixing (M2B − M1B; Modified). OHC is accumulated over the upper 200 m. (c) The difference between the projected changes in climatological mean OHC for the simulations with and without wave induced mixing (Modified minus Standard). OHC is accumulated over the upper 200 m. (d) Projected change in climatological mean OHC for the simulation without wave-induced mixing (M2A − M1A; Standard). OHC is accumulated over all longitudes globally. (e) Projected change in climatological mean OHC for the simulation with wave induced mixing (M2B − M1B; Modified). OHC is accumulated over all longitudes globally. (f) The difference between the projected changes in climatological mean OHC for the simulations with and without wave induced mixing (Modified minus Standard). OHC is accumulated over all longitudes globally.

Figure 3.
Difference between the climatological mean projected changes in Ocean Heat Content (OHC) for simulations without wave-induced mixing (Standard) and with wave induced mixing (Modified). Red indicates a wave-induced increase in projected ocean heat uptake; blue indicates a decrease. This difference is normalized by present day OHC (M1A). OHC is accumulated over the upper 200 m.


Table 1.
A description of the four simulations. Ocean Heat Content (OHC) is the mean heat content within the upper 200 m of the ocean.
Table 1.
A description of the four simulations. Ocean Heat Content (OHC) is the mean heat content within the upper 200 m of the ocean.
| Simulation | Years | Description | OHC (J) |
|---|---|---|---|
| M1A | 2014–2034 | Present-day climate without wave-induced mixing | 6.67467 × 1025 |
| M1B | 2014–2034 | Present-day climate with wave-induced mixing | 6.68025 × 1025 |
| M2A | 2080–2100 | Future climate without wave-induced mixing | 6.67694 × 1025 |
| M2B | 2080–2100 | Future climate with wave-induced mixing | 6.68246 × 1025 |
Table 2.
Changes in Ocean Heat Content (OHC) due to wave-induced mixing for the present-day and future climates. OHC is the mean heat content within the upper 200 m of the ocean.
Table 2.
Changes in Ocean Heat Content (OHC) due to wave-induced mixing for the present-day and future climates. OHC is the mean heat content within the upper 200 m of the ocean.
| Comparison | Description | ∆OHC |
|---|---|---|
| (M1B − M1A) | Wave-induced heat (present-day climate; total) | 5.58 × 10²² J |
| (M1B − M1A)/M1A | Wave-induced heat (present-day climate; relative) | 0.0836% |
| (M2B − M2A) | Wave-induced heat (future climate; total) | 5.52 × 10²² J |
| (M2B − M2A)/M2A | Wave-induced heat (future climate; relative) | 0.0827% |
Table 3.
Projections of changes in Ocean Heat Content (OHC) for the future climate period. OHC is the mean heat content within the upper 200 m of the ocean.
Table 3.
Projections of changes in Ocean Heat Content (OHC) for the future climate period. OHC is the mean heat content within the upper 200 m of the ocean.
| Comparison | Description | ∆OHC |
|---|---|---|
| (M2A − M1A) | The ‘standard’ projection: expected OHC increase by the end of the 21st century under RCP4.5 | 2.27 × 10²² J |
| (M2B − M1B) | The ‘modified’ projection: expected OHC increase by the end of the 21st century under RCP4.5 if wave-induced mixing is accounted for | 2.21 × 10²² J |
| (M2B − M1B) − (M2A − M1A) | Difference between the standard and modified projections of ocean heat uptake by the end of the 21st century, i.e., the effect of wave-induced mixing (total) | −6.00 × 10²⁰ J |
| ((M2B − M1B) − (M2A − M1A))/(M2A − M1A) | Difference between the standard and modified projections of ocean heat uptake by the end of the 21st century, i.e., the effect of wave-induced mixing (relative) | −2.64% |
Disclaimer/Publisher’s Note: The statements, opinions and data contained in all publications are solely those of the individual author(s) and contributor(s) and not of MDPI and/or the editor(s). MDPI and/or the editor(s) disclaim responsibility for any injury to people or property resulting from any ideas, methods, instructions or products referred to in the content. |
© 2023 by the authors. Licensee MDPI, Basel, Switzerland. This article is an open access article distributed under the terms and conditions of the Creative Commons Attribution (CC BY) license (https://creativecommons.org/licenses/by/4.0/).
Share and Cite
MDPI and ACS Style
Kousal, J.; Walsh, K.J.E.; Song, Z.; Liu, Q.; Qiao, F.; Babanin, A.V. Surface Wave Mixing Modifies Projections of 21st Century Ocean Heat Uptake. Atmosphere 2023, 14, 532. https://doi.org/10.3390/atmos14030532
AMA Style
Kousal J, Walsh KJE, Song Z, Liu Q, Qiao F, Babanin AV. Surface Wave Mixing Modifies Projections of 21st Century Ocean Heat Uptake. Atmosphere. 2023; 14(3):532. https://doi.org/10.3390/atmos14030532
Chicago/Turabian StyleKousal, Joshua, Kevin J. E. Walsh, Zhenya Song, Qingxiang Liu, Fangli Qiao, and Alexander V. Babanin. 2023. "Surface Wave Mixing Modifies Projections of 21st Century Ocean Heat Uptake" Atmosphere 14, no. 3: 532. https://doi.org/10.3390/atmos14030532
Note that from the first issue of 2016, this journal uses article numbers instead of page numbers. See further details here.