Article

Characterization of Soot Loading and Filtration Efficiency of a Gasoline Particulate Filter with Photoacoustic Sensor and Particle Number Counting Systems

1
Department of Modern Mechanical Engineering, Waseda University, Tokyo 169-8555, Japan
2
Mechanical Engineering Course, Kokushikan University, Tokyo 154-8515, Japan
3
AVL List GmbH, 8020 Graz, Austria
*
Author to whom correspondence should be addressed.
Atmosphere 2023, 14(3), 476; https://doi.org/10.3390/atmos14030476
Submission received: 31 January 2023 / Revised: 17 February 2023 / Accepted: 22 February 2023 / Published: 28 February 2023
(This article belongs to the Special Issue Vehicle Emissions: New Challenges and Potential Solutions)

Abstract

:
An optimum operation of a gasoline particulate filter (GPF) for a gasoline direct injection vehicle in terms of its performance of pressure drop, soot loading, and filtration efficiency becomes inevitable to fulfill upcoming emission regulations. This paper proposes a methodology to characterize the GPF performance for validation of simulation models for more precise operation strategies along with future legislative requirements. The feasibility was examined through experiments of miniature GPF samples using a synthetic particle generator. Firstly, permeability of the GPF walls was estimated to be 6.9 ± 1.5 × 10⁻¹³ m2 by a flow resistance descriptor model, which was in good agreement with its pore structure. Secondly, photoacoustic sensor systems indicated soot accumulation inside the GPFs in real time thanks to linear correlations between sensor signals and soot mass concentrations in exhaust. Thirdly, particle number counting systems compliant with respective regulatory technical requirements exhibited time-resolved filtration efficiencies of the GPFs in conjunction with solid particle number emissions whose diameter was larger than 10 nm and 23 nm. The filtration efficiencies at a clean state of the GPF were 0.78 and 0.77, respectively. The slight difference could be explained by Brownian diffusion and interception for particle filtration.

1. Introduction

Particulate matter (PM) has been classified as a group 1 carcinogen and a major harmful component to human health [1]. Additionally, ultrafine particles remain a threat to deep deposits in the lungs and penetrate the bloodstream to cause cardiovascular disease leading to premature death [2,3]. It has been considered for decades that a major contribution to PM pollution in ambient air comes from fuel-powered engines and vehicles [4]. Thus, a reduction of the PM emissions from engines and vehicles in the size range of several tens of nanometers has been a major challenge to improving ambient air quality.
Introductions of stringent emission regulations for the engine and vehicle exhaust from their tailpipe have been driving progress on emission control technologies and contributed to the improvement of ambient air quality. The European Commission first introduced the PM emission regulation for diesel light-duty (LD) vehicles as new type approvals in 1992 [5] and its limits have subsequently reduced to the current one of 4.5 mg/km [6]. For gasoline direct injection (G-DI) LD vehicles, the PM emission regulation started in 2009 with a limit of 5 mg/km and it was reduced to 4.5 mg/km in 2011 [7].
Meanwhile, the PM emission control technology for engines and vehicles has drastically become advanced since the 1980s. Many efforts had been devoted to an understanding of fundamental phenomena for the performance of honeycomb structure and wall-flow diesel particulate filters (DPFs) consisting of ceramic porous media [8,9,10,11,12,13,14,15,16,17,18,19,20]. Konstandopoulos and Johnson (1989) [8] first illustrated the filtration of particles through the porous media based on a unit collector model. Pressure drop induced by the PM-loaded DPFs was precisely investigated by both experiments and simulations [11,12,14,15,20], and permeability of the porous DPF walls was regarded as one of the major contributors to the pressure drop [14,16]. Much research has been implemented for validations of the models with their characterizations and these models have played an important role in the applications of diesel engines and vehicles. Thanks to these efforts, the DPFs were introduced to the diesel LD vehicle market in 2000 [21,22] for the first time, and, since then, the deployment of the DPFs has appeared indispensable.
Once DPFs were widely accepted by the market, a more precise measurement methodology of PM emission was desired in order to quantify its low concentration close to the ambient air level out of DPFs. The particle measurement programme (PMP) under the United Nations Economic Commission for Europe (UNECE) established a solid particle number (SPN) measurement methodology as the advanced technology to detect a much lower concentration of the particles in exhaust [23]. It targets only the solid particles composed of mainly soot in an accumulation mode whose diameter is larger than 23 nm (hereinafter SPN23) because volatile particles such as nitrates and sulfates in a nucleation mode deteriorate the repeatability of particle number measurements. In order to ensure repeatability, the volatile ones are excluded by dilutions and thermal treatments of sample gas through the particle number counting system. The SPN emission regulation first came into force for diesel LD vehicles in 2011 [7] with a limit of 6 × 10¹¹ particles/km, which is more stringent than the PM one. It prevailed in the G-DI LD vehicles in 2014 [24] as well as in heavy-duty (HD) and non-road mobile machinery (NRMM) engines in 2013 and 2019, respectively [25,26]. The SPN measurement methodology further extended to on-board measurements using a portable emissions measurement system (PEMS) and the SPN emissions must comply with a real driving emission (RDE) regulation in a wider range of conditions compared to laboratory testing [27,28,29]. It has been leading the need of equipment of gasoline particulate filters (GPFs) in the G-DI LD vehicles [30].
The GPFs are nowadays of interest as an effective technology to reduce the PM emission from the G-DI vehicles. A lot of research has been conducted for the optimum operation [31,32,33,34,35]. Due to a limitation of back pressure for the G-DI vehicles, the GPFs are required to have a lower pressure drop compared to the DPFs, which results in a lower filtration efficiency. It causes a major challenge of the filtration efficiency at clean state or after regeneration. The G-DI engines demonstrate lower PM emission than the diesel ones. Soot accumulation inside the GPFs rises quite slowly in most of the operation time while they can be regenerated in a passive way by fuel cut-offs frequently during the operation. These characteristics force the GPFs to be operated in the clean state despite the fact that the filtration efficiency tends to be lower than that of the DPFs.
On the 11th of November in 2022, the European Commission announced that the new legislation of Euro 7 would come into force for the LD and HD vehicles from July 2025 and 2027, respectively [36]. It includes that the target of the SPN emission regulation is the particles larger than 10 nm (hereinafter SPN10) [37,38] instead of 23 nm due to the fact that the ultrafine particles should be more harmful to human health. Moreover, the SPN10 emission in real driving conditions will be covered under a conformity factor of 1 instead of 1.5, which is considered as a margin of measurement uncertainties of the on-board PEMS compared to instruments used in laboratory testing. It has been reported that challenges remain to make the GPF technology meet the future SPN emission requirements. The SPN10 emission was increased by around 50% compared to the SPN23 one [39,40]. The G-DI engines emit significant amount of PM in the case of the cold start under low ambient temperature and aggressive driving styles, which must be covered as extended boundary conditions specified by the Euro 7 proposal [41,42]. The optimum GPF structure to enhance the filtration efficiency at the clean state and the precise calibration based on simulation models are necessary to meet the upcoming future legislative requirements.
However, a methodology to determine a small amount of soot accumulation inside the GPF is weighing itself before and after the soot loading. This is less precise compared to weighing a DPF which usually loads a larger amount of the soot and is actively regenerated when the soot accumulation reaches the threshold. It is essential to monitor the soot accumulation to guarantee for the optimum operation in terms of pressure drop and filtration efficiency as well as for the avoidance of failure caused by uncontrolled regeneration. The weighing method needs meticulous care to avoid interference of artifacts and moisture as well as convection, buoyancy, and static electricity around the balance. Nevertheless, the weighing by balance with the care is not reliable when it comes to the measurement of the targeted amount of the soot inside the GPFs. Additionally, fundamental studies on the validation of the filtration models for the operation strategies are currently scarce from a viewpoint of the SPN10 measurements. The simulation results should be compared by the measurement results through corresponding instrumentation.
The purpose of this research is to propose a methodology to characterize the GPF performance of the pressure drop, soot loading, and filtration efficiencies in terms of SPN10 and SPN23. This paper deals with experiments of miniature GPF samples using a synthetic particle generator at a constant flow rate in order to generalize the particle emission behaviors before and after the GPF and to validate the feasibility of the proposed methodology. A flow resistance descriptor model [14] was applied to the pressure drop induced by the honeycomb-shaped GPF samples without using the particle generator to estimate the permeability of the GPF walls, which is a fundamental parameter for the pressure drop. Sensor signals of photoacoustic sensor systems (AVL Micro Soot Sensor 2: MSS2 model 497) [43] were examined by comparing soot mass concentrations in the exhaust and they were used for the experiments to monitor time-resolved soot loading inside the GPF samples. Simultaneous measurements of SPN10 and SPN23 by particle number counting systems (AVL Particle Counter: APC model 489) [44], which are compliant with technical requirements of the UNECE global technical regulation No. 15 (GTR15)-Amendment 6 [45], were demonstrated for the experiments to investigate the filtration efficiencies in conjunction with both SPN10 and SPN23. One of each system was sampling at the inlet and the outlet of the GPF sample. The subtraction of the inlet emissions from the outlet ones expresses the soot accumulation inside the GPF sample and the filtration efficiencies. The proposed methodology in this research can be standardized for the characterization of the GPF performance instead of current implementations. The results obtained through the methodology must be more practical to validate the simulation models, and they will enable us to create optimum operation strategies of the GPF along with the upcoming emission regulation in future work.

2. Materials and Methods

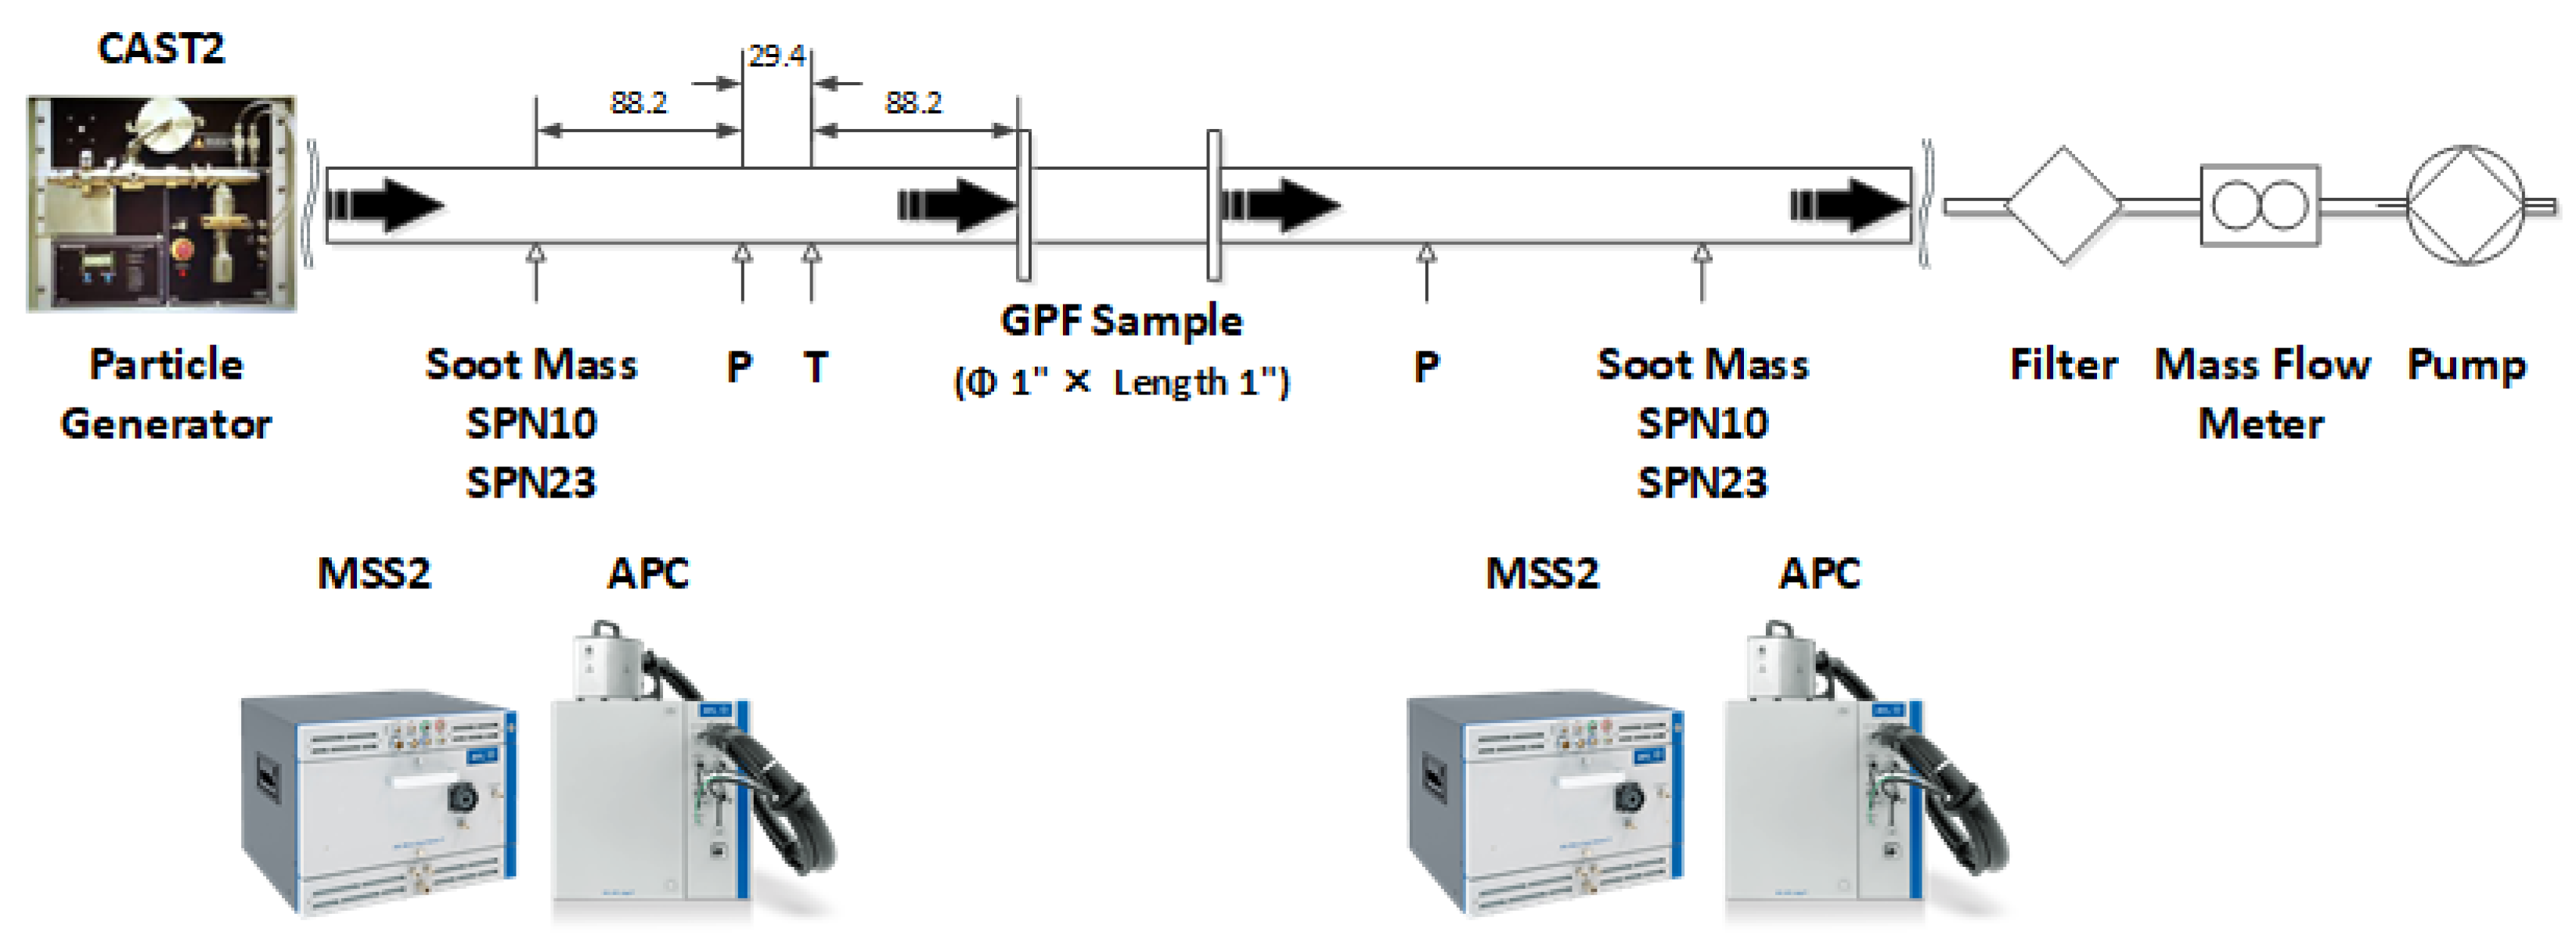
2.1. Experimental Layout

GPF samples in diameter and length of one inch each were analyzed to evaluate permeability of the porous GPF walls and to monitor soot loading and filtration efficiencies in terms of SPN10 and SPN23 in real time. Figure 1 illustrates an experimental layout of the testing and Table 1 lists specifications of the GPF samples.
Firstly, ambient air was introduced to the GPF sample by a pump and the pressure drop caused by the sample was measured as a function of air flow rate. Diameter of a pipe upstream and downstream of the sample was 1.5 inches so that the pressure drop induced by the pipe geometry can be avoided, which was not relevant to the one caused by the sample. Relative pressures were measured at 5 × pipe inner diameter upstream and downstream of the sample where the flow was fully developed. The permeability was calculated from the pressure drop and the air flow rate in accordance with a flow resistance descriptor method [14].
Secondly, the soot loading was observed when synthetic particles were accumulated into the GPF samples. A combustion aerosol standard (CAST) manufactured by Matter Engineering AG was used for the synthetic particle generation, which is based on a principle of a laminar co-flow diffusion flame. It has a burner inside and it produces diffusion flame by oxidation reactions of C3H8 and air. The flame is quenched by continuous flow of N2 gas at a certain height of the flame so that primary soot particles can be generated. The primary particles are coagulated with each other due to their high number density and form particle agglomerates, which are similar to the PM emitted by internal combustion engines in terms of their morphology and chemical compositions. Their size distribution can be adjusted by changing the quenching position in the flame. In our experiments, a CAST operating point of mean diameter of 60 nm was chosen as it matches to the size range of the particles emitted by G-DI engines [46]. The pressure drop induced by the GPF samples along with the soot loading and the gas flow rate were again measured as mentioned above. To monitor the transient soot loading inside the sample, two photoacoustic sensor systems of MSS2 were equipped at inlet and outlet of the sample, respectively. It detects time-resolved soot mass concentration in the gas with negligible interference to other components such as water by a photoacoustic principle [43] as described later.
Thirdly, the filtration efficiencies in terms of the SPN10 and SPN23 were evaluated in real time. Two particle number counting systems of APC [23] were deployed at inlet and outlet of the sample, respectively. Each of them simultaneously measures the SPN10 and SPN23 concentrations in the gas in compliance with technical requirements of the UNECE GTR15 [45] as described later. All the sampling points were located 5 × inner diameter of the pipe upstream and downstream of those of the relative pressure sensors so that the instruments could extract the sample gas at the position where the flow was stabilized. The time-resolved soot mass as well as the SPN10 and SPN23 emissions were obtained by multiplication of the concentrations and the flow rates. Afterward, the soot loading as well as the filtration efficiencies of both SPN10 and SPN23 were derived by subtracting the emissions at inlet from the ones at outlet.

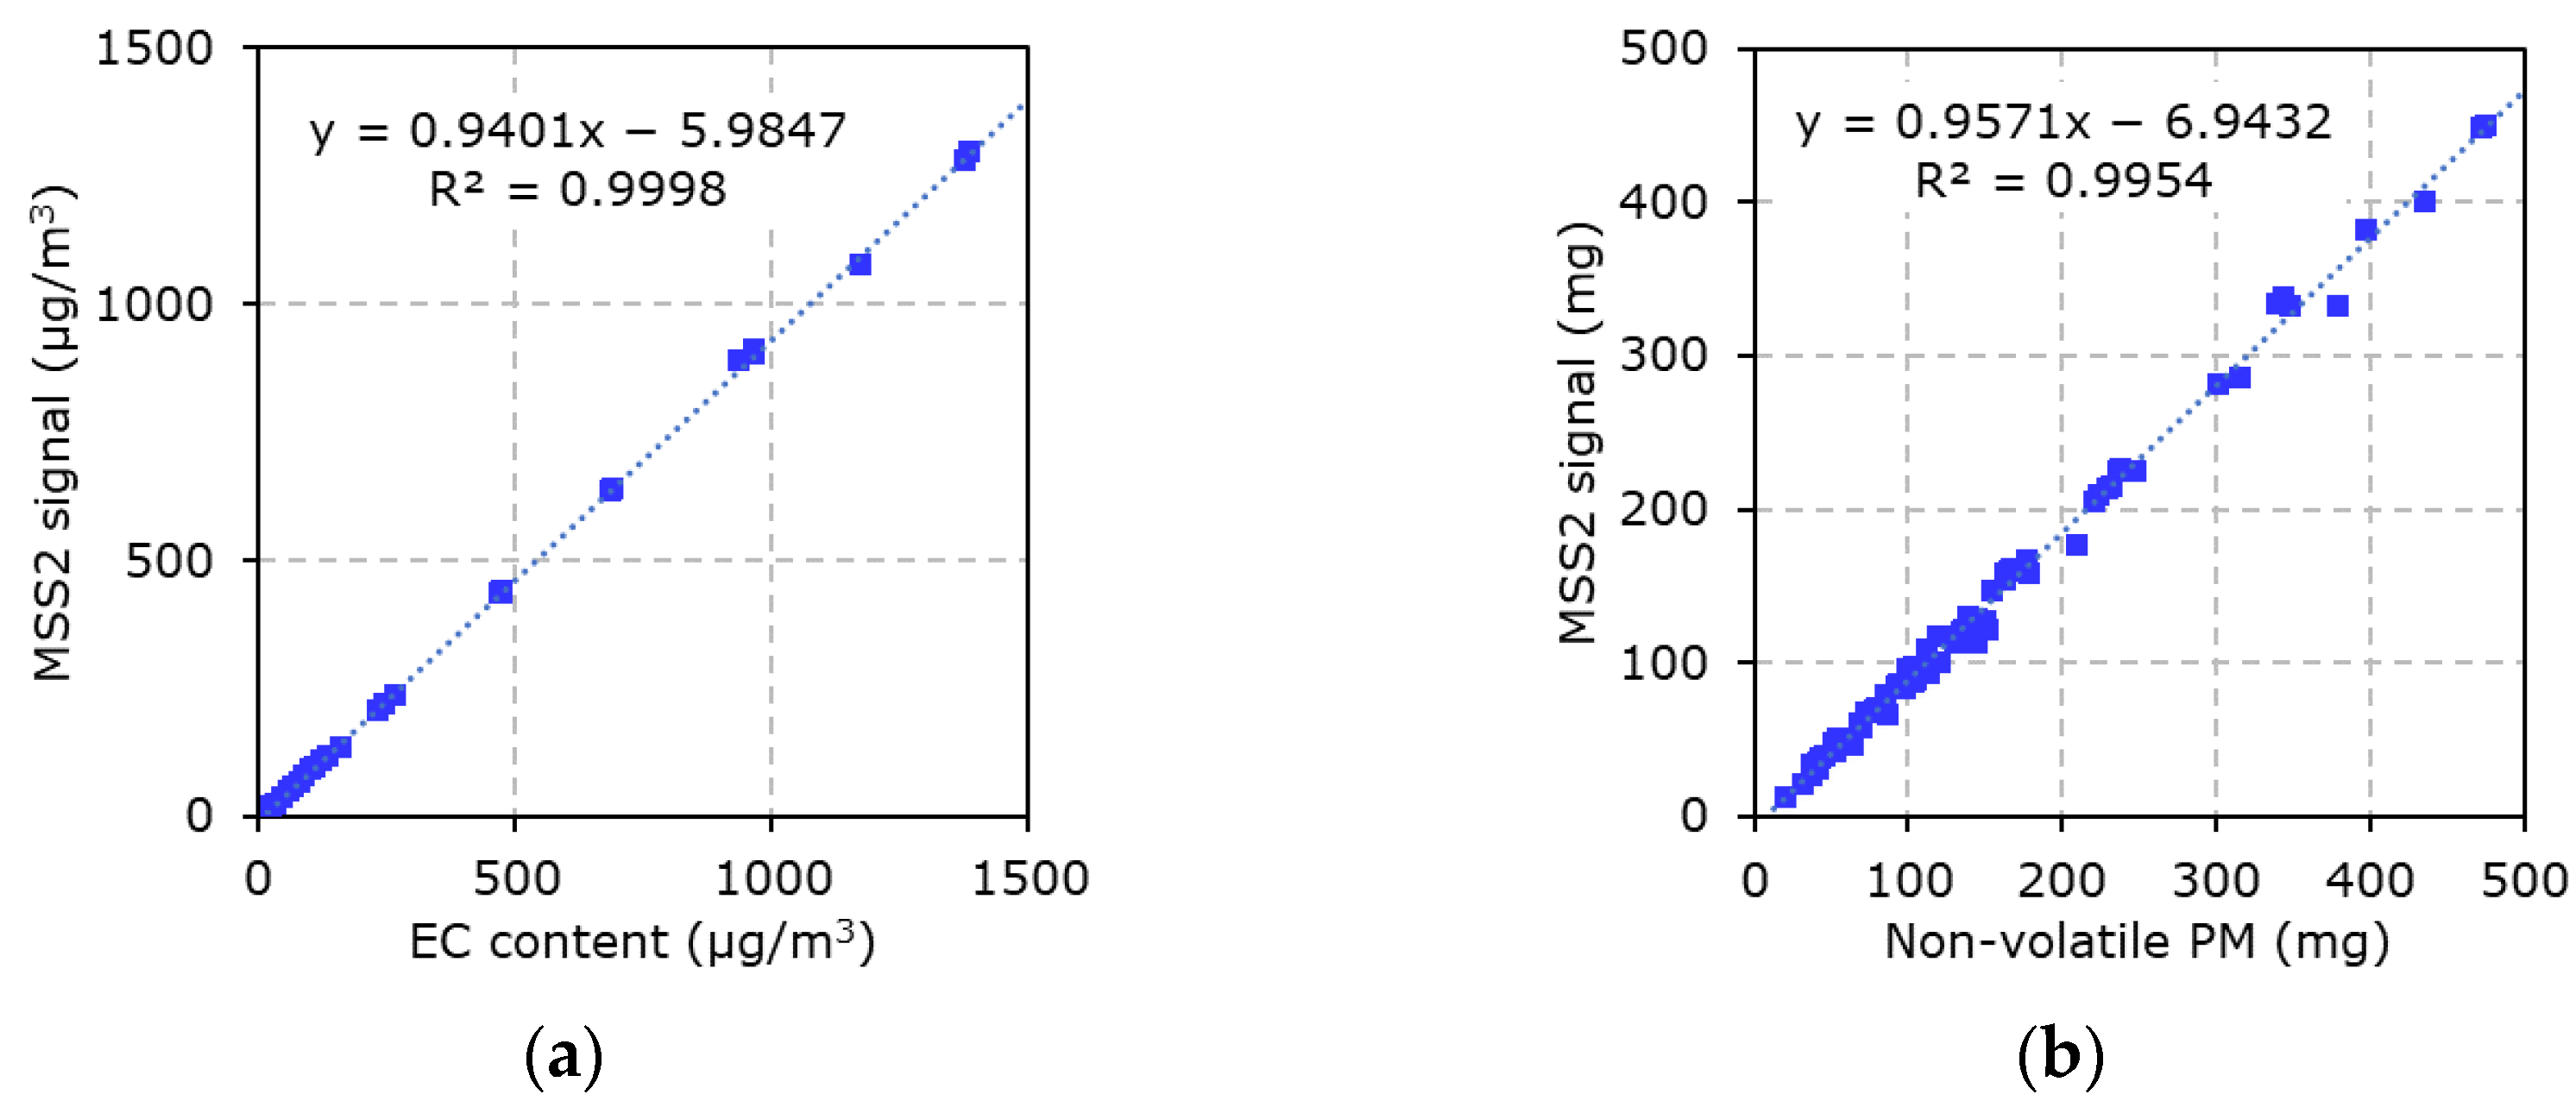
2.2. Photoacoustic Sensor System

The time-resolved signals of the soot mass concentration in the gas were obtained by the MSS2 which is based on the photoacoustic principle [43]. The device offers a detection limit of 0.001 mg/m3. The exhaust gas containing the soot is partially extracted, and then it is diluted with air by an internal dilutor of the MSS2. It subsequently passes through a resonant cell where it is periodically irradiated by an 808 nm laser beam. The soot particles in the gas absorb the radiation and heat is released to surrounding gas due to its excitation. This causes periodic expansion and contraction of the gas resulting in pressure waves, which are detected by a microphone inside the resonant cell. The acoustic signal amplitude rises proportionally as a function of the soot mass concentration in the gas irrespective of soot particle size and morphology. Soot-free filtered air is used to zero out any contaminations periodically and to correct for signal drifts.
It has been confirmed that interferences to other engine exhaust gas components are very low for the soot measurements by the photoacoustic principle [43]. An absorption coefficient of soot emitted from diesel engines in diameter of several tens of nanometers is constant within ±10%. The adsorption of hydrocarbons on the surface of the soot particles up to its mass fraction of 85% does not affect the absorption coefficient. Tests with synthetic gasses such as H2O, CO, CO2, NO, NO2, N2O, NH3, CH4O, C3H8, and C7H8 have shown that cross-sensitivities to any of these substances are mostly negligible for the measurements of the soot mass concentration in exhaust gas of diesel or gasoline engines.
Soot generated by a CAST, which is subsequently diluted in a mixing chamber, serves as calibration aerosol for the MSS2. Optical properties of the CAST soot particles are comparable to those emitted by diesel engines. A semi-continuous organic carbon (OC)/elemental carbon (EC) analyzer using a thermal and optical transmittance (TOT) method is used to produce the calibration reference. The analyzer provides the content of the EC which is identical to the soot in the exhaust gas sample by pyrolysis in a certain temperature protocol. The MSS2 is calibrated against the EC content. In parallel, a gravimetric measurement of a loaded filter is conducted in accordance with the international organization for standardization (ISO) 16183 to check the validity of the calibration.
A linear correlation between MSS2 signals and EC contents was confirmed in terms of their soot mass. Exhaust gas with particles generated by a mini-CAST of Jing Engineering was diluted and fed to both MSS2 and OC/EC analyzer of Sunset Laboratory in parallel. A part of the exhaust gas was extracted before the dilution to vary the soot mass concentration levels. Both instruments were operated and synchronized during the experiment at each concentration level. For the determination of the EC mass concentration, the particles on a filter inside the analyzer were firstly heated up to 800 °C in helium atmosphere and an OC content was analyzed by measuring a CO2 emission. Secondly, it was again heated up to 800 °C in oxygen and helium atmosphere, and EC content was examined by again measuring the CO2 emission. Laser light transmission was simultaneously monitored to correct for pyrolysis of the OC. Then, the derived EC mass was divided by the sample flow volume resulting in an averaged EC mass concentration in μg/m3. Figure 2a shows a correlation of the MSS2 signals to the EC contents determined by the abovementioned TOT method. According to a linear regression method, the slope and the intercept of the correlation were 0.9401 and −5.9847, respectively. Additionally, the square of the Pearson correlation coefficient (R2) was 0.998. These results indicate the inherent linear relationship between the MSS2 signals and the soot mass concentrations in the gas. Differences of the slope and the intercept could be attributed to a calibration uncertainty of the MSS2 before the testing as well as measurement uncertainties of the MSS2 and the OC/EC analyzer including the integrated sample flow volume rate during the testing.
A linear correlation between MSS2 signals and non-volatile PM mass from diesel engines was also observed. Emission testing of diesel engines was executed over new European driving cycles (NEDCs) and their exhaust gases were sampled for both MSS2 and filter for its gravimetric PM measurements through a constant volume sampler (CVS) tunnel. The MSS2 signals in mg/m3 multiplied by diluted exhaust gas flow volume over the cycle were integrated to derive soot mass in mg per test. The PM collected on the filter was heated to 200 °C in a vacuum oven to evaporate the organic fraction and subsequently weighed as a part of only non-volatile particles of the PM. The linear regression was applied to the results in a range from approximately 19 to 475 mg to evaluate the correlation of the MSS2 signals to the non-volatile PM weights. As a result, the slope and R2 were 0.9571 and 0.9954, respectively (Figure 2b). This result also expresses that the MSS2 signals and the weights of the non-volatile PM emitted by the diesel engines linearly correlate with each other.

2.3. Particle Number Counting System

The SPN10 and SPN23 concentrations in the gas were simultaneously measured by APC which is compliant with the UNECE GTR15 [23,45]. It consists of a two-stage dilution system, a so-called volatile particle remover (VPR), and two types of particle number counters (PNCs).
The VPR dilutes the gas and removes volatile particles in the sample gas in order to detect only solid particles subsequently by PNCs for an enhancement of the repeatability of particle number concentration measurements. It is composed of a particle number diluter (PND) 1, an evaporation tube (ET) with a catalytic stripper (CS), and a PND2. The PND1 heats the sample gas at 155 °C and dilutes it by 10 to 1000 ratios with compressed air filtered by high-efficiency particulate air (HEPA) filters in order to avoid water contamination and to minimize particle losses which affect measurement uncertainties. Afterward, the sample gas passes through the ET with the CS at temperature of 350 °C in order to sufficiently vaporize and oxidize the volatile particles in the sample gas. It is subsequently diluted and cooled down by the PND2 by a ratio of 10 to 20 with the compressed air through HEPA filters at room temperature so that the PNCs downstream of the PND2 can measure the SPN concentration in the sample gas adequately in terms of its concentration levels and sample gas temperature. The VPR fulfills more than 99.9% removal efficiency of tetracontane (CH3(CH2)38CH3) particles with count median diameter larger than 50 nm and mass concentration more than 1 mg/m3.
Particle number concentration reduction factors (PCRFs) have been introduced to adequately express the dilution of the sample gas containing aerosol with respect to a particle number concentration [23]. The APC applies the PCRFs determined by its calibration to the SPN measurement values in accordance with the UNECE GTR15 [45]. The PCRFs include not only dilution ratios but also particle losses which occur on any materials contacting the sample gas inside the instrument by nature. It is defined as a ratio of particle number concentrations between inlet and outlet of the VPR using sample gases with the mono-disperse particles in diameters of 15 nm, 30 nm, 50 nm, and 100 nm, respectively. A total PCRF, which is calculated by averaging the PCRFs of the particles at 30 nm, 50 nm, and 100 nm, is applied to the particle number concentrations measured by the PNCs in order to employ the ones in the exhaust gas adequately. Additionally, a penetration efficiency of more than 70% at mono-disperse particles in diameter of 100 nm should be achieved in order to avoid an excess underestimation of the measurements. Moreover, the PCRFs of the mono-disperse particles in diameter of 15 nm, 30 nm, and 50 nm should be less than 100%, 30%, and 20%, respectively, compared to the PCRF of the one at 100 nm.
The PNCs downstream of the VPR count the number of particles by means of condensation particle counter (CPC) principle [23]. The APC equips two units of AVL CPC. They comprise a saturator, a condenser, and optics with a detector. Heterogenous nucleation carries out around the nanoparticles in the sample gas by saturation of a working fluid (butanol) in the saturator at temperature of approximately 38 °C. They are transferred to the condenser whose temperature is lower than that of the saturator to drive supercooling of the butanol and its growth. They subsequently pass through the optics with the detector where the enlarged particles by the butanol scatter beam from the optics and the caused light pulses are detected for particle number counting.
Both the PNCs are calibrated in accordance with ISO 27891:2015 for cut-off sizes of 10 nm and 23 nm, respectively. One of the PNCs is calibrated with a counting efficiency of 65 ± 15% at 10 nm particles and more than 90% at 15 nm ones in accordance with the UNECE GTR15 [45]. Another PNC has a counting efficiency of 50 ± 12% at 23 nm particles and more than 90% at 41 nm ones according to the UNECE GTR15 [45]. Both the PNCs have a linear response and counting efficiencies within ±10% against a calibrated aerosol electrometer up to their single particle count mode of 30,000 particles/cm3. Six particle number concentration levels are confirmed for the PNC calibration. They include a zero one measured with air passing through a HEPA filter. R2 of the two data sets between testing PNC and electrometer is more than 0.97. The slope from the linear regression of the two data sets is regarded as a calibration factor and applied to the PNC measurement values.

3. Results

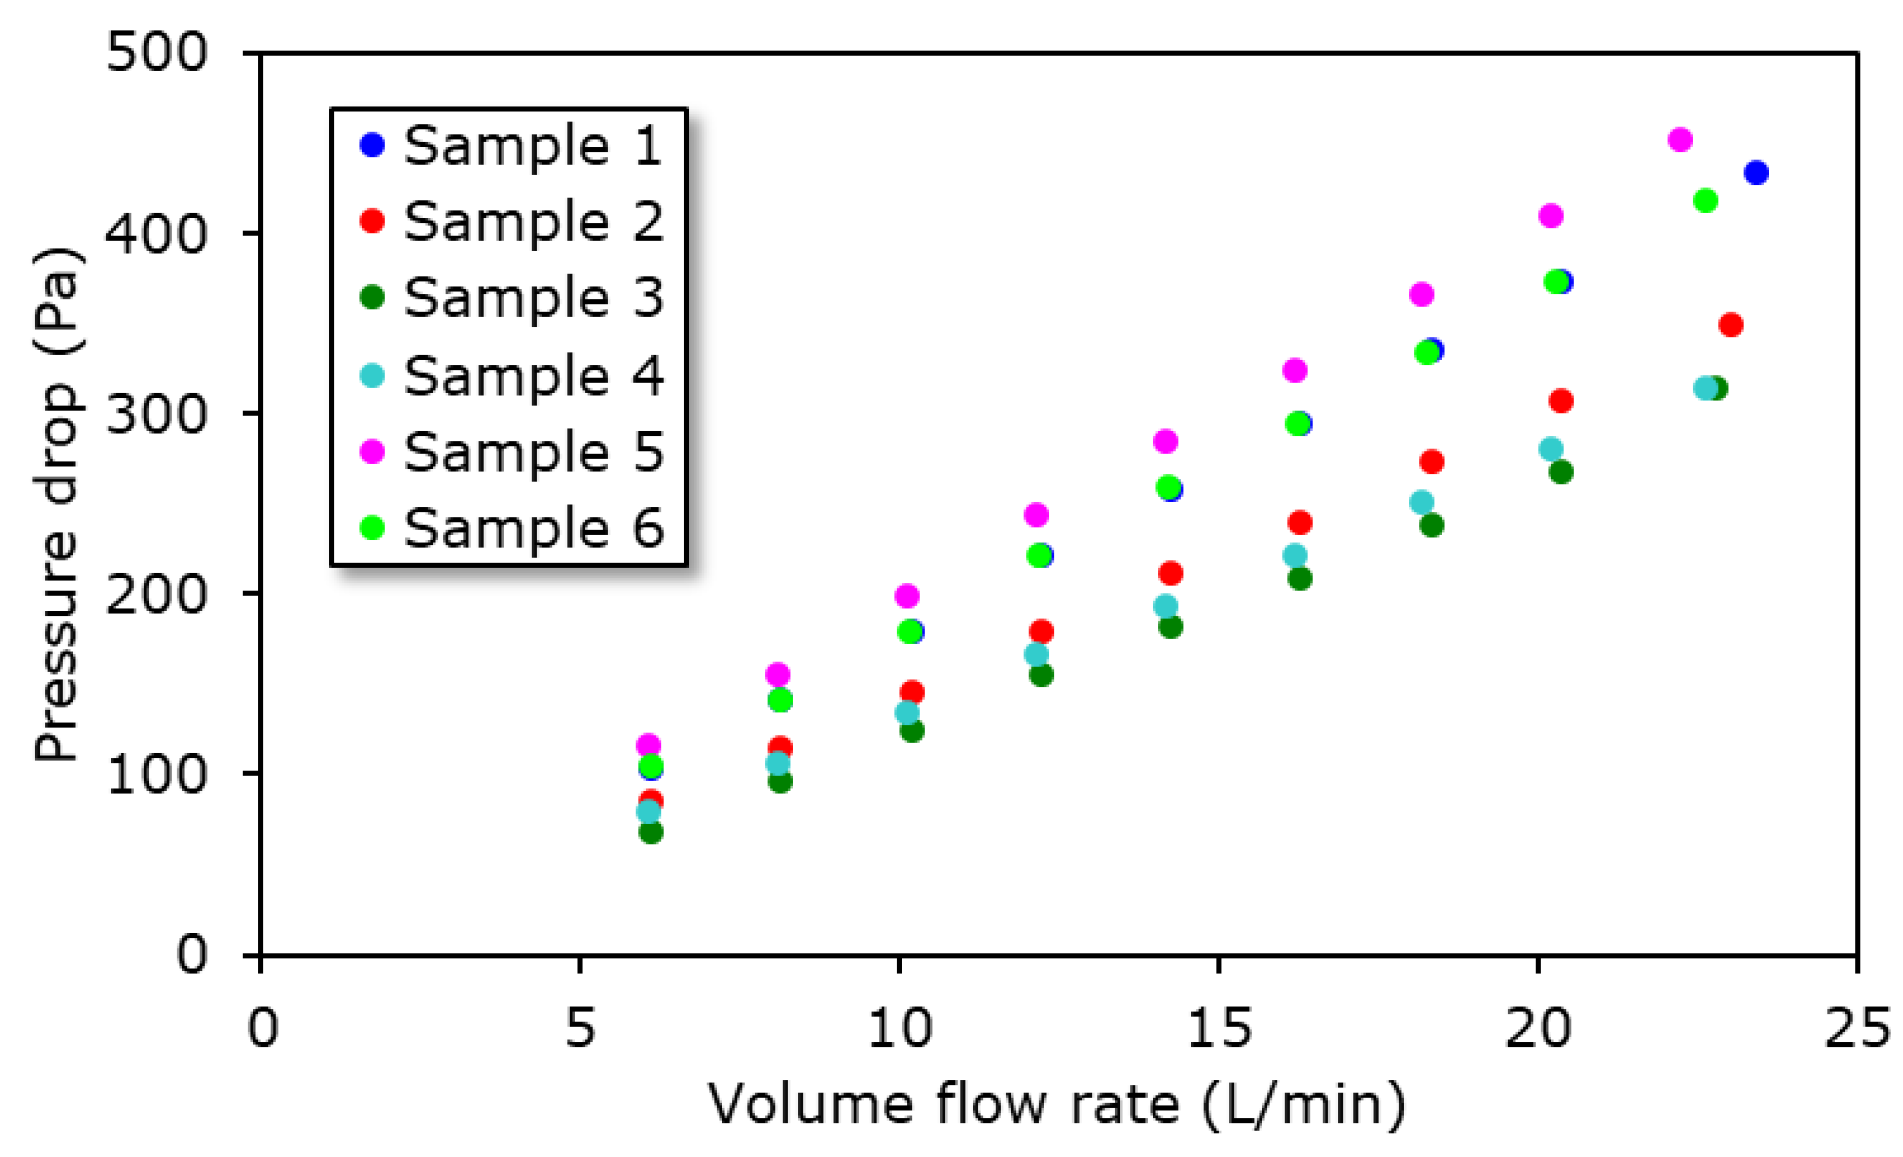
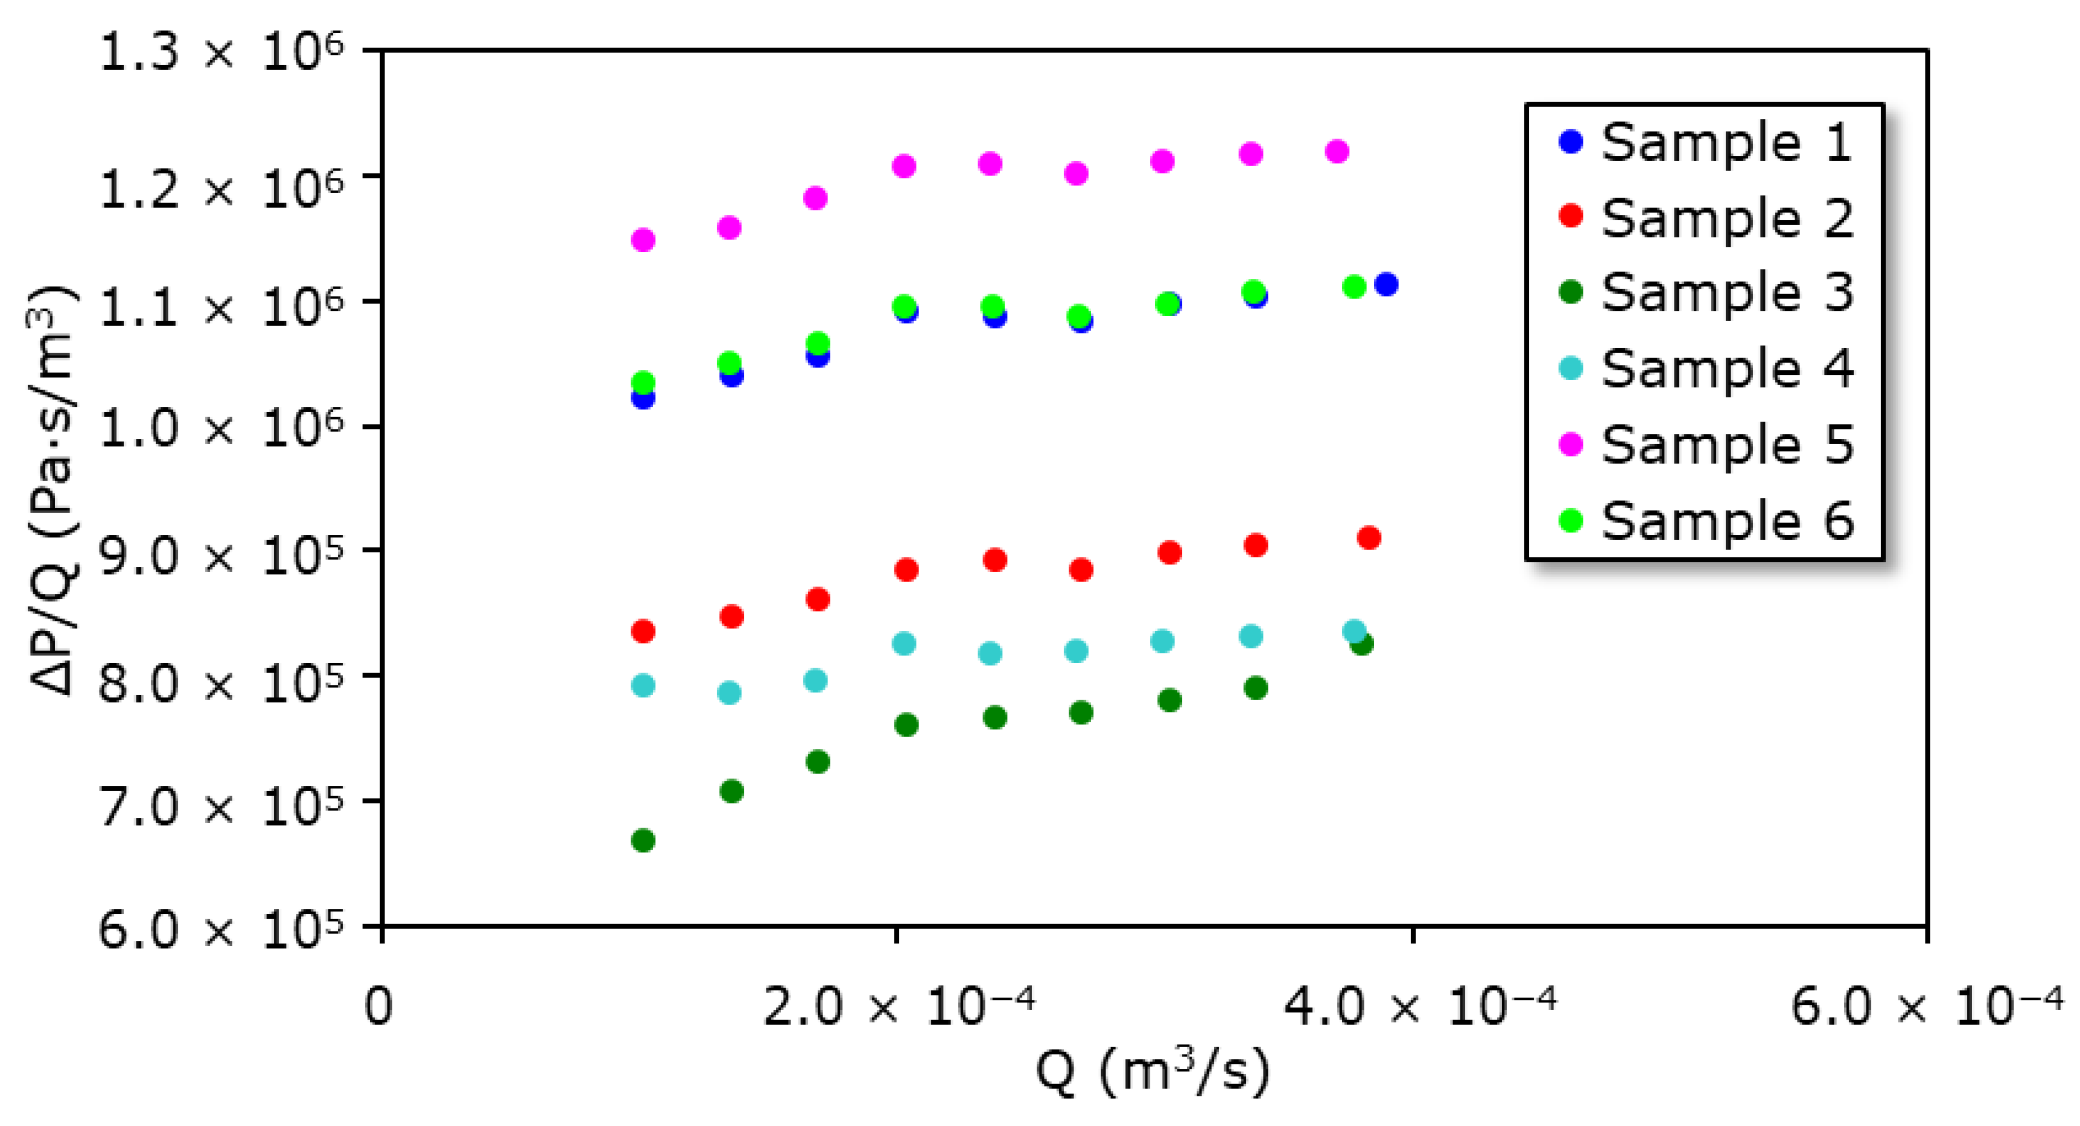
3.1. Pressure Drop of GPF Samples in Clean State

The pressure drop of the GPF samples with clean air is shown in Figure 3 as a function of the air volume flow rate. Before the testing, a leak check of the apparatus by compressed air was performed. In total, six samples were tested for the permeability evaluation. The range of the volume flow rate was around 6.0 to 23.4 L/min which corresponds to a space velocity (SV) of 47,000 to 206,000 1/h. The results of the pressure drop varied because of the difference in each sample shape such as diameter and length. Inertial losses cannot be recognized for each sample in Figure 3, which will be discussed later.

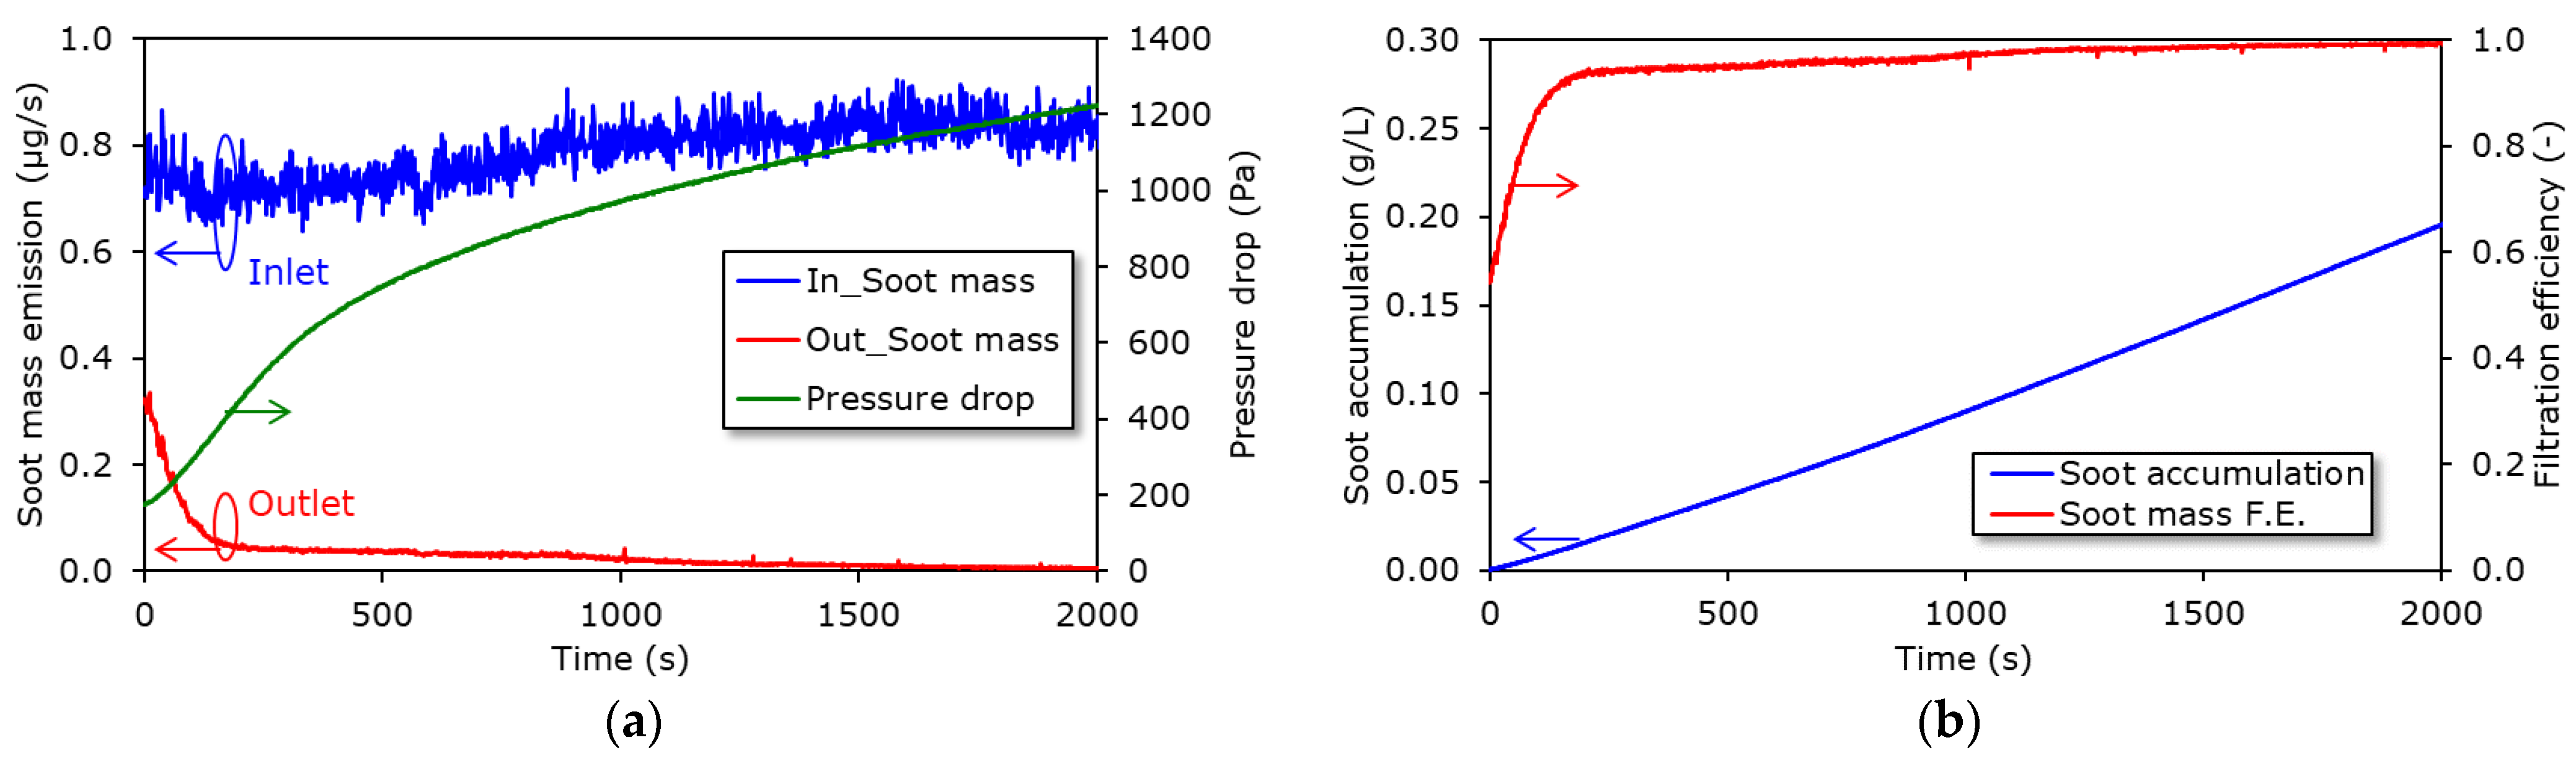
3.2. Soot Loading of GPF Samples

Figure 4 shows time-resolved soot mass emissions and soot accumulation inside a GPF sample. The soot mass emissions illustrated in Figure 4a were measured upstream and downstream of the GPF sample. The pressure drop induced by the sample is also added to Figure 4a. The soot mass emission upstream of the sample was kept stable at around 0.789 μg/s during the experiment from 0 to 2000 s. The soot mass emission behind the sample dropped from 0.311 μg/s initially to 0.056 μg/s already at 150 s. Afterward, it slightly decreased to 0.005 μg/s towards the end of the experiment where the soot concentration reached the detection limit of the instrument. The pressure drop was around 153 Pa at the beginning of the experiment, and then it gradually increased to approximately 1200 Pa at the end of the experiment as the soot accumulated inside the sample. Its increment can be distinguished as two slopes, although the transition was not clear: the first increment was rather steeper than the latter one. The time-resolved soot accumulation inside the GPF sample as well as its soot mass filtration efficiency is shown in Figure 4b. The soot accumulated linearly throughout the experiment, and it reached around 0.19 g/L at the end of the experiment. The filtration efficiency of the soot mass rapidly increased from 0.56 in the clean state of the GPF sample to 0.92 at 150 s, and then it rose slightly and linearly towards the end of the experiment.

3.3. Filtration Efficiencies of GPF Samples in Terms of SPN10 and SPN23

Figure 5 depicts the SPN10 and SPN23 emissions and their filtration efficiencies of a GPF sample. The SPN10 and SPN23 emissions at each inlet and outlet point of the GPF sample as well as the pressure drop caused by the loaded sample are shown in Figure 5a. Both the SPN10 and SPN23 emissions were stable upstream of the sample at approximately 2.521 × 10¹⁰ and 1.368 × 10¹⁰ particles/s, respectively, over the entire experiment. Those at the outlet rapidly decreased from 4.150 × 10⁹ and 3.797 × 10⁹ particles/s at the beginning to 3.654 × 10⁸ and 2.505 × 10⁸ particles/s at 200 s, respectively. Afterward, they slightly declined to 1.034 × 10⁸ and 6.222 × 10⁷ particles/s, respectively, towards the end of the testing. The pressure drop exhibited the similar behavior as that in the soot loading testing shown in Figure 5a. It initially started from around 145 Pa and steeply increased in the beginning of the experiment. Afterwards, it continued rising to approximately 950 Pa towards the end of the experiment and the increment was rather smaller than that in the beginning of the experiment. The SPN10 and SPN23 filtration efficiencies of the GPF sample were around 0.78 and 0.77 at first, respectively, and exponentially increased to 0.99 and 0.98 at 200 s, respectively, as shown in Figure 5b. The SPN10 emission at the inlet was 1.85 times higher than the SPN23 one and 0.46 of them was attributed to the particles in diameter from 10 nm to 23 nm, which can be seen as the fraction of particle emissions in diameter between 10 nm and 23 nm (SPN10–SPN23) in Figure 5b. After passing through the GPF sample, the factor and the fraction of “SPN10–SPN23” decreased to around 1.45 and 0.31, respectively, at 200 s.

4. Discussion

It is fundamental that the permeability of the porous media is directly measured with a piece of porous media by processing a honeycomb-shaped particulate filter to it. However, the process is sometimes impossible due to brittle and fragile characteristics of the media made of ceramics. Another way for the direct measurement is to process the bulk sample of the porous media by an extrusion of slurry with the same compositions but it is expensive and time-consuming. In the case of especially highly porous media such as GPF walls, which are mostly required to suppress the pressure drop during the operation, one can perform the experiment with a honeycomb-shaped sample and apply its analytical flow resistance model [14] to predict the permeability.
Konstandopoulos (2003) [14] describes flow resistances of honeycomb structure and wall-flow particulate filters. According to him, pressure drop of the clean filter is shown as the sum of a Darcy and Forchheimer terms as follows:
Δ P = μ k u w w s + β ρ u w 2 w s
where k and β are Darcy permeability and a Forchheimer coefficient, respectively. The permeability depends on the characteristics of the porous DPF walls and contributes to the entire pressure drop whereas the Forchheimer coefficient is small enough to be neglected for practical calculations of the pressure drop. Additional pressure drop is induced by frictional losses of the flow along the channels as follows:
Δ P f r i c t i o n = μ U L a 2 F ξ
where F has a constant value of 28.454 for fully developed laminar flow in square cross-sectional channels. The factor of ξ is for a correction of strong suction and injection. It can be 1 since the flow velocities are small enough to keep the laminar flow inside the channels. Inertial losses due to the contraction and expansion of the flow occur when it enters and leaves the filter channels as follows:
Δ P c o n t r . / e x p a n . = ζ ρ U 2 2
where ζ is the contraction/expansion inertial loss coefficient. The total pressure drop of the clean honeycomb structure and wall-flow filter can be expressed by:
Δ P = μ Q 2 V t r a p ( a + w s ) 2 [ w s k a + 8 F L 2 3 a 4 ] + 2 ζ ρ Q 2 ( a + w s ) 4 V t r a p 2 a 2 ( L a ) 2
The permeability can be deduced by an intercept of the relationship between ΔP/Q and Q, which can be obtained by the experiment for the pressure drop measurements of the wall-flow filter samples:
k = 3 μ a 3 w s ( a + w s ) 2 6 V t r a p a 4 ( I n t e r c e p t ) 8 μ F L 2 ( a + w s ) 2
Figure 6 demonstrates the relationship between ΔP/Q and Q of the GPF samples by using their pressure drop measurements shown in Figure 3. In these results, the inertial losses were not seen (Figure 3) and the data were good enough to calculate the permeability. By obtaining the intercepts from a linear regression calculation as well as measuring the geometries of each sample, the permeability of the GPF resulted in 6.9 ± 1.5 × 10⁻¹³ m2. This value is in good agreement with its pore structure whose porosity and pore diameter were 0.57 and 8.3 μm, respectively [14,16].
Particle size from CAST for experiments was chosen so that it could become similar to that emitted from G-DI engines [46] by selecting a CAST operating point of a mean diameter of 60 nm. However, it is well known that coagulation of particles occurs when they transfer in pipes. Previous studies theoretically and experimentally revealed that the coagulation could significantly take place when particle number concentration exceeds 108 particles/cm3 [47,48]. The particle size at the GPF inlet in the experiments may have changed from the mean diameter of 60 nm at the CAST outlet during the transportation of the particles. An advantage of simultaneous measurements of SPN10 and SPN23 is that a fraction of particles in diameter from 10 nm to 23 nm can be examined as shown in Figure 5b and it offers information about particle size distribution. Giechaskiel et al. (2019) [46] holistically investigated SPN10 and SPN23 emissions through vehicle testing and literature surveys by carefully taking their measurement uncertainties into consideration. They found out that fractions of particles in diameter from 10 nm to 23 nm in emissions from G-DI vehicles without a GPF ranged from 0.35 to 0.50. Comparing to them, the fraction at the inlet of the GPF samples in the experiment was 0.46 shown as “In_SPN10–SPN23” in Figure 5b, which was in the range reported by Giechaskiel et al. (2019) [46]. Thus, the synthetic particles that we used for the experiments can represent the particle emissions from the G-DI engines flowing into the GPF regarding not only their morphology and chemical compositions as described above but also their size distribution.
It has been reported that a rapid increase in pressure drop induced by a particulate filter during soot loading resulted in a decrease in the wall permeability of its porous media [19]. Soot particles firstly deposit inside the porous media when they are in a clean state, and then the pores are clogged by the particles. It causes a decrease in the wall permeability, which induces the first steep increase in the pressure drop during a so-called deep-bed filtration mode. Afterward, the soot particles subsequently start bridging with each other on top of the walls after the pores are filled by the particles, which creates cake layers on the walls. This is a so-called cake filtration mode. It has been known that a second linear increase in the pressure drop resulted in the growth of the thickness of the cake layers along with the soot accumulation [17]. It is found that the first rapid and second linear increases in the pressure drop shown in Figure 4a and Figure 5a were induced by the decrease in the wall permeability and the growth of the thickness of the cake layers, respectively. In combination with the photoacoustic measurement principle and the aforementioned linear correlations of the MSS2 signals to the soot mass concentrations, it is considered that the time-resolved values measured by the MSS2 shown in Figure 4a demonstrated the soot mass emissions in real time. It has also been studied that some particles pass through the porous particulate filter walls during the deep-bed filtration mode whereas almost all the particles are captured by the cake layers on the walls once the mode migrates the cake filtration one. It is recognizable that the first sharp and second linear decreases in the soot mass emission downstream of the GPF sample resulted from the deep-bed and cake filtrations, respectively, when the soot mass emission upstream of the sample was steady. The filtration efficiency in terms of the soot mass in Figure 4b, which was calculated by dividing the soot mass emission at the outlet from the inlet of the GPF sample in time, represented the transition of the deep-bed to cake filtration modes. According to the above discussion about the soot mass emissions, the estimation by subtracting the soot mass emission at the outlet from that at the inlet of the sample exhibited the time-resolved soot accumulation inside the sample.
The SPN10 and SPN23 emissions shown in Figure 5a decreased from 2.521 × 10¹⁰ and 1.368 × 10¹⁰ particles/s to 4.150 × 10⁹ and 3.797 × 10⁹ particles/s by the GPF sample, respectively, at the beginning of the experiment. They correspond to reductions of around one order of magnitude which resulted in filtration efficiencies of 0.78 and 0.77, respectively (Figure 5b). The emissions downstream of the GPF sample steeply declined and they reached 3.654 × 10⁸ and 2.505 × 10⁸ particles/s at 200 s, respectively, which exhibited reductions of almost two orders of magnitude (Figure 5a). The same tendency of the pressure drop behavior was found in the experiment for the SPN10 and SPN23 emissions as that for the soot mass one, which indicated the first deep-bed and second cake filtration modes (Figure 5a). It is demonstrated that the former steep decreases in SPN10 and SPN23 emissions downstream of the GPF sample at the beginning of the experiment were caused by the deep-bed filtration while the latter slight decreases resulted from the cake one. When it comes to capturing smaller particles, the fraction of particles in diameter from 10 nm to 23 nm upstream of the sample was 0.46, whereas that at the outlet of the sample decreased to 0.31 as illustrated in Figure 5b. The reduction of 0.15 points indicates that the smaller particles were captured by the GPF sample in a more efficient way compared to the larger ones in diameter above 23 nm. However, the contribution of the filtration of the particles in diameter from 10 nm to 23 nm to the entire emissions out of the GPF sample was not significant since the filtration efficiencies in terms of the SPN10 and SPN23 emissions were close to each other. It implies that the SPN emissions out of the GPF sample can be dominated by the particles in diameter above 23 nm, which escaped from the sample.
The particle filtration by a particulate filter can be expressed by a so-called unit collector model [8]. It is assumed to collect the particles by principles of Brownian diffusion and interception. The filtration efficiency of the clean particulate filter can be expressed as follows:
E = 1 e x p [ 3 η D R ( 1 ε 0 ) w s 2 ε 0 d c 0 ]
where a combined efficiency, ηDR, is divided into the two principles independently as follows:
η D R = η D + η R η D · η R
The single spherical collector efficiency for Brownian diffusion can be expressed by:
η D = 3.5 · g ( ε ) · P e 2 / 3
The function g(ε) covers the impact of the flow field representing Kuwabara’s hydrodynamic factor:
g ( ε w ) = ε w 1 3 ( 2 ε w 5 9 · ( 1 ε w ) 1 3 1 5 · ( 1 ε w ) 2 ) 1 3
The collection efficiency due to interception is given by:
η R = 1.5 · N R 2 ( 1 + N R ) s · g ( ε ) 3
where the interception parameter NR is shown by:
N R = d p d c
The filtration efficiency of the GPF sample was simulated under the experimental conditions in accordance with the above unit collector model as shown in Figure 7. The filtration efficiency of small particles in diameter of around 10 nm was almost 1.0. It decreased and increased as the particles become large having a local minimum at the diameter of around 200 nm. The high filtration efficiency of the small particles in diameter of several tens of nanometers is attributed to the Brownian diffusion whereas the increase as the particles become large in sub-μm is caused by the interception. The entire filtration efficiency resulted in 0.74 for the SPN10 and 0.73 for the SPN23. The values were lower than those observed in the experiments, which were 0.78 and 0.77, respectively. These might be caused by the slight difference in the amount of the soot loading at the initial stage of the accumulation. However, the difference in the filtration efficiencies between SPN10 and SPN23 represented the experimental results: the filtration efficiency of SPN10 was only 0.01 points higher than that of SPN23. It is found by the simulation based on the unit collector model that the slightly higher filtration efficiency of SPN10 compared to SPN23 was due to the Brownian diffusion and it did not produce the main margin between filtration efficiencies in terms of the SPN10 and SPN23. It indicates that the particle size escaping from the GPF ranges above 23 nm and the particles in diameter of several hundreds of nanometers dominate the SPN emissions out of the GPF. The filtration efficiency would further improve if the particles entering the GPF became smaller in the range of several tens of nanometers even though the specification of the GPF is the same. In the experiment of the SPN10 and SPN23 emissions, the reduction of the fraction of particles in diameter from 10 nm to 23 nm by the GPF sample was 0.15 points as depicted in Figure 5b and it is lower than expected as the filtration efficiency in this range attains 0.98 according to the simulation result. We speculate that it might be caused by the pore size distribution of the porous GPF walls and further investigations are necessary for future work.
The next step will be the validation of the entire simulation model of the GPF performance in terms of the pressure drop, filtration efficiency, and soot loading with the experimental results obtained by the proposed methodology, and it will be extended to use cases of G-DI engine testing for further validation. As a result, the model will enable us to find the optimum specifications of the GPF and to create operation strategies in the G-DI vehicles for the upcoming future regulation.

5. Conclusions

A methodology to characterize GPF performance of pressure drop, soot loading, and filtration efficiencies in terms of SPN10 and SPN23 is proposed. Feasibility of the methodology was examined through experiments of miniature GPF samples using a synthetic particle generator.
Firstly, the permeability was estimated by the entire pressure drop of the honeycomb-shaped GPF samples in a clean state in accordance with a flow resistance descriptor method. As a result, it was 6.9 ± 1.5 × 10⁻¹³ m2, which is in a good agreement with its pore structure.
Secondly, the time-resolved soot loading of the GPF samples was monitored by means of photoacoustic sensor systems whose sensor signals were confirmed to have linear correlations to soot mass concentration in exhaust. The soot emission downstream of the GPF demonstrated a transition from deep-bed to cake filtration modes in combination with the pressure drop behavior induced by the loaded GPF samples.
Thirdly, the filtration efficiencies of the GPF in terms of SPN10 and SPN23 were observed in real time with particle number counting systems which are compliant with the technical requirements of UNECE GTR15. Their profiles exhibited the transition of the filtration modes corresponding to the pressure drop behavior, too. The filtration efficiencies of the SPN10 and SPN23 at a clean state of the GPF samples were 0.78 and 0.77, respectively, and they were similar to each other. Simulations by means of a unit collector model under the experimental conditions showed that the initial filtration efficiencies of the SPN10 and SPN23 were 0.74 and 0.73, respectively, which were in good agreement with the experimental results. They indicated that almost no difference in filtration efficiencies between SPN10 and SPN23 was attributed to Brownian diffusion.
The proposed methodology can be standardized for the characterization of the GPF performance instead of current measurement methods. The performance obtained through the methodology must be more practical to validate simulation models along with upcoming legislative requirements. In the future, the entire simulation model of the GPF performance will be validated by the experimental results and will be extended to use cases of G-DI engine testing. The model will allow engineers to find the optimum specifications of the GPF and to create operation strategies in the G-DI vehicles to meet future regulations.

Author Contributions

Conceptualization, K.N., K.Y. and J.K.; methodology, K.N., K.Y., J.K., M.A. and C.D.; formal analysis, K.N. and Y.S.; investigation, K.N., Y.S. and K.Y.; data curation, K.N. and Y.S.; writing—original draft preparation, K.N., M.A. and C.D.; writing—review and editing, K.N., K.Y. and J.K.; visualization, K.N.; supervision, J.K. All authors have read and agreed to the published version of the manuscript.

Funding

This research received no external funding.

Institutional Review Board Statement

Not applicable.

Informed Consent Statement

Not applicable.

Data Availability Statement

The data that support the findings of this research are available from the corresponding author, K.N., upon reasonable request.

Acknowledgments

The authors would like to thank I. Ishii and Tokyo Dylec Corp. (J. Kawase and S. Fujino) for their on-site support in setting up equipment for experiments.

Conflicts of Interest

M.A. and C.D. are employed by AVL List GmbH, which is a supplier of particle measurement instruments. The rest of the authors declare no conflict of interest.

Abbreviations

APCAVL Particle Counter
CASTCombustion aerosol standard
CPCCondensation particle counter
CSCatalytic stripper
CVSConstant volume sampler
DPFDiesel particulate filter
ECElemental carbon
ETEvaporation tube
G-DI Gasoline direct injection
GPFGasoline particulate filter
GTRGlobal technical regulation
HDHeavy-duty
HEPAHigh efficiency particulate air
ISOInternational organization for standardization
MSS2AVL Micro Soot Sensor 2
NEDCNew European driving cycle
NRMMNon-road mobile machinery
LDLight-duty
OCOrganic carbon
PCRFParticle number concentration reduction factor
PEMSPortable emissions measurement system
PMParticulate matter
PMPParticle measurement programme
PND Particle number diluter
PNCParticle number counter
RDEReal driving emission
SPN10Solid particle number in diameter > 10 nm
SPN23Solid particle number in diameter > 23 nm
SVSpace velocity
TOTThermal and optical transmittance
UNECEUnited Nations Economic Commission for Europe
VPRVolatile particle remover
aFilter cell width
dcLoaded collector diameter
dpParticle diameter
EGrade collection efficiency
FFriction factor equal to 28.454
g(ε)Geometric function by Kuwabara
kFilter wall permeability
LFilter length
NRInterception parameter
PePeclet number
QExhaust volumetric flow rate
ReReynolds number
UEntrance or exit average channel velocity
uwFiltration velocity
VtrapFilter volume
wsFilter wall thickness
βForchheimer coefficient in porous wall
ΔPPressure drop induced by a filter
ΕFilter wall porosity
ζContraction/expansion inertial losses coefficient
ηDCollection efficiency due to Brownian diffusion
ηDRCombined collection efficiency
ηRCollection efficiency due to interception
μExhaust dynamic viscosity
ξSuction/injection correction factor
ρExhaust gas density

References

  1. Pope, C.A., III; Coleman, N.; Pond, Z.A.; Burnett, R.T. Fine Particulate Air Pollution and Human Mortality: 25+ Years of Cohort Studies. Environ. Res. 2020, 183, 108924. [Google Scholar] [CrossRef]
  2. Ohlwein, S.; Kappeler, R.; Kutlar Joss, M.; Künzli, N.; Hoffmann, B. Health Effects of Ultrafine Particles: A Systematic Literature Review Update of Epidemiological Evidence. Int. J. Public Health 2019, 64, 547–559. [Google Scholar] [CrossRef] [PubMed]
  3. Kwon, H.-S.; Ryu, M.H.; Carlsten, C. Ultrafine Particles: Unique Physicochemical Properties Relevant to Health and Disease. Exp. Mol. Med. 2020, 52, 318–328. [Google Scholar] [CrossRef]
  4. Pant, P.; Harrison, R.M. Estimation of the Contribution of Road Traffic Emissions to Particulate Matter Concentrations from Field Measurements: A Review. Atmos. Environ. 2013, 77, 78–97. [Google Scholar] [CrossRef]
  5. European Commission. Council Directive 91/441/EEC of 26 June 1991 Amending Directive 70/220/EEC on the Approximation of the Laws of the Member States Relating to Measures to Be Taken against Air Pollution by Emissions from Motor Vehicles. Off. J. Eur. Union 1991. [Google Scholar]
  6. European Commission. Commission Regulation (EU) 2016/646 of 20 April 2016 Amending Regulation (EC) No 692/2008 as Regards Emissions from Light Passenger and Commercial Vehicles (Euro 6) (Text with EEA Relevance). Off. J. Eur. Union 2016. [Google Scholar]
  7. European Commission. Regulation (EC) No 715/2007 of the European Parliament and of the Council of 20 June 2007 on Type Approval of Motor Vehicles with Respect to Emissions from Light Passenger and Commercial Vehicles (Euro 5 and Euro 6) and on Access to Vehicle Repair and Maintenance Information (Text with EEA Relevance). Off. J. Eur. Union 2007, 171. [Google Scholar]
  8. Konstandopoulos, A.G.; Johnson, J.H. Wall-Flow Diesel Particulate Filters—Their Pressure Drop and Collection Efficiency. SAE Tech. Pap. 1989, 890405. [Google Scholar] [CrossRef]
  9. Konstandopoulos, A.G.; Skaperdas, E.; Warren, J.; Allansson, R. Optimized Filter Design and Selection Criteria for Continuously Regenerating Diesel Particulate Traps. SAE Tech. Pap. 1999, 279–288. [Google Scholar] [CrossRef]
  10. Konstandopoulos, A.G.; Kostoglou, M. Periodically Reversed Flow Regeneration of Diesel Particulate Traps. SAE Tech. Pap. 1999, 289–302. [Google Scholar] [CrossRef]
  11. Konstandopoulos, A.G.; Kostoglou, M.; Skaperdas, E.; Papaioannou, E.; Zarvalis, D.; Kladopoulou, E. Fundamental Studies of Diesel Particulate Filters: Transient Loading, Regeneration and Aging. SAE Tech. Pap. 2000, 683–705. [Google Scholar] [CrossRef]
  12. Masoudi, M.; Konstandopoulos, A.G.; Nikitidis, M.S.; Skaperdas, E.; Zarvalis, D.; Kladopoulou, E.; Altiparmakis, C. Validation of a Model and Development of a Simulator for Predicting the Pressure Drop of Diesel Particulate Filters. SAE Tech. Pap. 2001, 650–656. [Google Scholar] [CrossRef]
  13. Konstandopoulos, A.G.; Skaperdas, E.; Masoudi, M. Microstructural Properties of Soot Deposits in Diesel Particulate Traps. SAE Tech. Pap. 2002. [Google Scholar] [CrossRef]
  14. Konstandopoulos, A.G. Flow Resistance Descriptors for Diesel Particulate Filters: Definitions, Measurements and Testing. SAE Tech. Pap. 2003. [Google Scholar] [CrossRef]
  15. Konstandopoulos, A.G.; Kladopoulou, E. The Optimum Cell Density for Wall-Flow Monolithic Filters: Effects of Filter Permeability, Soot Cake Structure and Ash Loading. SAE Tech. Pap. 2004, 32–43. [Google Scholar] [CrossRef]
  16. Ido, T.; Ogyu, K.; Ohira, A.; Hayashi, M.; Ohno, K.; Konstandopoulos, A.G. Study on the Filter Structure of SiC-DPF with Gas Permeability for Emission Control. SAE Tech. Pap. 2005. [Google Scholar] [CrossRef]
  17. Konstandopoulos, A.G.; Kostoglou, M.; Vlachos, N.; Kladopoulou, E. Progress in Diesel Particulate Filter Simulation. SAE Tech. Pap. 2005. [Google Scholar] [CrossRef]
  18. Konstandopoulos, A.G.; Kostoglou, M.; Vlachos, N.; Kladopoulou, E. Advances in the Science and Technology of Diesel Particulate Filter Simulation. Adv. Chem. Eng. 2007, 33, 213–294. [Google Scholar] [CrossRef]
  19. Konstandopoulos, A.G.; Papaioannou, E. Update on the Science and Technology of Diesel Particulate Filters. KONA Powder Part. J. 2008, 26, 36–65. [Google Scholar] [CrossRef] [Green Version]
  20. Konstandopoulos, A.G.; Skaperdas, E.; Masoudi, M. Inertial Contributions to the Pressure Drop of Diesel Particulate Filters. SAE Tech. Pap. 2001. [Google Scholar] [CrossRef]
  21. Ohno, K.; Shimato, K.; Taoka, N.; Santae, H.; Ninomiya, T.; Komori, T.; Salvat, O. Characterization of SiC-DPF for Passenger Car. SAE Tech. Pap. 2000, 53–66. [Google Scholar] [CrossRef]
  22. Salvat, O.; Marez, P.; Belot, G. Passenger Car Serial Application of a Particulate Filter System on a Common Rail Direct Injection Diesel Engine. SAE Tech. Pap. 2000, 227–239. [Google Scholar] [CrossRef]
  23. Giechaskiel, B.; Mamakos, A.; Andersson, J.; Dilara, P.; Martini, G.; Schindler, W.; Bergmann, A. Measurement of Automotive Nonvolatile Particle Number Emissions within the European Legislative Framework: A Review. Aerosol Sci. Technol. 2012, 46, 719–749. [Google Scholar] [CrossRef]
  24. European Commission. Commission Regulation (EU) No 459/2012 of 29 May 2012 Amending Regulation (EC) No 715/2007 of the European Parliament and of the Council and Commission Regulation (EC) No 692/2008 as Regards Emissions from Light Passenger and Commercial Vehicles (Euro 6) Text with EEA Relevance. Off. J. Eur. Union 2012. [Google Scholar]
  25. European Commission. Commission Regulation (EU) No 582/2011 of 25 May 2011 Implementing and Amending Regulation (EC) No 595/2009 of the European Parliament and of the Council with Respect to Emissions from Heavy Duty Vehicles (Euro VI) and Amending Annexes I and III to Directive 2007/46/EC of the European Parliament and of the Council Text with EEA Relevance. Off. J. Eur. Union 2011. [Google Scholar]
  26. European Commission. Regulation (EU) 2016/1628 of the European Parliament and of the Council of 14 September 2016 on Requirements Relating to Gaseous and Particulate Pollutant Emission Limits and Type-Approval for Internal Combustion Engines for Non-Road Mobile Machinery, Amending Regulations (EU) No 1024/2012 and (EU) No 167/2013, and Amending and Repealing Directive 97/68/EC (Text with EEA Relevance). Off. J. Eur. Union 2016, 252. [Google Scholar]
  27. European Commission. Commission Regulation (EU) 2016/427 of 10 March 2016 Amending Regulation (EC) No 692/2008 as Regards Emissions from Light Passenger and Commercial Vehicles (Euro 6) (Text with EEA Relevance). Off. J. Eur. Union 2016. [Google Scholar]
  28. Giechaskiel, B.; Clairotte, M.; Valverde-Morales, V.; Bonnel, P.; Kregar, Z.; Franco, V.; Dilara, P. Framework for the Assessment of PEMS (Portable Emissions Measurement Systems) Uncertainty. Environ. Res. 2018, 166, 251–260. [Google Scholar] [CrossRef]
  29. Giechaskiel, B.; Bonnel, P.; Perujo, A.; Dilara, P. Solid Particle Number (SPN) Portable Emissions Measurement Systems (PEMS) in the European Legislation: A Review. Int. J. Environ. Res. Public Health 2019, 16, 4819. [Google Scholar] [CrossRef] [Green Version]
  30. Giechaskiel, B.; Joshi, A.; Ntziachristos, L.; Dilara, P. European Regulatory Framework and Particulate Matter Emissions of Gasoline Light-Duty Vehicles: A Review. Catalysts 2019, 9, 586. [Google Scholar] [CrossRef] [Green Version]
  31. Boger, T.; Cutler, W. Reducing Particulate Emissions in Gasoline Engines. Available online: https://www.sae.org/publications/books/content/r-471/ (accessed on 31 January 2023).
  32. Guan, B.; Zhan, R.; Lin, H.; Huang, Z. Review of the State-of-the-Art of Exhaust Particulate Filter Technology in Internal Combustion Engines. J. Environ. Manag. 2015, 154, 225–258. [Google Scholar] [CrossRef] [PubMed]
  33. Joshi, A.; Johnson, T.V. Gasoline Particulate Filters—A Review. Emiss. Control Sci. Technol. 2018, 4, 219–239. [Google Scholar] [CrossRef]
  34. Raza, M.; Chen, L.; Leach, F.; Ding, S. A Review of Particulate Number (PN) Emissions from Gasoline Direct Injection (GDI) Engines and Their Control Techniques. Energies 2018, 11, 1417. [Google Scholar] [CrossRef] [Green Version]
  35. Qian, Y.; Li, Z.; Yu, L.; Wang, X.; Lu, X. Review of the State-of-the-Art of Particulate Matter Emissions from Modern Gasoline Fueled Engines. Appl. Energy 2019, 238, 1269–1298. [Google Scholar] [CrossRef]
  36. European Commission. Commission Proposes New Euro 7 Standards. Available online: https://ec.europa.eu/commission/presscorner/detail/en/ip_22_6495 (accessed on 31 January 2023).
  37. Giechaskiel, B.; Melas, A.; Martini, G.; Dilara, P. Overview of Vehicle Exhaust Particle Number Regulations. Processes 2021, 9, 2216. [Google Scholar] [CrossRef]
  38. Lahde, T.; Giechaskiel, B.; Martini, G. Development of Measurement Methodology for Sub 23 Nm Particle Number (PN) Measurements. SAE Int. J. Adv. Curr. Prac. Mobil. 2020, 3, 551–560. [Google Scholar] [CrossRef]
  39. Giechaskiel, B.; Manfredi, U.; Martini, G. Engine Exhaust Solid Sub-23 Nm Particles: I. Literature Survey. SAE Int. J. Fuels Lubr. 2014, 7, 950–964. [Google Scholar] [CrossRef]
  40. Giechaskiel, B.; Vanhanen, J.; Väkevä, M.; Martini, G. Investigation of Vehicle Exhaust Sub-23 Nm Particle Emissions. Aerosol Sci. Technol. 2017, 51, 626–641. [Google Scholar] [CrossRef] [Green Version]
  41. Giechaskiel, B.; Melas, A.; Valverde, V.; Otura, M.; Martini, G. Challenging Conditions for Gasoline Particulate Filters (GPFs). Catalysts 2022, 12, 70. [Google Scholar] [CrossRef]
  42. Giechaskiel, B.; Valverde, V.; Kontses, A.; Melas, A.; Martini, G.; Balazs, A.; Andersson, J.; Samaras, Z.; Dilara, P. Particle Number Emissions of a Euro 6d-Temp Gasoline Vehicle under Extreme Temperatures and Driving Conditions. Catalysts 2021, 11, 607. [Google Scholar] [CrossRef]
  43. Schindler, W.; Haisch, C.; Beck, H.A.; Niessner, R.; Jacob, E.; Rothe, D. A Photoacoustic Sensor System for Time Resolved Quantification of Diesel Soot Emissions. SAE Tech. Pap. 2004, 483–490. [Google Scholar] [CrossRef]
  44. Giechaskiel, B.; Cresnoverh, M.; Jörgl, H.; Bergmann, A. Calibration and Accuracy of a Particle Number Measurement System. Meas. Sci. Technol. 2010, 21, 045102. [Google Scholar] [CrossRef]
  45. United Nations Economic Commission for Europe. Addendum 15: United Nations Global Technical Regulation No. 15—Amendment 6—Appendix 1; UNECE: Geneva, Switzerland, 1998; Available online: https://unece.org/transport/documents/2021/01/standards/addendum-15-united-nations-global-technical-regulation-no-15 (accessed on 31 January 2023).
  46. Giechaskiel, B.; Lähde, T.; Drossinos, Y. Regulating Particle Number Measurements from the Tailpipe of Light-Duty Vehicles: The next Step? Environ. Res. 2019, 172, 1–9. [Google Scholar] [CrossRef]
  47. Isella, L.; Giechaskiel, B.; Drossinos, Y. Diesel-Exhaust Aerosol Dynamics from the Tailpipe to the Dilution Tunnel. J. Aerosol Sci. 2008, 39, 737–758. [Google Scholar] [CrossRef]
  48. Giechaskiel, B.; Arndt, M.; Schindler, W.; Bergmann, A.; Silvis, W.; Drossinos, Y. Sampling of Non-Volatile Vehicle Exhaust Particles: A Simplified Guide. SAE Int. J. Engines 2012, 5, 379–399. [Google Scholar] [CrossRef]
Figure 1. An experimental layout of GPF testing for soot loading and filtration efficiency evaluation.
Atmosphere 14 00476 g001
Figure 2. Comparison of MSS2 signals to soot mass: (a) comparison of MSS2 signals to EC contents of particles generated by mini-CAST. The EC content was measured by an OC/EC analyzer; (b) comparison of MSS2 signals to non-volatile PM weights emitted by diesel engines over NEDCs. The non-volatile PM on a filter was obtained by heating the entire PM at 200 °C in a vacuum oven.
Atmosphere 14 00476 g002
Figure 3. Pressure drop of GPF samples as a function of gas volume flow rate.
Atmosphere 14 00476 g003
Figure 4. Time-resolved soot mass emissions and soot accumulation inside a GPF sample (sample gas temperature = 31 °C, space velocity = 74,000 1/h): (a) the soot mass emissions at inlet and outlet points of the GPF sample as well as pressure drop induced by the loaded sample; (b) the soot accumulation inside the GPF sample and the soot mass filtration efficiency of the GPF sample.
Atmosphere 14 00476 g004
Figure 5. SPN10 and SPN23 emissions and their filtration efficiencies of a GPF sample (sample gas temperature = 20 °C, space velocity = 78,000 1/h): (a) the SPN10 and SPN23 emissions at each inlet and outlet points of the GPF sample as well as the pressure drop caused by the loaded sample; (b) a fraction of particle emissions in diameter between 10 nm and 23 nm to the SPN10 (SPN10–SPN23) at each inlet and outlet points of the GPF sample as well as the SPN10 and SPN23 filtration efficiencies of the GPF sample.
Atmosphere 14 00476 g005
Figure 6. Pressure drop divided by gas volume flow rate as a function of gas volume flow rate for the permeability calculation. The data correspond to those in Figure 3.
Atmosphere 14 00476 g006
Figure 7. Filtration efficiency of a clean GPF sample as a function of particle mobility diameter, which is calculated by a unit collector model under experimental conditions.
Atmosphere 14 00476 g007
Table 1. GPF sample specifications.
MaterialCordierite
Diameter1 inch
Length1 inch
Cell structureSquare
Cell density198 1/inch2
Wall thickness8.4 mil
Wall porosity0.57
Wall pore diameter8.3 μm
Disclaimer/Publisher’s Note: The statements, opinions and data contained in all publications are solely those of the individual author(s) and contributor(s) and not of MDPI and/or the editor(s). MDPI and/or the editor(s) disclaim responsibility for any injury to people or property resulting from any ideas, methods, instructions or products referred to in the content.

