Article

Particle Size Matters: Distribution, Source, and Seasonality Characteristics of Airborne and Pathogenic Bacteria in Wastewater Treatment Plants

1
Science and Technology Innovation Center for Municipal Wastewater Treatment and Water Quality Protection, Northeast Normal University, Changchun 130117, China
2
Key Laboratory of Songliao Aquatic Environment, Ministry of Education, Jilin Jianzhu University, Changchun 130118, China
3
Center for Advanced Optoelectronic Functional Materials Research, Key Laboratory of UV Light-Emitting Materials and Technology of Ministry of Education, Northeast Normal University, Changchun 130024, China
*
Author to whom correspondence should be addressed.
Atmosphere 2023, 14(3), 465; https://doi.org/10.3390/atmos14030465
Submission received: 27 January 2023 / Revised: 16 February 2023 / Accepted: 24 February 2023 / Published: 26 February 2023
(This article belongs to the Special Issue Contributions of Emission Inventory to Air Quality)

Abstract

:
Wastewater treatment plants (WWTPs) are a crucial source of bioaerosols, which account for both environmental and health hazards. Although various culture-based studies on bioaerosols have been reported, little knowledge remains about distribution and potential risks for more omnipresent non-culturable bacterial aerosols. Here, in summer, an eight-stage Andersen air sampler was applied to capture particles of various sizes from the atmospheric environment of eight treatment units from two WWTPs in northeastern China. Particles of various sizes in aeration tank (AT) were sampled in autumn and winter. The abundance and community composition of the bacterial aerosols were investigated using 16S rRNA gene sequencing. In order to explore the importance of particle size on community composition of bacterial aerosols, this study investigated the particle size distribution of bacterial aerosols in different treatment units. The results indicated that the sludge dewatering room was the major source of bacterial aerosols in both WWTPs, with the abundance of stage VII (0.65–1.1 μm) demonstrating a 4-fold to 9-fold increase when compared to any other treatment unit. The highest relative abundance of bacterial aerosols was in autumn, while the lowest was found in winter. However, most particles detected in autumn were larger than 4.7 µm in diameter, while submicron particles (less than 1.1 µm, over 40%) were detected primarily in winter. The most 15 dominant bacterial aerosol genera in were observed at submicron level, and about half of the genera (6 and 8) were detected as human pathogens, suggesting their easier penetration to human respiratory tracts. This study demonstrates that size distribution characteristics should be crucial information for the comprehensive assessment of the potential health risks of bacterial aerosols from WWTPs.

1. Introduction

Currently, human health and well-being are severely threatened by the COVID-19 epidemic. Studies have shown that aerosols are the primary vector of COVID-19 transmission [1]. As a result, there has been widespread, gradually increasing concern about the threat of aerosols to human health. Bioaerosols are defined as airborne particles of biological origin with aerodynamic diameters between 0.01 and 100 μm [2]. They are mixed colloids made up of bacteria, fungi, viruses, fungi, endotoxins, and toxic substances, among others [3]. According to reports, 5–10% of the total suspended particles and around 24% of the total atmospheric particles were devoted by bioaerosols [4]. Owing to their small size and lightweight, bioaerosols can easily be deposited throughout the respiratory system of humans and cause various acute and chronic diseases (e.g., asthma, endocarditis, rhinitis, osteomyelitis, and bronchitis) [5]. Thus, bioaerosols’ characteristics and health risk have attracted more attention.
Bioaerosol have been measured in many different environments (especially working environments), showing high health risks to workers [5]. For example, previous research in Poland showed that employees’ hands and masks were frequently exposed to germs linked to biomass during routine work [2]. Madsen et al. reported that the source of microbial exposure can be moldy seeds, a biopesticide, and fungi on building materials [6]. Numerous studies have suggested that wastewater treatment plants (WWTPs) are a typical point source of hazardous, infectious bioaerosol emissions [7,8,9,10]. For instance, WWTPs may release specific airborne pathogenic bacteria, such as fecal coliform, E. coli, and Enterococcus, that cause respiratory illnesses, including asthma and chronic bronchitis [11]. Such pathogens pose serious health risks to occupational workers and the residents of surrounding communities [12,13].
In WWTPs, the A2O process is widely used, which accounts for 31% of the statistics [14]. It removes both of the nutrients, nitrogen and phosphorus, in wastewater. However. during the treatment process of wastewater, bacteria, fungi, and their metabolic products from wastewater and sludge will be released under various external forces (such as mechanical agitation in the secondary settling tank and the screen room, bubble aeration in the aeration tank, and sludge dewatering in the sludge dewatering room) [15]. According to prior studies, bioaerosols can be found in various wastewater treatment stages, including the sludge dewatering room, the aeration tank, the secondary settling tank, and the screen room [16]. During these stages, workers are exposed to the bioaerosols environment for long periods of time while at work (e.g., making rounds, cleaning up trash, and transporting sludge). Therefore, it is necessary to pay attention to the risk to human health from bioaerosols distributed in the above four treatment units.
However, limited information on bacterial aerosols has prevented a proper risk assessment that bacterial aerosols may pose to human health in WWTP [14]. The most influential characteristics in assessing the health risks of bacterial aerosols are concentration and size [17]. In WWTPs, concentrations of bacterial aerosols were observed in regions such as Iran (4–3780 CFU/m3), Spain (602–1973 CFU/m3), and China (194–5.16 × 10⁴ CFU/m3), with particle sizes primarily below 4.7 µm [18,19,20,21]. Through use of a high-throughput sequencing technique, the sludge dewatering room was found to have the highest species richness (520 species in surrounding air) compared with those captured from other treatment units [22]. The sludge dewatering room and the aeration tank are the primary sources of aerosol emissions, and aerosol generation is significantly increased by aeration and mechanical agitation in the WWTP [23]. The concentration, size distribution, bacterial pathogens, and discriminative taxa (biomarker) of the bioaerosols that escape from each treatment unit are not identical and are based on the kind of wastewater type, capacity, and environmental conditions [7,16]. However, few previous studies have investigated the effects of particle size on microbial communities from WWTP.
The two principal pathways that people are exposed to bioaerosols are through inhalation and skin contact; in terms of exposure risks, the former was more significant than the latter [24]. One principal aspect that influences the dosage of inhalable particles and the subsequent health consequences is particle size [25]. For example, large particles (>5 μm) are primarily deposited in the upper airway, while medium-sized particles (<5 μm) are more likely to penetrate and be deposited in internal airways and even in deeper (Small particle: <1 μm) alveolar regions [26,27]. Therefore, we need to pay more attention to particle size characteristics and their effect on human health.
A number of studies have aimed to use culturable methods to investigate the size characteristics of bacterial aerosol particles. However, culturable bacteria made up less than 1% of all bacterial aerosols’ particles, resulting in an underestimation of the particle size distribution and the associated hazards. In this study, we therefore aimed to: (I) investigate the size-related relative abundance and diversity of the bacterial aerosols generated by various treatment units; (II) determine the contribution of wastewater to bacterial aerosols, and (III) compare the size-related characteristics of bacterial aerosols across seasons. This work helps to clarify the relationship between species diversity and particle size for airborne bacterial aerosols in WWTPs.

2. Materials and Methods

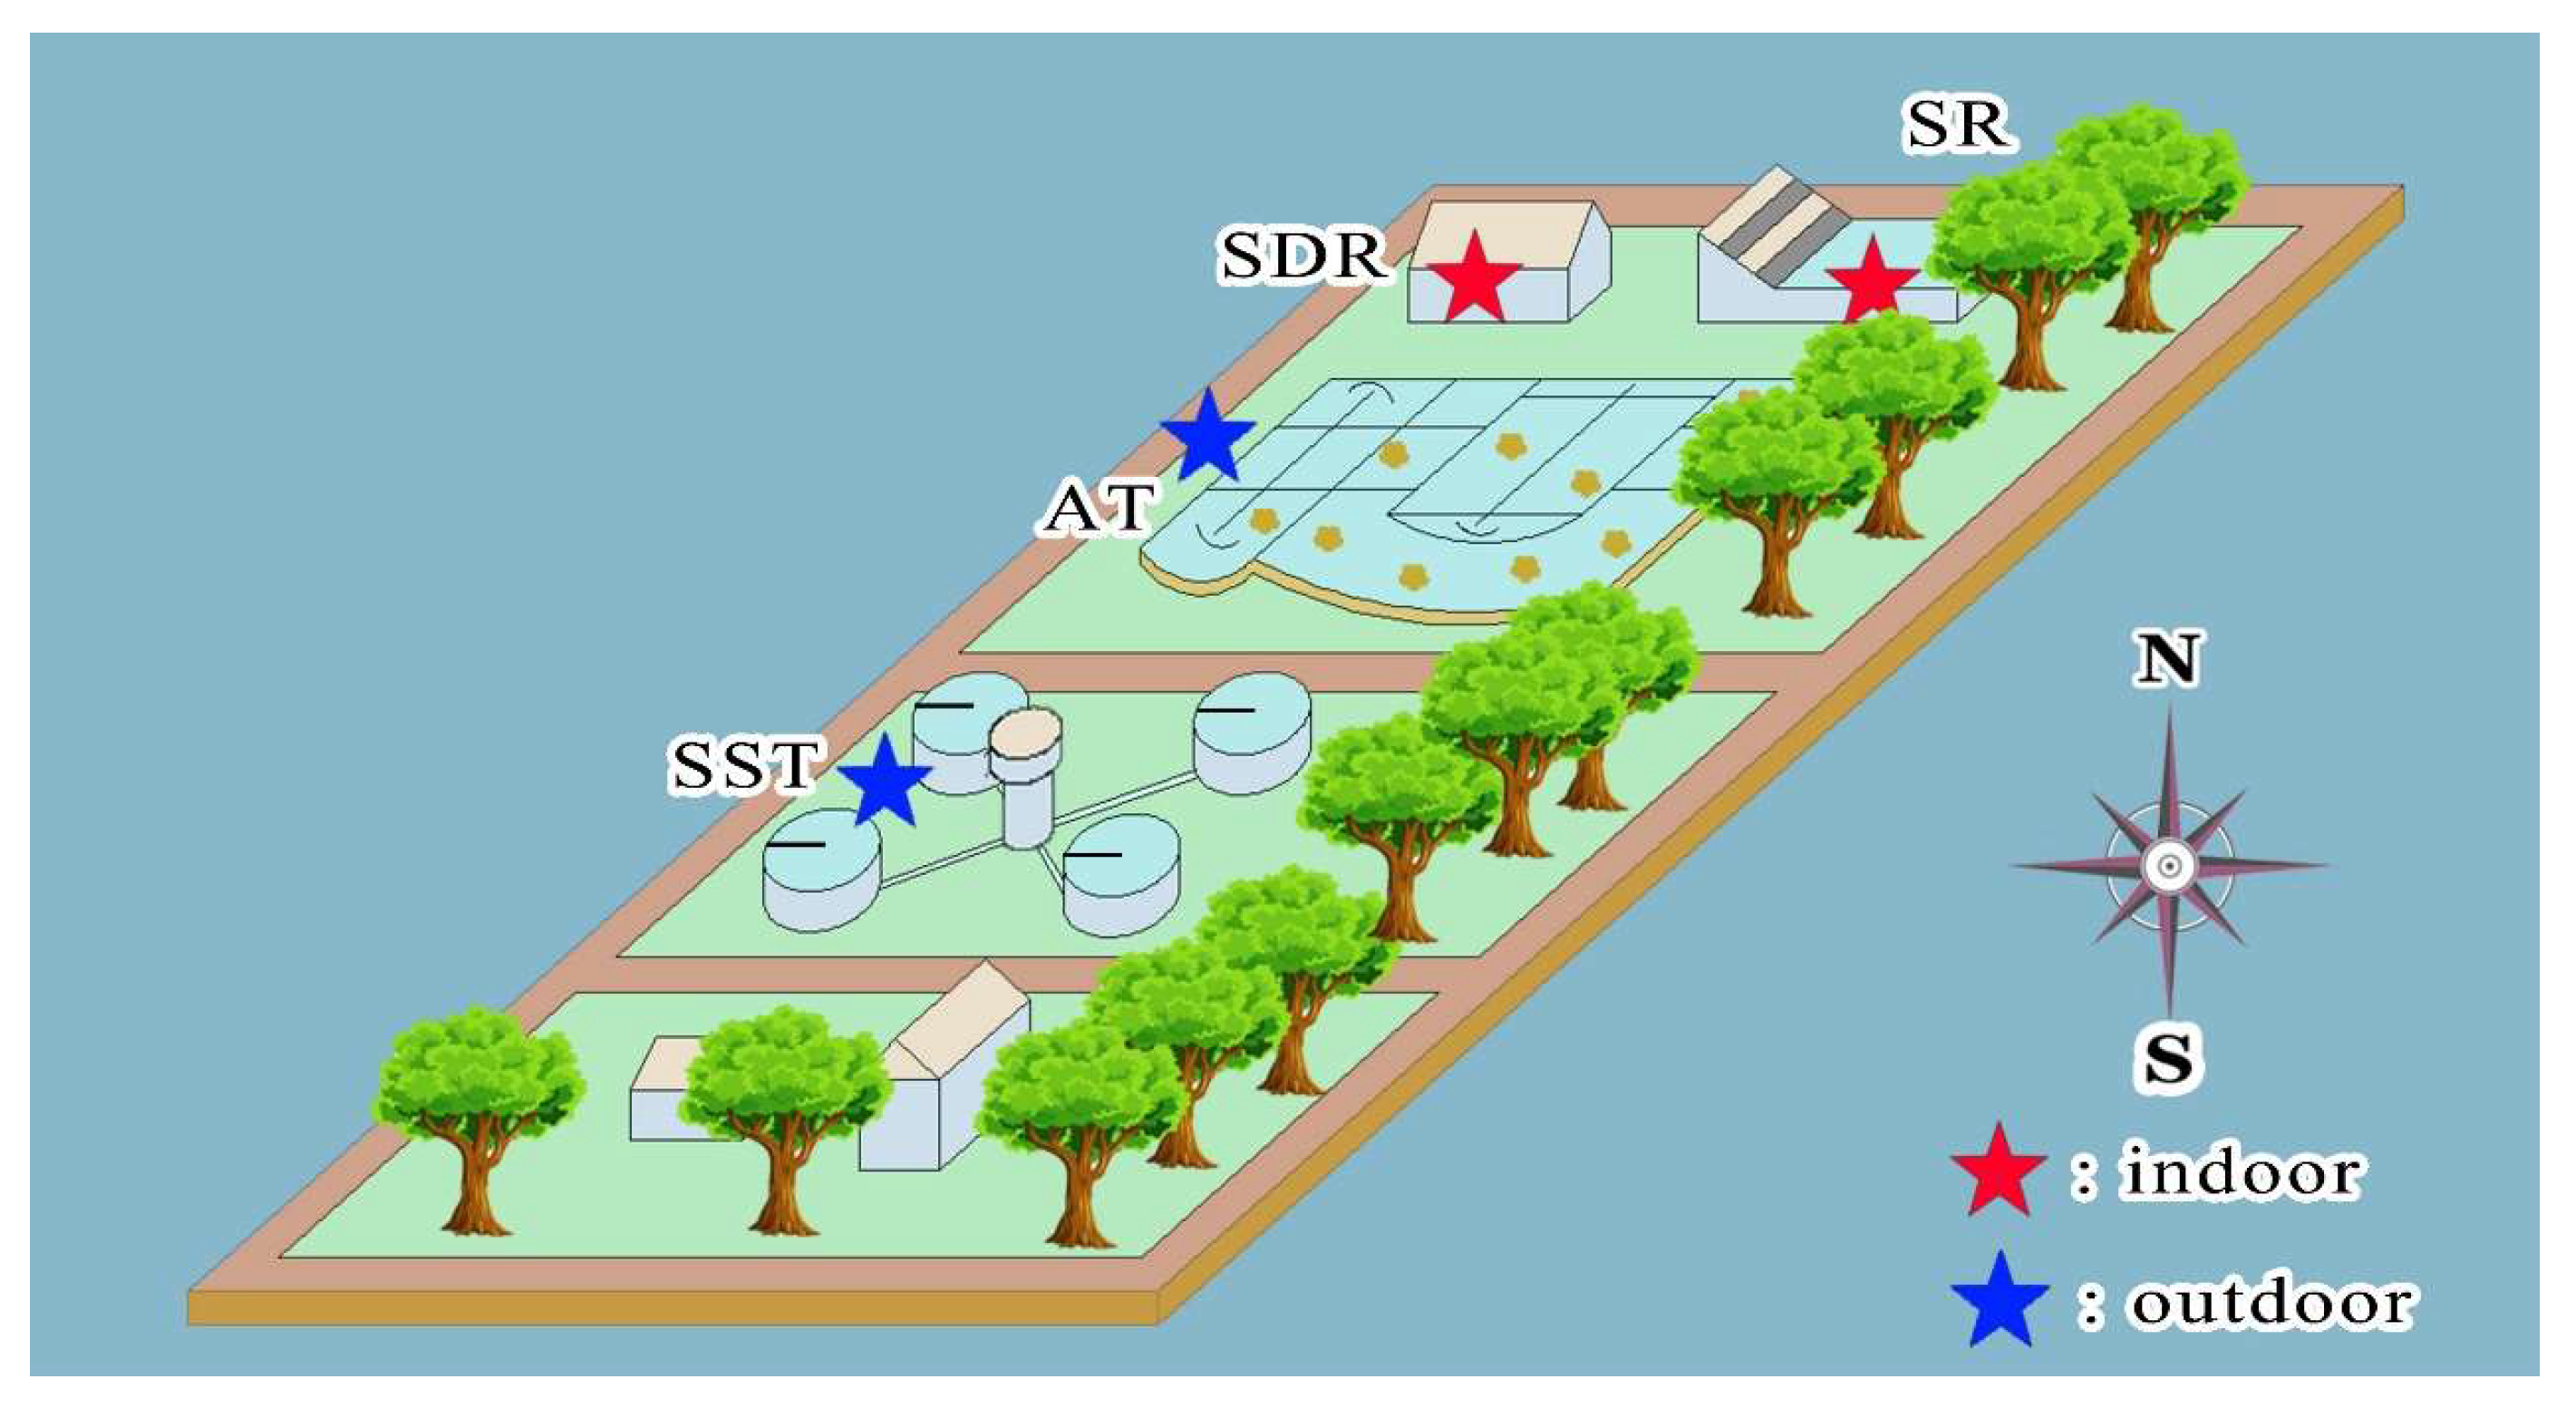
2.1. Description of the WWTPs and Sampling Sites

Sampling sites were established in two WWTPs in Changchun, China. In Plant C, urban domestic sewage from the surrounding residential areas (about 81.6 km2) represented about 53% of the influent water (industrial wastewater and others: 47%); it serves around 5 × 10⁵ people, with daily treatment capacities of 2 × 10⁴ m3. In Plant D, about 71% of the influent water was primarily urban domestic sewage from the surrounding residential areas (about 60 km2) (industrial wastewater and others: 29%); it serves around 3 × 10⁵ people, with daily treatment capacities of 1 × 10⁴ m3. Both plants use fine bubble aeration in the oxic tank of the A2O process. Four sampling sites were established to investigate the microbial diversity of the bacterial aerosols in Plant C and Plant D (Figure 1): the aeration tank (AT, biological treatment sections); the sludge dewatering room (SDR, sludge treatment sections); the secondary settling tank (SST, pretreatment sections); and the screen room (SR, pretreatment sections). The aerosol and wastewater samples were collected in the summer (July–August), autumn (October), and winter (December) of 2021.

2.2. Bioaerosols and Wastewater Collection

Before each sample was collected, the Andersen eight-stage sampler (aerodynamic diameter: I: > 9.0, II: 5.8–9.0, III: 4.7–5.8, IV: 3.3–4.7, V: 2.1–3.3, VI: 1.1–2.1, VII: 0.65–1.1, and VIII: 0.43–0.65 μm; Andersen, Cleves, OH, USA) were cleaned with 75% ethanol. The quartz membranes (Munktell, Falun, Sweden) were pre-sterilized by baking at 500 °C for 5 h in a muffle furnace, and placed in sterile filter storage boxes to reduce the contamination of the sampling equipment during transport. In addition, a filter was brought to the sample sites, and was not connected to a pump to serve as a blank filter.
The Andersen eight-stage sampler was placed 1.5 m above the ground to mimic the average nostril height of a standing person. Each sampler was set at the flow rate of 28.3 L/min and ran for 8 h (from 8 a.m. to 4 p.m.). The quartz membranes were changed every 4 h to prevent reductions in sampling efficiency due to prolonged use [18]. In the summer, aerosol samples were collected at eight sampling sites (AT, SST, SR, SDR of Plant C and Plant D), while wastewater samples were collected at six sample sites of wastewater treatment (AT, SST, SR of Plant C and Plant D). In the autumn and winter, aerosol samples were collected in the AT of Plant D. A total of 80 aerosol samples and six wastewater samples were collected. The collected membranes were stored at −80 °C for subsequent DNA extraction.
During each sampling event, solar radiation, wind speed (WS), temperature (T), and relative humidity (RH) were real-time measured using an irradiance meter (Delta OHM, Padova, Italy), a portable anemometer (Delta OHM, Padova, Italy) and a thermohygrometer (Delta OHM, Padova, Italy), respectively. All meteorological conditions have been listed in Table S1.

2.3. DNA Extraction

The membranes were placed in 100 mL centrifuge tubes with 60 mL of 1× PBS buffer (pH: 7.4; Cytiva, MA, USA) and centrifuged (200 g, 4 °C, 3 h) as described previously [28]. The centrifuged liquid was filtered through a 0.22 μm pore filter membrane (Pall, Port Washington, NY, USA). Due to the difficulty of extracting DNA from air samples, the high-quality and high-purity DNA samples were extracted using a combination of the QIAGEN DNeasy Power Soil Pro Kit (Qiagen, Dusseldorf, Germany) and Magic DNA Select Beads (Magic, Hangzhou, China). DNA was extracted from the paired wastewater samples (200 mL) using the QIAGEN DNeasy Power Water Kit (Qiagen, Dusseldorf, Germany).

2.4. Amplicon Sequencing and Bioinformatic Analysis

The hypervariable V3 and V4 regions of 16S rRNA were amplified in triplicate using the bacterial primers 338F/806R [29]. PCR products were detected using 2.0% agarose gels and purified using the AxyPrep DNA Gel Extraction Kit (AxyPrep, Union City, CA, USA). Both amplicon library construction and sequencing were performed on an Illumina Miseq PE300 platform (Illumina Inc., San Diego, CA, USA; Majorbio, Shanghai, China). Raw read files have been uploaded to the NCBI SRA database, under the access number PRJNA894540.
Using the demux plugin of Qiime2 [30] (version 2020.2), raw sequences were demultiplexed and their quality was evaluated. The DADA2 plugin of Qiime2 created the ASV (Amplicon Sequence Variant) database by performing paired-end read stitching, quality filtering, and chimeric variant filtering [31]. The taxonomy of assignment of ASVs was annotated using the Naive Bayesian consensus taxonomy classifier implemented in Qiime2 and the SILVA 16S rRNA database [32] (v138).

2.5. Statistical Analysis

The alpha diversity indices for the amplicon sequence variants (ASVs), including observed ASVs, the Chao1 index, and the Shannon index, were calculated with Mothur v1.30.1 [33]. The similarities among the microbial communities from various samples were visualized using principal coordinate analysis (PCoA) based on Bray–Curtis and unweighted UniFrac dissimilarity values using the Vegan v2.5-3 package in R [34]. The percentage of variation explained by treatment and the corresponding statistical significance were determined using the permutational multivariate analysis of variance (PERMANOVA) test, as implemented in the Vegan v2.5-3 package in R. The linear discriminant analysis (LDA) effect size (LEfSe) (http://huttenhower.sph.harvard.edu/LEfSe, accessed on 21 October 2021) was performed to identify the taxa that were significantly characteristic of each period [35] (LDA score > 4, p < 0.05).

3. Results and Discussion

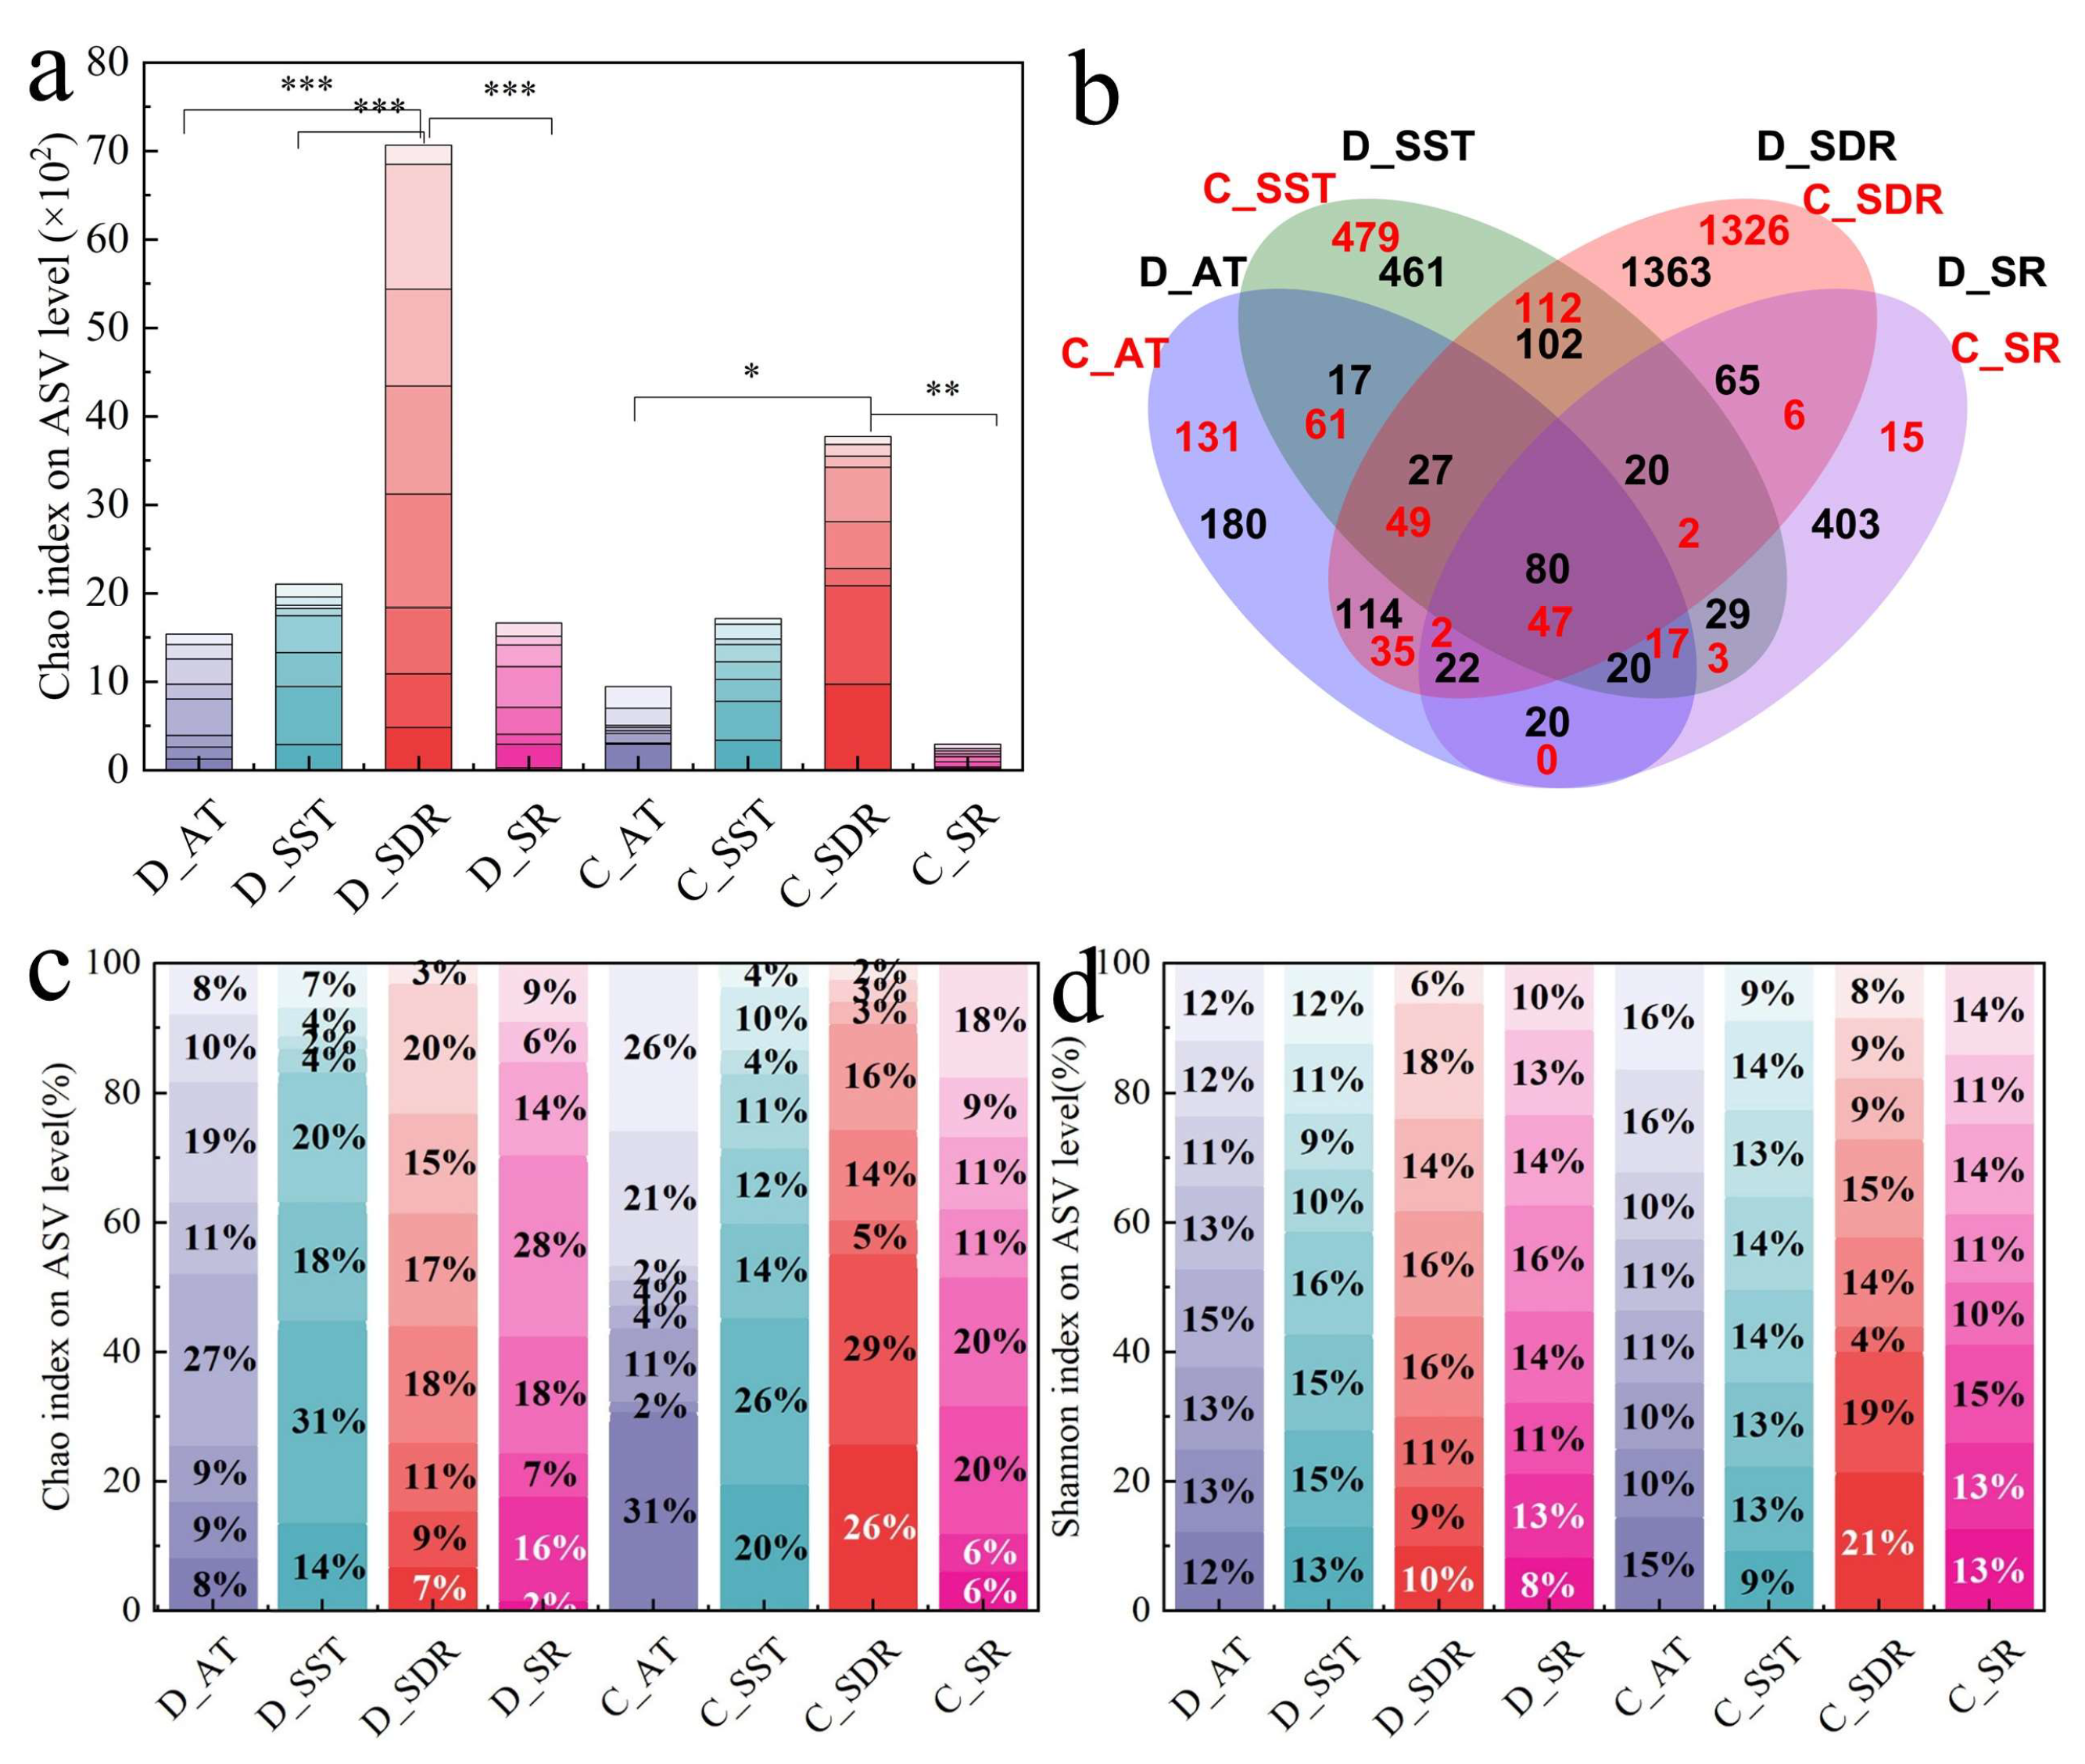
3.1. Emission Levels and Size Distributions of Bacteria Aerosols

A total of 5,665 bacterial ASVs were obtained by rarefying 86 samples with the minimum number of sample sequences. In the Plant C, the numbers of bacterial ASVs were 342, 770, 1,579, and 92 (four sampling sites: AT, SST, SDR, and SR), respectively, while the numbers of bacterial ASVs in the Plant D were 480, 756, 1,793, and 659 (four sampling sites: AT, SST, SDR, and SR), respectively (Figure 2b).
The relative abundance of bacterial aerosols in each treatment units from the WWTPs was examined. In the Plant D, Chao index was the greatest in the SDR (7067.57), followed by the SST (2102.91), the SR (1666.15), and the AT (1536.68) (Figure 2a). Abundance patterns were similar between Plant C and Plant D. From the first to the eighth stage of the SDR, the relative abundance of bacterial aerosols was greater than that at the corresponding stage in the other treatment units, with the seventh stage (0.65–1.1 μm) being the most significant (a 4-fold to 9-fold increase compared to the seventh stage in any other treatment unit). Liu et al. [36] found similar the results (based on the culturable) that the SDR was a primary source of aerosols in WWTPs. Due to the high concentrations of microbes in the sludge, the compression of the solid particles and the descent of the sludge can lead to the aerosolization of a significant number of microorganisms that cling to the sludge surface [18]. Additionally, the results also showed that the abundances of the four sampling sites corresponding to Plant D was higher than those of Plant C. It caused by differences such as the more suitable environment (Table S1), greater abundance of wastewater (Figure S1), lack of deodorization (Figure S2), and other factors in Plant D [8].
The pathophysiological effects of bioaerosols depend strongly on particle size distribution [37]. While variations in diversity were not significant (about 12%; Figure 2d), there were great fluctuations in the relative abundance of different particle sizes in the WWTPs (2–31%, Figure 2c). Particles of a certain size (<3.3 µm) are known as respirable fraction [38]. The results showed that five sample sites (D_SR: 57.4%, D_SDR: 55.8%, C_AT: 52.7%, C_SR: 48.4% and D_AT: 47.8%) had a respirable fraction proportion of about 50%, and three sample sites (C_SST: 28.5%, C_SDR: 25.6% and D_SST: 16.9%) had a respirable fraction proportion of about 25% (Figure 2c). Overall, with the exception of the SST, respirable fraction of other treatment units was a higher proportion. Previous investigations based on the culturable to find similar results [24]. Respirable fraction is one of the primary contributors to inflammation and can reach deeper positions in the human body [38]. Therefore, it is essential to focus seriously on the health risks that bioaerosols and particle size cause to humans.

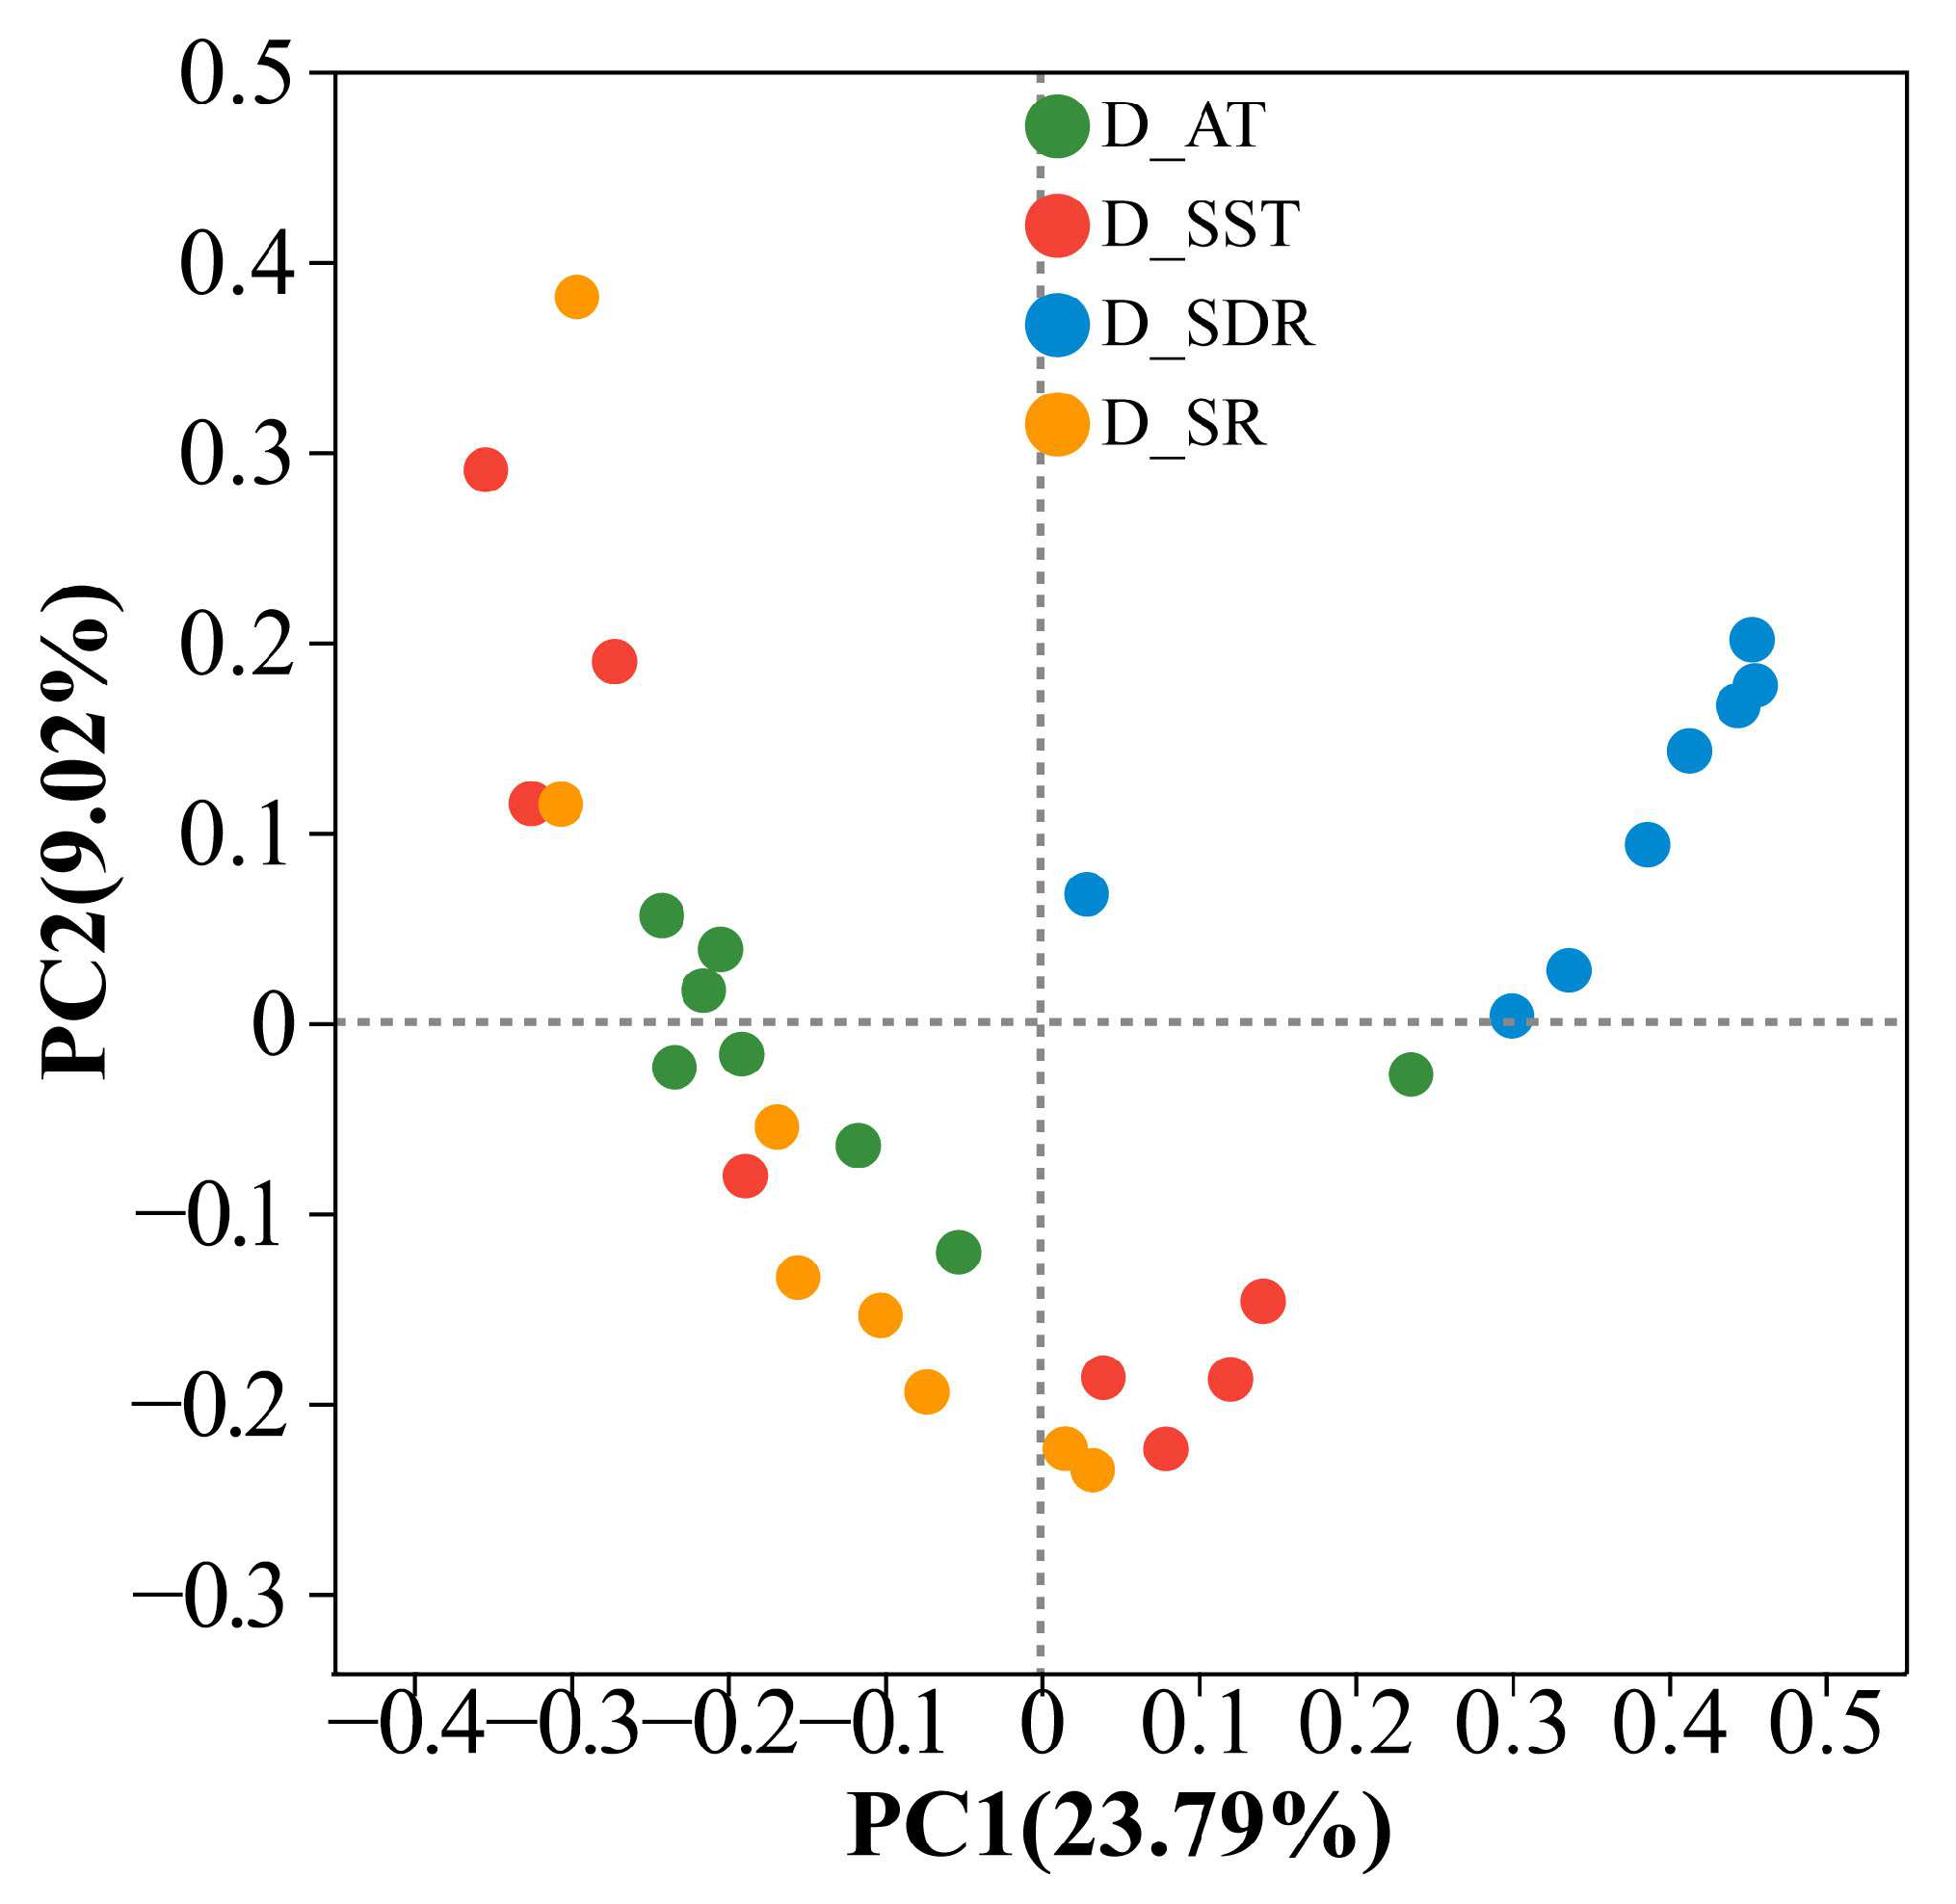
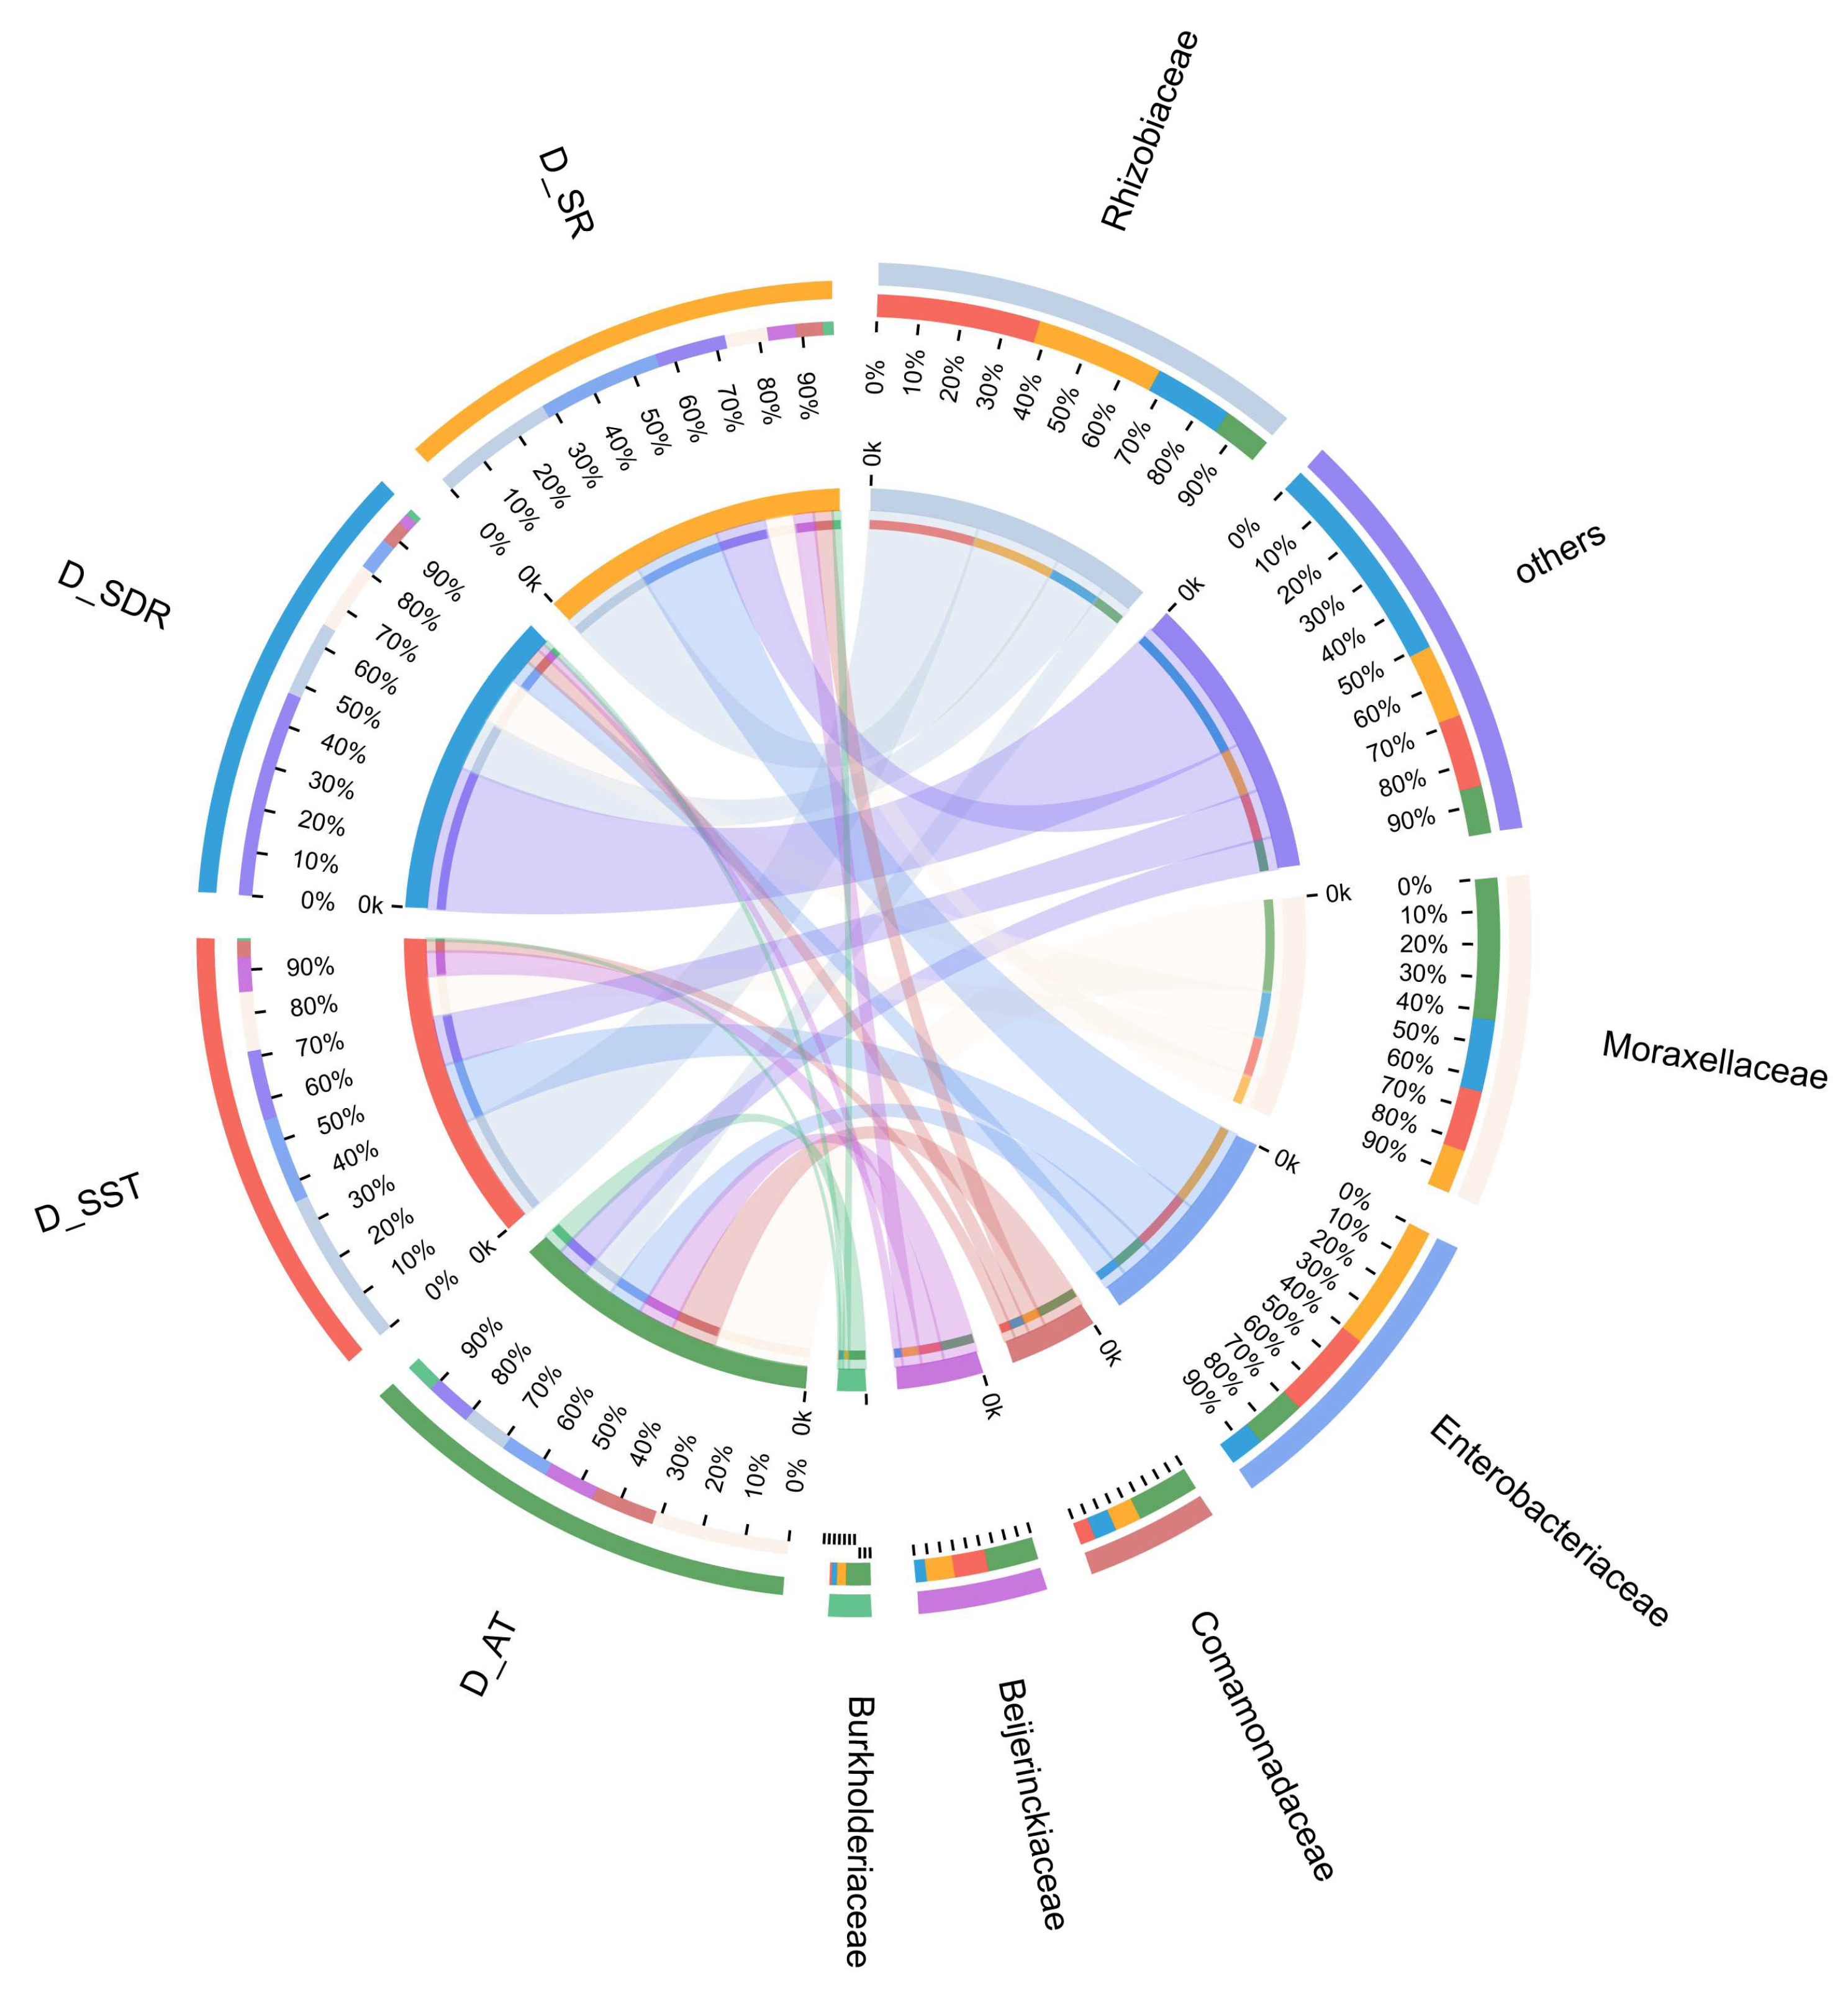
3.2. Bacterial Aerosols Community Composition

The microbial community composition was investigated using a PCoA based on unweighted UniFrac distances. Treatment units were separated on the first central coordinate (Figure 3 and Figure S3), and PERMANOVA confirmed that treatment unit was the largest source of variation among microbial communities (Plant C: 27.89% of the variance, p < 0.002; Plant D: 35.52% of the variance, p < 0.002). The second largest source of variation was particle size (Plant C: 7.33% and Plant D: 4.54% of the variance), and there was no significant variability among the groups (p > 0.05). Therefore, treatment unit had a greater effect on variations in bacterial aerosols’ community composition than particle size. Similar patterns have been found in other environments. For instance, a previous study showed that the type of poultry house had a more significant effect on microbial community composition than particle size [39]. To further explore differences of treatment unit, variations in relative abundance for the 15 most abundant families across all treatment units were analyzed using the Kruskal–Wallis H test (Figure S4a,b) and visualized using the Circos (Figure 4 and Figure S5). This analysis identified 11 families (11/15) that had distinct differences (p < 0.05). Once again, it was verified that treatment units have a large impact on aerosol community composition [8,22]. Previous investigations found that the variations in airborne bacterial ecology among treatment units were mainly caused by the different sources of bacteria (different wastewater and sludge and background atmospheric sources), environmental conditions (solar radiation, WS, T, and RH), and mechanical facilities [40].
To further explore differences of particle size, variations in relative abundance for the 10 most abundant families across all particle size were analyzed using the Kruskal–Wallis H test (Figure S6). The dominant family in both the SDR and the SR was Enterobacteriaceae. In the SDR, relative abundance of Enterobacteriaceae was negatively correlated with particle size (small particle: 36.29%, medium particle: 17.27%, large particle: 5.15%; Figure S6b), while, in the SR, relative abundance of Enterobacteriaceae was positively correlated with particle size (small particle: 24.9%, medium particle: 36.72%, large particle: 49.49%; Figure S6c). This result helps to clarify the effects of particle size on bacterial community composition and demonstrates the larger effect of treatment unit.
Additionally, Enterobacteriaceae were generally used as indicators of potential pathogens (such astoxic pneumonia, chronic bronchitis, and asthma) in WWTPs [11,41]. At the genus level, abundant pathogenic bacteria were also found in both WWTPs. Of the 15 most abundant bacterial genera identified in the Plant C and Plant D (Figure S7a,b), eight and six, respectively, were pathogenic (Acinetobacter, Comamonas, Brevundimonas and Klebsiella, etc.). Previous investigations found similar specie of pathogenic bacteria in WWTPs, which can cause skin, respiratory, urinary tract, and gastrointestinal infections in humans [9,13]. Therefore, we can no longer ignore the danger of bioaerosols and should also test the contribution of wastewater to the bioaerosols of WWTPs.

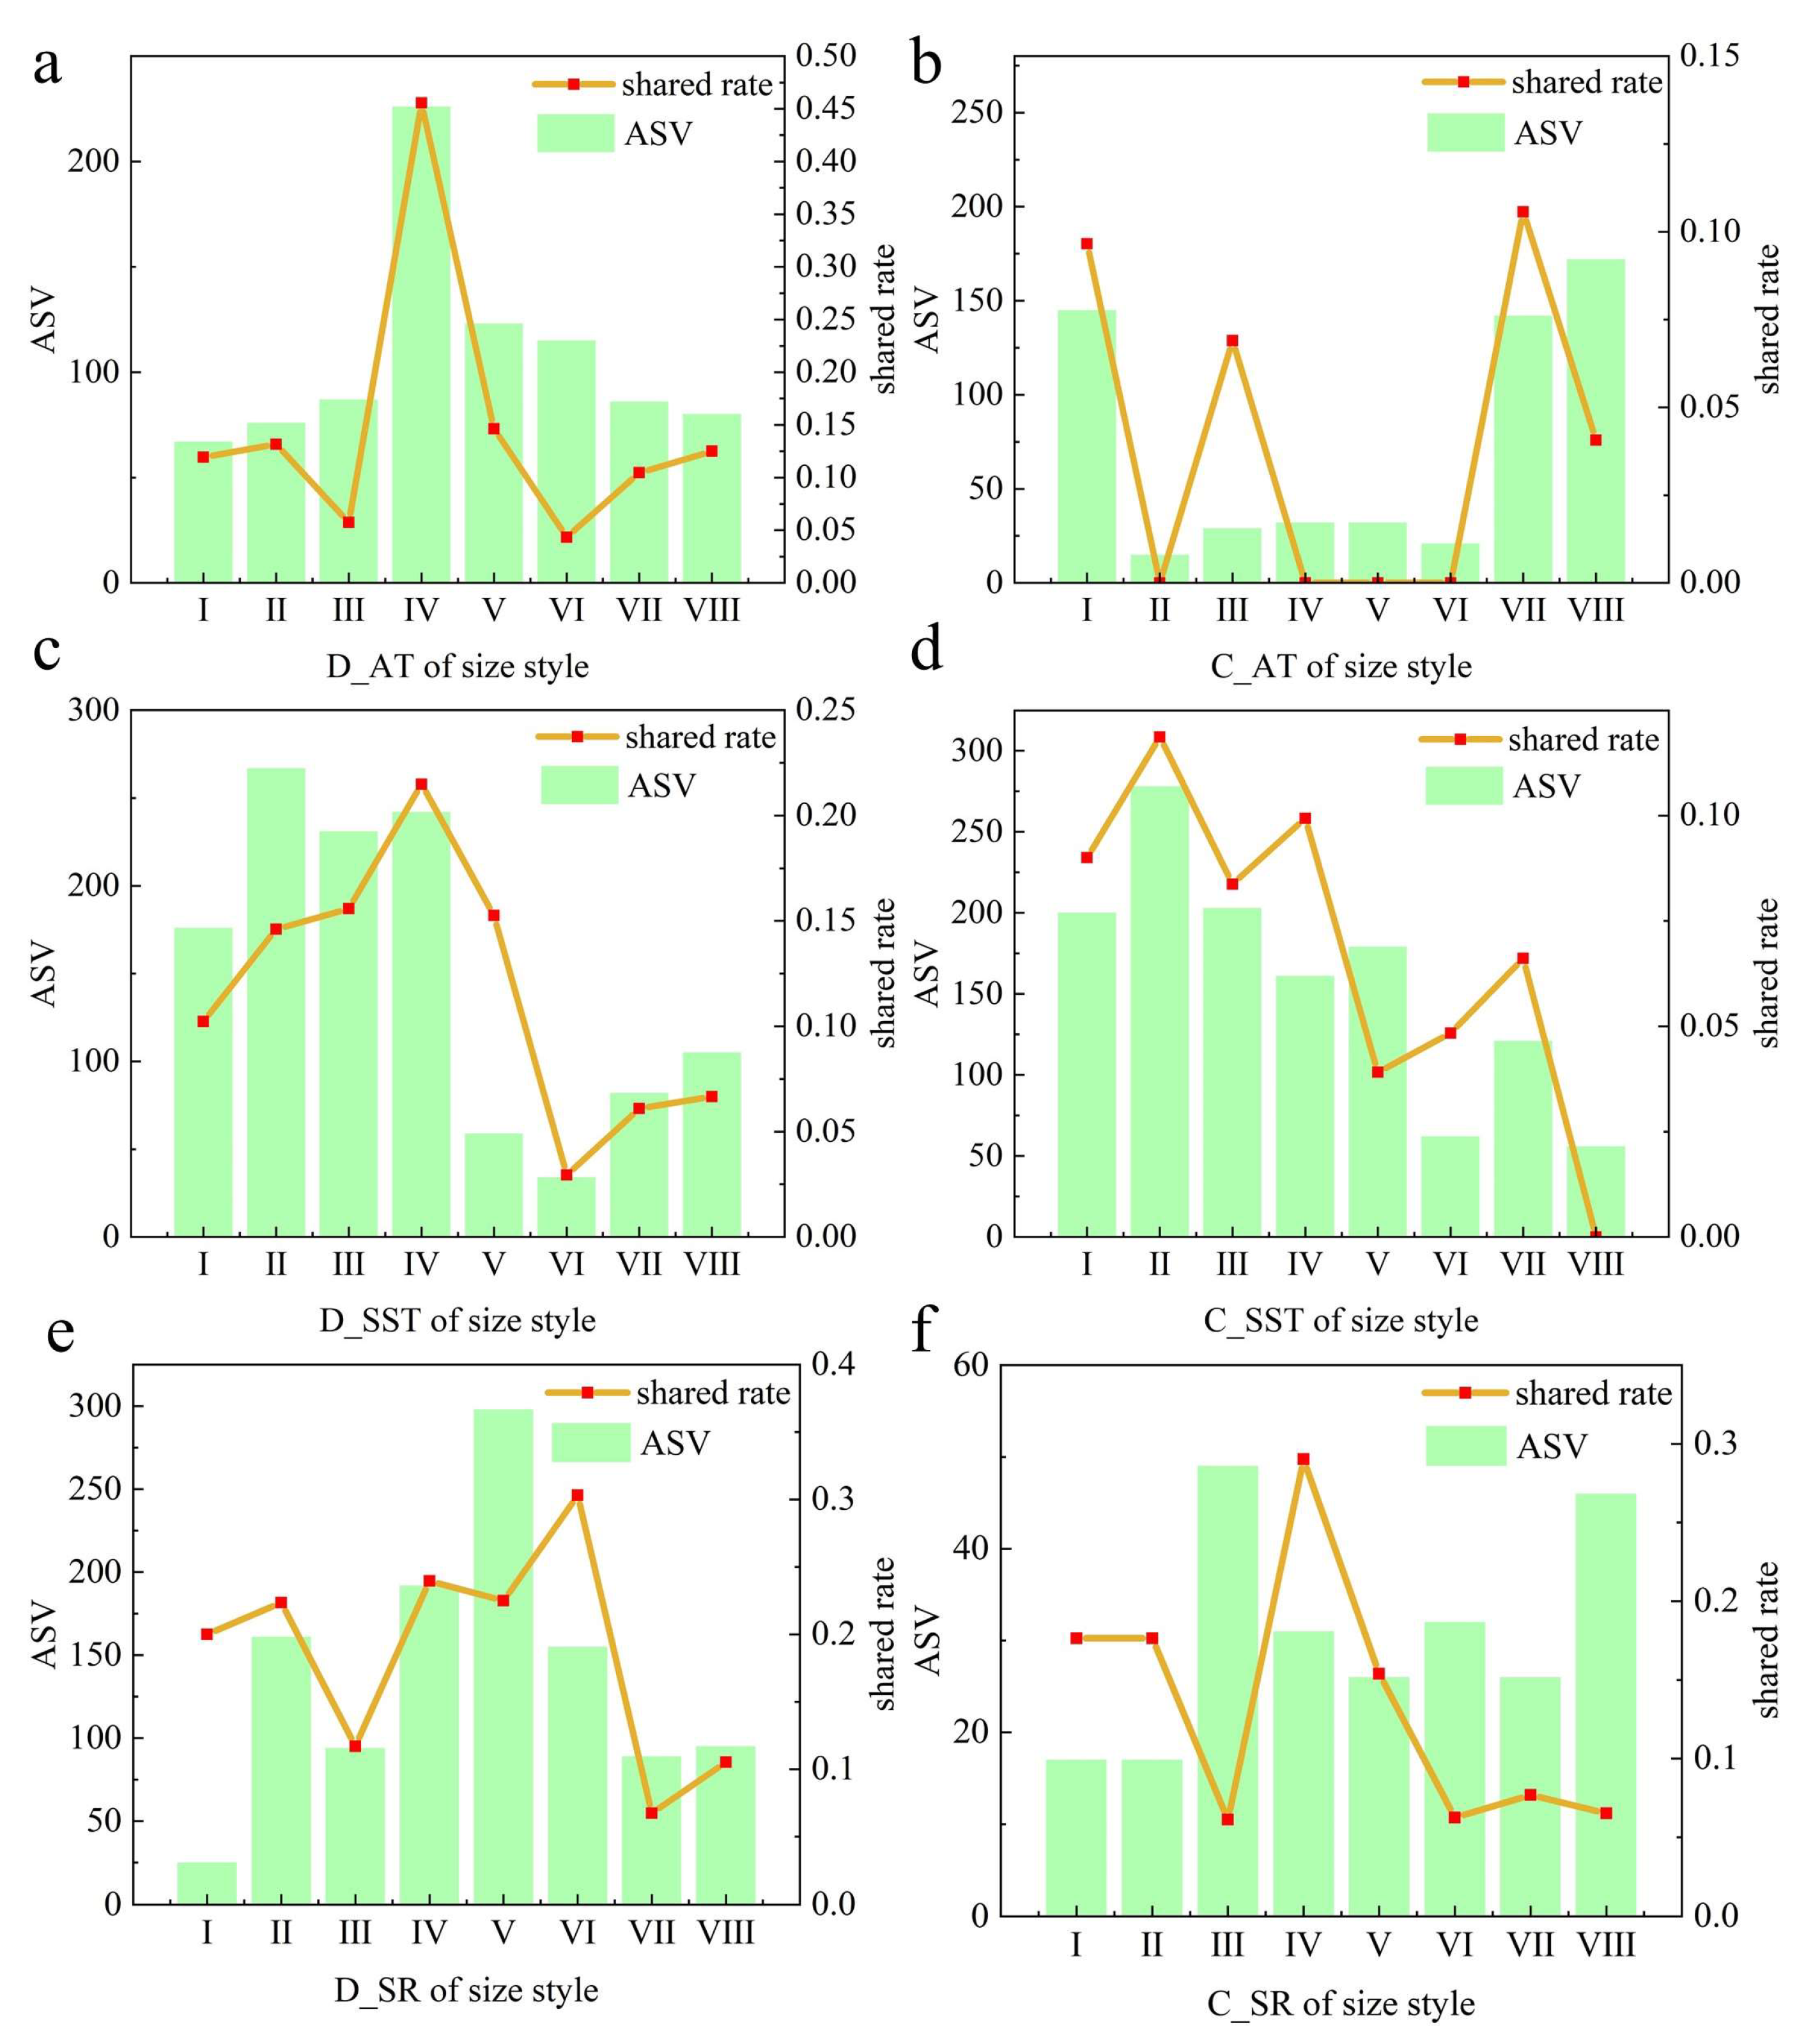
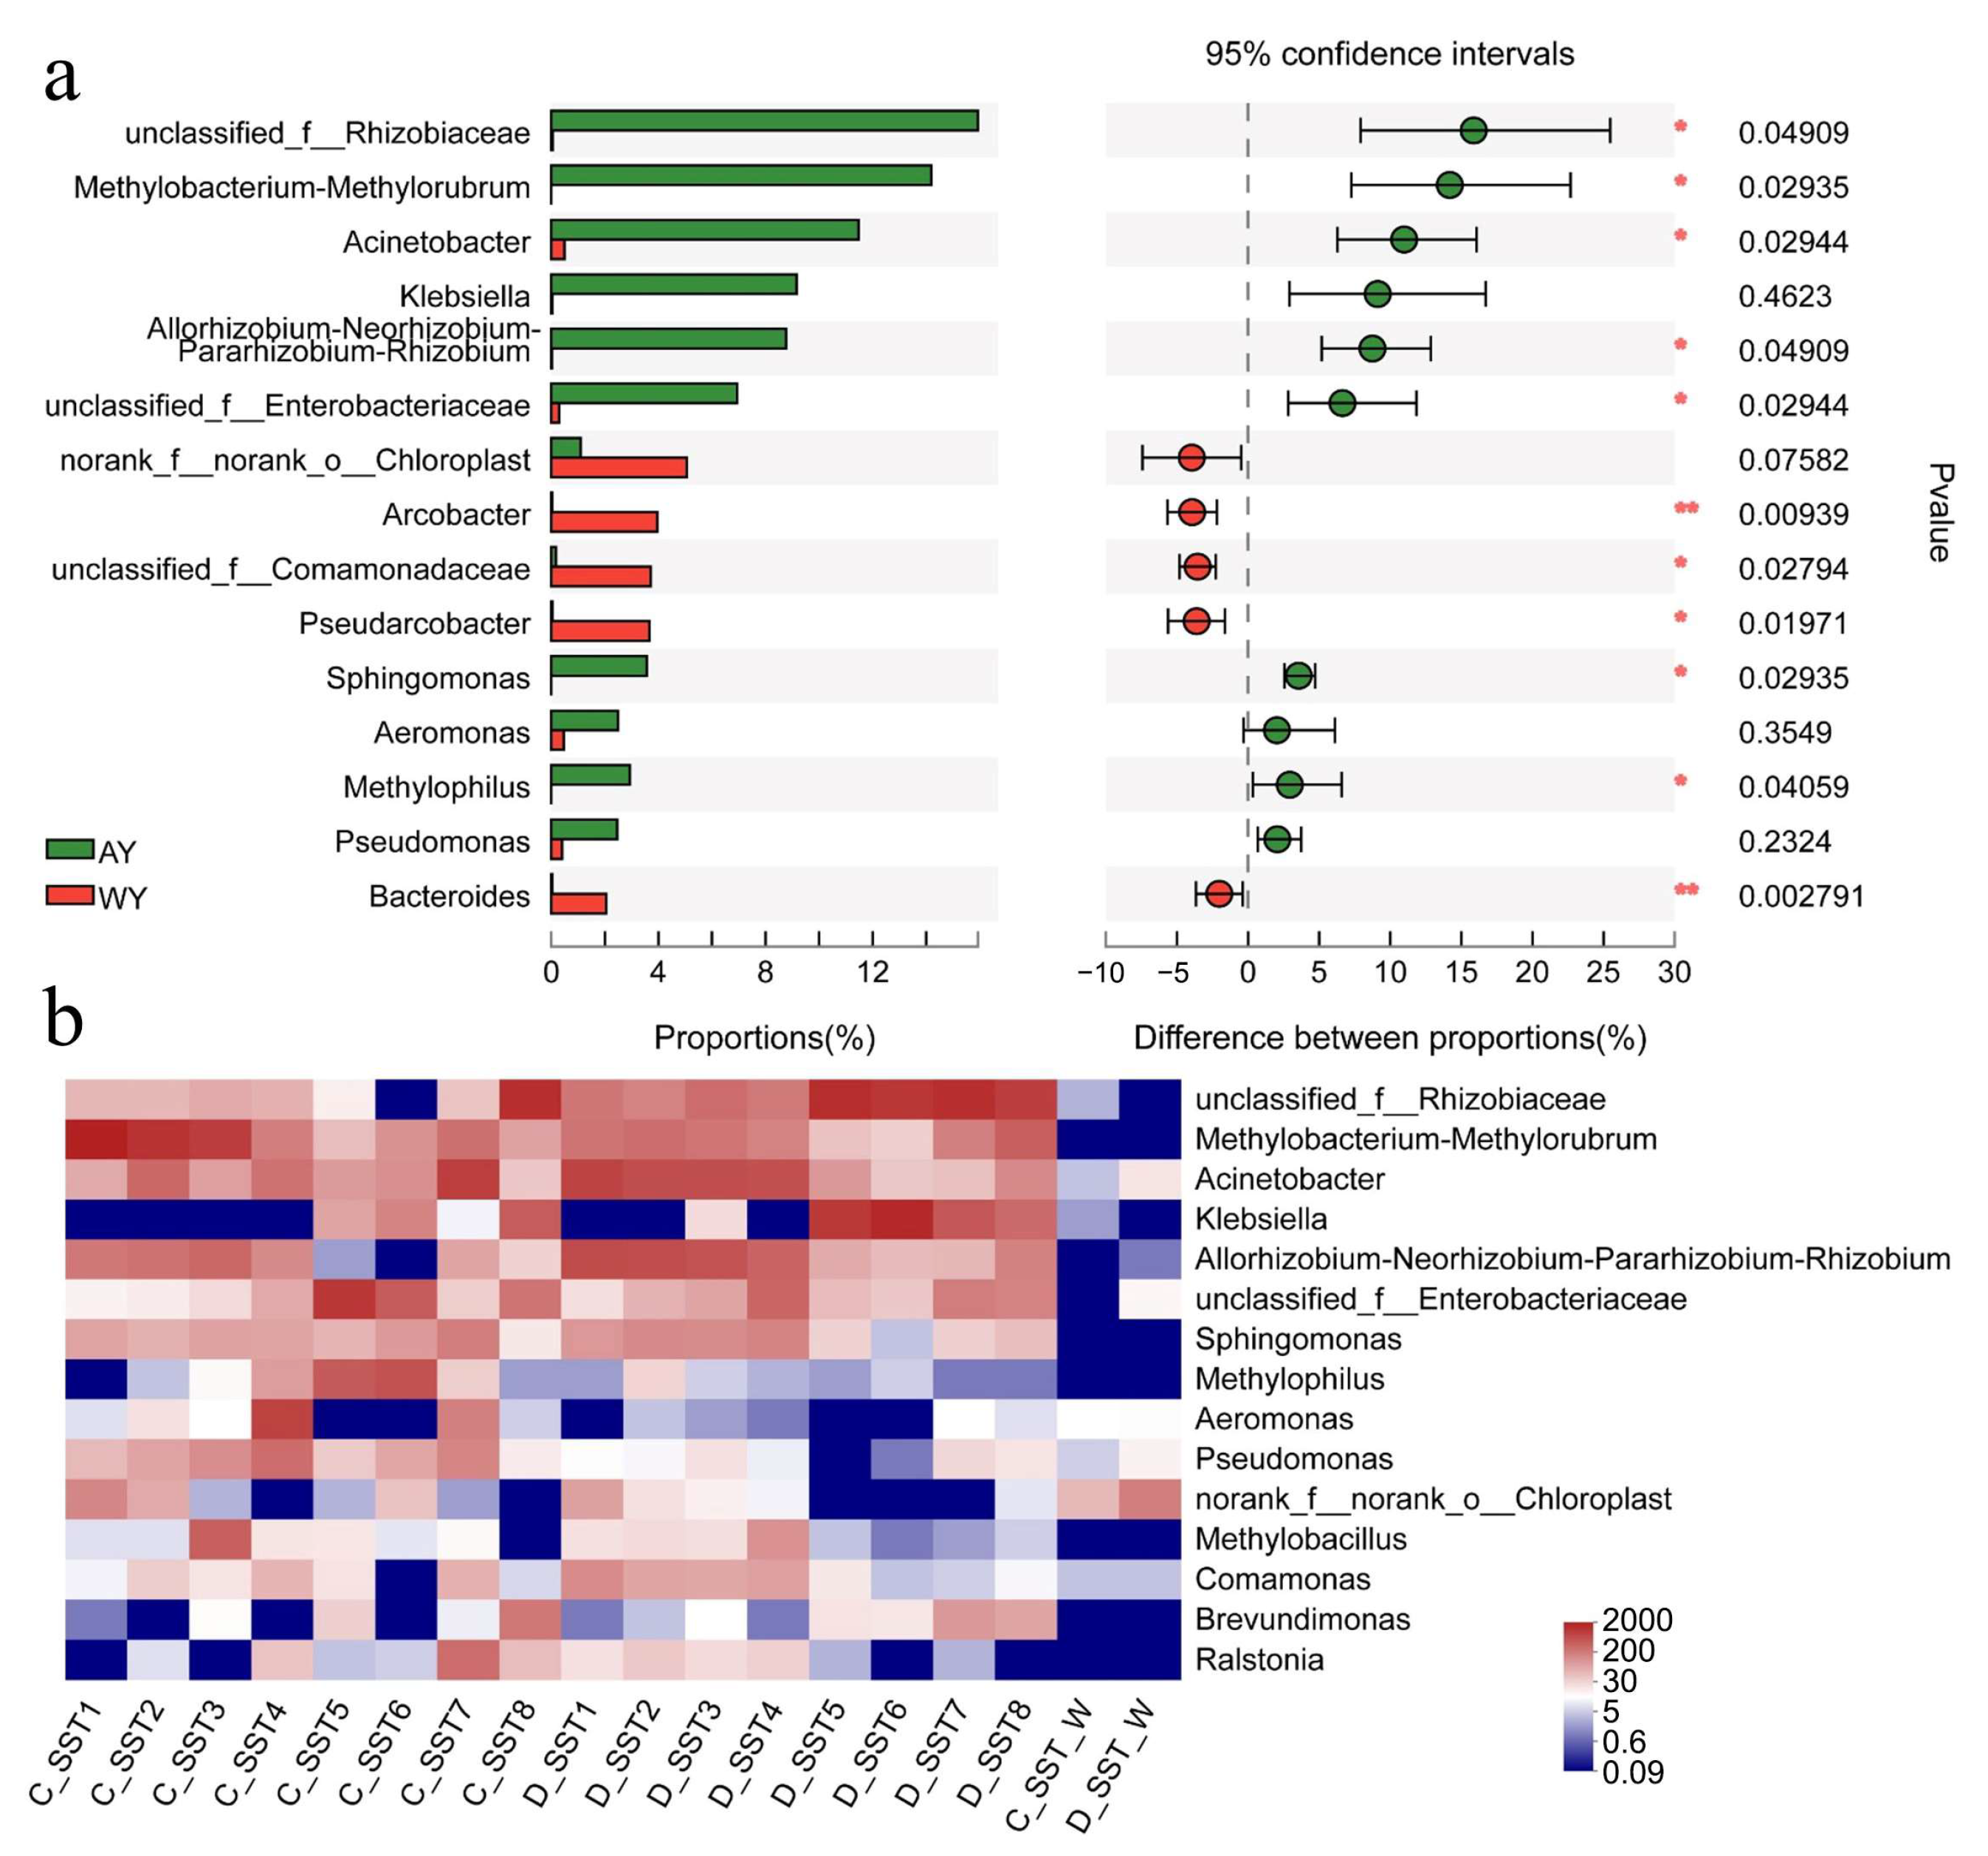
3.3. Contribution of Water Sources to Bacterial Aerosols

As in Figure 5, the contribution of wastewater to the ASV of each particle size sample was explored. The results showed that the largest contribution of wastewater to stage IV (0–45.56%, 3.3–4.7 μm) was observed, and the trend of aerosol ASV amounts between each particle size stage was similar to the contribution of wastewater. This phenomenon solves the problem of the relative abundance of bacterial aerosols being higher in stage IV (3.3–4.7 μm). Yang et al. [23] also detected that 66–69% of the bacterial genera in aerosols were shared with the wastewater samples. Therefore, the wastewater contributes significantly to the bacterial aerosols of the WWTPs.
The differences in community composition between wastewater and aerosols were compared by Wilcoxon rank sum test on genus level. Figure 6a showed that 11 genura of the 15 most abundant genus were distinctly different (p < 0.05) between wastewater and aerosols in SST. Similar differences were found for the SR (10/15 in Figure S8a) and AT (6/15 in Figure S8b). The heat map was used to explore in-depth the differences in the composition of the dominant bacteria between wastewater and aerosols. In the SST, the dominant genera wastewater was unclassified_f_Comamonadaceae (4.91%, Plant C) and norank_f_norank_o_Chloroplast (7.91%, Plant D), respectively; the dominant genera of aerosols were Methylobacterium-Methylorubrum (59.82–32.78%), unclassified_f_Rhizobiaceae (45.97–31.72%), and Acinetobacter (32.05–22.01%) (Figure 6b). Similar results were recovered for wastewater and bacterial aerosols for the AT and SR (Figure S9a,b). The above results show that the dominant bacterial genera in the wastewater had low relative abundance in the aerosols, while the dominant bacterial genera in the aerosols had low relative abundance in the wastewater.
Previous studies have indicated that the dominant bacteria in aerosols was aerosolized easily and survive and reproduce in the atmospheric environment [42]. Consequently, although wastewater is one of the main sources of bacterial aerosols, wastewater does not play a decisive role in the formation of aerosol community structure [21] (other factors: the ability of the microorganisms and environmental conditions). In addition to wastewater, sludge and external air are also essential sources of bacterial aerosols in WWTPs [43,44].

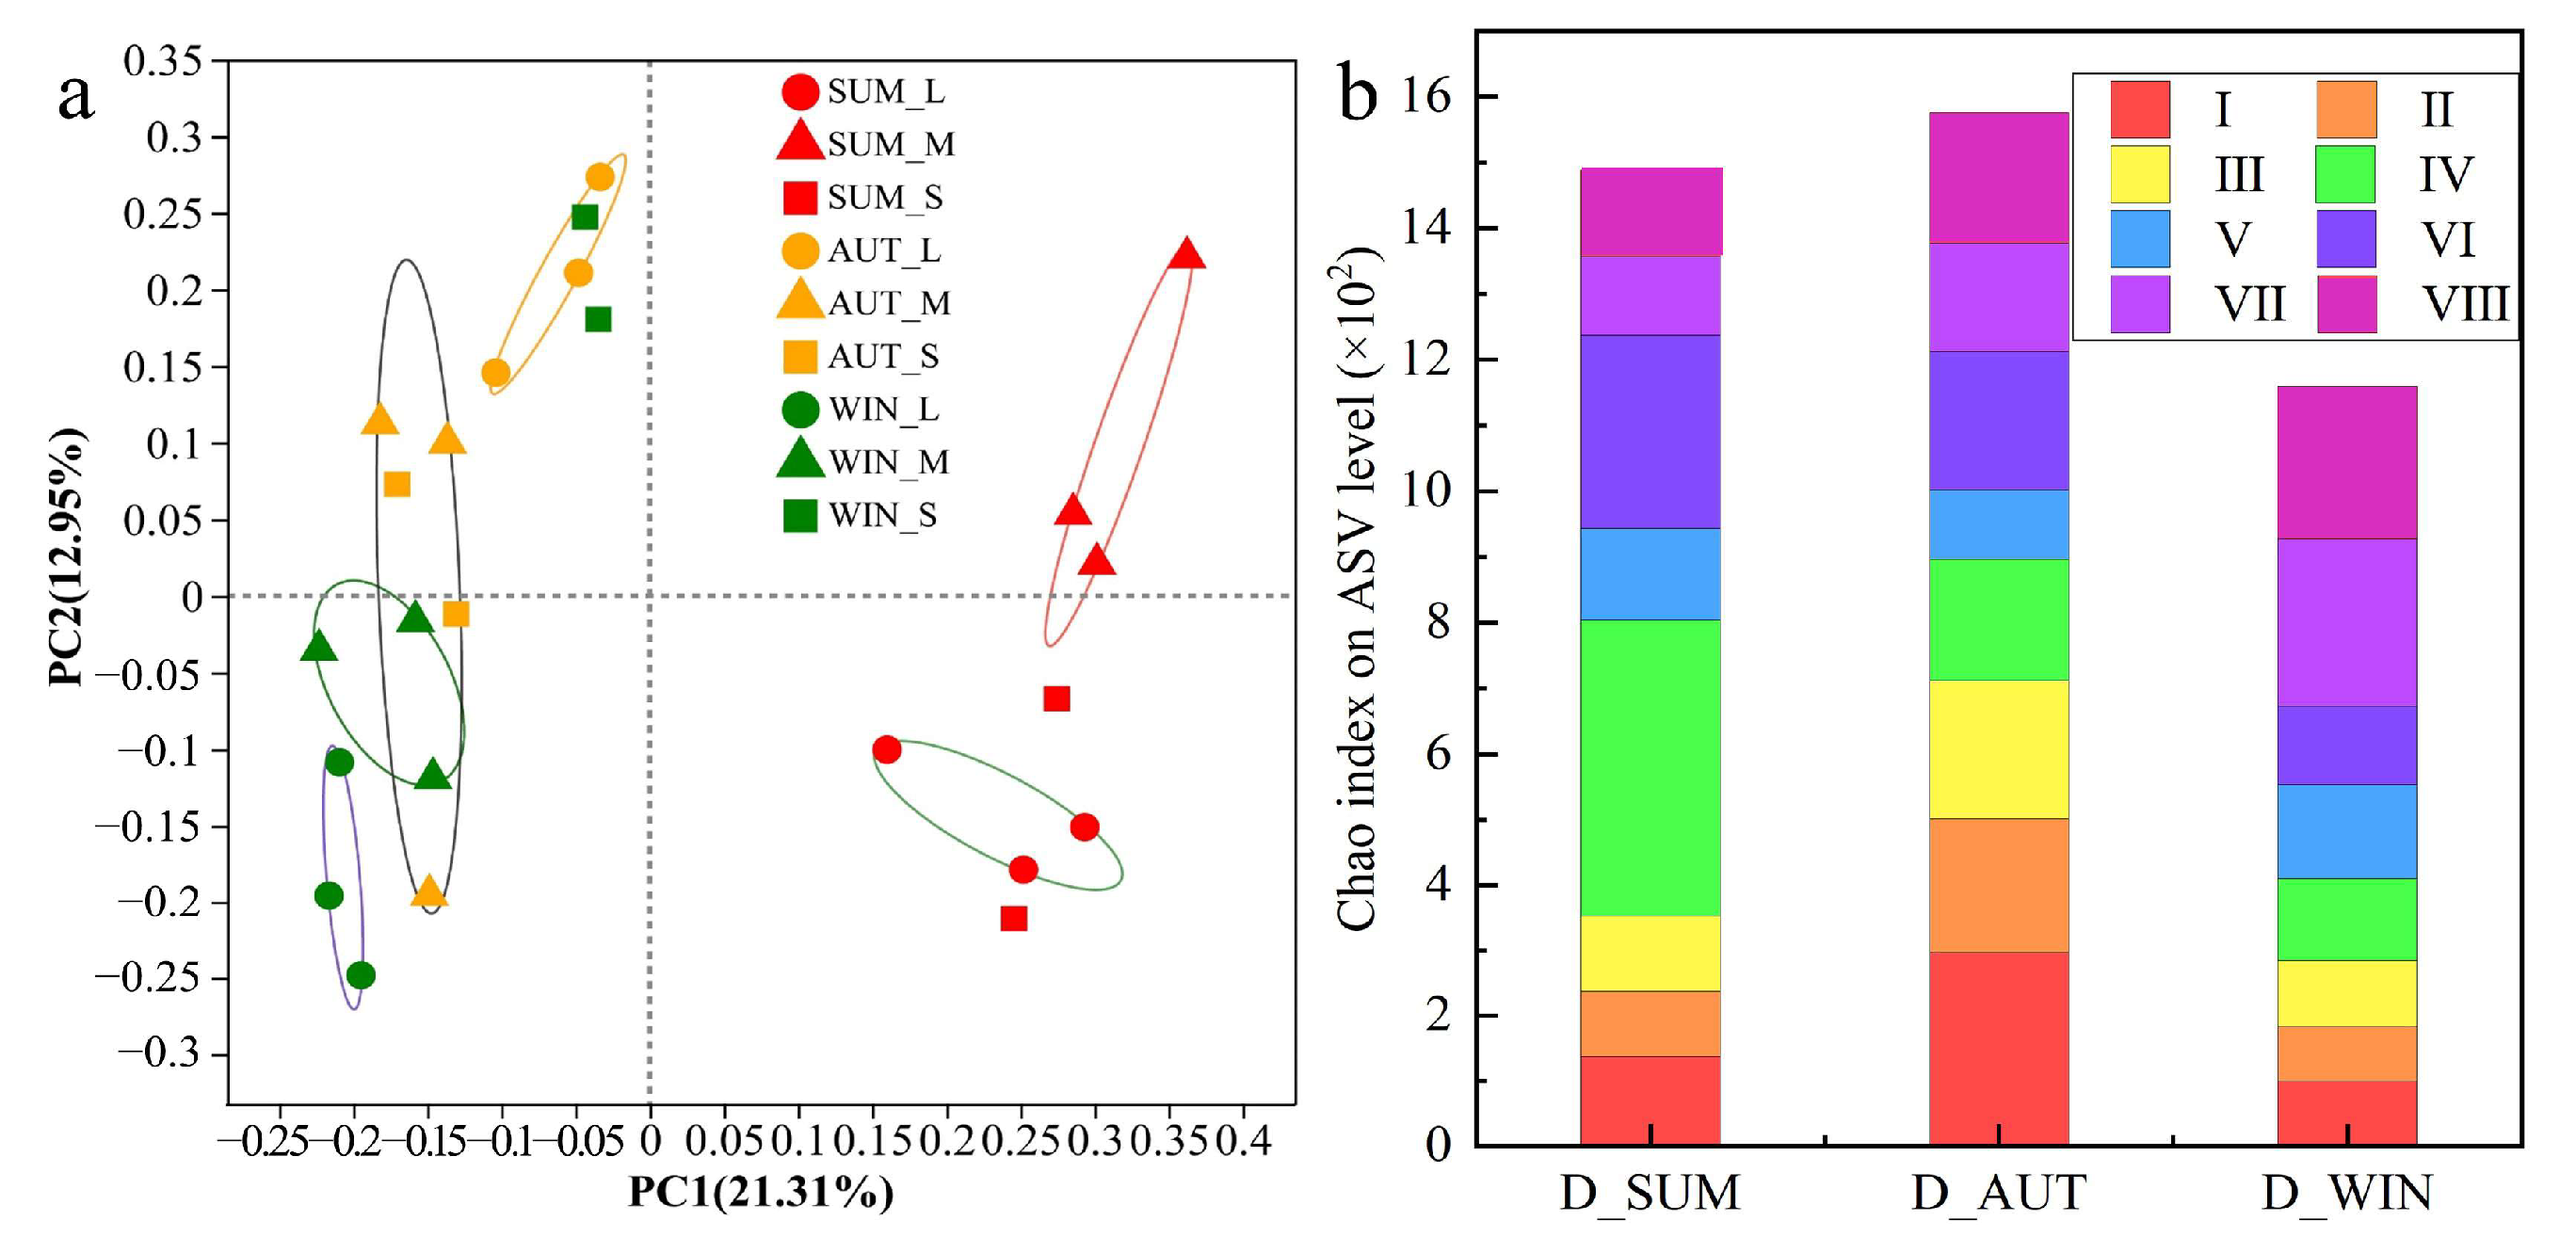
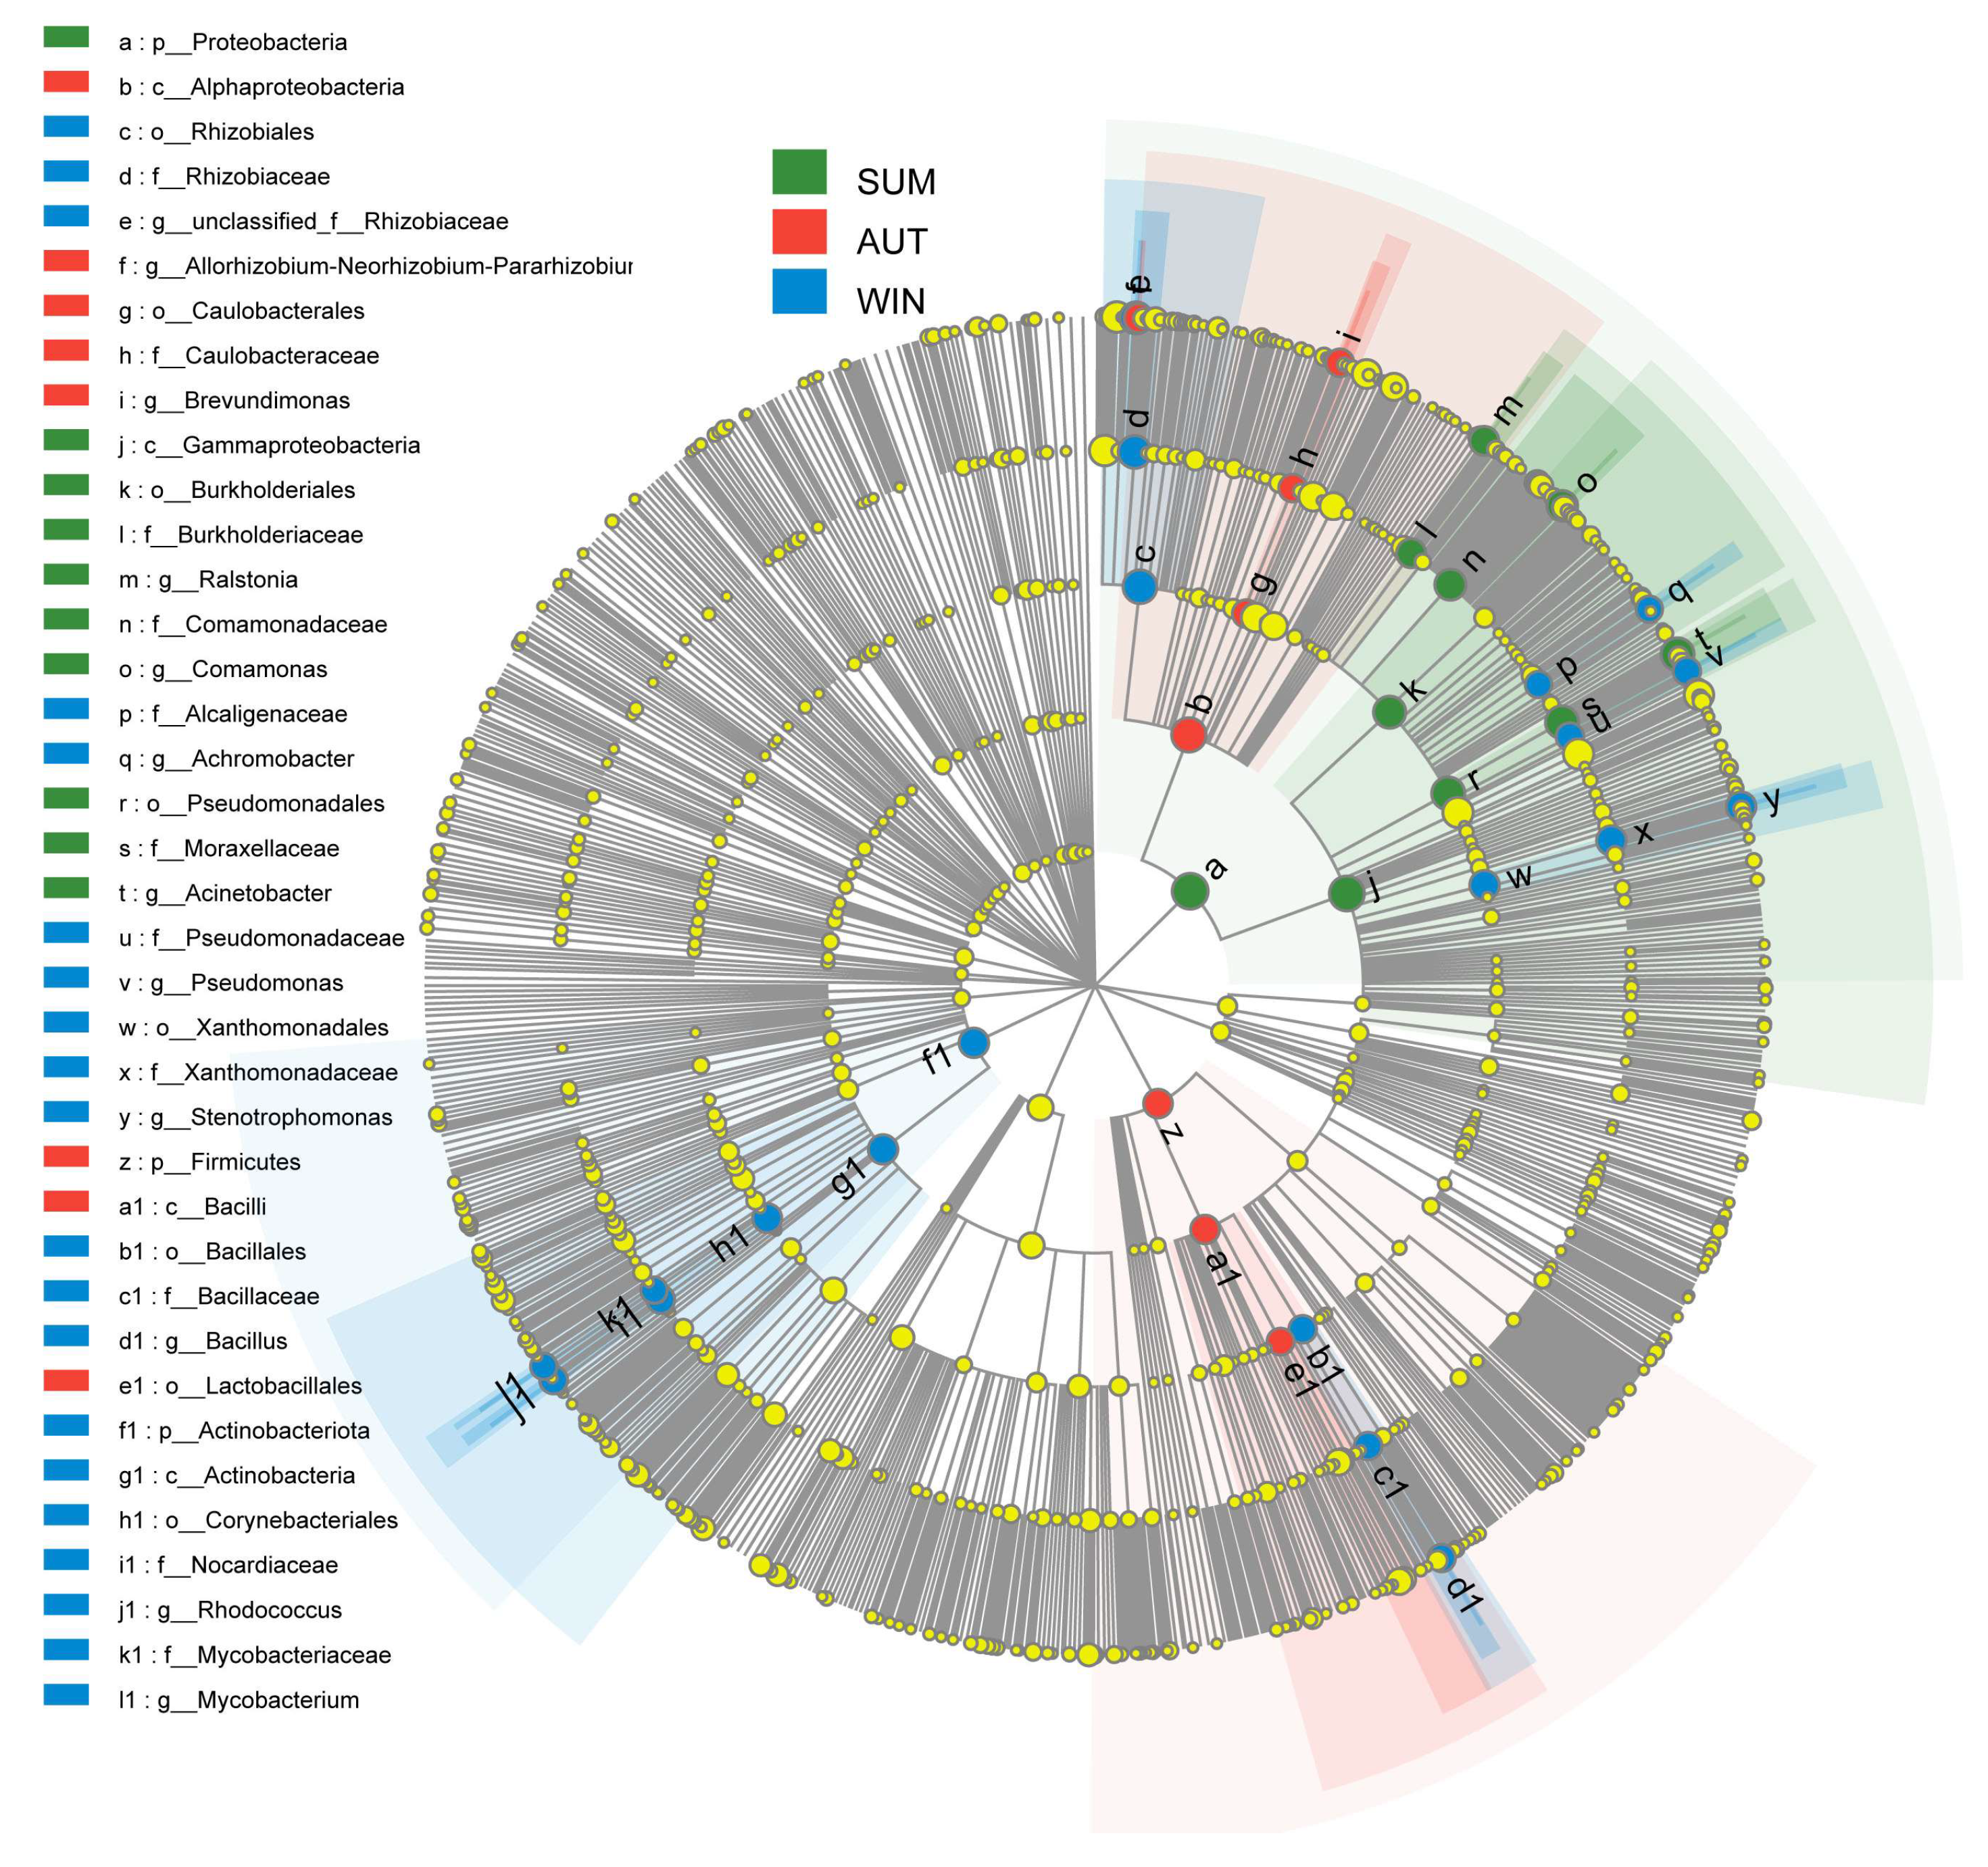
3.4. Seasonal Effects of Bacterial Aerosols on Aeration Tank

The PCoA of the unweighted UniFrac distances matrix (Figure 7a) showed that samples from the three seasons were clearly separated, indicating that the bacterial communities varied significantly among the three seasons tested (PERMANOVA, 22.26%, p < 0.001). The summer samples were distant from the autumn and winter samples, which were closer together, indicating that bacterial community composition was more similar between autumn and winter. Several studies have investigated seasonal effects on bioaerosols due to differences in environmental conditions [45] (e.g., temperature, relative humidity, and light intensity). Specifically, outdoor treatment units are more influenced than indoor units by the season, as Table S1 demonstrates (due to factors such as wind speed and solar radiation). As an outdoor treatment unit, the seasonal characteristics of the AT are more significant.
LEfSe was utilized to identify the abundant taxa that distinguished the summer, autumn, and winter communities (i.e., an LDA score above 4.0) (Figure 8). The LEfSe analysis of the bacterial communities identified a total of 36 significantly abundant taxa across the three seasons. The abundant genera were Bacillales, Mycobacterium, and Pseudomonas in winter; Brevundimonas in autumn; and Acinetobacter, Comamonas, and Ralstonia in summer. This result explains the seasonal variations in bacterial community composition.
It is worth noting that most of these indicator bacteria are potential pathogens. For instance, Acinetobacter can cause respiratory tract infections, sepsis, meningitis, and endocarditis [46], while Pseudomonas can cause septic lesions and is a common conditionally pathogenic bacterium in clinical practice [41]. Bacillus is commonly found in soil and wastewater, but two species of Bacillus are of medical significance, causing anthrax and food poisoning [7]. These pathogenic bacteria could be considered potential indicators of possible health hazards in future experimental risk assessments and should be carefully monitored for the effective management of WWTP bioaerosols.
Relative abundance was the highest in autumn (1575.28), followed by summer (1488.29) and winter (1159.83) (Figure 7b). Consistent with this, several studies have demonstrated that bacterial aerosol concentrations are significantly higher in autumn and summer than in winter [47,48]. Figure 7b also shows that the relative abundances of the NO IV (3.3–4.7 μm, Medium particle), NO I (>9.0 μm, Large particle), and NO VII (0.65–1.1 μm, Small particle) samples were greatest in summer, autumn, and winter, respectively. However, Han et al. [14] reported that highest bacterial concentration of autumn and summer were found in small particles and large particles, respectively. Thus, seasonal variations in the particle size distributions were different between culturable bacteria and non-culturable bacteria.
It is well known that smaller bacterial aerosol particles more easily penetrate deeply into the human respiratory system, causing more significant harm [49]. However, the relative abundance of bacterial aerosols was greatest in autumn, and these particles were mainly large (45.23%). Although bacterial aerosols in winter tended to be small particles (41.97%), the overall relative abundance of bacterial aerosols in winter was low. To our knowledge, seasonal variations in bacterial particle size have not previously been studied using an eight-stage sampler. Therefore, this study provides the first report of the relationship between particle size and bacterial abundance between seasons in WWTPs. Our results show that comprehensive analyses of environmental bacterial aerosol risk must consider both particle size and concentration.

4. Conclusions

The present study performed investigation of bacterial aerosol characteristics, particle size distributions, source, and seasonality in WWTPs. The results of the study were consistent with the following conclusions:
(1) The relative abundance of bacterial aerosols was greater in the SDR than those in any other treatment unit;
(2) Half of the dominant genera were pathogens in the bacterial aerosols of WWTPs;
(3) Wastewater were the main contribution source of bacterial aerosols, and they were mostly distributed in the diameter of 3.3–4.7;
(4) Community composition of bacterial aerosols varied strongly with both size distributions and season; submicron particles (less than 1.1 µm) were detected primarily in winter.
Further studies of bioaerosols from size distribution should be adequately investigated in WWTP, and protective measures should be set up to minimize exposure risk of workers and residents around plants.
However, in this study, the use of only molecular analyses meant that it was not possible to determine the total concentration level of bacterial aerosols and their dead or alive status. With the upgrading of technology and microbial detection tools, it might be possible to implement monitoring of information such as concentration and particle size of total microbial aerosols in the atmospheric environment. Establishing a bioaerosol risk assessment system can provide more accurate warning of bioaerosol health risks in WWTPs. In addition, the scope and differentiation of the study should also be expanded to form a detailed database of bioaerosols from WWTPs.

Supplementary Materials

The following supporting information can be downloaded at: https://www.mdpi.com/article/10.3390/atmos14030465/s1, Table S1: meteorological conditions; Figure S1: The picture of cover and deodorization in plant D; Figure S2: Chao of wastewater from the treatment unit of both plants; Figure S3: PCoA using unweighted UniFrac distances matrix to calculate Plant C samples; Figure S4: The difference in species composition at the top 15 family level of relative abundance among treatment units in Plant C (a) and Plant D (b); Figure S5: Circos plots exhibit the species composition of Plant C at the top 95% of family level of relative abundance in distinct treatment units; Figure S6: The difference in species composition at the top 15 family level of relative abundance among size distributions in AT (a), SDR (b), SR(c) and SST(d); Figure S7: Heatmap of the main 15 bacterial genera in Plant C (a) and Plant D (b); Figure S8: The difference in species composition at the top 15 genus level of relative abundance among wastewater (WY: red) and aerosols (AY: green) in SR (a) and AT (b); Figure S9: Heatmap of the main 50 bacterial genera in SR (a) and AT (b).

Author Contributions

Conceptualization, Y.H. and J.W. (Jianan Wan); methodology, Y.H. and J.W. (Jianan Wan); software, Z.Z.; validation, J.W. (Jianan Wan) and J.W. (Jinghui Wu); formal analysis, J.W. (Jianan Wan), J.W. (Jinghui Wu) and Y.W.; investigation, J.W. (Jianan Wan) and Y.W.; resources, M.H., Y.H., Z.Z., X.W. and J.W. (Jinghui Wu); data curation, Y.H.; writing—original draft preparation, Y.H. and J.W. (Jianan Wan); writing—review and editing, M.H.; visualization, Y.H. and J.W. (Jianan Wan); supervision, M.H., Y.H. and Z.Z.; project administration, Y.H. and J.W. (Jianan Wan); funding acquisition, M.H., Y.H. and Z.Z. All authors have read and agreed to the published version of the manuscript.

Funding

This study was financially supported by the National Natural Science Foundation of China (Grant Nos. 52000085, 52270197 and 51908109), Science and Technology Development Program of Jilin Province (Grant Nos. 20220101182JC and 20220508121RC), and Key Laboratory of Songliao Aquatic Environment, Ministry of Education.

Institutional Review Board Statement

Not applicable.

Informed Consent Statement

Not applicable.

Data Availability Statement

Not applicable.

Conflicts of Interest

The authors declare no conflict of interest.

References

  1. Jiang, J.; Yao, M.; Hwang, J.; Wang, C. Bioaerosol: A Key Vessel between Environment and Health. Front. Environ. Sci. Eng. 2021, 15, 49. [Google Scholar] [CrossRef] [PubMed]
  2. Brągoszewska, E.; Pawlak, M. Health Risks Associated with Occupational Exposure to Biological Air Pollutants Occurring during the Processing of Biomass for Energy Purposes: A Case Study. Energies 2021, 14, 2086. [Google Scholar] [CrossRef]
  3. Schlosser, O. Bioaerosols and health: Current knowledge and gaps in the field of waste management. Detritus 2019, 5, 111–125. [Google Scholar] [CrossRef]
  4. Adhikari, A.; Reponen, T.; Grinshpun, S.A.; Martuzevicius, D.; LeMasters, G. Correlation of ambient inhalable bioaerosols with particulate matter and ozone: A two-year study. Environ. Pollut. 2006, 140, 16–28. [Google Scholar] [CrossRef] [PubMed]
  5. Brągoszewska, E. The Dose of Fungal Aerosol Inhaled by Workers in a Waste-Sorting Plant in Poland: A Case Study. Int. J. Environ. Res. Public Health 2020, 17, 177. [Google Scholar] [CrossRef] [Green Version]
  6. Madsen, A.M.; Alwan, T.; Ørberg, A.; Uhrbrand, K.; Jørgensen, M.B. Waste Workers’ Exposure to Airborne Fungal and Bacterial Species in the Truck Cab and During Waste Collection. Ann. Occup. Hyg. 2016, 60, 651–668. [Google Scholar] [CrossRef]
  7. Han, Y.; Yang, T.; Xu, G.; Li, L.; Liu, J. Characteristics and interactions of bioaerosol microorganisms from wastewater treatment plants. J. Hazard. Mater. 2020, 391, 122256. [Google Scholar] [CrossRef]
  8. Kataki, S.; Patowary, R.; Chatterjee, S.; Vairale, M.G.; Sharma, S.; Dwivedi, S.K.; Kamboj, D.V. Bioaerosolization and pathogen transmission in wastewater treatment plants: Microbial composition, emission rate, factors affecting and control measures. Chemosphere 2022, 287, 132180. [Google Scholar] [CrossRef]
  9. Singh, N.K.; Sanghvi, G.; Yadav, M.; Padhiyar, H.; Thanki, A. A state-of-the-art review on WWTP associated bioaerosols: Microbial diversity, potential emission stages, dispersion factors, and control strategies. J. Hazard. Mater. 2021, 410, 124686. [Google Scholar] [CrossRef]
  10. Yang, T.; Jiang, L.; Bi, X.; Cheng, L.; Zheng, X.; Wang, X.; Zhou, X. Submicron aerosols share potential pathogens and antibiotic resistomes with wastewater or sludge. Sci. Total Environ. 2022, 821, 153521. [Google Scholar] [CrossRef]
  11. Espigares, E.; Bueno, A.; Espigares, M.; Gálvez, R. Isolation of Salmonella serotypes in wastewater and effluent: Effect of treatment and potential risk. Int. J. Hyg. Environ. Health 2006, 209, 103–107. [Google Scholar] [CrossRef] [PubMed]
  12. Fracchia, L.; Pietronave, S.; Rinaldi, M.; Martinotti, M.G. Site-related airborne biological hazard and seasonal variations in two wastewater treatment plants. Water Res. 2006, 40, 1985–1994. [Google Scholar] [CrossRef]
  13. Han, Y.; Yang, T.; Yan, X.; Li, L.; Liu, J. Effect of aeration mode on aerosol characteristics from the same wastewater treatment plant. Water Res. 2020, 170, 115324. [Google Scholar] [CrossRef] [PubMed]
  14. Han, Y.; Yang, K.; Yang, T.; Zhang, M.; Li, L. Bioaerosols emission and exposure risk of a wastewater treatment plant with A2O treatment process. Ecotoxicol. Environ. Saf. 2019, 169, 161–168. [Google Scholar] [CrossRef] [PubMed]
  15. Bruni, E.; Simonetti, G.; Bovone, B.; Casagrande, C.; Castellani, F.; Riccardi, C.; Pomata, D.; Di Filippo, P.; Federici, E.; Buiarelli, F.; et al. Evaluation of bioaerosol bacterial components of a wastewater treatment plant through an integrate approach and in vivo assessment. Int. J. Environ. Res. Public Health 2020, 17, 273. [Google Scholar] [CrossRef] [PubMed] [Green Version]
  16. Szyłak-Szydłowski, M.; Kulig, A.; Miaśkiewicz-Pęska, E. Seasonal changes in the concentrations of airborne bacteria emitted from a large wastewater treatment plant. Int. Biodeterior. Biodegrad. 2016, 115, 11–16. [Google Scholar] [CrossRef]
  17. Han, Y.; Li, L.; Wang, Y.; Ma, J.; Li, P.; Han, C.; Liu, J. Composition, dispersion, and health risks of bioaerosols in wastewater treatment plants: A review. Front. Environ. Sci. Eng. 2020, 15, 38. [Google Scholar] [CrossRef]
  18. Han, Y.; Wang, Y.; Li, L.; Xu, G.; Liu, J.; Yang, K. Bacterial population and chemicals in bioaerosols from indoor environment: Sludge dewatering houses in nine municipal wastewater treatment plants. Sci. Total Environ. 2018, 618, 469–478. [Google Scholar] [CrossRef]
  19. Malakootian, M.; Radhakrishna, N.; Mazandarany, M.P.; Hossaini, H. Bacterial-aerosol emission from wastewater treatment plant. Desalin. Water Treat. 2013, 51, 4478–4488. [Google Scholar] [CrossRef]
  20. Niazi, S.; Hassanvand, M.S.; Mahvi, A.H.; Nabizadeh, R.; Alimohammadi, M.; Nabavi, S.; Faridi, S.; Dehghani, A.; Hoseini, M.; Moradi-Joo, M.; et al. Assessment of bioaerosol contamination (bacteria and fungi) in the largest urban wastewater treatment plant in the Middle East. Environ. Sci. Pollut. Res. Int. 2015, 22, 16014–16021. [Google Scholar] [CrossRef]
  21. Wang, Y.; Li, L.; Han, Y.; Liu, J.; Yang, K. Intestinal bacteria in bioaerosols and factors affecting their survival in two oxidation ditch process municipal wastewater treatment plants located in different regions. Ecotoxicol. Environ. Saf. 2018, 154, 162–170. [Google Scholar] [CrossRef]
  22. Yang, K.; Li, L.; Wang, Y.; Xue, S.; Han, Y.; Liu, J. Airborne bacteria in a wastewater treatment plant: Emission characterization, source analysis and health risk assessment. Water Res. 2019, 149, 596–606. [Google Scholar] [CrossRef] [PubMed]
  23. Yang, T.; Han, Y.; Liu, J.; Li, L. Aerosols from a wastewater treatment plant using oxidation ditch process: Characteristics, source apportionment, and exposure risks. Environ. Pollut. 2019, 250, 627–638. [Google Scholar] [CrossRef] [PubMed]
  24. Li, Y.P.; Zhang, H.F.; Qiu, X.H.; Zhang, Y.; Wang, H. Dispersion and Risk Assessment of Bacterial Aerosols Emitted from Rotating-Brush Aerator during Summer in a Wastewater Treatment Plant of Xi’an, China. Aerosol Air Qual. Res. 2013, 13, 1807–1814. [Google Scholar] [CrossRef]
  25. Yamamoto, N.; Bibby, K.; Qian, J.; Hospodsky, D.; Rismani-Yazdi, H.; Nazaroff, W.W.; Peccia, J. Particle-size distributions and seasonal diversity of allergenic and pathogenic fungi in outdoor air. ISME J. 2012, 6, 1801–1811. [Google Scholar] [CrossRef] [PubMed] [Green Version]
  26. Nel, A. Air Pollution-Related Illness: Effects of Particles. Science 2005, 308, 804–806. [Google Scholar] [CrossRef]
  27. Visser, S.; Slowik, J.G.; Furger, M.; Young, D.E.; Williams, P.I.; Detournay, J.F.; Halios, C.H.; Fleming, Z.L.; Baltensperger, U.; Prévôt, A.S. Kerb and urban increment of highly time-resolved trace elements in PM10, PM2.5 and PM1.0 winter aerosol in london during clearflo 2012. Atmos. Chem. Phys. 2015, 15, 2367–2386. [Google Scholar] [CrossRef] [Green Version]
  28. Jiang, W.; Liang, P.; Wang, B.; Fang, J.; Lang, J.; Tian, G.; Jiang, J.; Zhu, T.F. Optimized DNA extraction and metagenomic sequencing of airborne microbial communities. Nat. Protoc. 2015, 10, 768–779. [Google Scholar] [CrossRef]
  29. Liu, C.; Zhao, D.; Ma, W.; Guo, Y.; Wang, A.; Wang, Q.; Lee, D.J. Denitrifying sulfide removal process on high-salinity wastewaters in the presence of Halomonas sp. Appl. Microbiol. Biotechnol. 2016, 100, 1421–1426. [Google Scholar] [CrossRef]
  30. Bolyen, E.; Rideout, J.R.; Dillon, M.R.; Bokulich, N.A.; Abnet, C.C.; Al-Ghalith, G.A.; Alexander, H.; Alm, E.J.; Arumugam, M.; Asnicar, F.; et al. Author Correction: Reproducible, interactive, scalable and extensible microbiome data science using QIIME 2. Nat. Biotechnol. 2019, 37, 1091. [Google Scholar] [CrossRef]
  31. Callahan, B.J.; McMurdie, P.J.; Rosen, M.J.; Han, A.W.; Johnson, A.J.; Holmes, S.P. DADA2: High-resolution sample inference from Illumina amplicon data. Nat. Methods 2016, 13, 581–583. [Google Scholar] [CrossRef] [PubMed] [Green Version]
  32. Quast, C.; Pruesse, E.; Yilmaz, P.; Gerken, J.; Schweer, T.; Yarza, P.; Peplies, J.; Glöckner, F.O. The SILVA ribosomal RNA gene database project: Improved data processing and web-based tools. Nucleic Acids Res. 2013, 41, D590–D596. [Google Scholar] [CrossRef] [PubMed]
  33. Schloss, P.D.; Westcott, S.L.; Ryabin, T.; Hall, J.R.; Hartmann, M.; Hollister, E.B.; Lesniewski, R.A.; Oakley, B.B.; Parks, D.H.; Robinson, C.J.; et al. Introducing mothur: Open-source, platform-independent, community-supported software for describing and comparing microbial communities. Appl. Environ. Microbiol. 2009, 75, 7537–7541. [Google Scholar] [CrossRef] [PubMed] [Green Version]
  34. Coll, C.; Bier, R.; Li, Z.; Langenheder, S.; Gorokhova, E.; Sobek, A. Association between Aquatic Micropollutant Dissipation and River Sediment Bacterial Communities. Environ. Sci. Technol. 2020, 54, 14380–14392. [Google Scholar] [CrossRef]
  35. Segata, N.; Izard, J.; Waldron, L.; Gevers, D.; Miropolsky, L.; Garrett, W.S.; Huttenhower, C. Metagenomic biomarker discovery and explanation. Genome Biol. 2011, 12, R60. [Google Scholar] [CrossRef] [Green Version]
  36. Liu, J.; Zang, N.; Liu, X.; Tian, H.; Kang, X. Bioaerosols dispersed from a typical wastewater treatment plant with a membrane bioreactor: Emission characteristics, source analysis and health risk. Process Saf. Environ. Prot. 2022, 160, 976–987. [Google Scholar] [CrossRef]
  37. Humbal, C.; Gautam, S.; Trivedi, U. A review on recent progress in observations, and health effects of bioaerosols. Environ. Int. 2018, 118, 189–193. [Google Scholar] [CrossRef]
  38. Uhrbrand, K.; Schultz, A.C.; Koivisto, A.J.; Nielsen, U.; Madsen, A.M. Assessment of airborne bacteria and noroviruses in air emission from a new highly-advanced hospital wastewater treatment plant. Water Res. 2017, 112, 110–119. [Google Scholar] [CrossRef]
  39. Gao, M.; Jia, R.; Qiu, T.; Han, M.; Wang, X. Size-related bacterial diversity and tetracycline resistance gene abundance in the air of concentrated poultry feeding operations. Environ. Pollut. 2017, 220, 1342–1348. [Google Scholar] [CrossRef]
  40. Ding, W.; Li, L.; Han, Y.; Liu, J.; Liu, J. Site-related and seasonal variation of bioaerosol emission in an indoor wastewater treatment station: Level, characteristics of particle size, and microbial structure. Aerobiologia 2015, 32, 211–224. [Google Scholar] [CrossRef]
  41. Korzeniewska, E.; Filipkowska, Z.; Gotkowska-Plachta, A.; Janczukowicz, W.; Dixon, B.; Czułowska, M. Determination of emitted airborne microorganisms from a BIO-PAK wastewater treatment plant. Water Res. 2009, 43, 2841–2851. [Google Scholar] [CrossRef]
  42. Liu, M.; Nobu, M.K.; Ren, J.; Jin, X.; Hong, G.; Yao, H. Bacterial compositions in inhalable particulate matters from indoor and outdoor wastewater treatment processes. J. Hazard. Mater. 2020, 385, 121515. [Google Scholar] [CrossRef]
  43. Korzeniewska, E. Emission of bacteria and fungi in the air from wastewater treatment plants—A review. FBS 2011, 3, 393–407. [Google Scholar] [CrossRef] [Green Version]
  44. Yang, T.; Jiang, L.; Han, Y.; Liu, J.; Wang, X.; Yan, X.; Liu, J. Linking aerosol characteristics of size distributions, core potential pathogens and toxic metal(loid)s to wastewater treatment process. Environ. Pollut. 2020, 264, 114741. [Google Scholar] [CrossRef]
  45. Karra, S.; Katsivela, E. Microorganisms in bioaerosol emissions from wastewater treatment plants during summer at a Mediterranean site. Water Res. 2007, 41, 1355–1365. [Google Scholar] [CrossRef]
  46. Zhang, M.; Zuo, J.; Yu, X.; Shi, X.; Chen, L.; Li, Z. Quantification of multi-antibiotic resistant opportunistic pathogenic bacteria in bioaerosols in and around a pharmaceutical wastewater treatment plant. J. Environ. Sci. 2018, 72, 53–63. [Google Scholar] [CrossRef]
  47. Fathi, S.; Hajizadeh, Y.; Nikaeen, M.; Gorbani, M. Assessment of microbial aerosol emissions in an urban wastewater treatment plant operated with activated sludge process. Aerobiologia 2017, 33, 507–515. [Google Scholar] [CrossRef]
  48. Vítězová, M.; Vítěz, T.; Mlejnková, H.; Lošák, T. Microbial contamination of the air at the wastewater treatment plant. Acta Univ. Agric. Silvic. Mendel. Brun. 2013, 60, 233–240. [Google Scholar] [CrossRef] [Green Version]
  49. Kim, K.-Y.; Ko, H.-J.; Kim, D. Assessment of Airborne Microorganisms in a Swine Wastewater Treatment Plant. Environ. Eng. Res. 2012, 17, 211–216. [Google Scholar] [CrossRef]
Figure 1. Schematic diagram of sampling sites in the WWTP. AT: aeration tank; SST: secondary settling tank; SDR: sludge dewatering room; and SR: screen room.
Atmosphere 14 00465 g001
Figure 2. Size distributions at different sampling sites. (a) Chao indices in Plant C and Plant D. (b) Venn diagram based on ASVs, black font for Plant C and red font for Plant D. (c,d) Proportion of Chao and Shannon indices at each size stage. AT: aeration tank; SST: secondary settling tank; SDR: sludge dewatering room; and SR: screen room. Stage I–VIII: color from dark to light; * significance at 0.05 probability level, ** significance at 0.01 probability level, *** significance at 0.001 probability level.
Atmosphere 14 00465 g002
Figure 3. PCoA using unweighted UniFrac distances matrix to calculate Plant D samples. AT: aeration tank; SST: secondary settling tank; SDR: sludge dewatering room; SR: screen room; D: Plant D.
Atmosphere 14 00465 g003
Figure 4. Circos plots exhibit the species composition of Plant D at the top 95% of family level of relative abundance in distinct treatment units. D_AT: aeration tank of Plant D; D_SST: secondary settling tank of Plant D; D_SDR: sludge dewatering room of Plant D; and D_SR: screen room of Plant D.
Atmosphere 14 00465 g004
Figure 5. ASV in size distribution and shared rate of ASVs from aerosol and wastewater. (a) D_AT (aeration tank of Plant D), (b) C_AT (aeration tank of Plant C), (c) D_SST (secondary settling tank of Plant D), (d) C_SST (secondary settling tank of Plant C), (e) D_SR (screen room of Plant D), (f) C_SR (screen room of Plant C). I–VIII: from the first to the eighth particle-size stages.
Atmosphere 14 00465 g005
Figure 6. (a) The difference in species composition at the top 15 genus level of relative abundance among wastewater (WY: red) and aerosols (AY green) in SST. (b) Heat map of the main 15 bacterial genera in SST. The color gradient indicates the size of the proportion of species. 1–8: represent eight size stages. D_SST: secondary settling tank of Plant D; C_SST: secondary settling tank of Plant C; A: aerosol sample; W: water sample.
Atmosphere 14 00465 g006
Figure 7. Size distributions of bacterial aerosols in three seasons. (a) PCoA based on the unweighted UniFrac distance matrix for aerosol samples collected from the AT of the three seasons. (b) Chao values at eight size stages. SUM: summer; AUT: autumn; WIN: winter. Round: large particles (L); Triangles: medium particles (M); Square: small particles (S).
Atmosphere 14 00465 g007
Figure 8. LEfSe analysis indicates the distinct taxonomic units of bacteria in various seasons. Differently colored areas represent distinct components (red for autumn, green for summer, and blue for winter), and the diameter of each circle is proportional to the relative abundance of that taxon. The inner to outer circles correspond to the phylum to genus hierarchy. SUM: summer; AUT: autumn; WIN: winter.
Atmosphere 14 00465 g008
Disclaimer/Publisher’s Note: The statements, opinions and data contained in all publications are solely those of the individual author(s) and contributor(s) and not of MDPI and/or the editor(s). MDPI and/or the editor(s) disclaim responsibility for any injury to people or property resulting from any ideas, methods, instructions or products referred to in the content.

