Article

Evaluation of GPM and TRMM and Their Capabilities for Capturing Solid and Light Precipitations in the Headwater Basin of the Heihe River

1
Research Center of Water Resources and Environment, Sun Yat-sen University, Guangzhou 510275, China
2
Guangdong Research Institute of Water Resources and Hydropower, Guangzhou 510635, China
*
Author to whom correspondence should be addressed.
Atmosphere 2023, 14(3), 453; https://doi.org/10.3390/atmos14030453
Submission received: 31 January 2023 / Revised: 20 February 2023 / Accepted: 23 February 2023 / Published: 24 February 2023

Abstract

:
Obtaining accurate precipitation data in mountainous regions is important but challenging. In ungauged areas, remotely sensed precipitation products are useful supplements and alternatives to measured precipitation products. However, their ability to detect solid precipitation and light precipitation in mountain areas is still unclear. The primary objective of this study is to evaluate two satellite precipitation products, Global Precipitation Measurement (GPM) and Tropical Precipitation Measuring Mission (TRMM), in the headwaters of an inland river on the northeastern Tibetan Plateau (the Heihe river basin), with a specific focus on their performance regarding light precipitation and solid precipitation. The achieved results reveal that both GPM and TRMM perform poorly over the Heihe river basin, with low Correlation Coefficient value and Critical Success Index value, particularly in winter. Based on the coupled Time-Variant Gain Model-Degree Day Factor Model (TVGM-DDF) initiated in this paper, the GPM is more applicable in terms of running hydrological models. With the aim of detecting solid precipitation, the GPM is more capable of detecting solid precipitation but still unsatisfactory at two stations. In the case of light precipitation, both products underestimate light precipitation. In general, the performance of the two products in the Heihe river basin is not satisfactory and should be enhanced in upcoming explorations. This study provides a strong foundation for choosing alternate precipitation data for related research in the mountain basin.

1. Introduction

Precipitation is a significant component of the hydrological cycle and is essential forcing data for many applications including hydrology [1,2], agriculture [3] and extreme precipitation events research [4]. Among them, extreme precipitation research has attracted much attention because of its impact on disaster assessment and risk management. Commonly, due to the significant regional and temporal variability of precipitation, reliable data on precipitation at high spatial and temporal resolutions are crucial when studying extreme precipitation events.
Conventional observations from rain gauge stations usually provide the most direct and precise measurements at the gauge locations. A shortcoming is that the spatial representation of precipitation patterns is frequently subpar in mountain locations due to the moderately sparse distribution of rain gauges [5,6]. Additionally, the precipitation time series gathered from rain gauges typically has gaps and inhomogeneity. On the other hand, remote sensing precipitation has become the most promising potential precipitation product, with constant and high spatial and temporal resolutions. Precipitation datasets at various spatial and temporal resolutions at the world or quasi-global scale are now more readily available as a result of the sustained efforts undertaken over the past decades to develop satellite remote sensing precipitation datasets [7].
The Tropical Precipitation Measuring Mission (TRMM) is the first meteorological satellite to use passive microwave (PMW) and infrared remote (IR) to observe large-scale precipitation in tropical and subtropical regions [8]. These data have been employed in numerous former investigations, including precision evaluation, driving hydrological models, supporting reservoir operations, and managing water resources [9,10,11,12]. As the successor to TRMM, Global Precipitation Measurement Integrated MultisatellitE Retrievals (IMERG) exhibits a higher spatial and temporal resolution. Developers claim that ability to detect both light precipitation (the minimum detectable rainrate is 0.5 mm·h−1) and solid precipitation are the most essential characteristics of the Global Precipitation Measurement (GPM) [13], which present crucial precipitation characteristics in high latitudes and mountain regions.
Regional differences may exist in how well satellite-based precipitation products (SPPs) work. Thus, before using SPPs, they should be fully and thoroughly realized. Several explorations have focused on the GPM and TRMM in various spatial scales. The few studies investigating IMERG performance on a worldwide level produced conflicting findings. Liu et al. displayed how the IMERG monthly product is capable of properly capturing major heavy precipitation areas [14]. The discrepancies between the IMERG products and those of the 3B42V7 vary with the surface type (land or ocean) and the precipitation rate in summer and winter [14]. Derin et al. found that Global Satellite Mapping of Precipitation(GSMaP) outperforms the performance of IMERG for practically all regions in terms of systematic and random error metrics [15]. At the regional scale, most of the earlier investigations associated with the TRMM and GPM have focused on assessing their precision and applications. However, not many studies have elucidated these two products’ ability to identify light and solid precipitation, specifically in mountain regions of China. Tang’s research revealed that the IMERG results underestimate snowfall when compared to gauge and reanalysis data, which somewhat degrades the IMERG performance in cold climates [16]. Chen believes that the IMERG exhibits poor performance in winter as the TRMM 3B43, even if the GPM improves its capability to detect frozen precipitation more accurately [17]. The achieved results by Li indicated that the IMERG performs poorer and has a somewhat greater miss bias for light precipitation in regions with a complicated winter precipitation phase [18]. Ma et al. explained that the IMERG could be potentially employed in detecting solid precipitation, which is not retrieved from the 3B42V7 products [19].
The Heihe River is an inland river in the northeastern Tibetan Plateau of China. The Heihe river basin (HRB) has attracted substantial attention in China due to growing pressures on the water supply and a fragile ecological environment [20]. The shortage of water resources in the basin has become a restrictive factor in controlling the ecological balance and economic development of the basin. Therefore, it is important to evidentially explore precipitation in the HRB. The main objective of the current investigation is to assess how well the TRMM 3B42V7 precipitation product (abbreviated as TRMM below) and the newly released GPM IMERG precipitation product (abbreviated as GPM below) perform in terms of daily estimated precipitation over the HRB. More significantly, we discuss their performance to estimate light and solid precipitation. This study is aimed at providing a solid reference for the application of the GPM and reliable input data for the study of extreme precipitation events in mountain areas.
The paper is organized as follows. Section 2 introduces the study area, the datasets, and the employed methodology. Section 3 and Section 4 present the evaluation results and discuss their implications, respectively. The significantly obtained results are also provided in Section 5.

2. Materials and Methods
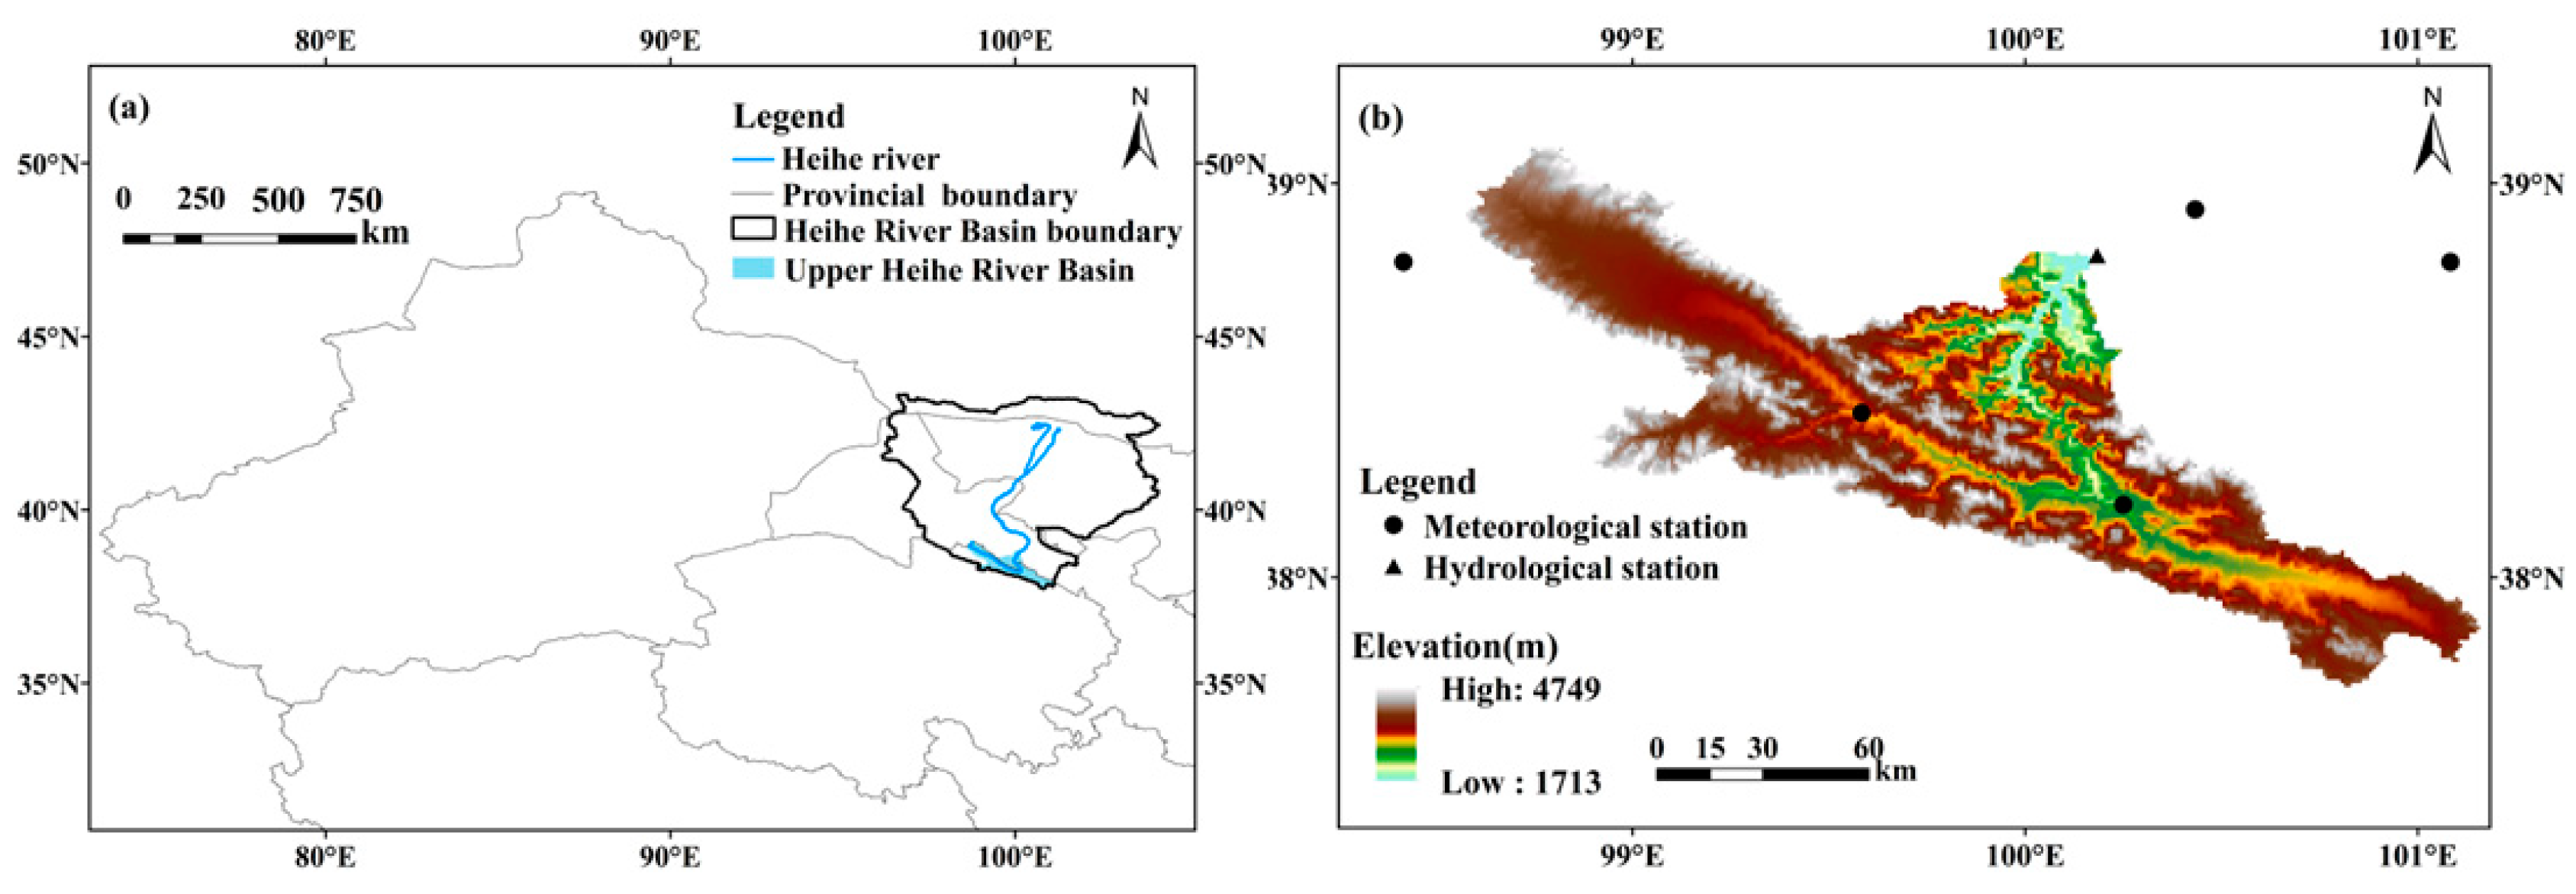
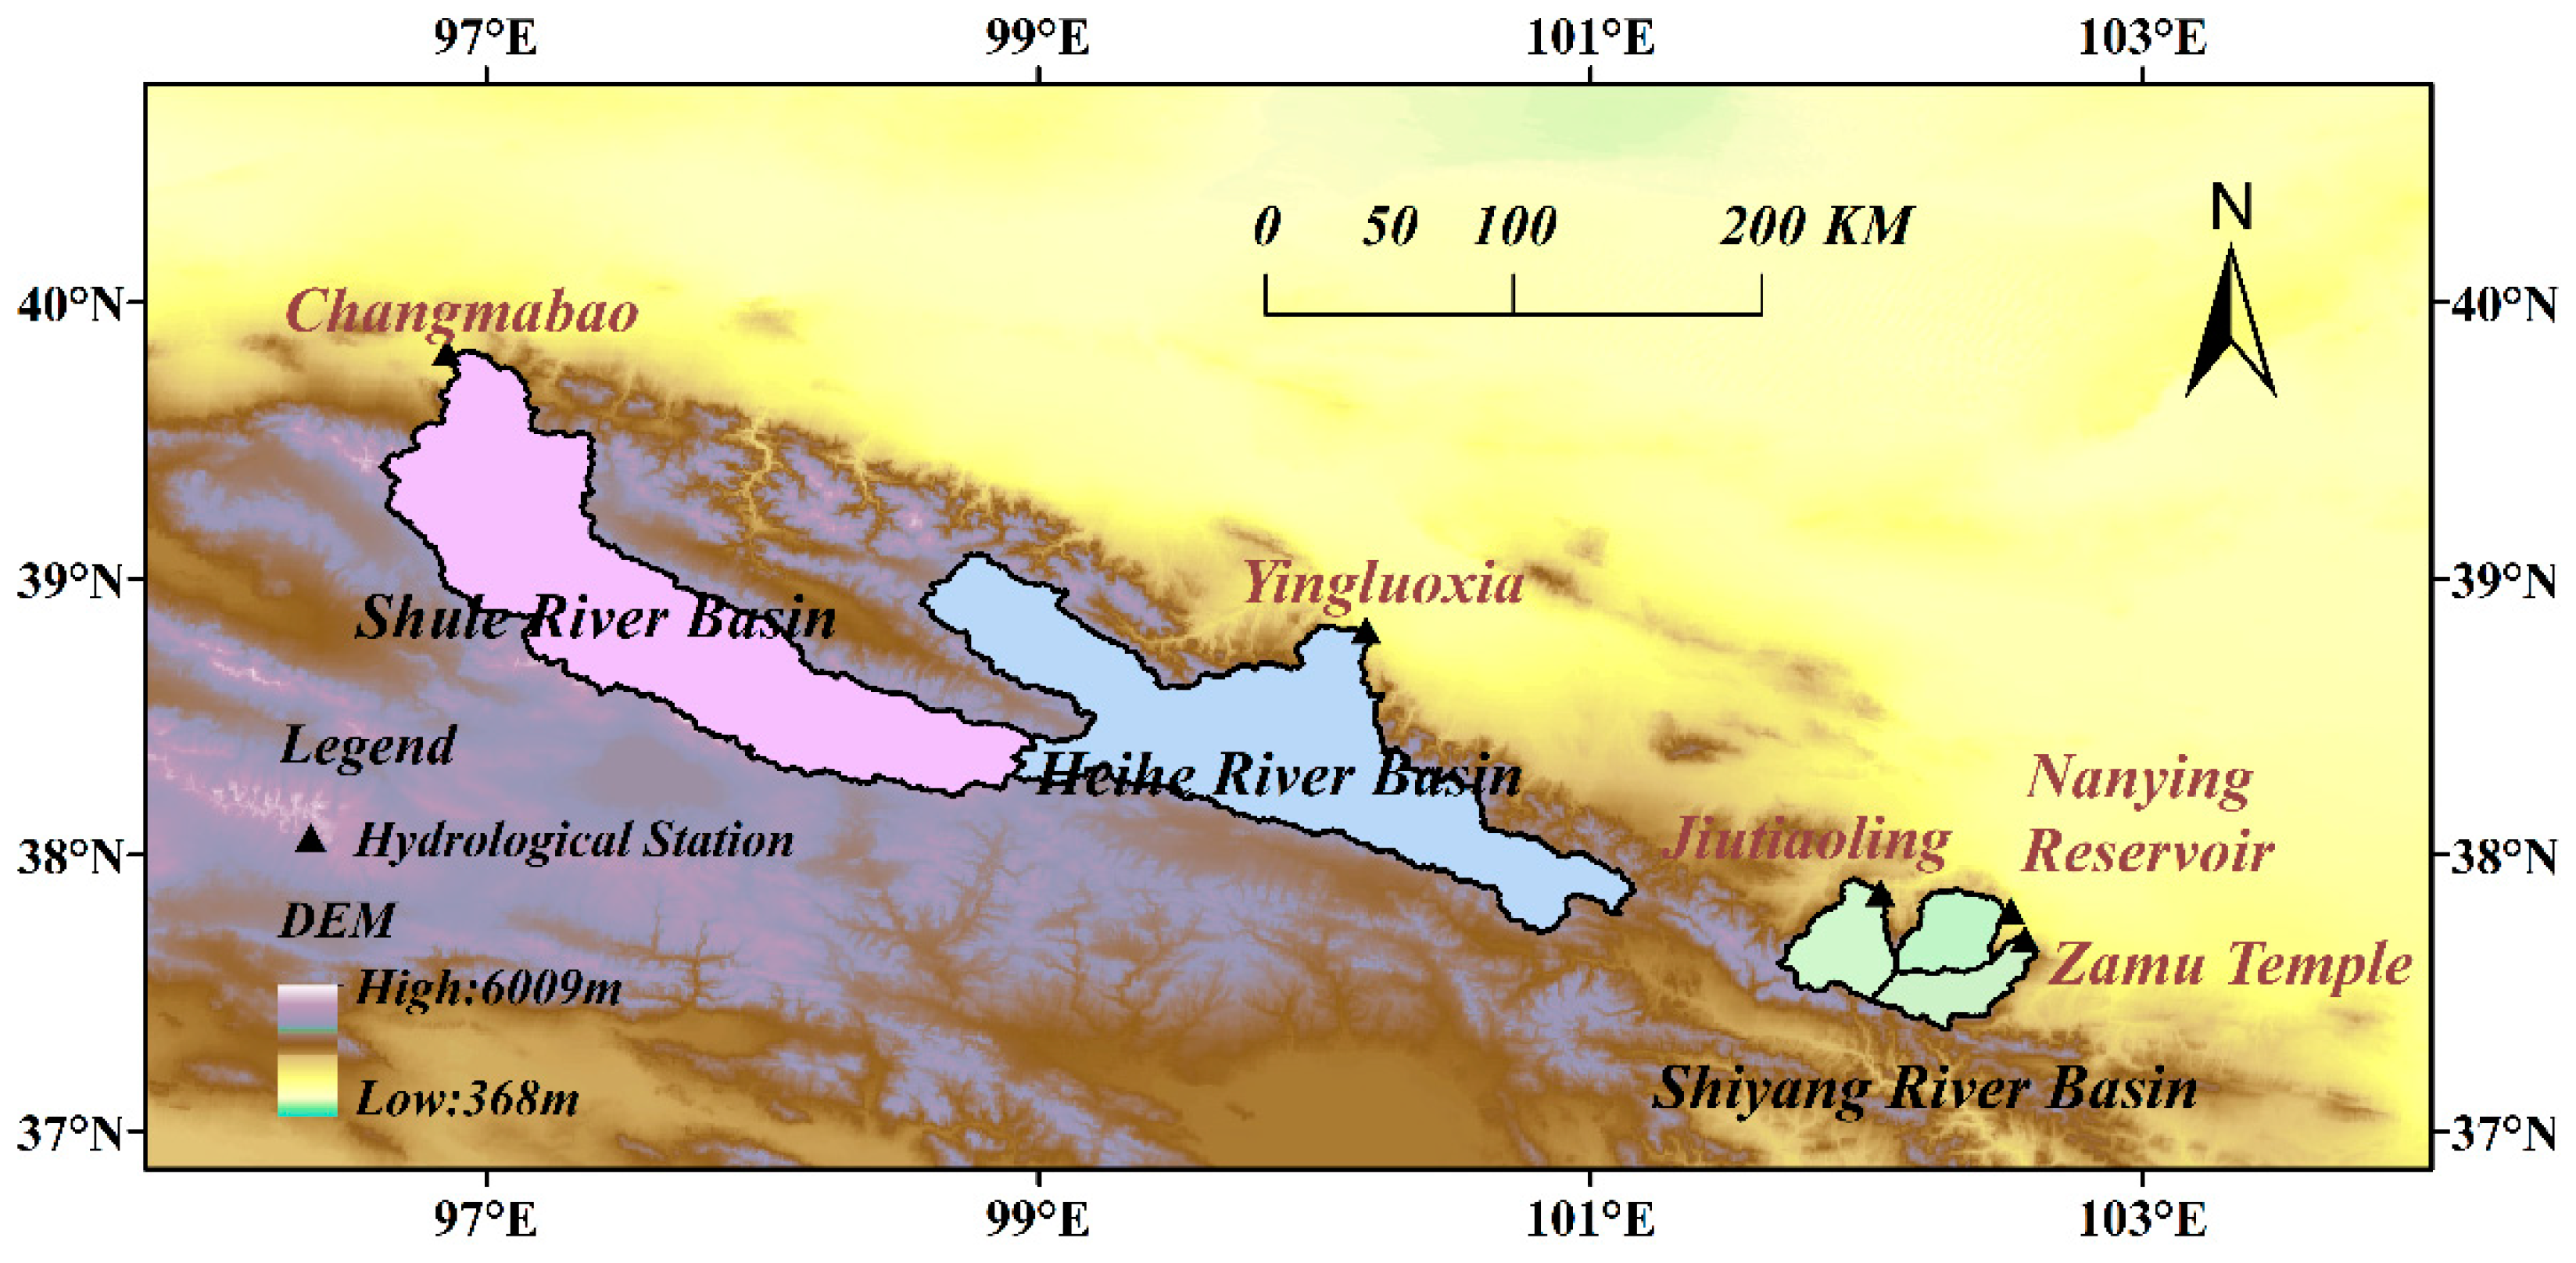
2.1. Study Area

The Heihe river is the second largest inland river in China, with a total length of 821 km. It originates in the Qilian Mountains, travels through the Hexi Corridor in the middle reaches, and finally flows north into Juyanhai Lake (Figure 1). The upstream of the Heihe River is above Yingluoxia hydrological station, with the elevation range of 1800–5000 m and a drainage area of 10,009 km2. In the upper HRB, the mean annual air temperature fluctuates between −9 and 5 °C, while the annual precipitation ranges from 200 to 700 mm [21]. The elevation of the upper HRB has a significant impact on precipitation and temperature, and it also causes significant geographic variation in land use and cover [22,23,24]. A few glaciers and permafrost are primarily visible above 4000 m. The entire glacier area was about 80 km2, and the associated water reserve was almost 0.5 billion m3 as of 2010 [25]. Nearly 70% of the runoff that enters the HRB originates from its headwaters [26], and the average annual runoff measured at the Yingluoxia station in the 2000s was roughly 1.58 billion m3.

2.2. Data

2.2.1. Reference Data

As a reference dataset for the current investigation, we use the China gauge-based daily precipitation analysis (CGDPA) published by the China Meteorological Administration. The CGDPA is interpolated from roughly 2400 stations in mainland China based on an optimal interpolation method and has undergone rigorous quality control. Research has demonstrated that the CGDPA is accurate when compared to the Climate Prediction Center (CPC) Global Precipitation and the East Asia gauge analysis [27]. The CGDPA has been used extensively as reference data that can be regarded as the “real value” of precipitation [28,29], and as input data for hydrological models [30]. The CGDPA data from 2014 to 2020, which have a daily temporal resolution and a spatial resolution of 0.25° × 0.25°, are used in this investigation.

2.2.2. GPM

GPM is a satellite-based precipitation measurement program developed by NASA on the basis of the TRMM [14,31]. GPM adopts a dual-frequency radar observation system for the first time and combines active radar observation technology [31]. It is also capable of providing physical information on cloud precipitation particles from various angles, enhancing the capability of capturing lightweight precipitation and snowfall [31]. The GPM-based products are divided into four levels according to their data inversion algorithms. Integrated Multi satellitE Retrievals for GPM (IMERG) are the Level 3 multi-satellite precipitation product of the GPM [32]. The temporal and spatial resolutions in order are 0.5 h and 0.1° × 0.1°. According to the various calibration accuracy, the IMERG products are divided into three types: “early run”, “late run”, and “final run” (IMERG-E, IMERG-L, and IMERG-F). The IMERG-E and IMERG-L products are near real-time products, releasing 4h and 14h after observation, respectively [33]. However, the IMERG-F represents a post-processing product, which has been calibrated for the deviation of monthly observation data of ground precipitation stations and is usually released two months after observation [32]. In continuing, IMERG-F V6 products are selected in the present research.

2.2.3. TRMM

The TRMM 3B42V7 is a post-real-time product based on the TRMM multi-satellite precipitation analysis (TMPA) algorithm [8]. The TMPA estimations commonly have four steps: (i) calibrating and combining the PMW precipitation estimates; (ii) creating the IR precipitation estimates based on the calibrated PMW precipitation; (iii) appropriately combining the predicted results of PMW and IR; and finally (iv) incorporating the data from the rain gauge [8]. The daily accumulated TRMM 3B42V7 products with a 0.25° × 0.25° spatial resolution are utilized in the present study.

2.2.4. Other Data for Hydrological Model

The grid meteorological data driving the hydrological model are provided by the daily surface temperature grid dataset (0.5° × 0.5°) in China. The hydrological data are provided by the administration associated with the HRB. The snow cover product used in this paper is specified by MOD10A2. The daily dataset of China’s surface climate data, (V3.0) including the station temperature and precipitation data, are used to investigate how well SPPs can detect snowfall.

2.3. Methodology

2.3.1. Statistical Analysis

In the current investigation, seven common statistical criteria (Table 1) are employed in assessing the accuracy of the TRMM and the GPM at a daily scale and 0.25° × 0.25° grid spatial scale. The bilinear interpolation method, which uses the distance-weighted average of the four nearest pixel values to estimate a new pixel value, is used to convert the GPM from 0.1° × 0.1° resolution to 0.25° × 0.25° resolution [19]. More information on evaluation metrics can be found in the related paper [28].

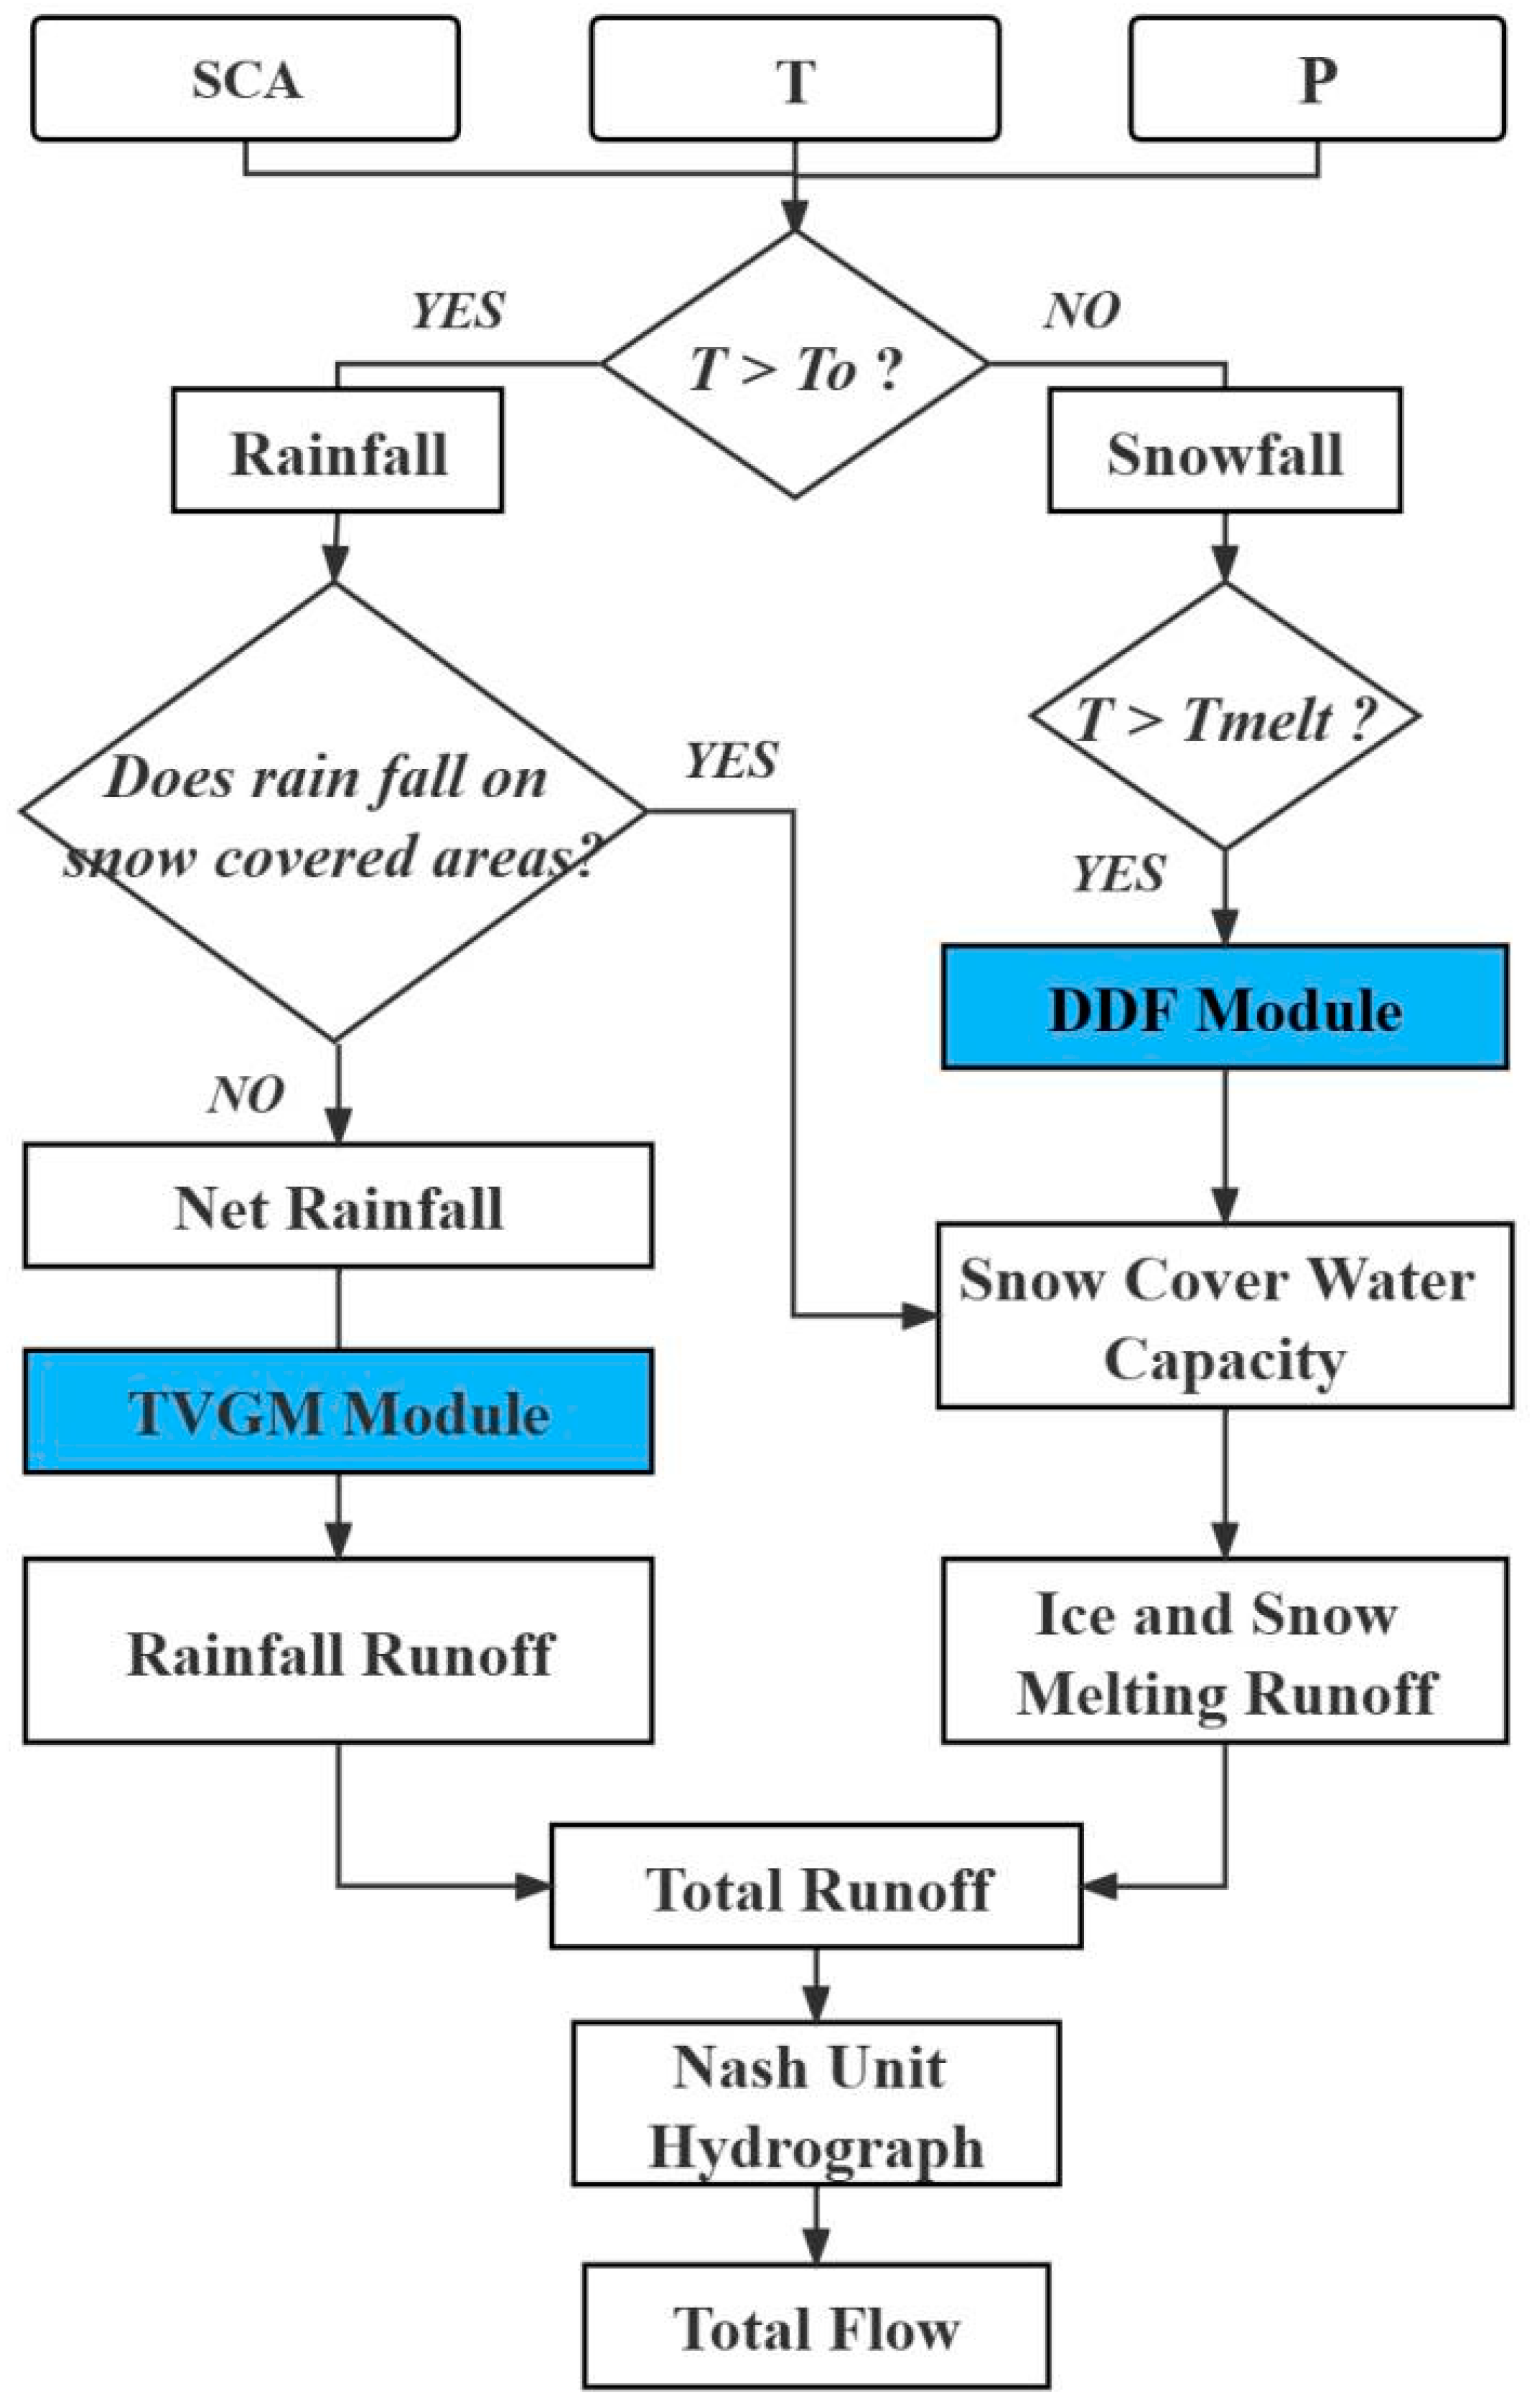
2.3.2. Hydrologic Model

In order to simulate runoff for glacier and snow-characterized watersheds such as the HRB, we coupled the Time-Variant Gain Model (TVGM) for simulating rainfall runoff with the Degree Day Factor Model (DDF) for simulating ice and snow melting runoff, namely the so-called Time-Variant Gain Model-Degree Day Factor Model (TVGM-DDF). The coupling process is as follows and is demonstrated in Figure A1.
The forcing data of the TVGM-DDF model are temperature, precipitation, and Snow-Covered Area (SCA). The model calculates the rainfall generated runoff and glaciers snow melting runoff separately, and the sum is taken as the total runoff in Equation (1).
R ( t ) = R rain ( t ) + R ice , snow ( t )
in which R is the total runoff, Rrain is the runoff generated by rainfall, and Rice, snow is the runoff caused by glaciers and snow melting.
If the mean temperature of a day is higher than the critical temperature of solid–liquid separation (T0, set to 0 °C in the proposed model), the precipitation of that day is considered as rainfall; otherwise, it is considered as snowfall. If the rain falls on bare land, it is regarded as effective rainfall and further forms rainfall runoff. The Rrain is calculated by the broadly utilized lumped hydrological model TVGM.
In the TVGM, the relationship of how rainfall converts to runoff is considered to be nonlinear. The surface runoff coefficient changes with time and is noticeably influenced by the antecedent soil moisture [36,37,38],
G rain ( t ) = g 1 + g 2 × API ( t )
where Grain(t) denotes the time-variant rainfall-runoff coefficient, g1 and g2 are parameters related to Grain(t), and API(t) represents the antecedent precipitation index function which is commonly employed as an index of catchment wetness.
Then, the process of rainfall-runoff generation could be evaluated by multiplying the effective rainfall P(t) and runoff coefficient GRain(t), which is simply expressed by:
R rain ( t ) = G G rain ( t ) × P ( t )
If the rain falls on the snow-covered area, it is considered to increase the water-holding capacity in the snowpack. The snowfall directly enters the snowpack. If the mean temperature exceeds the melting-point threshold (Tmelt, set to 0 °C in the model), the DDF model [39] is used to calculate the glacial and snow melting runoff (Rice,snow) (see Equation (4)).
R ice , snow ( t ) = D D F × ( T ( t ) T melt )
where Rice,snow denotes glacial and snow melting runoff, DDF stands for the degree-day factor, T(t) represents the average temperature of the day, and Tmelt is the temperature threshold for judging whether melting has occurred, and it is herein set as 0 °C.
When the average temperature is below the critical melting temperature, the storage water of the snowpack refreezes. The snowpack retains the melting water until it exceeds 10% of the water equivalent of the snowpack [40]. After calculating the total runoff collected by rainfall runoff and glaciers snowmelt runoff, the streamflow is generated by the Nash unit hydrograph [41].
The shuffled complex evolution method developed at the University of Arizona (the SCE-UA algorithm) [42] is implemented to optimize the parameters of TVGM-DDF, and the Nash–Sutcliffe efficiency (NSE) [43] and BIAS are employed as objective functions to assess the model performance.
Based on the experience, the values of T0 and Tmelt in the TVGM-DDF model are set equal to 0°C and do not participate in the parameter optimization. The parameters involved in optimization are the rain runoff parameters, namely, g1 and g2, snowmelt runoff parameter DDF, and flow parameters, namely n and k. Table 2 display the ranges of the above five parameters.
Since the TVGM-DDF is a novel model, this paper first examines the validity of the established model. The area chosen for model validation is the Hexi inland river basin. This basin is placed in the northwest arid region and at the edge of the Qinghai–Tibet Plateau. From east to west, such a basin includes Shiyang River Basin, Heihe River Basin, and Shule River Basin, respectively [44]. The regional overview is illustrated in Figure A2, and the basic information of each basin can be readily found in Table A1.
We use the data from 1991 to warm up the model. The calibration period of the model is set as from 1992 to 2004, and the validation period is considered from 2005 onwards until 2015. The runoff simulation results are carefully presented in Figure A3. Results reveal that the accuracy of the TVGM-DDF model in each watershed is moderately high. The average NSE of the calibration and validation periods reached 0.84 and 0.83, respectively. In general, the TVGM-DDF model suitably simulates the runoff process of the typical mountain watershed of the Hexi inland river, indicating that this is a capable-efficient model for predicting the hydrological aspects of the mountain watershed.

3. Results

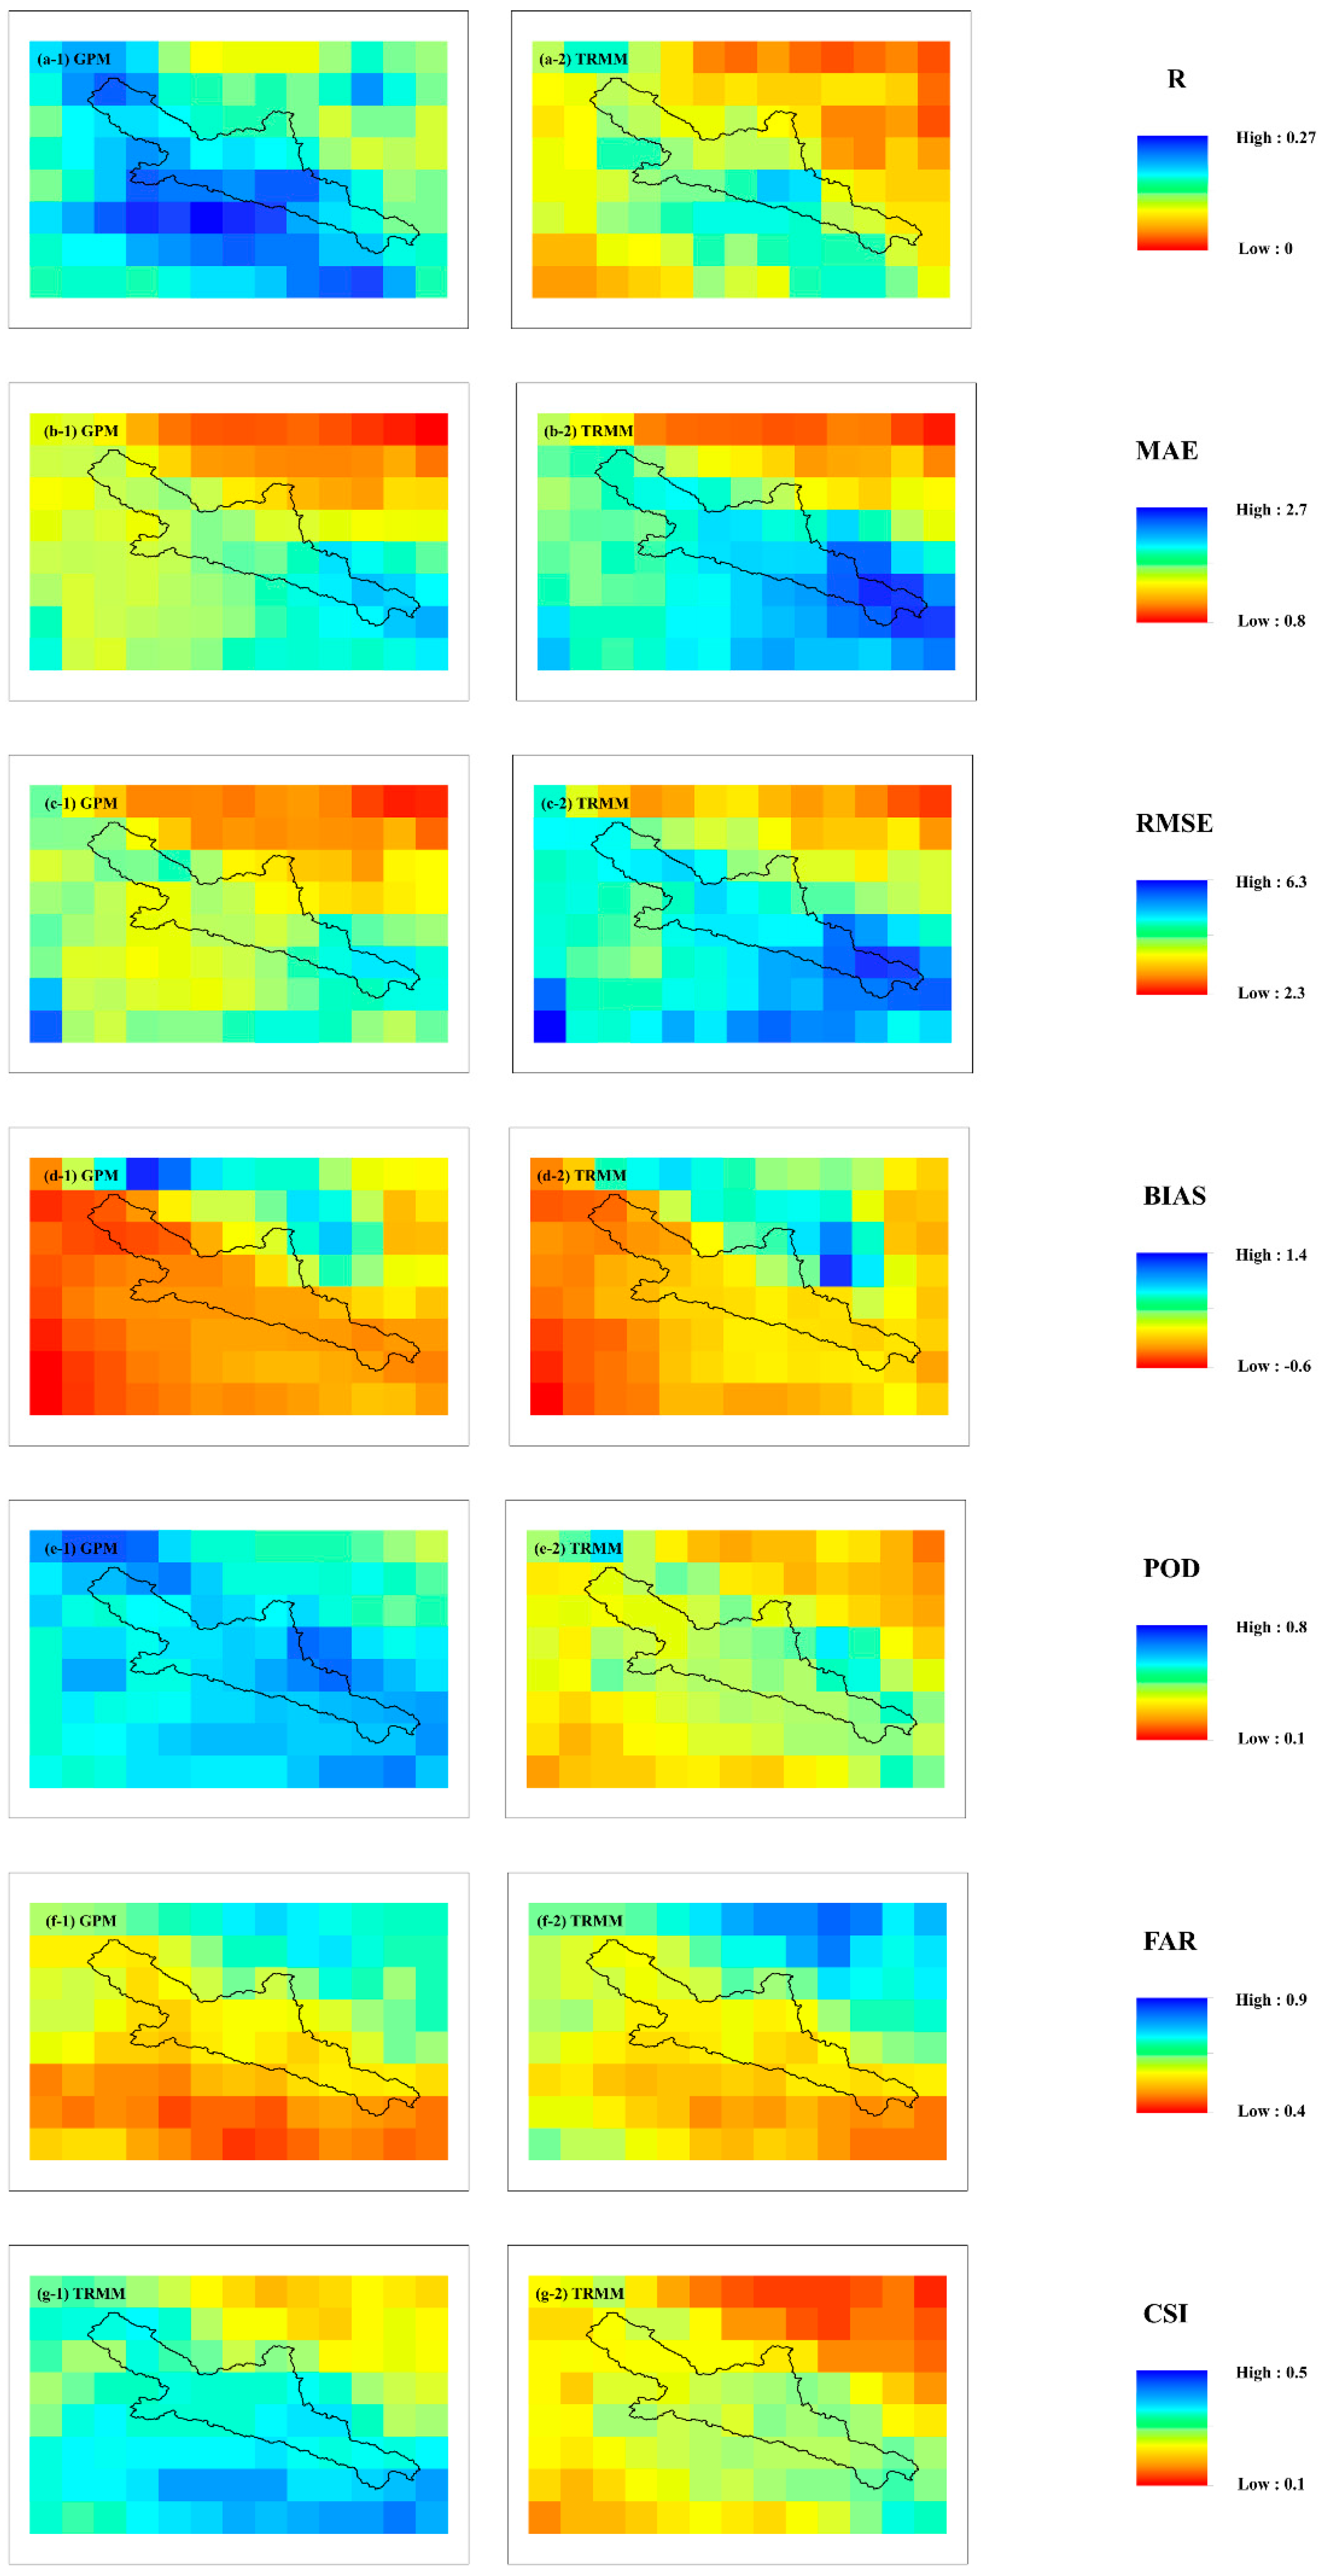
3.1. Evaluation of the SPPs

3.1.1. Overall Evaluation of the HRB

Figure 2 demonstrates the statistical results of the GPM and TRMM for daily precipitation at the grid scale. As seen in Figure 2, the GPM exhibits higher R-values than the TRMM, indicating better consistency with reference data. The GPM also has lower MAE and RMSE values than the TRMM. Overall, the GPM and TRMM underestimate the amount of precipitation to varying degrees, and the GPM underestimates that to a greater extent. The GPM exhibits relatively high values of the POD and CSI, representing that the GPM has better detection capability for precipitation events. The FAR values for the GPM and TRMM are similar.
Table 3 presents the average value of seven evaluation metrics pertinent to the GPM and TRMM at the grid scale. It is important to note that the R-value and CSI-value of the two products are relatively low; that is, their performances in the HRB were not great.

3.1.2. Seasonal Evaluation of SPPs

For a better understanding of the performance in various seasons, we evaluate the kinds of accuracy indicators in various seasons at the basin scale (Table 4). Specifically, spring, summer, fall and winter refer to March to May, June to August, September to November and December to February of the next year, respectively. In total, the accuracy in the spring, summer, and fall is higher than that in the winter for the same product. Specifically, in spring, summer, and fall the GPM exhibits a higher R-value than the TRMM, while in winter the GPM is not even as good as the TRMM. It should be noticed that the GPM underestimates precipitation to the same extent in each season, with negative BIAS values. In particular, the GPM demonstrates an extremely negative BIAS value (−92.99%) in winter, implying a severe underestimation of precipitation. The TRMM overestimates summer precipitation while underestimating it during other seasons. Generally, the TRMM products exhibit lower MAE values compared to the GPM products, while the GPM demonstrates lower RMSE values in comparison with the TRMM.

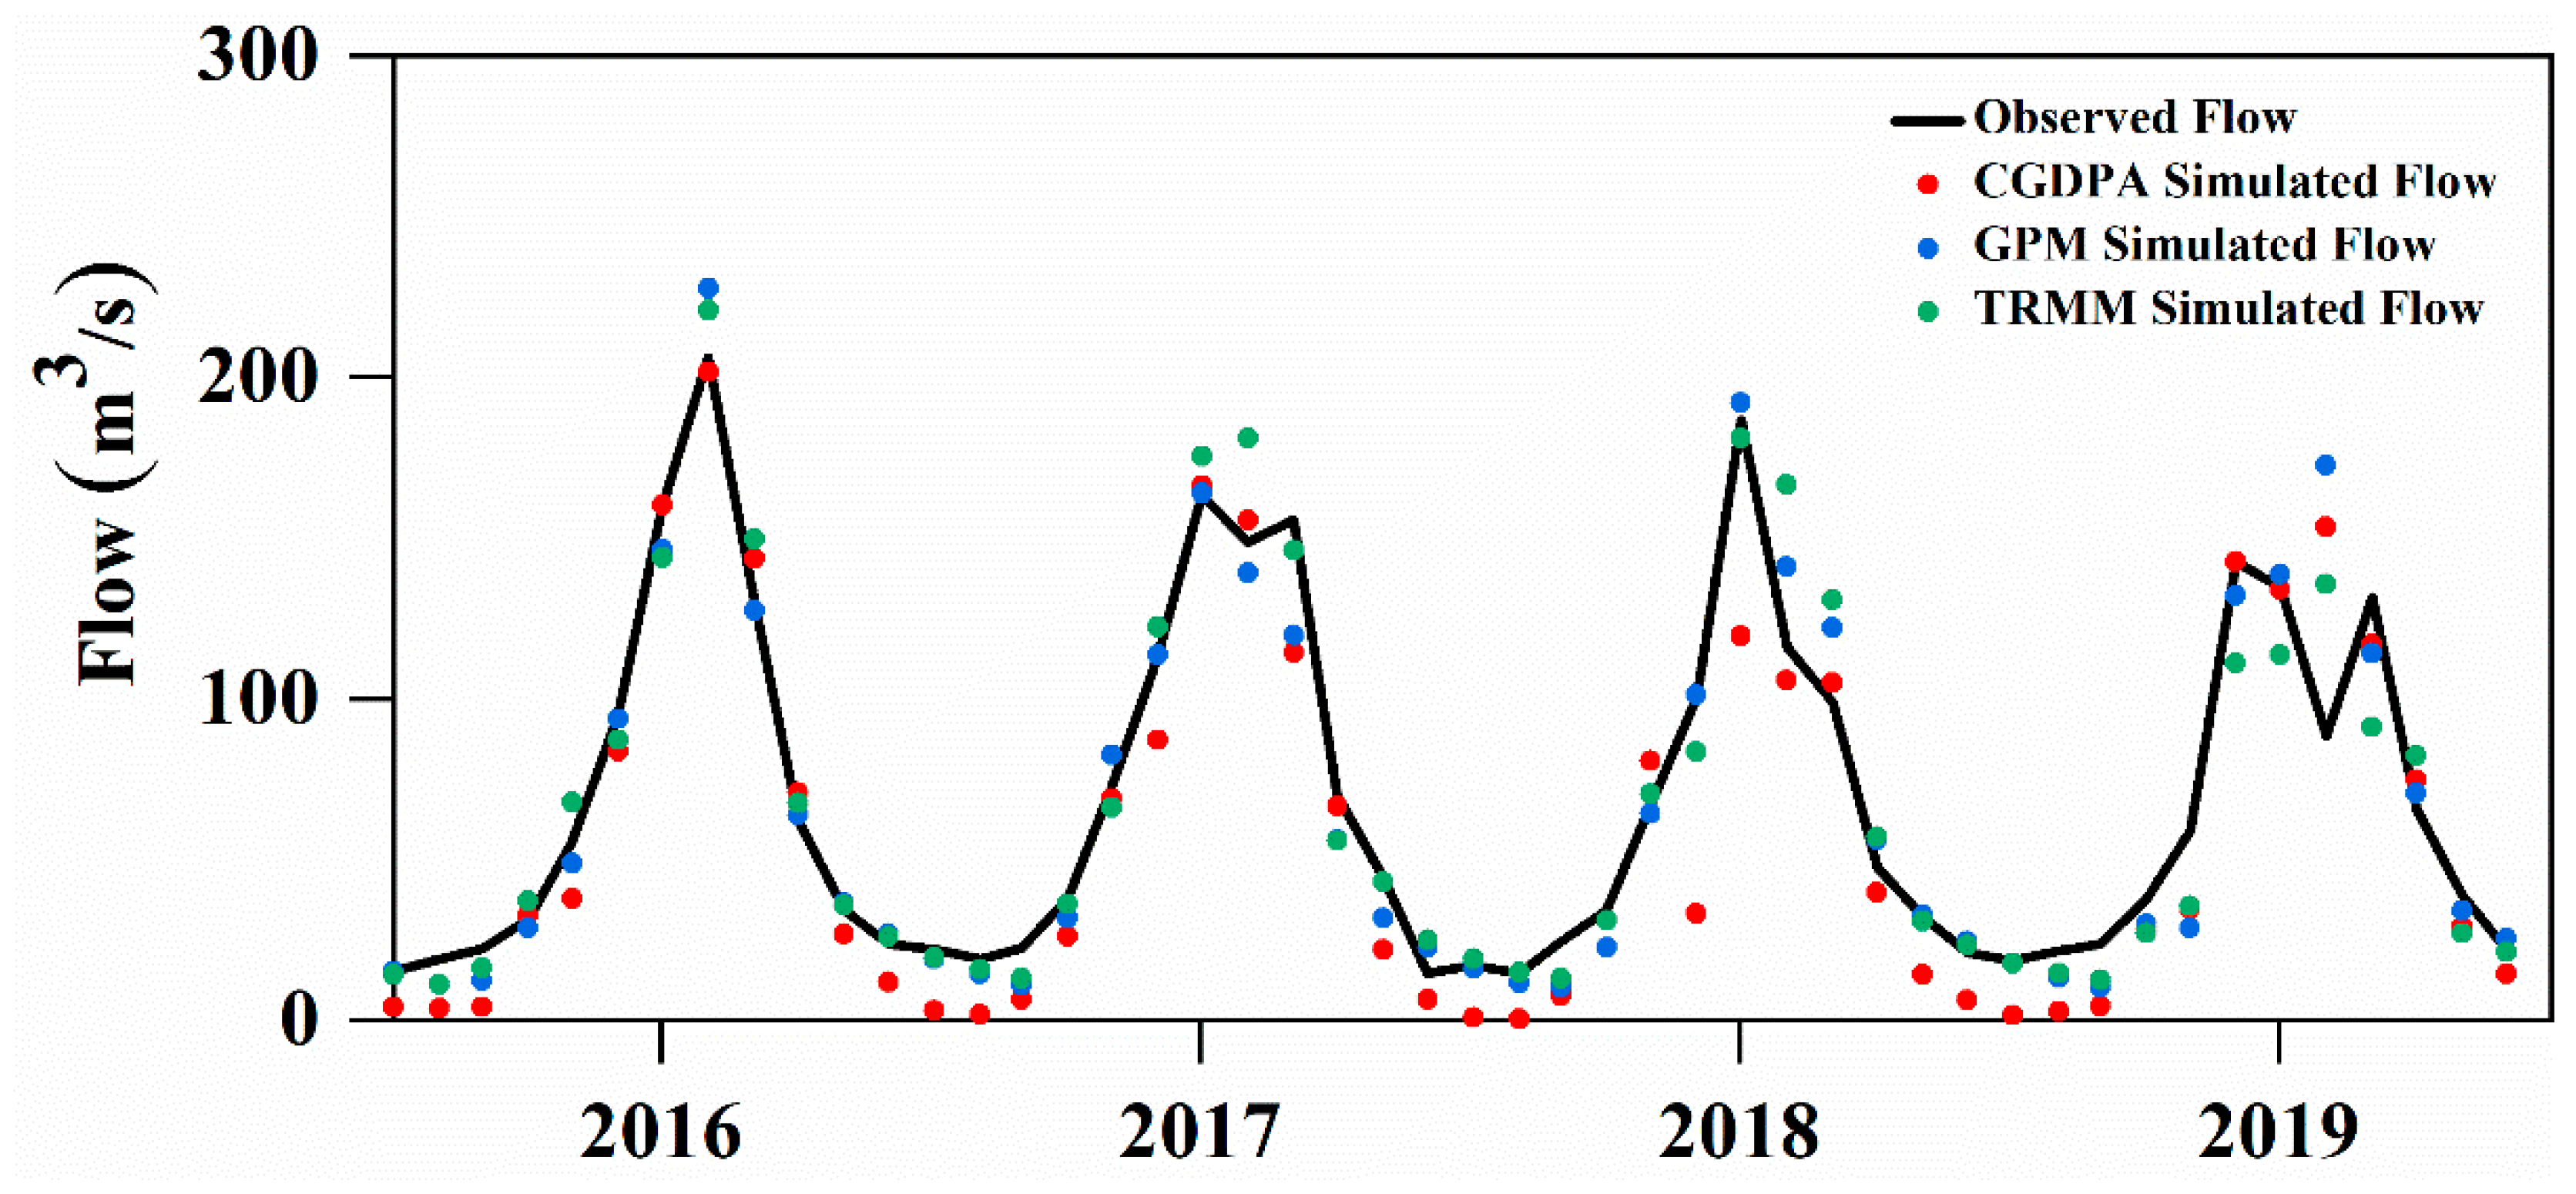
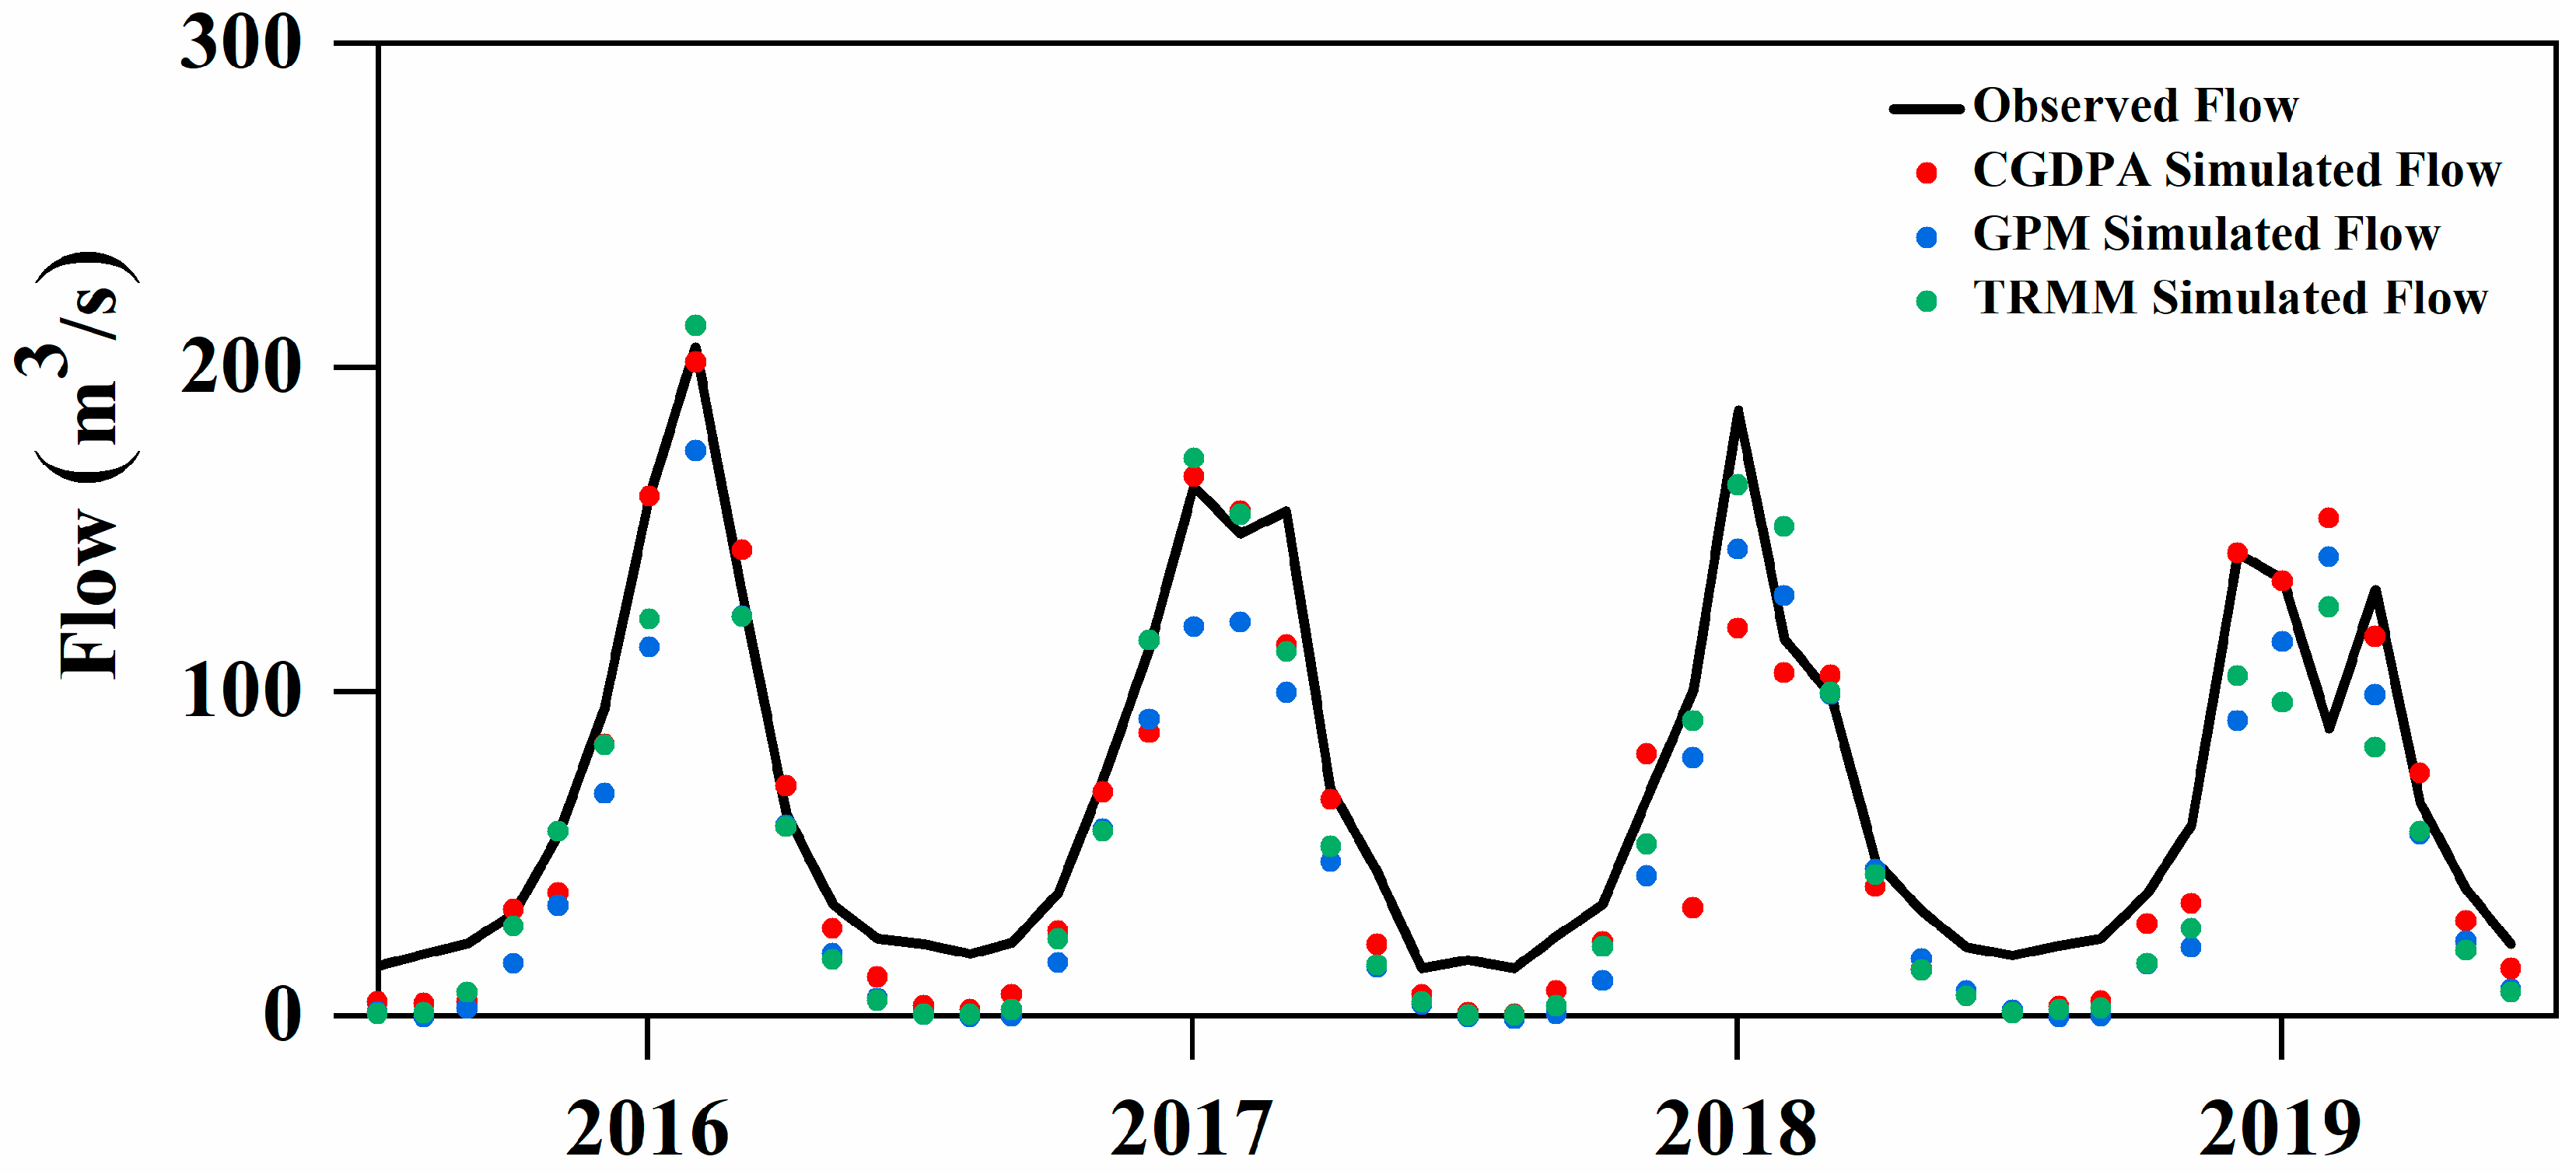
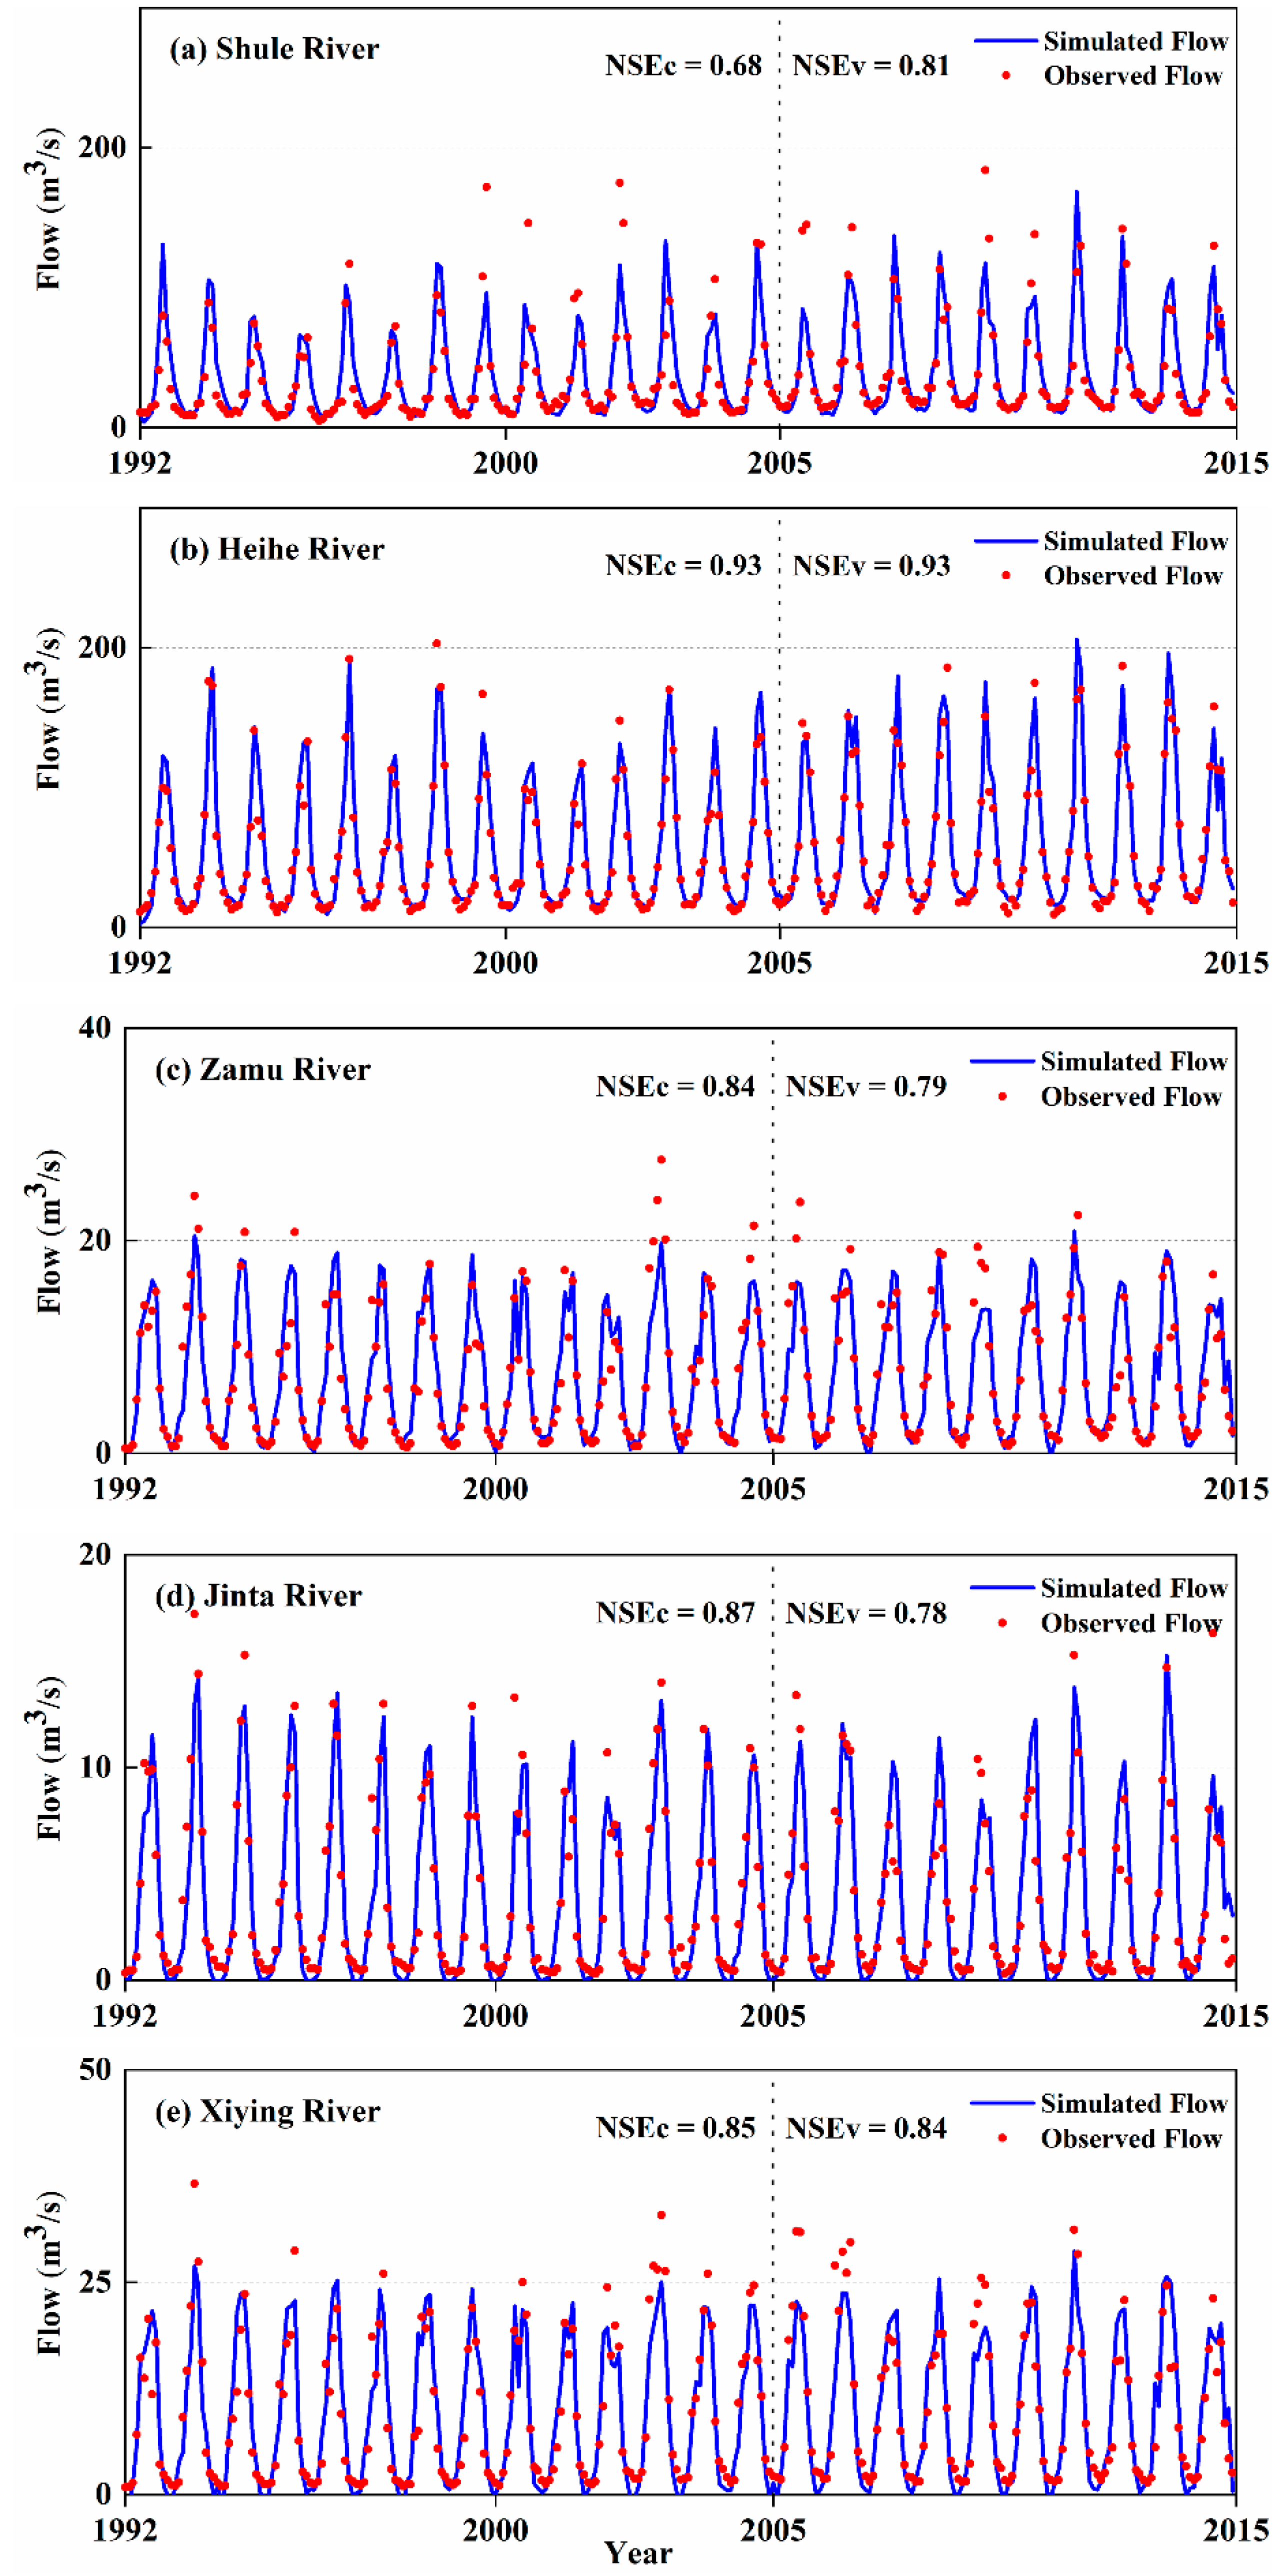
3.2. Applicability Analysis of SPPs-Driven Hydrological Model

Through two separate parameter calibration scenarios, the streamflow simulation capabilities of the IMERG and TRMM products are assessed based on the TVGM-DDF model. In scenario I, the model was warmed up and simulated using observations from rain gauges for the two time periods of January 2015 to December 2015 and, accordingly, January 2016 to December 2019. The model was then run using the IMERG and TRMM products with model parameters calibrated by rain gauges for the period of January 2016 to December 2019. In scenario II, model parameters were recalculated by each satellite precipitation dataset in order to examine how the hydrological model accepted and corrected the mistake of the SSPs. Both calibrations were automatically processed by implementing the SCE-UA algorithm.

3.2.1. Applicability Analysis of the Fixed Parameters

First, we employed the measured precipitation data to run the TVGM-DDF model, and the simulation findings are depicted in Figure 3 (red points) and Table 5. As can be seen from Figure 3 and Table 5, the NSE value of the TVGM-DDF reached 0.83, and the TVGM-DDF appropriately simulated the flow. At the same time, we obtained a set of optimized TVGM-DDF parameters. Then, the TRMM and GPM were utilized to apply the model based on the optimized parameters, respectively. The simulation results of the two products are demonstrated in Figure 3 (blue points and green points) and Table 5. The simulation results revealed that, in the case of fixed parameters, both products have a certain degree of ability to force the model. Among them, the accuracy of the GPM is relatively high, with an NSE of 0.84, while the NSE of the TRMM applied model is only 0.77.
The presented results specify that the precision of the runoff simulation based on the GPM and TRMM is relatively high under the fixed parameters condition. In the HRB, this issue could be attributed to the fact that the glacier snow melting runoff dominated by the temperature played an important role. The simulation results by Wu et al. indicate that the glacier made about a 9% contribution to the streamflow in HRB [45].

3.2.2. Applicability Analysis of Variable Parameters

In this subsection, the GPM and TRMM were employed as forcing TVGM-DDF models, and the parameters were optimized using SCE-UA algorithms. The simulation results of the two products are demonstrated in Figure 4. It can be seen in Figure 4 that the accuracy of the two product-driven hydrological models is similar. Comparing the NSE values of different precipitation products driving the hydrological model was subjected to fixed and unfixed parameters, respectively, as given in Table 5. The provided data in this table indicate that the simulation results of fixed parameters are poor. Recalibration of the parameters could enhance the simulation accuracy of the model.

4. Discussion

Many studies have revealed that the accuracy of the GPM is substantially greater than the TRMM over the Tibetan Plateau [46,47]. However, in our research, the accuracy of the two products was not high enough, and the GPM was slightly stronger. A few research works have reported similar results to ours. For instance, Wang suggested that the IMERG does not exhibit remarkable improvement compared to its predecessor TRMM, and performs even worse when estimating the amount of precipitation in the Hexi region [48]. The reason could be that the understudied area was located in the mountains of the Tibetan Plateau, and the remote sensing sensors did not sufficiently exhibit sensitivity. In particular, the accuracy of the GPM products is moderately low in winter, which could be related to its detection capabilities of solid precipitation and light precipitation. Thus, the following part aims to mainly discuss the capabilities of two products in detecting both light and solid precipitations.

4.1. Detection Capability of Solid Precipitation

In order to examine the capability of the GPM and TRMM in detecting solid precipitation, we explored five sites in and near the HRB in the time interval of 2014–2020. The details of the five weather stations have been provided in Table 6. In the case of the average temperature of the station on that day being less than 0 °C the precipitation event is judged as snowfall, and the corresponding results are explained and discussed in the following.
Table 7 presents the accuracy index of snow detection of two products. The achieved results reveal that the POD value of the GPM is higher than that of the TRMM at all stations. For the FAR index, the performance of the two products is similar. In general, the GPM is more accurate, with a higher CSI value. Comparing the results obtained for different sites, the accuracy of the two stations (52,657 and 52,652) is relatively low.
Some investigators have examined the capability of GPM products in detecting snowfall events. A piece of research work by Ma on the Qinghai–Tibet Plateau revealed that the GPM could only detect 25% of the snowfall in the experiment [19]. Meng’s research on the Yellow River source region indicated the limitations of the IMERG products in estimating solid precipitation [49]. This is consistent with our conclusion that the GPM’s capability in identifying solid precipitation is enhanced compared with the TRMM, but it is still not satisfactory. This issue suggests the limitations of the GPM under cold conditions and reveals its shortcoming of retrieval and calibration algorithms for estimating solid precipitation.
Admittedly, we simply utilize 0 °C to distinguish between rain and snow, which may have caused some errors in the results. Temperature thresholds considering the change of different study areas [50] could favor a more precise classification of the kind of precipitation and should be applied in future research.

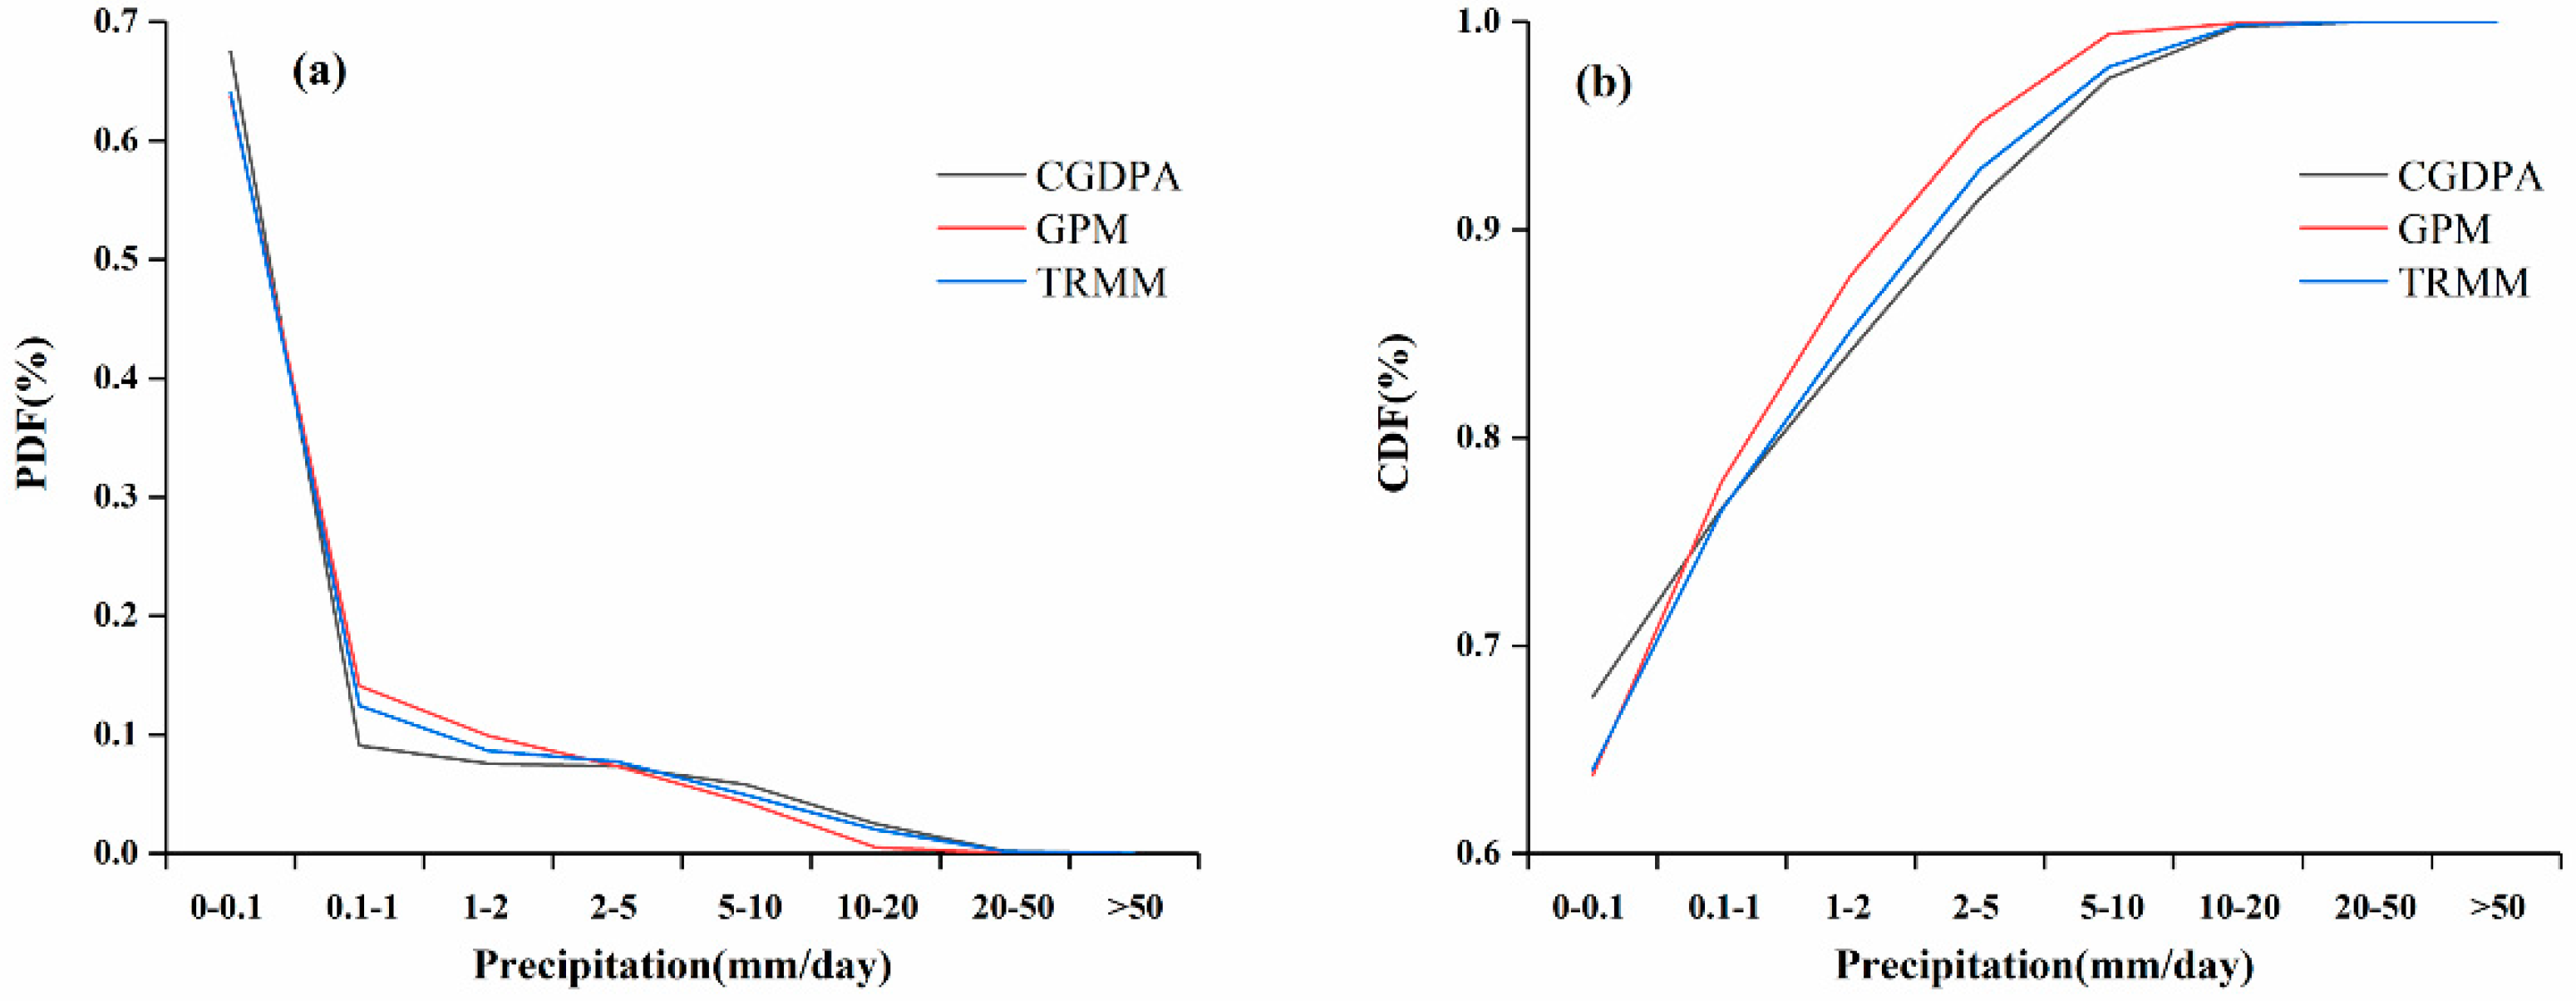
4.2. Evaluation of SPPs to Identify Extreme Precipitation Characteristics

In order to investigate the capabilities of the GPM and TRMM for detecting light precipitation, the Probability Density Function (PDF) and Cumulative Distribution Function (CDF) plots of precipitation in the HRB have been extracted and demonstrated in Figure 5. The achieved results indicate that both GPM and TRMM underestimate the precipitation in the interval of 0 to 0.1 mm/day. In the range of 0.1–2.5 mm/day, both products overestimate precipitation. When the daily precipitation exceeds 2.5 mm, both products underestimate precipitation again.
Some explorations on light precipitation lead to similar conclusions. Li et al. assessed and analyzed the GPM products for light precipitation over Mainland China [18]. Wang thought that the overestimation of the GPM in light precipitation events in the arid area should be noticed and improved [48]. By studying the accuracy of the GPM in disparate climatic regions of China and its capability in applying the hydrological models, Jiang et al. came to a similar conclusion [51]. In future research, improving the ability to detect micro precipitation should be focused, which will be helpful to drought research.

5. Conclusions

We comprehensively applied the GPM and TRMM products over the HRB in China and evaluated their accuracy based on the CGDPA as the reference data. Then, the accuracy of the GPM and the TRMM in different seasons and the applicability of driving the hydrological model were analyzed. We then focused on their capabilities in detecting both solid and light precipitations.
Our comprehensive evaluation revealed that both GPM and TRMM performed poorly over the HRB, with 0.18 and 0.14 R value, respectively. When all indicators are taken into account, the GPM performs better overall than the TRMM. In spring, summer, and autumn, the GPM is superior to the TRMM. In winter, both products performed poorly. In terms of running hydrological models, the GPM is more applicable in the fixed parameters scenario. In addition, the recalibration of parameters could enhance the simulation accuracy of the model.
The capabilities of the two products in identifying solid precipitation are not strong, but the GPM is more capable of detecting solid precipitation, relatively speaking. Comparing different sites, the accuracy of the GPM at two stations (52,657 and 52,652) is relatively low, which suggests the limitations of the GPM under cold conditions. In addition, in the case of light precipitation, both products underestimate light precipitation (0 to 0.1 mm/day).
The findings of this study offer a solid foundation for choosing alternate precipitation data for related studies in the mountain basin. Upcoming research works could focus on improving the accuracy of the GPM in mountainous areas.

Author Contributions

Conceptualization, X.C. and J.L.; methodology, B.H. and J.L.; software, J.L.; validation, L.C. and J.Y.; data curation, J.L.; writing—original draft preparation, J.L.; writing—review and editing, X.C. and J.Y. All authors have read and agreed to the published version of the manuscript.

Funding

This research was funded by the Research and Development Projects in Key Areas of Guangdong Province, grant number 2020B0101130018.

Data Availability Statement

The CGDPA data and China’s surface climate data (V3.0) are available at http://data.cma.cn/ (accessed on 17 December 2022). The TRMM data and GPM data are available at https://disc.gsfc.nasa.gov/ (accessed on 17 December 2022). The MOD10A2 are available at https://modis.gsfc.nasa.gov/ (accessed on 17 December 2022). The hydrological data are provided by the administration associated with the HRB, which cannot be downloaded publicly.

Acknowledgments

We thank Xia Jun from Wuhan University for his help in the coupling of the TVGM-DDF model.

Conflicts of Interest

The authors declare no conflict of interest. The funders had no role in the design of the study; in the collection, analyses, or interpretation of data; in the writing of the manuscript; or in the decision to publish the results.

Appendix A

Figure A1. Flow chart of the TVGM-DDF model. Notes: SCA, T and P represent Snow-Covered Area, temperature and precipitation, respectively; T0 represents the critical temperature of solid–liquid separation; and Tmelt represents the melting-point threshold temperature.
Atmosphere 14 00453 g0a1
Figure A2. Overview of basins of the Hexi inland river.
Atmosphere 14 00453 g0a2
Figure A3. Runoff simulation plots obtained from the TVGM-DDF model in a typical mountainous watershed of the Hexi inland river.
Atmosphere 14 00453 g0a3
Table A1. Basic situation of the Hexi inland river sub-basins.
Water System NameRiver NameHydrological StationDrainage Area (km²)
Shule River BasinChangma RiverChangmabao11,600
Heihe River BasinHeihe RiverYingluoxia10,009
Shiyang River BasinZamu RiverZaguji Temple846
Jinta RiverNanying Reservoir849
Xiying RiverJiutiaoling1088

References

  1. Try, S.; Tanaka, S.; Tanaka, K.; Sayama, T.; Oeurng, C.; Uk, S.; Takara, K.; Hu, M.; Han, D. Comparison of gridded precipitation datasets for rainfall-runoff and inundation modeling in the Mekong River Basin. PLoS ONE 2020, 15, e0226814. [Google Scholar] [CrossRef] [Green Version]
  2. Boluwade, A. Remote sensed-based rainfall estimations over the East and West Africa regions for disaster risk management. ISPRS J. Photogramm. Remote Sens. 2020, 167, 305–320. [Google Scholar] [CrossRef]
  3. Amekudzi, L.K.; Yamba, E.I.; Preko, K.; Asare, E.O.; Aryee, J.; Baidu, M.; Codjoe, S.N.A. Variabilities in rainfall onset, cessation and length of rainy season for the various agro-ecological zones of Ghana. Climate 2015, 3, 416–434. [Google Scholar] [CrossRef]
  4. Huang, C.; Hu, J.; Chen, S.; Zhang, A.; Liang, Z.; Tong, X.; Xiao, L.; Min, C.; Zhang, Z. How well can IMERG products capture typhoon extreme precipitation events over southern China? Remote Sens. 2019, 11, 70. [Google Scholar] [CrossRef] [Green Version]
  5. Yu, C.; Hu, D.; Liu, M.; Wang, S.; Di, Y. Spatio-temporal accuracy evaluation of three high-resolution satellite precipitation products in China area. Atmos. Res. 2020, 241, 104952. [Google Scholar] [CrossRef]
  6. Wang, N.; Liu, W.; Sun, F.; Yao, Z.; Wang, H.; Liu, W. Evaluating satellite-based and reanalysis precipitation datasets with gauge-observed data and hydrological modeling in the Xihe River Basin, China. Atmos. Res. 2020, 234, 104746. [Google Scholar] [CrossRef]
  7. Xie, P.; Xiong, A.-Y. A conceptual model for constructing high-resolution gauge-satellite merged precipitation analyses. J. Geophys. Res. 2011, 116, D21106. [Google Scholar] [CrossRef]
  8. Huffman, G.J.; Adler, R.F.; Bolvin, D.T.; Nelkin, E.J. The TRMM multi-satellite precipitation analysis (TMPA). In Satellite Rainfall Applications for Surface Hydrology; Springer: Berlin/Heidelberg, Germany, 2010; pp. 3–22. [Google Scholar]
  9. Duan, Z.; Liu, J.; Tuo, Y.; Chiogna, G.; Disse, M. Evaluation of eight high spatial resolution gridded precipitation products in Adige Basin (Italy) at multiple temporal and spatial scales. Sci. Total Environ. 2016, 573, 1536–1553. [Google Scholar] [CrossRef] [Green Version]
  10. Liu, J.; Duan, Z.; Jiang, J.; Zhu, A.-X. Evaluation of Three Satellite Precipitation Products TRMM 3B42, CMORPH, and PERSIANN over a Subtropical Watershed in China. Adv. Meteorol. 2015, 2015, 151239. [Google Scholar] [CrossRef] [Green Version]
  11. Hu, Q.; Yang, D.; Wang, Y.; Yang, H. Accuracy and spatio-temporal variation of high resolution satellite rainfall estimate over the Ganjiang River Basin. Sci. China Technol. Sci. 2013, 56, 853–865. [Google Scholar] [CrossRef]
  12. Yang, N.; Zhang, K.; Hong, Y.; Zhao, Q.; Huang, Q.; Xu, Y.; Xue, X.; Chen, S. Evaluation of the TRMM multisatellite precipitation analysis and its applicability in supporting reservoir operation and water resources management in Hanjiang basin, China. J. Hydrol. 2017, 549, 313–325. [Google Scholar] [CrossRef]
  13. Huffman, G.J.; Bolvin, D.T.; Braithwaite, D.; Hsu, K.; Joyce, R.; Xie, P.; Yoo, S.-H. NASA global precipitation measurement (GPM) integrated multi-satellite retrievals for GPM (IMERG). Algorithm Theor. Basis Doc. Version 2015, 4, 26. [Google Scholar]
  14. Liu, Z. Comparison of integrated multisatellite retrievals for GPM (IMERG) and TRMM multisatellite precipitation analysis (TMPA) monthly precipitation products: Initial results. J. Hydrometeorol. 2016, 17, 777–790. [Google Scholar] [CrossRef]
  15. Derin, Y.; Anagnostou, E.; Berne, A.; Borga, M.; Boudevillain, B.; Buytaert, W.; Chang, C.-H.; Chen, H.; Delrieu, G.; Hsu, Y.C.; et al. Evaluation of GPM-era global satellite precipitation products over multiple complex terrain regions. Remote Sens. 2019, 11, 2936. [Google Scholar] [CrossRef] [Green Version]
  16. Tang, G.; Clark, M.P.; Papalexiou, S.M.; Ma, Z.; Hong, Y. Have satellite precipitation products improved over last two decades? A comprehensive comparison of GPM IMERG with nine satellite and reanalysis datasets. Remote Sens. Environ. 2020, 240, 111697. [Google Scholar] [CrossRef]
  17. Chen, F.; Li, X. Evaluation of IMERG and TRMM 3B43 monthly precipitation products over mainland China. Remote Sens. 2016, 8, 472. [Google Scholar] [CrossRef] [Green Version]
  18. Li, X.; Sungmin, O.; Wang, N.; Liu, L.; Huang, Y. Evaluation of the GPM IMERG V06 products for light rain over Mainland China. Atmos. Res. 2021, 253, 105510. [Google Scholar] [CrossRef]
  19. Ma, Y.; Tang, G.; Long, D.; Yong, B.; Zhong, L.; Wan, W.; Hong, Y. Similarity and error intercomparison of the GPM and its predecessor-TRMM multisatellite precipitation analysis using the best available hourly gauge network over the Tibetan Plateau. Remote Sens. 2016, 8, 569. [Google Scholar] [CrossRef] [Green Version]
  20. Cheng, G.; Li, X.; Zhao, W.; Xu, Z.; Feng, Q.; Xiao, S.; Xiao, H. Integrated study of the water--ecosystem--economy in the Heihe River Basin. Natl. Sci. Rev. 2014, 1, 413–428. [Google Scholar] [CrossRef] [Green Version]
  21. Gao, B.; Yang, D.; Qin, Y.; Wang, Y.; Li, H.; Zhang, Y.; Zhang, T. Change in frozen soils and its effect on regional hydrology, upper Heihe basin, northeastern Qinghai--Tibetan Plateau. Cryosphere 2018, 12, 657–673. [Google Scholar] [CrossRef] [Green Version]
  22. Wang, Y.; Yang, H.; Yang, D.; Qin, Y.; Gao, B.; Cong, Z. Spatial interpolation of daily precipitation in a high mountainous watershed based on gauge observations and a regional climate model simulation. J. Hydrometeorol. 2017, 18, 845–862. [Google Scholar] [CrossRef]
  23. Pan, X.; Li, X.; Cheng, G.; Li, H.; He, X. Development and evaluation of a river-basin-scale high spatio-temporal precipitation data set using the WRF model: A case study of the Heihe River Basin. Remote Sens. 2015, 7, 9230–9252. [Google Scholar] [CrossRef] [Green Version]
  24. Xiong, Z.; Yan, X. Building a high-resolution regional climate model for the Heihe River Basin and simulating precipitation over this region. Chin. Sci. Bull. 2013, 58, 4670–4678. [Google Scholar] [CrossRef]
  25. Wang, Y.; Yang, H.; Gao, B.; Wang, T.; Qin, Y.; Yang, D. Frozen ground degradation may reduce future runoff in the headwaters of an inland river on the northeastern Tibetan Plateau. J. Hydrol. 2018, 564, 1153–1164. [Google Scholar] [CrossRef]
  26. Yang, D.; Gao, B.; Jiao, Y.; Lei, H.; Zhang, Y.; Yang, H.; Cong, Z. A distributed scheme developed for eco-hydrological modeling in the upper Heihe River. Sci. China Earth Sci. 2015, 58, 36–45. [Google Scholar] [CrossRef]
  27. Shen, Y.; Xiong, A. Validation and comparison of a new gauge-based precipitation analysis over mainland China. Int. J. Climatol. 2016, 36, 252–265. [Google Scholar] [CrossRef]
  28. Liu, J.; Xia, J.; She, D.; Li, L.; Wang, Q.; Zou, L. Evaluation of six satellite-based precipitation products and their ability for capturing characteristics of extreme precipitation events over a climate transition area in China. Remote Sens. 2019, 11, 1477. [Google Scholar] [CrossRef] [Green Version]
  29. Sun, R.; Yuan, H.; Liu, X.; Jiang, X. Evaluation of the latest satellite-gauge precipitation products and their hydrologic applications over the Huaihe River basin. J. Hydrol. 2016, 536, 302–319. [Google Scholar] [CrossRef]
  30. Ma, J.; Sun, W.; Yang, G.; Zhang, D. Hydrological Analysis Using Satellite Remote Sensing Big Data and CREST Model. IEEE Access 2018, 6, 9006–9016. [Google Scholar] [CrossRef]
  31. Hou, A.Y.; Kakar, R.K.; Neeck, S.; Azarbarzin, A.A.; Kummerow, C.D.; Kojima, M.; Oki, R.; Nakamura, K.; Iguchi, T. The global precipitation measurement mission. Bull. Am. Meteorol. Soc. 2014, 95, 701–722. [Google Scholar] [CrossRef]
  32. Tan, J.; Huffman, G.J.; Bolvin, D.T.; Nelkin, E.J. IMERG V06: Changes to the morphing algorithm. J. Atmos. Ocean. Technol. 2019, 36, 2471–2482. [Google Scholar] [CrossRef]
  33. Pradhan, R.K.; Markonis, Y.; Godoy, M.R.V.; Villalba-Pradas, A.; Andreadis, K.M.; Nikolopoulos, E.I.; Papalexiou, S.M.; Rahim, A.; Tapiador, F.J.; Hanel, M. Review of GPM IMERG performance: A global perspective. Remote Sens. Environ. 2022, 268, 112754. [Google Scholar] [CrossRef]
  34. Ebert, E.E.; Janowiak, J.E.; Kidd, C. Comparison of near-real-time precipitation estimates from satellite observations and numerical models. Bull. Am. Meteorol. Soc. 2007, 88, 47–64. [Google Scholar] [CrossRef] [Green Version]
  35. Conti, F.L.; Hsu, K.L.; Noto, L.V.; Sorooshian, S. Evaluation and comparison of satellite precipitation estimates with reference to a local area in the Mediterranean Sea. Atmos. Res. 2014, 138, 189–204. [Google Scholar] [CrossRef] [Green Version]
  36. Xia, J. Identification of a Constrained Nonlinear Hydrological System Described by Volterra Functional Series. Water Resour. Res. 1991, 27, 2415–2420. [Google Scholar]
  37. Xia, J. A System Approach to Real-time Hydrologic Forecast in Watersheds. Water Int. 2002, 27, 87–97. [Google Scholar] [CrossRef]
  38. Xia, J.; O’Connor, K.M.; Kachroo, R.K.; Liang, G.C. A non-linear perturbation model considering catchment wetness and its application in river flow forecasting. J. Hydrol. 1997, 200, 164–178. [Google Scholar] [CrossRef]
  39. Hock, R. Temperature index melt modelling in mountain areas. J. Hydrol. 2003, 282, 104–115. [Google Scholar] [CrossRef]
  40. Seibert, J.; Vis, M.J.P. Teaching hydrological modeling with a user-friendly catchment-runoff-model software package. Hydrol. Earth Syst. Sci. Discuss. 2012, 9, 5905–5930. [Google Scholar] [CrossRef] [Green Version]
  41. Nash, J.E. HRS A unit hydrograph study, with particular reference to British catchments. Proc. Inst. Civ. Eng. 1960, 17, 249–282. [Google Scholar]
  42. Duan, Q.; Sorooshian, S.; Gupta, V.K. Optimal use of the SCE-UA global optimization method for calibrating watershed models. J. Hydrol. 1994, 158, 265–284. [Google Scholar] [CrossRef]
  43. Nash, J.E.; Sutcliffe, J. V River flow forecasting through conceptual models part I—A discussion of principles—ScienceDirect. J. Hydrol. 1970, 10, 282–290. [Google Scholar] [CrossRef]
  44. Ji, X.; Kang, E.; Chen, R.; Zhao, W.; Zhang, Z.; Jin, B. The impact of the development of water resources on environment in arid inland river basins of Hexi region, Northwestern China. Environ. Geol. 2006, 50, 793–801. [Google Scholar] [CrossRef]
  45. Wu, F.; Zhan, J.; Wang, Z.; Zhang, Q. Streamflow variation due to glacier melting and climate change in upstream Heihe River Basin, Northwest China. Phys. Chem. Earth Parts A/B/C 2015, 79, 11–19. [Google Scholar] [CrossRef]
  46. Zhang, S.; Wang, D.; Qin, Z.; Zheng, Y.; Guo, J. Assessment of the GPM and TRMM Precipitation Products Using the Rain Gauge Network over the Tibetan Plateau. J. Meteorol. Res. 2018, 32, 324–336. [Google Scholar] [CrossRef]
  47. Xu, R.; Tian, F.; Yang, L.; Hu, H.; Lu, H.; Hou, A. Ground validation of GPM IMERG and trmm 3B42V7 rainfall products over Southern Tibetan plateau based on a high-density rain gauge network. J. Geophys. Res. 2017, 122, 910–924. [Google Scholar] [CrossRef]
  48. Wang, X.; Ding, Y.; Zhao, C.; Wang, J. Similarities and improvements of GPM IMERG upon TRMM 3B42 precipitation product under complex topographic and climatic conditions over Hexi region, Northeastern Tibetan Plateau. Atmos. Res. 2019, 218, 347–363. [Google Scholar] [CrossRef]
  49. Meng, C.; Mo, X.; Liu, S.; Hu, S. Extensive evaluation of IMERG precipitation for both liquid and solid in Yellow River source region. Atmos. Res. 2021, 256, 105570. [Google Scholar] [CrossRef]
  50. Luo, J.; Chen, H.; Zhou, B. Comparison of snowfall variations over china identified from different snowfall/rainfall discrimination methods. J. Meteorol. Res. 2020, 34, 1114–1128. [Google Scholar] [CrossRef]
  51. Jiang, L.; Bauer-Gottwein, P. How do GPM IMERG precipitation estimates perform as hydrological model forcing? Evaluation for 300 catchments across Mainland China. J. Hydrol. 2019, 572, 486–500. [Google Scholar] [CrossRef]
Figure 1. (a) Geographical location of the HRB and its headwaters. (b) Locations of meteorological and hydrologic stations in the HRB headwaters as seen on a Digital Elevation Model (DEM).
Atmosphere 14 00453 g001
Figure 2. The spatial distribution of the seven evaluation metrics for the GPM and TRMM at the daily and grid scales (a-1,a-2) R, (b-1,b-2) MAE, (c-1,c-2) RMSE, (d-1,d-2) BIAS, (e-1,e-2) POD, (f-1,f-2) FAR, and (g-1,g-2) CSI.
Atmosphere 14 00453 g002
Figure 3. Plot of the simulated runoff via the TVGM-DDF with the fixed parameter.
Atmosphere 14 00453 g003
Figure 4. Plot of the simulated runoff via the TVGM-DDF with the variable parameter.
Atmosphere 14 00453 g004
Figure 5. (a) The Probability Density Function(PDF) plot of the average daily precipitation in the HRB. (b) The Cumulative Distribution Function(CDF) plot of the average daily precipitation in the HRB.
Atmosphere 14 00453 g005
Table 1. The statistical index of SPPs evaluation.
Statistical MetricsFormulaOptimal ValueValue Range
Correlation Coefficient (R) R = i = 1 n ( G i G ¯ ) ( P i P ¯ ) i = 1 n ( G i G ¯ ) 2 i = 1 n ( P i P ) 2 1[−1, 1]
Relative Bias (BIAS) B I A S = i = 1 n P i i = 1 n G i 1 0(−∞, +∞)
Mean Absolute Error (MAE) M A E = i = 1 n | ( P i G i ) | n 0[0, +∞)
Root Mean Squared Error (RMSE) R M S E = i = 1 n ( P i G i ) 2 n 0[0, +∞)
Probability Of Detection (POD) P O D = H H + M 1[0, 1]
False Alarm Ratio (FAR) F A R = F H + F 0[0, 1]
Critical Success Index (CSI) C S I = H H + M + F 1[0, 1]
where n is the sample size, Gi is the reference precipitation data, and Pi is the i-th value of SPPs. The lowest amount of precipitation that may be measured in a precipitation gauge station is 0.1 mm, hence 0.1 mm/day is the threshold value for determining if a precipitation event has been measured [34,35]. In addition, H refers to the number of precipitation events that are simultaneously detected by the reference precipitation dataset and the SPPs. M stands for the number of precipitation events observed in the reference dataset but not detected by the SPPs, and F stands for the number of precipitation events detected by the SPPs but not detected in the reference dataset.
Table 2. Upper and lower limits of the parameters associated with the TVGM-DDF model.
Parameter ClassificationPrecipitation Runoff ParametersSnowmelt Runoff ParameterFlow Parameters
Nameg1g2DDFnk
Lower range00000
Upper range11102020
Table 3. The average values of seven evaluation metrics for the GPM and TRMM at the grid scale.
Product NameRMAERMSEBIASPODFARCSI
GPM0.18 1.75 4.11 27% 0.59 0.54 0.35
TRMM0.14 2.11 5.02 10% 0.42 0.55 0.28
Notes: the BIAS value is the absolute value.
Table 4. The four evaluation metrics pertinent to the GPM and TRMM at the grid scale in various seasons.
SeasonSPPsRMAERMSEBIAS (%)
SpringGPM0.141.30 2.79−39.81
TRMM0.04 0.843.21 −21.08
SummerGPM0.153.59 5.60−16.20
TRMM0.07 3.516.75 9.68
FallGPM0.161.36 2.82−36.96
TRMM0.07 0.813.12−27.24
WinterGPM−0.04 0.19 0.70−92.99
TRMM−0.04 0.080.78 −53.78
Note: The optimal value is in bold.
Table 5. Precision of different SPPs driven hydrological models under different scenarios.
CGDPAGPMTRMM
Fixed parameters0.830.840.77
Variable parameters0.830.900.90
Table 6. Basic information of meteorological stations in the HRB.
NumberNameLongitude (°)Latitude (°)Elevation (m)
52,633Tuole38.8 98.4 2311.8
52,645Yeniugou38.4 99.6 3320.0
52,657Qilian38.2 100.3 2787.4
52,661Shandan38.8 101.1 1764.6
52,652Zhangye 38.9 100.4 1482.7
Table 7. Accuracy index of snow detection of two products.
Index52,633 52,645 52,657 52,661 52,652
GPMPOD0.63 0.63 0.19 0.65 0.26
FAR0.70 0.63 0.93 0.70 0.78
CSI0.25 0.31 0.05 0.26 0.13
TRMMPOD0.32 0.36 0.09 0.31 0.12
FAR0.69 0.56 0.92 0.69 0.81
CSI0.19 0.25 0.04 0.18 0.08
Disclaimer/Publisher’s Note: The statements, opinions and data contained in all publications are solely those of the individual author(s) and contributor(s) and not of MDPI and/or the editor(s). MDPI and/or the editor(s) disclaim responsibility for any injury to people or property resulting from any ideas, methods, instructions or products referred to in the content.

