Article

Quantifying the Impact of Canopy Structural Characteristics on Soil Temperature Variations in Different Bamboo Communities

College of Landscape Architecture, Zhejiang A & F University, Hangzhou 311300, China
*
Author to whom correspondence should be addressed.
These authors contributed equally to this work.
Atmosphere 2023, 14(3), 445; https://doi.org/10.3390/atmos14030445
Submission received: 23 January 2023 / Revised: 16 February 2023 / Accepted: 20 February 2023 / Published: 23 February 2023
(This article belongs to the Special Issue Urban Green and Blue Infrastructures for Heat Mitigation)

Abstract

:
Soil temperature plays an important role in soil respiration, which is related to the atmospheric carbon cycle. In addition to its own physical and chemical properties, soil temperature is also influenced by external environmental factors, including plants. Therefore, it is relevant to explore the relationship between plant characteristics and soil temperature. This study was conducted in Hangzhou, China. The influence of canopy structural characteristics of bamboo communities on soil temperature was investigated in detail by means of field measurements. In summer, the canopy structure of bamboo communities reduced the soil temperature by up to 3.0–3.8 °C, 2.4–3.4 °C, and 2.3–3.0 °C at 5 cm, 10 cm, and 20 cm, respectively. In winter, the canopy structure of bamboo communities increased soil temperature by up to 0.1–0.4 °C, 0.1–0.6 °C, and 0.2–0.7 °C at 5 cm, 10 cm, and 20 cm, respectively. The leaf area index and canopy cover significantly affected the soil temperature, while the effect of the sky view factor was minimal compared to other factors. We also discovered that soil temperatures at different depths interact and are influenced by the air temperature. These findings provide a more reasonable bamboo canopy plan to improve the urban environment effectively.

1. Introduction

With rapid urbanization and the expansion of urban areas, the atmospheric CO2 content of greenhouse gases has dramatically increased due to the impact of human activities, leading to global warming [1,2,3,4,5]. Global warming is an abnormal climatic phenomenon and a serious environmental problem; thus, it has become the focus of research in global climatology and ecology. Global warming not only increases the occurrence of natural disasters, but also leads to an increase in the prevalence and severity of infectious diseases [6,7,8,9,10,11]. The most effective measure to combat global climate change is to control carbon emissions. The world’s soils, which serve as a large reservoir of reactive carbon and an important source of atmospheric carbon dioxide, have an organic carbon storage of approximately 1500 Pg C, which are essential for regulating the global carbon cycle and minimizing the greenhouse effect [12,13,14,15]. Estimated at approximately 77 × 1015 gC/y, soil respiration is the main process of carbon release in ecosystems [16]. Many studies have proven that soil temperature (ST) is a vital factor in soil respiration and a feature that significantly affects biological events and guides physical and chemical processes in soil [17,18,19,20,21,22].
Previous studies show that soil temperature is affected by various factors such as time, meteorological conditions, soil depth, soil type, land cover type, precipitation, and topography [23,24,25,26,27,28]. However, its surrounding environment also has a significant influence, especially the plants above. Many studies have revealed that vegetation is crucial in the temporal and spatial changes in soil heat [26,29]. Hashimoto et al. investigated how vegetation changes ST and discovered that the annual mean ST at depths of 0.5 m, 1.0 m, 2.0 m, and 3.0 m increased by approximately 2.2 °C, 2.0 °C, 1.7 °C, and 1.4 °C, respectively, after clear-cutting. He reported that the maximum ST also increased by approximately 3.2 °C, 3.0 °C, 2.2 °C, and 1.8 °C, respectively [30]. Ni et al. compared the ST of tree-covered flat ground, grass-covered ground, and bare flat ground for reference based on an ST of 0.35–2.3 m. The results showed that the ST of tree-covered flat ground was always lower than its air temperature (AT) and the bare flat ground’s ST. In addition, due to the existence of tree crowns, the ST fluctuation of tree-covered flat ground (18.5–31.1 °C) is smaller than that of bare soil (19–38.7 °C) [31]. In addition, there were scholars who discovered that plant coverage and the leaf area index (LAI) significantly affected ST. Throughout the growing season, compared with sites with a low LAI, sites with a high LAI had STs that were 7 °C lower and surface temperatures that were 6 °C lower [32]. Few detailed attempts have been made to directly understand the internal relationship between the correlation factors of plants and ST, such as the LAI, canopy coverage (CC), and sky view factor (SVF). However, few studies have been conducted from the different seasonal perspectives of summer and winter; previous studies focused mainly on summer.
Bamboo is a distinct plant type in subtropical and tropical areas, with more than 70 genera and 1200 species in the world, mainly distributed in tropical and subtropical regions. China is the country with the richest bamboo resources, ranking first in the world in terms of bamboo species, bamboo area, and bamboo accumulation. At present, China has more than 500 bamboo species in 39 genera and an area of over 500 million hectares, accounting for a quarter of the world’s bamboo area [33,34,35]. As bamboo has the characteristics of fast growth, high yield, strong adaptability, and rich cultural connotation, it has been widely utilized in the construction of urban and rural green spaces in recent years. Research on soil erosion control, water conservation, land rehabilitation, carbon sequestration, and sustainable materials for a green building construction based on bamboo has gradually attracted the attention of scholars worldwide [36,37]. In addition, the research on the thermal comfort of bamboo stands has increased in recent years, and some correlation function models have also been developed [38]. More studies on the diurnal variation in the ST of bamboo communities in urban green spaces and the effects of community canopy structure are thus necessary.
Given the above issues, to provide insights into ameliorating the urban bamboo landscape using planning and design strategies, in the present work, we analyzed the daily variation characteristics of soil temperature in different bamboo communities and compared the differences in soil temperature in different communities, from which we explored the influence of canopy structure characteristics (LAI, CC, and SVF) of bamboo communities on soil temperature changes. The objectives of this study were (1) to determine the daily variation characteristics of AT and ST at different depths in different bamboo communities; (2) to determine the correlations between the ST of different bamboo species and the community canopy structure; and (3) to determine the change rule of the ST of bamboo under the influence of the community canopy structure in different seasons. Thus, we explored the main factors that cause differences among bamboo communities.

2. Materials and Methods
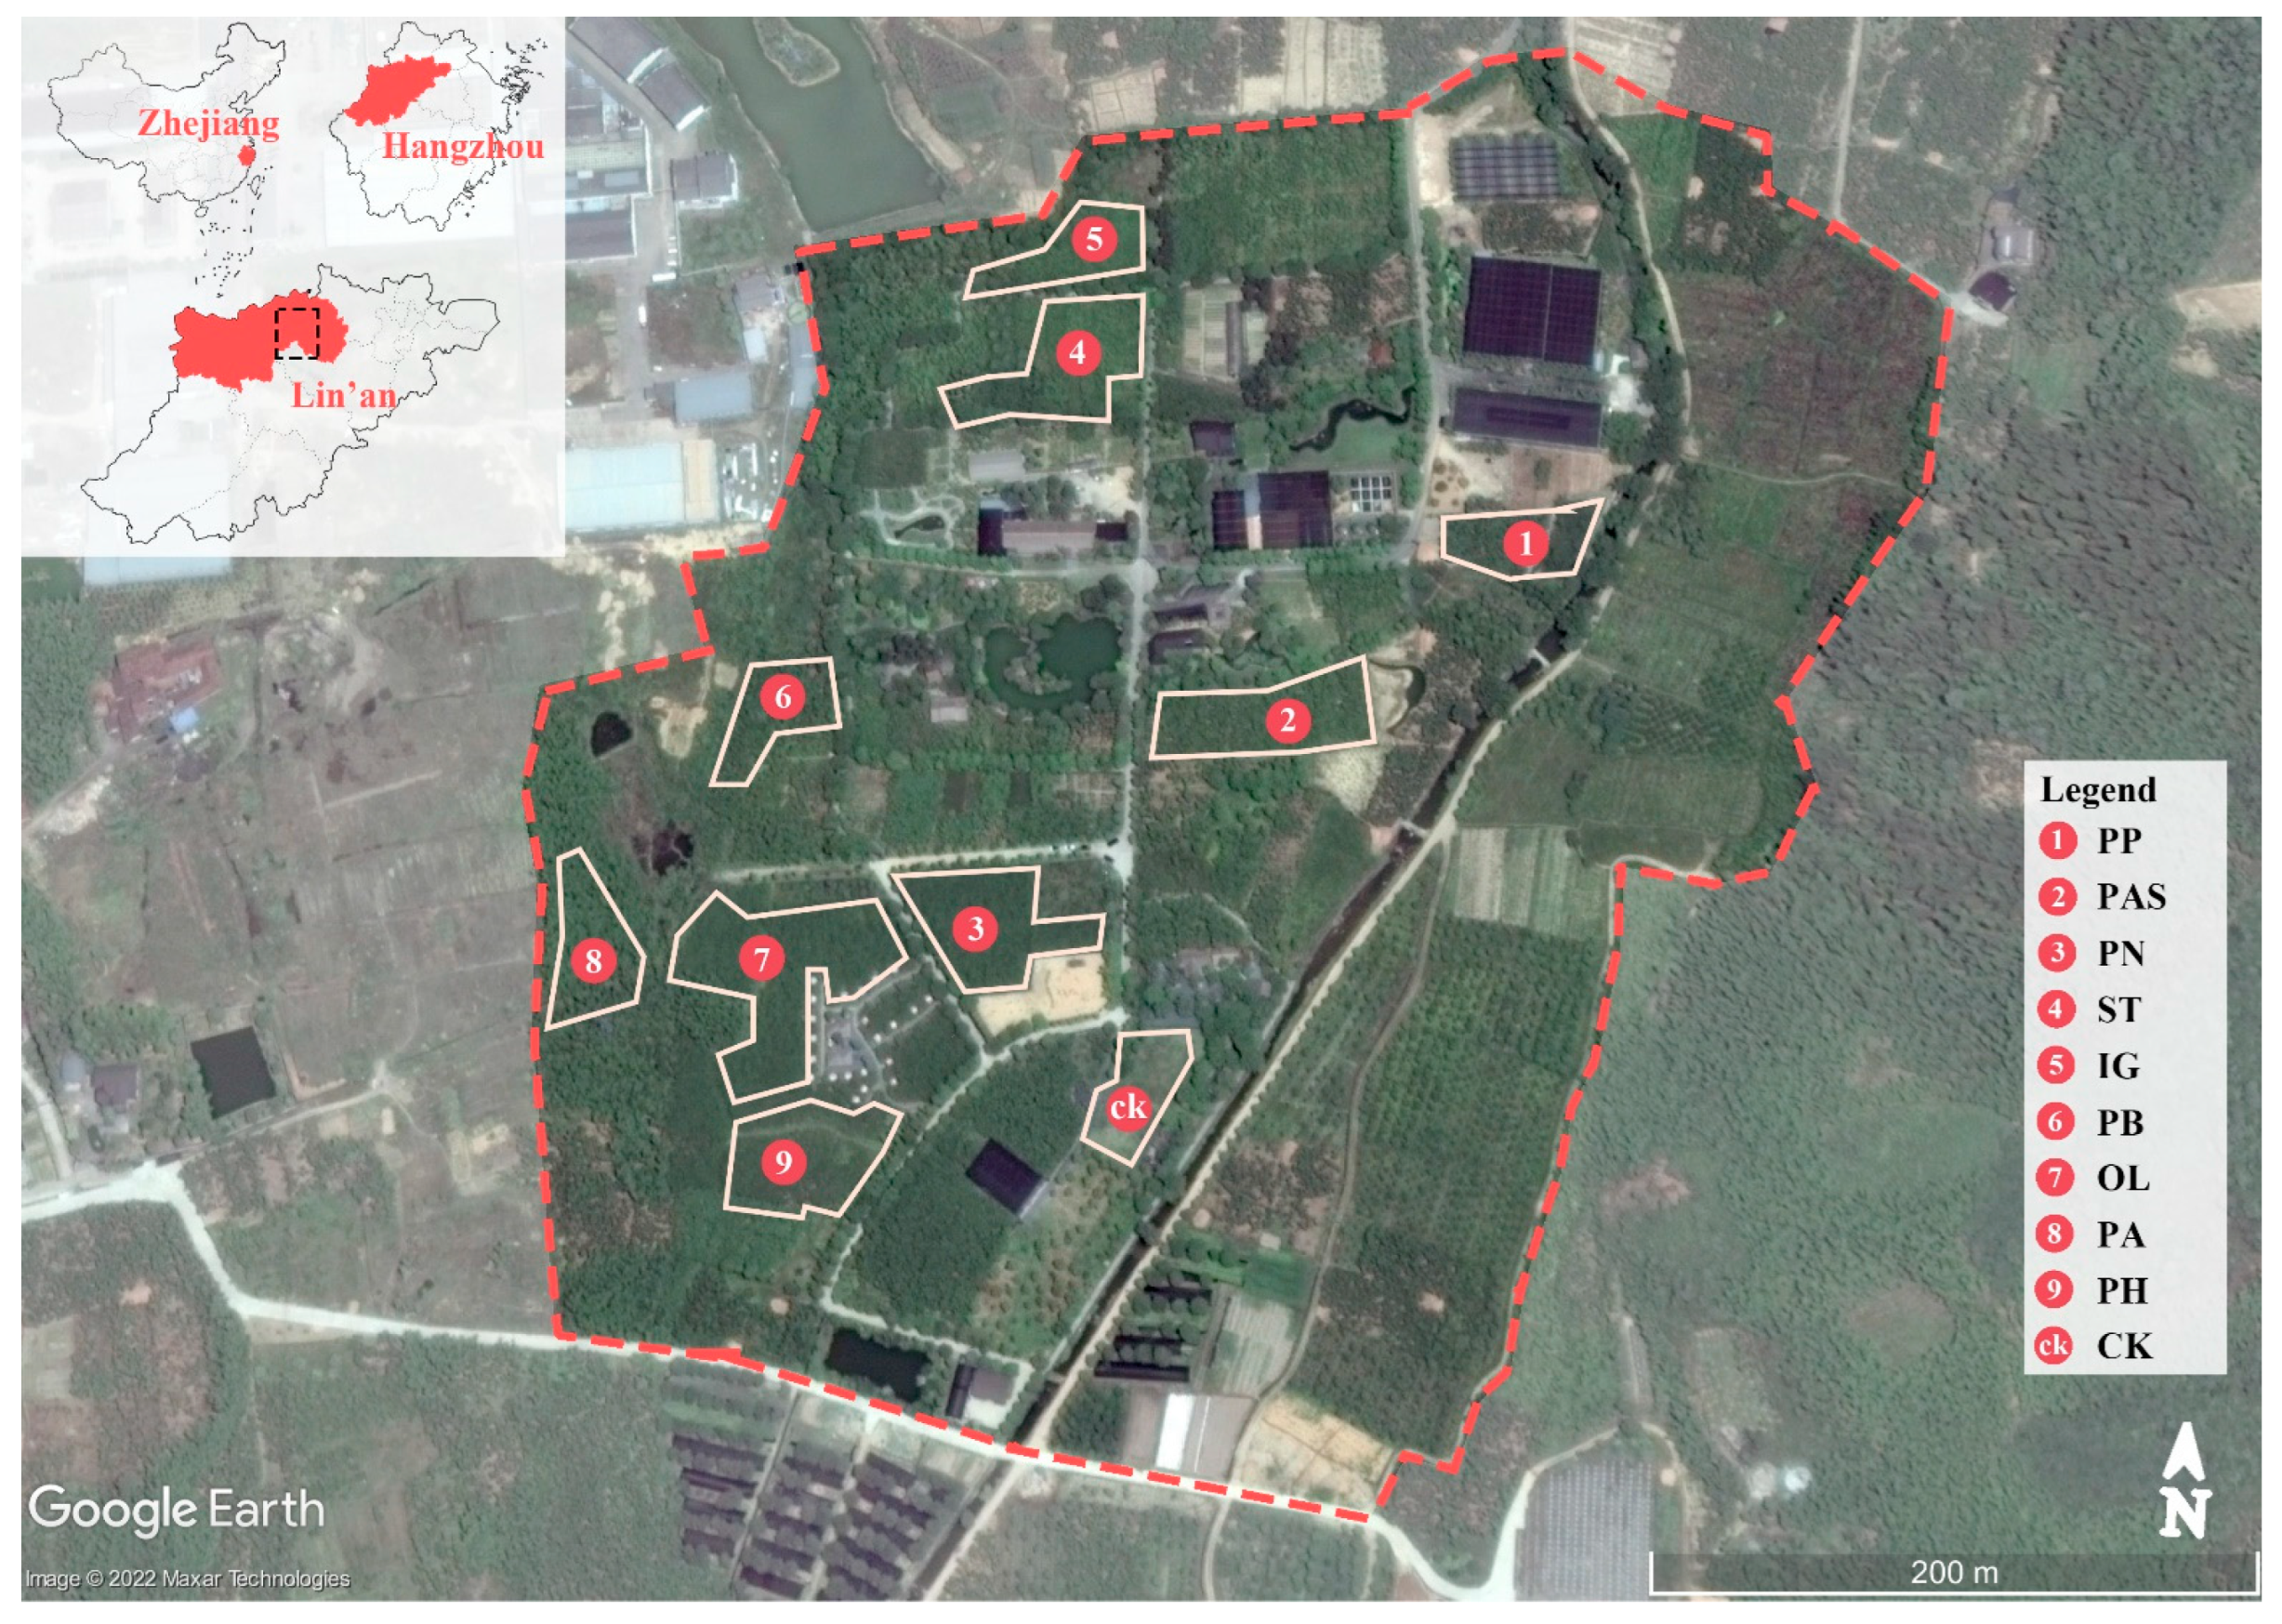
2.1. Study Area

Hangzhou (29°11′–30°33′ N, 118°21′–120°30′ E), the capital of Zhejiang Province, is situated in the Yangtze River delta, and is of type Cfa in the Köppen–Geiger climatic division [39]. Hangzhou has a monsoon climate with hot summers and cold winters. In Hangzhou, the annual average temperature is 16.5 °C, and the average annual precipitation is 1454.6 mm, most of which falls in summer. July is the hottest month, with a mean AT above 28.4 °C, and January is the coldest month, with a mean AT below 4.3 °C. The predominant wind direction in summer is southeast to northwest, and the reverse occurs during winter.
This study was conducted in Bamboo Culture Park in the southwestern region of Lin’an district, Hangzhou, which encompasses a total area of 70 ha (Figure 1). The main plants are members of the Bambusoideae, including 20 genera and 120 species of bamboo (consisting of different varieties). There are multiple pure forest communities of single bamboo species, which is a good place to explore the ecological benefits of different bamboo species. The soil type in this park consists mainly of paddy soil [40]. According to the application status of bamboo in East China, we selected 9 sample sites of the most common bamboo communities and set the control check (CK) site in unshaded lawn. Detailed parameters of bamboo communities are shown in Table 1. Their areas exceeded 900 m2 and their ages were similar. The distance to each edge of the community was greater than 15 m, the distance from the water bodies was greater than 30 m, and the distance from the road was greater than 15 m. To eliminate the interference of other environmental factors, the sample community was selected in the same area adjacent to the other area, and the analyzed bamboo communities comprised a single species. The clearing of dead leaves and other fallen objects could reduce the impact of respiration on the ST. The surface of the soils was exposed, no weeds were present, and the soil moisture contents of each area were equal.

2.2. Field Measurements

The AT was measured at a distance of 1.5 m above the ground with a humidity/temperature sensor (Tes-1365, Taipei, Taiwan; TA/RH accuracy = ±0.5 °C/±10–95%). The ST was measured using a thermometer (Tes-1310, Taipei, Taiwan; ST accuracy = ±1 °C/±0.3%) (recording depths of 5 cm, 10 cm, and 20 cm). In addition, we utilized the HemiView 2.1 SR5 plant canopy analysis system (Delta-T Devices Ltd., Burwell, UK) to measure the LAI, SVF, and CC of the plant communities. As the bamboos we investigated belong to evergreen plants, the canopy parameters in winter and summer are consistent by default.
All monitoring was carried out on continuous test days with clear sky, no wind, and similar basic weather conditions (AT, wind velocity, and air quality) in summer (25–27 July 2017) and winter (8–10 December 2017) to avoid the potential impact of meteorological factors, such as cloudiness, precipitation, and wind. Temperature measurements were conducted once every two hours from 8:00 to 18:00 every day and continuously for three days. The measurement points were set in the center of each community, and another four readings in the cardinal directions were collected at a distance of 5 m from the center point in the east, south, west, and north directions. The ST, AT, LAI, CC, and SVF of the communities were obtained by averaging the measured data at each measurement point. The ST and AT were measured using the same instruments and methods at the control (CK) site in the unshaded lawn.

2.3. Data Analysis

To analyze and compare the parameters of the different plant communities at different dates and different times, it is necessary to standardize the AT and ST concentrations with the following methods:
Air temperature difference   ( ° C ) : d e l t a A T = A T C K A T s p
Soil temperature difference   ( ° C ) : d e l t a S T = S T C K S T s p  
Soil temperature change rate :   d e l t a S T s p % = ( S T C K S T s p ) / S T C K × 100 %  
where CK represents control sites in the unshaded lawn and sp represents sampling sites in the community.
One-way analysis of variance (ANOVA) was performed to test the comparison of AT and ST between experimental groups and the CK, and multiple comparisons were made using the LSD method. Coefficients of variation and daily average means of canopy structural characteristics (LAI, CC, and SVF) and ST (ST5, ST10, and ST20) were analyzed using ANOVA tests. Significant ANOVAs (p < 0.05) were followed by the LSD multiple comparison test (p < 0.05) to perform multiple comparisons of means. A simple linear regression was further developed to examine the relationship and trend between different depths of ST (recording depths of 5 cm, 10 cm, and 20 cm) and AT, LAI, CC, and SVF. Multivariate regression analysis was employed to quantify the relative contributions of different canopy structural characteristics to ST (ST5, ST10, and ST20) at different times in summer and winter.
All statistical analyses were performed using SPSS 27.0.1 software; p values < 0.05 were regarded as statistically significant.

3. Results

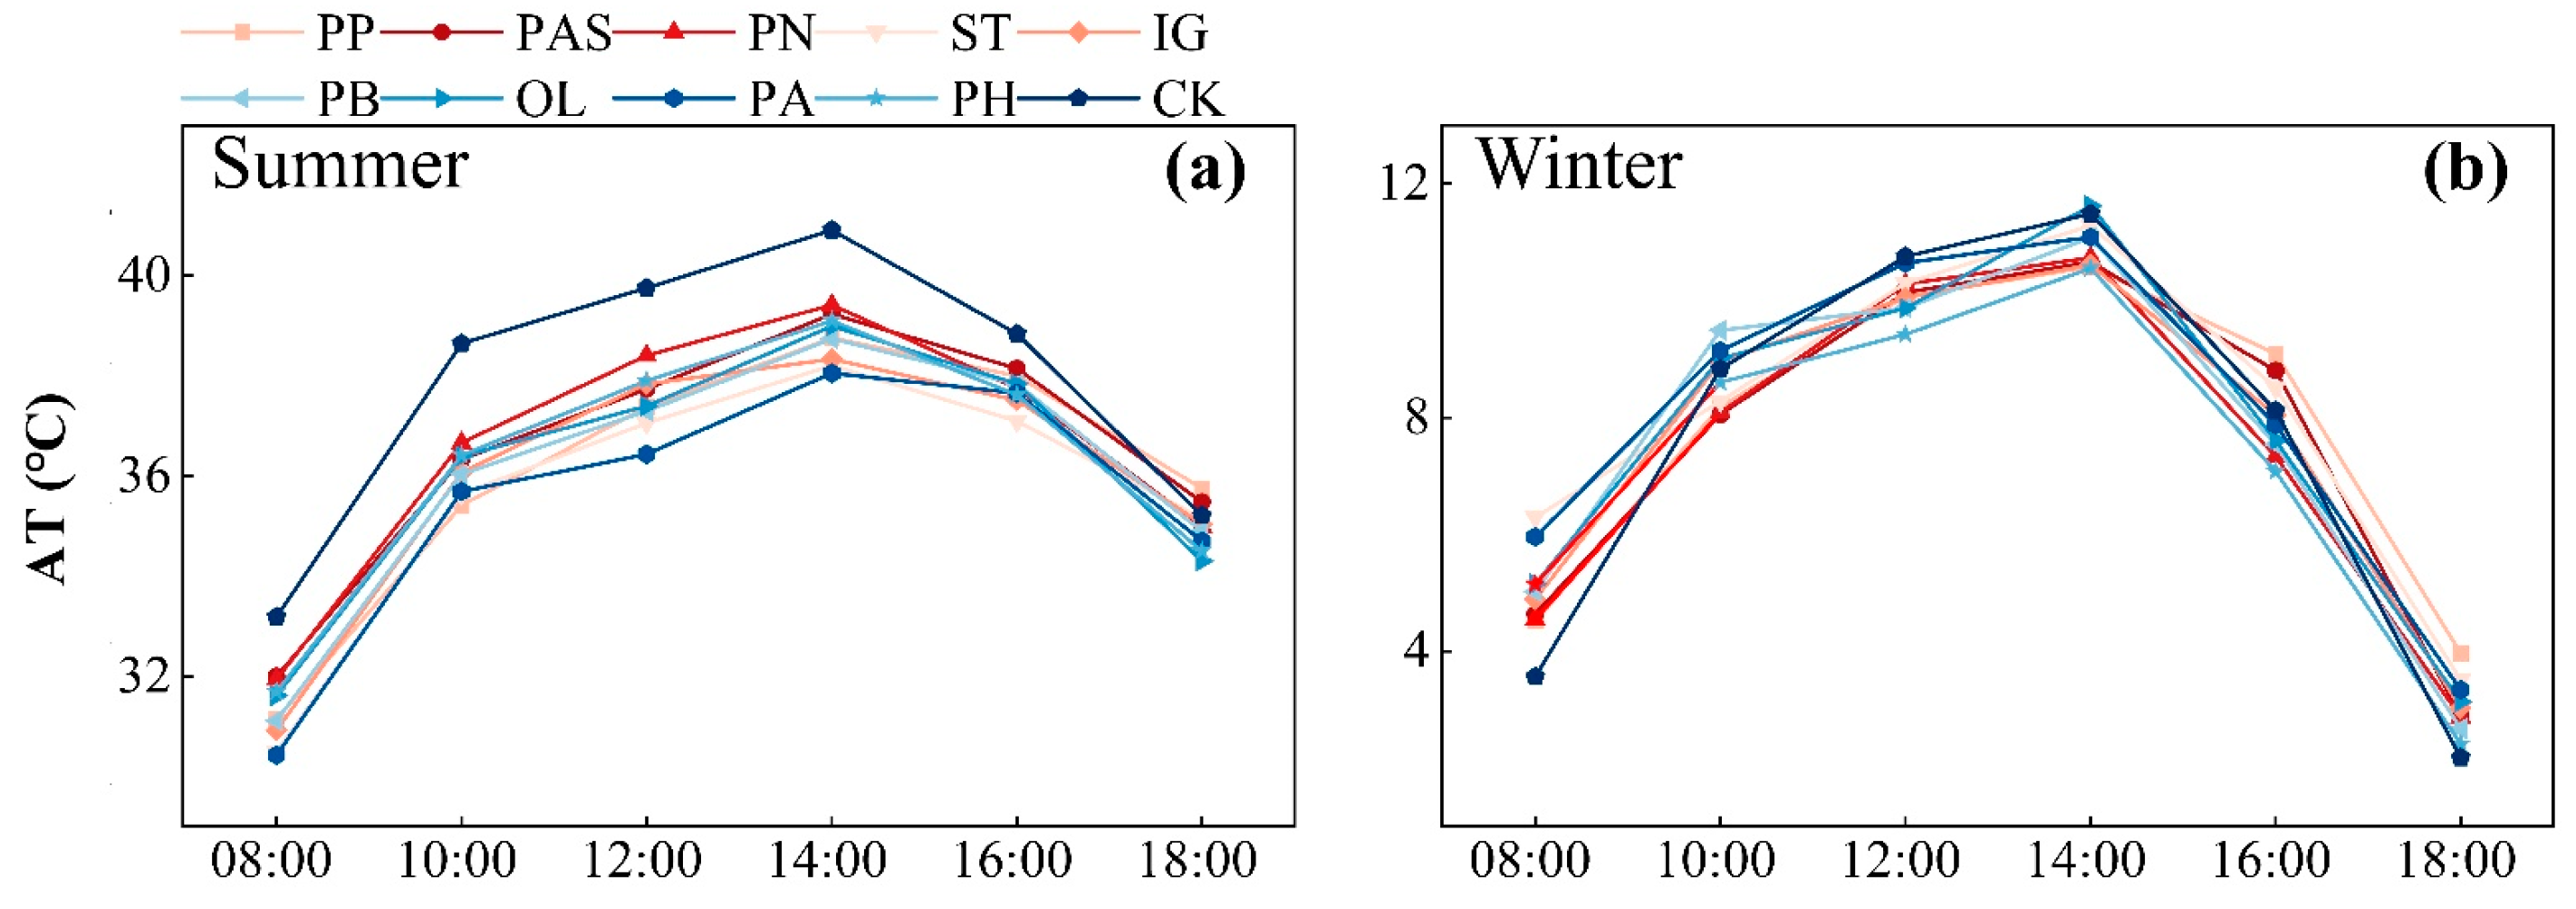
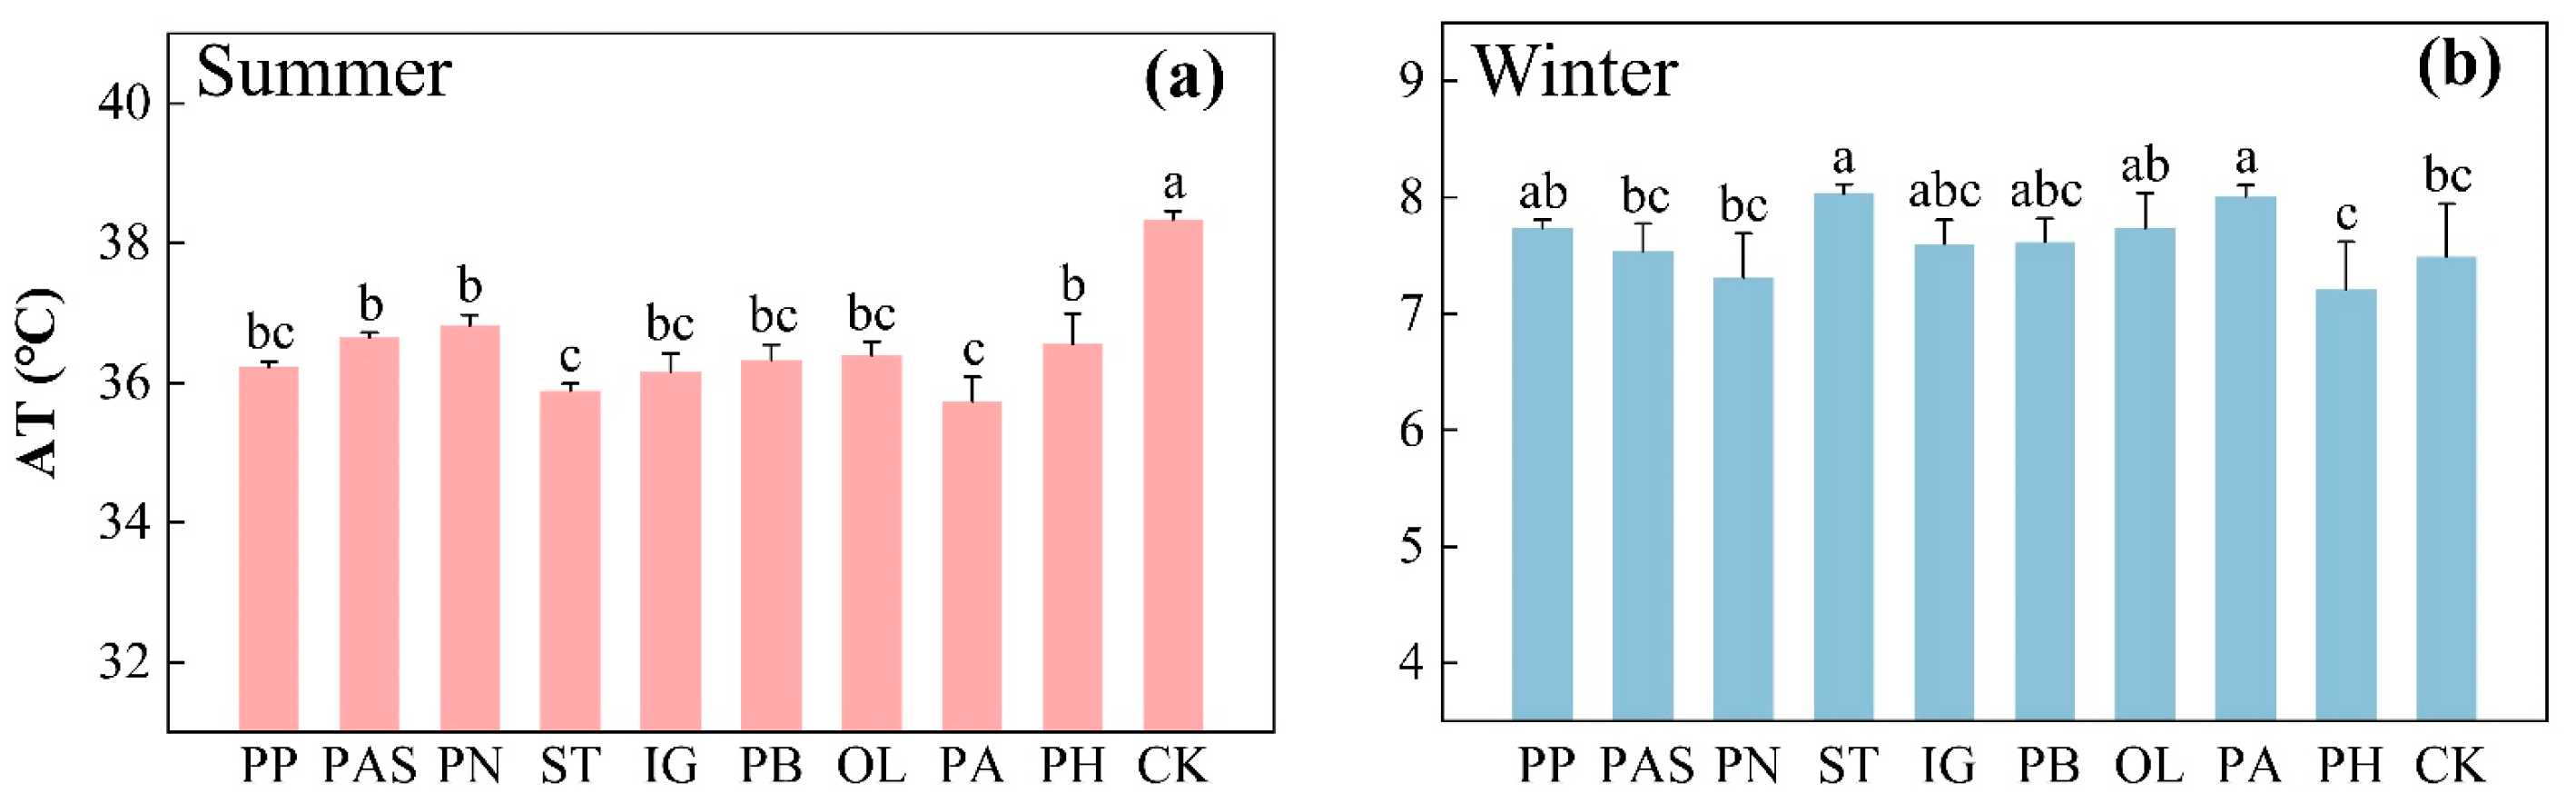
3.1. Air Temperature

During summer daytime, from the data shown in Figure 2 and Table 2, compared with the CK, in the unshaded lawn, the nine experimental groups all had lower AT, which was especially evident during the highest-temperature period of the day (12:00–14:00). During the observation time, the AT of the nine bamboo communities and the CK showed unimodal variation, which increased but then decreased. Among the nine experimental groups, the average deltaAT ranged from 1.5 to 2.6 °C, with a mean of 2.0 °C. The maximum deltaAT was obtained in group PA, and the lowest average deltaAT was in group PN. The average daily temperature of the nine bamboo communities followed the order of PN > PAS/PH > OL > PB > PP/IG > ST > PA. The average temperature at 14:00 followed the order of PN > PAS > PH > OL > PP > PB > IG > ST > PA, while the cooling rate followed the order of PA > ST > IG > PP > PB > OL > PH > PAS > PN.
During the winter daytime (Figure 2 and Table 3), the AT of the CK group was initially lower than that of the experimental groups, and then was slightly higher than that of the experimental groups from 12:00 to 16:00. After sunset, the AT of the CK group was gradually lower than that of the experimental groups. Similar to summer, the AT of all groups showed a trend of rising and then falling. Among the nine experimental groups, groups ST and PA had a maximum deltaAT of 0.5 °C and a minimum deltaAT (0 °C) in area PAS. The average daily temperature of the nine bamboo communities followed the order of ST/PA > PP/OL > IG/PB > PAS > PN > PH. The average temperature at 18:00 followed the order of PP > ST > PA > OL > IG > PAS/PN > PB > PH, while the height of the temperature rise followed the order of ST > PA > PP/OL > PB > IG > PAS > PN > PH.
The results of the one-way ANOVA of the daily average AT of the different bamboo communities and the CK in a day (Figure 3) showed that there was a significant difference in the daily average temperature between the bamboo communities and the CK during summer (LSD multiple comparison, p < 0.01) and in winter; only ST and PA have significant heat preservation functions in winter compared to CK. The results indicate that the bamboo communities have a significant cooling effect in summer and a certain heat preservation function in winter. Overall, the thermal performance difference in summer was clearly higher than that in winter.

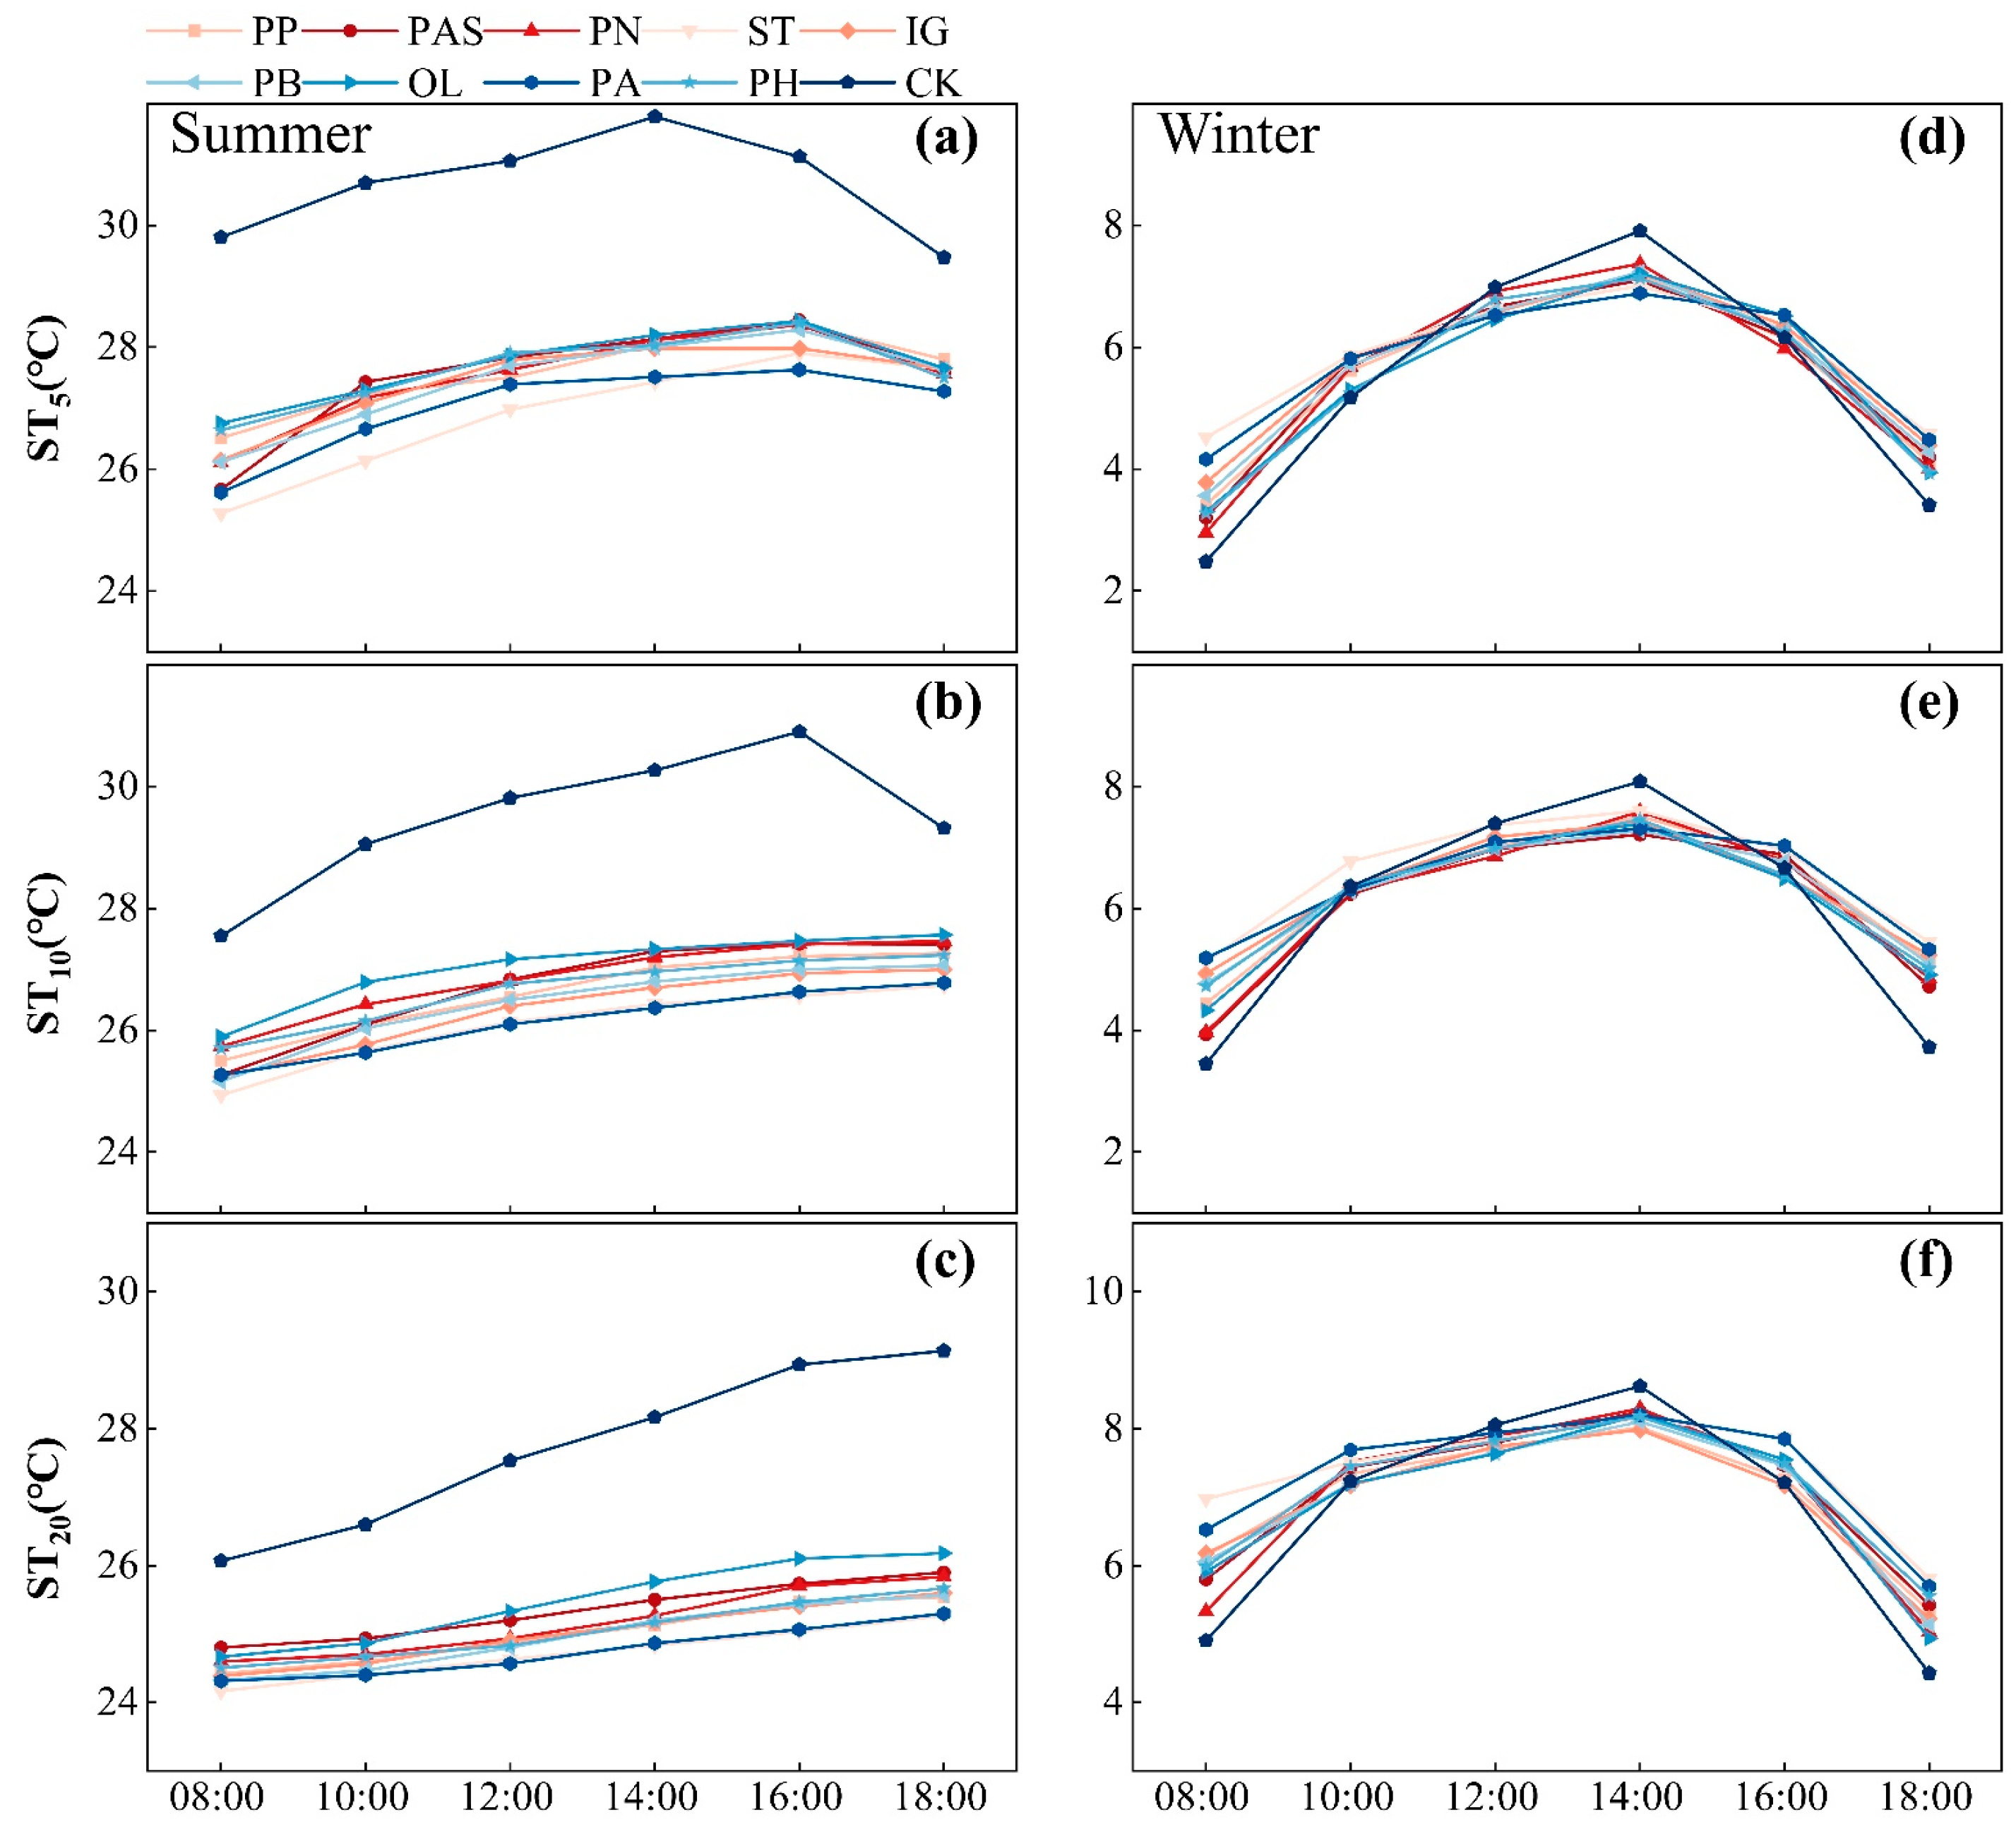
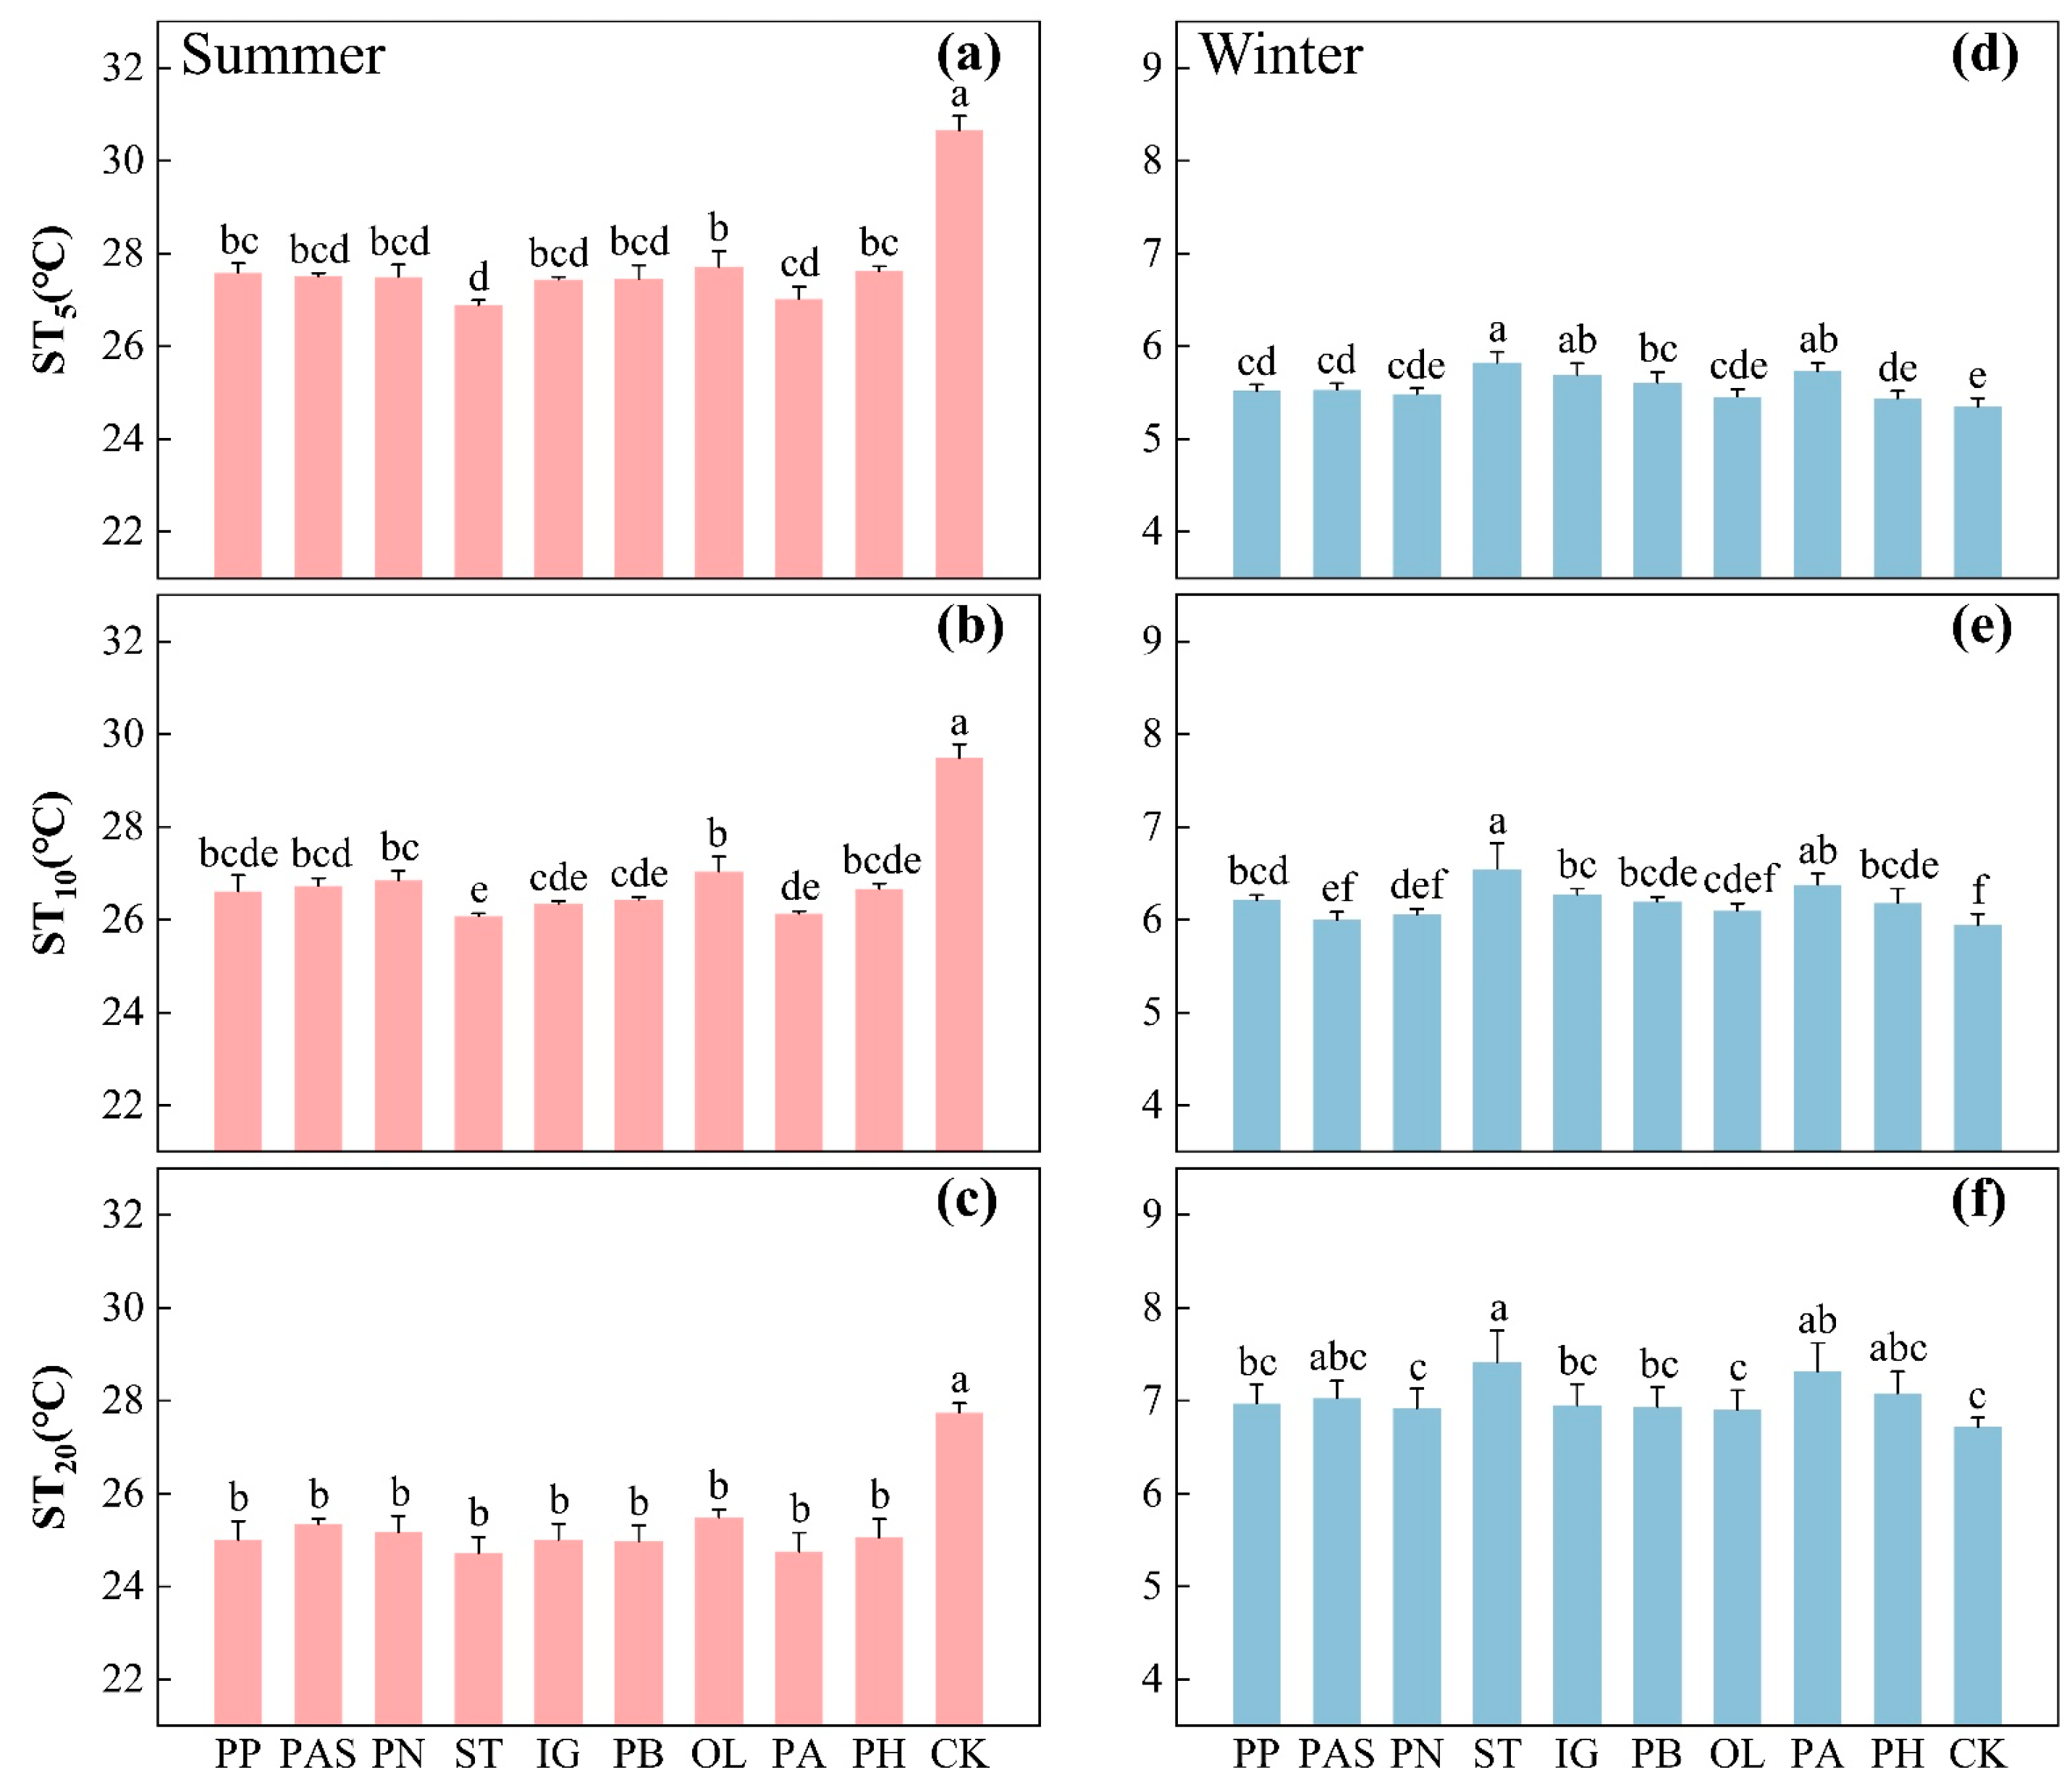
3.2. Soil Temperature

According to Figure 4a–c, the ST of the different bamboo communities and the CK showed unimodal variation in summer and winter, in which the ascending speed was fast and then slow. During the summer daytime (Table 2 and Figure 4a–c), from 08:00 to 18:00, the ST at different depths of the CK was significantly higher than that of the bamboo communities. Therefore, each community had a cooling effect on the ST of the internal environment, and different bamboo communities differed in their cooling effect. From 08:00 to 10:00, with an increase in the solar radiation intensity in the external environment, the ST of the CK rapidly increased, whereas the ST in the bamboo communities slowly increased. Until 10:00, the ST of the CK continuously increased and gradually peaked. However, the time at which the highest temperature occurred varied by depth. At 5 cm depth, the maximum ST occurred from 14:00 to 16:00, and as the depth increased, the ST exhibited a significant lag effect. At 10 cm depth, the maximum ST occurred at approximately 16:00; at 20 cm depth, it occurred at approximately 18:00. Then, as the intensity of solar radiation weakened, the ST of the CK and the bamboo communities gradually decreased in growth rate, with that of the CK showing a greater decrease. Therefore, the cooling effect correspondingly weakened significantly. In addition, the ST was lower than the AT during most summer daytimes.
However, during the winter daytime (Table 3 and Figure 4a–c), the ST of the CK was slightly higher than that of the bamboo community only at 12:00–14:00 and lower than that of the bamboo community at other times. The ST of each community had a heat preservation effect mostly during the period of low solar radiation, and the different plant communities exhibited different heat preservation effects. Until 12:00–14:00, the ST of each depth and the CK peaked. With a decrease in solar radiation, the ST of each community and the CK also gradually decreased, while the CK exhibited a greater change.
The results of the ANOVA of the three daily average STs of the different bamboo communities and the CK during summer and winter (Figure 5) indicated a significant difference between the daily average ST (soil depths of 5 cm, 10 cm, and 20 cm) of the communities and that of the CK (LSD multiple comparison test; p < 0.01). These results show that the bamboo communities have a significant effect on the ST. However, this effect is less as the soil deepens, and the impact is more significant in summer than in winter.
Compared with that in the CK, the daytime mean deltaST at 5 cm soil depth in the bamboo communities in summer ranged from 3.0 to 3.8 °C, with an average value of 3.3 °C, and the cooling rate ranged from 9.6 to 12.3%, with an average value of 10.6%. Among the different bamboo communities, OL significantly differed from ST and PA. The average ST at 5 cm depth of the nine bamboo communities followed the order of OL > PH/PP > PAS/PN > PB/IG > PA > ST. The average temperature at 14:00 followed the order of OL > PAS/PN > PP/IG/PB/PH > PA > ST, while the cooling rate followed the order of ST > PA > IG/PB > PN/PAS > PP > PH > OL. In winter, the average deltaST ranged from 0 to 0.4 °C, with an average value of 0.2 °C. Among all the experimental groups, ST, IG, PB, and PA significantly differed from PH. The average ST at 5 cm depth of the nine bamboo communities followed the order of ST > IG/PA > PB > PP/PAS/PN/OL > PH. The average temperature at 18:00 followed the order of ST > PA > IG > PB > PAS > PP > PN/OL/PH, while the height of temperature rise followed the order of ST > PA > IG > PB > PAS > PP > OL > PN > PH.
For the 10 cm depth of soil, compared to the control group, the average daily cooling intensity at 10 cm soil depth in the bamboo communities ranged from 2.5 to 3.4 °C in summer, with an average value of 3.0 °C, and the cooling rate ranged from 8.3 to 11.5%, with an average value of 10.0%. Among the different bamboo communities, OL had the highest average ST at the 10 cm depth of the nine bamboo communities and significantly differed from ST, IG, PB, and PA. Furthermore, PN was significantly different from ST and PA, and PAS was significantly different from ST, which had the highest average temperature at 14:00. In winter, the average deltaST ranged from 0.1 to 0.6 °C, with an average value of 0.3 °C. Among all the experimental groups, ST and PA were highest at 18:00 and were significantly different from PAS, PN, and OL.
In summer, the daily temperature of the 20 cm soil depth in the bamboo communities ranged from 24.7 to 25.5 °C, with an average of 25.1 °C, and the temperature ranged from 8.1 to 10.9%, with an average of 9.7%. In winter, the average deltaST ranged from 0.2 to 0.7 °C, with an average value of 0.3 °C. Among all the experimental groups, ST and PA significantly differed from PN and OL, which were the two communities with the lowest average daily temperature and the average temperature at 18:00.

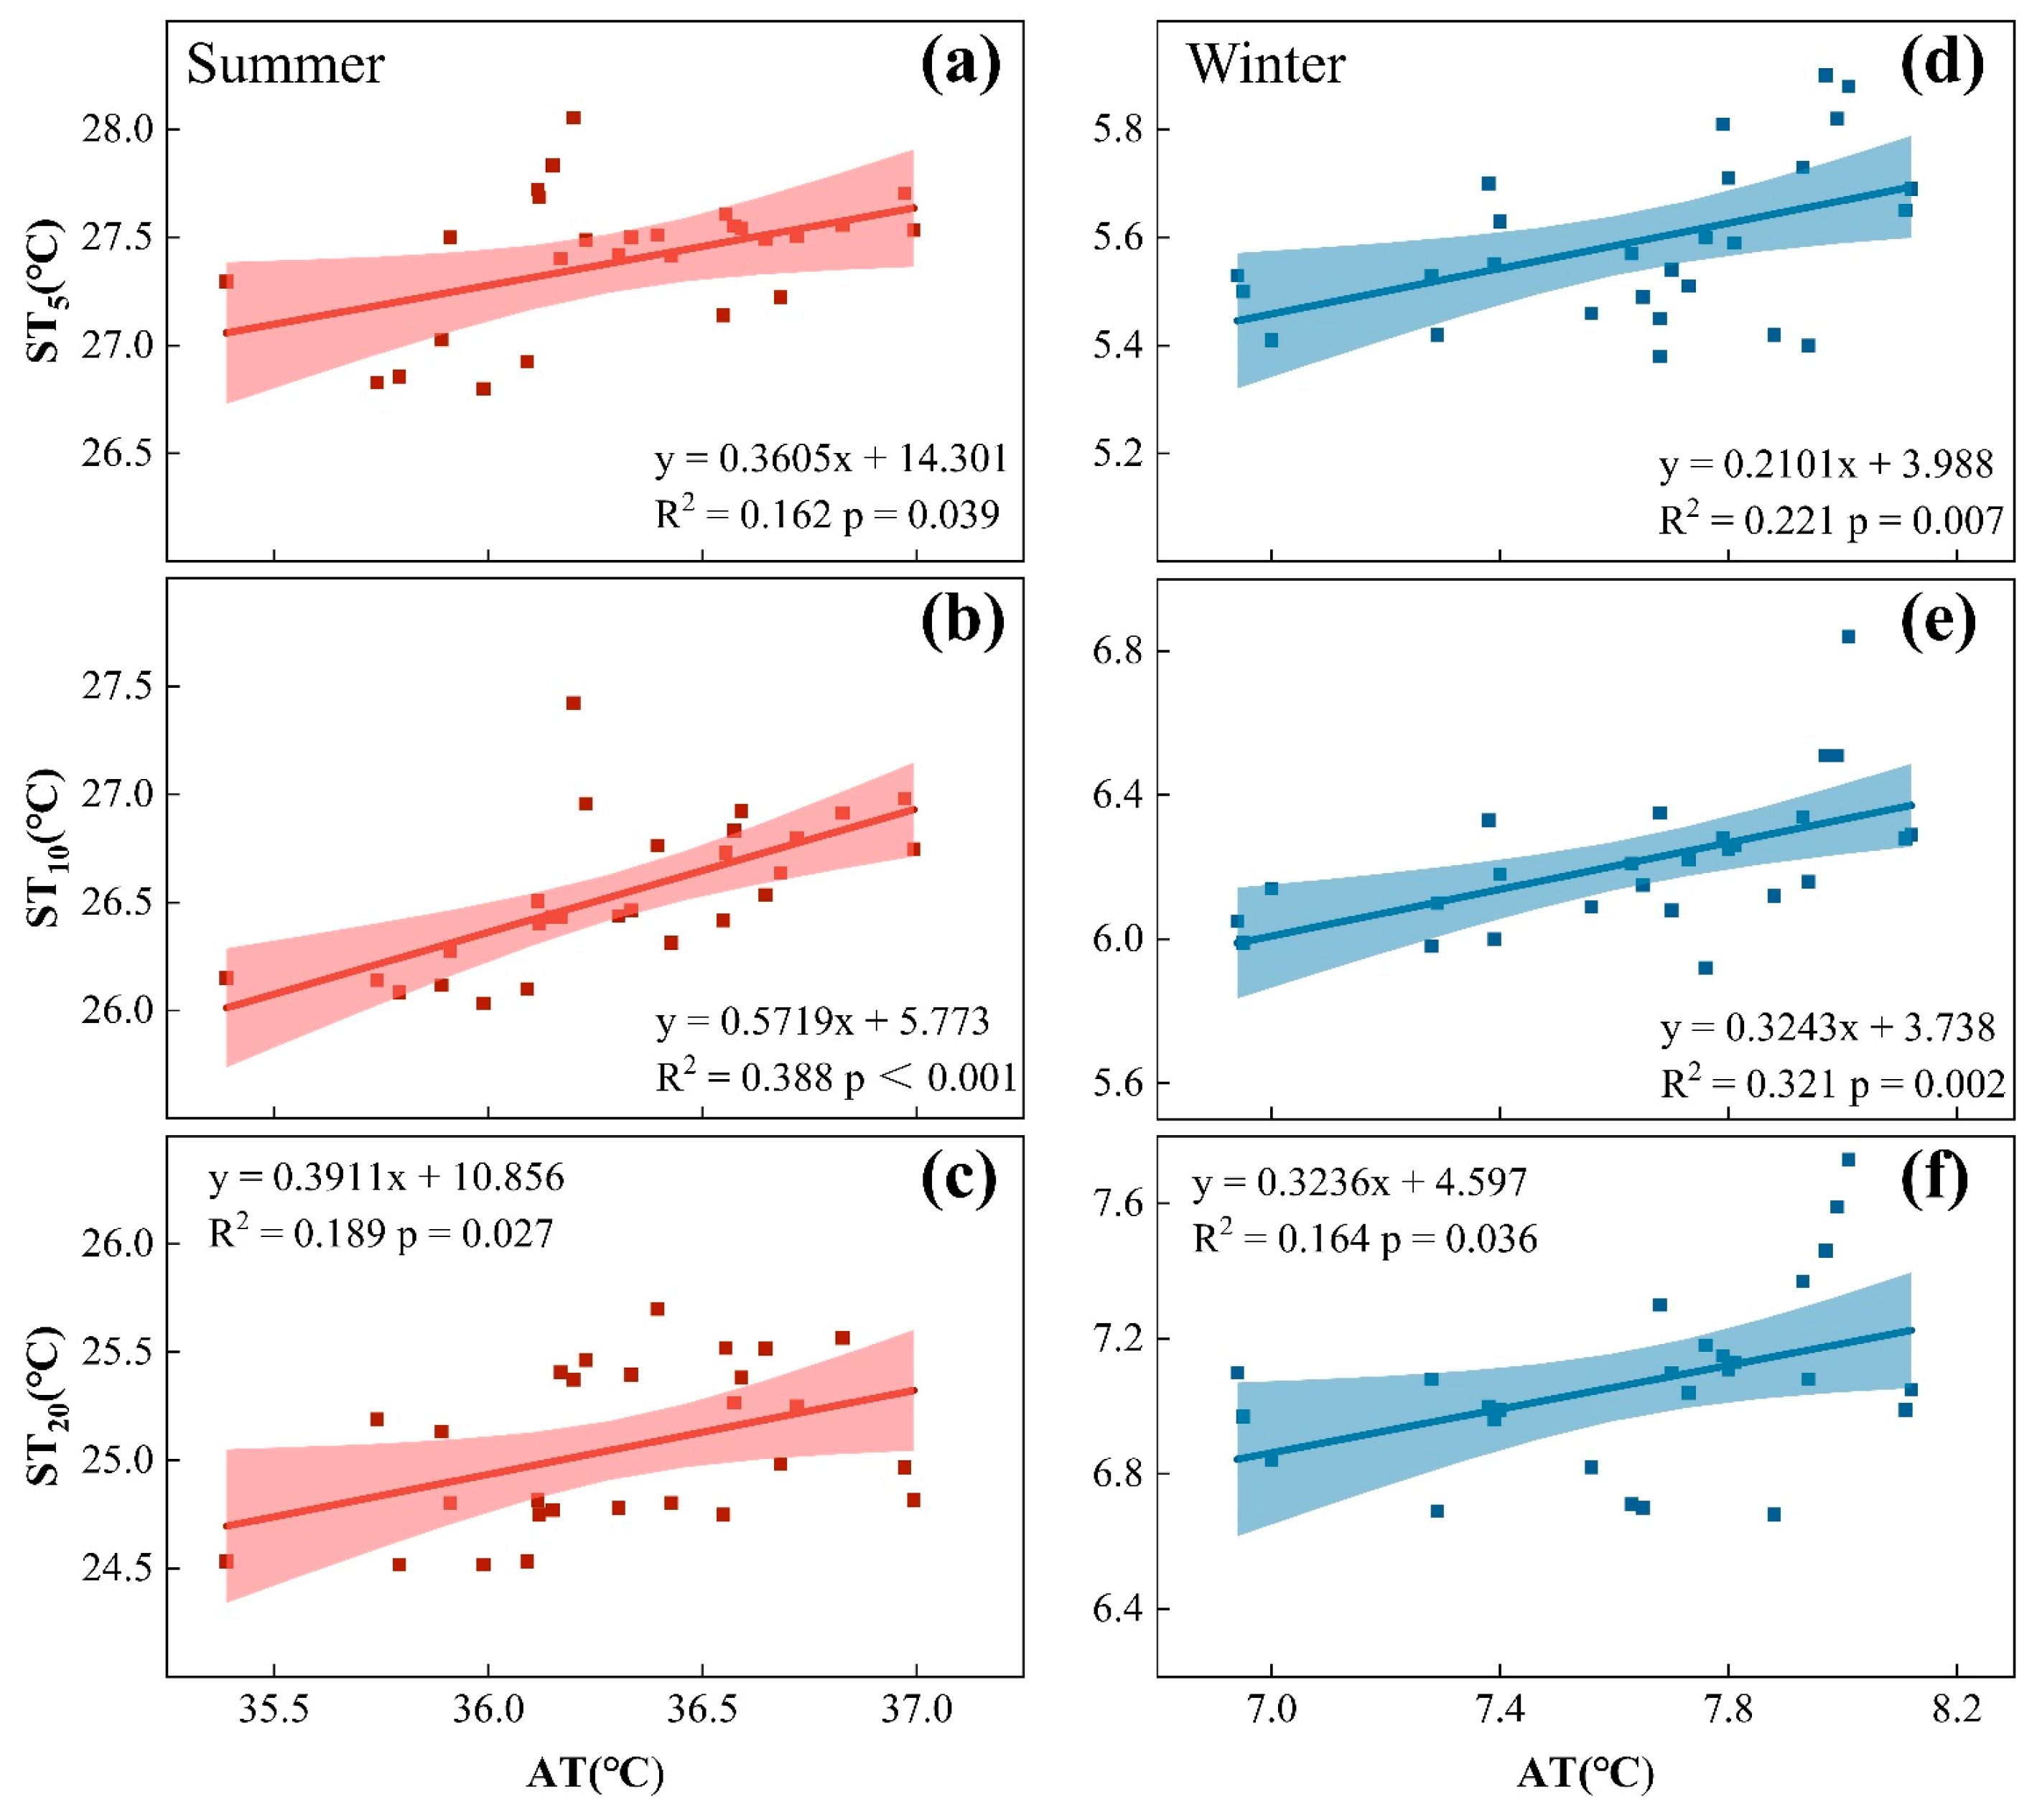
3.3. Influence of Air Temperature on Soil Temperature

The results of the correlation analysis showed that the effect of AT on ST was similar across seasons, as shown in Figure 6 and Figure 7. There is a significant positive correlation between air temperature and soil temperature at different depths. There was also a correlation between ST at different depths of the nine bamboo communities in summer. Both ST at 5 cm depth and ST at 20 cm depth showed a strong positive relationship with ST at 10 cm depth (Figure 6a,c; r1 = 0.403, r2 = 0.435) and a positive relationship between ST at 5 cm depth and ST at 20 cm depth (Figure 6b; r = 0.623).
During the daytime in winter, both ST at 5 cm depth and ST at 20 cm depth had a positive relationship with AT (Figure 7d,f; r1 = 0.470, r2 = 0.405), and there was a significant positive relationship between AT and ST at 10 cm depth (Figure 7e; r = 0.567). There was also a correlation among the STs at different depths of the nine bamboo communities in winter; both ST at 10 cm depth and ST at 20 cm depth showed a strong positive relationship with ST at 5 cm depth (Figure 6) and a significant positive relationship between ST at 10 cm depth and ST at 20 cm depth (Figure 6). The STs at different depths of the nine bamboo communities were significantly correlated with each other in winter.

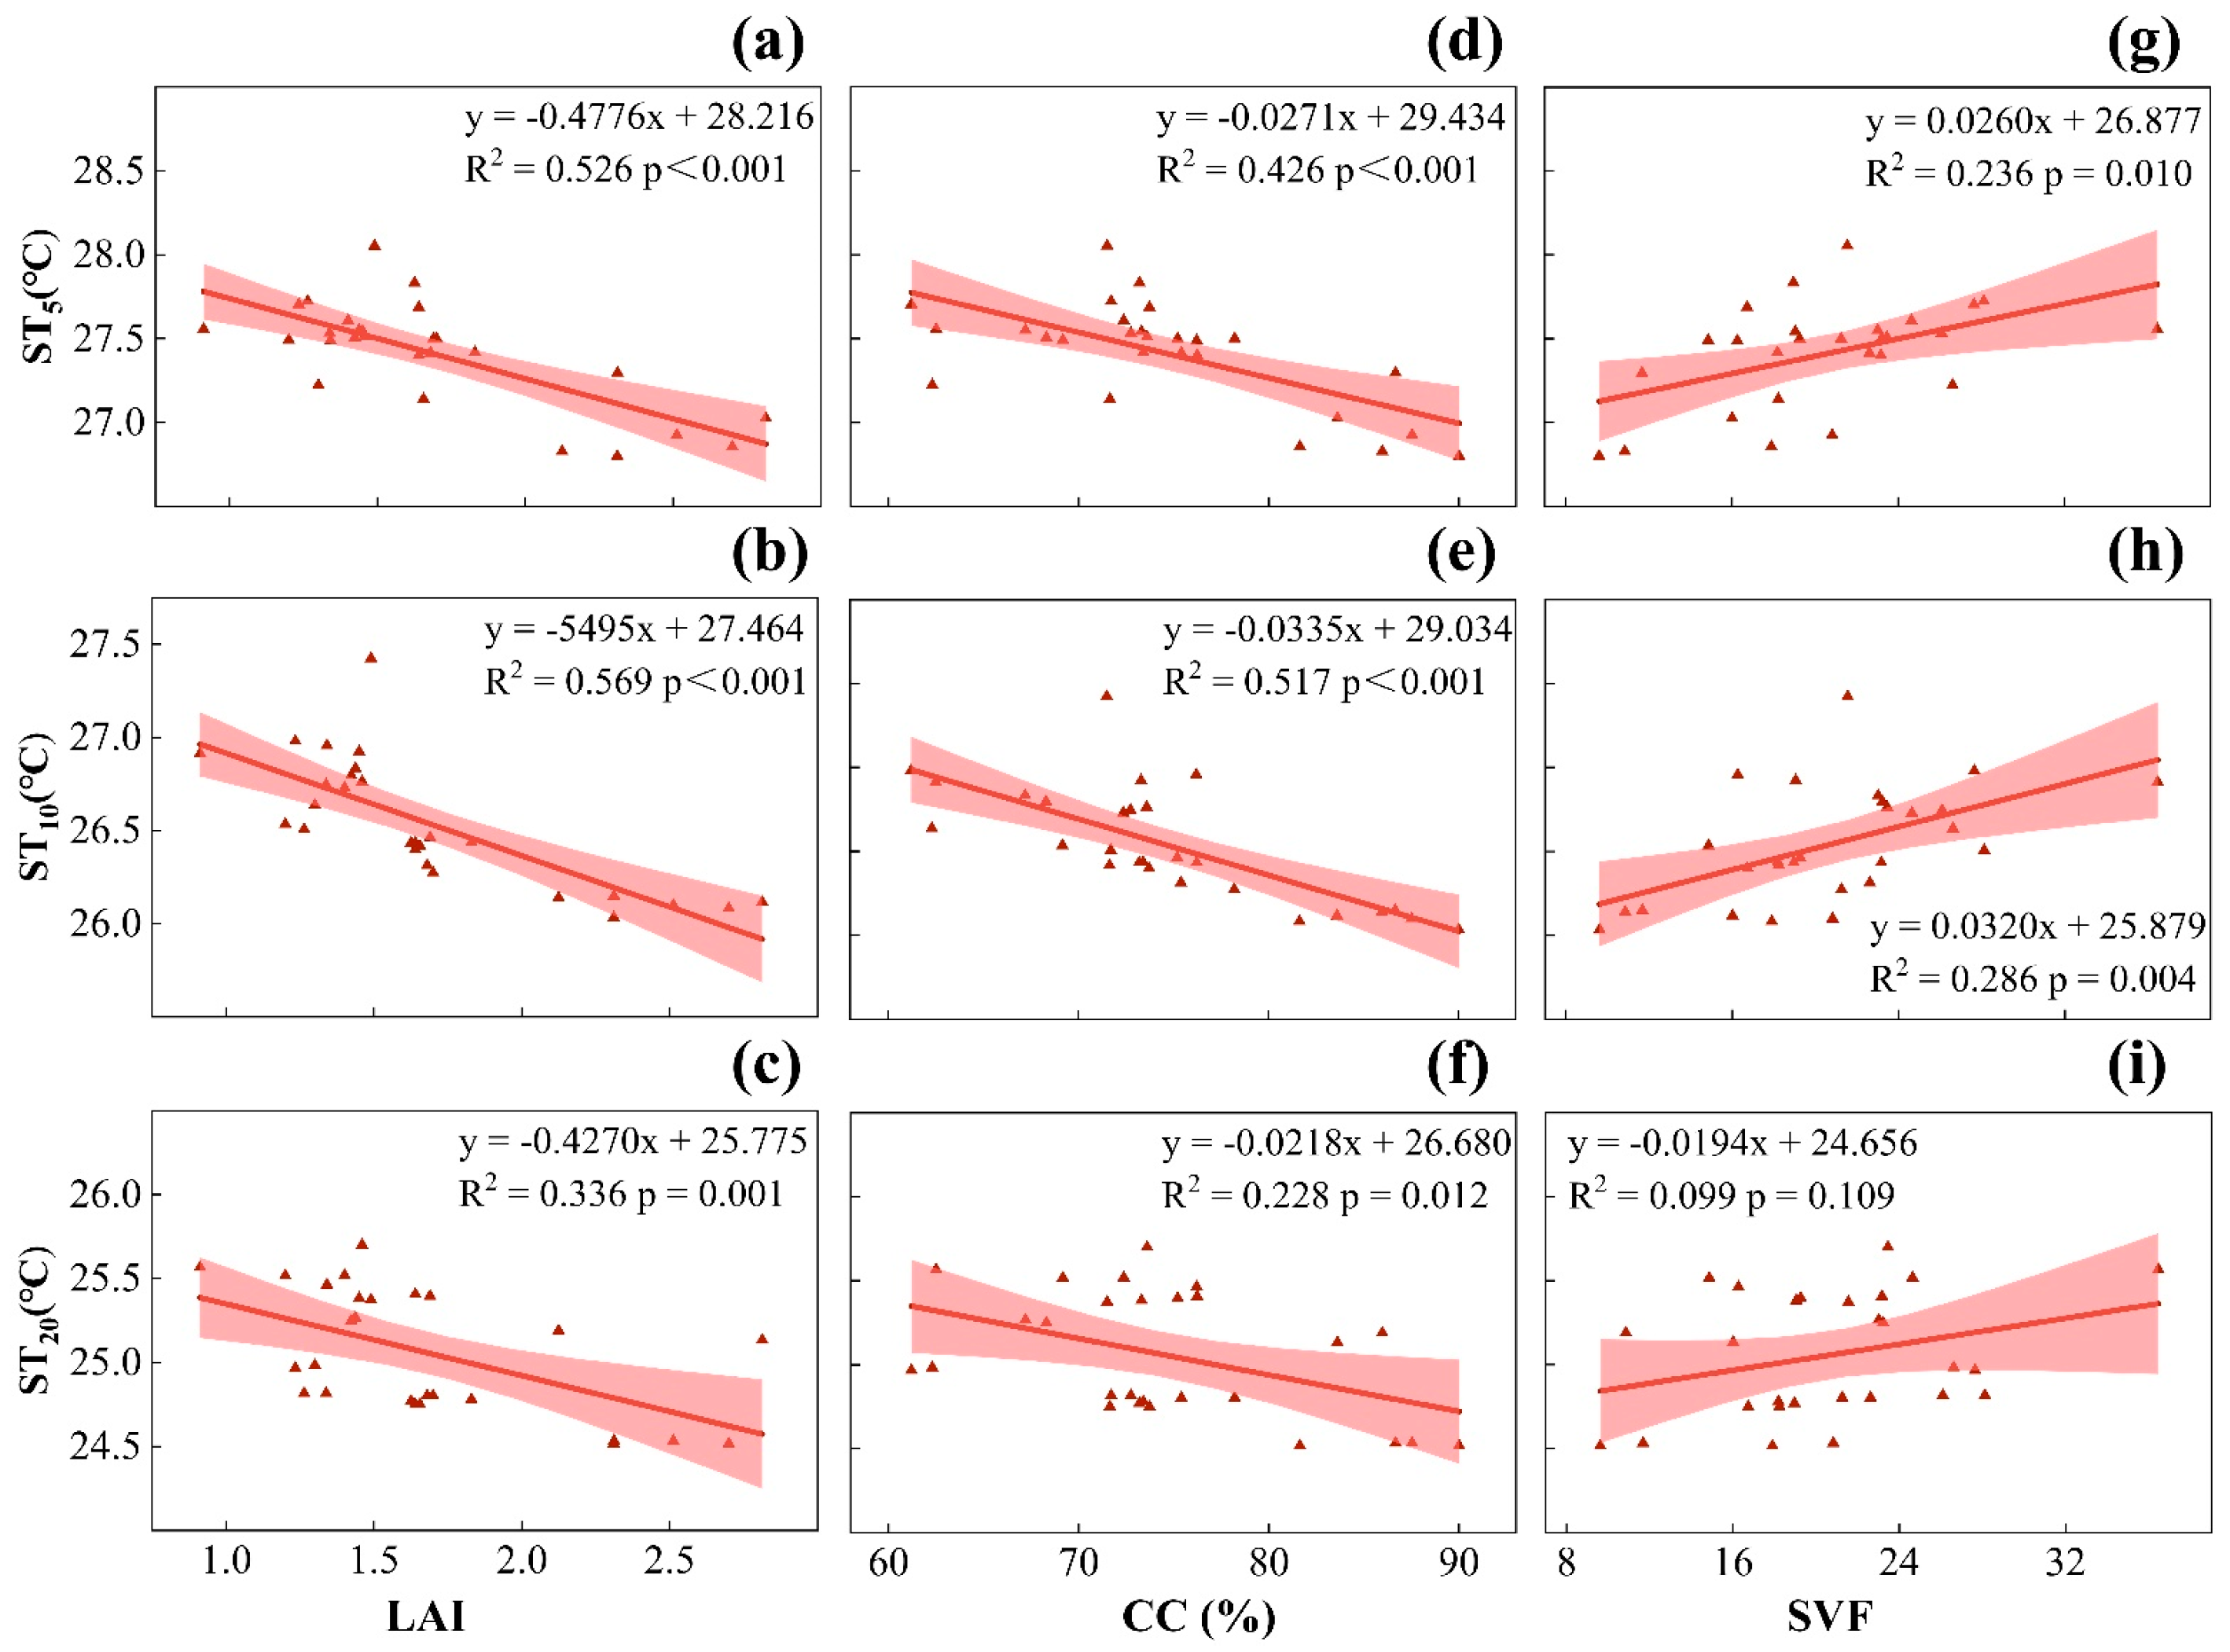
3.4. Influence of Canopy Structural Characteristics on Soil Temperature

As shown in Figure 8 and Figure 9, we utilized Pearson linear regression to explore the relationship between bamboo canopy structure variables and ST at different depths in summer and winter, and to reveal the effects of various canopy structure features on ST at different depths in nine bamboo communities in both seasons. During the summer daytime, the daily average ST at 5 cm depth had a highly significant negative correlation with the LAI (Figure 8a; r = −0.752) and CC (Figure 8d; r = −0.658), while the daily average ST had significant positive correlation with the SVF (Figure 8g; r = 0.486). However, as the depth increased to 10 and 20 cm, they still had significant correlations with LAI and CC, but the correlation gradually decreased. When the soil depth reached 20 cm, the ST no longer had a significant correlation with the SVF (Figure 8i; r = 0.315).
However, during the winter daytime, the daily average ST at 5 cm depth had a highly significant positive correlation with the LAI (Figure 9a; r = 0.770) and CC (Figure 9d; r = 0.666), while the daily average ST had a significant negative correlation with the SVF (Figure 9g; r = −0.507). Similar to summer, the daily average ST at both 10 cm depth and 20 cm depth had a highly significant correlation with the LAI (Figure 9b,c; r1 = 0.786, r2 = 0.541) and CC (Figure 9e,f; r1 = 0.673, r2 = 0.462). For the SVF, when the soil depth was 10 cm, it showed a significant negative correlation (Figure 9h; r = −0.436) but did not have a significant correlation at 20 cm depth (Figure 8i; r = −0.331).

4. Discussion

4.1. Temperature Differences between the Communities

There were spatial differences in AT and ST in plant communities and unshaded lawn. Such findings have also been reported in several previous studies [41,42,43,44,45,46,47]. The results from our study indicated that, compared with the unshaded lawn, nine bamboo communities had a temperature difference in summer and winter. We discovered that during the summer daytime the AT and ST of the bamboo communities were lower than those in the CK, indicating that the bamboo communities have a marked cooling effect in summer. Compared with that in the CK, the average decrease in AT in the bamboo communities was 2.0 °C, the average decrease in ST at a depth of 5 cm was 3.3 °C, the average decrease in ST at a depth of 10 cm was 3.0 °C, and the average decrease in ST at a depth of 20 cm was 2.6 °C. This result is consistent with some previous studies, for example, in Minnesota, [32] Peters reported that non-bamboo communities can reduce the AT and ST across the growing season. In Beijing, Qin et al. discovered that Populus tomentosa communities can reduce the AT and have a significant cooling effect on calm sunny summer days [48]. During the winter daytime, the AT and ST of the bamboo communities were higher than those in the CK, indicating that the bamboo communities have a thermal insulation effect in winter, but the difference is very small. However, the temperature difference in summer is much higher than that in winter. This finding indicates that the cooling effect of the plant canopy on the soil in summer is stronger than the insulating effect of the plant canopy on the soil in winter. This difference may be attributed to the notion that soil heat is initially derived mainly from solar radiation and is usually transferred from the surface to the deeper layers. The temperature difference between the bamboo communities and the CK in summer was mainly influenced by AT and soil moisture, while in winter it was mainly influenced by AT due to lower soil moisture. Previous studies have shown similar findings; for example, Xiao found that biological soil crusts (BSCs) can decrease ST by up to 11.8 °C, 7.5 °C, 5.4 °C, and 3.2 °C at the surface, 5 cm, 15 cm, and 30 cm, respectively, under hot and humid summer conditions and increase ST by up to 1.2 °C, 1.2 °C, and 1.1 °C at 5 cm, 15 cm, and 30 cm, respectively, under cold and dry winter conditions [49]. In addition, the stronger solar radiation intensity in summer than in winter may also explain the difference. Furthermore, we also discovered that the STs between the different bamboo communities were different, which may be attributed to the different canopy structures of the bamboo communities. Many studies in different plant communities support these findings [31,32,50]. In the nine bamboo communities in this study, slowing soil respiration by lowering soil temperature was most effective in summer for Sinobambusa tootsik var. laeta (ST) and in winter for Phyllostachys nigra (PN) and Phyllostachys heterocycla ‘Pubescens’ (PH).

4.2. Effects of the Air Temperature on the Soil Temperature

We discovered that there was a significant relationship between AT and ST in summer and winter. The R2 values were 0.162, 0.388, and 0.189 at depths of 5 cm, 10 cm, and 20 cm, respectively, in summer and 0.221, 0.321, and 0.164, respectively, in winter. AT correlates well with ST, as both are determined by the energy balance at the ground surface [28,50,51,52]. Some scholars have also reported that ST and AT have a strong correlation and have established linear regression models that can calculate ST via AT [28,53,54,55,56]. In the present study, there was also a correlation between ST at different depths in the nine bamboo communities in summer and winter. We found that compared with the influence of AT on ST, there was a more obvious correlation between ST at different depths of the soil surface.

4.3. Effects of Canopy Structural Characteristics on Soil Temperature

Owing to the different structures of the bamboo community canopy, the ST of different bamboo communities showed different changes. During the summer daytime, the structure of the bamboo community canopy has a significant influence on the cooling effect. In the three canopy structure indices of this study, the LAI and CC were significantly correlated with the cooling intensity, indicating that these indices were the main factors affecting the cooling effect of the urban environment. The canopy impedes solar radiation and produces shade, while the plants can alter the temperature of the air under the crowns via evapotranspiration (plant transpiration and soil evaporation). Evapotranspiration increases the air humidity and is caused by the conversion of radiant energy to latent heat energy, reducing sensible heat and thereby reducing the AT [57], ultimately reducing the ST [28]. With respect to these indices, the adjustment of the LAI is the most important. The ST variables showed strong responses to changes in the LAI during the daytime in the summer. For every unit increase in LAI, the ST at 5 cm depth decreased by 0.48 °C, the ST at 10 cm depth decreased by 0.55 °C, and the ST at 20 cm depth decreased by 0.43 °C. The results of this study are the same as those of previous studies. For example, Peters reported that for every unit increase in LAI, the ST at 10 cm depth decreased by 3.1 °C at evergreen-dominated sites and by 1.2 °C at deciduous-dominated sites [32]. The ST decreases with the increase in LAI, as the canopy has a good cooling effect on the soil. In addition, we found that CC was also a good predictor of ST. AT is most affected by direct beams of solar radiation penetrating a canopy at a given moment in time; this phenomenon is mostly dependent on the extent and distribution of the canopy [32]. As a result, over the range of CC from 0 to 100%, the ST was reduced by 2.71 °C (at 5 cm soil depth), 3.34 °C (at 10 cm depth), and 2.18 °C (at 20 cm depth). In contrast, compared with LAI and CC, the SVF was not a good predictor of deep ST.
In winter, compared with summer, the transpiration and evapotranspiration of solar radiation heat through vegetation are greatly reduced, and the structure of the bamboo community canopy has a significant influence on the insulation effect. With respect to these indices, the adjustment of the LAI was the most important. The ST variables showed strong responses to changes in the LAI during the daytime in winter. For every unit increase in LAI, the ST at 5 cm depth increased by 0.24 °C, the ST at 10 cm depth increased by 0.32 °C, and the ST at 20 cm depth increased by 0.30 °C. Over the range of CC from 0 to 100%, the ST increased by 1.33 °C (at 5 cm soil depth), 1.73 °C (at 10 cm depth), and 1.64 °C (at 20 cm depth). The SVF was also not a good predictor of ST at 20 cm depth in winter. Under cold and dry winter conditions, elevated STs in the canopy of bamboo communities may be due to the following: Since the heat flow in winter is mainly from the deeper warmer layer to the surface colder layer, the covering effect of the bamboo canopy can prevent the heat from flowing out of the soil to a certain extent [58,59]. During the period of strong solar radiation in the daytime, the temperature may be lower than that of the lawn control group due to the reduction in heat sources caused by the interception of solar radiation by the bamboo canopy structure. This conclusion is consistent with the results from Xiao et al., who reported that by comparing sites without biological soil crusts, the daily mean ST in sites with biological soil crusts increased up to 2.3 °C. It is possible to equate the biological soil crusts here with the bamboo canopy in our study [49], but due to the difference in their distance from the soil layer with more or less differences in the extent of influences.
In conclusion, this result may be because bamboo is an evergreen plant, and the canopy structure will not change significantly in winter and summer, but the evaporation of soil water would be weakened due to the significant reduction in winter temperature [60]. The cooling effect in the daytime was less than the heat preservation effect of the plant canopy on soil in winter.

4.4. Relationship between Canopy Structure, Soil Temperature and Carbon Storage

The effect of bamboo canopy structure on ST can have important implications for the carbon cycle. When the ST is between 0 and 40 °C, the soil respiration rate increases exponentially with the increase in temperature [61]; in turn, soil respiration leads to carbon emissions, which are affected by ST, showing that urban soil carbon emissions are affected by plant canopy structure. The results of this study show that the canopy structure of bamboo has a good cooling effect on ST in summer, and although the canopy structure of bamboo has a certain thermal insulation effect on ST in winter, the temperature growth range was small (ST at a depth of 5 cm increased 0–0.5 °C; ST at a depth of 10 cm increased 0.1–0.6 °C; ST at a depth of 20 cm increased 0.2–0.7 °C). From an overall perspective, the carbon sequestration of the soil under the bamboo community was more significant in one year [62,63]. These phenomena effectively maintain soil carbon storage capacity, which is beneficial for maintaining global climate change; in particular, reducing the concentration of atmospheric CO2 has important significance [64,65]. The results indicate that with respect to the green infrastructure of the whole city, we should strengthen the use of bamboo.

5. Conclusions

Comparison of ST (recording depths of 5 cm, 10 cm and 20 cm) and AT in different bamboo communities in Hangzhou Bamboo Culture Park and the influence of canopy structure characteristics on ST in the nine bamboo communities in summer and winter were investigated by field measurements. During the summer daytime, compared with those in the CK, the differences in daily average AT and ST in the bamboo communities were significant during summer and winter. The ST at a depth of 5 cm was reduced by 3.0–3.8 °C, and the average ST was 3.3 °C. The ST at a depth of 10 cm decreased by 2.5–3.4 °C, and the average ST was 3.0 °C. Furthermore, the ST decreased by 2.2–3.0 °C at 20 cm depth, and the average ST was 2.6 °C. For winter, compared with those in the CK, the ST at a depth of 5 cm was increased by 0–0.4 °C, and the average ST was 0.2 °C. The ST at a depth of 10 cm increased by 0.1–0.6 °C, and the average ST was 0.3 °C. Furthermore, the ST increased by 0.2–0.7 °C at 20 cm depth, and the average ST value was 0.3 °C. The cooling effect of the bamboo canopy structure in summer was much greater than that in winter. The ST difference responded differently to the variation in different canopy structural characteristics of bamboo communities. Furthermore, the relative contribution of different canopy structural characteristics, when they acted concurrently, explained the variation in ST by season. The LAI and CC had a great influence in each situation. The SVF has some reference significance in predicting shallow ST (at depths of 5 cm and 10 cm).
This paper focuses on the ST change in bamboo communities and its correlation with the LAI, CC, and SVF in summer and winter. According to the results of this study, Sinobambusa tootsik var. laeta (ST) has the strongest cooling capacity in summer but the weakest thermal insulation capacity in winter. In contrast, Phyllostachys nigra (PN) and Phyllostachys heterocycla ‘Pubescens’ (PH) have insignificant cooling capacity in summer but stronger thermal insulation capacity in winter. These findings provide a scientific basis for the selection of plant species for plant landscape design and ensure that the ST of urban green spaces generally exhibits low values. According to the correlations between canopy structure parameters and the ST of bamboo communities, the ST and temperature reduction effects of bamboo communities can be evaluated by the determination of canopy structure parameters.
Although our research was conducted in summer and winter, there was no comparison between spring and autumn. Additionally, some other types of bamboo have not been studied in this paper and can be expanded in subsequent research, such as ground cover types. In addition to LAI, CC, and SVF, other factors can be further explored. Future research may include comprehensive research on the soil surface temperature, which is the most direct variable affected by the plant canopy structure, and the thermal comfort of human body under the bamboo community can be explored.

Author Contributions

Conceptualization, T.M., X.N., R.W., H.Y., N.W., J.S. and Z.B.; methodology, T.M., X.N. and R.W.; investigation, X.N., N.W. and J.S.; software, T.M. and X.N.; resources, T.M., X.N. and R.W.; writing—original draft preparation, T.M.; writing—review and editing, T.M., X.N. and Z.B.; visualization, T.M., N.W. and J.S. All authors have read and agreed to the published version of the manuscript.

Funding

This research was funded by Humanities and Social Sciences General Research Program of the Ministry of Education, grant number 21YJC770026.

Institutional Review Board Statement

Not applicable.

Informed Consent Statement

Not applicable.

Data Availability Statement

Not applicable.

Acknowledgments

The authors sincerely thank the staff of the Hangzhou Bamboo Culture Park for their assistance and for providing the study area for this research. In addition, the authors acknowledge the assistance of Ye Shu, Chenwei Zhang, Qiaoliang Wang, Shimin Yang, Chunbing Song, Zhihao Lin, Xiaohui Guo, Shengmeng Huang, Xingda Yao, Jie Yao, and Xinru Wang during the field measurement processes.

Conflicts of Interest

The authors declare no conflict of interest.

References

  1. Pand, D.N. Global climate change and carbon management in multifunctional forests. J. Econ. Sci. Assocjes. 2002, 83, 593–602. [Google Scholar]
  2. Yadvinder, M.; Patrick, M.; Sandra, B. Forests, carbon and global climate. Phil. Trans. R. Soc. Lond. 2002, 360, 1567–1591. [Google Scholar]
  3. Lianhua, Z.; Zhongting, W.; Wei, Z.; Xiaoyu, Y.; Shaohua, Z.; Qing, L. GOSAT Mapping of Global Greenhouse Gas in 2020 and 2021. Atmosphere 2022, 13, 1814. [Google Scholar]
  4. Houghton, E. Climate Change 1995: The Science of Climate Change: Contribution of Working Group I to the Second Assessment Report of the Intergovernmental Panel on Climate Change; Cambridge University Press: Cambridge, UK, 1996. [Google Scholar]
  5. Houghton, E. Climate Change 2007: Impacts, Adaptation and Vulnerability; Cambridge University Press: Cambridge, UK, 1996. [Google Scholar]
  6. Laurens, M.B. Have Disaster Losses Increased Due to Anthropogenic Climate Change? B Am. Meteorol. Soc. 2011, 92, 39–46. [Google Scholar]
  7. McCarty, J.P. Ecological Consequences of Recent Climate Change. Conserv. Biol. 2001, 15, 320–331. [Google Scholar] [CrossRef]
  8. Helen, F.D.; Nicholas, R.M. Ecological consequences of global climate change for freshwater ecosystems in South Africa. S. Afr. J. Sci. 2014, 110, 1–11. [Google Scholar]
  9. Zhu, Z.; Mirong, S. Impacts of Observed Extreme Antarctic Sea Ice Conditions on the Southern Hemisphere Atmosphere. Atmosphere 2023, 14, 36. [Google Scholar] [CrossRef]
  10. Shope, R. Global Climate Change and Infectious Diseases. Environ. Health Perspect. 1991, 96, 171–174. [Google Scholar] [CrossRef]
  11. Lawrence, A.P.; Marleen, W. Global climate change and mental health. Curr. Opin. Psychol. 2020, 32, 12–16. [Google Scholar]
  12. Scharlemann, J.P.W.; Tanner, E.V.J.; Hiederer, R.; Kapos, V. Global soil carbon: Understanding and managing the largest terrestrial carbon pool. Carbon Manag. 2014, 5, 81–91. [Google Scholar] [CrossRef]
  13. Lal, R. Soil carbon management and climate change. Carbon Manag. 2014, 4, 439–462. [Google Scholar] [CrossRef]
  14. Susan, E.T.; Oliver, A.C.; Ronald, A. Rapid Exchange Between Soil Carbon and Atmospheric Carbon Dioxide Driven by Temperature Change. Science 1996, 272, 393–396. [Google Scholar]
  15. Jenkinson, D.S.; Adams, D.E.; Wild, A. Model estimates of CO2 emissions from soil in response to global warming. Nature 1991, 351, 304–306. [Google Scholar] [CrossRef]
  16. James, W.; Raich, C.S.P. Global patterns of carbon dioxide emissions from soil. Glob. Biogeochem. Cycles 1995, 9, 23–36. [Google Scholar]
  17. Kang, S.; Doh, S.; Lee, D.; Lee, D.; Jin, V.L.; Kimball, J.S. Topographic and climatic controls on soil respiration in six temperate mixed-hardwood forest slopes, Korea. Glob. Chang. Biol. 2003, 9, 1427–1437. [Google Scholar] [CrossRef] [Green Version]
  18. Paul, G.; Sven, J. Temperature and substrate controls on intra-annual variation in ecosystem respiration in two subarctic vegetation types. Glob. Chang. Biol. 2005, 11, 465–475. [Google Scholar]
  19. David, G.G.; Andrew, B.T.; Tim, J.G.; Alan, G.B.; Rachhpal, S.J.; Zoran, N. Interpreting the dependence of soil respiration on soil temperature and water content in a boreal aspen stand. Agric. For. Meteorol. 2006, 140, 220–235. [Google Scholar]
  20. Jia, B.; Zhou, G.; Wang, Y.; Wang, F.; Wang, X. Effects of temperature and soil water-content on soil respiration of grazed and ungrazed Leymus chinensis steppes, Inner Mongolia. J. Arid Environ. 2006, 67, 60–76. [Google Scholar] [CrossRef]
  21. Yohannes, Y.; Shibistova, O.; Abate, A.; Fetene, M.; Guggenberger, G. Soil CO2 efflux in an Afromontane forest of Ethiopia as driven by seasonality and tree species. For. Ecol. Manag. 2011, 261, 1090–1098. [Google Scholar] [CrossRef]
  22. Canan, S.; Ozan, O. The Relationship between Soil Moisture and Temperature Vegetation on Kirklareli City Luleburgaz District A Natural Pasture Vegetation. Int. J. Environ. Agric. Res. 2017, 3, 21–29. [Google Scholar]
  23. Hasfurther, V.; Burman, R.D.; Nunn, J. A Model for Predicting Soil Temperature from Air Temperature; Natural Resource Ecology Laboratory, Colorado State University: Colorado, CO, USA, 1972. [Google Scholar]
  24. Hinkel, K.M.; Paetzold, F.; Nelson, F.E.; Bockheim, J.G. Patterns of soil temperature and moisture in the active layer and upper permafrost at Barrow, Alaska: 1993–1999. Glob. Planet. Chang. 2001, 29, 293–309. [Google Scholar] [CrossRef]
  25. Mihalakakou, G. On estimating soil surface temperature profiles. Energ. Build. 2002, 34, 251–259. [Google Scholar] [CrossRef]
  26. Paul, K.I.; Polglase, P.J.; Smethurst, P.J.; O’Connell, A.M.; Carlyle, C.J.; Khanna, P.K. Soil temperature under forests: A simple model for predicting soil temperature under a range of forest types. Agric. For. Meteorol. 2004, 121, 167–182. [Google Scholar] [CrossRef]
  27. Wigneron, J.P.; Chanzy, A.; de Rosnay, P.; Rudiger, C.; Calvet, J.C. Estimating the Effective Soil Temperature at L-Band as a Function of Soil Properties. IEEE T Geosci. Remote 2008, 46, 797–807. [Google Scholar] [CrossRef]
  28. Daolan, Z.; Raymond, H.J.E.; Steven, W.R. A daily soil temperature model based on air temperature and precipitation for continental applications. Clim. Res. 1993, 2, 183–191. [Google Scholar]
  29. Kang, S.; Kim, S.; Oh, S.; Lee, D. Predicting spatial and temporal patterns of soil temperature based on topography, surface cover and air temperature. For. Ecol. Manag. 2000, 136, 173–184. [Google Scholar] [CrossRef]
  30. Hashimoto, S.; Suzuki, M. The impact of forest clear-cutting on soil temperature: A comparison between before and after cutting, and between clear-cut and control sites. J. For. Res. 2017, 9, 125–132. [Google Scholar] [CrossRef]
  31. Junjun, N.; Yifeng, C.; Qinhua, W.; Charles, W.W.N.; Ankit, G. Effects of vegetation on soil temperature and water content: Field monitoring and numerical modelling. J. Hydrol. 2019, 571, 494–502. [Google Scholar]
  32. Peters, E.B.; McFadden, J.P. Influence of seasonality and vegetation type on suburban microclimates. Urban Ecosyst. 2010, 13, 443–460. [Google Scholar] [CrossRef] [Green Version]
  33. Jiang, Z.; Fei, B.; Chen, X. Bamboo and Rattan in the World; China Forestry Publishing House: Beijing, China, 2007. [Google Scholar]
  34. Vorontsova, M.S.; Clark, L.G.; Dransfield, J.; Govaerts, R.; Baker, W.J. World Checklist of Bamboos and Rattans: In Celebration of INBAR’s 20th Anniversary; International Centre for Bamboo and Rattan: Beijing, China, 2016. [Google Scholar]
  35. Ohrnberger, D. The Bamboos of the World: Annotated Nomenclature and Literature of the Species and the Higher and Lower Taxa; Elsevier: Amsterdam, The Netherlands; Beijing, China, 1999. [Google Scholar]
  36. Benzhi, Z.; Maoyi, F.; Jinzhong, X.; Xiaosheng, Y.; Zhengcai, L. Ecological functions of bamboo forest: Research and Application. J. For. Res. 2005, 16, 143–147. [Google Scholar] [CrossRef]
  37. Effendi, T.B.; Asep, D.; Gustian, R.P. Multi-culm bamboo composites as sustainable materials for green constructions: Section properties and column behavior. Results Eng. 2023, 17, 100911. [Google Scholar]
  38. Effendi, T.B.; Naresworo, N.; Lina, K.; Surjono, S. Human Comfort Period Outside and Inside Bamboo Stands. Int. J. Environ. Sci. Technol. 2014, 7, 245–265. [Google Scholar]
  39. Peel, M.C.; Finlayson, B.L.; McMahon, T.A. Updated world map of the Köppen-Geiger climate classification. Hydrol. Earth Syst. Sci. 2007, 11, 1633–1644. [Google Scholar] [CrossRef] [Green Version]
  40. National Earth System Science Data Center, National Science & Technology Infrastructure of China. Available online: http://www.geodata.cn (accessed on 14 February 2023).
  41. Oliveira, S.; Andrade, H.; Vaz, T. The cooling effect of green spaces as a contribution to the mitigation of urban heat: A case study in Lisbon. Build. Environ. 2011, 46, 2186–2194. [Google Scholar] [CrossRef]
  42. Yan, H.; Hao, P.Y.; Dong, L. Study on the Diurnal Change of Microclimate and Human Comfort in Five Types of Land Covers. In Proceedings of the III International Conference on Landscape and Urban Horticulture, Beijing, China, 25 June 2013; Volume 999, pp. 193–197. [Google Scholar]
  43. Yan, H.; Wang, X.; Hao, P.; Dong, L. Study on the microclimatic characteristics and human comfort of park plant communities in summer. Procedia Environ. Sci. 2012, 13, 755–765. [Google Scholar] [CrossRef] [Green Version]
  44. Zhanga, Z.; Yingmin, L.; Huitang, P. Cooling and humidifying effect of plant communities in subtropical urban parks. Urban For. Urban Green. 2013, 12, 323–329. [Google Scholar] [CrossRef]
  45. Skelhorn, C.; Lindley, S.; Levermore, G. The impact of vegetation types on air and surface temperatures in a temperate city: A fine scale assessment in Manchester, UK. Landsc. Urban Plan. 2014, 121, 129–140. [Google Scholar] [CrossRef]
  46. Mohammad, A.R.; Astrid, M.; Thomas, R.; Stephan, P. Microclimatic differences and their influence on transpirational cooling of Tilia cordata in two contrasting street canyons in Munich, Germany. Agric. For. Meteorol. 2017, 232, 443–456. [Google Scholar]
  47. An-Shik, Y.; Yu-Hsuan, J.; Chih-Yung, W.; Chao-Jui, C. Numerical simulation of cooling effect of vegetation enhancement in a subtropical urban park. Appl. Energy 2017, 192, 178–200. [Google Scholar]
  48. Zhong, Q.; Zhandong, L.; Fangyun, C.; Jianfang, C.; Bing, L. Influence of canopy structural characteristics on cooling and humidifying effects of Populus tomentosa community on calm sunny summer days. Landsc. Urban Plan. 2014, 127, 75–82. [Google Scholar]
  49. Bo, X.; Huifang, W.; Jun, F.; Thomas, F.; Maik, V. Biological soil crusts decrease soil temperature in summer and increase soil temperature in winter in semiarid environment. Ecol. Eng. 2013, 58, 52–56. [Google Scholar]
  50. Byrne, L.B.; Bruns, M.A.; Kim, K.C. Ecosystem Properties of Urban Land Covers at the Aboveground–Belowground Interface. Ecosystems 2008, 11, 1065–1077. [Google Scholar] [CrossRef]
  51. Kätterer, T.; Andrén, O. Predicting daily soil temperature profiles in arable soils in cold temperate regions from air temperature and leaf area index. Acta Agric. Scand. Sect. B Soil Plant Sci. 2009, 59, 77–86. [Google Scholar] [CrossRef]
  52. Brian, H.; Ross, C. A weighted coefficient model for estimation of Australian daily soil temperature at depths of 5 cm to 100 cm based on air temperature and rainfall. Soil Res. 2011, 49, 305–314. [Google Scholar]
  53. Bocock, K.L.; Jeffers, J.N.R.; Lindley, D.K.; Adamson, J.K.; Gill, C.A. Estimating woodland soil temperature from air temperature and other climatic variables. J. Agric. Meteorol. 1977, 18, 351–372. [Google Scholar] [CrossRef]
  54. Gehrig-Fasel, J.; Guisan, A.; Zimmermann, N.E. Evaluating thermal treeline indicators based on air and soil temperature using an air-to-soil temperature transfer model. Ecol. Model. 2008, 213, 345–355. [Google Scholar] [CrossRef]
  55. Wu, S.H.; Jansson, P.E.; Kolari, P. The role of air and soil temperature in the seasonality of photosynthesis and transpiration in a boreal Scots pine ecosystem. Agr. For. Meteorol. 2012, 156, 85–103. [Google Scholar] [CrossRef]
  56. Ozgener, O.; Ozgener, L.; Tester, J.W. A practical approach to predict soil temperature variations for geothermal (ground) heat exchangers applications. Int. J. Heat Mass Transf. 2013, 62, 473–480. [Google Scholar] [CrossRef]
  57. Souch, C.A.; Souch, C. The effect of trees on summertime below canopy urban climates: A case study bloomington, Indiana. J. Arboric. 1993, 19, 303–312. [Google Scholar] [CrossRef]
  58. Abu-Hamdeh, N.H.; Reeder, R.C. Soil Thermal Conductivity Effects of Density, Moisture, Salt Concentration, and Organic Matter. Soil Sci. Soc. Am. J. 2000, 64, 1285–1290. [Google Scholar] [CrossRef]
  59. van Donk, S.J.; Tollner, E.W. Measurement and modeling of heat transfer mechanisms in mulch materials. Am. Soc. Agric. Eng. 2000, 43, 919–925. [Google Scholar] [CrossRef]
  60. Liu, P.; Xia, Y.; Shang, M. A bench-scale assessment of the effect of soil temperature on bare soil evaporation in winter. Hydrol. Res. 2020, 51, 1349–1357. [Google Scholar] [CrossRef]
  61. Lloyd, J.; Taylor, J.A. On the Temperature Dependence of Soil Respiration. Funct. Ecol. 1994, 8, 315–323. [Google Scholar] [CrossRef]
  62. Churkina, G. Modeling the carbon cycle of urban systems. Ecol. Model. 2008, 216, 107–113. [Google Scholar] [CrossRef]
  63. Mamde, K.H.; Abdullah, A.M.; Zaharin, A.A.; Ainuddin, A.N. Drivers of Soil Carbon Dioxide Efflux in a 70 years Mixed Trees Species of Tropical Lowland Forest, Peninsular Malaysia. Sains Malays. 2014, 43, 1843–1853. [Google Scholar] [CrossRef]
  64. Song, X.; Zhou, G.; Jiang, H.; Yu, S.; Fu, J.; Li, W.; Wang, W.; Ma, Z.; Peng, C. Carbon sequestration by Chinese bamboo forests and their ecological benefits: Assessment of potential, problems, and future challenges. Environ. Rev. 2011, 19, 418–428. [Google Scholar] [CrossRef] [Green Version]
  65. Zhou, G.; Meng, C.; Jiang, P.; Xu, Q. Review of Carbon Fixation in Bamboo Forests in China. Bot. Rev. 2011, 77, 262–270. [Google Scholar] [CrossRef]
Figure 1. Map of the study area and measurement sites.
Atmosphere 14 00445 g001
Figure 2. The diurnal variation in the AT of the different communities in summer (a) and winter (b).
Atmosphere 14 00445 g002
Figure 3. The average daily AT of the different bamboo communities and the CK in summer (a) and winter (b). The letters above the columns are multiple comparisons between the different communities (Tukey significant difference test; different letters mean significant differences, p < 0.01).
Atmosphere 14 00445 g003
Figure 4. The diurnal variation in the ST of the different communities in summer and winter. Diurnal variation in the ST at 5 cm (a), 10 cm (b), and 20 cm (c) depth in summer; diurnal variation in the ST at 5 cm (d), 10 cm (e), and 20 cm (f) depth in winter.
Atmosphere 14 00445 g004
Figure 5. The daily averages of the different bamboo plant communities and the CK in summer and winter. (a) Daily average ST at a 5 cm depth in summer; (b) Daily average ST at a 10 cm depth in summer; (c) Daily average ST at a 20 cm depth in summer; (d) Daily average ST at a 5 cm depth in winter; (e) Daily average ST at a 10 cm depth in winter; (f) Daily average ST at a 20 cm depth in winter.
Atmosphere 14 00445 g005
Figure 6. The correlation plot between microclimatic factors and the canopy structure of the bamboo communities in summer and winter. * Significant at the 0.05 level (bilateral); ** significant at the 0.01 level (bilateral).
Atmosphere 14 00445 g006
Figure 7. Relationships between summer daytime AT in relation to different depths of ST at 5 cm (a), 10 cm (b), 20 cm (c); relationships between winter daytime AT in relation to different depths of ST at 5 cm (d), 10 cm (e), 20 cm (f).
Atmosphere 14 00445 g007
Figure 8. In summer, relationships between LAI in relation to different depths of ST at 5 cm (a), 10 cm (b), 20 cm (c); relationships between CC in relation to different depths of ST at 5 cm (d), 10 cm (e), 20 cm (f); relationships between SVF in relation to different depths of ST at 5 cm (g), 10 cm (h), 20 cm (i).
Atmosphere 14 00445 g008
Figure 9. In winter, relationships between LAI in relation to different depths of ST at 5 cm (a), 10 cm (b), 20 cm (c); relationships between CC in relation to different depths of ST at 5 cm (d), 10 cm (e), 20 cm (f); relationships between SVF in relation to different depths of ST at 5 cm (g), 10 cm (h), 20 cm (i).
Atmosphere 14 00445 g009
Table 1. Morphological indicators, canopy structure data, and photos of bamboo communities. AH: average height (m); DBH: diameter at breast height (cm); PD: planting density (T·m−2), T: tree; LAI: leaf area index; CC: canopy coverage (%); SVF: sky view factor (%).
Bamboo CommunitiesMorphological IndicatorsCanopy StructureFish-Eye Photos
AHDBHPDLAICCSVF
Atmosphere 14 00445 i001Phyllostachys praecox
‘Prevernalis’ (PP)
4.54.23.51.6074.317.8Atmosphere 14 00445 i002
Atmosphere 14 00445 i003Phyllostachys aureosulcata
‘Spectabilis’ (PAS)
5.32.09.21.3568.220.4Atmosphere 14 00445 i004
Atmosphere 14 00445 i005Phyllostachys nigra (PN)4.71.19.21.1562.030.2Atmosphere 14 00445 i006
Atmosphere 14 00445 i007Sinobambusa tootsikvar.
laeta (ST)
5.01.815.82.6185.114.5Atmosphere 14 00445 i008
Atmosphere 14 00445 i009Indosasa gigantea (IG)7.43.86.81.6776.622.3Atmosphere 14 00445 i010
Atmosphere 14 00445 i011Phyllostachys bambusoidesf.
lacrima-deae (PB)
7.03.06.01.6673.518.1Atmosphere 14 00445 i012
Atmosphere 14 00445 i013Oligostachyum lubricum (OL)3.70.815.21.4772.821.3Atmosphere 14 00445 i014
Atmosphere 14 00445 i015Pseudosasa amabilis (PA)5.01.921.02.3286.714.5Atmosphere 14 00445 i016
Atmosphere 14 00445 i017Phyllostachys heterocycla
‘Pubescens’ (PH)
8.98.32.01.3372.326.3Atmosphere 14 00445 i018
Atmosphere 14 00445 i019Unshaded lawn (CK)///0.4991.076.0/
Table 2. Comparison of AT and ST in the different communities in summer.
TemperaturePPPASPNSTIGPBOLPAPHCK
AT/°CX36.236.636.835.936.236.336.435.736.638.3
α38.839.239.438.238.338.739.038.139.140.9
β12.11.71.52.42.12.01.92.61.7/
γ5.54.44.06.45.75.25.16.84.7/
ST5/°CX27.627.527.526.927.427.427.727.027.630.7
α28.028.128.127.428.028.028.227.528.031.8
β23.13.23.23.83.33.33.03.73.1/
γ10.010.310.312.310.510.59.611.99.9/
ST10/°CX26.626.726.826.126.326.427.026.126.729.5
α27.027.327.226.426.726.827.326.427.030.3
β22.92.82.73.43.23.12.53.42.8/
γ9.79.49.011.510.710.48.311.49.6/
ST20/°CX25.025.325.224.725.025.025.524.825.127.7
α25.125.525.324.825.225.225.824.925.228.2
β22.72.42.53.02.72.72.22.92.6/
γ9.98.69.310.99.910.08.110.89.7/
X: diurnal mean value; α: 14:00 mean value; α: 18:00 mean value; β1: air temperature difference; β2: soil temperature difference; γ: soil temperature changing rate (%). AT: air temperature; ST5: 5 cm depth of soil temperature; ST10: 10 cm depth of soil temperature; ST20: 20 cm depth of soil temperature.
Table 3. Comparison of AT and ST in the different communities in winter.
TemperaturePPPASPNSTIGPBOLPAPHCK
AT/°CX7.77.57.38.07.67.67.78.07.27.5
α4.02.92.93.53.02.73.13.32.42.2
β10.200.20.50.10.10.20.50.3/
γ3.30.6–2.47.21.51.73.37.0–3.8/
ST5/°CX5.55.55.55.85.75.65.55.75.45.4
α4.14.24.04.64.44.34.04.54.03.4
β20.10.10.10.40.30.20.10.30/
γ2.93.12.08.77.05.22.27.21.8/
ST10/°CX6.26.06.16.56.36.26.16.46.25.9
α5.14.74.95.55.25.14.95.35.03.7
β20.30.10.20.60.40.30.20.50.3/
γ1.82.11.71.81.81.91.71.51.5/
ST20/°CX7.07.06.97.47.06.96.97.37.06.7
α5.35.45.05.85.25.14.95.75.64.4
β20.30.30.20.70.30.20.20.60.3/
γ3.44.22.79.93.12.82.48.55.0/
X: diurnal mean value; α: 18:00 mean value; β1: air temperature difference; β2: soil temperature difference; γ: soil temperature changing rate (%). AT: air temperature; ST5: 5 cm depth of soil temperature; ST10: 10 cm depth of soil temperature; ST20: 20 cm depth of soil temperature.
Disclaimer/Publisher’s Note: The statements, opinions and data contained in all publications are solely those of the individual author(s) and contributor(s) and not of MDPI and/or the editor(s). MDPI and/or the editor(s) disclaim responsibility for any injury to people or property resulting from any ideas, methods, instructions or products referred to in the content.

