Article

Comprehensive Analysis of Typhoon Nangka Based on the Satellite Data from the GPM, CloudSat and Himawari-8

College of Meteorology and Oceanography, National University of Defense Technology, Changsha 410073, China
*
Author to whom correspondence should be addressed.
Atmosphere 2023, 14(3), 440; https://doi.org/10.3390/atmos14030440
Submission received: 8 January 2023 / Revised: 20 February 2023 / Accepted: 22 February 2023 / Published: 23 February 2023

Abstract

:
A typhoon or hurricane is one of the most destructive high-impact weather events. In this study, the genesis and development processes of Typhoon Nangka (2015), which occurred over the Western Pacific in 2015, were investigated based on the comprehensive observation data from three satellites, i.e., the Himawari-8 satellite, the CloudSat satellite and the Global Precipitation Measurement mission satellite (GPM), focusing on the characteristics of typhoon structure, precipitation and cloud. The results (Results) show that during the developing stage of Typhoon Nangka, the cloud system was relatively complex and changed significantly, with large raindrops dominating the precipitation around the eyewall in the first quadrant, and the convection in the eyewall and outer rainband burst upward to 17 km. In addition, three features were obvious: stratiform precipitation was dominant in the inner rainband, both the precipitation type (stratiform or convective) and intensity were distributed unevenly in the outer rainband, and large water content was located in the warm layer of clouds. Moreover, the collision growth and breakup of water droplets tended to be stable. The precipitation in the typhoon eyewall, inner rainband and outer rainband was significantly different; stratiform precipitation mainly occurred in the inner rainband, while convective precipitation mainly appeared in the eyewall and outer rainband. The cloud system was distributed asymmetrically, and the upper-layer and lower-layer clouds were closely related, dominated by single-layer clouds. There were deep convective clouds in the eyewall, and cirrus clouds with the broadest range across the eyewall. The coverage range of cirrus clouds was close to the radius of the typhoon. There were stratocumulus, altostratus and cumulus in the low levels.

1. Introduction

A typhoon is one of the most destructive high-impact weather events [1,2]. With global warming, typhoons have become more and more active and abnormal, and the heavy precipitation caused by typhoons has been more severe and widespread. In particular, several cyclones with sudden changes in tracks are more challenging to forecast, causing the great loss of life and property. A range of evidence has shown that the typhoon structure and intensity are closely related to precipitation [3,4,5]. The typhoon cloud systems are complex, and their structural characteristics play a crucial role in the development and evolution of typhoons and the formation of precipitation [6]. Therefore, it is of great significance to study the structural characteristics of high-impact weather systems, namely typhoons, to improve typhoon intensity forecasts [7].
Satellites are revolutionary tools for typhoon observation over the ocean. In particular, the CloudSat satellite was successfully launched in April 2006, which carries a cloud profiling radar (CPR) that can detect cloud and precipitation particles and provide the vertical structures of cloud systems. Yan et al. [8] studied the asymmetry of the vertical cloud structure of a typhoon over the Western Pacific by using CloudSat data. The results showed that the typhoon’s spiral cloud bands had an asymmetric “mushroom” shape, and cloud ice water appeared mainly near the typhoon center. Based on CloudSat data, Han et al. [9] investigated the typhoons on the Eastern Pacific during 2006–2010. They found that all types of clouds varied significantly along the radial and tangential directions, and the effective particle radius and ice water content decreased as the height increased, while the particle number concentration increased. The core part of the Global Precipitation Measurement (GPM) mission was launched in February 2014, which significantly improved the spatio-temporal resolution of global precipitation measurements. The GPM satellite data have been fully utilized in typhoon research. Lyu et al. [10] analyzed the precipitation evolution during the rapid intensification of Typhoon Lekima (2019) by using the Integrated Multi-Satellite Retrievals for GPM (IMERG), and the results suggested that the average precipitation rate and the frequency of short-term heavy precipitation vary in different typhoon development stages. Lu and Wei [11] studied the precipitation distribution, vertical structure and precipitation structure of Typhoon Mujigae (2015) based on the GPM Microwave Imager (GMI) and Dual-Frequency Precipitation Radar (DPR) data. In addition, they proved the reliability of the DPR data through a comparison with ground-based S-band weather radar data [11]. Compared with the above two satellites, the Himawari-8 geostationary satellite has a higher temporal resolution with an observation frequency of approximately 10 min. Yan et al. [12] estimated the short-term heavy precipitation of Typhoon Meranti by using the infrared brightness temperature data from the Himawari-8 satellite and carried out a quality evaluation. The results demonstrated that the precipitation estimated by the Himawari-8 satellite data had an indicative effect on the early warning and forecasting of typhoon-induced precipitation. Although there are many types of satellites, and the obtained satellite products are diverse, few studies have been conducted to investigate the structural and physical characteristics of typhoons by combining these data products. Zhao [6] analyzed the structure and precipitation of Typhoon Meranti with three satellite datasets. The aforementioned three satellites can provide or be used to derive abundant products, such as blackbody temperature, precipitation intensity, cloud types and so on. These products can describe the cloud and precipitation characteristics completely. However, there is a lack of relevant microphysical process analysis in most research. To this end, in this study, we focus on the structure and related microphysical processes of Typhoon Nangka as detected by the satellites.
Super Typhoon Nangka (2015) was mainly located in the Western Pacific during its life cycle and made two short-term landfalls in Japan. Being far from the coast of the ocean, in the main section of its life cycle, the typhoon was isolated from land, so the cloud and precipitation characteristics were not polluted by topography effects. In its decaying stage, the track of the typhoon had approximately 90° turning, and it suddenly moved northward [13], which brought a considerable challenge for forecasting. Due to the relatively low attention, relatively few studies have been conducted on the structural characteristics of Typhoon Nangka. In this research, based on GPM, CloudSat, Himawari-8 and CMORPH satellite data, we systematically studied the precipitation distribution characteristics, the precipitation classification and the three-dimensional distribution characteristics of the cloud system of the high-impact Typhoon Nangka, which will be helpful to deepen our understanding of the structural characteristics during typhoons’ life stages.

2. Data and Methods

2.1. Satellite Data

2.1.1. GPM Satellite Data

The 0.1° × 0.1° precipitation data used in this study were comprehensively obtained from the IMERG, the GPM-DPR data and the GMI data (https://search.earthdata.nasa.gov, accessed on 6 March 2021). The GPM was developed based on the Tropical Rainfall Measuring Mission (TRMM) Satellite, with higher accuracy. The GPM is capable of detecting light rain (<0.5 mm·h−1) and solid precipitation, which are essential components of precipitation at middle and high latitudes [3], and it can provide global precipitation products including rain and snow based on the microwave with a 3-h interval and the infrared band with a half-hour interval. The DPR carried by the GPM provides information about the droplet size distribution and precipitation intensity by using the difference in attenuation between the Ku-band (13.6 GHz) and Ka-band (35.5 GHz) radars in the matched beam band, in order to improve the estimation of the precipitation rate relative to other satellite sensors [14]. The GPM has a vertical sampling resolution of 125 m, a horizontal resolution of approximately 5 km and a maximum amplitude width of 245 km. The GMI has 13 channels, ranging from 10.65 GHz to 183 GHz, and all channels have dual-polarization, except for the channel of 23.80 GHz [15].

2.1.2. Himawari-8 Satellite Data

The 11.2 μm band data from the Himawari-8 satellite product (http://www.eorc.jaxa.jp/ptree/index.html, accessed on 8 June 2021) were used in this study. The Himawari-8 satellite is a geostationary meteorological satellite located near 140.7° E above the equator, launched by the Japan Meteorological Agency in July 2014. Its coverage mainly includes Southeast Asia, East Asia and parts of the Western Pacific. The infrared imager onboard the Himawari-8 satellite has 16 bands, and the central wavelength ranges from 0.47 μm to 13.3 μm. The reliability of Himawari-8 satellite products was verified, indicating that they can be used for meteorological research [16].

2.1.3. Cloudsat Satellite Data

The 2B-CLDCLASS data product from the CloudSat satellite (http://www.cloudsat.cira.colostate.edu, accessed on 27 March 2021).was used in this research. The CloudSat data are the orbiting satellite data from the CloudSat Data Processing Center. This satellite is a polar-orbiting satellite, with an orbital altitude of 705 km. The vertical resolution of the data at each nadir point is 0.5 km, and the satellite has strong penetration ability for clouds [17]. The 2B-CLDCLASS data are a cloud classification product (eight categories in total), considering the primary factors such as cloud phase and water vapor density. Thus, the CloudSat data can be used to study the characteristics of cloud systems [18].

3. Results

3.1. Overview of Typhoon Nangka

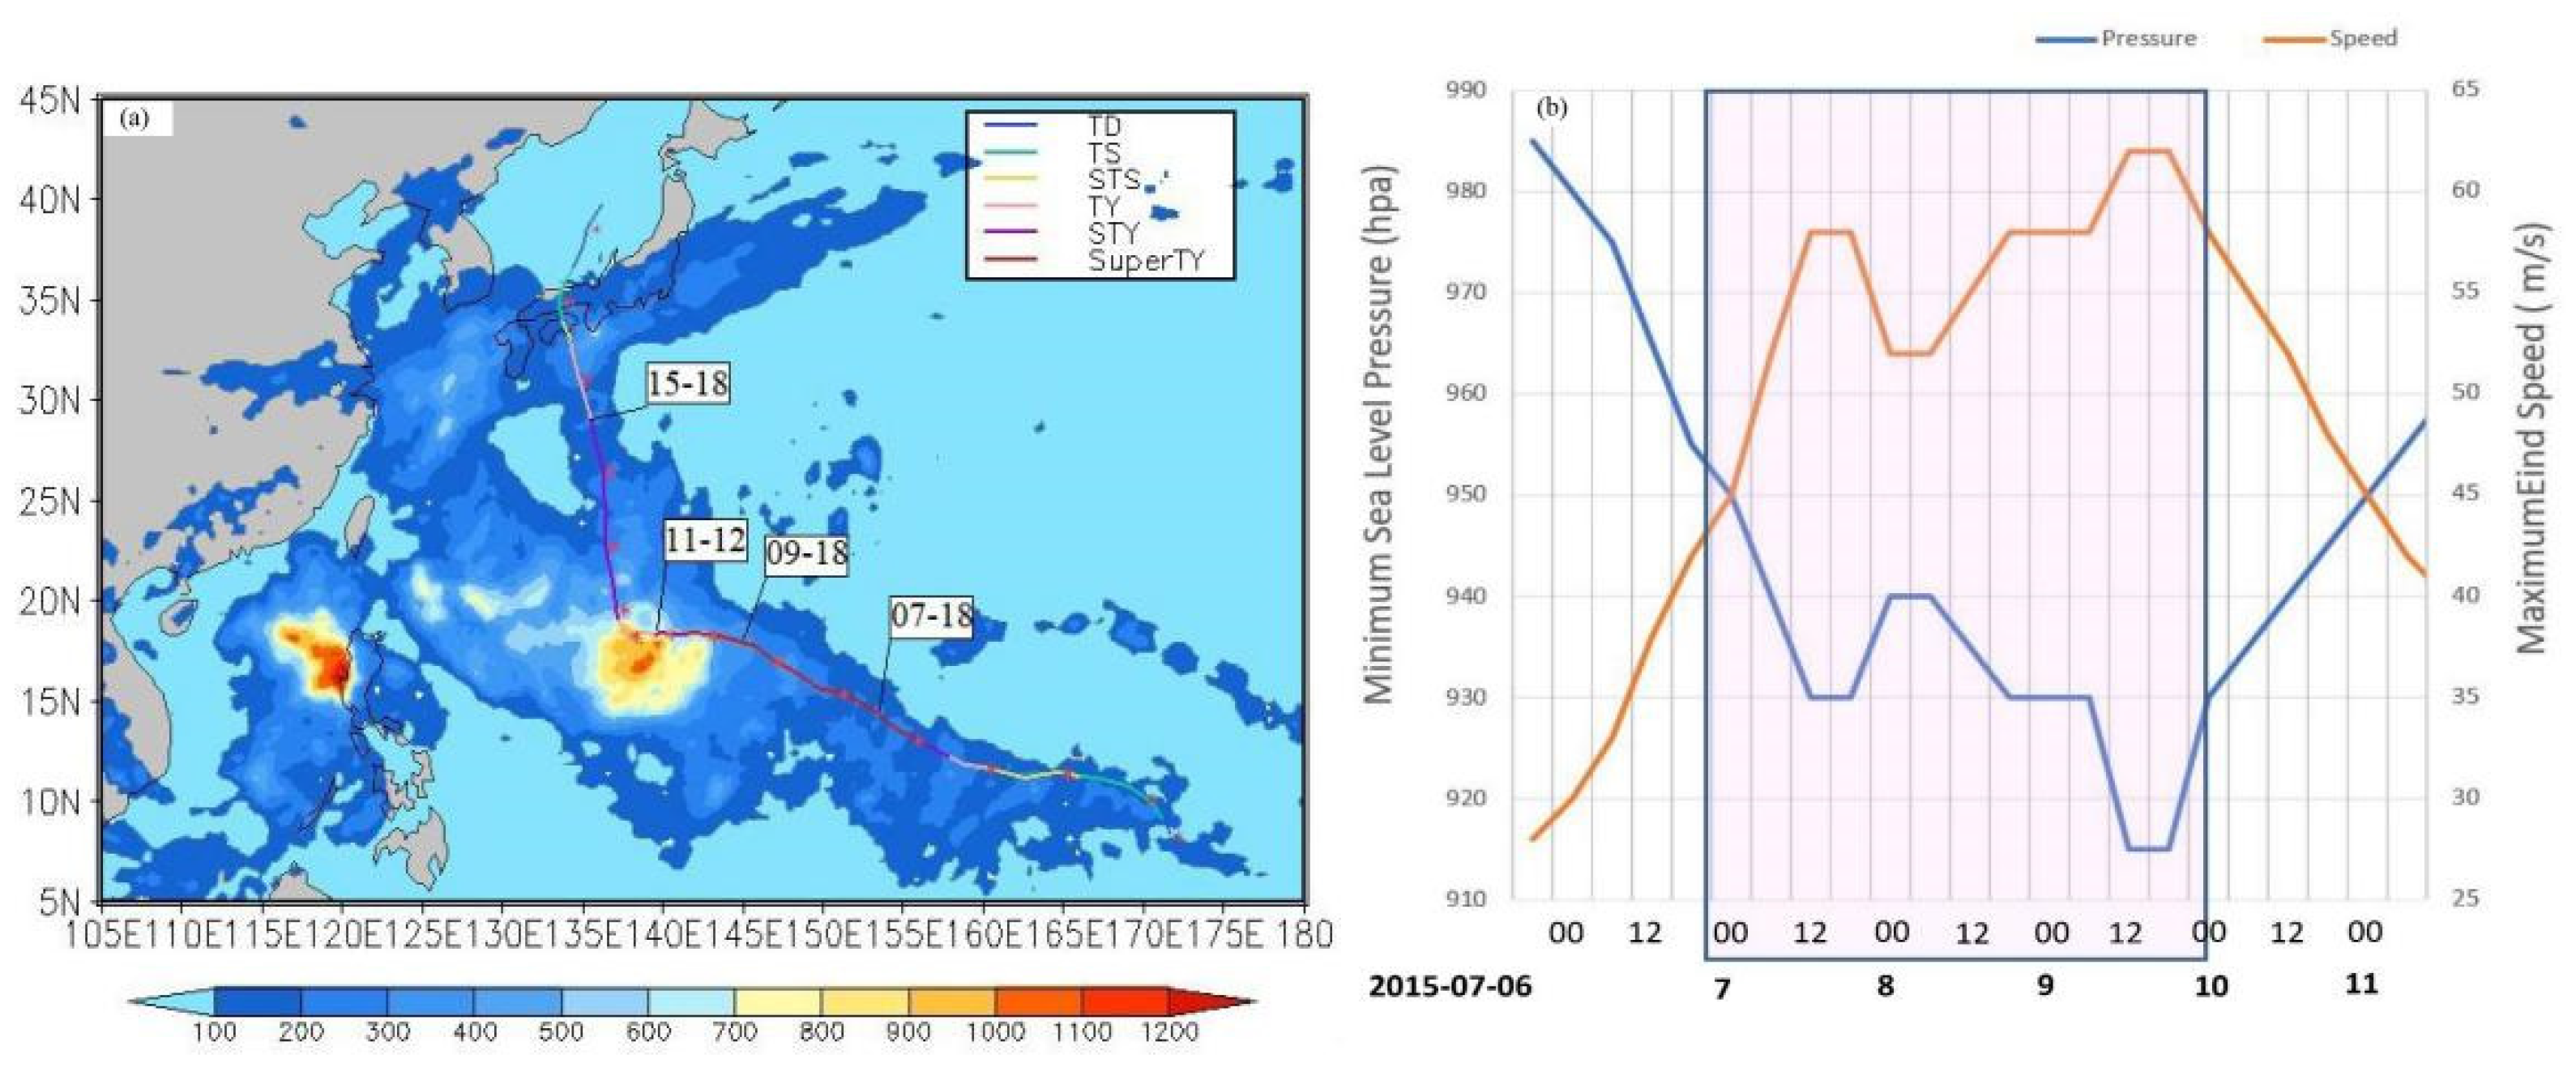
High-impact Typhoon Nangka (2015) was generated over the sea surface in the southeast of the Marshall Islands on 1 July 2015, gradually moved northwestward and was strengthened to become a severe typhoon at 20:00 on 7 July (UTC, hereafter the same). At the subsequent intensification stage, the central sea level pressure of the typhoon once reached 925 hPa. This typhoon was strongest on 10 July, with the minimum central pressure of 915 hPa, defined as a super typhoon by the Joint Typhoon Warning Center. On the evening of the 12th, the double eyewall structure could be observed; then, the typhoon landed in Japan at 22:00 on 16 July. At 02:00 on 19 July, the typhoon was merged into the front and disappeared.
As shown in Figure 1a, the whole life cycle of Typhoon Nangka had two major stages, i.e., the intensification stage over the sea in the east of 145° E, and the decaying stage in the west of the longitude. After the beginning of the decaying stage, the typhoon track experienced approximately 90° turning. Then, the typhoon moved northward and gradually weakened. The accumulated precipitation from Typhoon Nangka was mainly concentrated on the left side of its track, and there was a maximum precipitation center near 138° E, 17.5° N, with the accumulated precipitation reaching 1200 mm. The accumulated precipitation increased significantly along the southeastern coast of the Japan Islands due to terrain blocking. In the whole life history of Typhoon Nangka, the moving speed at the 6-h interval varied with the intensity and environment. From Figure 1a, it can be found that Typhoon Nangka moved approximately 250 km in 6 h at the initial stage. As the internal structure and energy of the typhoon varied, its speed gradually accelerated to 100 km·h−1. Near the turning point of the typhoon track, the moving speed slowed down obviously, to approximately 250 km per 6 h. Subsequently, the moving speed gradually increased and returned to 100 km·h−1 before landing in Japan.
Figure 1b shows the variations in the near-central maximum wind speed and minimum central pressure in the main life cycle of Typhoon Nangka. It can be seen that the typhoon’s intensity changed significantly, and the near-central maximum wind speed and the minimum central pressure varied most dramatically. From 00:00 on 6 July to 12:00 on 9 July, Typhoon Nangka rapidly intensified, with the minimum central pressure decreasing by 70 hPa and the near-central maximum wind speed increasing by 37 m·s−1. Note that the minimum central pressure decreased by 55 hPa only from 0:00 on 6 July to 12:00 on 7 July. Such a rapid intensification rate for a typhoon is rare. After this rapid intensification, the intensity of Typhoon Nangka weakened briefly and strengthened again, until the minimum central pressure reached its lowest. Subsequently, the typhoon rapidly weakened until it vanished.
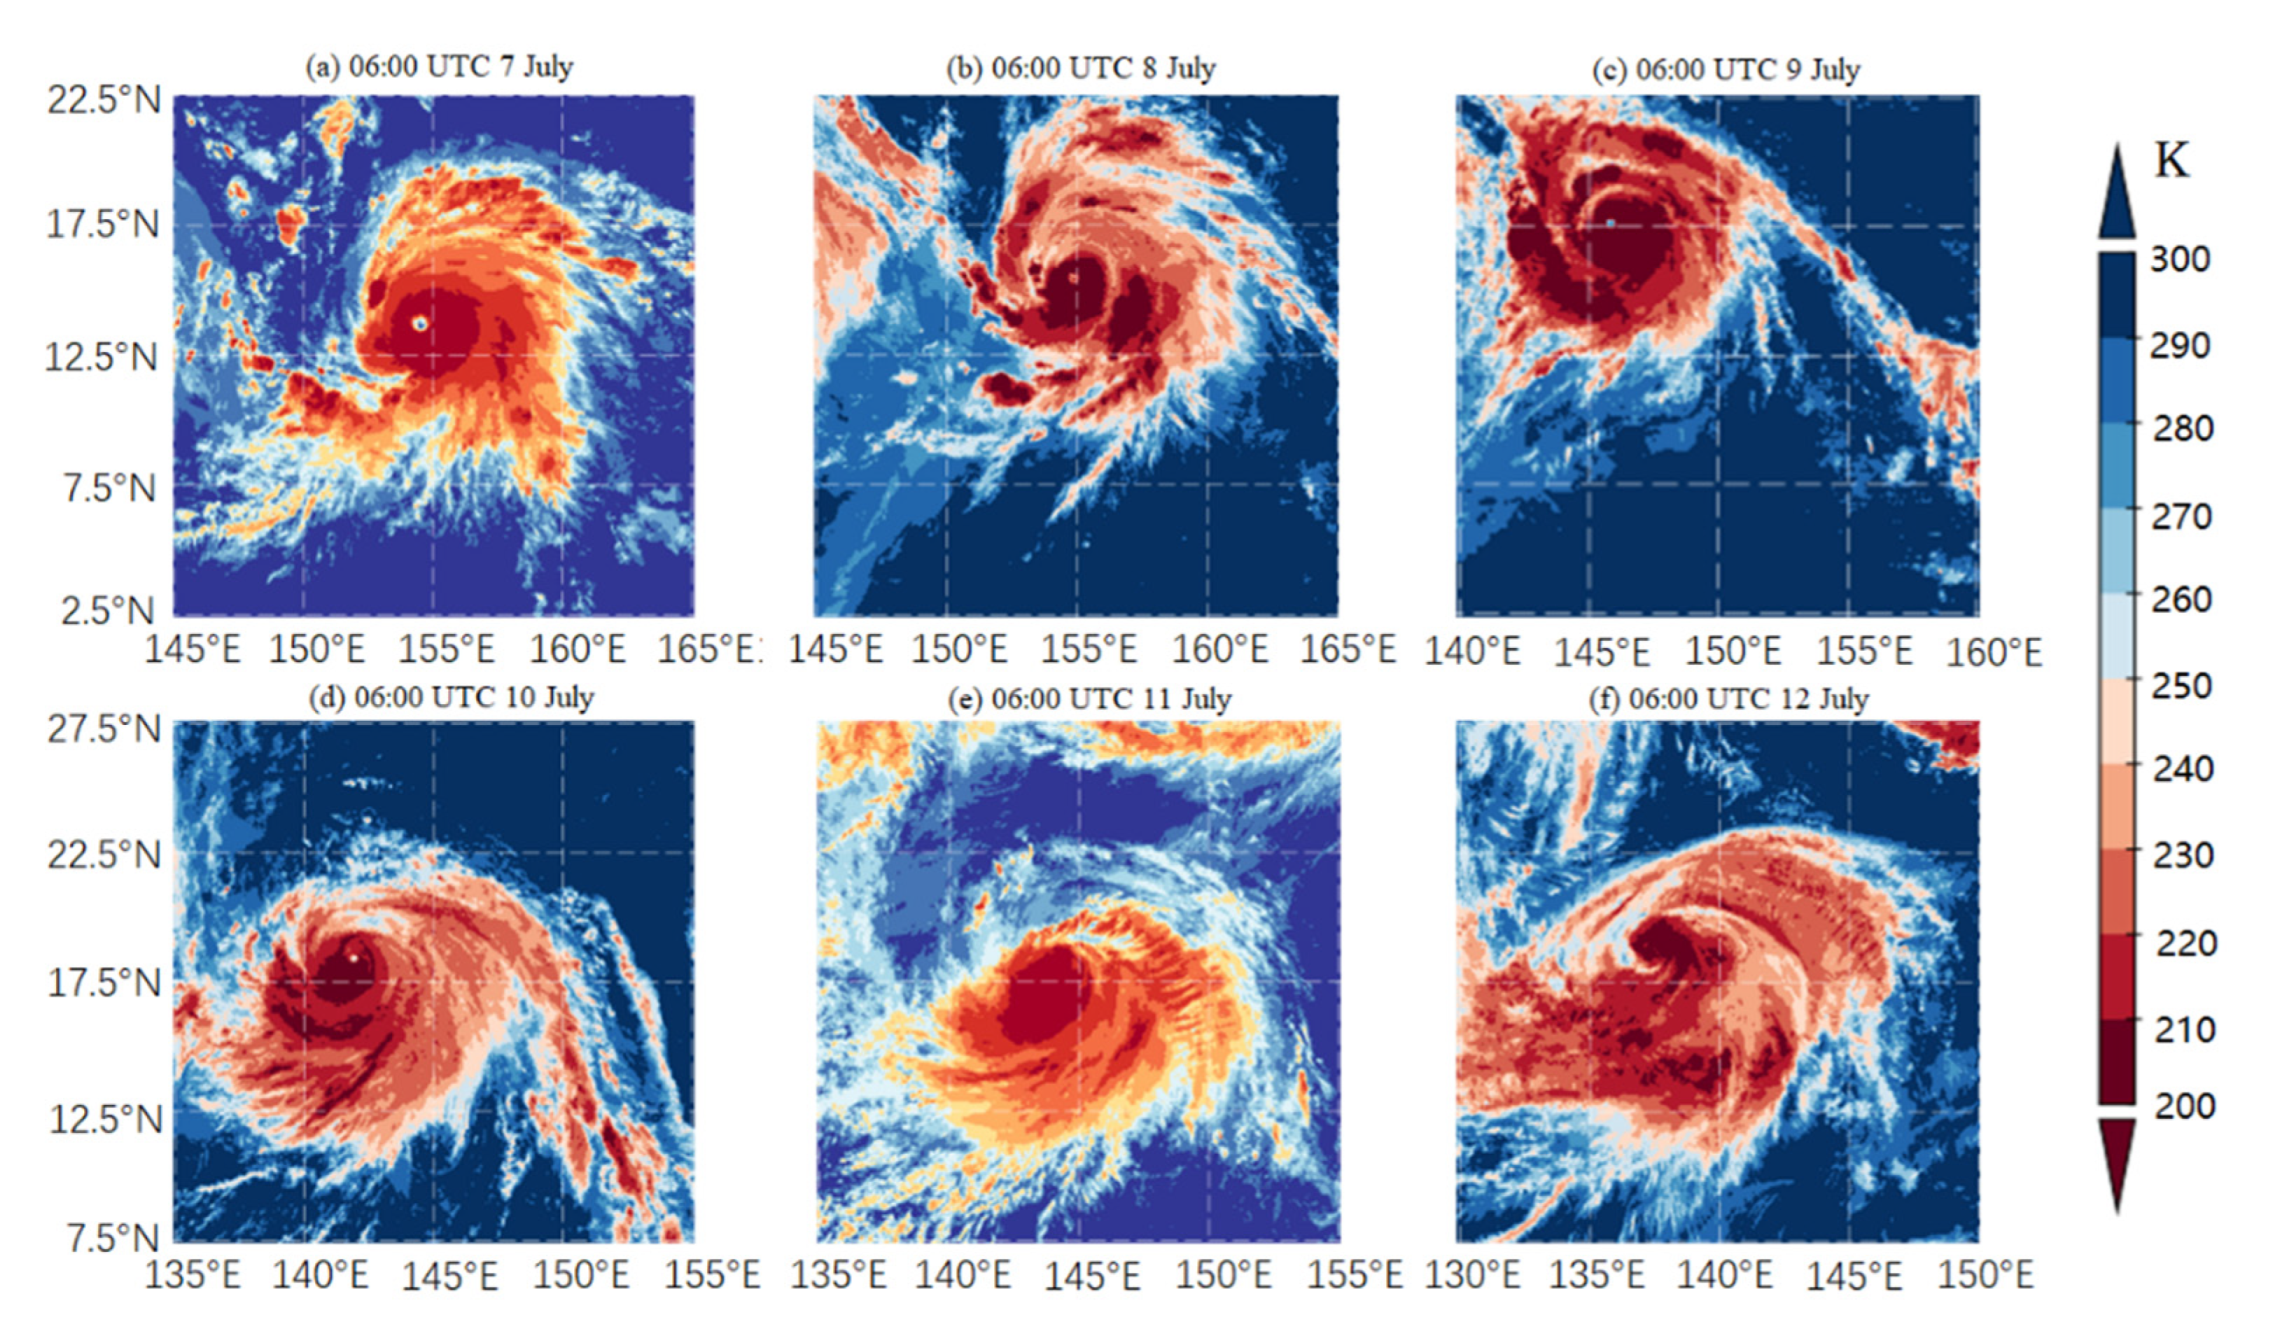
The 11.2 μm black body temperature (TBB) images of the Himawari-8 satellite from 06:00 on 7 July to 06:00 on 12 July (Figure 2) showed that the cloud system and spiral structure varied during the occurrence and development of the typhoon. Before changing track, at 06:00 on 7 July, the typhoon center was located at 13.6° N, 154.5° E, and the eyewall structure was apparent, with three spiral cloud bands around the periphery of the typhoon located at the north, southeast and southwest parts of the TC. By 06:00 on 8 July, the typhoon’s intensity had increased significantly, and a large part of the TBB dropped below 210 K. At 06:00 on 9 July, the typhoon’s eye became small and round, which was one of the vital signs indicating the vigorous development of the typhoon; in addition, the coverage of the lower TBB below 210 K extended, indicating the upward bursting of the cloud top, i.e., the cloud system around the typhoon became thick and dense. Except for a spiral cloud band in the fourth quadrant, the typhoon as a whole tended to be round, with significant symmetry characteristics. Until 06:00 on 10 July, the spiral structure changed more obviously, and several spiral deep cloud systems were located in the main body of the typhoon, exhibiting an asymmetrical structure with a dominant cloud mass to the south of the eye. In addition, the typhoon’s intensity was slightly weaker than previously. After 24 h, after changing track, the typhoon’s intensity weakened, and the typhoon’s eye disappeared, i.e., the typhoon’s eye was no longer visible in the 11.2 μm TBB cloud image. At this time, the super typhoon weakened to a severe typhoon, while the spiral structure was still obvious. At 06:00 on 12 July, the TC weakened from a severe typhoon to a typhoon, with a loose structure and weakened spiral structure. The main body of the typhoon gradually evolved from a near circle to an ellipse after 9th July.

3.2. Typhoon Structure in the GPM Satellite

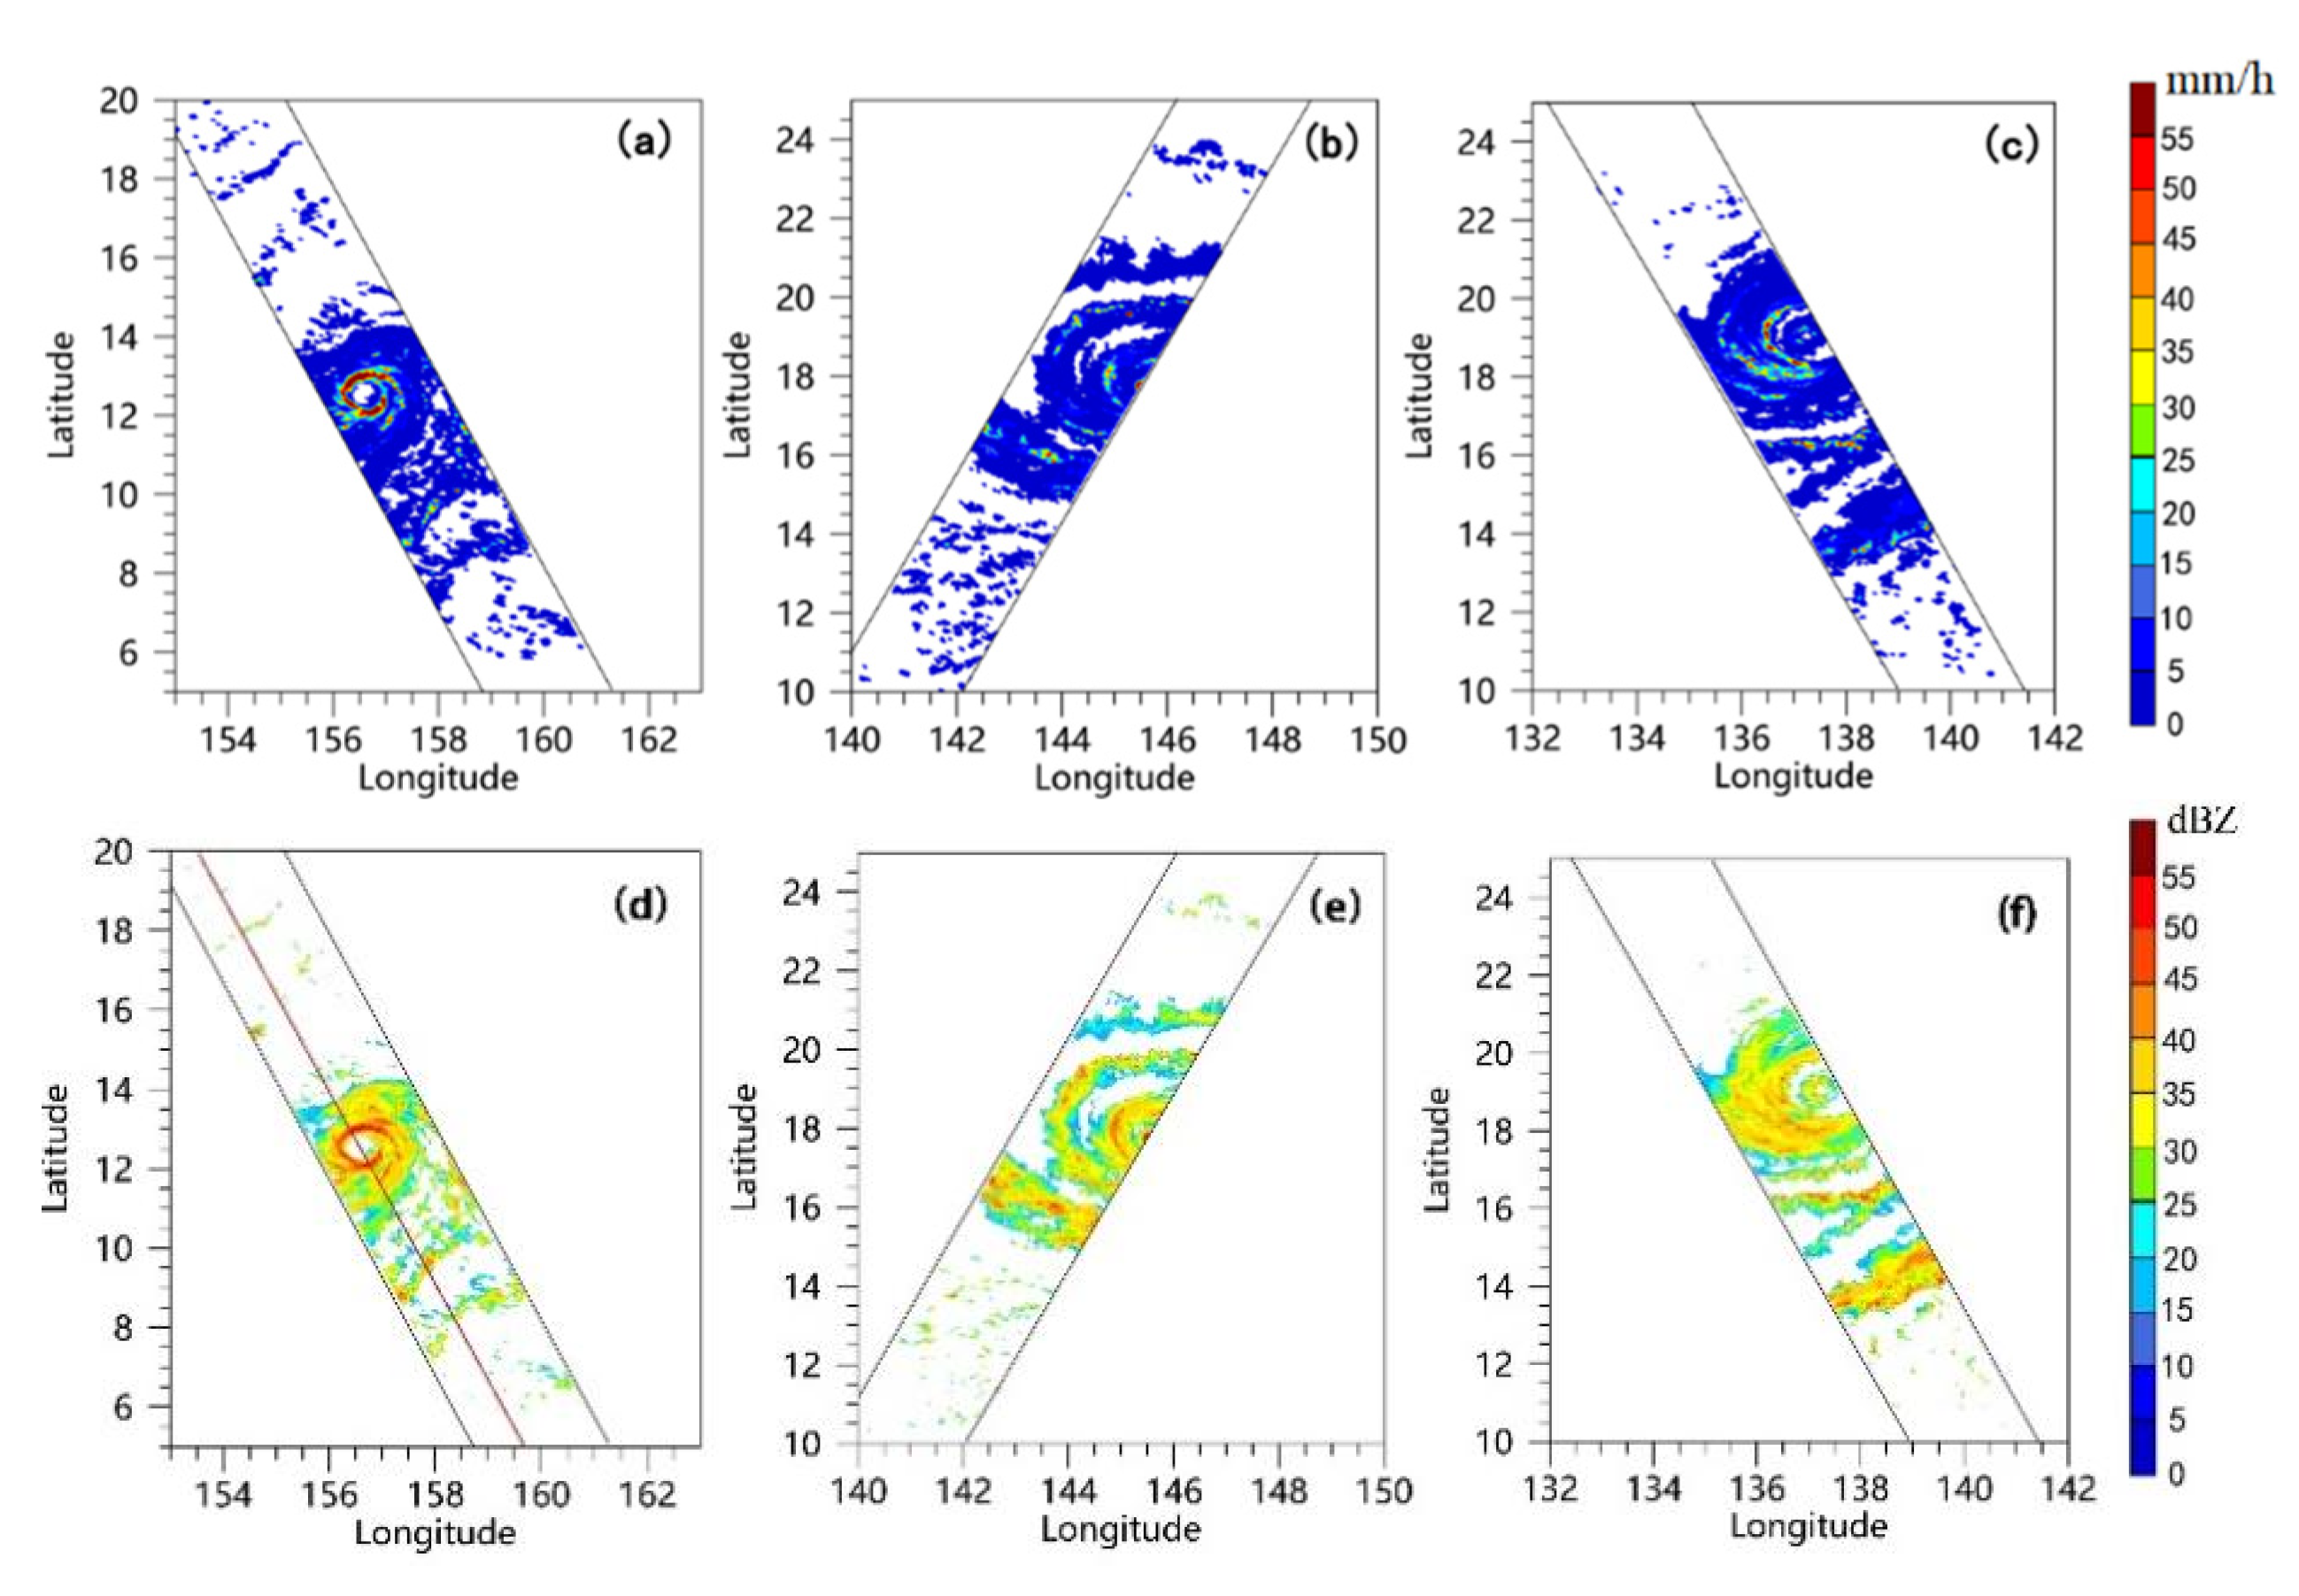
Three temporal samples with the best monitoring effect were selected for the analysis from the GPM satellite orbit where Typhoon Nangka was detected at 17:00 on 6 July, 06:00 on 9 July and 16:00 on 12 July, respectively.
At 17:00 on 6 July (Figure 3a,d), the intensity grade of Typhoon Nangka was severe, with a center position of 12.6° N, 156.3° E, and the GPM satellite scanned the complete eyewall structure. As shown in Figure 3a, the large-value area of the precipitation intensity was mainly located near the eyewall, with a maximum value of more than 55 mm·h−1. The precipitation intensity in the inner rainband was not large, and the precipitation distribution was relatively uniform, reflecting the characteristics of stratiform precipitation. However, the distribution of radar reflectivity was quite different from that of the precipitation intensity in the horizontal gradient, being smoother than the precipitation intensity. It could be seen in Figure 3d that although the radar reflectivity was the largest at the eyewall, its large-value area was closer to the periphery of the eyewall than that of the precipitation intensity. Unlike the sudden decrease in the precipitation intensity from the eyewall to the inner rainband, the transition characteristics of the radar reflectivity from the eyewall to the inner rainband were apparent, indicating that the particle number concentration between the inner rainband and the eyewall decreased gradually from inside to outside. By 06:00 on 9 July (Figure 3b,e), Typhoon Nangka had developed into a super typhoon, with a center at 18.0° N, 145.8° E, and its spiral characteristics were more obvious. In Figure 3b, the obvious spiral rainbands are apparent, and the rotation angle of the spiral rainband closest to the inner rainband is similar to a circle. Comparing the patterns of precipitation intensity and reflectivity, it was found that the large-value areas of reflectivity in the inner rainband and spiral rainbands were obviously larger than the surroundings and the coverage of large values was greater, while the precipitation intensity was generally uniform except for several small coverage centers. In the outer rainband, the precipitation intensity variation was almost unchanged, while the reflectivity had a peak and weakened toward the surrounding area, indicating that the particle number concentrations in the inner rainband and outer rainband of Typhoon Nangka changed significantly at this time, especially in the periphery of the inner rainband and the centers of the outer spiral rainbands. Typhoon Nangka weakened to a typhoon at 16:00 on 12 July (Figure 3c,f). Compared with the situation in the previous two periods, the precipitation intensity near the typhoon eyewall weakened, the particle number concentration in the inner rainband generally decreased, and the main body of the typhoon became loose.
The microwave radiation brightness temperature observed by the GMI carried by the GPM satellite could reflect the structural characteristics of typhoons more clearly [19]. This has a high impact on the typhoon strength [20]. 
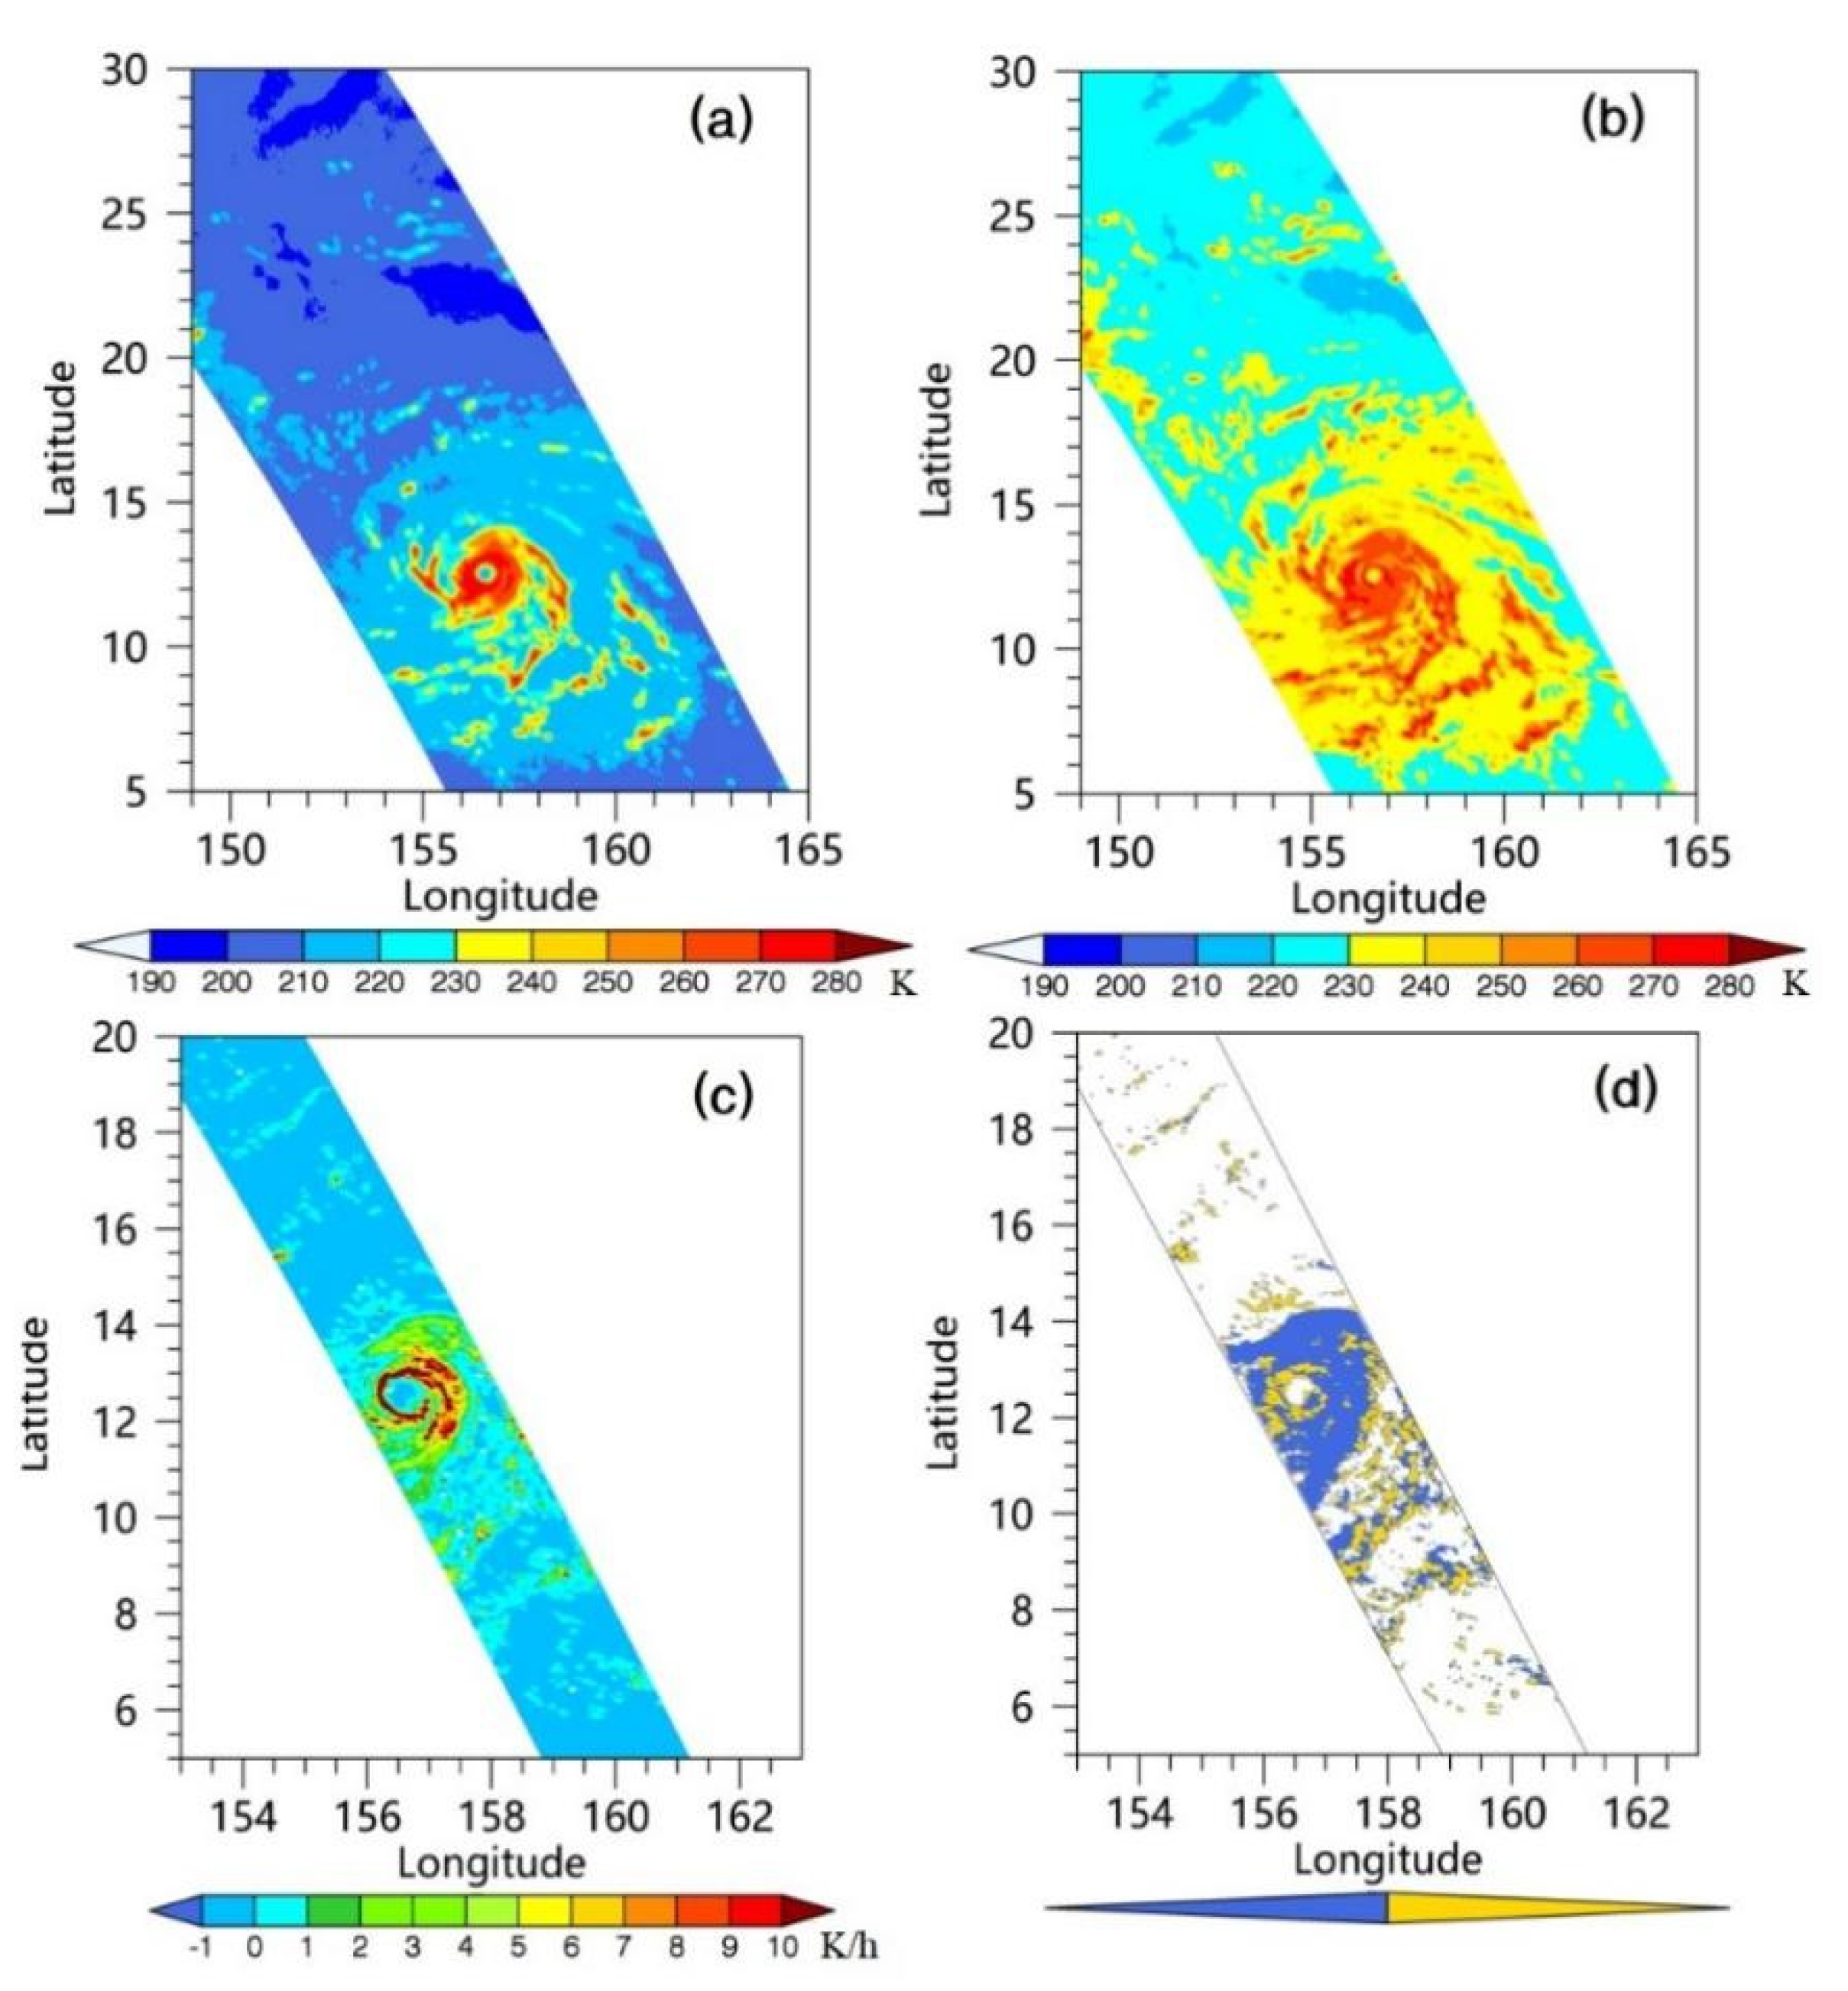
Figure 4a,b show that the brightness temperature at the 89.0 GHz channel was relatively larger than that of the 18.7 GHz channel. According to the principle of microwave radiation, the brightness temperature at the 89.0 GHz channel mainly reflects the intensity of the scattering signal of ice-phase particles in clouds; the fewer the ice-phase particles, the higher the brightness temperature at the 89.0 GHz channel. Meanwhile, the brightness temperature at the 18.7 GHz channel mainly reflects the number of liquid water particles in clouds, which is proportional to the number of liquid water particles [21]. The stronger the precipitation intensity, the larger the brightness temperature value at the 18.7 GHz channel, and the smaller the brightness temperature value at the 89.0 GHz channel. Therefore, in the inner rainband, the liquid water content was higher, the ice-phase particles were fewer, and the convective activity was not apparent. As shown in the figure, the spiral characteristics of particles in the cloud system of Typhoon Nangka were apparent, and a distinct spiral cloud system was observed, showing obvious asymmetry [22]. When the brightness temperature was proportional to the liquid water particles, there were large values of brightness temperature around the eyewall and small values in other regions, which corresponded to the large values of liquid water particles around the eyewall and small values of liquid water particles in other regions. Therefore, the convection near the eyewall was significant, and the precipitation in the other areas was dominated by stratiform precipitation (Figure 4d). At this time, the latent heat release in the first and fourth quadrants of the typhoon was apparent (Figure 4c). Figure 4d also suggests that stratiform precipitation mainly occurred in the inner rainband, and convective cloud precipitation mainly appeared along the eyewall and in the outer rainbands.
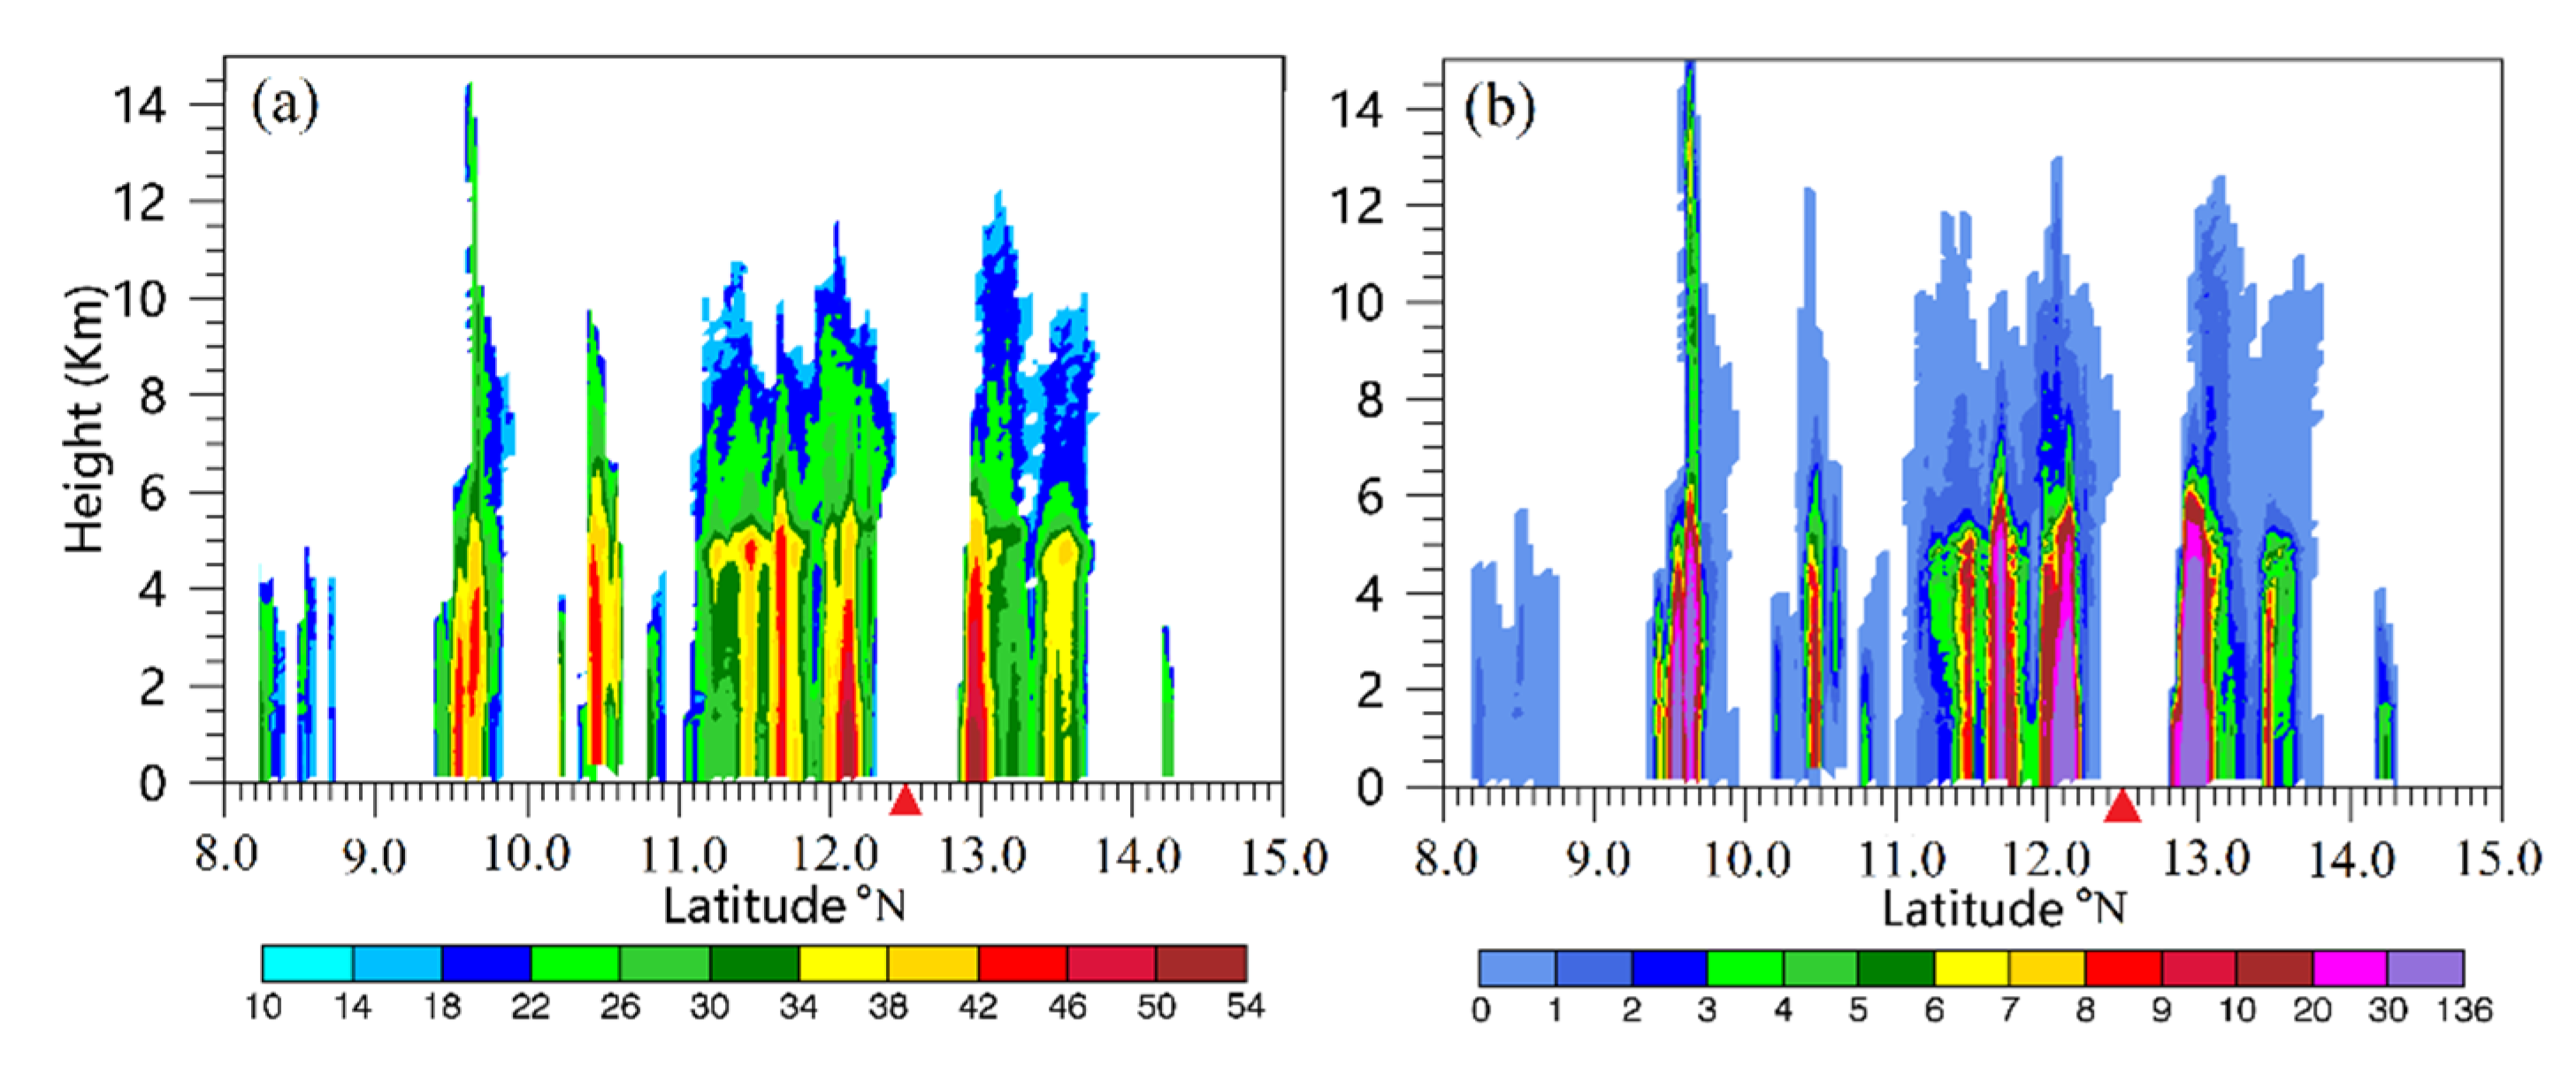
Figure 5 shows the overall profiles of the reflectivity and precipitation intensity along the satellite moving direction across the typhoon center. The vertical reflectivity profile of Typhoon Nangka (Figure 5a) demonstrated a bright band near the 0 °C layer at the height of around 4.5 km above sea level, around the eyewall between 11° N and 12.3° N, which indicated that the ice-phase particles melted on the height, resulting in a large-value area of reflectivity. In addition, the stratiform precipitation was obvious, which corresponds to the findings of Figure 4d. In parts of the spiral rainbands, the height of convection developed so robustly that the cloud top was vertically extended by more than 14 km, which was far higher than the height of the 0 °C layer. Moreover, there were ice-phase particles in these areas. Overall, the vertical reflectivity along the scanning direction varied significantly, which was related to the typhoon structure. The spatial distribution of precipitation (Figure 5b) was not continuous in the overall typhoon-induced precipitation, with the alternate distribution of high and low values along the satellite moving direction and even several areas with zero precipitation distributed dividually, which was consistent with the concept of a typhoon’s radial weather distribution, indicating that the spiral structure of Typhoon Nangka was evident. The spiral rainbands outside the main body of the typhoon were dispersed widely and even by more than 100 km in several places; the most remote one was approximately 4 latitudinal degrees to the south from the typhoon eye. The large-value areas of precipitation intensity and vertical reflectivity overlapped well, and the maximum precipitation intensity was mainly noted in the eyewall and the strong convection areas of spiral rainbands.
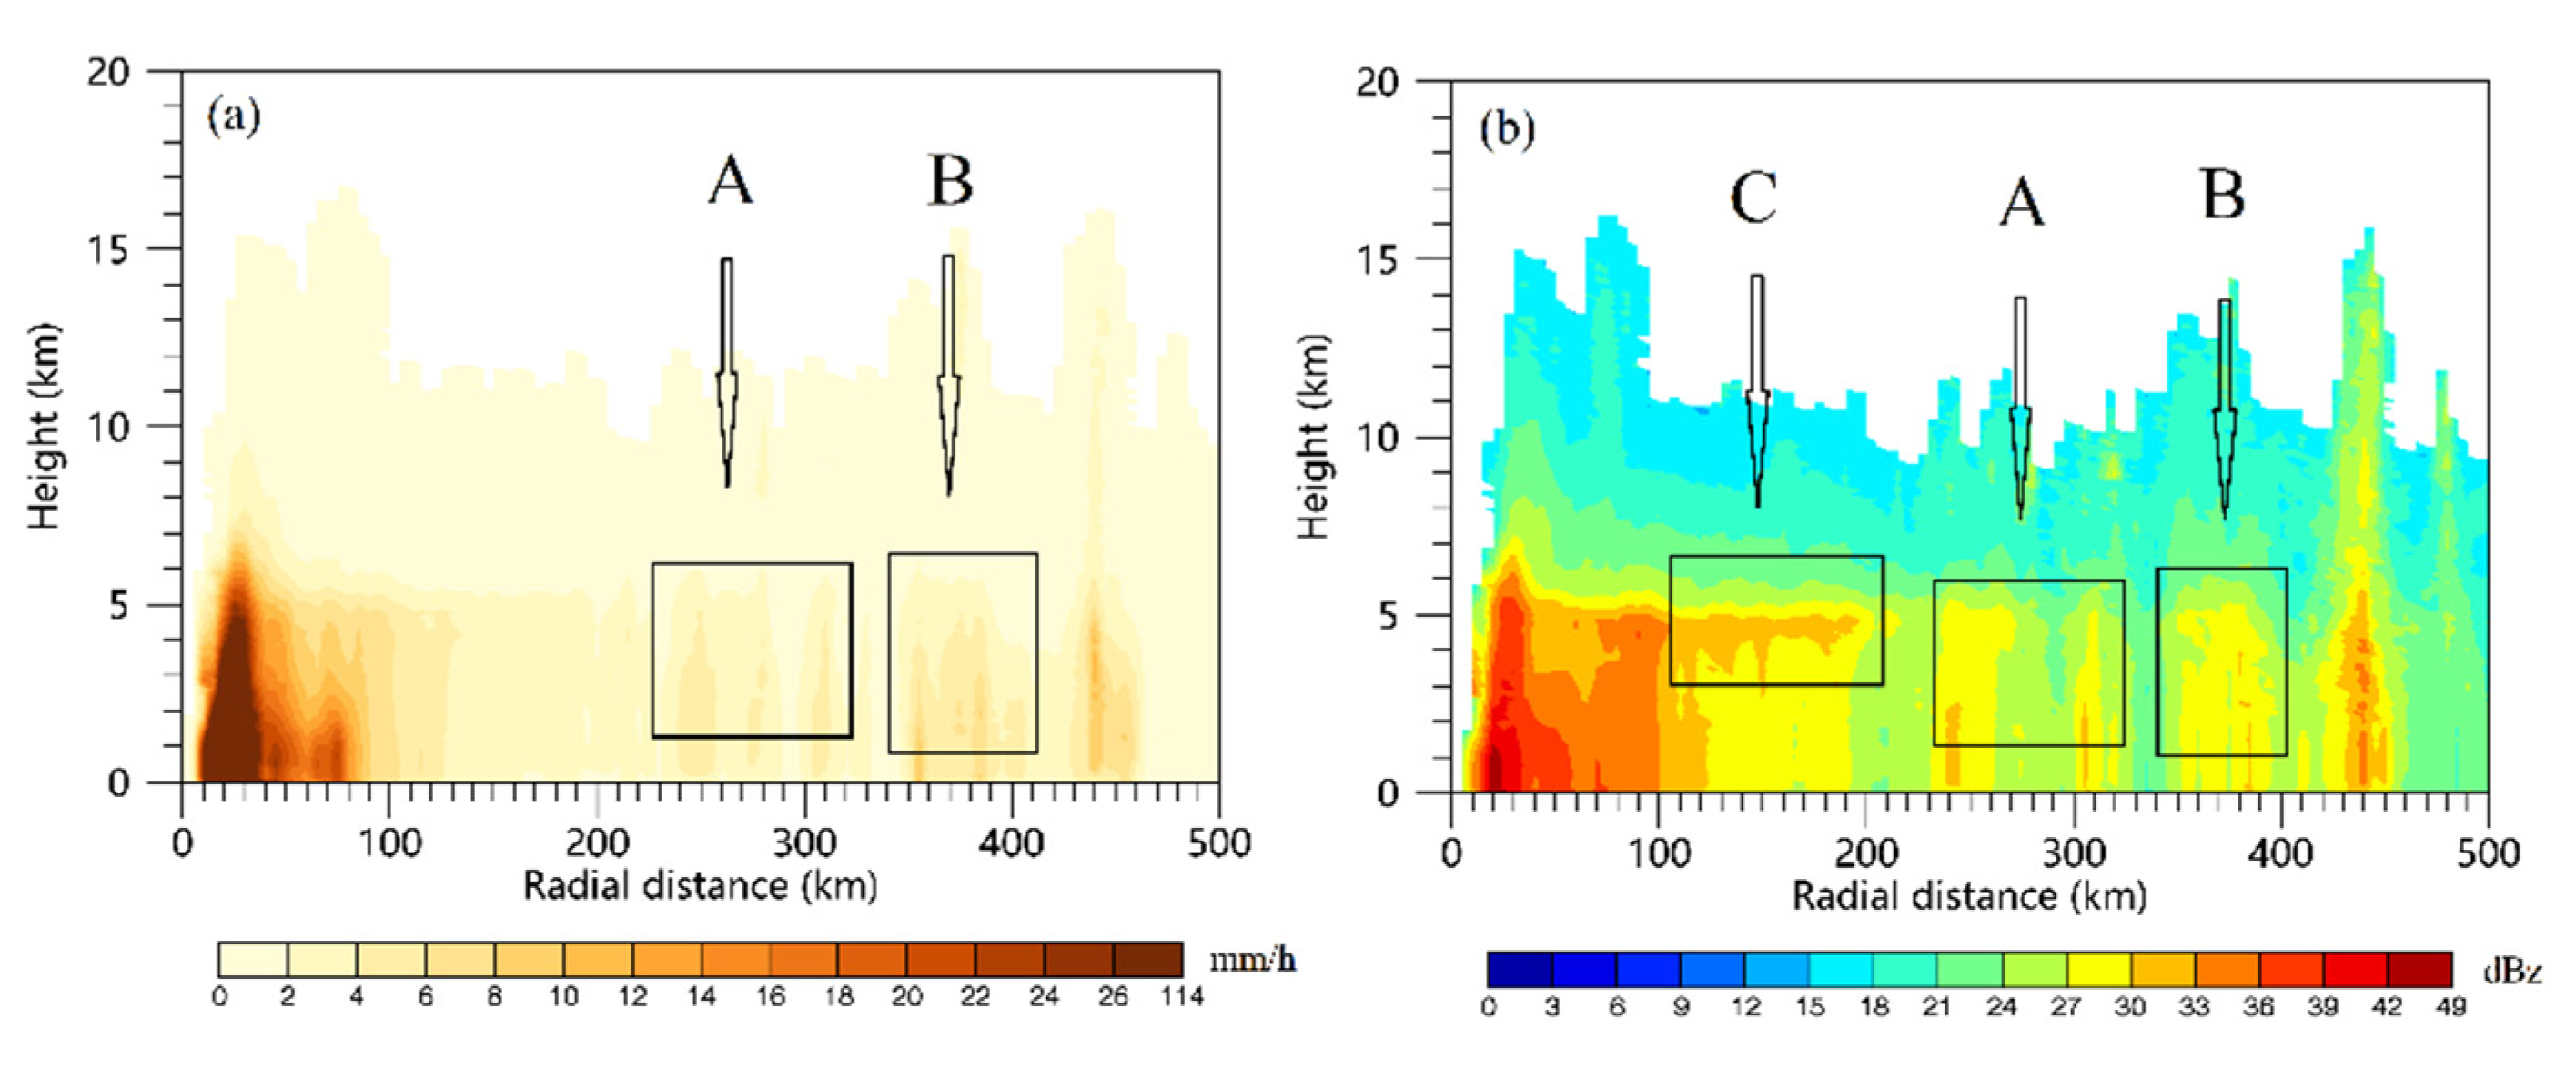
Combined with the typhoon classification standard defined by Didlake [23] and the observation data, Typhoon Nangka was roughly radially divided into three parts, namely the eyewall (0–100 km), the inner rainband (100–200 km) and the outer rainband (>200 km). Figure 6 shows that the eyewall was characterized by a large value for the precipitation intensity and reflectivity, and the maximum precipitation intensity was 114 mm·h−1. This result indicates that heavy precipitation occurred near the typhoon eyewall, and the precipitation intensity was far larger than that of other areas of the typhoon. There were two large-value centers of precipitation in the eyewall, and the maximum precipitation intensity far from the typhoon center was 24 mm·h−1, far less than that of the center close to the typhoon’s eye. In addition, the precipitation intensity radially decreased significantly within the outer section of the eyewall, with a radial range of 30~100 km (Figure 6a). In the inner rainband, the distribution of the precipitation intensity was relatively uniform, and there was no apparent alternating distribution of high and low values. In this area, the precipitation intensity remained stable between 4 mm·h−1 and 6 mm·h−1, and the height of precipitation development was relatively consistent, without obvious strong convective activity. In the outer rainband, the precipitation intensity had a prominent intermittently alternating center of high and low values, with an uneven distribution. At 450 km away from the typhoon’s eye, a large-value center of precipitation appeared in the outer spiral rainband, denoting strong convective activity. This center was one of the areas with the most intense precipitation development throughout the typhoon (the other area was the eyewall), and the height of precipitation development reached approximately 17 km. The distribution characteristics of the radar reflectivity were similar to those of the precipitation intensity, i.e., two obvious large-value areas could be found in the eyewall. A bright band appeared near the 0 °C layer in region C outside the eyewall, approximately 100 km in width. The radar reflectivity decreased from the bright band to both the upward and downward sides, indicating that the ice-phase particles were concentrated and melted in this area, and the characteristics of stratiform precipitation were significant. The distributions of the radar reflectivity and precipitation intensity in the outer rainband were similar, with obvious gaps separating two neighboring larger values. Note that the distributions of the precipitation intensity and radar reflectivity in regions A and B were exactly the opposite, and the maximum precipitation intensity in region A was significantly smaller than that of region B. However, the radar reflectivity in region A was larger than that of region B. According to the theory of radar reflectivity, it could be concluded that the precipitation in region B involved tiny raindrops with a high concentration, the precipitation in region A contained large raindrops with a low concentration, and the precipitation at the eyewall involved large raindrops with a high concentration. Precipitation in the eyewall, inner rainband and outer rainband had significantly different characteristics, with obvious independent characteristics.
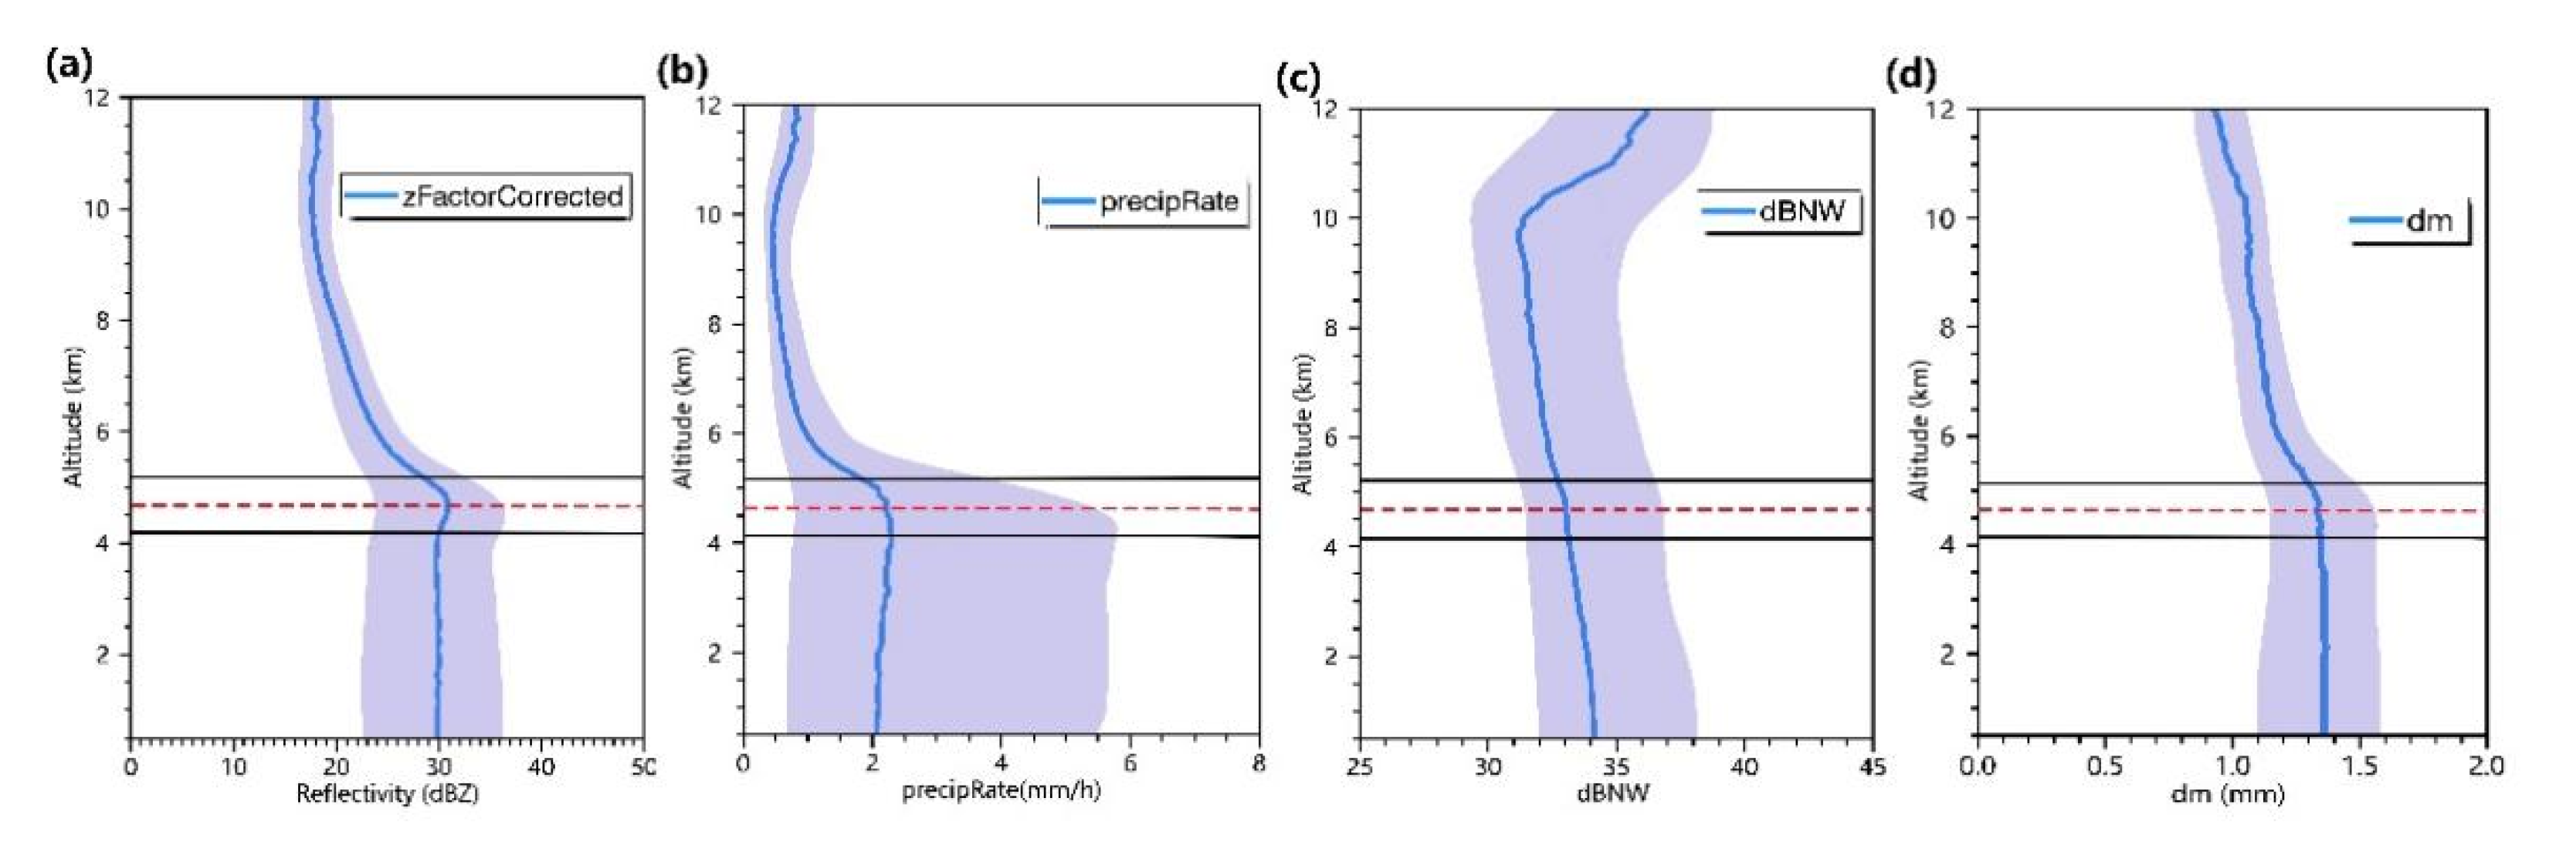
Figure 7 shows the overall characteristics of the typhoon in the vertical direction based on the GPM satellite data. The two solid black lines divide the typhoon into three vertical layers: the warm layer at the bottom, the transition layer in the middle and the cold layer at the top. Figure 7a clearly shows that there was a sudden change in reflectivity near the 0 °C layer, indicating that there was a bright band, and the characteristic of stratiform precipitation was obvious. The radar reflectivity was essentially stable in the warm layer, indicating that the collision and breakup processes of particles tended to be stable there. From the 10 km height down to the 0 °C layer, the radar reflectivity increased, indicating that the collision and growth processes between particles became more intense with the decreasing height. Both the precipitation intensity (Figure 7b) and reflectivity showed h-shaped distributions, and the precipitation intensity profile at the warm layer was close to the lower quartile of the shaded area, indicating that the distribution of the precipitation intensity of Typhoon Nangka was uneven. The precipitation intensity decreased sharply across the 0 °C layer, and the profile above the 0 °C layer decreased to half of that in the warm layer. In the warm layer, the particle number concentration increased from top to bottom (Figure 7c), and the particle diameter (Figure 7d) also increased slightly from top to bottom. Both the number and the diameter of particles increased, indicating that the water vapor content was sufficient in the warm layer. There were continuous large raindrops broken into tiny raindrops. In contrast, small raindrops were enlarged into large raindrops under the influence of sufficient water vapor. The particle number concentration in the ice layer tended to shift at 10 km, and the particle concentration above 10 km increased obviously with the height (Figure 7c).

3.3. Typhoon Structure Detected by the CloudSat Satellite

The cloud type distribution on the radial height section of Typhoon Nangka was obtained from the CloudSat 2B-CLDCLASS data. The cloud types were mainly identified as deep convective clouds, cumulus, altostratus, stratocumulus, cirrus, altocumulus and nimbostratus cloud systems [24]. Figure 8 suggests that the cloud system of Typhoon Nangka was relatively complex. Specifically, the deep convective clouds were mainly distributed in the eyewall area, with high vertical development, and the upper- and lower-layer clouds were closely coordinated. In addition, there were various cloud types over the same positions in parts of the cloud bands, where cirrus was the most widely distributed, and its coverage was close to half of the typhoon. There were high- and low-altitude configurations of nimbostratus and cirrus between the two deep convective clouds. With the development of the deep convective clouds, altocumulus also developed. In addition to the deep convective clouds, cirrus and altocumulus, there was still a limited amount of stratocumulus, altostratus and cumulus in parts of the mid- and low-altitude areas in the typhoon cloud bands. The eyewall was asymmetrically distributed, the typhoon cloud system was dominated by single-layer clouds, and multilayer clouds appeared in a few areas. This finding confirmed the results from Gao et al. [25].

4. Conclusions and Discussion

The GPM, CloudSat and Himawari-8 satellite data were used in this study to investigate a high-impact weather system—Typhoon Nangka (2015)—over the Western Pacific during 3–18 July in 2015. The characteristics of the cloud system, precipitation, radar reflectivity and cloud type distribution have been analyzed. The main conclusions are as follows.
The cloud system varied obviously during the intensification stage of Typhoon Nangka. When the intensity reached the grade of a super typhoon, the overall cloud system was close to a round shape, and the typhoon’s eye was small and round, and clearly visible. In addition, the cloud system developed relatively deeply. As the typhoon’s intensity weakened, the cloud system flattened, and the typhoon’s eye gradually disappeared. Large raindrops dominated the precipitation at the first quadrant near the eyewall of Typhoon Nangka. Convective cloud precipitation mainly occurred in the eyewall and parts of the spiral rainbands. The precipitation in the inner rainband was mainly stratiform precipitation, and the convective activity was not obvious. The convection in the outer rainband of Typhoon Nangka developed vigorously, upwards by more than 14 km, and the cold cloud process was significant. The characteristics of the stratiform precipitation caused by Typhoon Nangka were obvious, the water vapor content in the warm layer was sufficient, and the collision and breakup processes of water droplets were stable.
The eyewall, inner rainband and outer rainband of Typhoon Nangka were relatively independent, with significant feature differences. Specifically, the convective activities at the eyewall were intense, and the ice-phase process was significant. In addition, the stratus characteristics in the inner rainband were obvious, with an evident bright band, and the height of precipitation development was uniform. In terms of the outer rainband, the high and low values of precipitation were alternately distributed. Moreover, the height of precipitation development varied greatly, and severe convective activity was noted.
The cloud system of Typhoon Nangka was complex and diverse, with close cooperation. The eyewall contained mainly deep convective clouds. The altocumulus was generated with the development of convective activity. The clouds on both sides of the eyewall were cirrus and had the broadest range, covering nearly half of the typhoon. The clouds at low altitudes were dominated by single-layer clouds, accompanied by stratocumulus, altostratus and cumulus.
Based on the achievements of Zhao [6], the microphysical characteristics of the precipitation were analyzed in detail to verify the results of Zhao [6] and Gao et al. [25]. However, the satellite data have certain errors compared with the actual situation due to the attenuation of electromagnetic waves in the atmosphere and the influence of the algorithm. Therefore, more satellite data should be combined for a multi-faceted comparative study in the future. Moreover, the object of this research was only one high-impact weather system case, and the universality of the conclusions is still uncertain. In the next step, we will select more typhoon cases and conduct a statistical evaluation based on the existing research.

Author Contributions

Conceptualization, X.M.; methodology, H.H.; software, X.W.; formal analysis, J.W., Z.W. and B.H.; supervision, J.W. All authors have read and agreed to the published version of the manuscript.

Funding

This work is found by National Natural Science Foundation of China, 42075053, 41975128.

Informed Consent Statement

Informed consent was obtained from all subjects involved in the study.

Data Availability Statement

The IMERG data, the GPM-DPR data and the GMI data (https://search.earthdata.nasa.gov). The 11.2 μm band data from the Himawari-8 satellite (http://www.eorc.jaxa.jp/ptree/index.html). The 2B-CLDCLASS data product from the CloudSat satellite (http://www.cloudsat.cira.colostate.edu).

Conflicts of Interest

The authors declare no conflict of interest.

References

  1. Rappaport, E.N. Loss of Life in the United States Associated with Recent Atlantic Tropical Cyclones. Bull. Am. Meteorol. Soc. 2000, 81, 2065–2074. [Google Scholar] [CrossRef]
  2. Emanuel, K. Increasing Destructiveness of Tropical Cyclones over the Past 30 Years. Nature 2005, 436, 686–688. [Google Scholar] [CrossRef] [PubMed]
  3. May, P.T.; Holland, G.J. Role of Potential Vorticity Generation in Tropical Cyclone Rainbands. J. Atmos. Sci. 1999, 56, 1224–1228. [Google Scholar] [CrossRef]
  4. Xiang, C.Y.; Wu, L.G.; Tian, W.; Liu, Q.Y. Applications of MTCSWA Data to the Characteristic Analysis of Tropical Cyclone Structure. Meteorol. Mon. 2016, 42, 1215–1324. [Google Scholar]
  5. Tan, Z.M.; Chu, K. Annular Typhoons in the Western North Pacific. Weather Forecast. 2014, 29, 241–251. [Google Scholar]
  6. Zhao, Z. Multi-Satellite Observations on the Structure Characteristics of Typhoon Meranti in 2016. Plateau Meteorol. 2019, 38, 156–164. [Google Scholar]
  7. Duan, Y.H.; Yu, H.; Wu, R.S. Review of the Research in the Intensity Change of Tropical Cyclone. Acta Meteorol. Sin. 2005, 63, 636–645. [Google Scholar]
  8. Yan, Y.F.; Tan, J.G.; Cui, L.L.; Yu, W.; Hu, Y. Asymmetry of Cloud Vertical Structures and Associated Radiative Effects in Typhoon over the Northwest Pacific Based on CloudSat Tropical Cyclone Dataset. Asia-Pac. J. Atmos. Sci. 2020, 56, 515–532. [Google Scholar] [CrossRef]
  9. Han, D.; Yan, W.; Ye, J.; Liu, H.F. Analyzing Cloud, Precipitation, and Thermal Structure Characteristics of Typhoons in Eastern Pacific Based on CloudSat Satellite Data. Chin. J. Atmos. Sci. 2013, 37, 691–704. [Google Scholar]
  10. Lyu, Q.Y.; Zhang, Y.X.; Jiang, H.Y.; Zheng, H.; Chen, D.H.; Hu, Y.J. Precipitation Evolution During the Rapid Intensification Event of Typhoon “Lekima” (1909). J. Meteorol. Sci. 2020, 40, 136–142. [Google Scholar]
  11. Lu, M.Q.; Wei, M. GPM Data Application in Analysis of Vertical Structure of Typhoon ‘Mujigae’ Precipitation. Remote Sens. Technol. Appl. 2017, 32, 904–912. [Google Scholar]
  12. Yan, Y.F.; Tan, J.G.; Cui, L.L.; Yue, C.J.; Wei, W.; Liu, D.W. Estimating the Short Time Severe Precipitation of Typhoon Meranti and Its Evolution by Using the Infrared Brightness Temperature Data from Himawari 8 Satellite with High Spatio Temporal Resolution. Meteor. Mon. 2019, 45, 318–329. [Google Scholar]
  13. Zhou, Y.Y.; Zhou, L.; Guan, H. Numerical Simulation of Typhoon Waves in the Northwest Pacific Ocean. Mar. Forecast. 2016, 033, 23–30. [Google Scholar]
  14. Petty, G.W.; Bennartz, R. Field-of-view characteristics and resolution matching for the Global Precipitation Measurement (GPM) Microwave Imager (GMI). Atmos. Meas. Tech. Discuss. 2017, 10, 745–758. [Google Scholar] [CrossRef] [Green Version]
  15. Skofronick-Jackson, G.; Petersen, W.A.; Berg, W.; Kidd, C.; Stocker, E.; Kirschbaum, D.B.; Kakar, R.; Braun, S.A.; Huffman, G.J.; Toshio, I.; et al. The Global Precipitation Measurement (GPM) mission for science and society. Bull. Am. Meteor. Soc. 2017, 98, 1679–1695. [Google Scholar] [CrossRef] [PubMed]
  16. Wang, G.Y.; Wang, H.Q.; Zhuang, Y.Z.; Wu, Q.; Chen, S.Y.; Kang, H.K. Tropical Overshooting Cloud-Top Height Retrieval from Himawari-8 Imagery Based on Random Forest Model. Atmosphere 2021, 12, 173. [Google Scholar] [CrossRef]
  17. Sun, B.T.; Li, P.Y.; Fu, G. Vertical Structure of Cloud Microphysical Properties of an Explosive Cyclone over the Northwest Pacific in January, 2012. Period. Ocaean Univ. China 2020, 050, 11–18. [Google Scholar]
  18. Liu, J.J.; Chen, B.D. Cloud Occurrence Frequency and Structure over the Qinghai-Tibetan Plateau from CloudSat Observation. Plateau Meteorol. 2017, 36, 632–642. [Google Scholar]
  19. Zhao, H.C.; Zhou, X.H.; Liu, Y.X.; Ji, X.; Yang, L.; Sun, C.; Jin, S. Research on Measurement Coverage and Uncertainty Analysis of GPM Microwave Imager SST Products. Remote Sens. Technol. Appl. 2017, 32, 1031–1039. [Google Scholar]
  20. Spansan, D.; Wang, Y.D.; Gong, J.; Leah, D.; Stephen, J.M.; Wang, C.X.; Wu, D.L.; Liao, L.; William, S.O.; Donifan, O.B. A Comprehensive Machine Learning Study to Classify Precipitation Type over Land from Global Precipitation Measurement Microwave Imager (GPM-GMI) Measurements. Remote Sens. 2022, 14, 3631. [Google Scholar] [CrossRef]
  21. Zhang, A.Q.; Fu, Y.F. The Structural Characteristics of Precipitation Cases Detected by Dual-Frequency Radar of GPM Satellite. Chin. J. Atmos. Sci. 2018, 42, 33–51. [Google Scholar]
  22. Li, X.; Lin, S.B.; Wang, J.C.; Lu, S. Analysis on Asymmetric Structure of Tropical Cyclone Nangka and the Related Precipitation using Satellite Data. Guangdong Meteorol. 2011, 16, 1–6. [Google Scholar]
  23. Didlake, A.C.; Kumjian, M.R. Examining Polarimetric Radar Observations of Bulk Microphysical Structures and Their Relation to Vortex Kinematics in Hurricane Arthur (2014). Mon. Weather Rev. 2018, 145, 4521–4541. [Google Scholar] [CrossRef]
  24. Hung, M.-P.; Chen, W.-T.; Wu, C.-M.; Chen, P.-J.; Feng, P.-N. Intraseasonal Vertical Cloud Regimes Based on CloudSat Observations over the Tropics. Remote Sens. 2020, 12, 2273. [Google Scholar] [CrossRef]
  25. Gao, Y.; Fang, X. Analyses on Vertical Structure and Microphysical Features of Typhoon Cloud in Western Pacific Based on CloudSat Satellite Data. Meteor. Mon. 2018, 44, 597–611. [Google Scholar]
Figure 1. (a) The track and intensity of Typhoon Nangka and accumulated precipitation distribution during the typhoon life cycle (the track is indicated by the curve and the intensity is the color of the curve labeling at upper right; the precipitation is shown as a shaded area and scaled below with unit mm), and (b) the evolution of minimum central pressure (blue curve, hPa) and near-central maximum wind speed (yellow curve, m·s−1). TD denotes the tropical depression, TS denotes the tropical storm, STS denotes the severe tropical storm, TY denotes the typhoon, STY denotes the severe typhoon and SuperTY denotes the super typhoon. The shaded area in panel (b) represents the situation of the study period in this research.
Atmosphere 14 00440 g001
Figure 2. The black body temperature at the 11.2 μm band of the Himawari-8 satellite with 24 h interval from 7 to 12 July 2015 (unit: K).
Atmosphere 14 00440 g002
Figure 3. Distributions of (ac) precipitation intensity (mm·h−1) and (df) radar reflectivity (dBZ) of Typhoon Nangka detected by the GPM at (a,d) 17:00 on 6th July, (b,e) 06:00 on 9th July and (c,f) 16:00 on 12th July.
Atmosphere 14 00440 g003
Figure 4. Brightness temperature distributions of 17:00 on 6 July at (a) 18.7 GHz and (b) 89.0 GHz channels of the GMI (K), (c) the latent heating distribution obtained by the GPM spectral latent heating (K h−1) and (d) precipitation classification (blue: stratiform precipitation; yellow: convective precipitation).
Atmosphere 14 00440 g004
Figure 5. Latitudinal height sections of (a) the reflectivity (dBZ) and (b) precipitation intensity (mm·h−1) from the GPM-DPR data along the satellite track crossing the typhoon center at 17:00 on 6 July (the cross line between the section and the Earth is the solid red line in Figure 3d; the latitude of the TC center is marked with a red triangle beneath the x-coordinate).
Atmosphere 14 00440 g005
Figure 6. Radial distribution of tangential mean precipitation intensity (a) mm h−1 and mean reflectivity (b) dBz within 500 km from the typhoon center based on the GPM-DPR data (17:00 on 6 July).
Atmosphere 14 00440 g006
Figure 7. Vertical profiles of the (a) radar reflectivity, (b) precipitation intensity, (c) particle number concentrations and (d) particle diameters from the GPM satellite data. The dashed red line represents the 0 °C layer, and the black lines denote the range of 1 km above and below the 0 °C layer (17:00 on 6 July).
Atmosphere 14 00440 g007
Figure 8. Cloud type distribution on the vertical section of Typhoon Nangka at 17:00 on 6 July.
Atmosphere 14 00440 g008
Disclaimer/Publisher’s Note: The statements, opinions and data contained in all publications are solely those of the individual author(s) and contributor(s) and not of MDPI and/or the editor(s). MDPI and/or the editor(s) disclaim responsibility for any injury to people or property resulting from any ideas, methods, instructions or products referred to in the content.

