
Proton Exchange Membrane Fuel Cell as an Alternative to the Internal Combustion Engine for Emission Reduction: A Review on the Effect of Gas Flow Channel Structures

Abstract
:1. Introduction
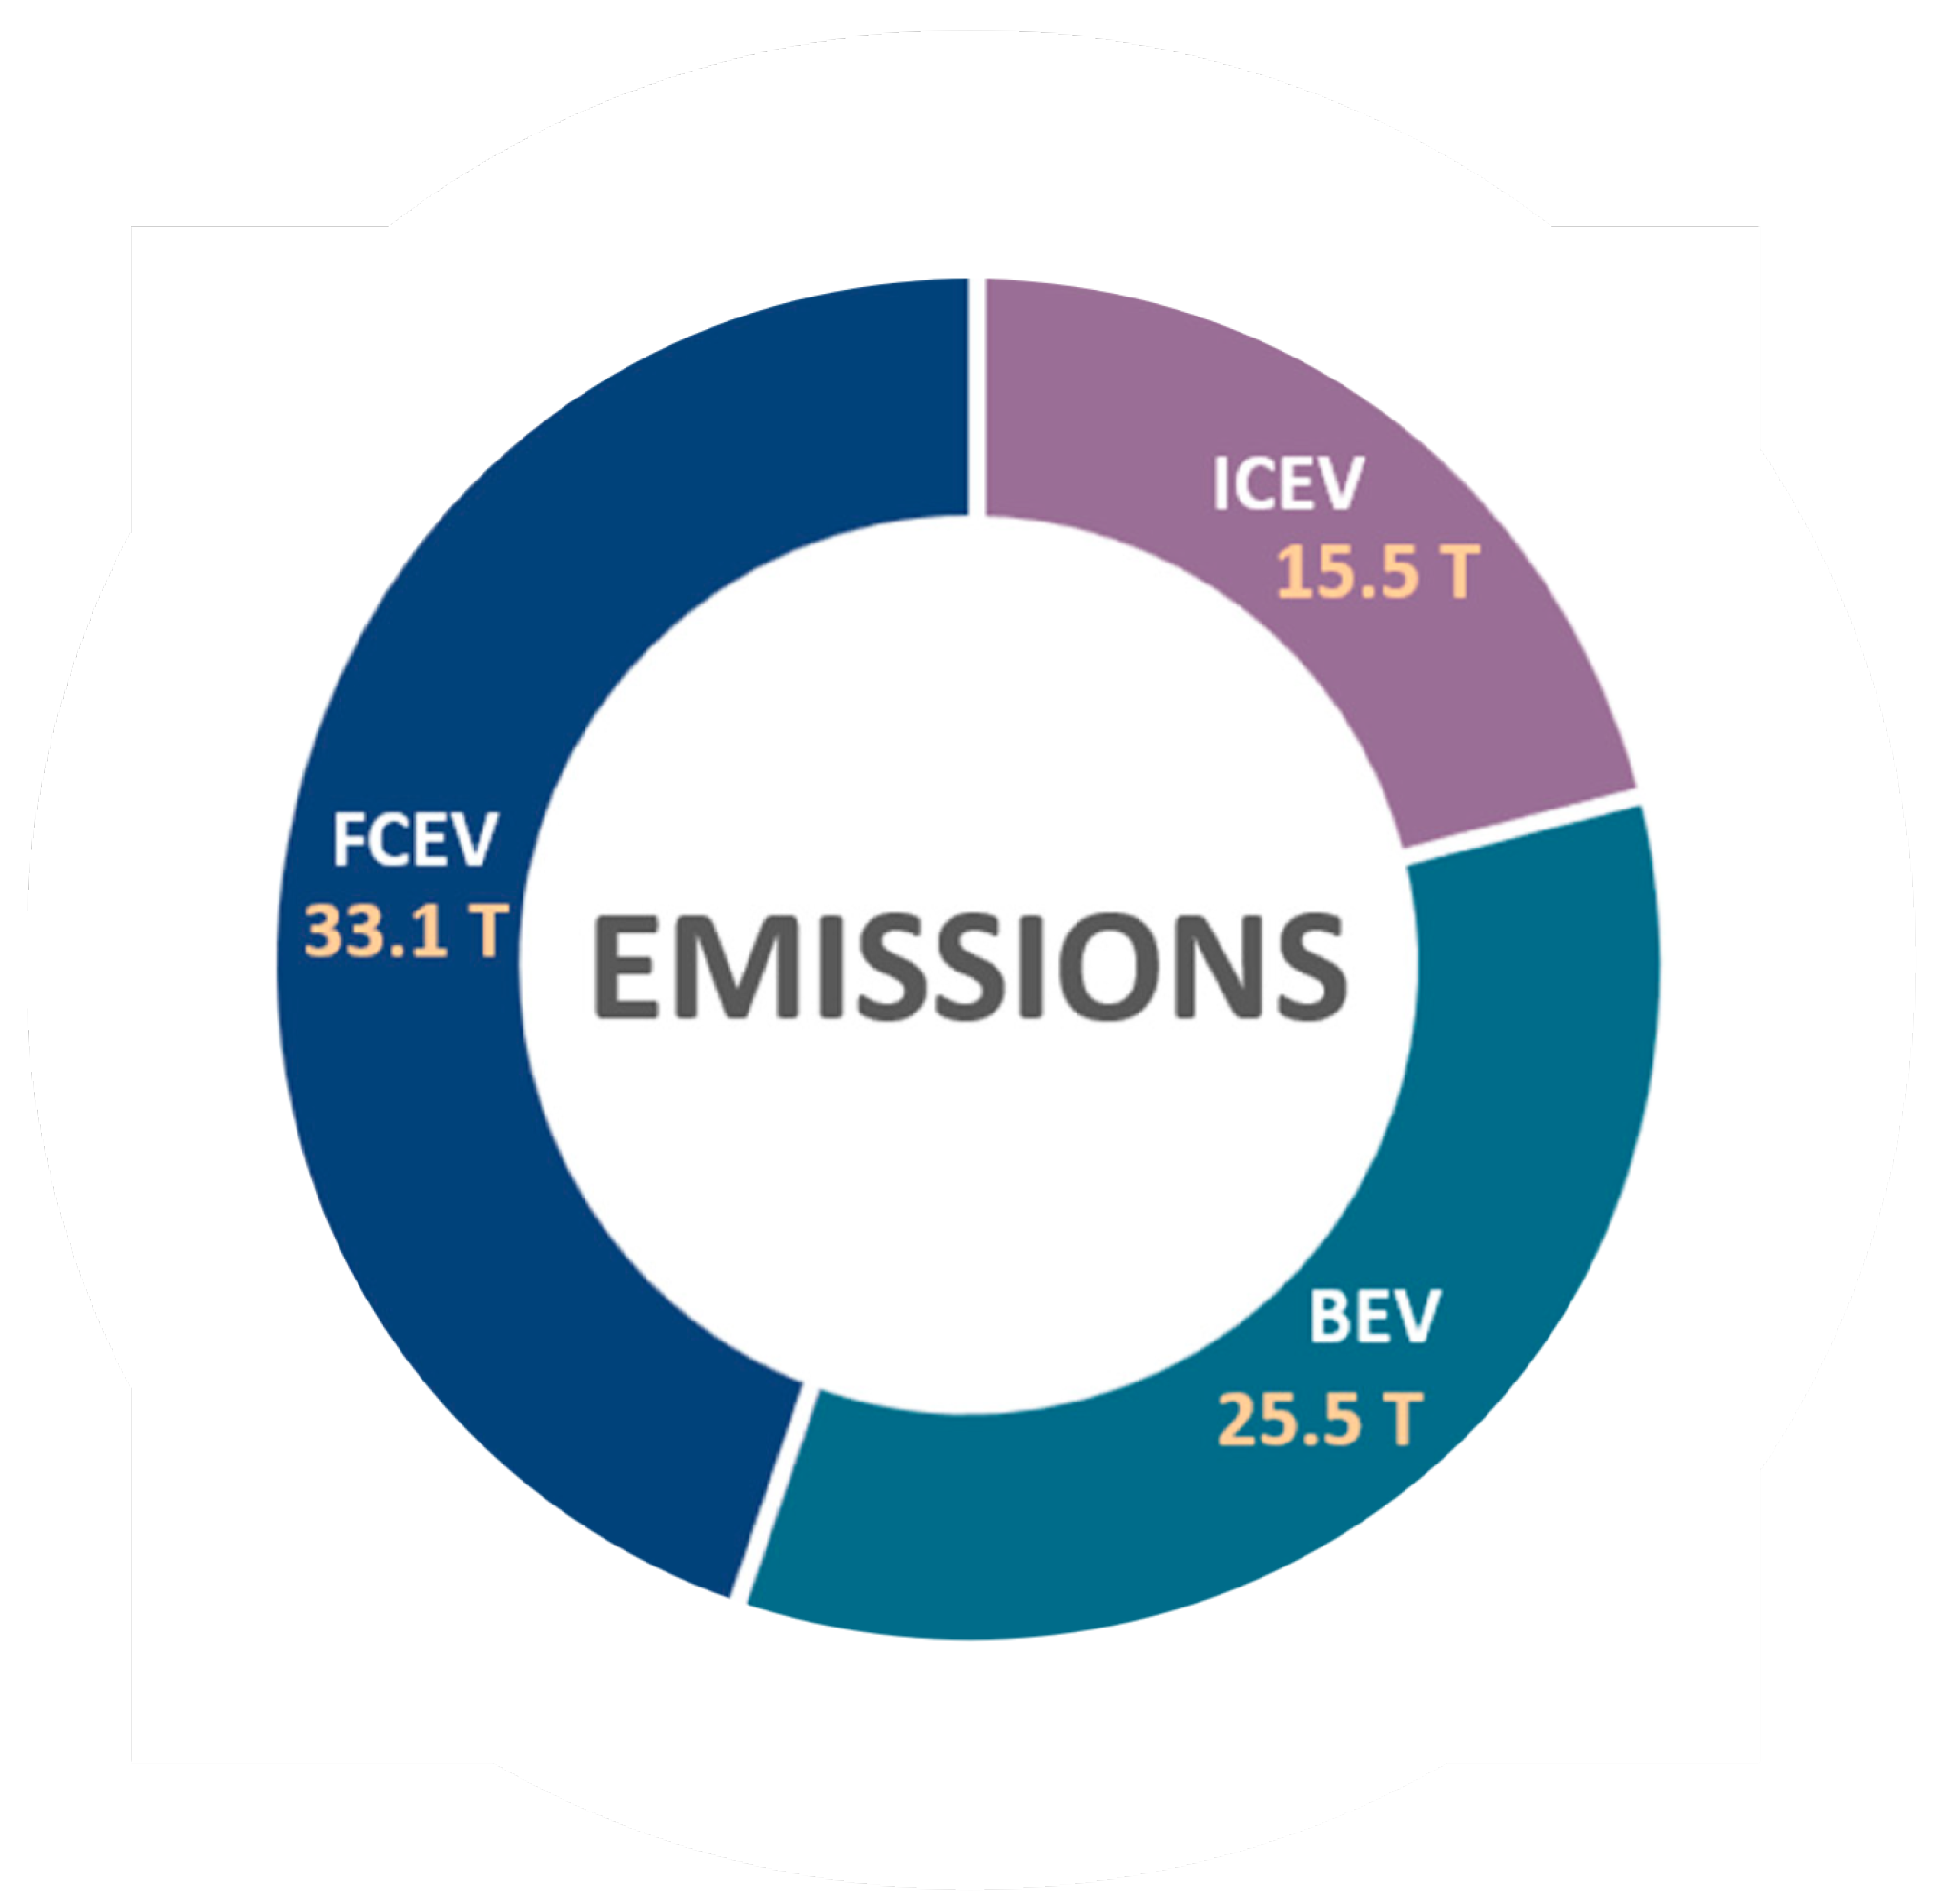
2. Comparison of Life-Cycle Emissions of Fuel Cell Electric Vehicles to Internal Combustion Engine Vehicles
3. Geometric Structure and Parameters of Gas Flow Channels
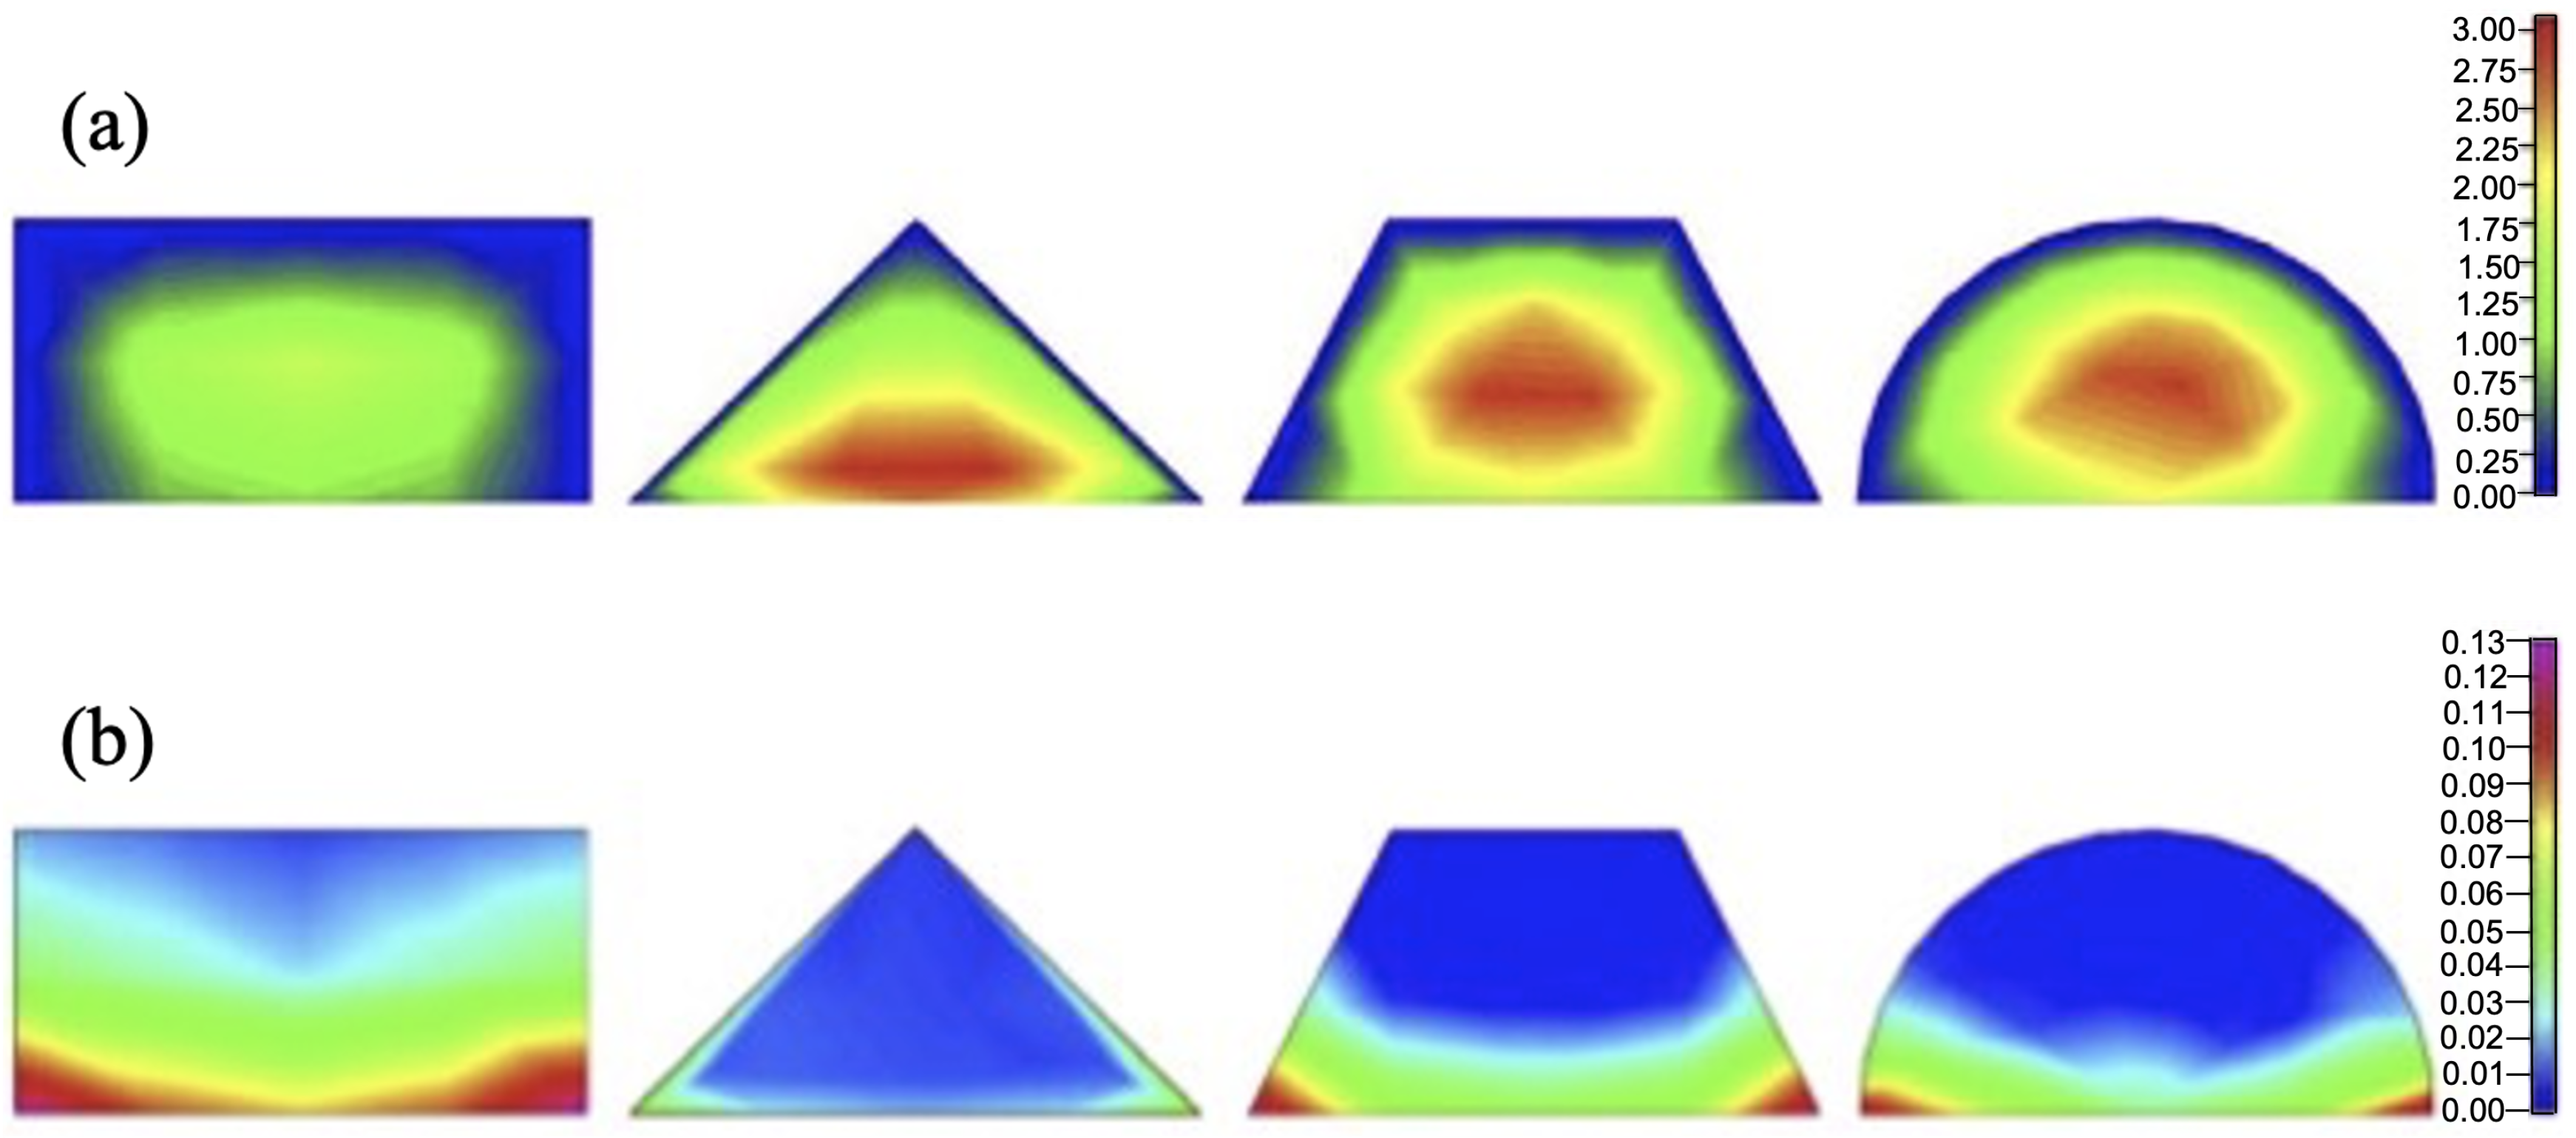
3.1. The Shape of the Channel Cross Section
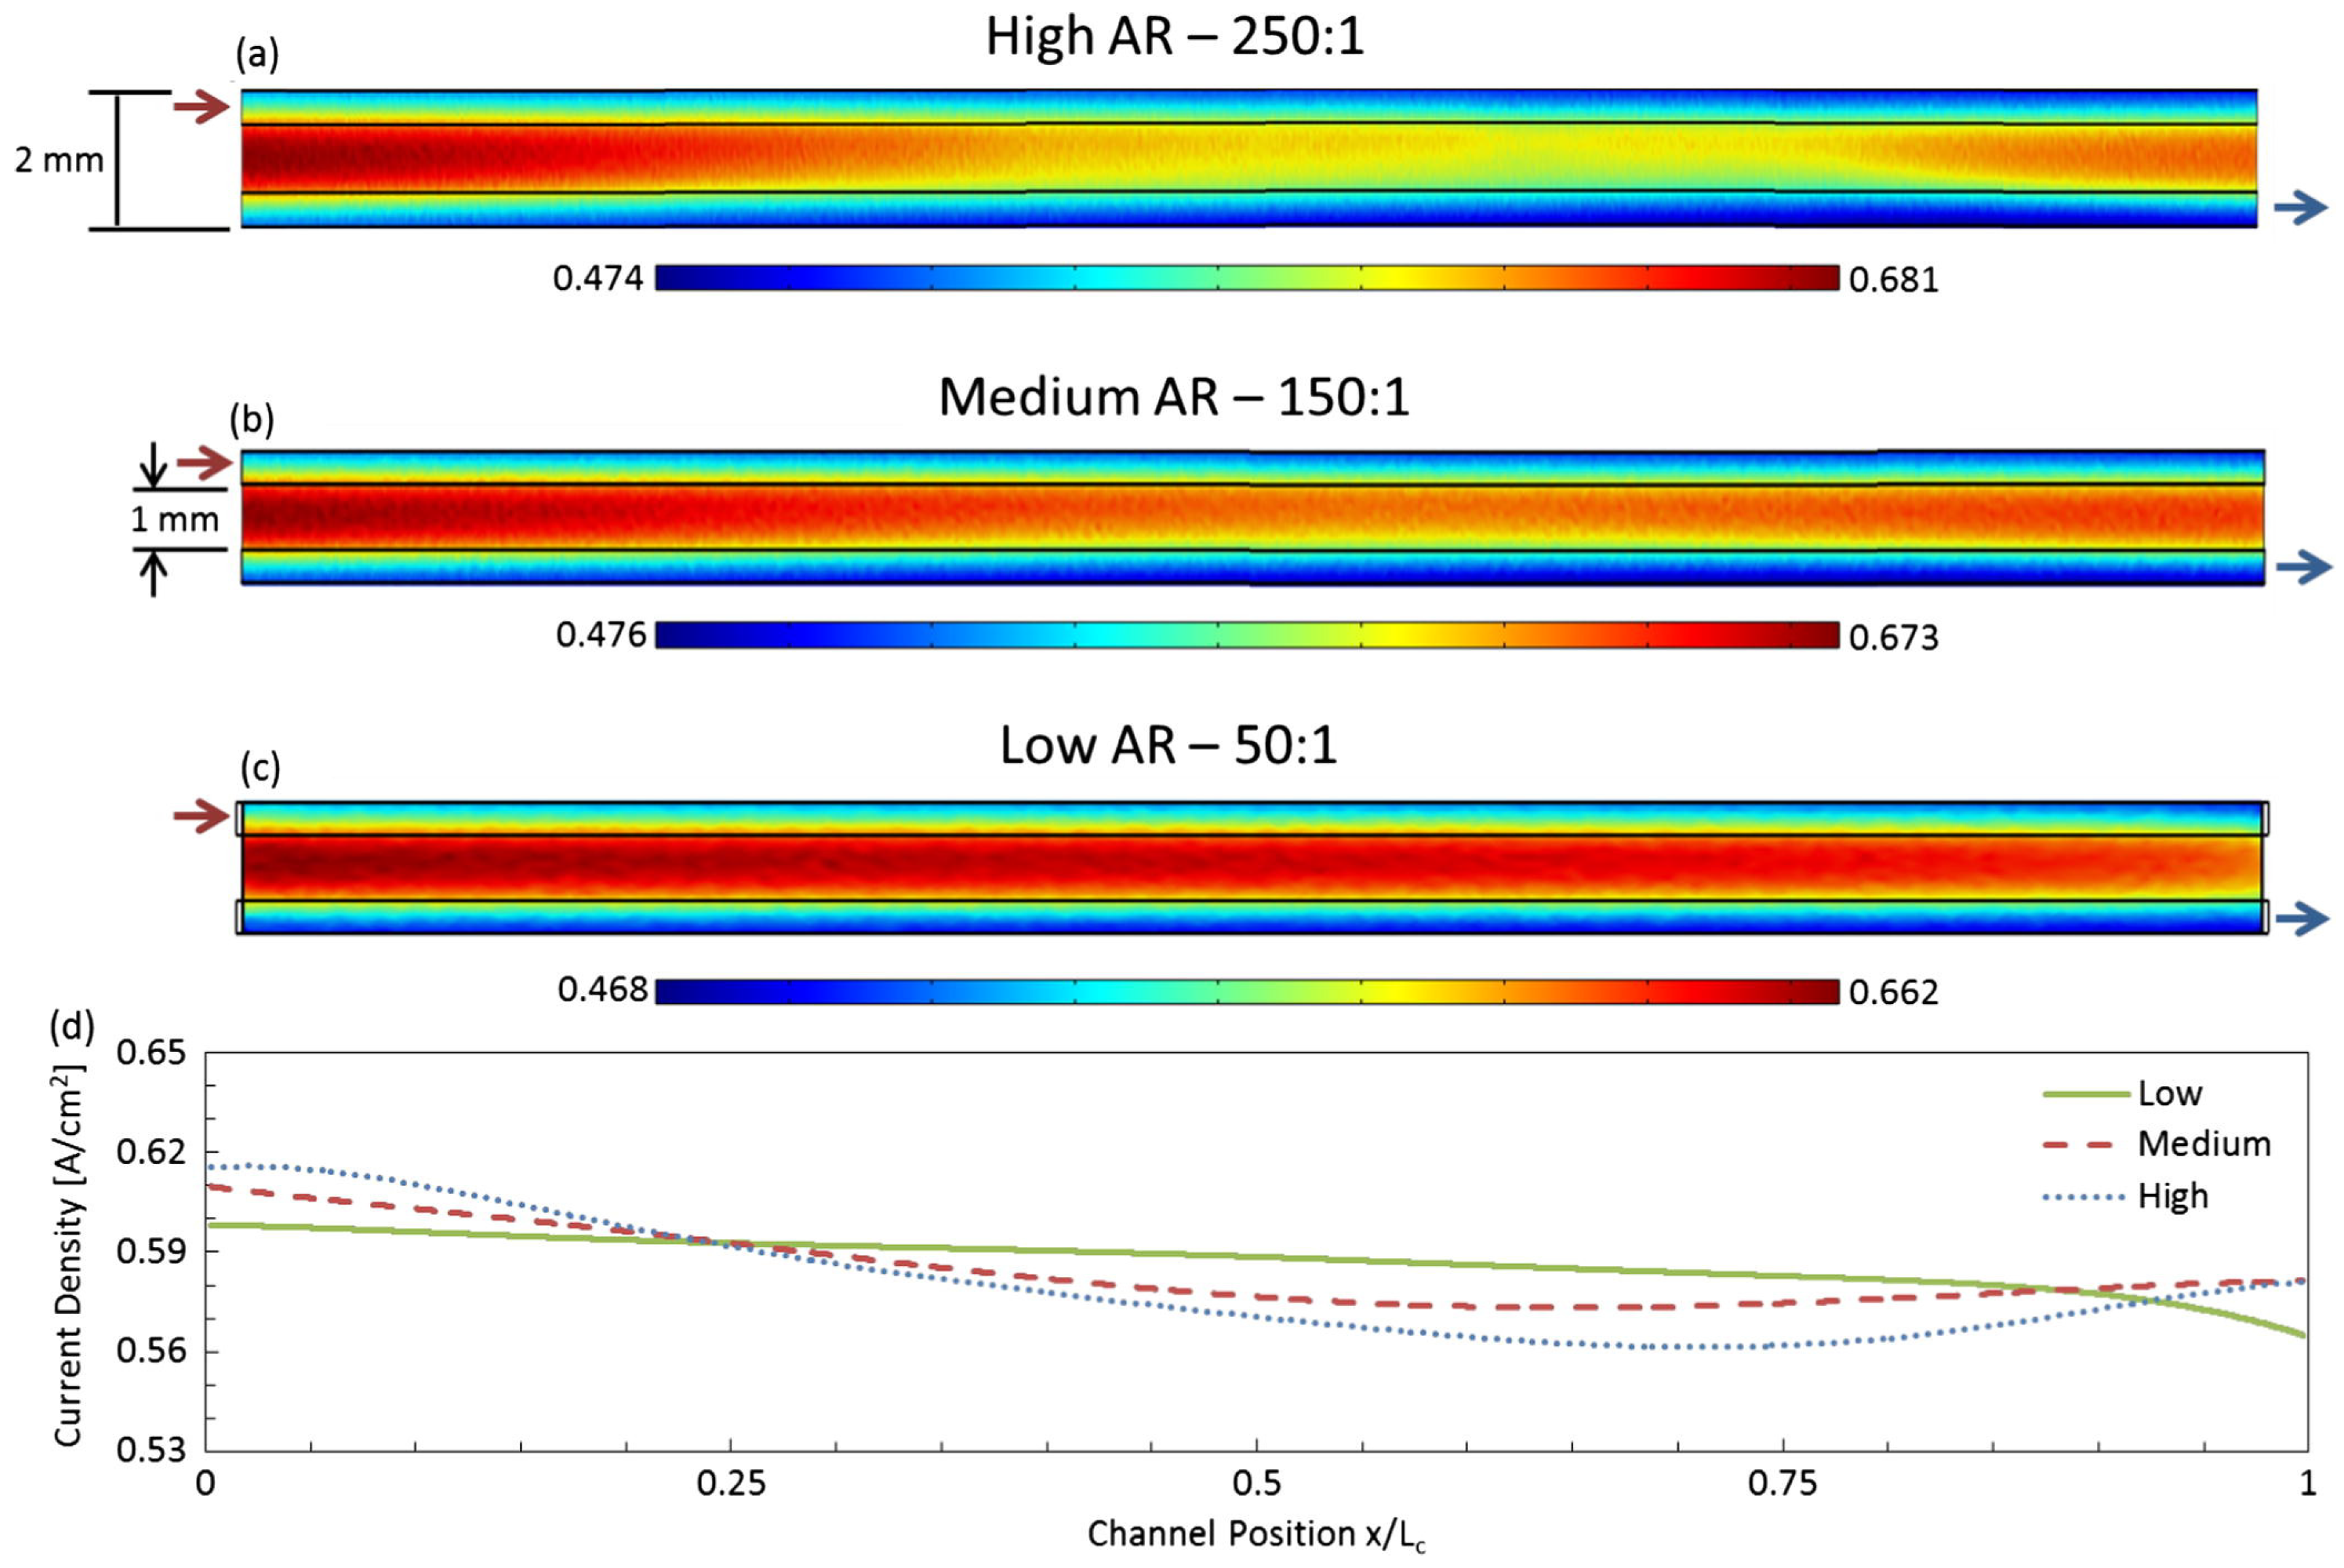
3.2. The Length and Width of the Flow Channel
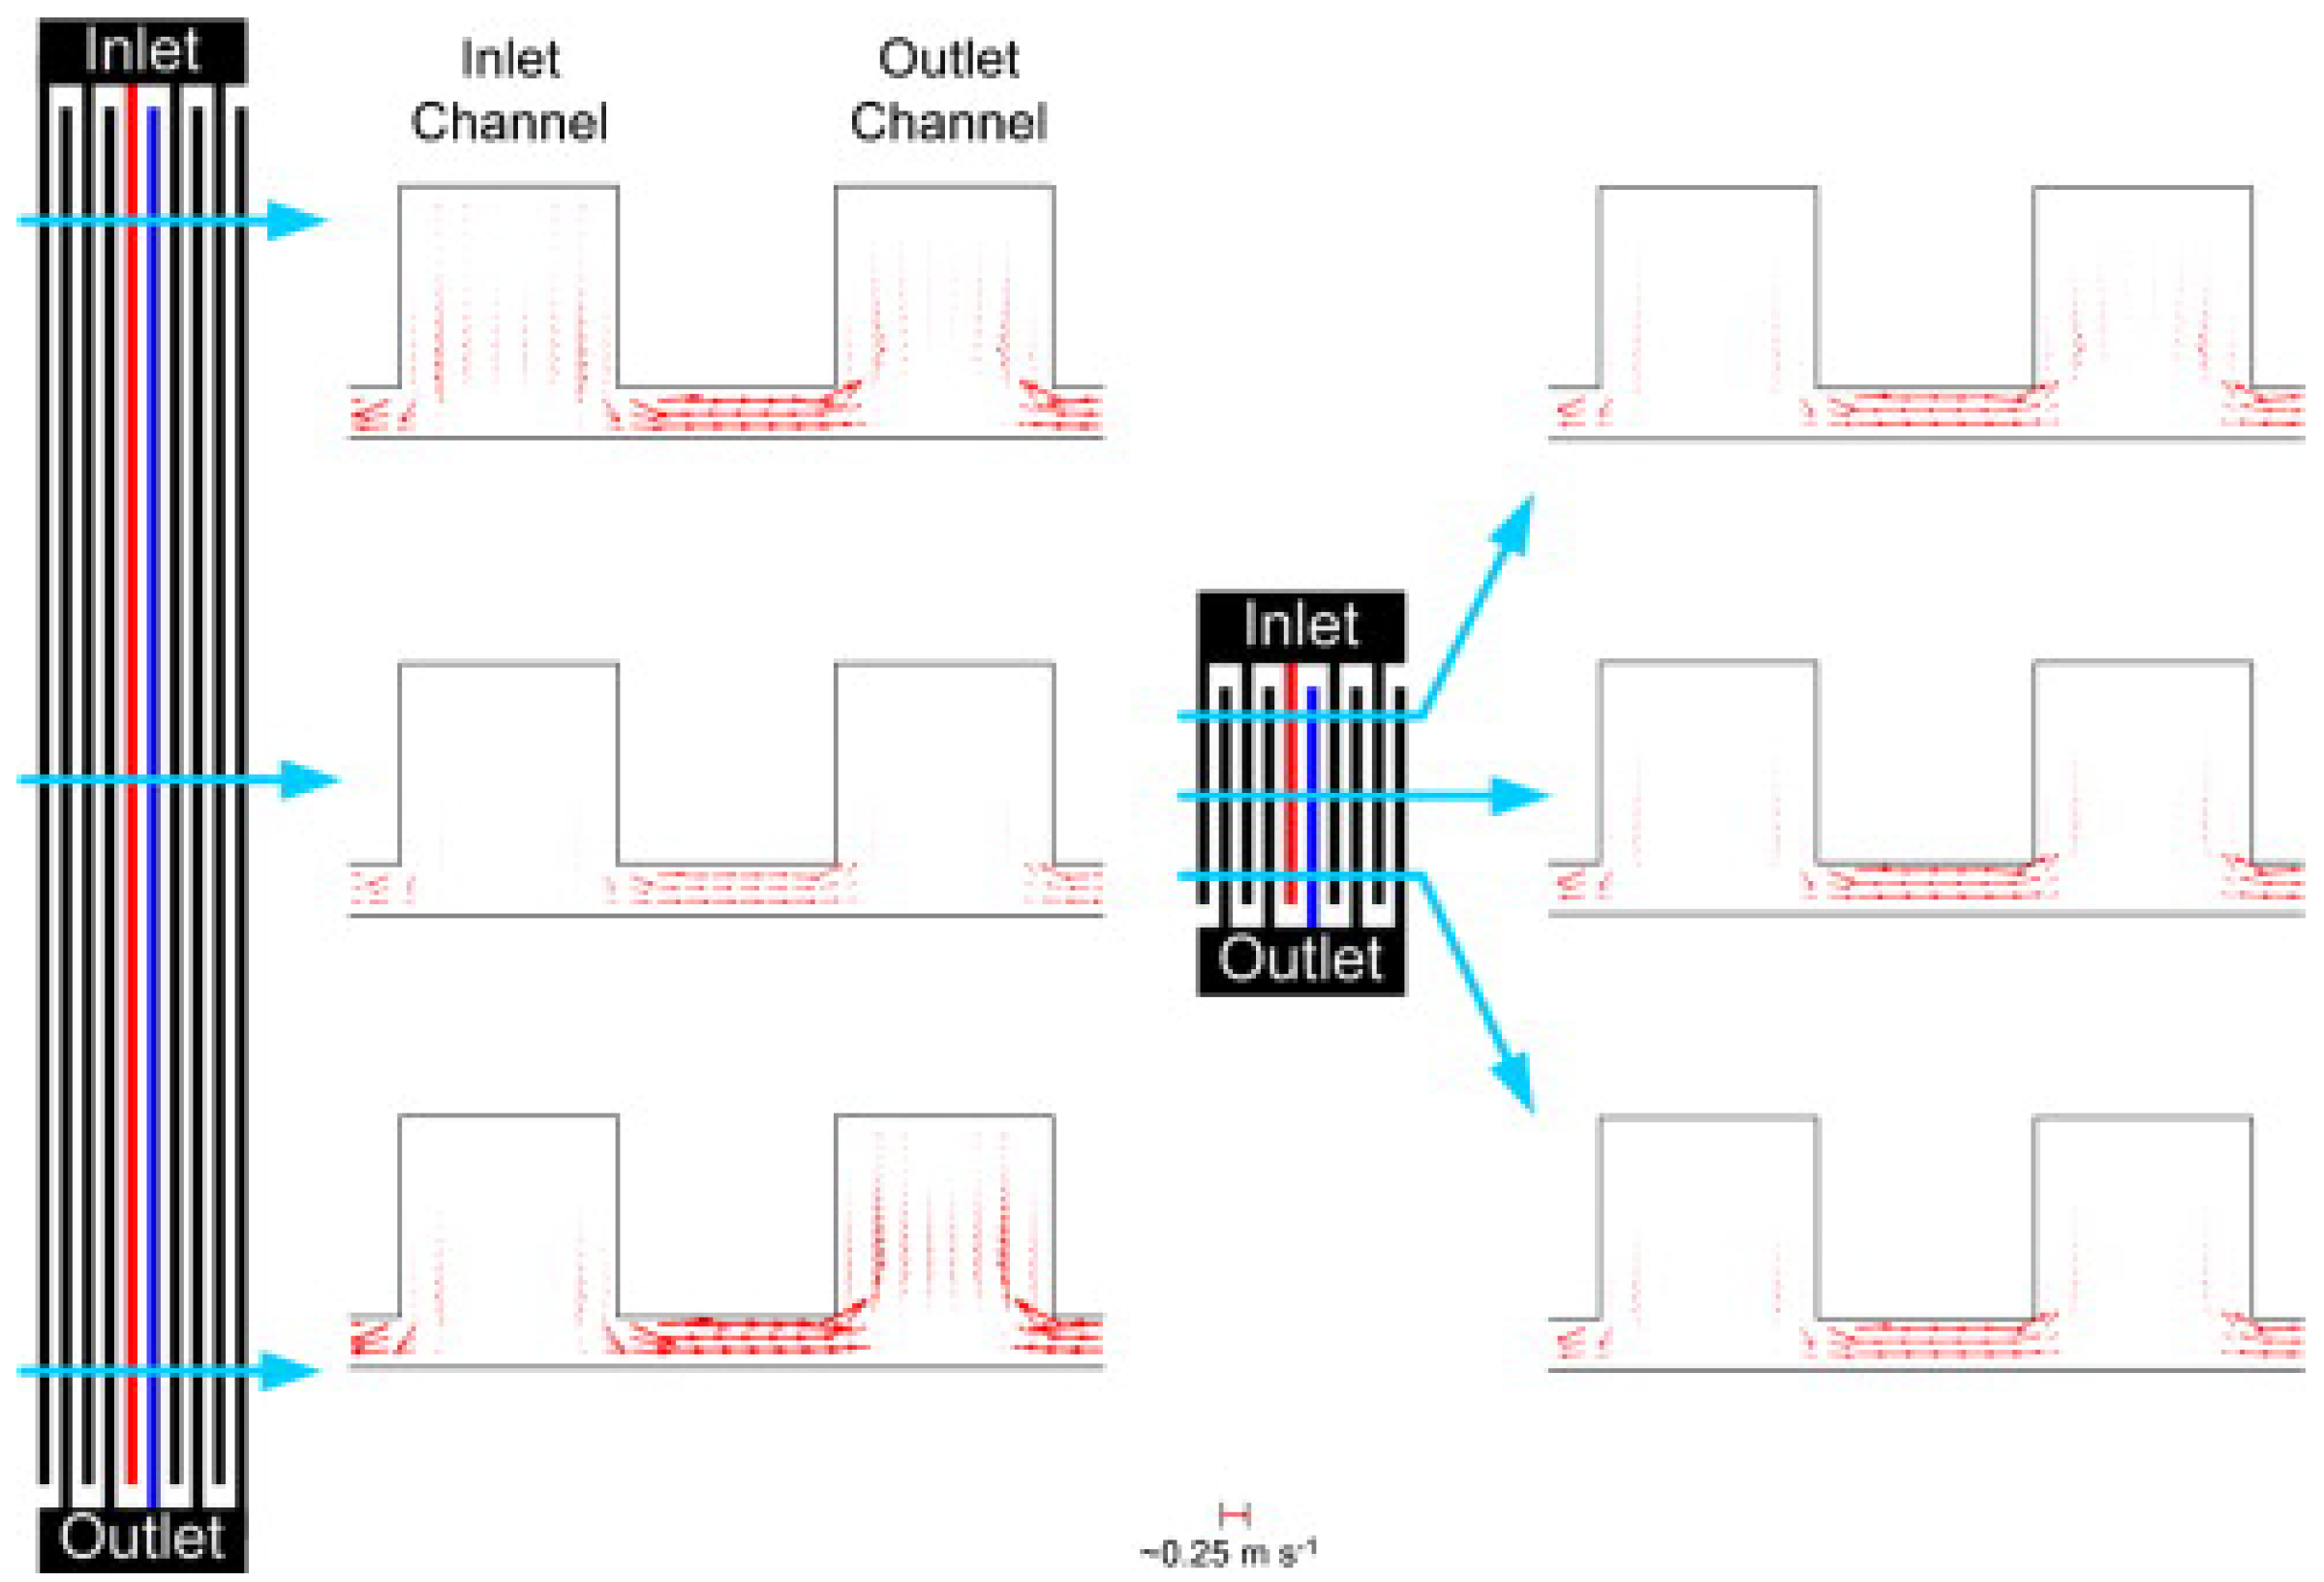
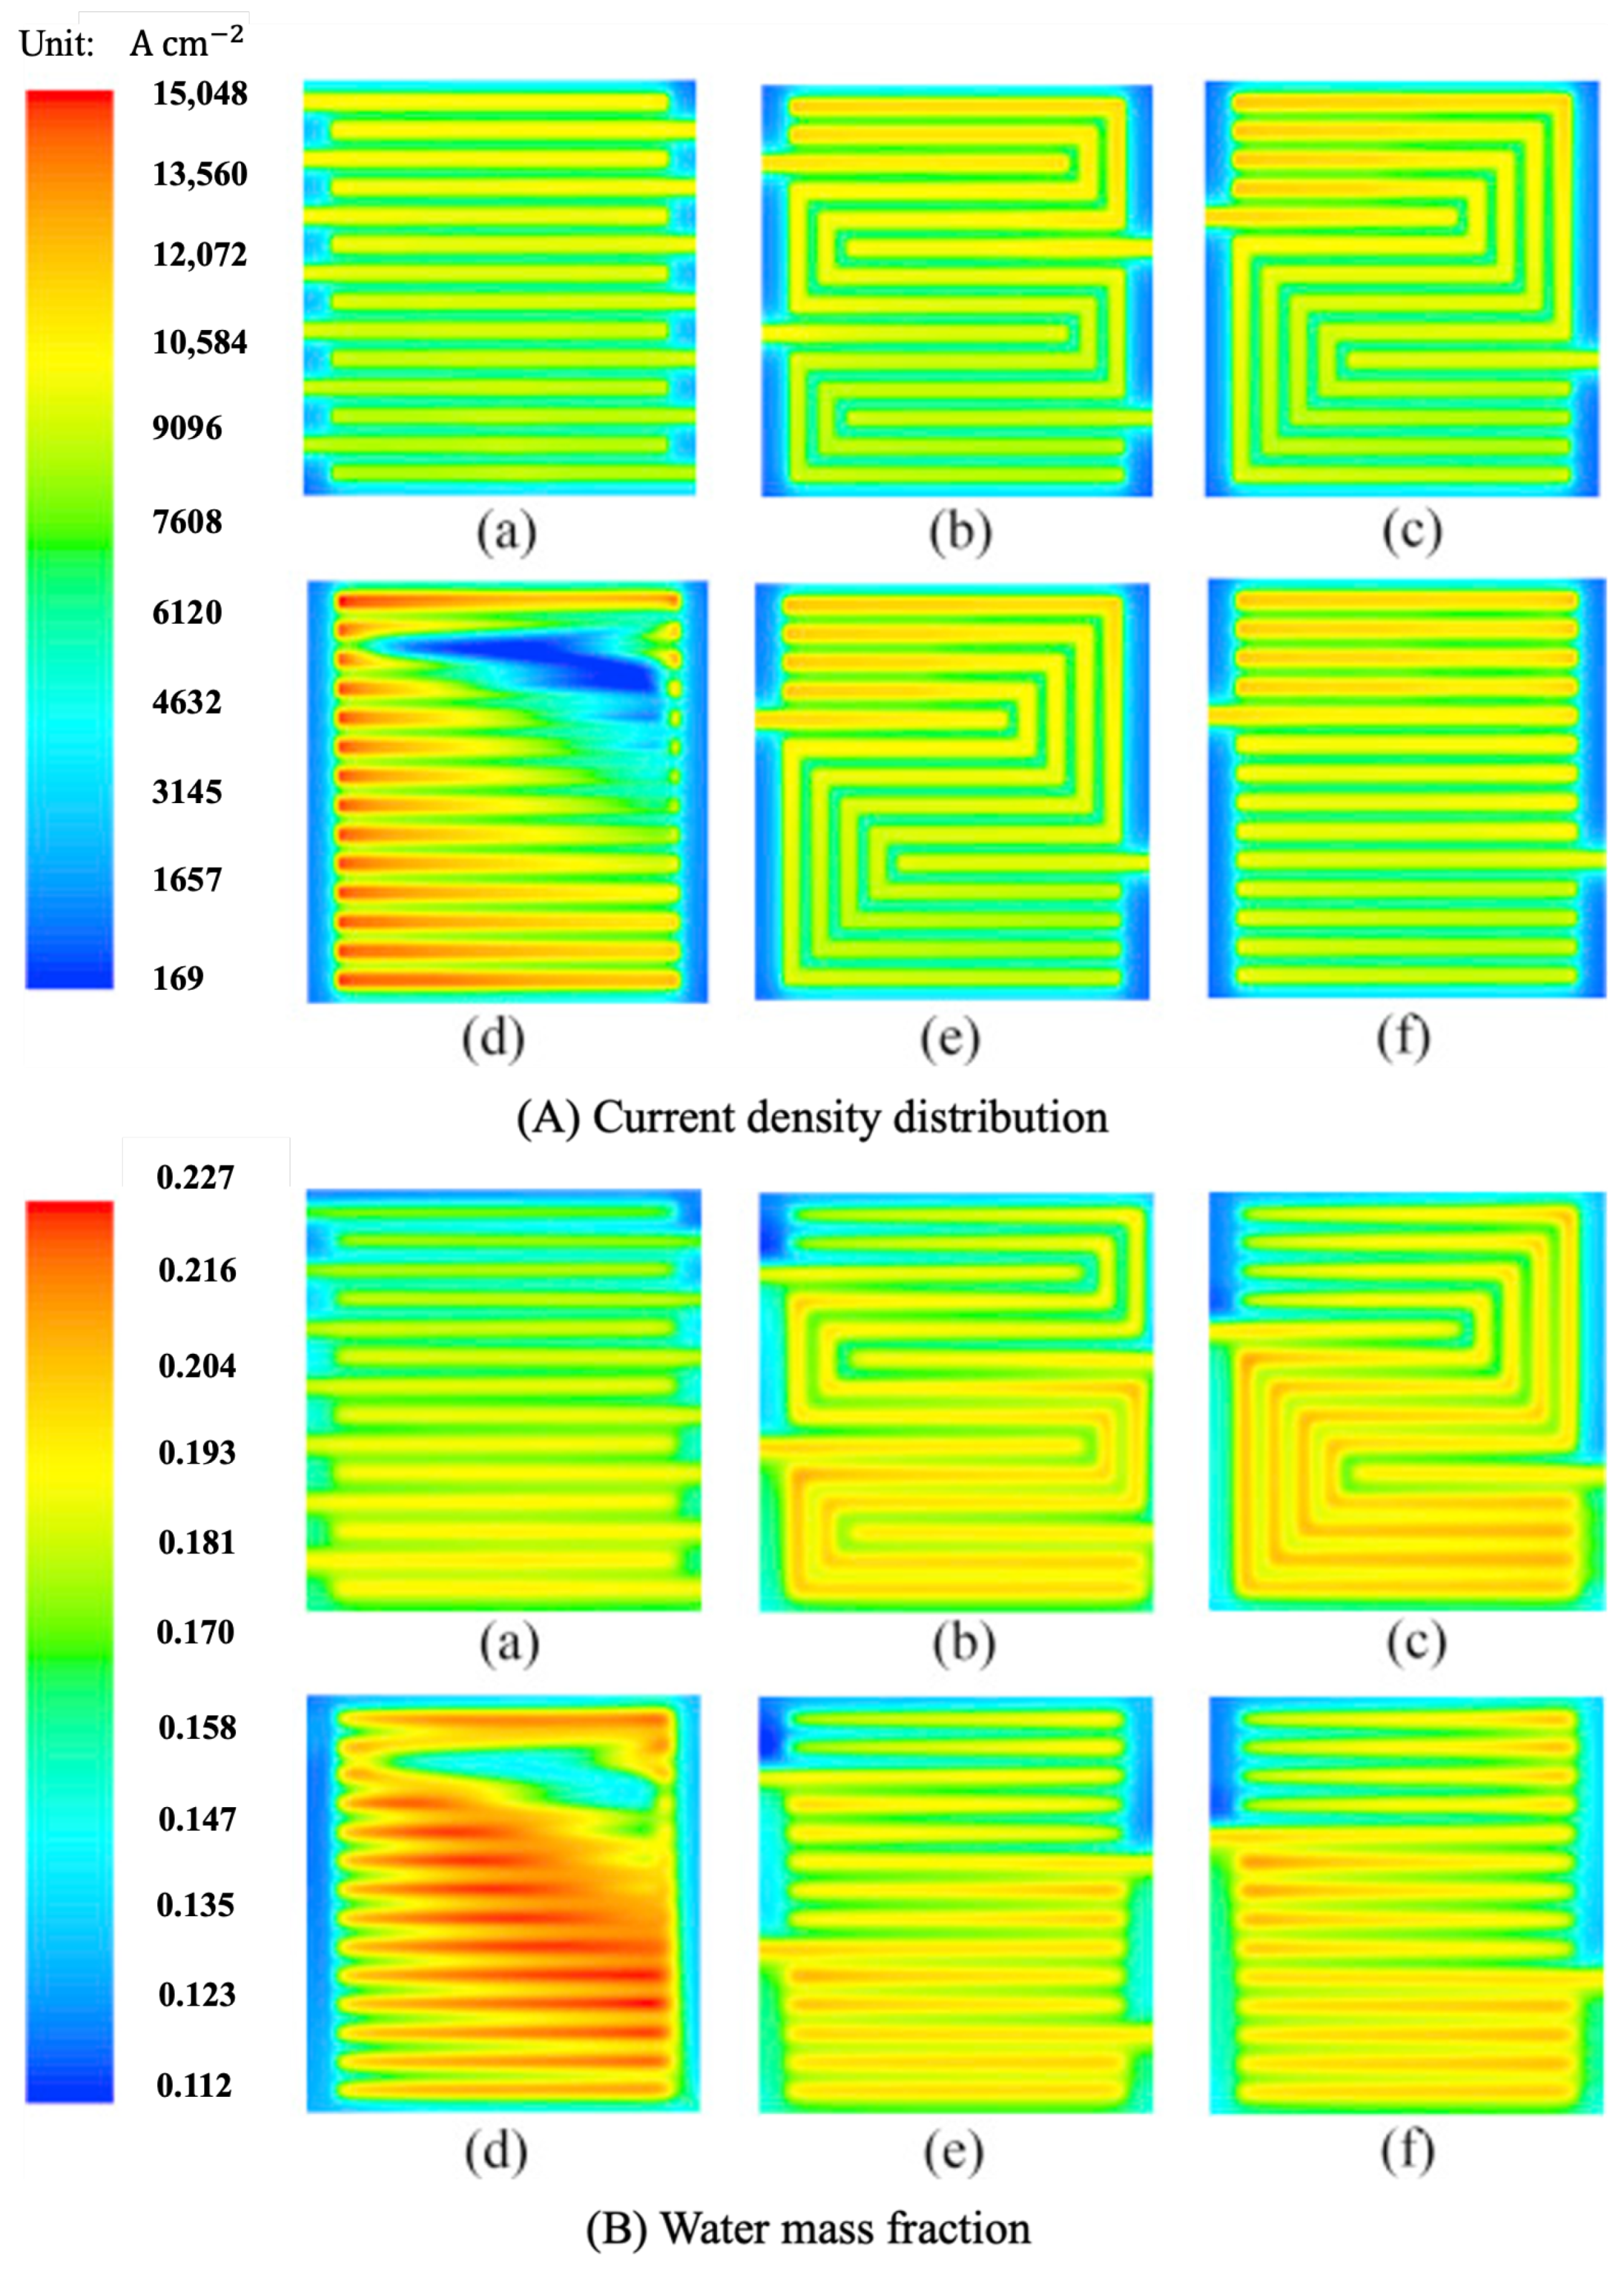
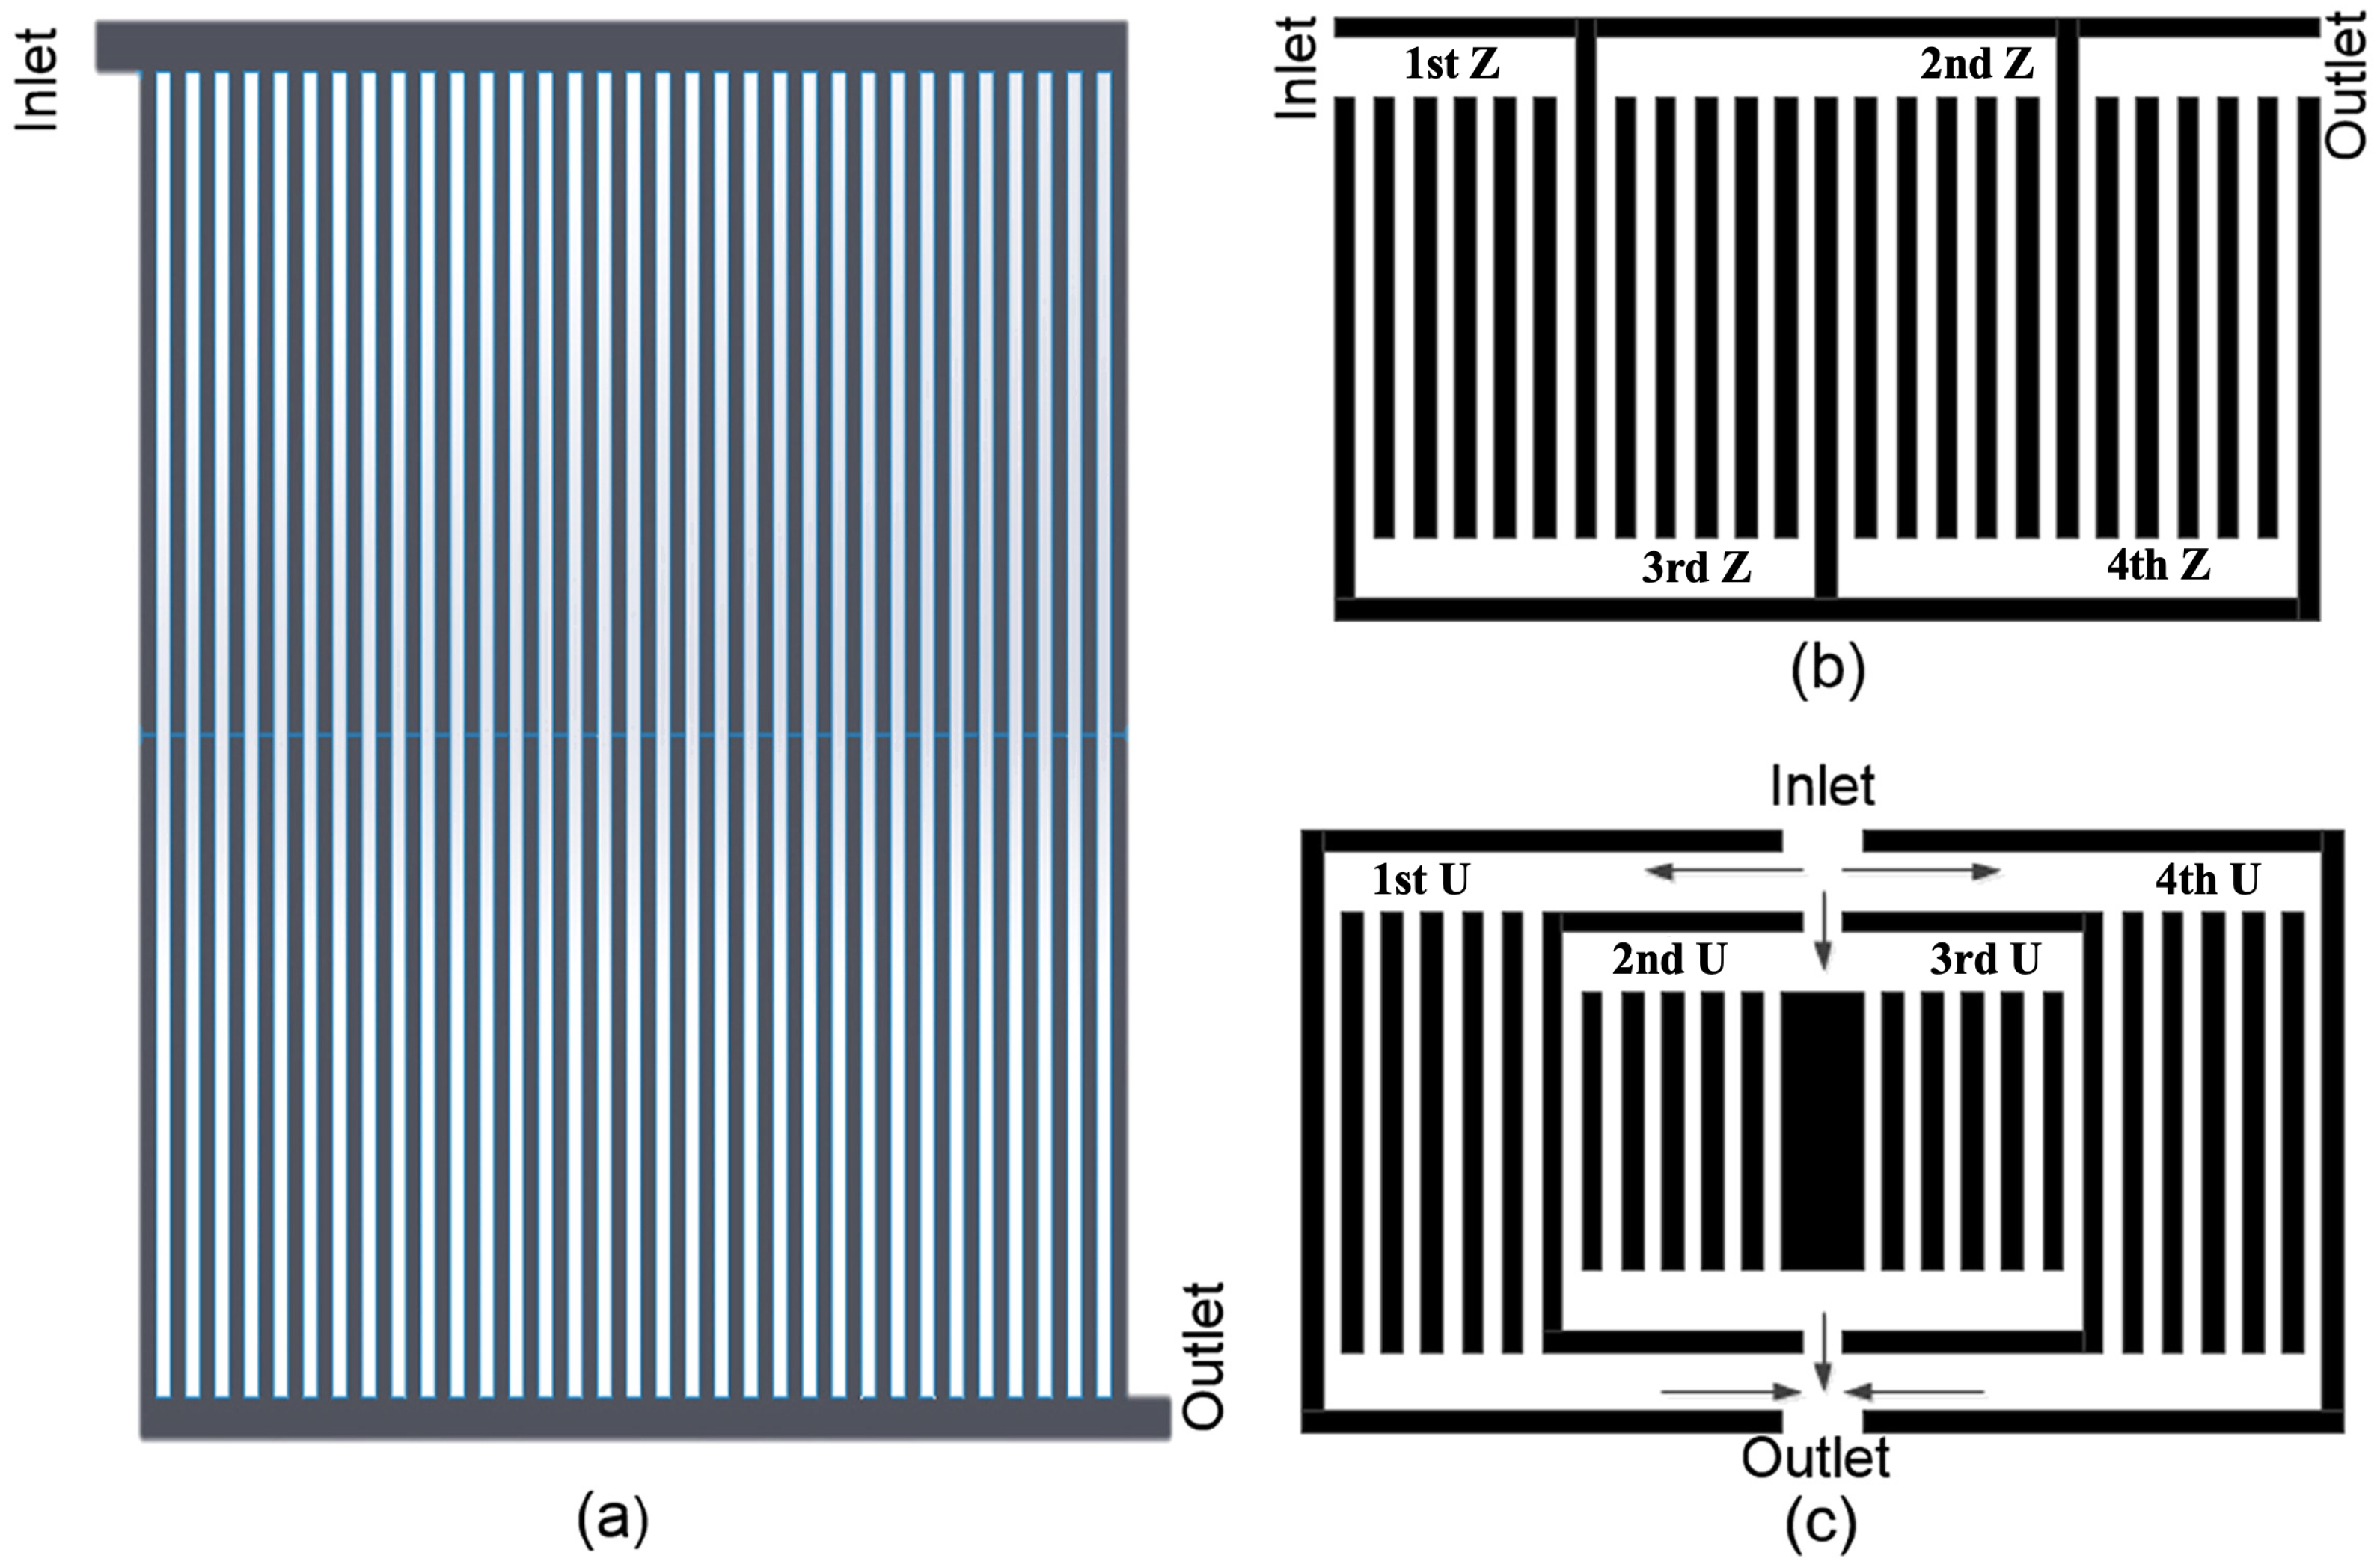
3.3. The Number of Gas Flow Channels
3.4. Headers at the Inlet and Outlet
4. Morphing in Flow Field Design
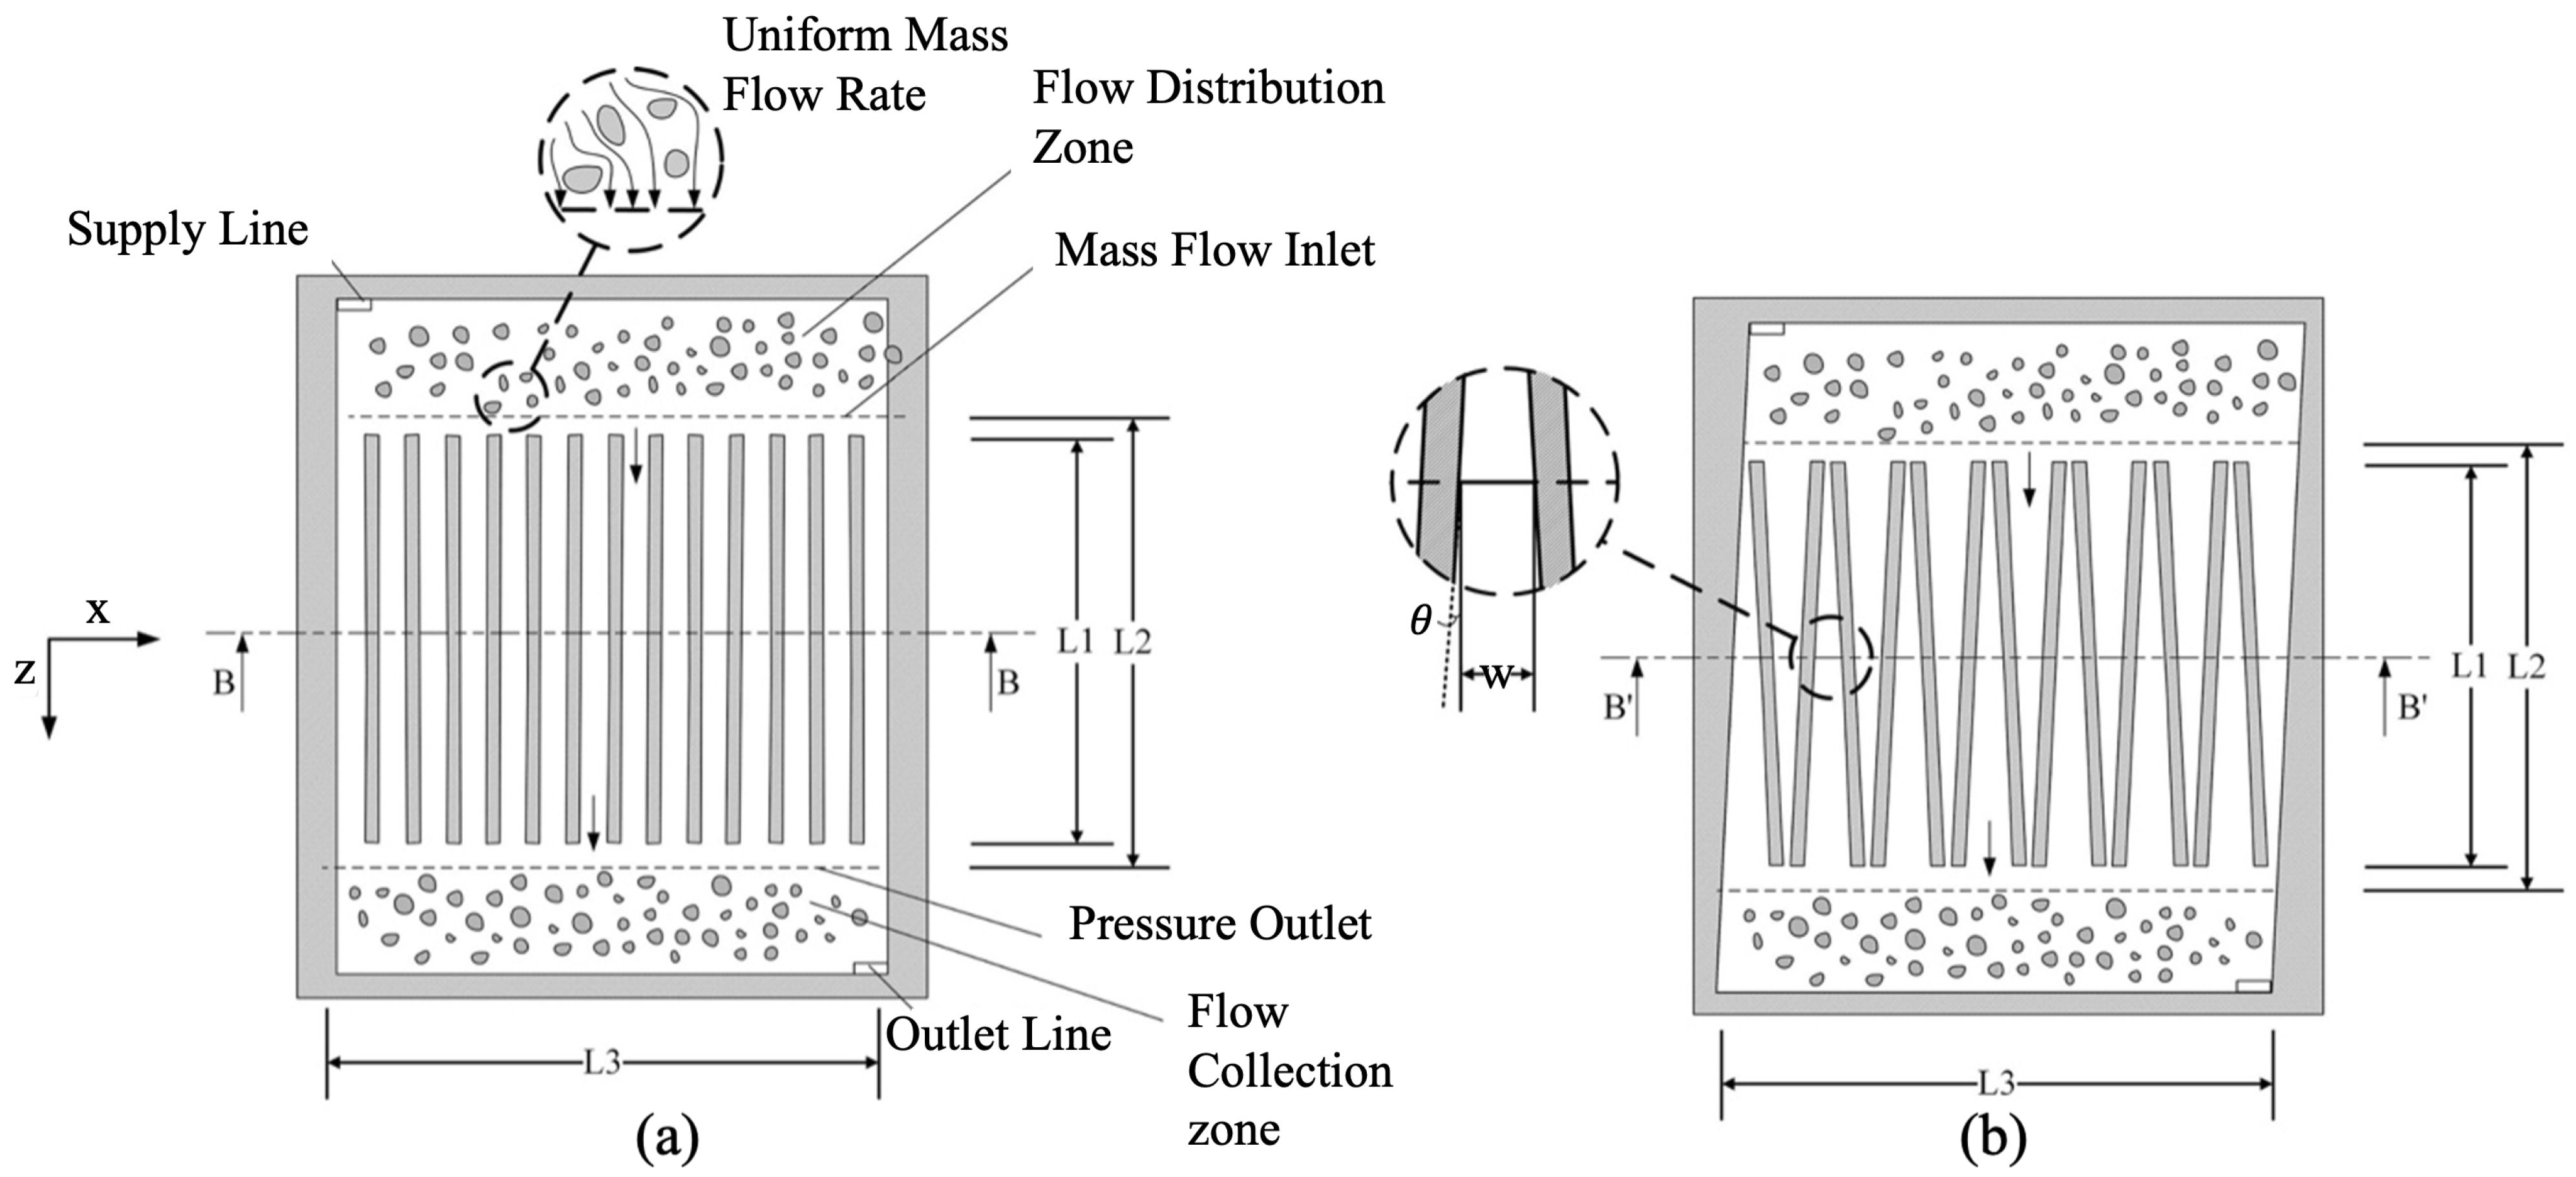
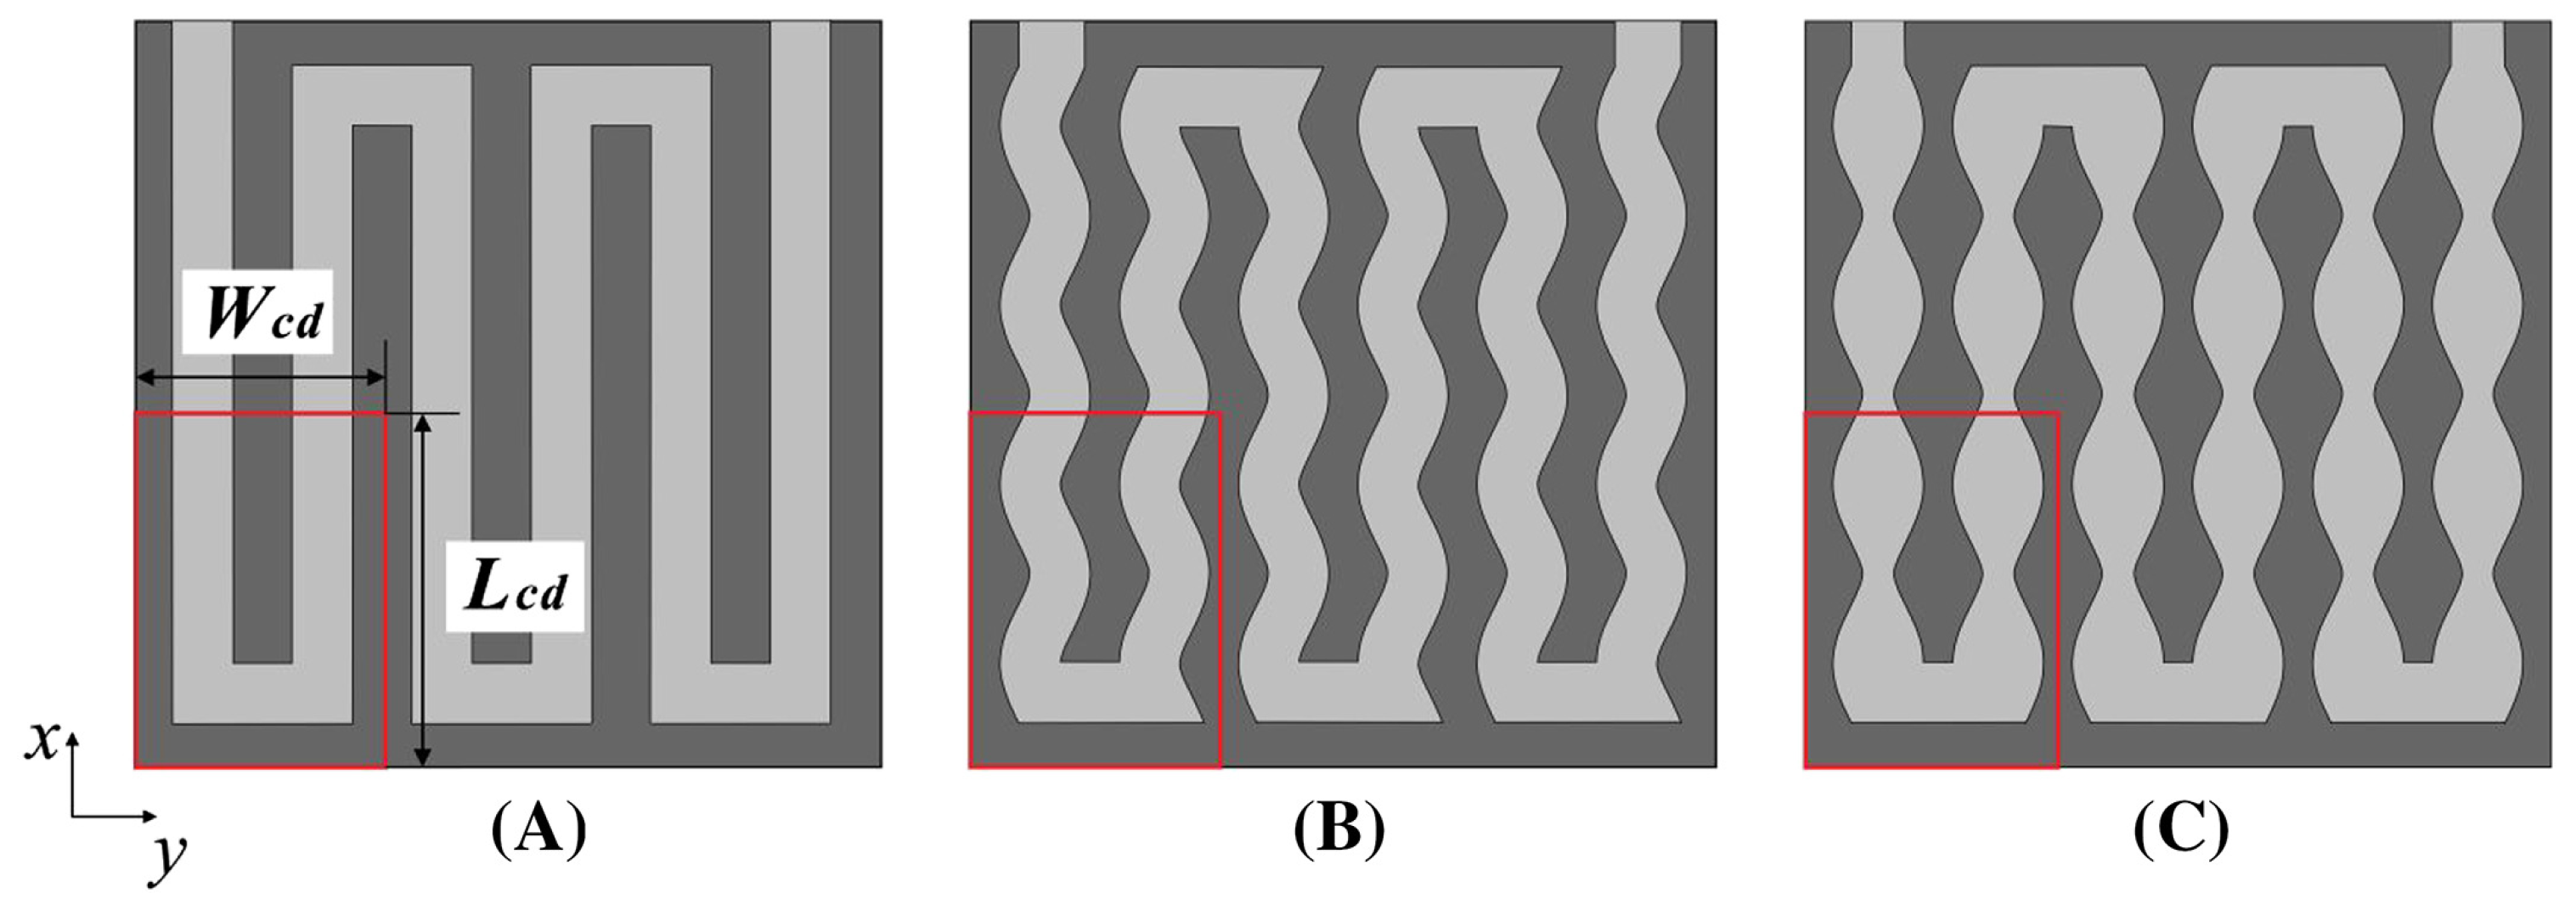
4.1. Design of Tortuous Flow Channels
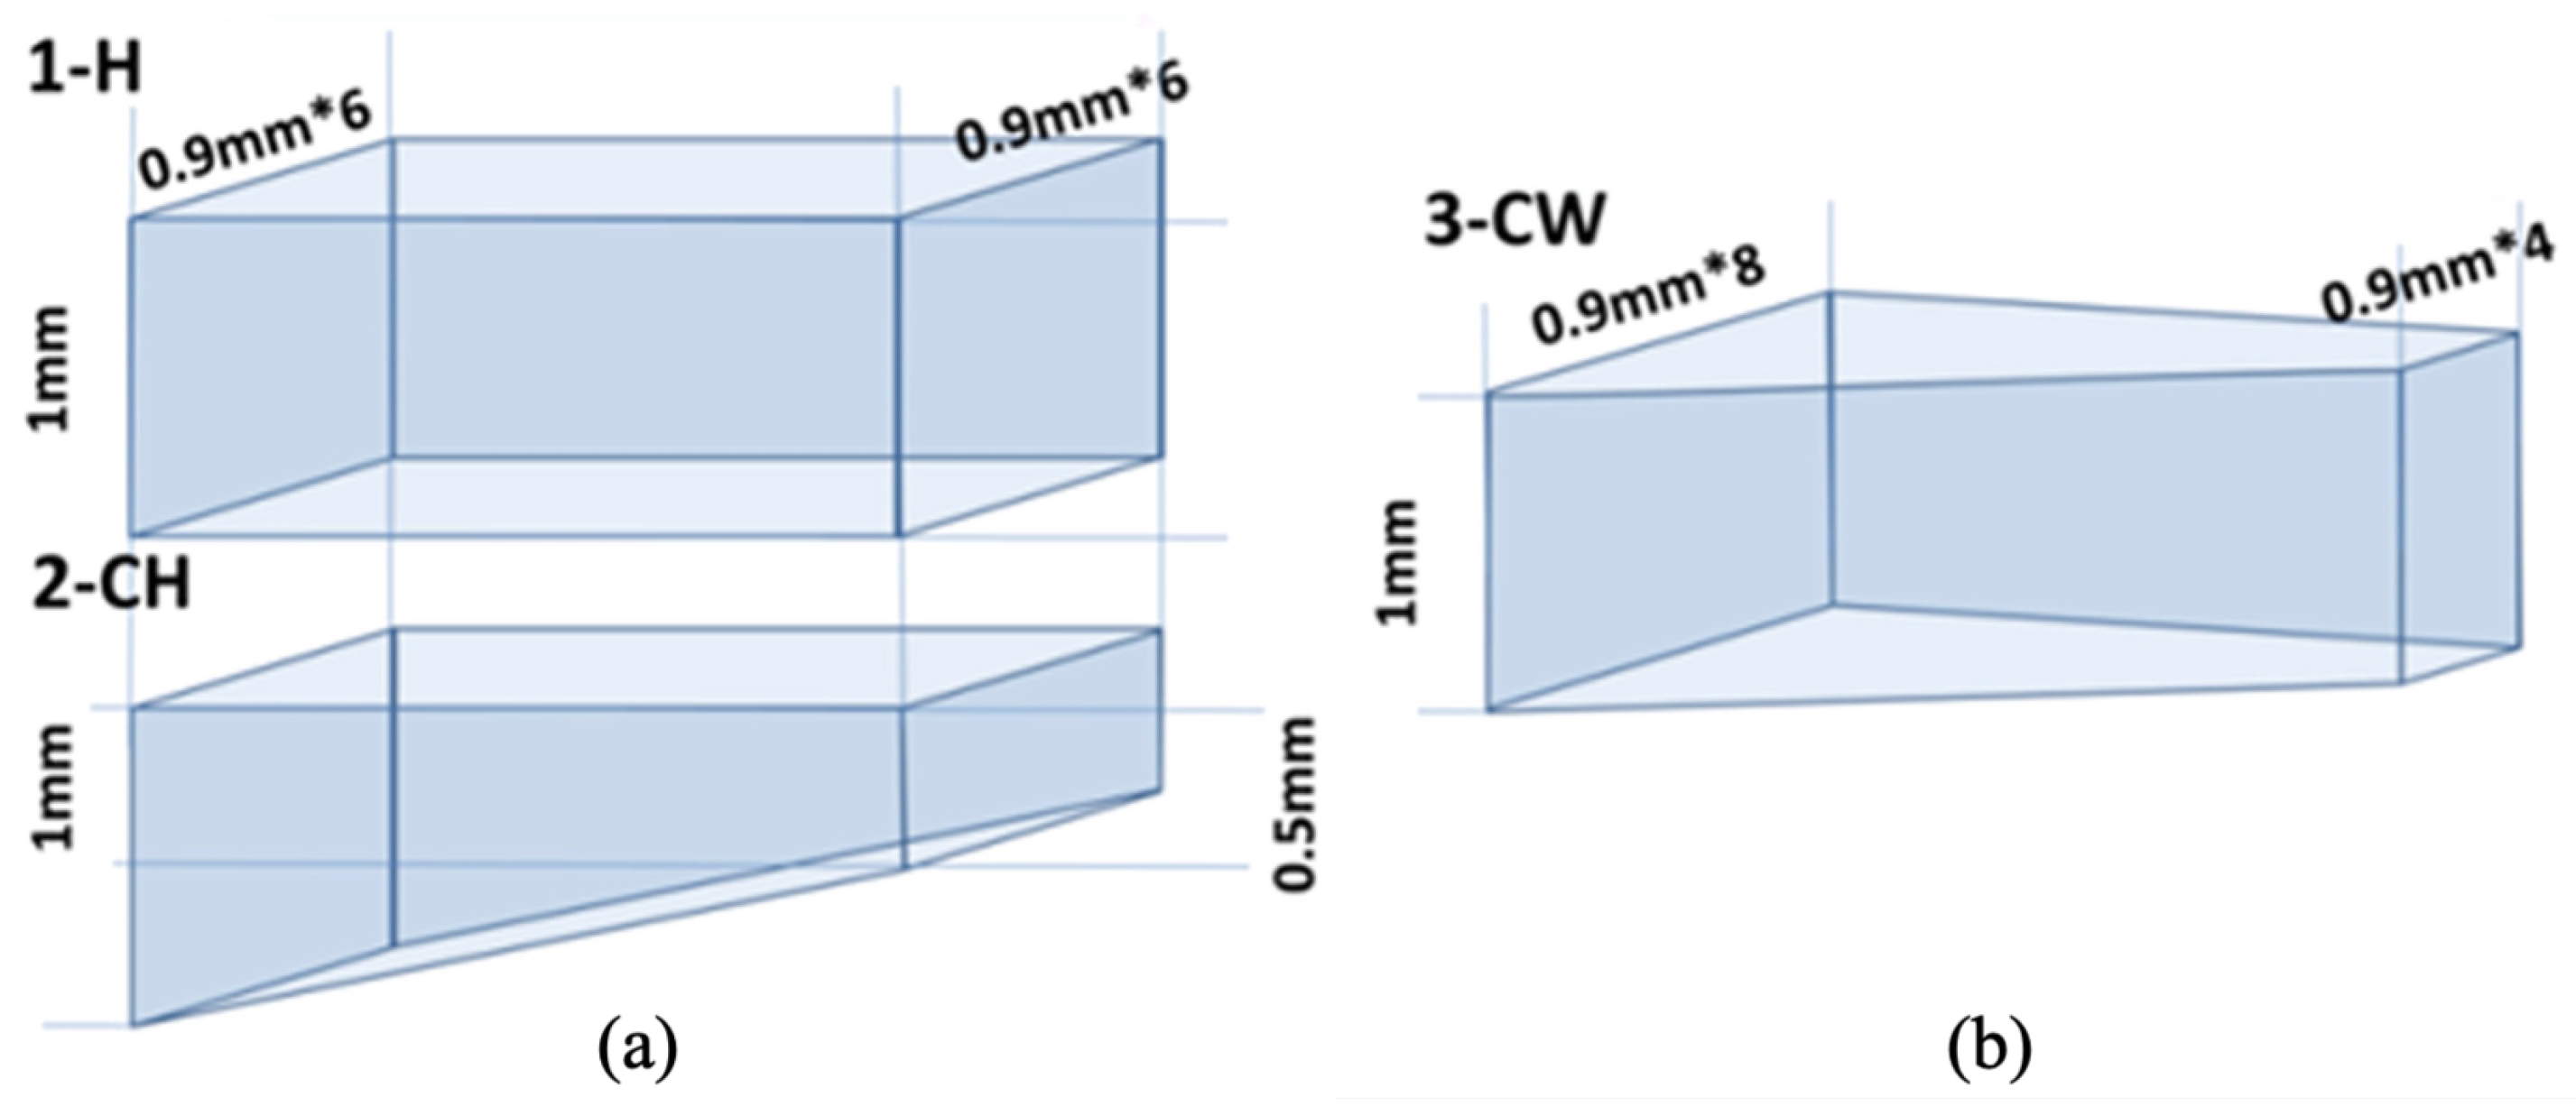
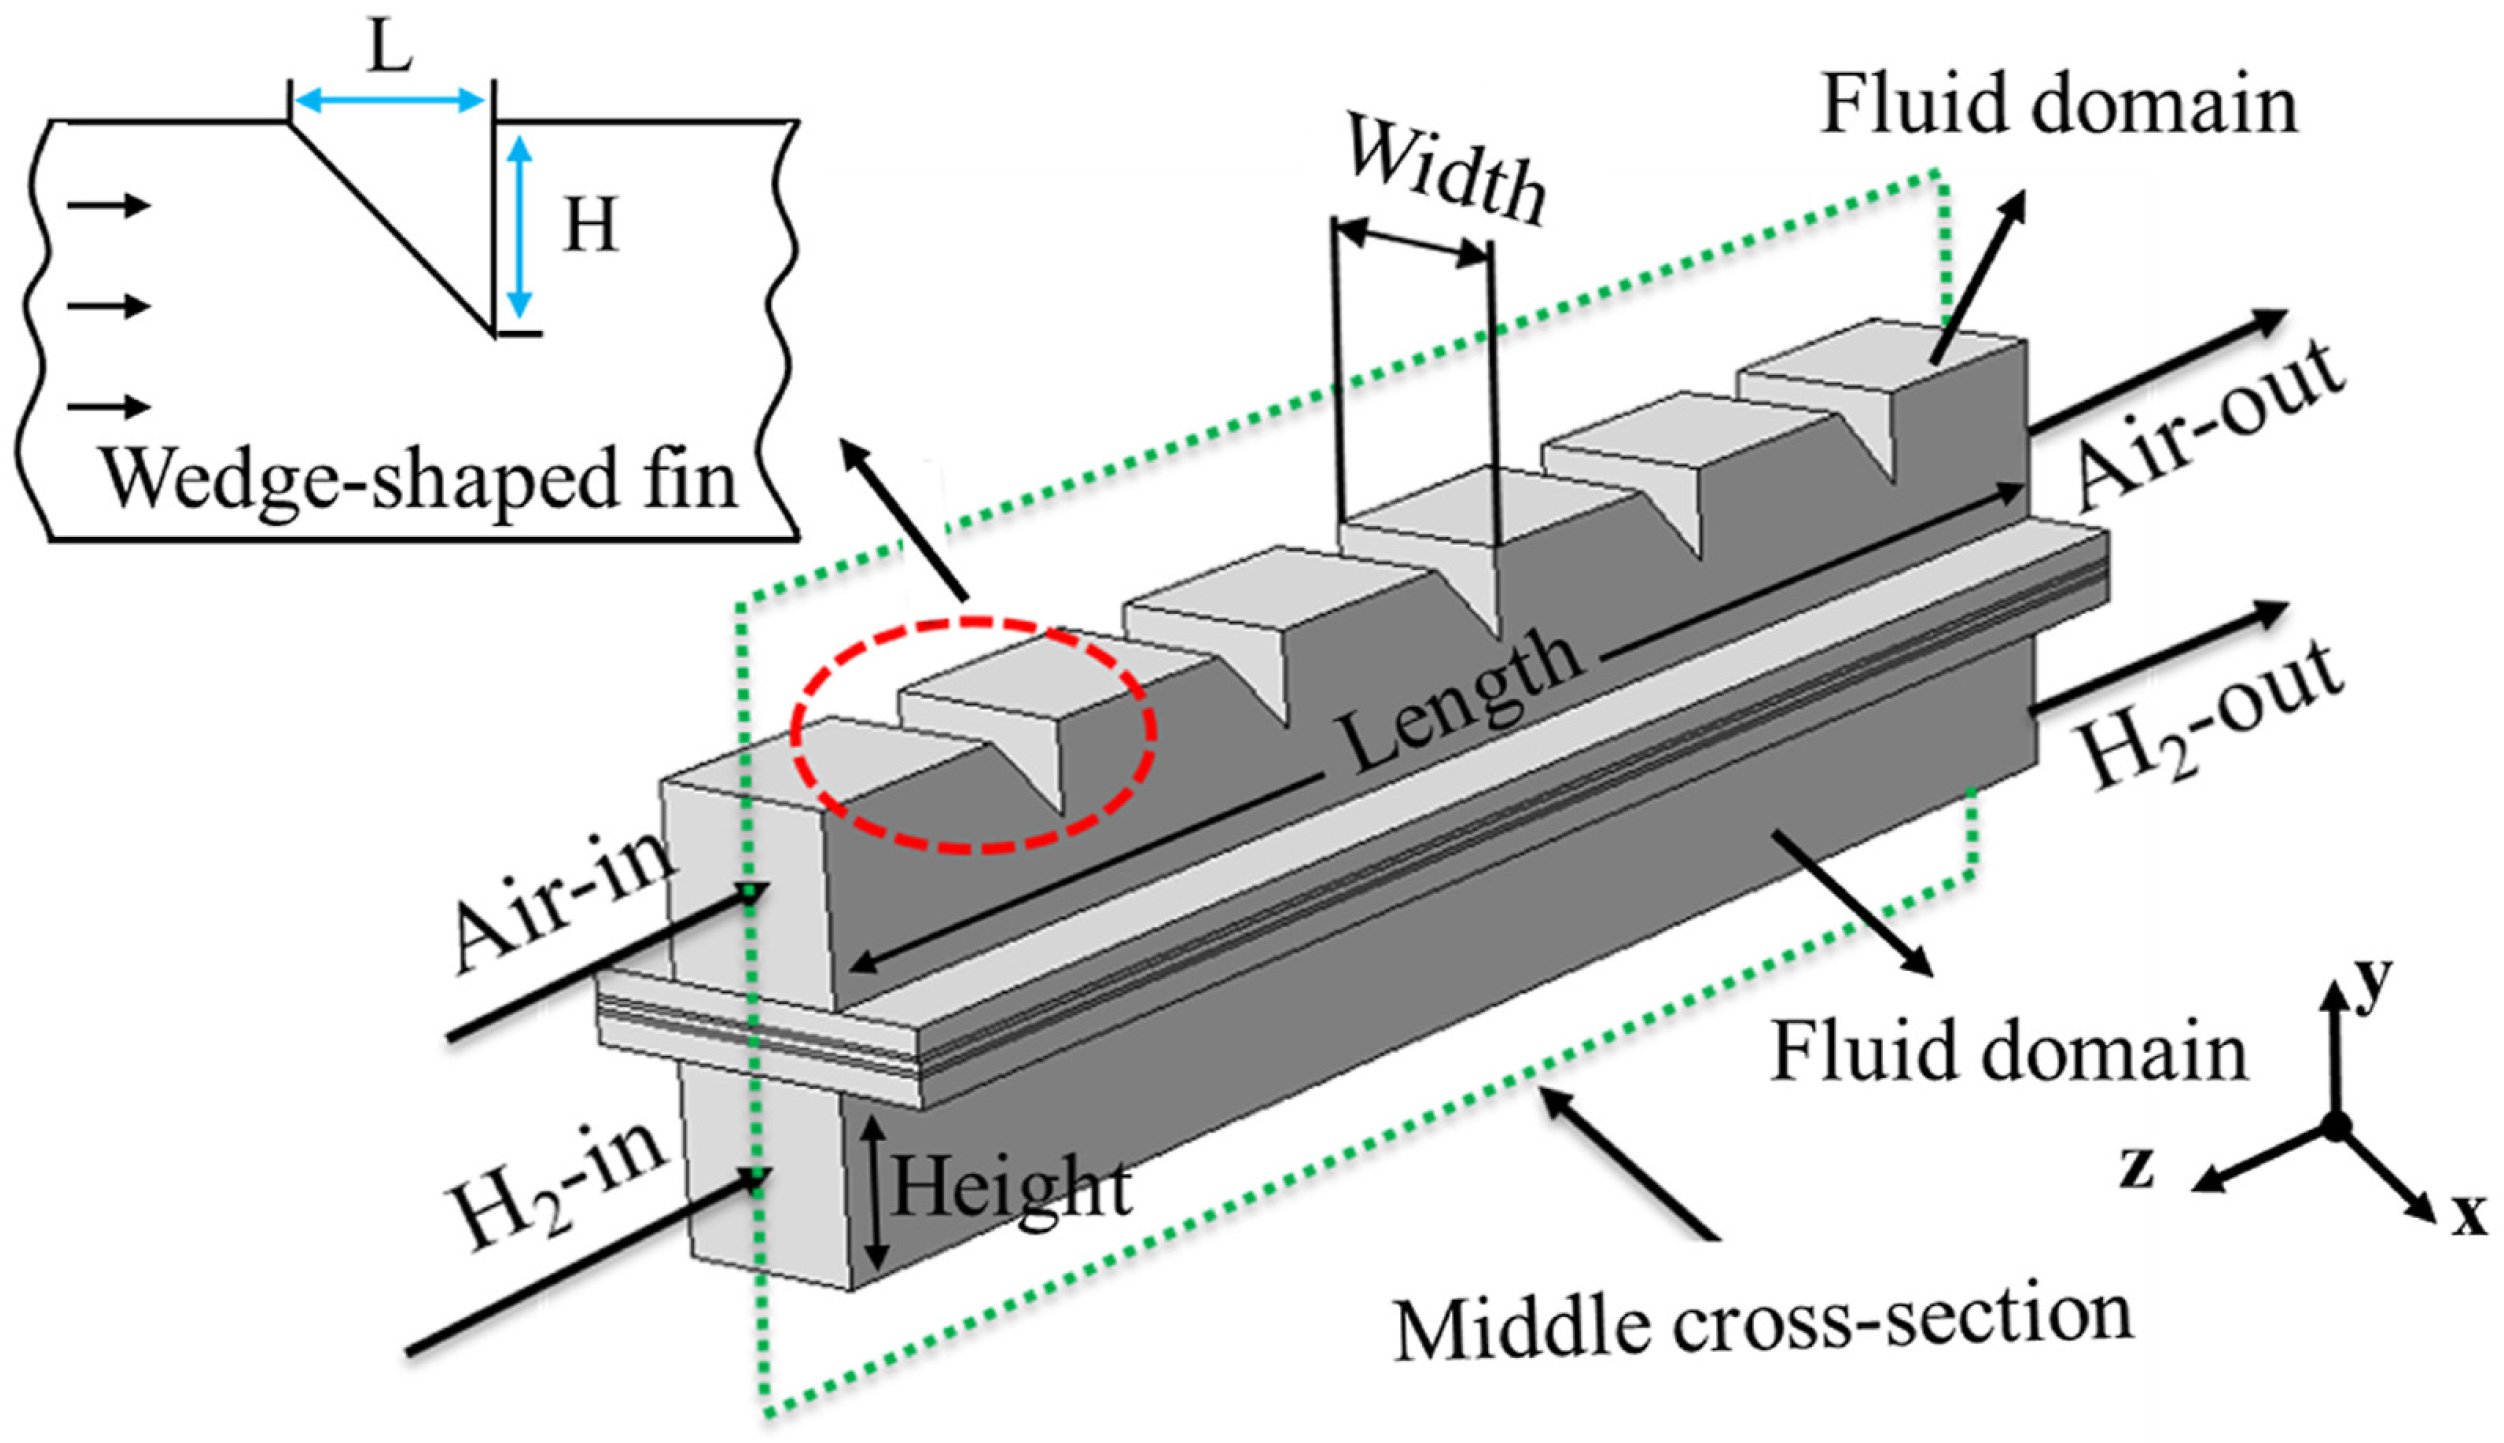
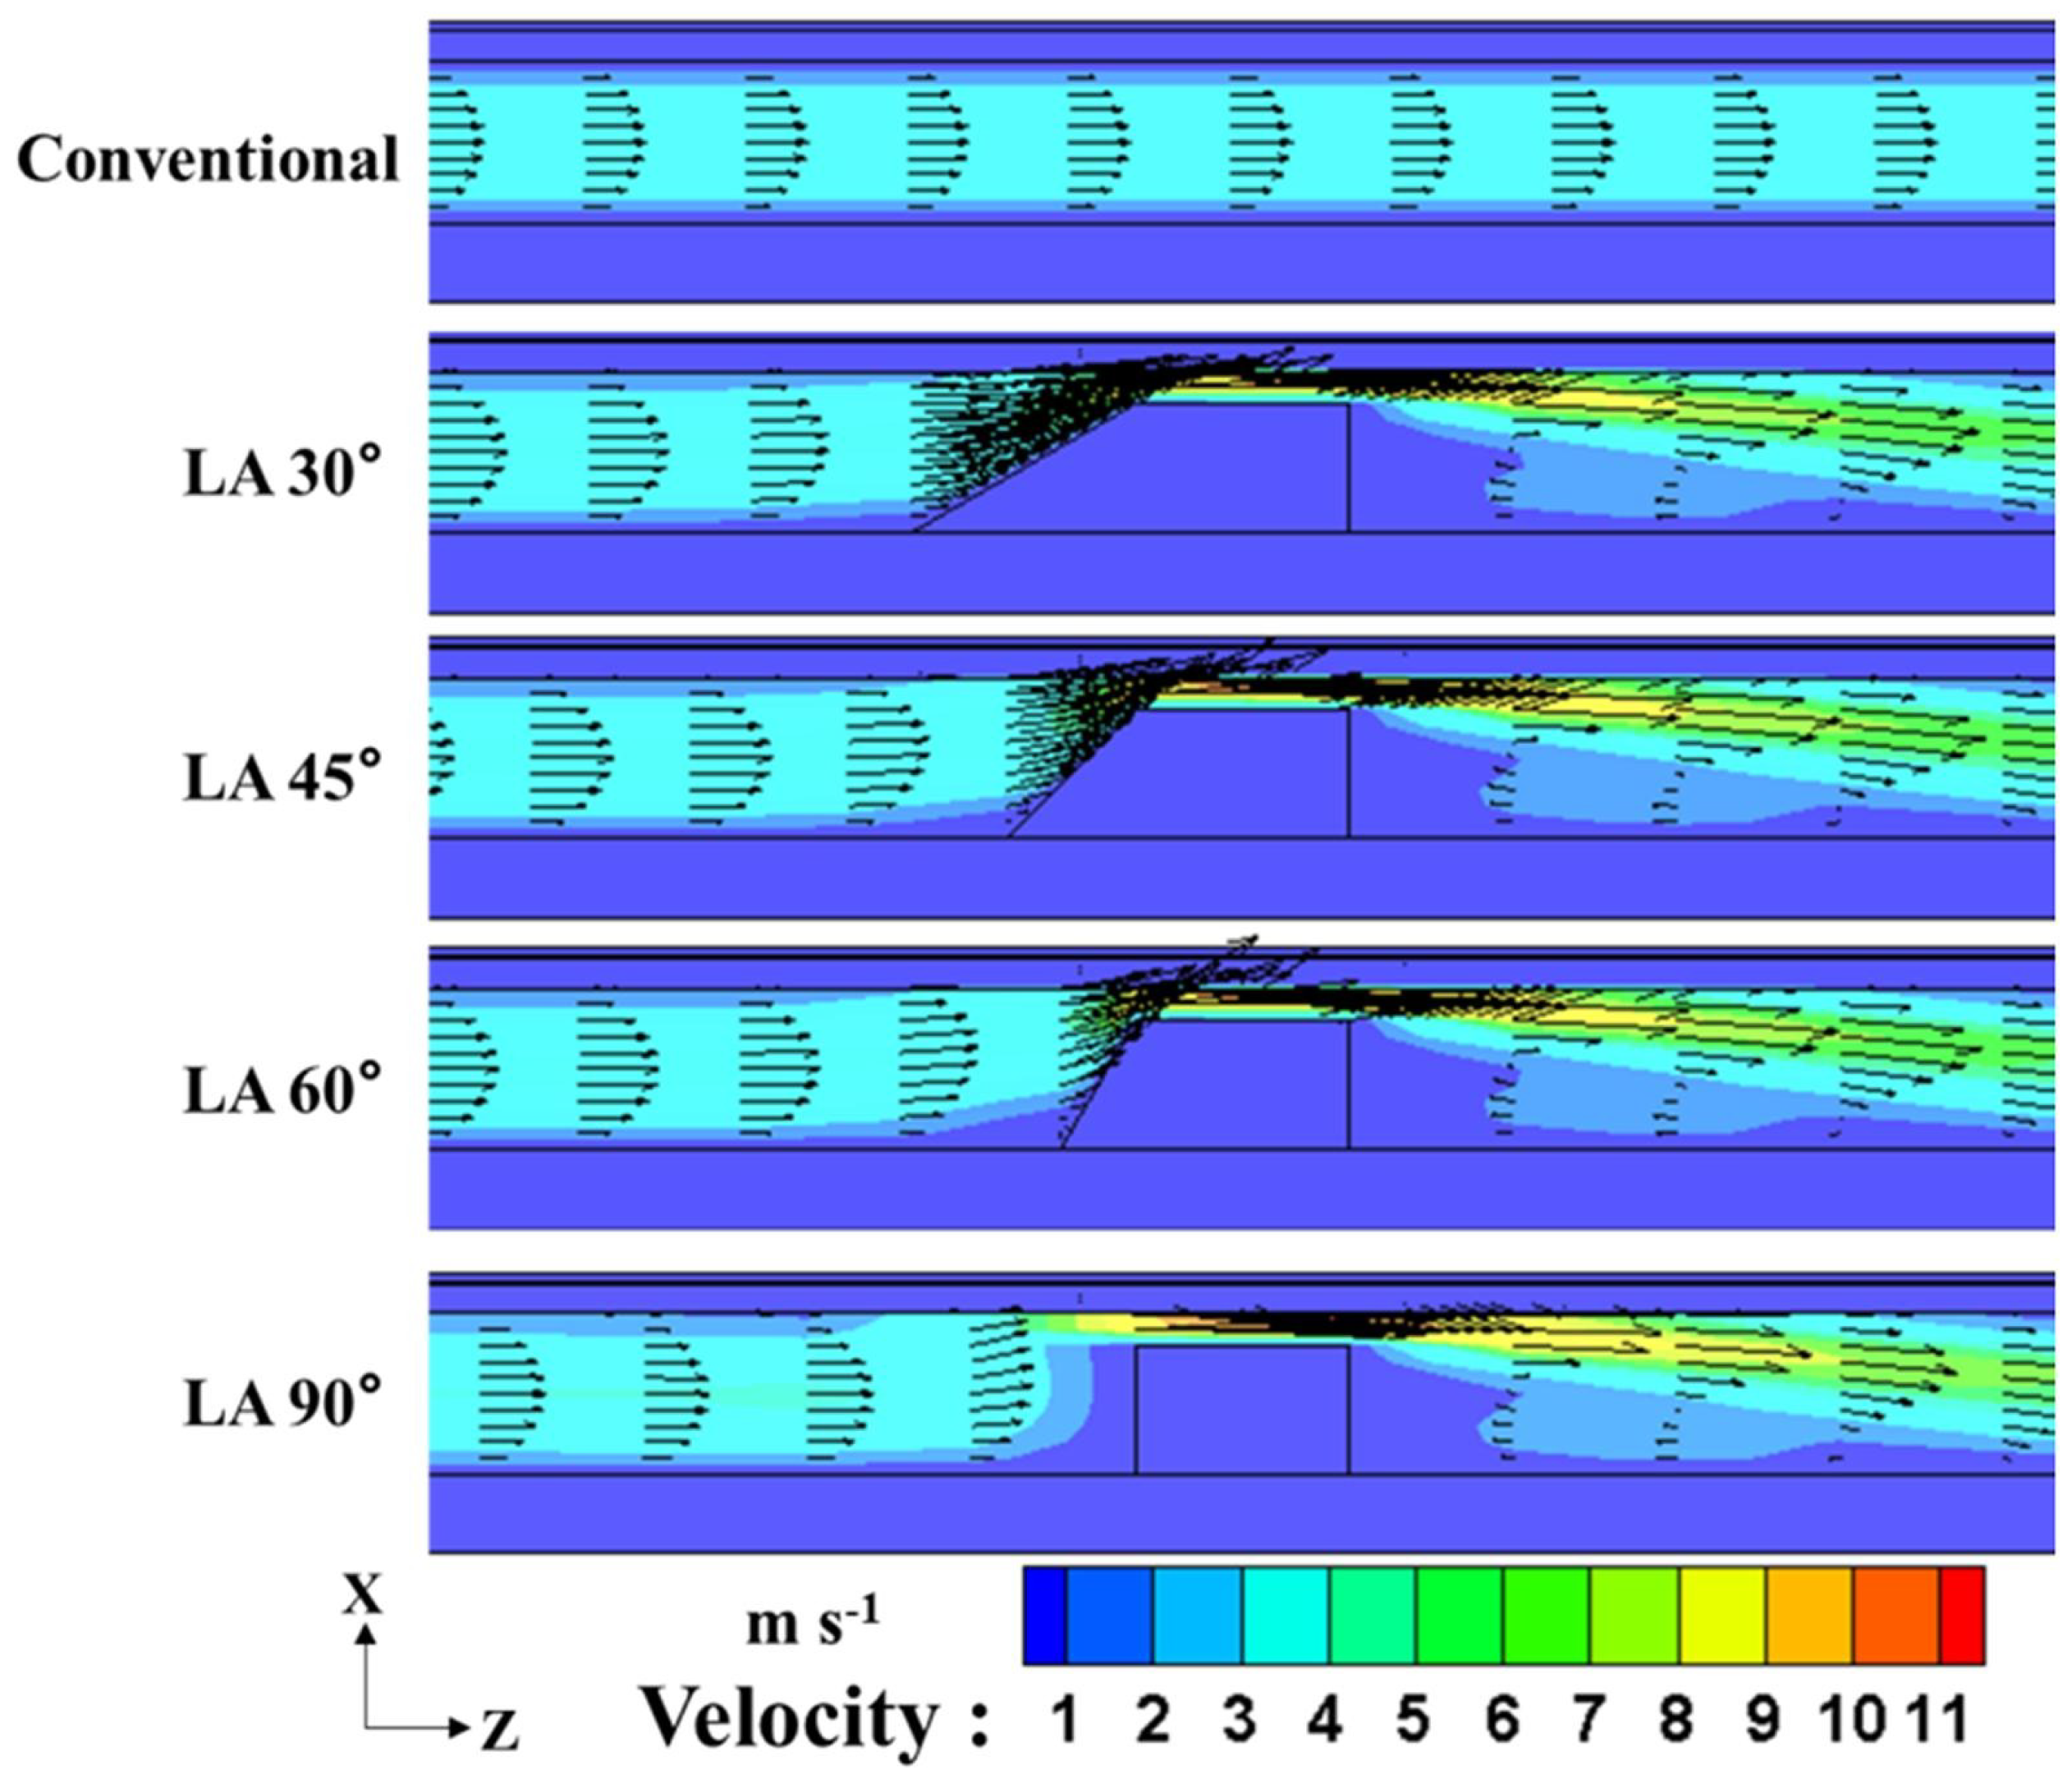
4.2. Design of Unfixed Cross Sections
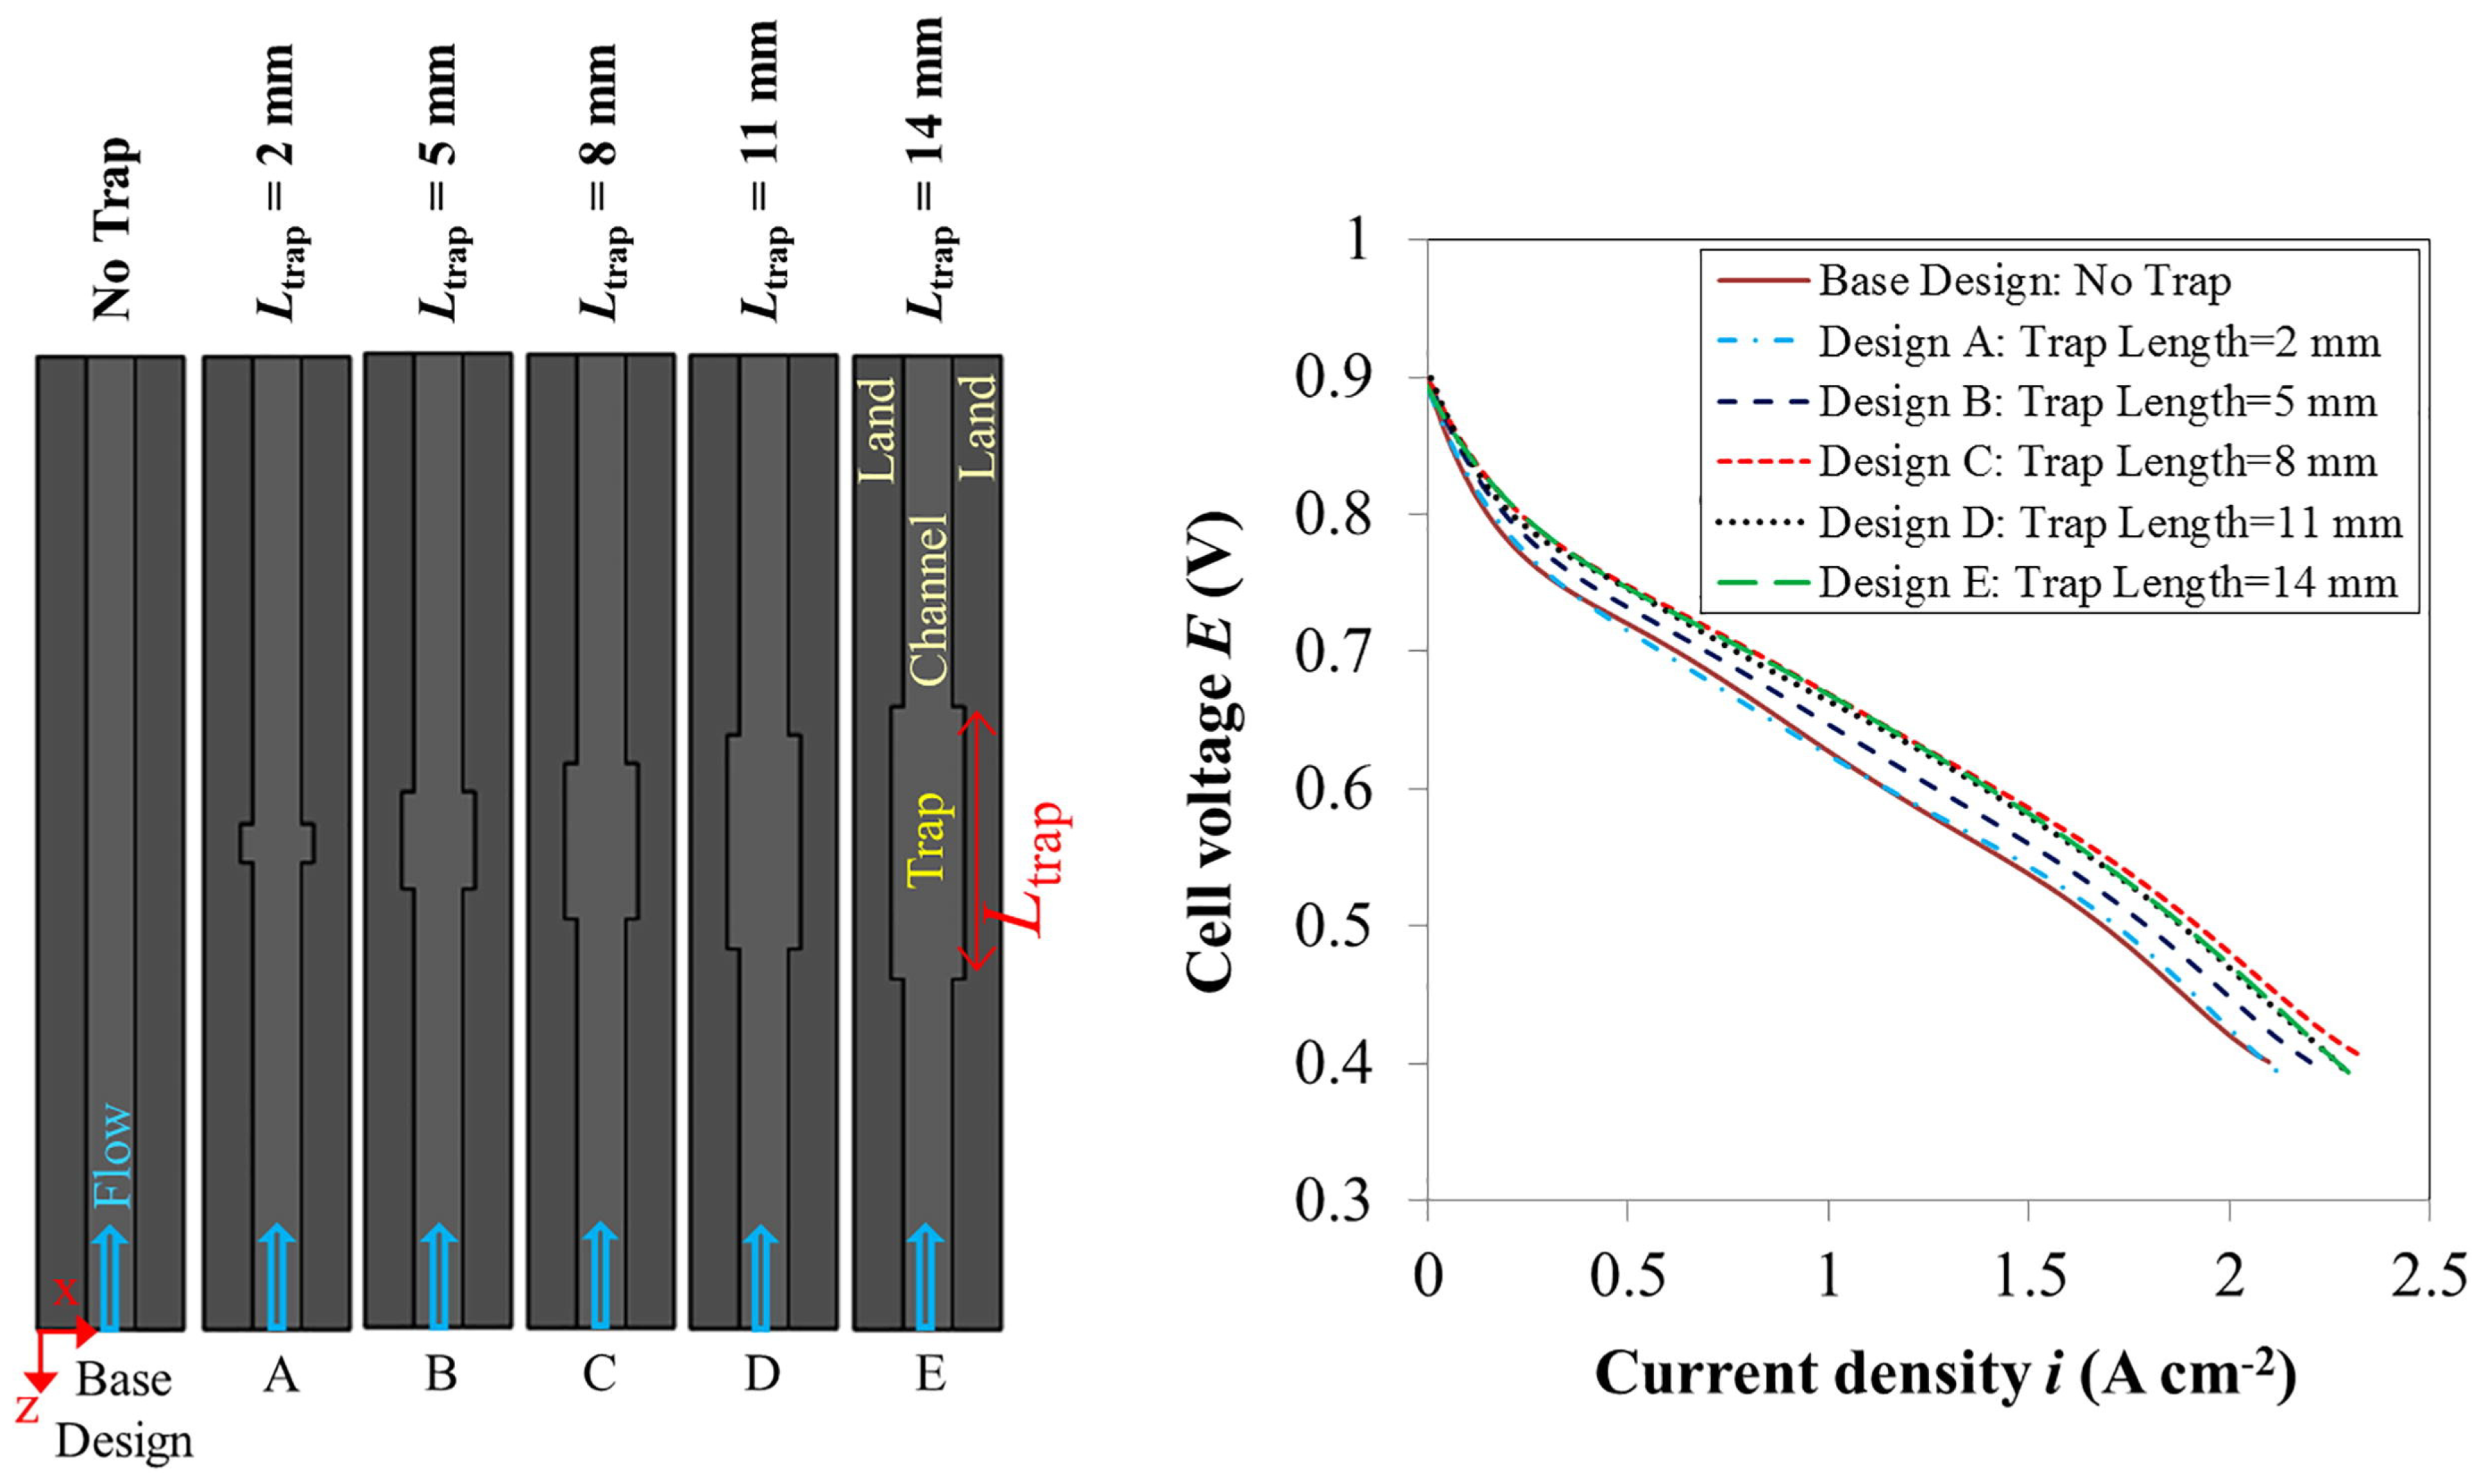
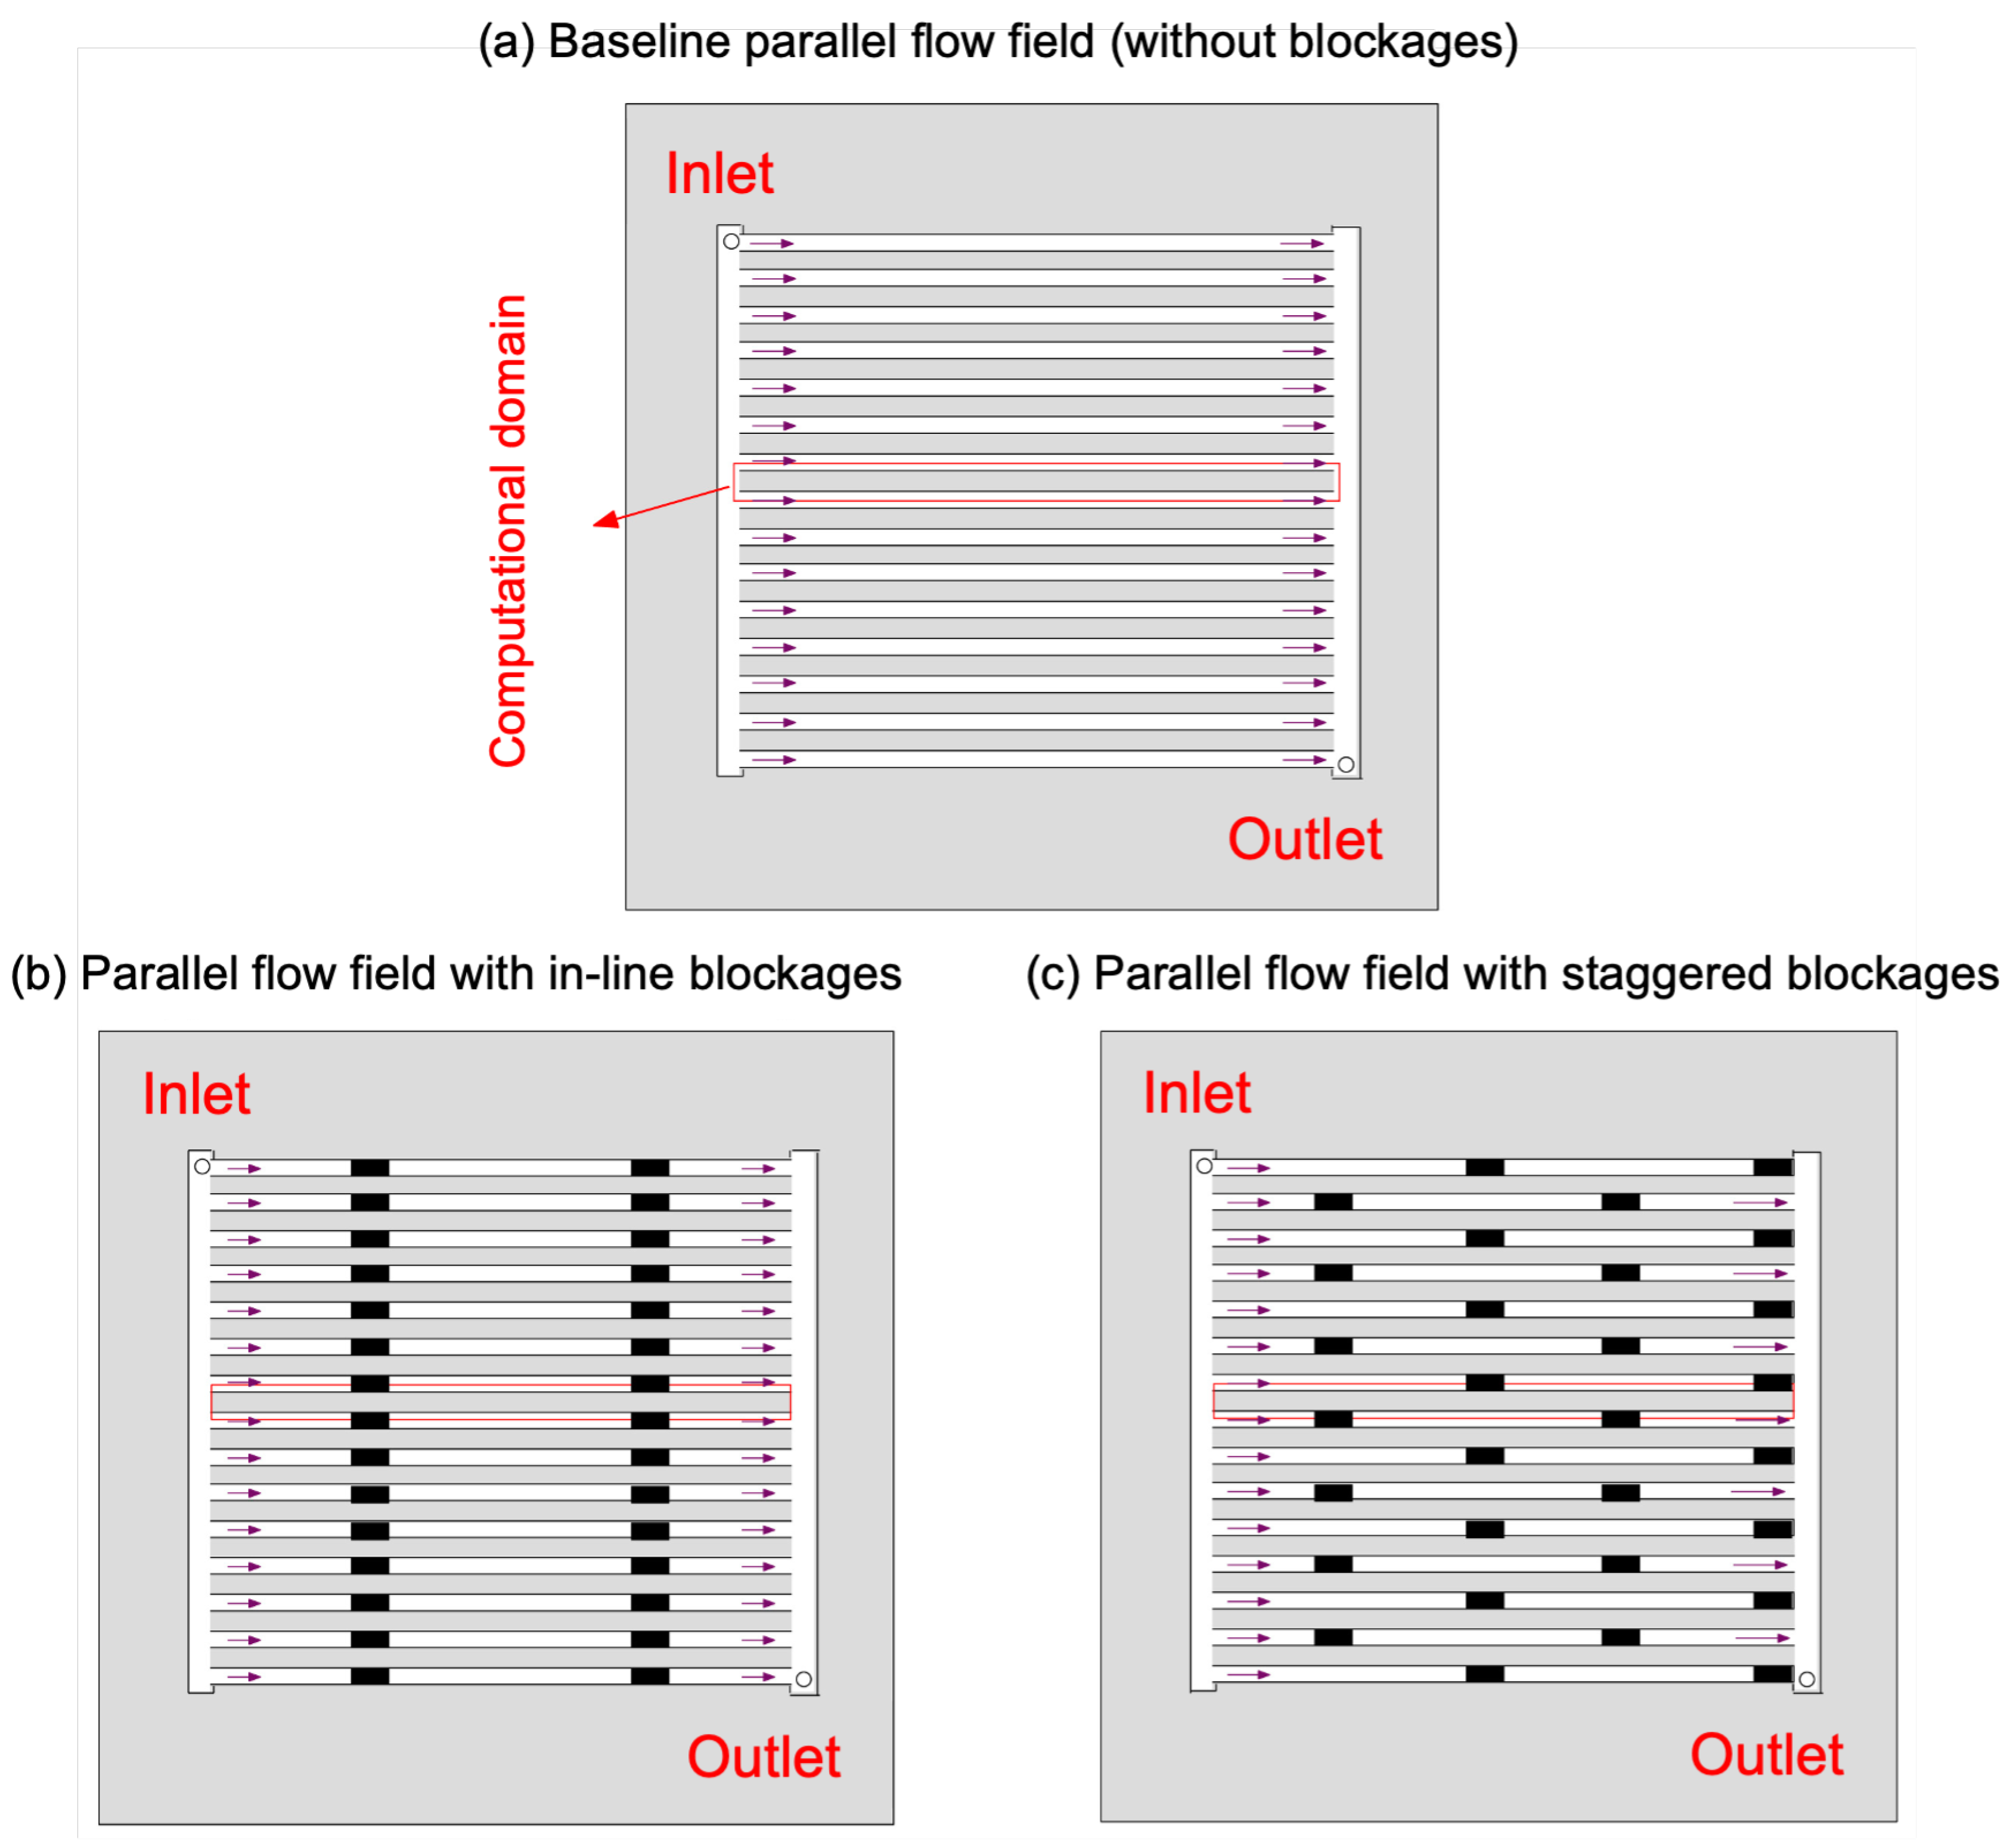
4.3. Placement of Baffles
5. Conclusions
Author Contributions
Funding
Institutional Review Board Statement
Informed Consent Statement
Data Availability Statement
Acknowledgments
Conflicts of Interest
Nomenclature
| AR | aspect ratio |
| BEV | Battery electric vehicle |
| CFD | Computational Fluid Dynamics |
| CL | Catalyst layer |
| CO | carbon monoxide |
| CO | carbon dioxide |
| E | cell voltage, V |
| electron | |
| FECV | Fuel cell electric vehicle |
| GDL | Gas diffusion layer |
| GFCs | Gas flow channels |
| H | height, mm |
| hydrogen ion | |
| hydrogen | |
| water | |
| ICEV | Internal combustion engine vehicle |
| i | current density, A cm |
| L | length, mm |
| channel length, mm | |
| length of computational domain, mm | |
| length of trap, mm | |
| LA | leading angle, |
| LCA | Life-cycle assessment |
| MEA | Membrane electrode assemblies |
| NEDE | New European Driving Cycle |
| NO | nitrogen oxide |
| oxygen | |
| PEMFC | Proton Exchange Membrane Fuel Cell |
| RDE | real driving emission |
| SIP | Sub-channel Inlet Position, % |
| US | United States |
| VOF | Volume of Fluid |
| width of computational domain | |
| WTW | well to wheel |
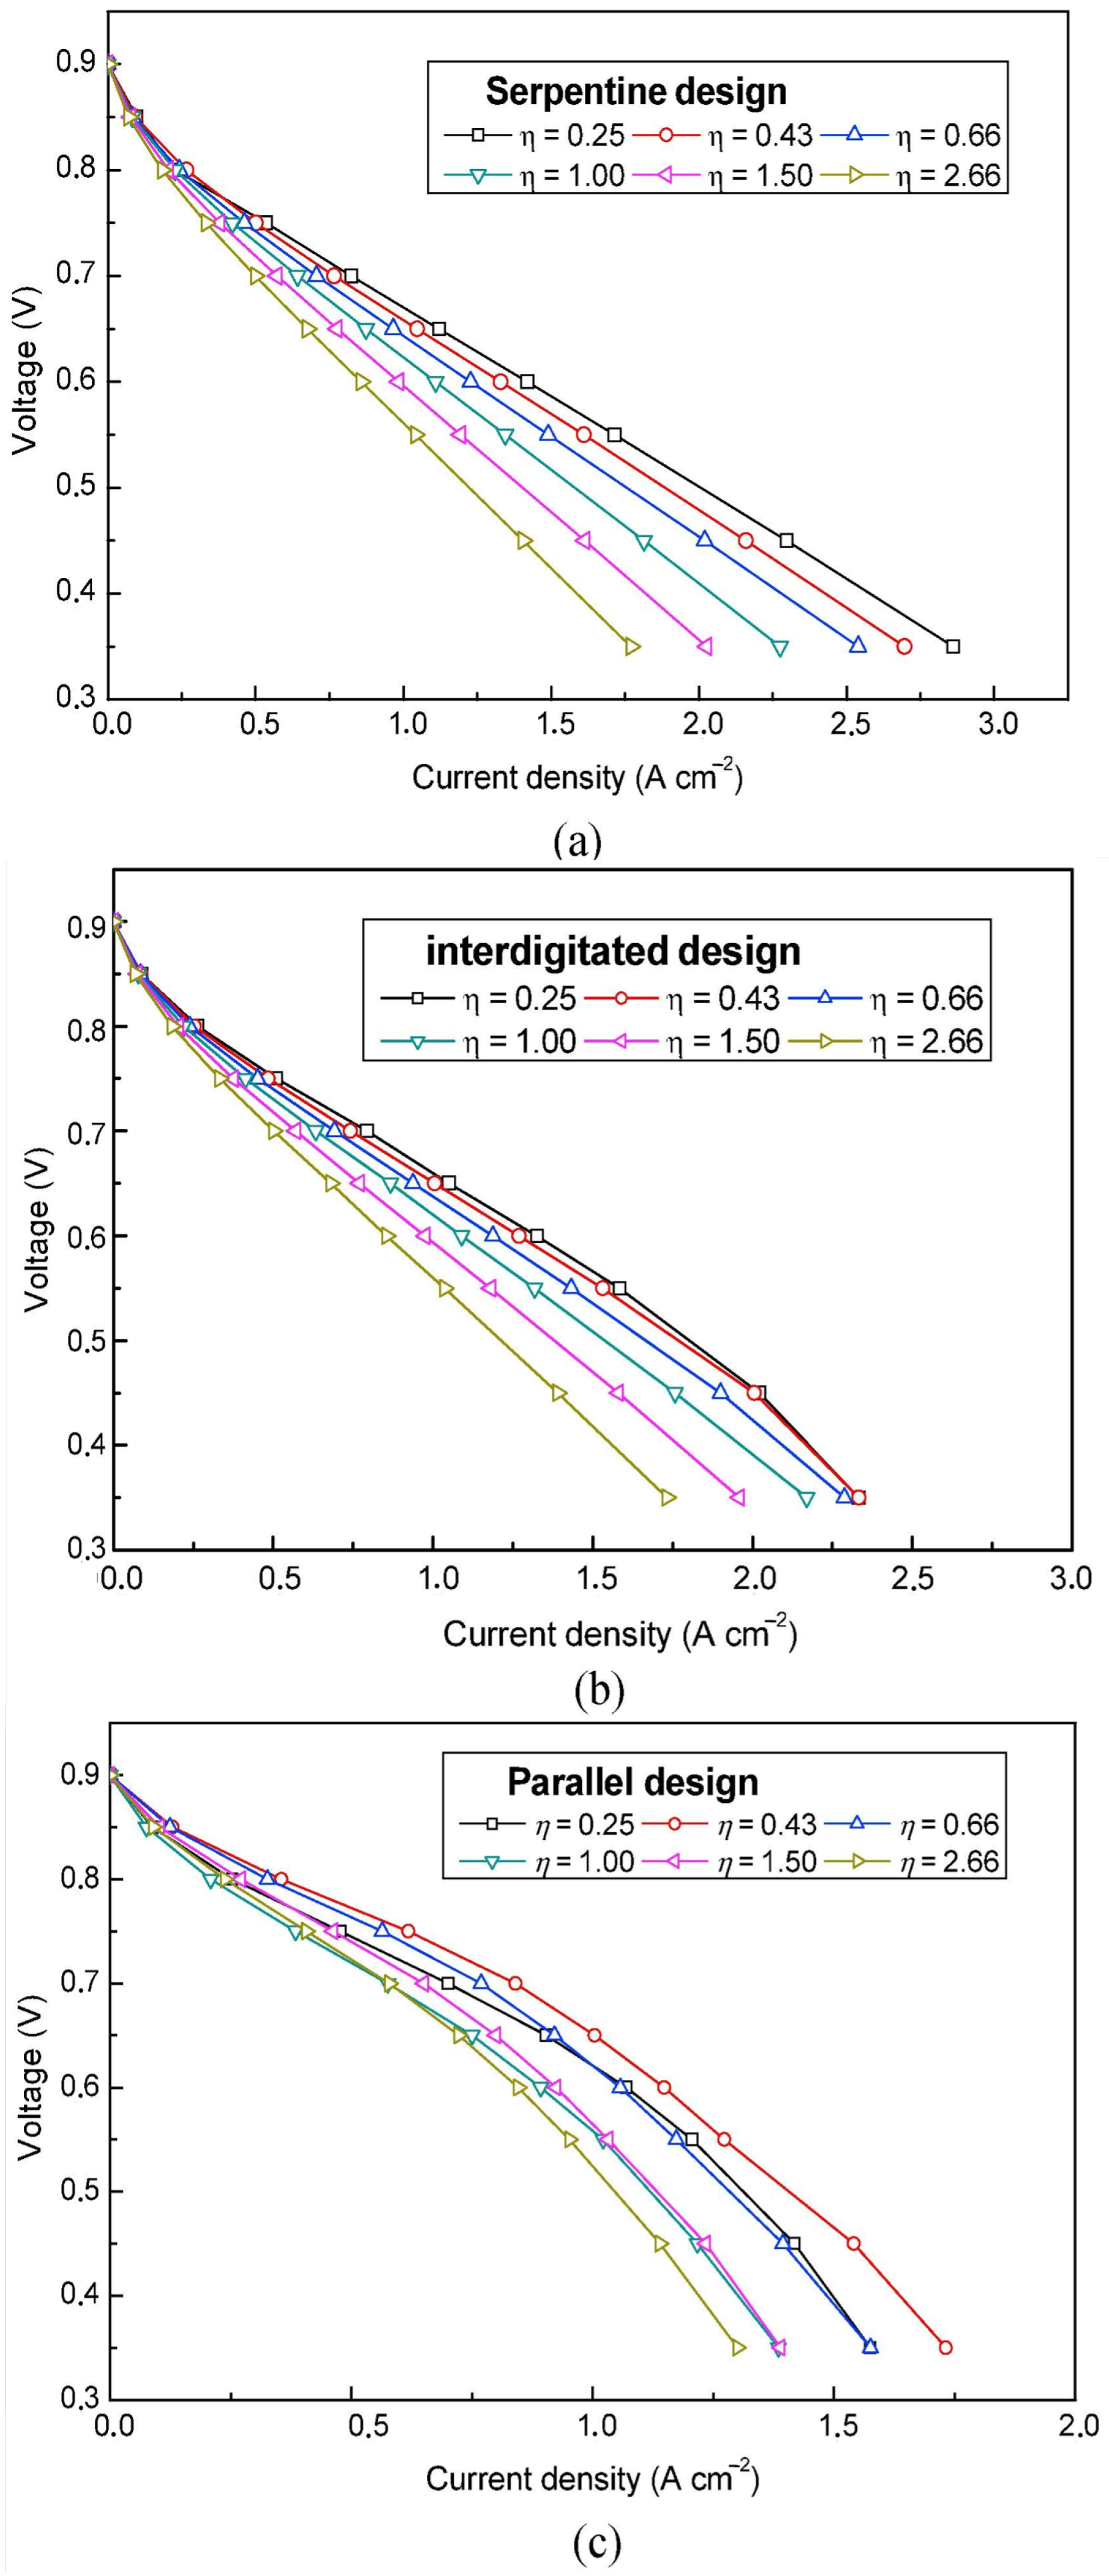
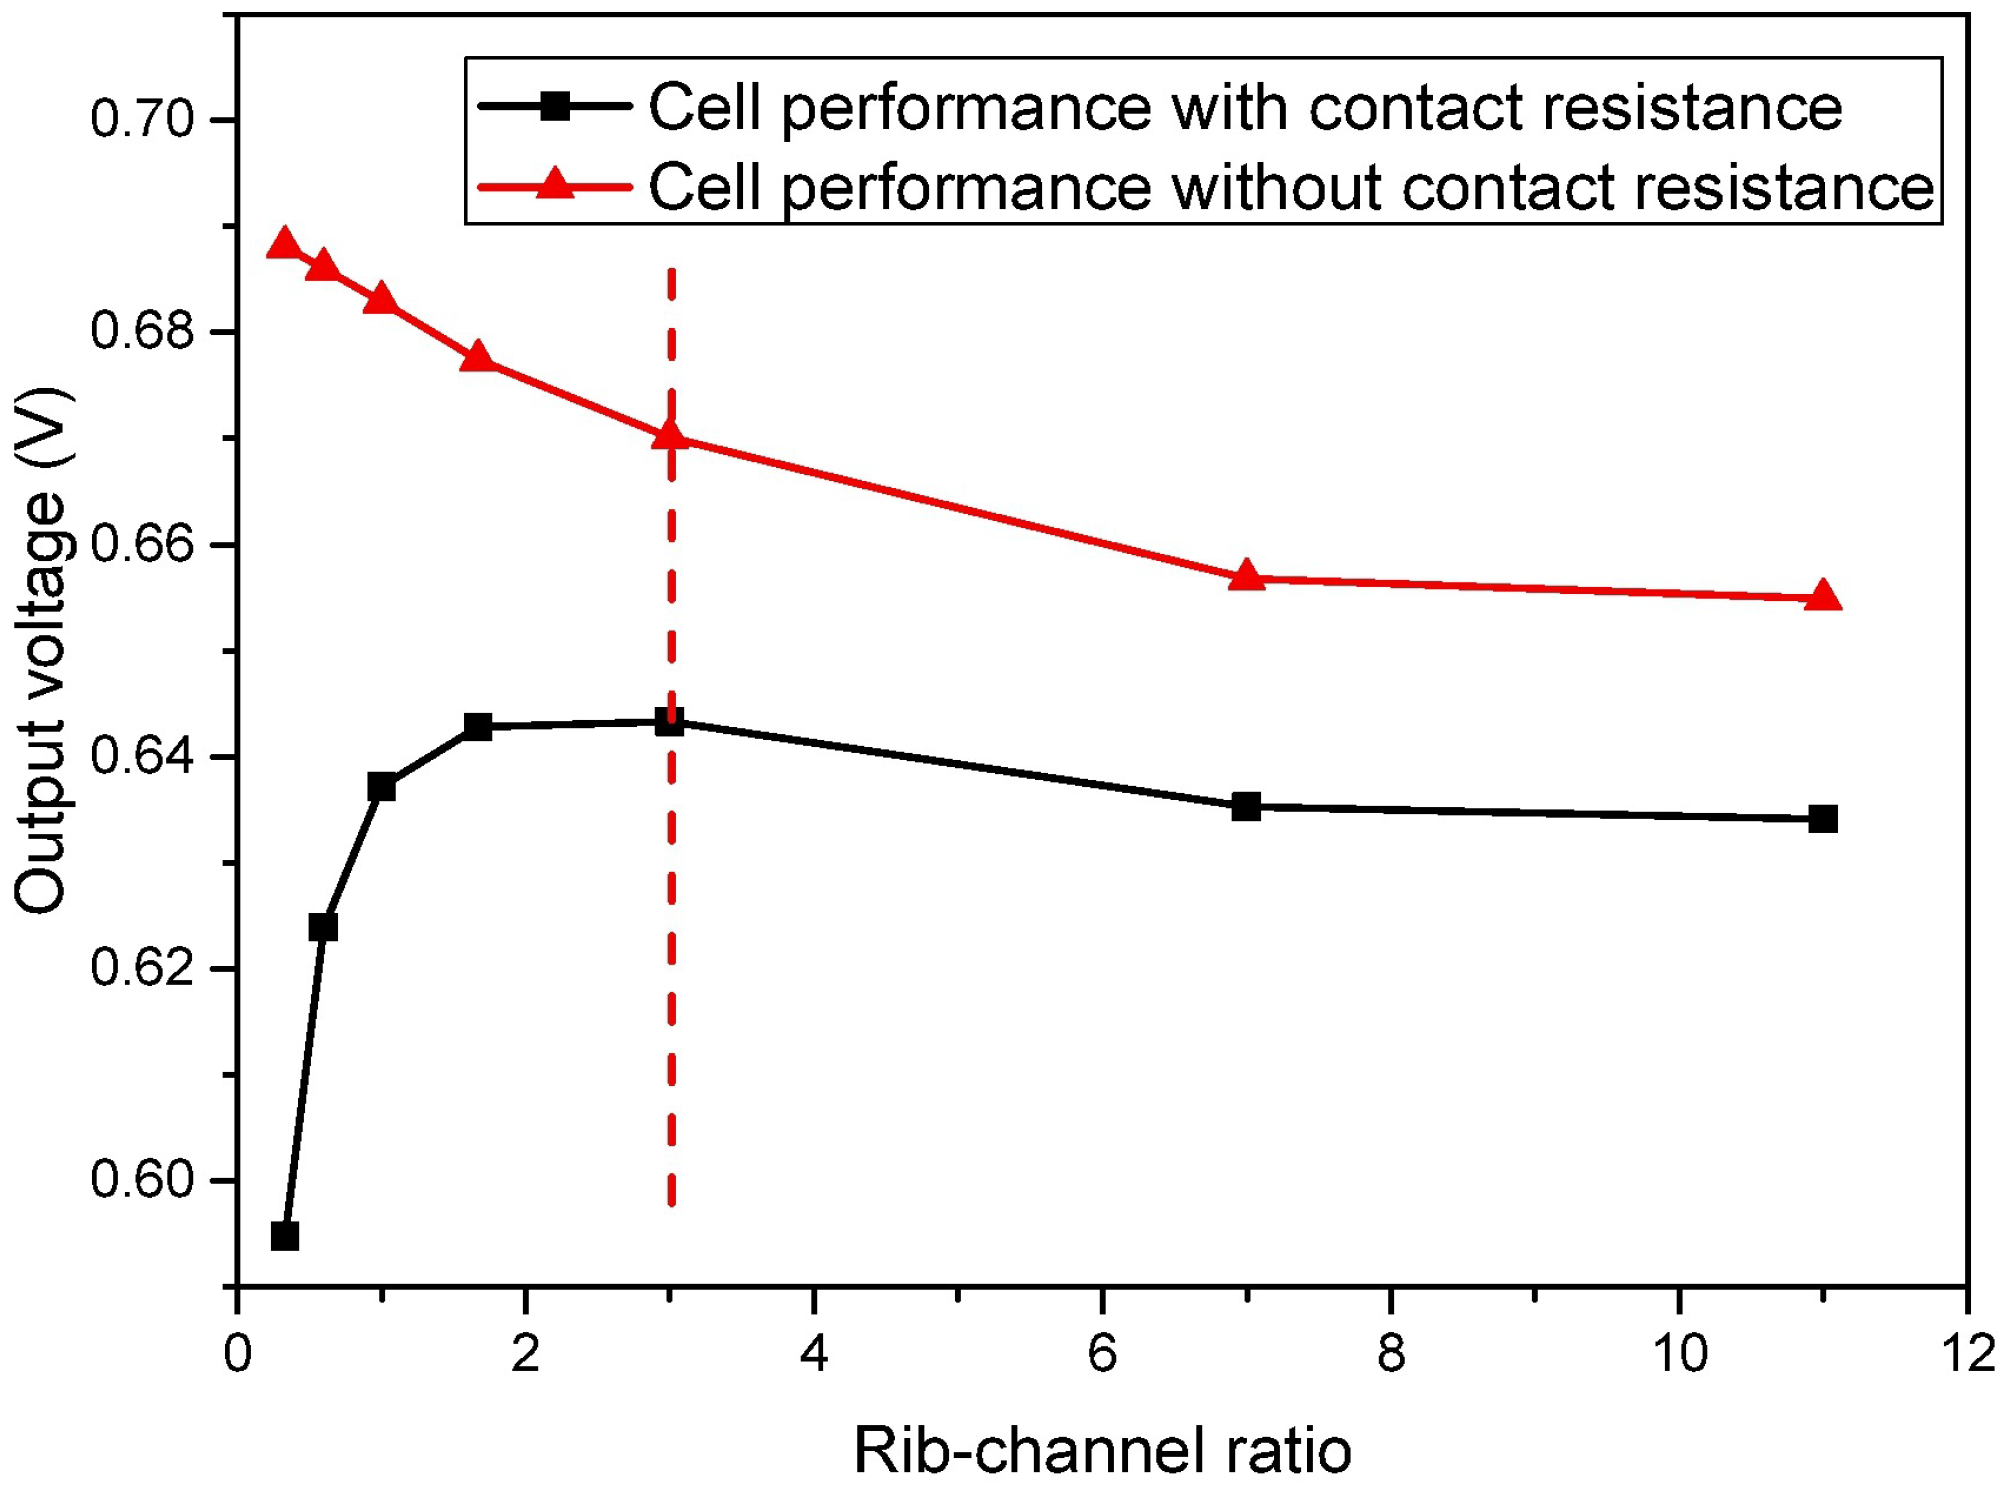
| channel to rib width ratio |
References
- O’hayre, R.; Cha, S.W.; Colella, W.; Prinz, F.B. Fuel cell fundamentals; John Wiley & Sons: Hoboken, NJ, USA, 2016. [Google Scholar]
- Barbir, F. PEM Fuel Cells: Theory and Practice; Academic Press: Cambridge, MA, USA, 2012. [Google Scholar]
- Lamir, J.; Dicks, A. Fuel Cell System Principle Design Application; Science Press: Beijing, China, 2006. [Google Scholar]
- Wang, Y.; Pang, Y.; Xu, H.; Martinez, A.; Chen, K.S. PEM Fuel cell and electrolysis cell technologies and hydrogen infrastructure development—A review. Energy Environ. Sci. 2022, 15, 2288–2328. [Google Scholar] [CrossRef]
- Nonobe, Y. Development of the fuel cell vehicle mirai. IEEJ Trans. Electr. Electron. Eng. 2017, 12, 5–9. [Google Scholar] [CrossRef] [Green Version]
- Stroman, R.O.; Schuette, M.W.; Swider-Lyons, K.; Rodgers, J.A.; Edwards, D.J. Liquid hydrogen fuel system design and demonstration in a small long endurance air vehicle. Int. J. Hydrogen Energy 2014, 39, 11279–11290. [Google Scholar] [CrossRef]
- Lee, B.; Park, P.; Kim, C.; Yang, S.; Ahn, S. Power managements of a hybrid electric propulsion system for UAVs. J. Mech. Sci. Technol. 2012, 26, 2291–2299. [Google Scholar] [CrossRef]
- Lapeña-Rey, N.; Blanco, J.; Ferreyra, E.; Lemus, J.; Pereira, S.; Serrot, E. A fuel cell powered unmanned aerial vehicle for low altitude surveillance missions. Int. J. Hydrogen Energy 2017, 42, 6926–6940. [Google Scholar] [CrossRef]
- Alaswad, A.; Baroutaji, A.; Achour, H.; Carton, J.; Al Makky, A.; Olabi, A.G. Developments in fuel cell technologies in the transport sector. Int. J. Hydrogen Energy 2016, 41, 16499–16508. [Google Scholar] [CrossRef] [Green Version]
- Wilberforce, T.; Alaswad, A.; Palumbo, A.; Dassisti, M.; Olabi, A.G. Advances in stationary and portable fuel cell applications. Int. J. Hydrogen Energy 2016, 41, 16509–16522. [Google Scholar] [CrossRef] [Green Version]
- Ogungbemi, E.; Ijaodola, O.; Khatib, F.N.; Wilberforce, T.; El Hassan, Z.; Thompson, J.; Ramadan, M.; Olabi, A.G. Fuel cell membranes – Pros and cons. Energy 2019, 172, 155–172. [Google Scholar] [CrossRef] [Green Version]
- Ous, T.; Arcoumanis, C. Degradation aspects of water formation and transport in Proton Exchange Membrane Fuel Cell: A review. J. Power Sources 2013, 240, 558–582. [Google Scholar] [CrossRef]
- Kone, J.P.; Zhang, X.; Yan, Y.; Hu, G.; Ahmadi, G. Three-dimensional multiphase flow computational fluid dynamics models for proton exchange membrane fuel cell: A theoretical development. J. Comput. Multiph. Flows 2017, 9, 3–25. [Google Scholar] [CrossRef] [Green Version]
- Das, P.K.; Li, X.; Liu, Z.S. Analysis of liquid water transport in cathode catalyst layer of PEM fuel cells. Int. J. Hydrogen Energy 2010, 35, 2403–2416. [Google Scholar] [CrossRef]
- Esfandiari, A.; Kazemeini, M.; Bastani, D. Synthesis, characterization and performance determination of an Ag@Pt/C electrocatalyst for the ORR in a PEM fuel cell. Int. J. Hydrogen Energy 2016, 41, 20720–20730. [Google Scholar] [CrossRef]
- Liu, D.; Lin, R.; Feng, B.; Yang, Z. Investigation of the effect of cathode stoichiometry of proton exchange membrane fuel cell using localized electrochemical impedance spectroscopy based on print circuit board. Int. J. Hydrogen Energy 2019, 44, 7564–7573. [Google Scholar] [CrossRef]
- Schmittinger, W.; Vahidi, A. A review of the main parameters influencing long-term performance and durability of PEM fuel cells. J. Power Sources 2008, 180, 1–14. [Google Scholar] [CrossRef]
- Jiao, K.; Li, X. Water transport in polymer electrolyte membrane fuel cells. Prog. Energy Combust. Sci. 2011, 37, 221–291. [Google Scholar] [CrossRef]
- Li, H.; Tang, Y.; Wang, Z.; Shi, Z.; Wu, S.; Song, D.; Zhang, J.; Fatih, K.; Zhang, J.; Wang, H.; et al. A review of water flooding issues in the proton exchange membrane fuel cell. J. Power Sources 2008, 178, 103–117. [Google Scholar] [CrossRef]
- Mobility 2030: Meeting the Challenges to Sustainability. Available online: https://www.wbcsd.org/Programs/Cities-and-Mobility/Transforming-Mobility/TransformingUrban-Mobility/SiMPlify/Resources/Mobility-2030-Meeting-the-challengesto-sustainability-Executive-Summary-2004 (accessed on 12 February 2023).
- Ahmadi, P.; Torabi, S.H.; Afsaneh, H.; Sadegheih, Y.; Ganjehsarabi, H.; Ashjaee, M. The effects of driving patterns and PEM fuel cell degradation on the lifecycle assessment of hydrogen fuel cell vehicles. Int. J. Hydrogen Energy 2020, 45, 3595–3608. [Google Scholar] [CrossRef]
- Global Greenhouse Gas Emissions Data | Greenhouse Gas (GHG) Emissions | US EPA. Available online: https://www.epa.gov/ghgemissions/global-greenhouse-gas-emissions-data (accessed on 12 February 2023).
- Bakas, I.; Hauschild, M.Z.; Astrup, T.F.; Rosenbaum, R.K. Preparing the ground for an operational handling of long-term emissions in LCA. Int. J. Life Cycle Assess. 2015, 20, 1444–1455. [Google Scholar] [CrossRef] [Green Version]
- Cazzola, P.; Scheffer, S.; Paoli, L.; Craglia, M.; Tietge, U.; Yang, Z. Fuel Economy in Major Car Markets: Technology and Policy Drivers, 2005–2017; Technical Report; International Energy Agency: Paris, France, 2019. [Google Scholar]
- Williams, S.E.; Davis, S.C.; Boundy, R.G. Transportation Energy Data Book, 36th ed.; Technical report; Oak Ridge National Lab. (ORNL): Oak Ridge, TN, USA, 2017. [Google Scholar]
- Zhou, N.; Price, L.; Yande, D.; Creyts, J.; Khanna, N.; Fridley, D.; Lu, H.; Feng, W.; Liu, X.; Hasanbeigi, A.; et al. A roadmap for China to peak carbon dioxide emissions and achieve a 20% share of non-fossil fuels in primary energy by 2030. Appl. Energy 2019, 239, 793–819. [Google Scholar] [CrossRef]
- Wróbel, K.; Wróbel, J.; Tokarz, W.; Lach, J.; Podsadni, K.; Czerwiński, A. Hydrogen Internal Combustion Engine Vehicles: A Review. Energies 2022, 15, 8937. [Google Scholar] [CrossRef]
- Ahmed, A.A.; Nazzal, M.A.; Darras, B.M.; Deiab, I.M. A Comprehensive Sustainability Assessment of Battery Electric Vehicles, Fuel Cell Electric Vehicles, and Internal Combustion Engine Vehicles through a Comparative Circular Economy Assessment Approach. Sustainability 2023, 15, 171. [Google Scholar] [CrossRef]
- Dhanushkodi, S.; Mahinpey, N.; Srinivasan, A.; Wilson, M. Life Cycle Analysis of Fuel Cell Technology. J. Environ. Informatics 2008, 11, 36–44. [Google Scholar] [CrossRef]
- Buberger, J.; Kersten, A.; Kuder, M.; Eckerle, R.; Weyh, T.; Thiringer, T. Total CO2-equivalent life-cycle emissions from commercially available passenger cars. Renew. Sustain. Energy Rev. 2022, 159, 112158. [Google Scholar] [CrossRef]
- Hwang, J.J.; Kuo, J.K.; Wu, W.; Chang, W.R.; Lin, C.H.; Wang, S.E. Lifecycle performance assessment of fuel cell/battery electric vehicles. Int. J. Hydrogen Energy 2013, 38, 3433–3446. [Google Scholar] [CrossRef]
- Evangelisti, S.; Tagliaferri, C.; Brett, D.J.L.; Lettieri, P. Life cycle assessment of a polymer electrolyte membrane fuel cell system for passenger vehicles. J. Clean. Prod. 2017, 142, 4339–4355. [Google Scholar] [CrossRef]
- Ahmadi, P.; Kjeang, E. Realistic simulation of fuel economy and life cycle metrics for hydrogen fuel cell vehicles. Int. J. Energy Res. 2017, 41, 714–727. [Google Scholar] [CrossRef]
- Hussain, M.M.; Dincer, I.; Li, X. A preliminary life cycle assessment of PEM fuel cell powered automobiles. Appl. Therm. Eng. 2007, 27, 2294–2299. [Google Scholar] [CrossRef]
- Ahmadi, P.; Kjeang, E. Comparative life cycle assessment of hydrogen fuel cell passenger vehicles in different Canadian provinces. Int. J. Hydrogen Energy 2015, 40, 12905–12917. [Google Scholar] [CrossRef]
- Zamel, N.; Li, X. Life cycle analysis of vehicles powered by a fuel cell and by internal combustion engine for Canada. J. Power Sources 2006, 155, 297–310. [Google Scholar] [CrossRef]
- Yang, Z.; Wang, B.; Jiao, K. Life cycle assessment of fuel cell, electric and internal combustion engine vehicles under different fuel scenarios and driving mileages in China. Energy 2020, 198, 117365. [Google Scholar] [CrossRef]
- Iannuzzi, L.; Hilbert, J.A.; Silva Lora, E.E. Life Cycle Assessment (LCA) for use on renewable sourced hydrogen fuel cell buses vs diesel engines buses in the city of Rosario, Argentina. Int. J. Hydrogen Energy 2021, 46, 29694–29705. [Google Scholar] [CrossRef]
- Liu, X.; Reddi, K.; Elgowainy, A.; Lohse-Busch, H.; Wang, M.; Rustagi, N. Comparison of well-to-wheels energy use and emissions of a hydrogen fuel cell electric vehicle relative to a conventional gasoline-powered internal combustion engine vehicle. Int. J. Hydrogen Energy 2020, 45, 972–983. [Google Scholar] [CrossRef]
- Seol, E.; Yoo, E.; Lee, C.; Kim, M.; Cho, M.; Choi, W.; Song, H.H. Well-to-wheel nitrogen oxide emissions from internal combustion engine vehicles and alternative fuel vehicles reflect real driving emissions and various fuel production pathways in South Korea. J. Clean. Prod. 2022, 342, 130983. [Google Scholar] [CrossRef]
- Garche, J.; Dyer, C.; Moseley, P.T.; Ogumi, Z.; Rand, D.A.; Scrosati, B. Encyclopedia of Electrochemical Power Sources; Newnes: Oxford, UK, 2013. [Google Scholar]
- Manso, A.P.; Marzo, F.F.; Barranco, J.; Garikano, X.; Garmendia Mujika, M. Influence of geometric parameters of the flow fields on the performance of a PEM fuel cell. A review. Int. J. Hydrogen Energy 2012, 37, 15256–15287. [Google Scholar] [CrossRef]
- Yu, L.j.; Ren, G.p.; Qin, M.j.; Jiang, X.m. Transport mechanisms and performance simulations of a PEM fuel cell with interdigitated flow field. Renew. Energy 2009, 34, 530–543. [Google Scholar] [CrossRef]
- Ahmed, D.H.; Sung, H.J. Effects of channel geometrical configuration and shoulder width on PEMFC performance at high current density. J. Power Sources 2006, 162, 327–339. [Google Scholar] [CrossRef]
- Kumar, A.; Reddy, R.G. Effect of channel dimensions and shape in the flow-field distributor on the performance of polymer electrolyte membrane fuel cells. J. Power Sources 2003, 113, 11–18. [Google Scholar] [CrossRef]
- Zhu, X.; Liao, Q.; Sui, P.C.; Djilali, N. Numerical investigation of water droplet dynamics in a low-temperature fuel cell microchannel: Effect of channel geometry. J. Power Sources 2010, 195, 801–812. [Google Scholar] [CrossRef]
- Wang, X.D.; Lu, G.; Duan, Y.Y.; Lee, D.J. Numerical analysis on performances of polymer electrolyte membrane fuel cells with various cathode flow channel geometries. Int. J. Hydrogen Energy 2012, 37, 15778–15786. [Google Scholar] [CrossRef]
- Lorenzini-Gutierrez, D.; Kandlikar, S.G.; Hernandez-Guerrero, A.; Elizalde-Blancas, F. Residence time of water film and slug flow features in fuel cell gas channels and their effect on instantaneous area coverage ratio. J. Power Sources 2015, 279, 567–580. [Google Scholar] [CrossRef]
- Mohammedi, A.; Sahli, Y.; Ben Moussa, H. 3D investigation of the channel cross-section configuration effect on the power delivered by PEMFCs with straight channels. Fuel 2020, 263, 116713. [Google Scholar] [CrossRef]
- Kahraman, H.; Orhan, M.F. Flow field bipolar plates in a proton exchange membrane fuel cell: Analysis & modeling. Energy Convers. Manag. 2017, 133, 363–384. [Google Scholar] [CrossRef]
- Kerkoub, Y.; Benzaoui, A.; Haddad, F.; Ziari, Y.K. Channel to rib width ratio influence with various flow field designs on performance of PEM fuel cell. Energy Convers. Manag. 2018, 174, 260–275. [Google Scholar] [CrossRef]
- Qiu, D.; Peng, L.; Tang, J.; Lai, X. Numerical analysis of air-cooled proton exchange membrane fuel cells with various cathode flow channels. Energy 2020, 198, 117334. [Google Scholar] [CrossRef]
- Rahimi-Esbo, M.; Ranjbar, A.; Ramiar, A.; Alizadeh, E.; Aghaee, M. Improving PEM fuel cell performance and effective water removal by using a novel gas flow field. Int. J. Hydrogen Energy 2016, 41, 3023–3037. [Google Scholar] [CrossRef]
- Wang, X.D.; Duan, Y.Y.; Yan, W.M. Numerical study of cell performance and local transport phenomena in PEM fuel cells with various flow channel area ratios. J. Power Sources 2007, 172, 265–277. [Google Scholar] [CrossRef]
- Wang, X.D.; Yan, W.M.; Duan, Y.Y.; Weng, F.B.; Jung, G.B.; Lee, C.Y. Numerical study on channel size effect for proton exchange membrane fuel cell with serpentine flow field. Energy Convers. Manag. 2010, 51, 959–968. [Google Scholar] [CrossRef]
- Feser, J.P.; Prasad, A.K.; Advani, S.G. On the relative influence of convection in serpentine flow fields of PEM fuel cells. J. Power Sources 2006, 161, 404–412. [Google Scholar] [CrossRef]
- Shimpalee, S.; Greenway, S.; Van Zee, J.W. The impact of channel path length on PEMFC flow-field design. J. Power Sources 2006, 160, 398–406. [Google Scholar] [CrossRef]
- Santamaria, A.D.; Cooper, N.J.; Becton, M.K.; Park, J.W. Effect of channel length on interdigitated flow-field PEMFC performance: A computational and experimental study. Int. J. Hydrogen Energy 2013, 38, 16253–16263. [Google Scholar] [CrossRef]
- Cooper, N.J.; Santamaria, A.D.; Becton, M.K.; Park, J.W. Investigation of the performance improvement in decreasing aspect ratio interdigitated flow field PEMFCs. Energy Convers. Manag. 2017, 136, 307–317. [Google Scholar] [CrossRef]
- Limjeerajarus, N.; Charoen-amornkitt, P. Effect of different flow field designs and number of channels on performance of a small PEFC. Int. J. Hydrogen Energy 2015, 40, 7144–7158. [Google Scholar] [CrossRef]
- Boddu, R.; Marupakula, U.K.; Summers, B.; Majumdar, P. Development of bipolar plates with different flow channel configurations for fuel cells. J. Power Sources 2009, 189, 1083–1092. [Google Scholar] [CrossRef]
- Sajid Hossain, M.; Shabani, B.; Cheung, C.P. Enhanced gas flow uniformity across parallel channel cathode flow field of Proton Exchange Membrane fuel cells. Int. J. Hydrogen Energy 2017, 42, 5272–5283. [Google Scholar] [CrossRef]
- Chen, S.; Xia, Z.; Zhang, X.; Wu, Y. Numerical studies of effect of interdigitated flow field outlet channel width on PEM fuel cell performance. Energy Procedia 2019, 158, 1678–1684. [Google Scholar] [CrossRef]
- Xiong, C.; Luo, M.; Chen, B.; Tu, Z. Effect of channel structure on oxygen distribution in cathode of fuel cells. Chi. J. Power Sources 2018, 42, 230–232. [Google Scholar]
- Arun Saco, S.; Thundil Karuppa Raj, R.; Karthikeyan, P. A study on scaled up proton exchange membrane fuel cell with various flow channels for optimizing power output by effective water management using numerical technique. Energy 2016, 113, 558–573. [Google Scholar] [CrossRef]
- Atyabi, S.A.; Afshari, E. A numerical multiphase CFD simulation for PEMFC with parallel sinusoidal flow fields. J. Therm. Anal. Calorim. 2019, 135, 1823–1833. [Google Scholar] [CrossRef]
- Anyanwu, I.S.; Hou, Y.; Xi, F.; Wang, X.; Yin, Y.; Du, Q.; Jiao, K. Comparative analysis of two-phase flow in sinusoidal channel of different geometric configurations with application to PEMFC. Int. J. Hydrogen Energy 2019, 44, 13807–13819. [Google Scholar] [CrossRef]
- Monsaf, T.; Hocine, B.M.; Youcef, S.; Abdallah, M. Unsteady three-dimensional numerical study of mass transfer in PEM fuel cell with spiral flow field. Int. J. Hydrogen Energy 2017, 42, 1237–1251. [Google Scholar] [CrossRef]
- Zhang, S.; Liu, S.; Xu, H.; Liu, G.; Wang, K. Performance of proton exchange membrane fuel cells with honeycomb-like flow channel design. Energy 2022, 239, 122102. [Google Scholar] [CrossRef]
- Kloess, J.P.; Wang, X.; Liu, J.; Shi, Z.; Guessous, L. Investigation of bio-inspired flow channel designs for bipolar plates in proton exchange membrane fuel cells. J. Power Sources 2009, 188, 132–140. [Google Scholar] [CrossRef]
- Ouellette, D.; Ozden, A.; Ercelik, M.; Colpan, C.O.; Ganjehsarabi, H.; Li, X.; Hamdullahpur, F. Assessment of different bio-inspired flow fields for direct methanol fuel cells through 3D modeling and experimental studies. Int. J. Hydrogen Energy 2018, 43, 1152–1170. [Google Scholar] [CrossRef]
- Zehtabiyan-Rezaie, N.; Arefian, A.; Kermani, M.J.; Noughabi, A.K.; Abdollahzadeh, M. Effect of flow field with converging and diverging channels on proton exchange membrane fuel cell performance. Energy Convers. Manag. 2017, 152, 31–44. [Google Scholar] [CrossRef]
- Wang, C.; Zhang, Q.; Lu, J.; Shen, S.; Yan, X.; Zhu, F.; Cheng, X.; Zhang, J. Effect of height/width-tapered flow fields on the cell performance of polymer electrolyte membrane fuel cells. Int. J. Hydrogen Energy 2017, 42, 23107–23117. [Google Scholar] [CrossRef]
- Jia, Y.; Sunden, B.; Xie, G. A parametric comparison of temperature uniformity and energy performance of a PEMFC having serpentine wavy channels. Int. J. Energy Res. 2019, 43, 2722–2736. [Google Scholar] [CrossRef]
- Ramin, F.; Sadeghifar, H.; Torkavannejad, A. Flow field plates with trap-shape channels to enhance power density of polymer electrolyte membrane fuel cells. Int. J. Heat Mass Transf. 2019, 129, 1151–1160. [Google Scholar] [CrossRef]
- Heidary, H.; Kermani, M.J.; Prasad, A.K.; Advani, S.G.; Dabir, B. Numerical modelling of in-line and staggered blockages in parallel flowfield channels of PEM fuel cells. Int. J. Hydrogen Energy 2017, 42, 2265–2277. [Google Scholar] [CrossRef]
- Shen, J.; Zeng, L.; Liu, Z.; Liu, W. Performance investigation of PEMFC with rectangle blockages in Gas Channel based on field synergy principle. Heat Mass Transf. 2019, 55, 811–822. [Google Scholar] [CrossRef]
- Zhang, S.; Qu, Z.; Xu, H.; Talkhoncheh, F.K.; Liu, S.; Gao, Q. A numerical study on the performance of PEMFC with wedge-shaped fins in the cathode channel. Int. J. Hydrogen Energy 2021, 46, 27700–27708. [Google Scholar] [CrossRef]
- Ghanbarian, A.; Kermani, M.J. Enhancement of PEM fuel cell performance by flow channel indentation. Energy Convers. Manag. 2016, 110, 356–366. [Google Scholar] [CrossRef]
- Yin, Y.; Wu, S.; Qin, Y.; Otoo, O.N.; Zhang, J. Quantitative analysis of trapezoid baffle block sloping angles on oxygen transport and performance of proton exchange membrane fuel cell. Appl. Energy 2020, 271, 115257. [Google Scholar] [CrossRef]
- Yin, Y.; Wang, X.; Shangguan, X.; Zhang, J.; Qin, Y. Numerical investigation on the characteristics of mass transport and performance of PEMFC with baffle plates installed in the flow channel. Int. J. Hydrogen Energy 2018, 43, 8048–8062. [Google Scholar] [CrossRef]
- Chen, H.; Guo, H.; Ye, F.; Ma, C.F.; Liao, Q.; Zhu, X. Mass transfer in proton exchange membrane fuel cells with baffled flow channels and a porous-blocked baffled flow channel design. Int. J. Energy Res. 2019, 43, 2910–2929. [Google Scholar] [CrossRef]
- Li, W.; Zhang, Q.; Wang, C.; Yan, X.; Shen, S.; Xia, G.; Zhu, F.; Zhang, J. Experimental and numerical analysis of a three-dimensional flow field for PEMFCs. Appl. Energy 2017, 195, 278–288. [Google Scholar] [CrossRef]
- Yan, X.; Guan, C.; Zhang, Y.; Jiang, K.; Wei, G.; Cheng, X.; Shen, S.; Zhang, J. Flow field design with 3D geometry for proton exchange membrane fuel cells. Appl. Therm. Eng. 2019, 147, 1107–1114. [Google Scholar] [CrossRef]
- Chen, X.; Yu, Z.; Yang, C.; Chen, Y.; Jin, C.; Ding, Y.; Li, W.; Wan, Z. Performance investigation on a novel 3D wave flow channel design for PEMFC. Int. J. Hydrogen Energy 2021, 46, 11127–11139. [Google Scholar] [CrossRef]
- Ashorynejad, H.R.; Javaherdeh, K.; Van den Akker, H.E.A. The effect of pulsating pressure on the performance of a PEM fuel cell with a wavy cathode surface. Int. J. Hydrogen Energy 2016, 41, 14239–14251. [Google Scholar] [CrossRef] [Green Version]
- Wang, Y.; Wang, S.; Wang, G.; Yue, L. Numerical study of a new cathode flow-field design with a sub-channel for a parallel flow-field polymer electrolyte membrane fuel cell. Int. J. Hydrogen Energy 2018, 43, 2359–2368. [Google Scholar] [CrossRef]


| Electrode | Equation of Electrochemical Reaction |
|---|---|
| Anode | |
| Cathode |
Disclaimer/Publisher’s Note: The statements, opinions and data contained in all publications are solely those of the individual author(s) and contributor(s) and not of MDPI and/or the editor(s). MDPI and/or the editor(s) disclaim responsibility for any injury to people or property resulting from any ideas, methods, instructions or products referred to in the content. |
© 2023 by the authors. Licensee MDPI, Basel, Switzerland. This article is an open access article distributed under the terms and conditions of the Creative Commons Attribution (CC BY) license (https://creativecommons.org/licenses/by/4.0/).
Share and Cite
Gong, M.; Zhang, X.; Chen, M.; Ren, Y. Proton Exchange Membrane Fuel Cell as an Alternative to the Internal Combustion Engine for Emission Reduction: A Review on the Effect of Gas Flow Channel Structures. Atmosphere 2023, 14, 439. https://doi.org/10.3390/atmos14030439
Gong M, Zhang X, Chen M, Ren Y. Proton Exchange Membrane Fuel Cell as an Alternative to the Internal Combustion Engine for Emission Reduction: A Review on the Effect of Gas Flow Channel Structures. Atmosphere. 2023; 14(3):439. https://doi.org/10.3390/atmos14030439
Chicago/Turabian StyleGong, Mengjun, Xinyu Zhang, Mengrong Chen, and Yong Ren. 2023. "Proton Exchange Membrane Fuel Cell as an Alternative to the Internal Combustion Engine for Emission Reduction: A Review on the Effect of Gas Flow Channel Structures" Atmosphere 14, no. 3: 439. https://doi.org/10.3390/atmos14030439