

Surface Microbial Contamination and Air Quality before and after Regular Cleaning Procedures

1
Faculty of Public and Environmental Health, University of Khartoum, Khartoum 205, Sudan
2
Department of Public Health, College of Health Sciences, Saudi Electronic University, Riyadh 11673, Saudi Arabia
Atmosphere 2023, 14(2), 352; https://doi.org/10.3390/atmos14020352
Submission received: 1 January 2023
/
Revised: 7 February 2023
/
Accepted: 8 February 2023
/
Published: 10 February 2023
(This article belongs to the Topic Indoor and Outdoor Air Quality in the Era of COVID-19)
Abstract
:Studies on indoor air quality (IAQ) have linked exposure to microorganisms in indoor air to a variety of illnesses. The association between indoor air quality, surface contamination, and IAQ under heterogeneous cleaning procedures are all crucial factors that were investigated in this study. The ATP bioluminescence test demonstrated a significant correlation (r = 0.89; p 0.05) with bacterial count obtained from swab specimens and a moderate correlation (r = 0.57; p 0.001) with viable settling bacterial count. For the entire sample (pre- and post-cleaning), the ATP values were heterogeneous, averaging 230 RLU/100 cm2, 140 RLU/100 cm2, 120 RLU/100 cm2, 135 RLU/100 cm2, 99 RLU/100 cm2, and 80 RLU/100 cm2, in offices, classrooms, toilet doorknobs, reception desks, main lobbies, and exit doorknobs, respectively. An insignificant association between indoor and outdoor PM2.5 (r = 0.21; p 0.05), an I/O ratio of PM2.5 with an average value of 1.2, and an I/O ratio of CO2 exceeding 1 suggest a minor impact of outdoor air. After cleaning, the bacterial and fungal counts on indoor surfaces showed significant reduction, suggesting that the cleaning procedures were effective. The concentrations of VOC but not HCHO in indoor air were significantly affected by cleaning, but not by temperature or relative humidity (RH). We propose ATP bioluminescence as a surrogate for detecting bacterial contamination rather than fungal contamination, which requires additional validation. We suggest that the results of active microbial sampling (in CFU/m3) and settling plates (in CFU/m2/h) be interpreted independently to avoid confusion.
1. Introduction
Exposure to indoor air pollutants, particularly aerosols, has been implicated as a major cause of respiratory diseases such as pneumonia, bronchitis, and respiratory inflammation [1,2,3]. It has been shown that poor air quality can increase the risk of death from respiratory diseases [4], cardiovascular illnesses [5,6,7], and cytotoxicity or DNA damage [8,9]. Air pollution is also associated with several health outcomes such as severe acute respiratory syndrome (SARS) and coronavirus (SARS-CoV) outbreaks [10]. Air pollution has a role in causing asthma and chronic obstructive pulmonary disease (COPD) that needs further investigations to differentiate between effects of single pollutants and combined effects of the complex mixture of air pollutants in the air [11,12].
There is still ambiguity surrounding the relationship between exposure and health outcomes owing to the fact that most of the epidemiological studies conducted in this field were based on exposure to total particulate matter rather than studying specific types of particles [13]. Moreover, a limited number of previous studies have assessed the actual exposure to indoor air pollution through direct environmental air measurements. The current state of air quality is not the only factor that affects the relationship between air pollution and the health status of exposed individuals. According to recent studies, poor socioeconomic status, poor housing, history of repeated lower respiratory tract infections during childhood, history of pulmonary tuberculosis, chronic asthma, intrauterine growth retardation, and poor nutrition are all considered fundamental risk factors leading to the development of respiratory illnesses such as COPD in adults and acute lower respiratory infections (ALRI) in children [14,15].
Indoor air quality is influenced by indoor human-related activities, building materials, furniture, and outdoor air quality [14]. The heating, ventilation, and air conditioning (HVAC) system, particularly ventilation, has a tremendous effect on IAQ and is considered an essential aspect for controlling respiratory infections, increasing the performance of occupants (employees, students, etc.), and reducing the disease burden on asthmatics and people who suffer from allergy [16]. Ventilation is linked with occupancy that in turn is associated with a risk of infection because an increase in the number of occupants implies higher exposure as people rebreathe each other’s air [17,18]. Human activities affect indoor air quality in a variety of ways, including resuspension of particles, production of carbon dioxide, and creation of favorable conditions for the development of microbes [14].
The adenosine triphosphate (ATP) bioluminescence assay, known also as ATP fluorescent marker, has been recognized as a reliable technique for investigating hygiene and surface contamination [19]. The ATP biofluorescence assay is a measure of the residual ATP of non-viable and viable microorganisms [20]. It has been applied in different situations for exploring total microbial load on surfaces, and on hands. Therefore, ATP portable devices are regarded as user-friendly and flexible tools in the field of mobile health [20,21,22,23,24,25,26]. The usefulness and feasibility of the ATP fluorescent marker increase when they are applied alongside other hygiene verification techniques such as RODAC (Replicate Organisms Detection and Counting) contact plates, sponges for quantitative analysis of microbial contamination [20,27], and volumetric active sampling of microbes [28]. There are several advantages of the ATP monitoring technique; for instance, rapidity and reliability help decision makers improve levels of safety and infection control measures. Moreover, ATP assay is an acceptable method for checking compliance with hygiene standards such as hazard analysis and critical control points (HACCP), and ISO standards. Furthermore, ATP assay helps in training workers who perform housekeeping. Likewise, it is an effective method to measure the effectiveness of the current cleaning and disinfection methods. Finally, ATP bioluminescence gives an indirect indication about microbial air quality of indoor environment [25,29,30]. The application of ATP assay is therefore an essential step toward achieving the goals of controlling the outbreak of COVID-19 and other respiratory infections and hygiene-related diseases that are closely linked to indoor air quality and to hygiene.
For investigating viral contamination, indirect methods such as ATP assays are more practical for estimating viruses in the air than the use of direct measures of viruses to judge the microbial quality of the air and on hygiene indoors. The reason is that direct air sampling of viruses is neither demanded nor recommended because viruses are obligate microbes, which means that they cannot complete their life cycle outside the host. Therefore, it is not feasible to take samples using conventional methods such as culturing. In the same regard, dryness and temperature kill most viruses [31]. The possible route of transmission of some viruses, including SARS-CoV, is still a controversial issue, whether to be considered as airborne diseases or diseases spreading by droplets via direct contact [17]. Lastly, there are currently no exposure limitations for indoor microbial agents; however, the overall microbial load serves as a clear indicator of quality and cleanliness [32].
In contrast, ATP-based measuring approaches have some drawbacks, including (I) the difficulty of conducting direct comparisons of findings acquired from different ATP instruments, i.e., comparing relative light units (RLUs) [23]; (II) results are negatively influenced by the existence of free ATP from lysed cells (recently destroyed microbial cells) that remain for sometimes which lead to overestimation of results, and ATP readings are overestimated by the existence of organic debris and residuals of detergents and disinfectants [33]; (III) bacterial spores reveal low ATP counts, but in fact, they pose a health threat, and a lack of knowledge on the types of microorganisms or their sources may lead to inconsistencies in the results, since the average ATP content of mammalian cells and yeast is approximately 100-fold higher than that of bacteria [23]; (IV) lastly, there are no clear benchmarks established for ATP contents to judge on the effectiveness of cleaning, although some studies suggest arbitrary ATP values ranging from 100 RLU/100 cm2 to 500 RLU/100 cm2. The goals and novelty of this study involve correlating findings of ATP bioluminescence with sampling for viable microbes in an attempt to understand the usefulness of ATP assay in detecting surface contamination and determining the association between indoor air quality and surface contamination. Additionally, recognizing the impact of cleaning practices on certain IAQ parameters such as total VOC and HCHO and determining the effectiveness of cleaning are other goals of the current study.
2. Materials and Methods
2.1. Study Area and Sampling
This study was conducted in two buildings at the Saudi Electronic University located in northern Riyadh, Saudi Arabia, between April 2022 and October 2022. Over 34,000 students are enrolled in the university through blended e-learning. The first study site is an administrative building that covers an area of around 8000 m2, consisting of administrative offices, lobbies, and classrooms. The second is a college building covering an area of approximately 4000 m2 that includes offices for faculty members, a few classrooms, a main lobby, and a mini health center. Both buildings were constructed in the past eight years, and they are in good condition and well maintained. The buildings are ventilated with air conditioners, with no apparent cracks that may increase the penetration of outdoor pollution into indoor spaces, and all windows are kept closed all the time. In each building, there is a main entrance, which remains closed and opens automatically using sensors while people enter the building, along with an alternative gate. Additionally, in each building, there is an exit leading to a car parking zone in the basement. In the administrative building, samples were collected on the ground floor from classrooms, main lobbies, reception rooms, toilets, and corridors, while in the second building, a few samples were collected on the second and third floors at the offices of faculty members, with the rest being collected on the first floor in the reception room, the main lobby (waiting hall), and toilets. All samples were collected during the daytime between 8:00 a.m. and 4:00 p.m. Indoor samples were collected at one meter height from the ground level and one meter away from the wall, and outdoor samples were collected in the close surroundings (microenvironment) at one meter distance from the wall and one meter from the ground level. The number of samples to be collected was guided by a walk-through survey and a pilot study, during which 20 random samples (6 active air samples, 6 passive air samples, and 8 surface swab samples) were collected and analyzed; more details on the number of samples are given in Table 1. The following were criteria for selecting microbial sampling sites/surfaces:
- Surfaces and sites accessed daily that are most likely to have microbial contamination affecting the hygiene standards.
- Surfaces and sites most likely exhibit the heaviest microbial growth and proliferation during working hours, due to favorable environmental conditions.
- The site selection is also guided by grid profiling to cover most indoor surfaces and a statistical design to collect a representative sample of each type of surface.
- Sites that are routinely cleaned by two different staff members were sampled twice.
- Some sampling sites were selected to represent the most inaccessible or difficult areas to disinfect or clean [34].
2.2. ATP Bioluminescence Assay
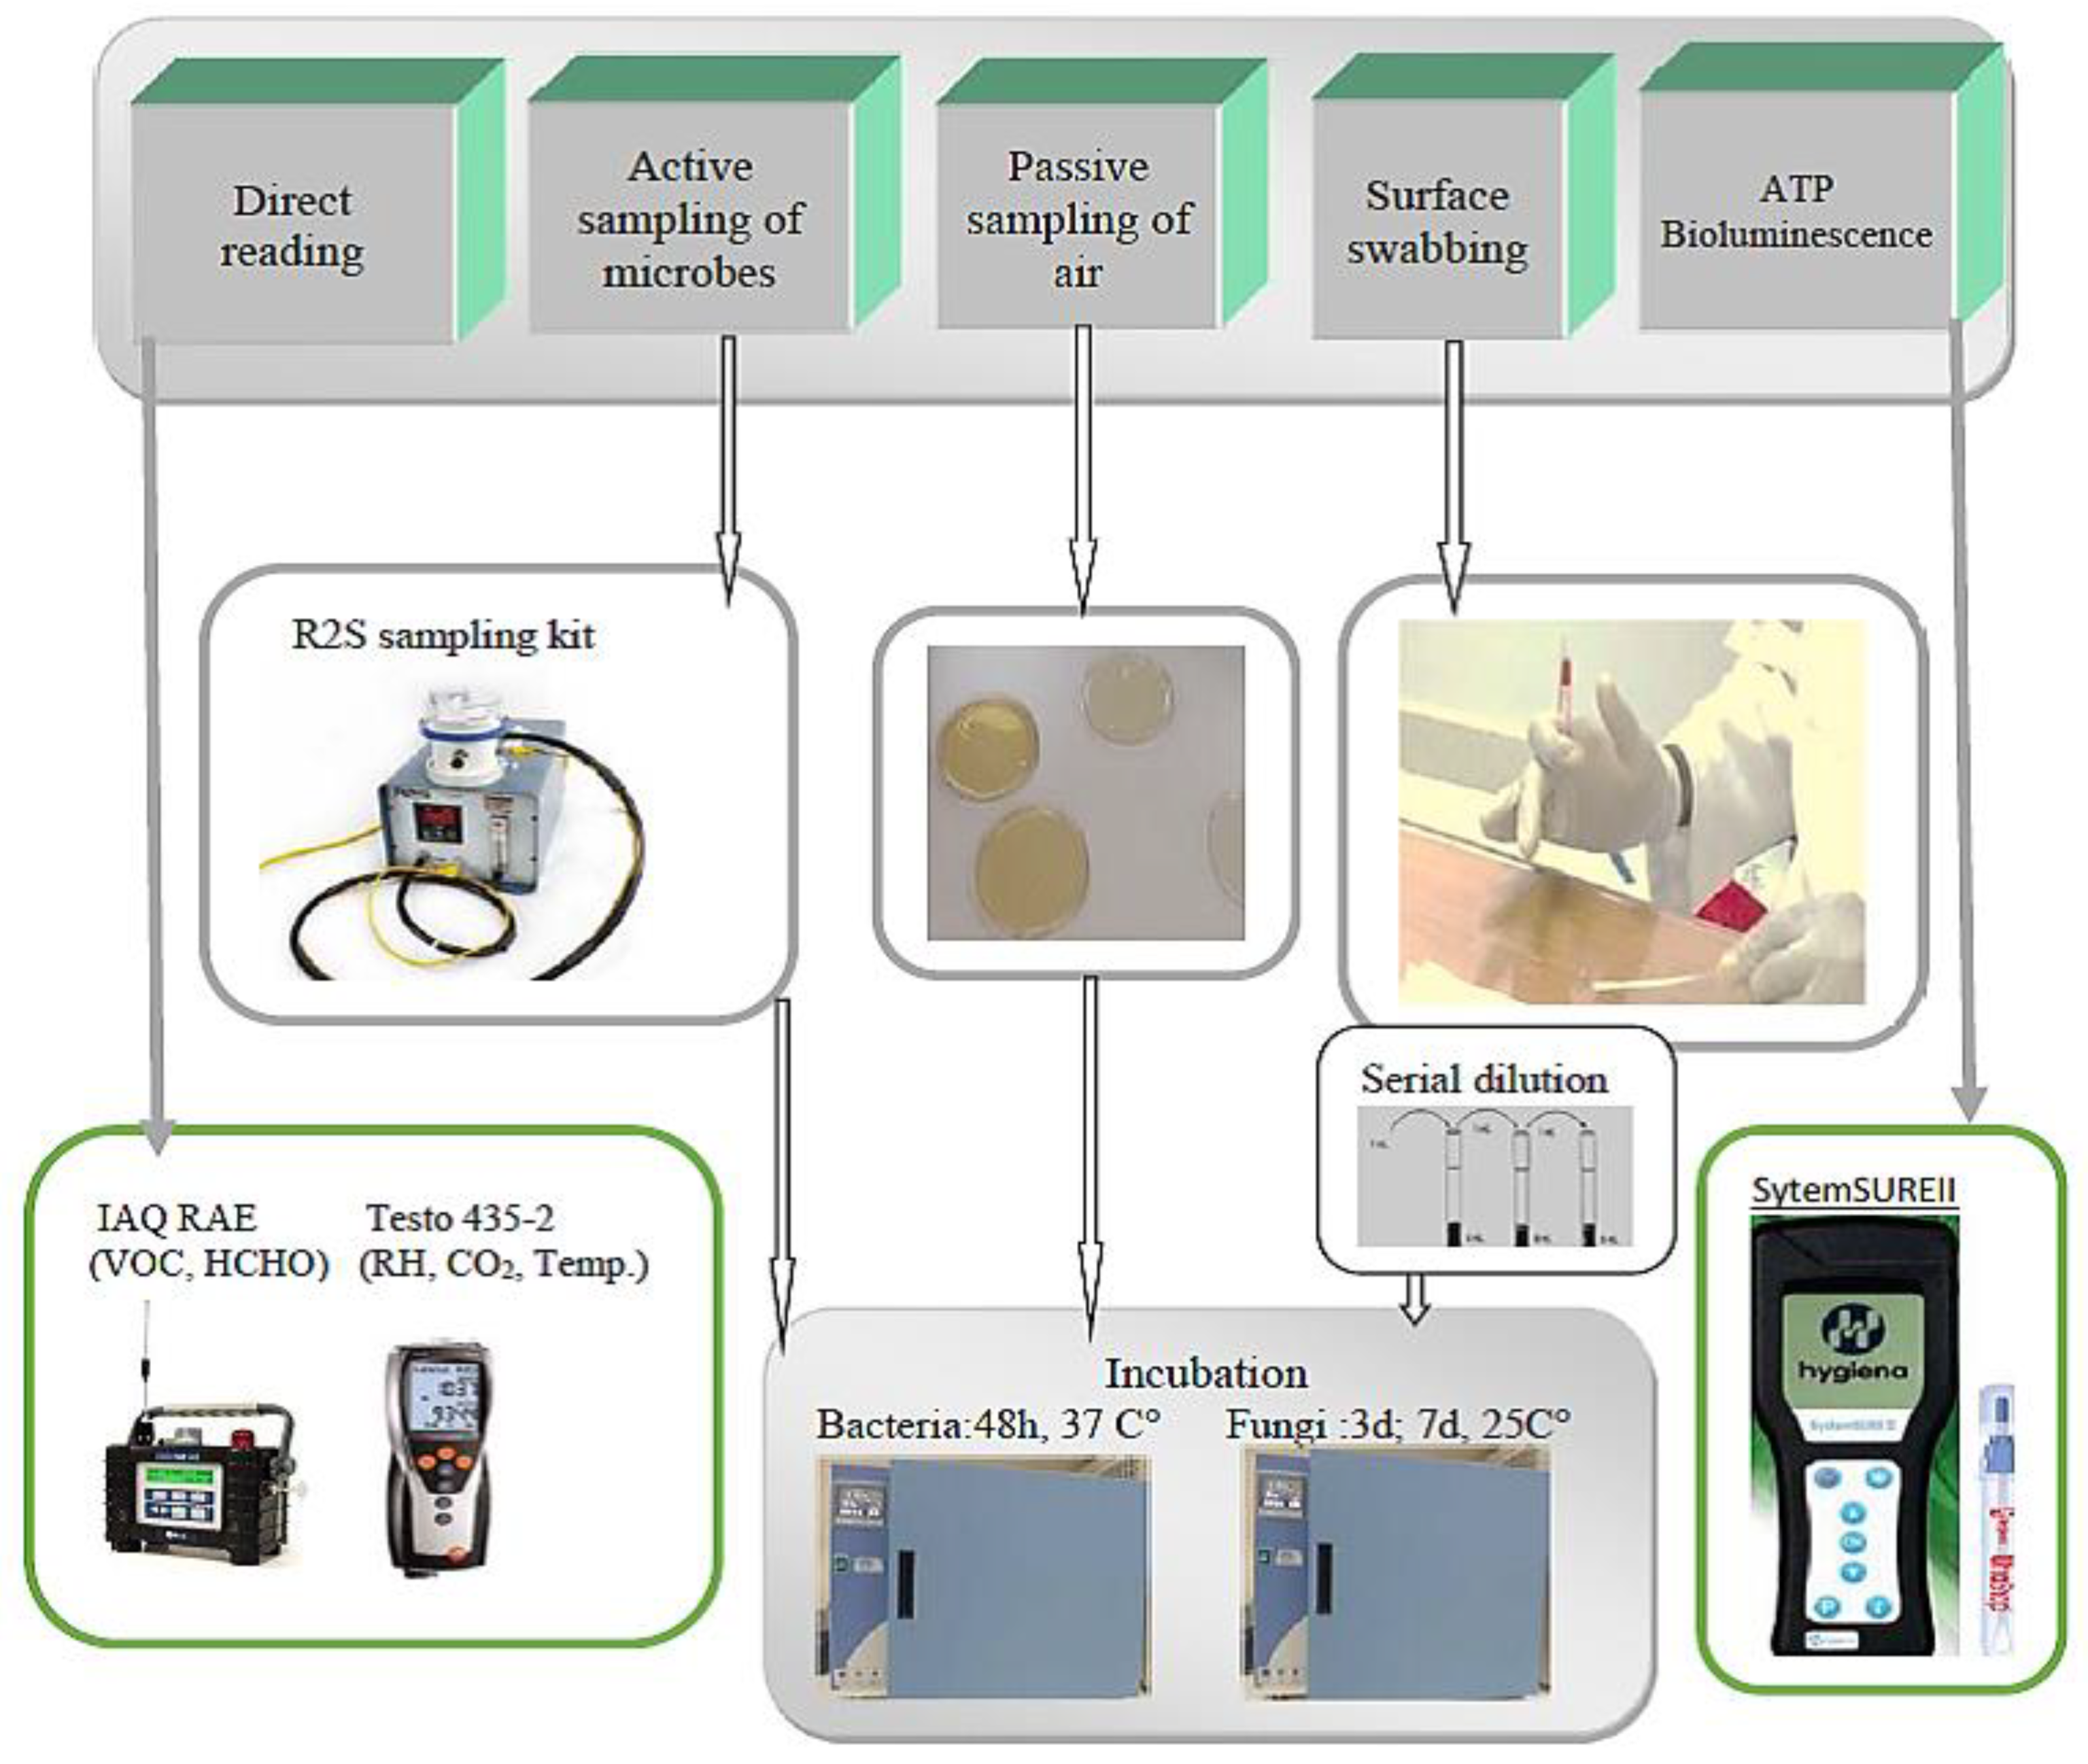
A verified SystemSURE II monitor in conjunction with Ultrasnap ATP (Hygiena® LCC, 941 Avenida Acaso, Camarillo, CA 93012, USA) was used for the bioluminescence assay (see Figure 1) [21,35]. In brief, the Ultrasnap ATP is an internally sterile tube containing luciferase enzyme and a cotton swab. For each sample, a new cotton swab is used for swabbing an area of 10 × 10 cm2 (100 cm2) of an investigated surface. The cotton swab is placed in the Ultrasnap tube that contains luciferase, then shaken forwards and backwards for 10 s before being placed in a test hole of SystemSURE II to obtain a direct reading; more details on swabbing for ATP bioluminescence are found in the literature [36]. The bioluminescence relies on adenosine 5-triphosphate (ATP), an energy source nucleotide produced inside the body that is consumed by several enzymes during biochemical processes that require energy. ATP is hydrolyzed by the enzyme luciferase, resulting in adenosine monophosphate (AMP), while the stored energy is discharged in the form of light as in the following Equation (1) [37]. The quantity of the measured ATP is then expressed as relative light units (RLU)/100 cm2.
2.3. Active Air Sampling
The active sampling technique was applied to collect mesophilic aerobic bacteria and fungi. For total bacterial count, Tryptic Soy Agar (TSA) [38] (supplemented with 0.25% cycloheximide for inhibiting the growth of fungi) was used as a general culture media. Meantime, for the cultivation of fungi, Malt Extract Agar medium (supplemented with 1% chloramphenicol to suppress the growth of bacteria) was used [39]. Samples were collected using the R2S (Remote-Slit-Sampler) Microbial Air Sampler (see Figure 1) (EM Technologies LLC, 1500 Kansas Avenue, Concordia, KC, USA) that operated at a medium flow rate of 28.3 for 5 min. All air samples were collected by placing the sampler 1–1.5 m from the floor level [39,40]. This sampler allows the collection of viable bioaerosols without disturbing their settlement. The total microbial counts per one cubic meter (CFU/m3) are then recalculated from the total volume collected during the given sampling duration. The R2S sampler operates with “Slit-to-Agar” active sampling methodology, where the sampler is equipped with a synchronous turntable motor that guarantees even distribution of the collected bioaerosols on the culture media. Other advantages of the R2S microbial air sampler include the existence of a built-in rotometer to adjust the airflow rate, the use of standard 90 mm plates that offer a large surface area for microbial growth, and, importantly, the sampler generates virtually no particulate matter that may affect readings.
2.4. Surface Swabbing and Settling Plates for Viable Microbes
Settling plates using standard Petri dishes of size 90 mm were used as passive sampling tools for collecting settling particles [41]. Particles were allowed to settle for a duration of 4 h, and the results were recalculated and expressed as CFU/m2/h. Meanwhile, for surface swabbing, sterile cotton swabs (moistened with sterilized water) were applied to wipe a quantifiable surface area of 10 × 10 cm2 (100 cm2) adjacent to the areas subjected to ATP bioluminescence testing [42,43]. Subsequently, each of the collected swabs was then eluted in 2–5 mL distilled water using an orbital shaker for 30–45 min. The spread plate method was applied by spreading 0.1 mL of the resulting suspension over the culture media. Three dilutions were applied for each of the swab samples, with the results being recalculated and expressed in CFU/100 cm2 to facilitate the comparison with ATP results expressed as RLU/100 cm2. All plates collected through the two aforementioned techniques were incubated at 35–37 °C for bacterial counts, with results being reported twice, after 48 h and after 72 h. Similarly, for the purpose of fungal counts, plates were incubated at 25 ± 1 °C, with the results being reported twice, after 3 days and after 7 days [38,44].
2.5. Non-Microbial IAQ Parameters
The total volatile organic compounds (VOC) and formaldehyde (HCHO) were measured using the IAQ RAE Monitor (Honeywell International Inc., 300 S. Tryon St. Suite 500, Charlotte, NC, USA). The CO2, RH, and temperature were monitored using an ISO-certified Testo 435-2 multifunction IAQ meter (Testo SE & Co. KGaA, Postfach 11 40, 79849 Lenzkirch, Germany), while PM2.5 and PM10 measurements were performed using a Temtop aerosol dust monitor, Model PMD 351 (Pilot Free Trade Zone, No. 188, Ona Road, Shanghai, China). Measurements were performed indoors (main lobbies, classrooms, offices, and reception) and outdoors, in close proximity to the areas where microbial samples were collected. For all of the non-microbial IAQ parameters including CO2, VOC, HCHO, RH, and temperature, simultaneous measurements were made. Measurements were based on TWA (time-weighted average) exposure, where for each parameter, several readings were reported over 5 min, with the average values taken to represent individual samples. These short-term measurements were consistent with the duration of active air sampling of microbes.
2.6. Description of Cleaning Procedure Applied in the Study Area
As part of a routine cleaning procedure in the study area, three commercially available disinfectant cleaning formulations were simultaneously applied, usually mixed with water. The first product is a chlorine-based disinfectant consisting of benalkonium chloride, methylisothiazolinone, 5% non-ionic surfactants, 2-Bromo-2-nitropropane-1,3-diol, methylchloroisothiazolinone, Linalool, perfumes, and preservatives, and 100–125 mL of this product is usually added to 2 L of water. The second solution is a cleaning product containing alcohol, ethylenediaminetetraacetic acid, fatty acid soap, chloroxylenol, and pine essential oil, of which around 100 mL is commonly mixed with 4 L of water. The third product, which is a shampoo basically intended for cleaning marble and ceramic surfaces but used as a general cleaner, consists of approximately 5–15% surface-active ingredients, 5–15% ionic materials, and perfumes; commonly, 80–100 mL is added to 4–5 L of water. Although instructions for use are provided on the label of each product indicating the appropriate dilutions, cleaning personnel sometimes apply an equal amount (100 mL) of each product to 4–5 L water. In this study, the cleaning was performed by applying the second product first by adding 100 mL of it to 4 L of water, followed by cleaning the same surfaces with the first product at a concentration of 100 mL/2 L of water. The third product was applied at a concentration of 80 mL/4 L of water as a general cleaner, along with the 1st and 2nd products. As a common practice in the study area, microfiber cloth wipes were used for both washing and subsequent wiping of surfaces in offices, main lobbies, classrooms, and reception. For washing in toilets, polyurethane foam wipes were used, followed by the use of microfiber cloth wipes for wiping surfaces.
2.7. Quality Assurance/Quality Control
- I
- II
- For active air sampling, blank samples (Petri dishes with the culture media but not exposed to air) representing 5% of the total number of the real samples were treated the same way as the samples, with their results being used for correcting any systematic errors in sampling.
- III
- IV
- For bacterial and fungal counts using surface swabbing, two replicate samples were taken for each sample eluted in distilled water, inoculated into culture media in two separate Petri dishes and incubated the same way.
- V
- All samples for microbiological examination were either delivered immediately to the lab or stored for less than two hours in a portable field incubator.
- VI
- The selected buildings are all smoke-free and cooking-free, which facilitates the calculation of the influence of outdoor air infiltration and reduces interferences from potential localized sources of air pollution.
- VII
- The culture medium obtained as a solid powder was properly autoclaved to eliminate cross-contamination and prepared according to the manufacturer’s directions.
- VIII
- Since all microbial analyses were performed by cultivating/inoculating the samples in Petri dishes, the detection limit is considered one colony per Petri dish. That is, even a single colony can accurately be detected given that all steps of analysis are followed correctly.
2.8. Statistical Data Analysis
Data visualization, including 3D contour mapping, generation of line charts, and descriptive tables and Pearson correlations, were performed using Statistical Analysis System—John’s Macintosh Project (SAS JMP), version 14 Pro (from the SAS Institute, Cary, NC, USA). Meanwhile, some tests such as analysis of variance (ANOVA) and regression were conducted with the Statistical Package for Social Science (IBM SPSS), version 26 (International Business Machines, IBM Corporation, Armonk, NY, USA). All of the statistical tests were carried out at 95% confidence levels, and only p values ≤ 0.05 were accepted and included in the results.
3. Results and Discussion
3.1. Estimating the Relationship between Indoor and Outdoor Air
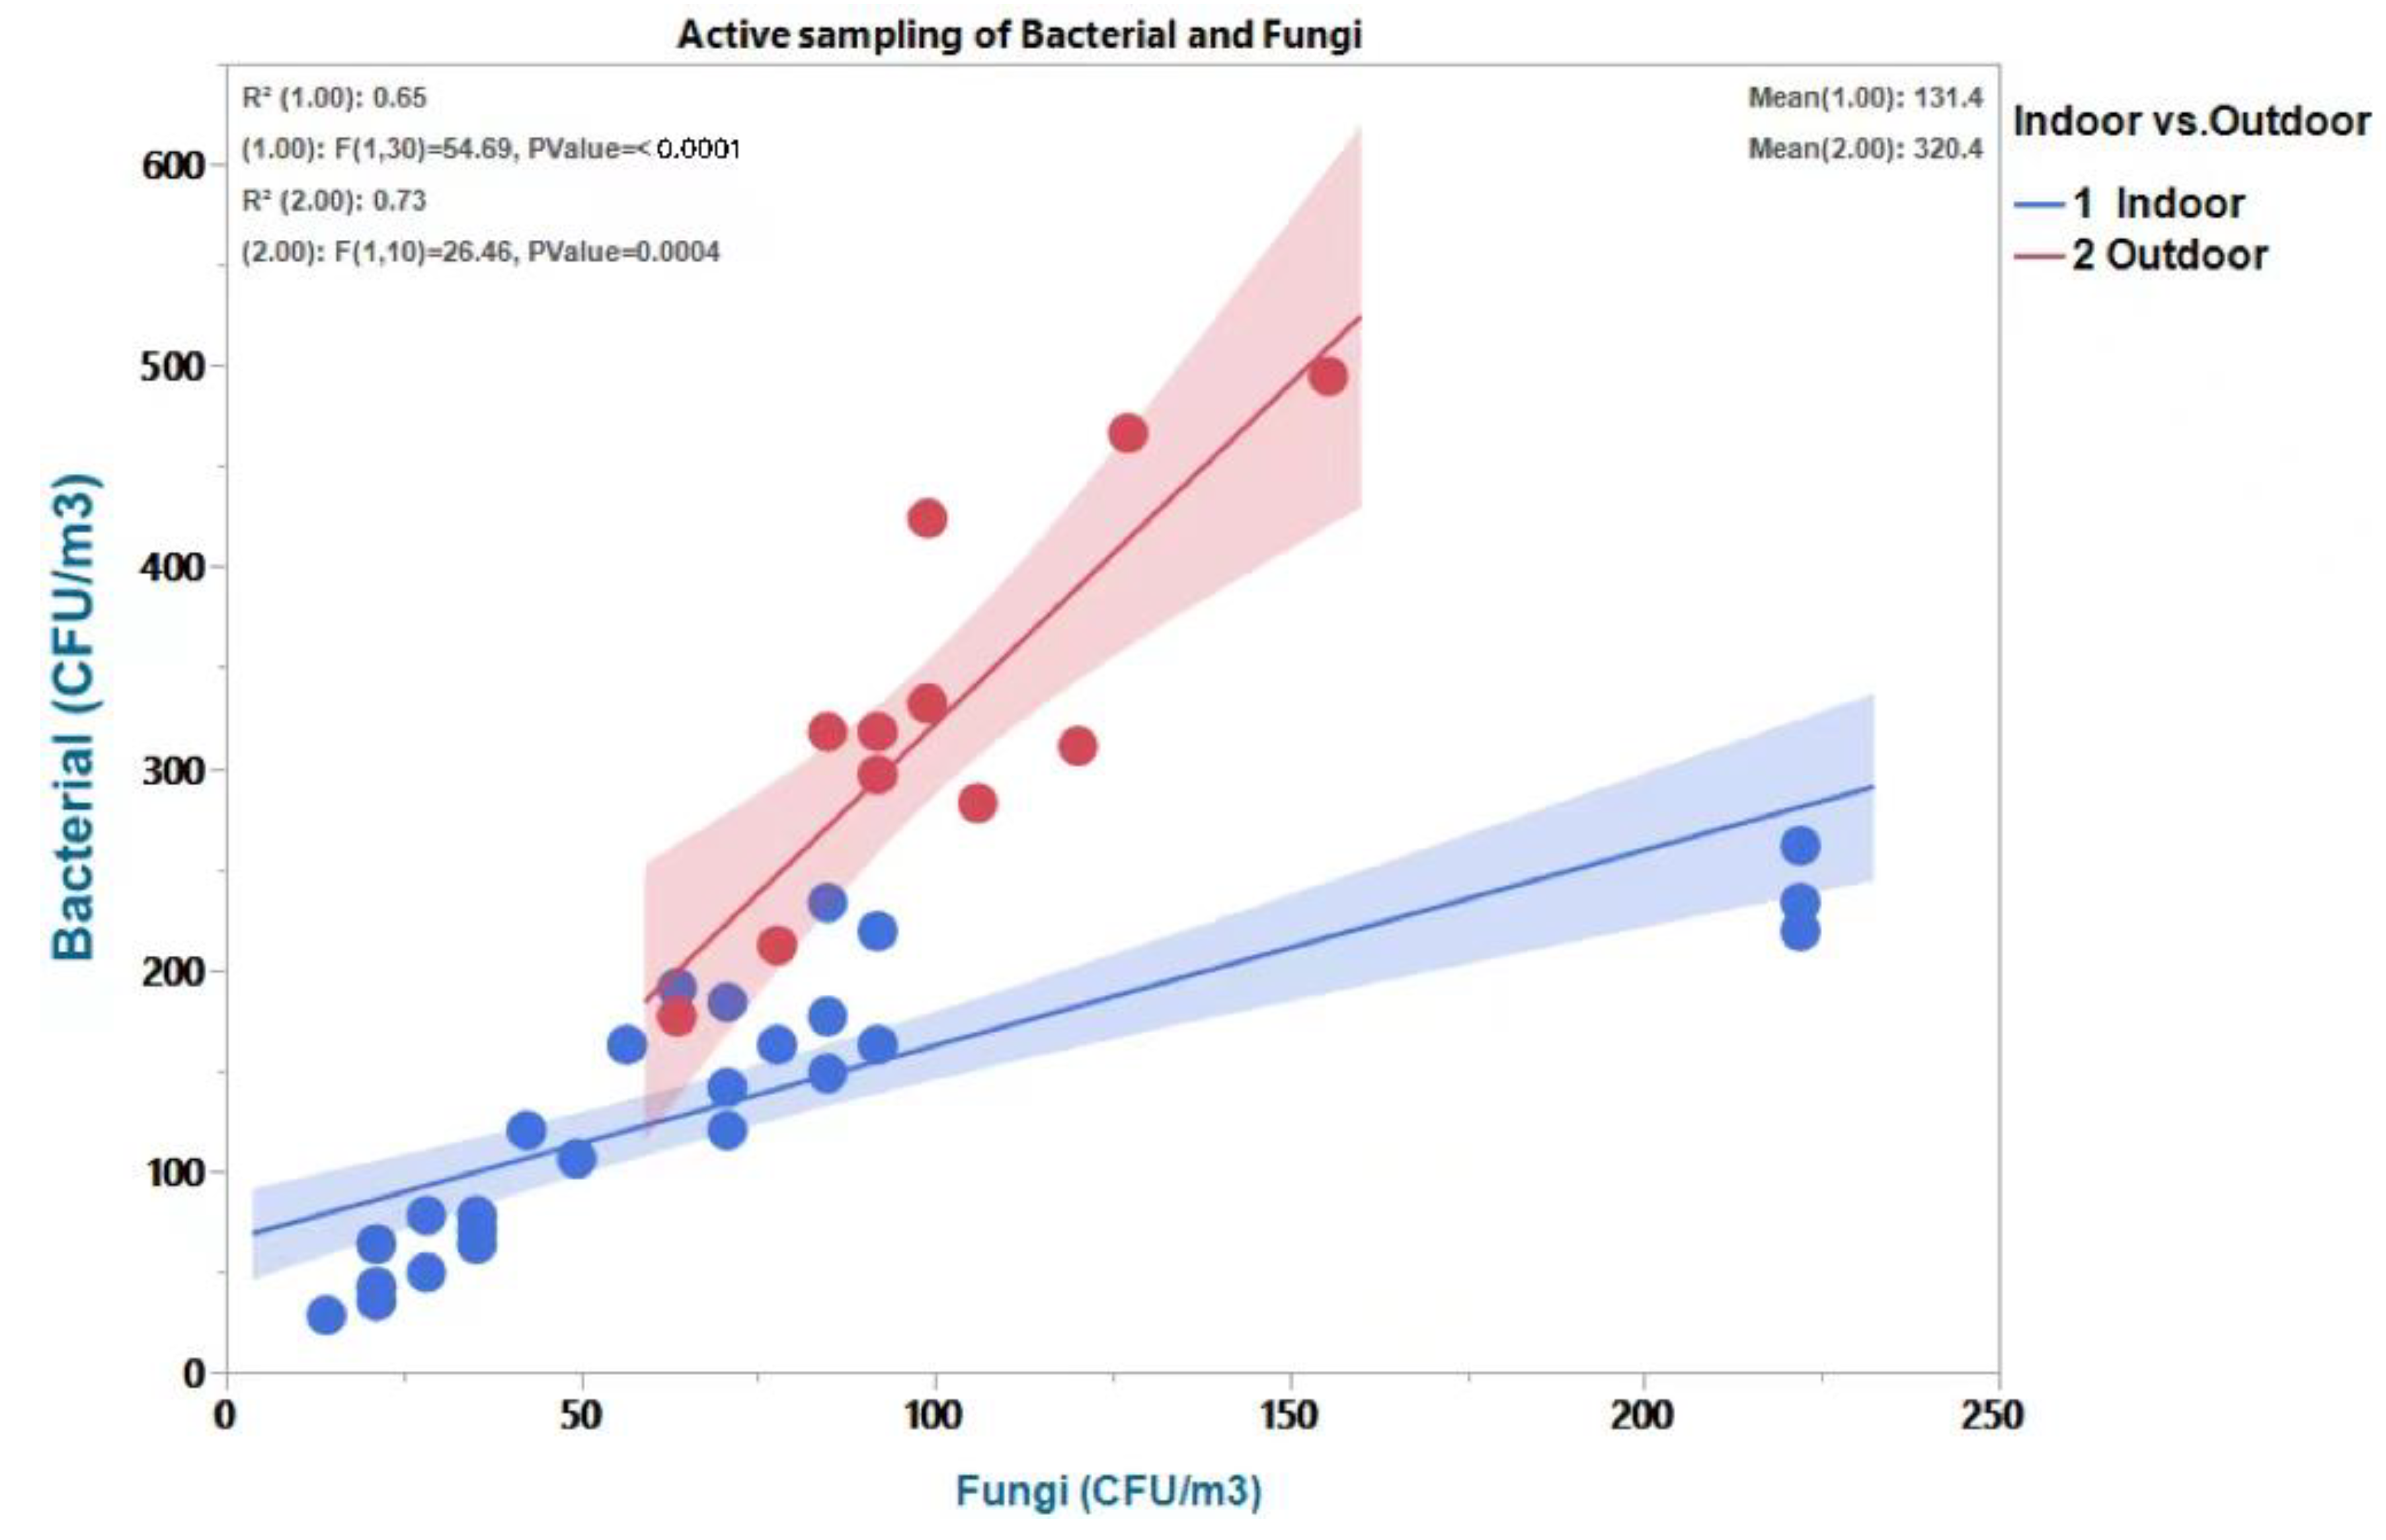
The assessment of airborne microbial load using active sampling revealed that the majority of I/O ratios were consistently larger than 1 for bacteria but less than 1 for fungi. Nevertheless, the trend of I/O ratios of bacteria and fungi is commonly changing and affected by seasonal conditions [45]. At a confidence level of 95%, an ANOVA test revealed a significant difference in airborne viable bacterial and fungal loads [F (1,31) = 33; p 0.001], with outdoor fungal loads being greater than indoor loads and outdoor bacterial loads being more prominent than indoor loads. In the same regard, Figure 2 showed a fair association (R2 = 0.65; p ≤ 0.001) between bacteria and fungi indoors, compared to a strong correlation (R2 = 0.73; p ≤ 0.001) outdoors, respectively, with lower and upper limits of R2 being 0.45 and 0.73, and p ≤ 0.001. In accordance with the findings of a relevant study conducted in private dwellings, it has been shown that the majority of bacteria originated from indoor sources and the majority of fungi from outdoor sources [44]. Likewise, Kalwasiska et al., 2012, who carried out a similar study in a university library, indicated that indoor contamination with bacteria is greater than that of fungi, and vice versa for outdoor contamination, where fungal load is greater than bacterial load.
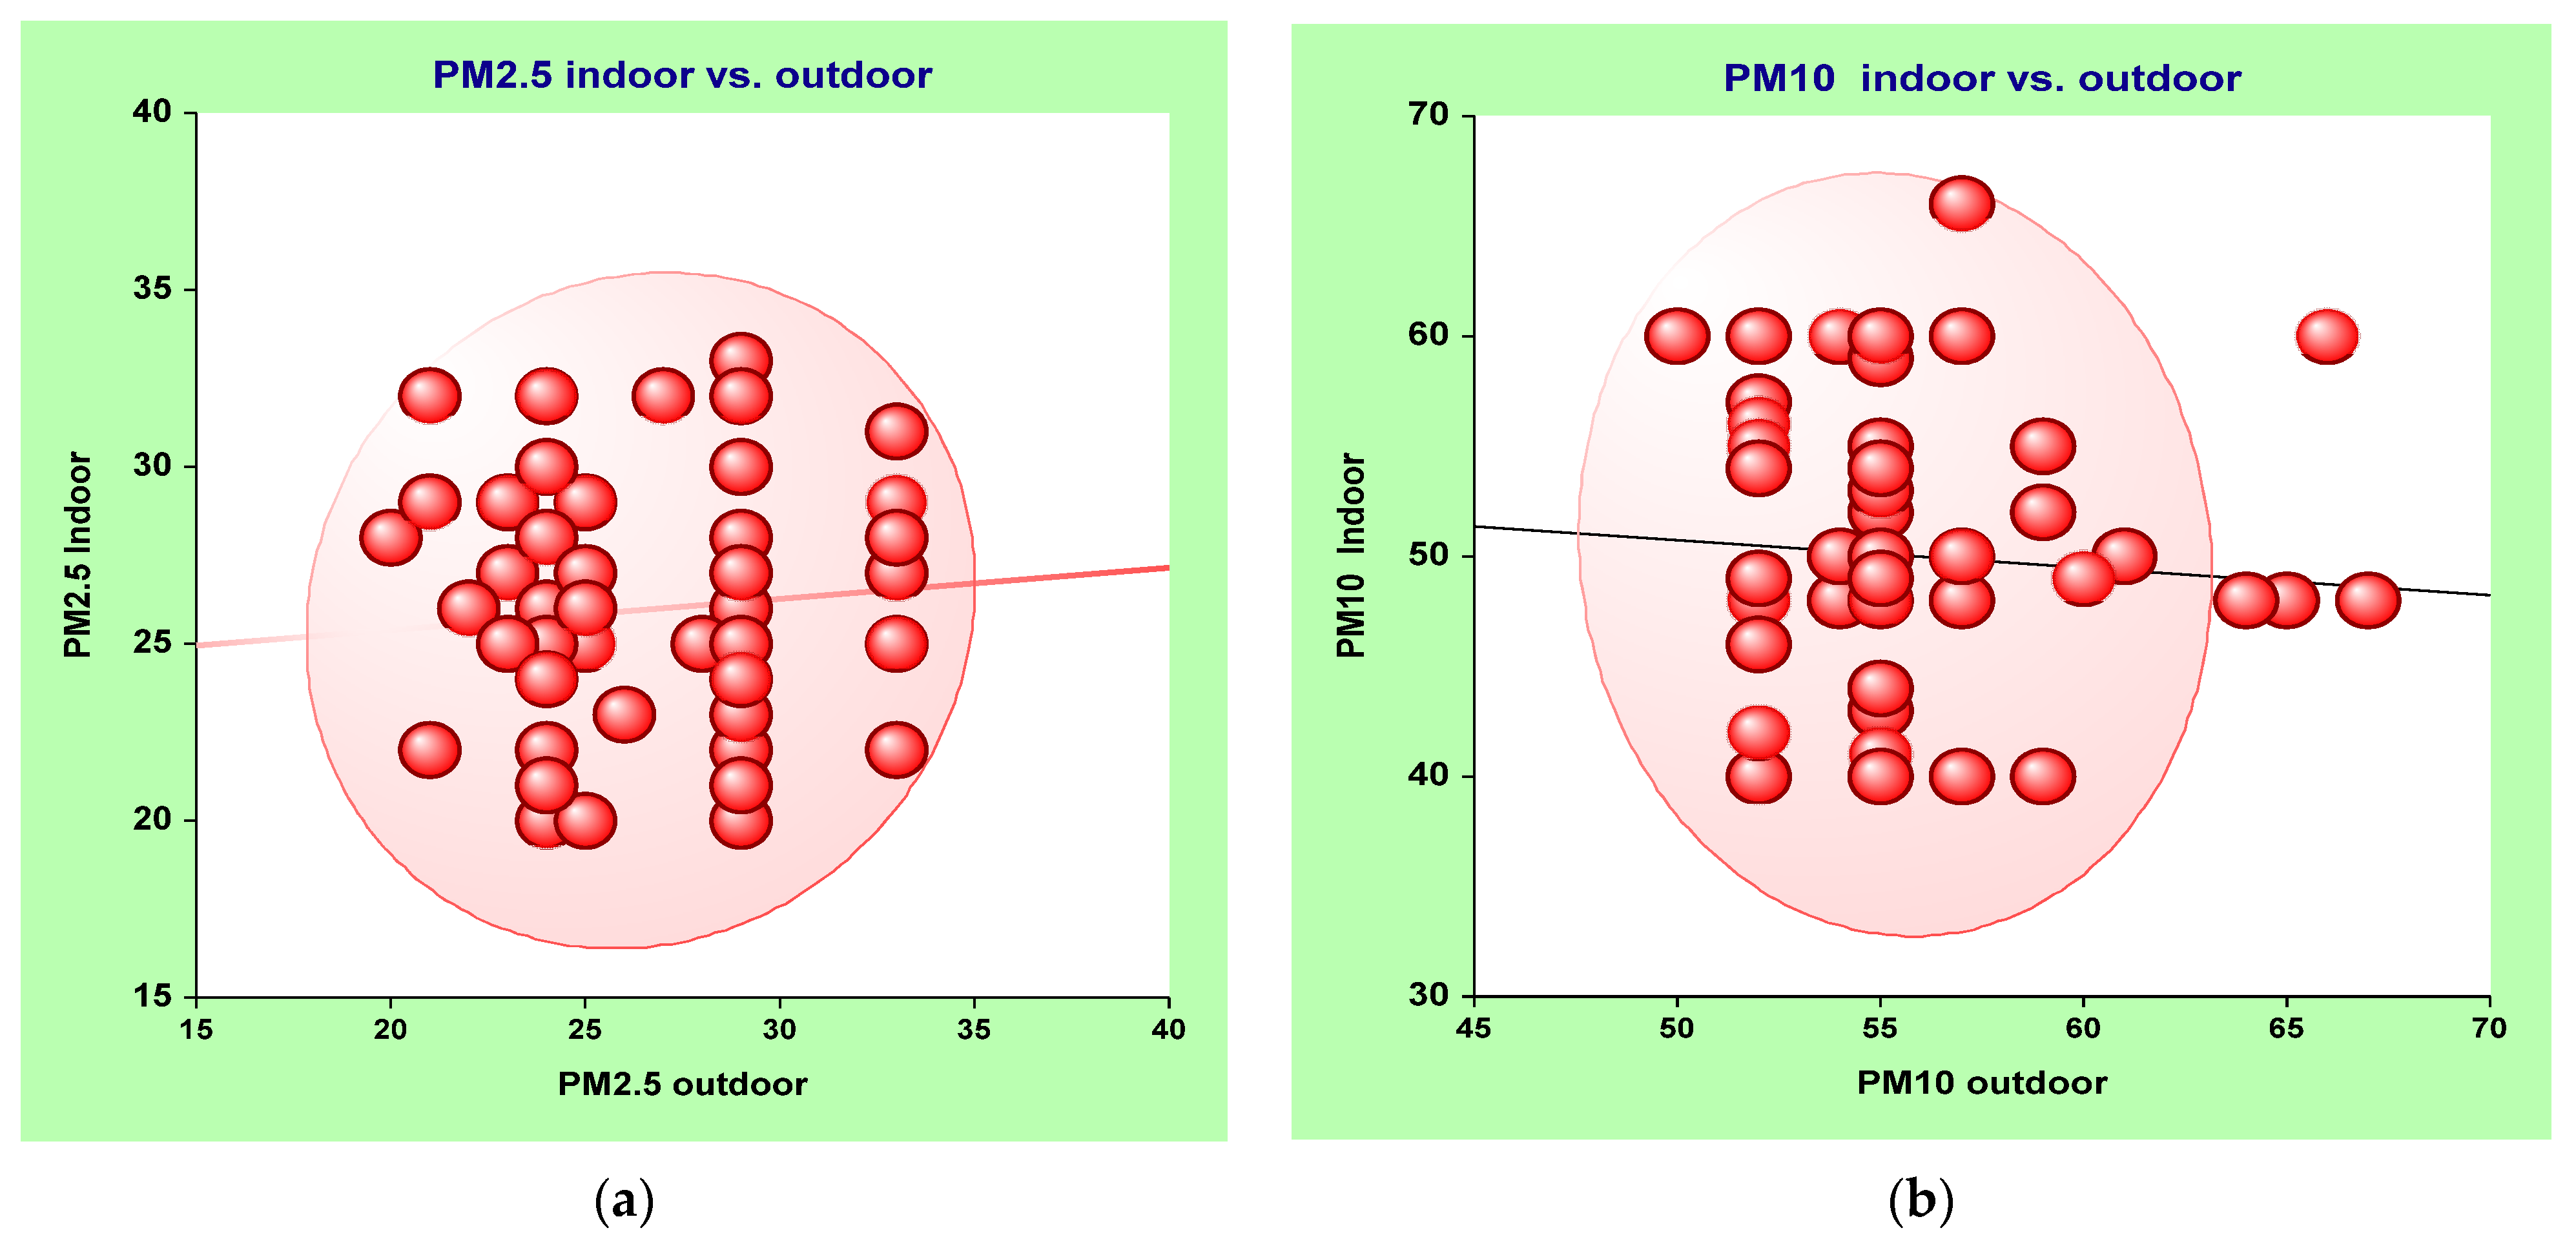
Indoor–outdoor ratios and correlations for PM2.5 and PM10 were also determined to evaluate I/O relationships, as mentioned elsewhere [47,48,49,50,51]. Figure 3 shows an insignificant correlation between indoor and outdoor PM2.5 (r = 0.21; p ≥ 0.05), and between indoor and outdoor PM10 (r = −0.11; p ≥ 0.05), as well as regression line and probability ellipse of 95% confidence levels, which are all visualized. These insignificant relations between indoor and outdoor levels of aerosols confirm the idea that indoor pollution is mostly attributed to indoor sources rather than penetration of outdoor air. The I/O ratios of PM2.5 ranged from 0.8 to 1.4, with an average ratio of 1.2, while I/O ratios for PM10 mainly varied between 0.5 and 1.1, with an average value of 0.86.
Additionally, concentrations of CO2 indoors and in close proximity to the outdoors were measured to estimate the possible impact of occupancy, and the efficiency of ventilation [52]. In accordance with information about CO2 levels in schools, we discovered that the majority of I/O ratios of CO2 are greater than 1, implying a possible influence of indoor sources [53]. More information about the interpretation of I/O ratios of CO2 is given in a review by De Gennaro, et al., 2014, who emphasized that I/O ratios of CO2 greater than 1 suggest a low impact of outdoor sources on indoor CO2.
3.2. ATP Bioluminescence (RLU/100 cm2)
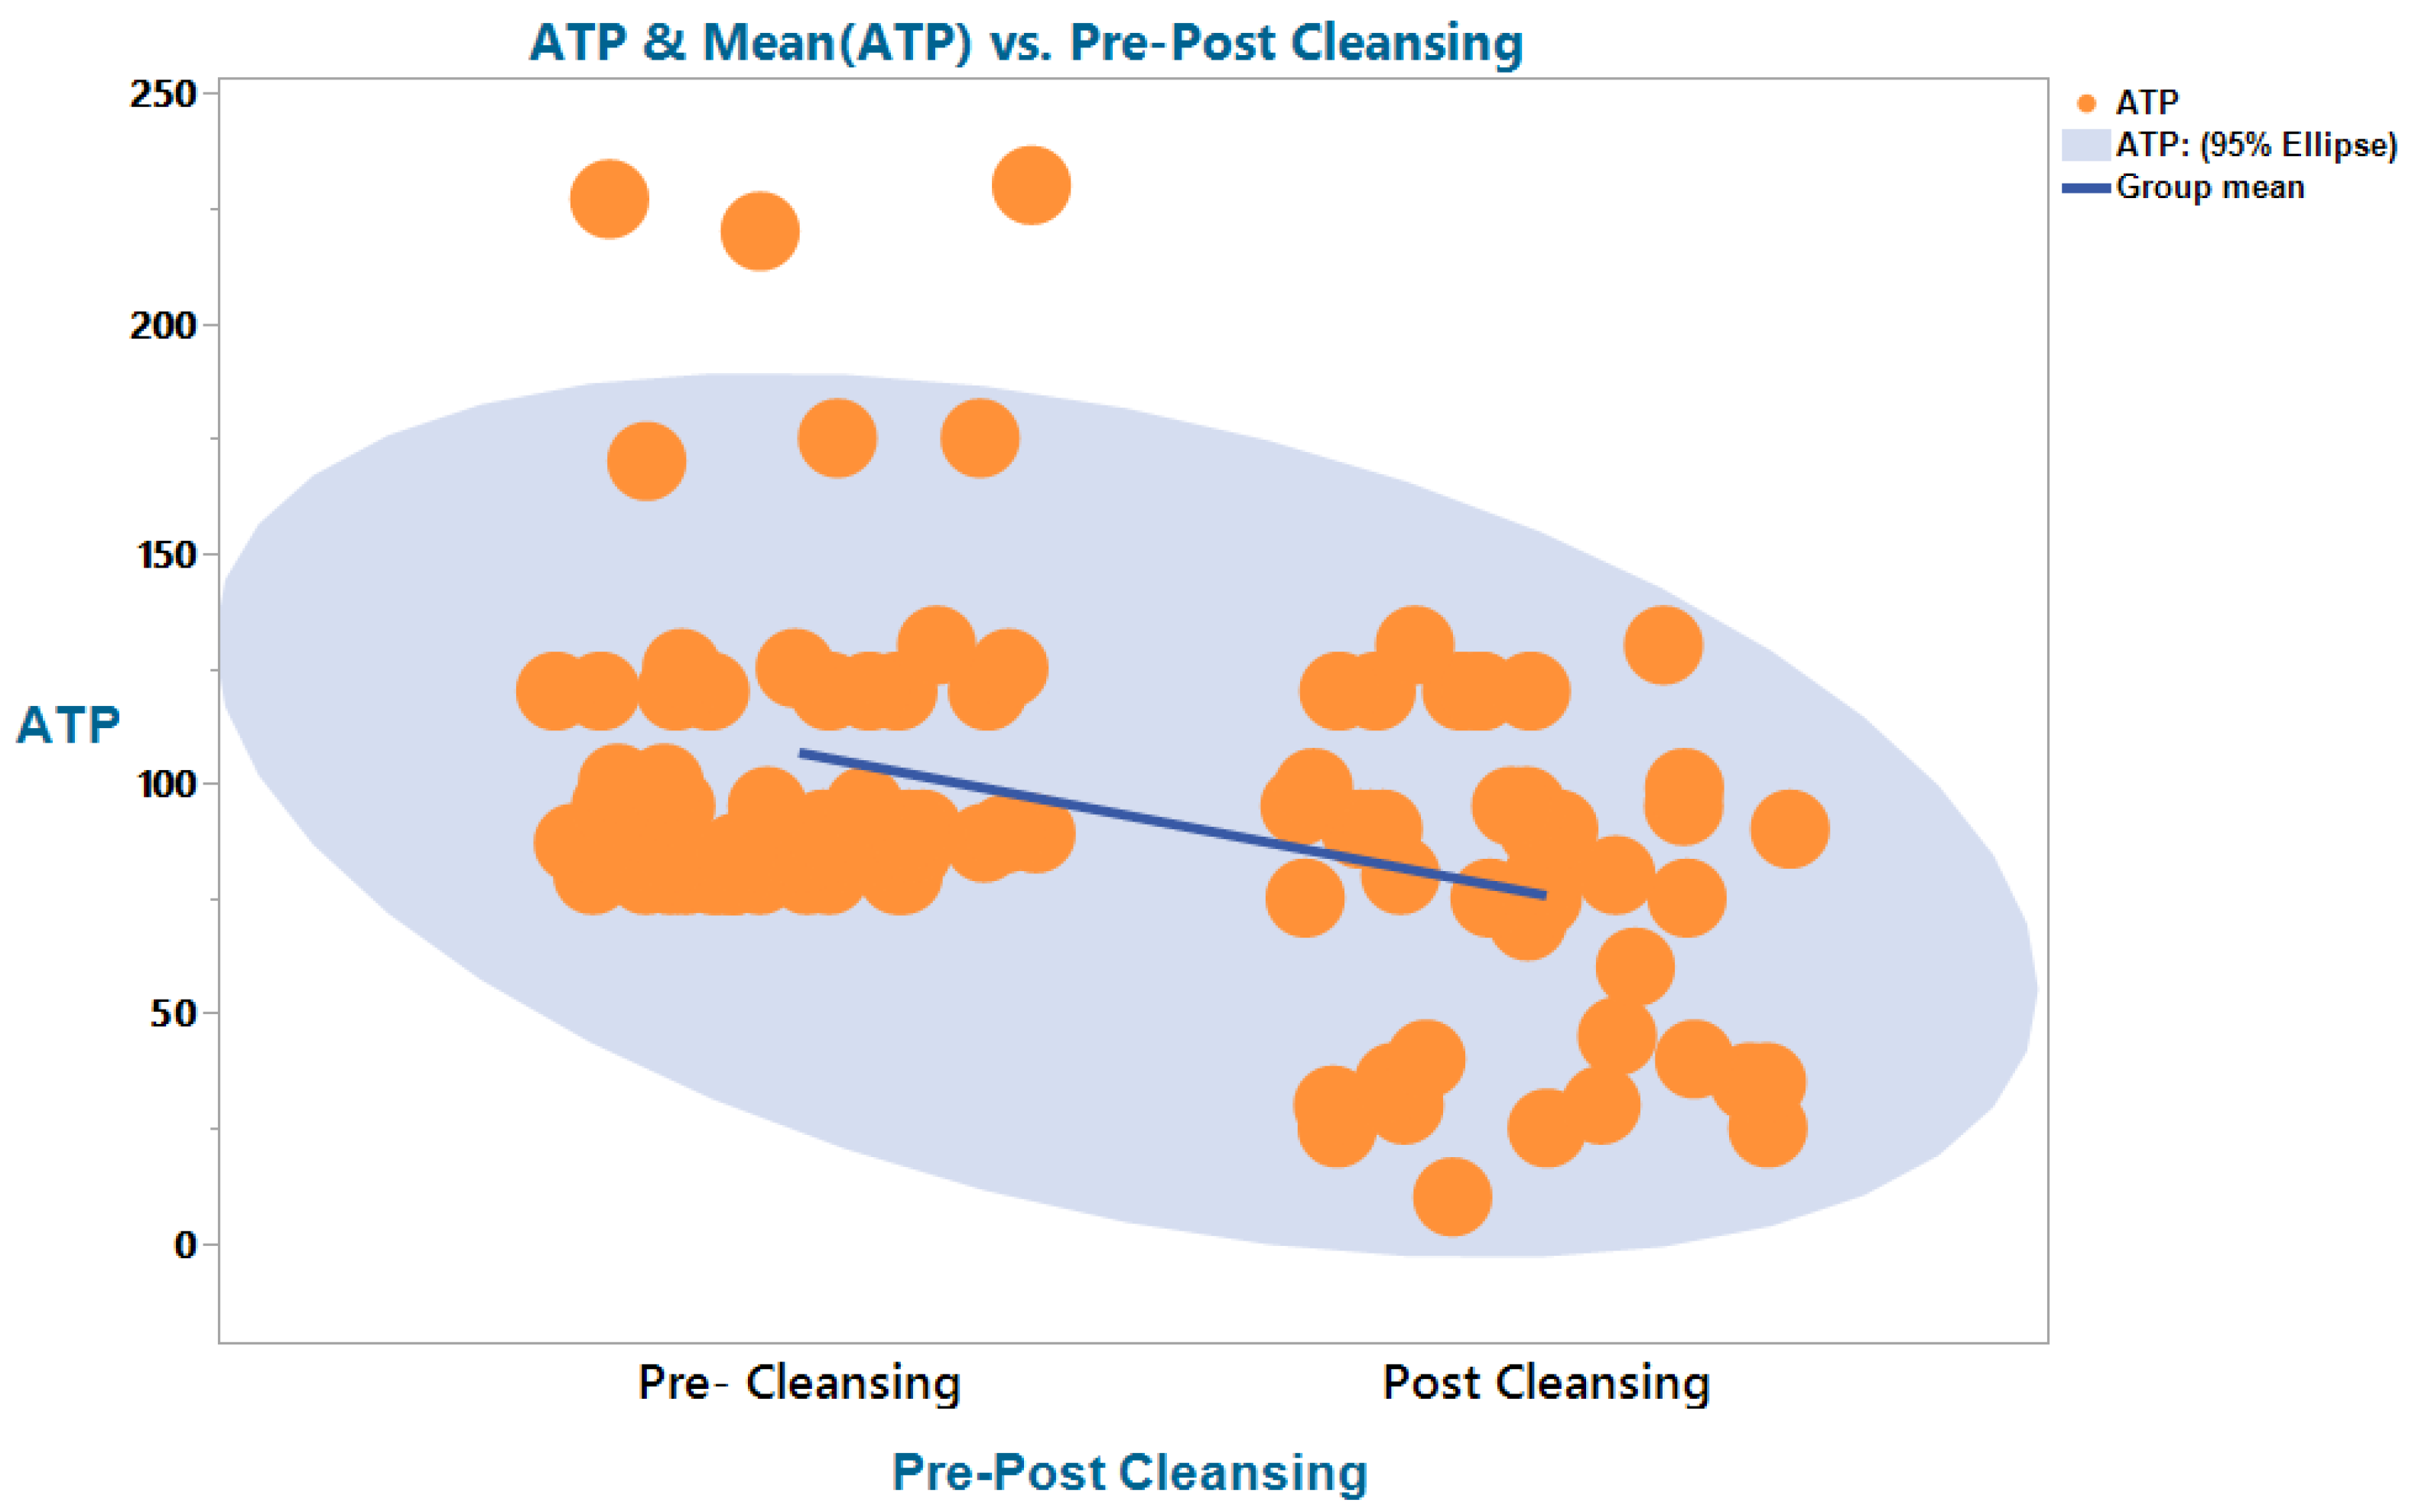
For the entire sampling campaign (pre- and post-cleaning), the average ATP values in offices, classrooms, toilet doorknobs, reception desks, main lobbies (waiting halls), and exit doorknobs accounted for 230 RLU/100 cm2, 140 RLU/100 cm2, 120 RLU/100 cm2, 135 RLU/100 cm2, 99 RLU/100 cm2, and 80 RLU/100 cm2, respectively. Before cleaning, average ATP values in offices, classrooms, toilet doorknobs, reception desks, main lobbies, and exit doorknobs accounted for 280 RLU/100 cm2, 176 RLU/100 cm2, 160 RLU/100 cm2, 171 RLU/100 cm2, 133 RLU/100 cm2, and 94 RLU/100 cm2, respectively. In the same order, ATP average values after cleaning accounted for 96 RLU/100 cm2, 83 RLU/100 cm2, 40 RLU/100 cm2, 55 RLU/100 cm2, 32 RLU/100 cm2, and 40 RLU/100 cm2. The heterogeneity in ATP values reported for different surfaces may be attributable to the inconsistent application of different sanitizers. In the literature, different arbitrary benchmark values for ATP were suggested depending on the types of swabbed surfaces and indoor settings. For toilet handles, surfaces in restaurants, and touch screens, different arbitrary benchmark ATP values were mainly set below 250 RLU/100 cm2 [23]. That is, an ATP value lower than this benchmark indicates the cleanliness of the surface. For indoor settings such as food factories, a value ≤ 500 RLU/100 cm2 was set [23], while an ATP value ≤ 100 RLU/100 cm2 was suggested for high-touch areas in hospitals [43,54].
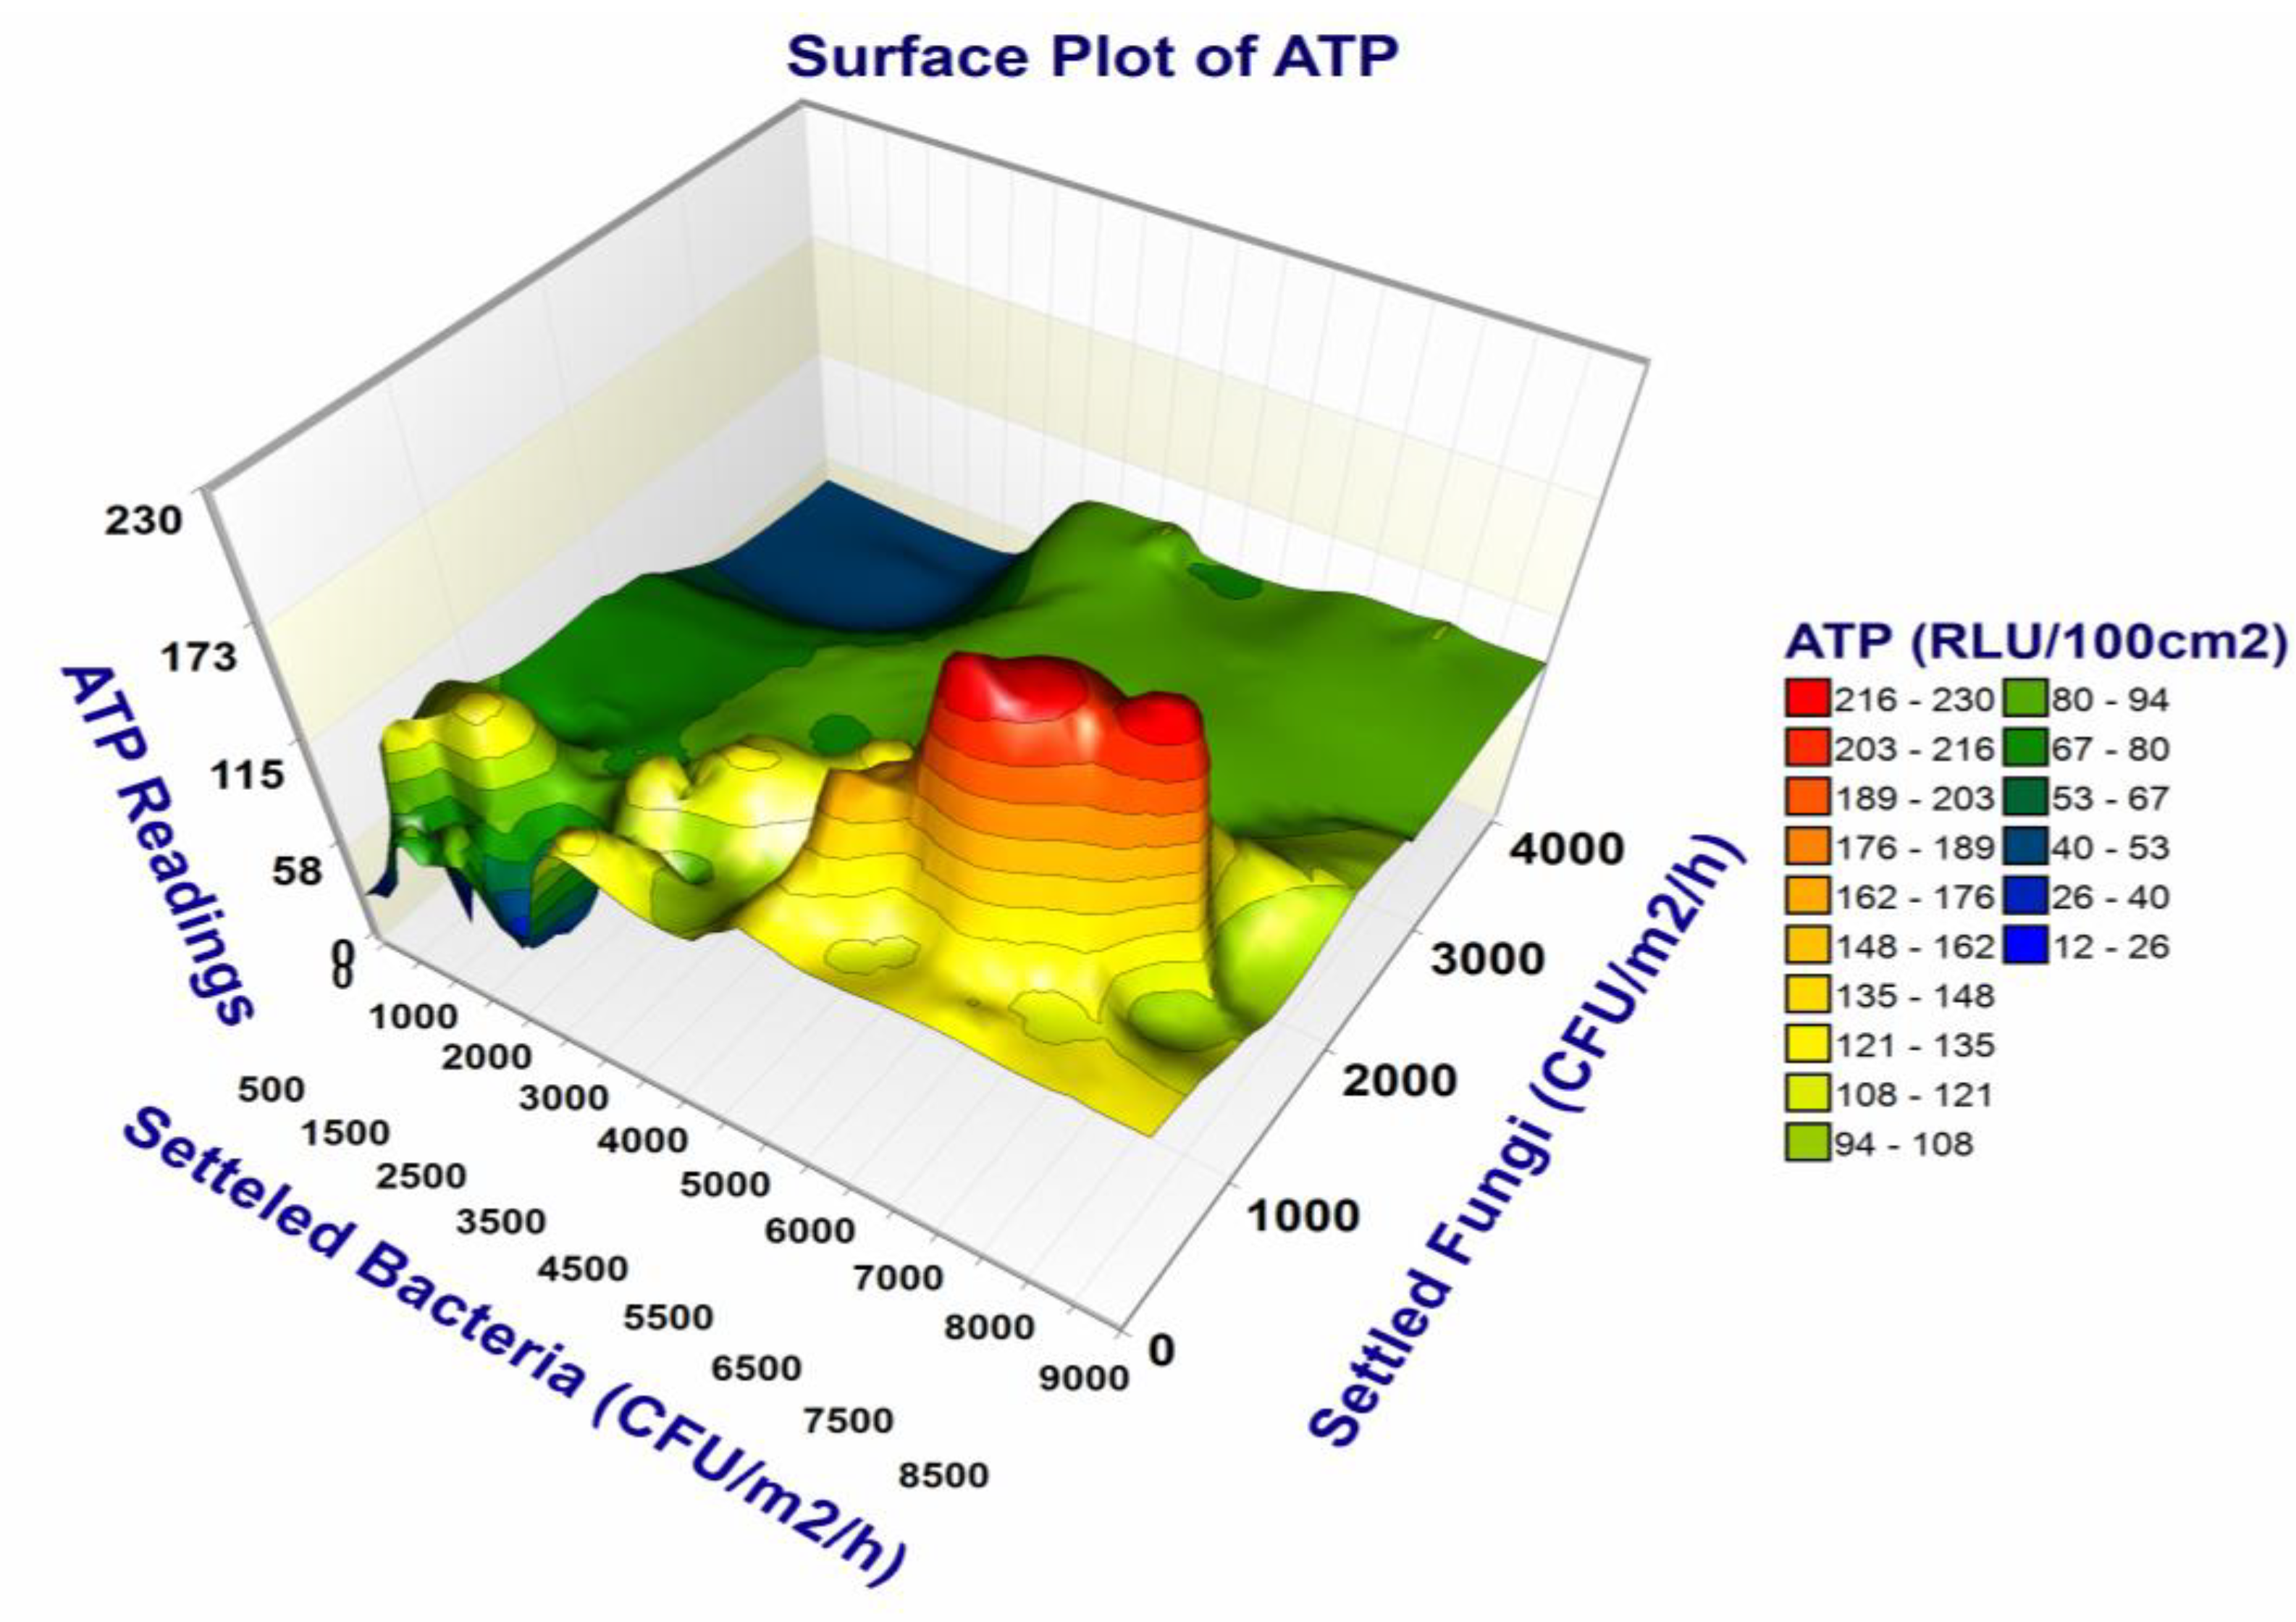
The ATP values showed a fair correlation (r = 0.57; p < 0.001) with viable settled bacterial count but an insignificant reverse association (r = −0.11; p > 0.05) with settled fungal count, which partially agrees with similar research conducted by Osimani et al. (2014a). Figure 4 illustrates the abovementioned correlation between ATP and settled microbes where the ATP values are positively associated with higher bacterial contamination. The challenges associated with the use of ATP bioluminescence in the investigation of the actual bioburden of bacteria and fungi are attributed to the fact that the number of bacteria is usually greater than that of fungi [55], while fungi commonly show higher numbers of ATP compared to bacteria. In addition, the apparent relationship between ATP levels and microbial surface contamination does not account for the ATP attributed to organic waste [23]. This means that ATP bioluminescence testing has to be supported with results from culturing of bacteria and fungi in selective media. Meanwhile, as samples are often taken from small portions of the studied surface, it is probable that the tested areas may not accurately represent the surface’s overall cleanliness [20].
Both ATP bioluminescence and viable count techniques were found consistently effective in detecting contaminated surfaces. Nevertheless, there is no consensus regarding the correlations between ATP counts and settled microorganisms, which contradicts the findings of a previous study [46]. Importantly, although Figure 5 shows an apparent difference in the distribution of ATP before and after cleaning, this difference is not statistically significant, which challenges findings from the literature [56].
3.3. Results of Viable Microbial Analysis
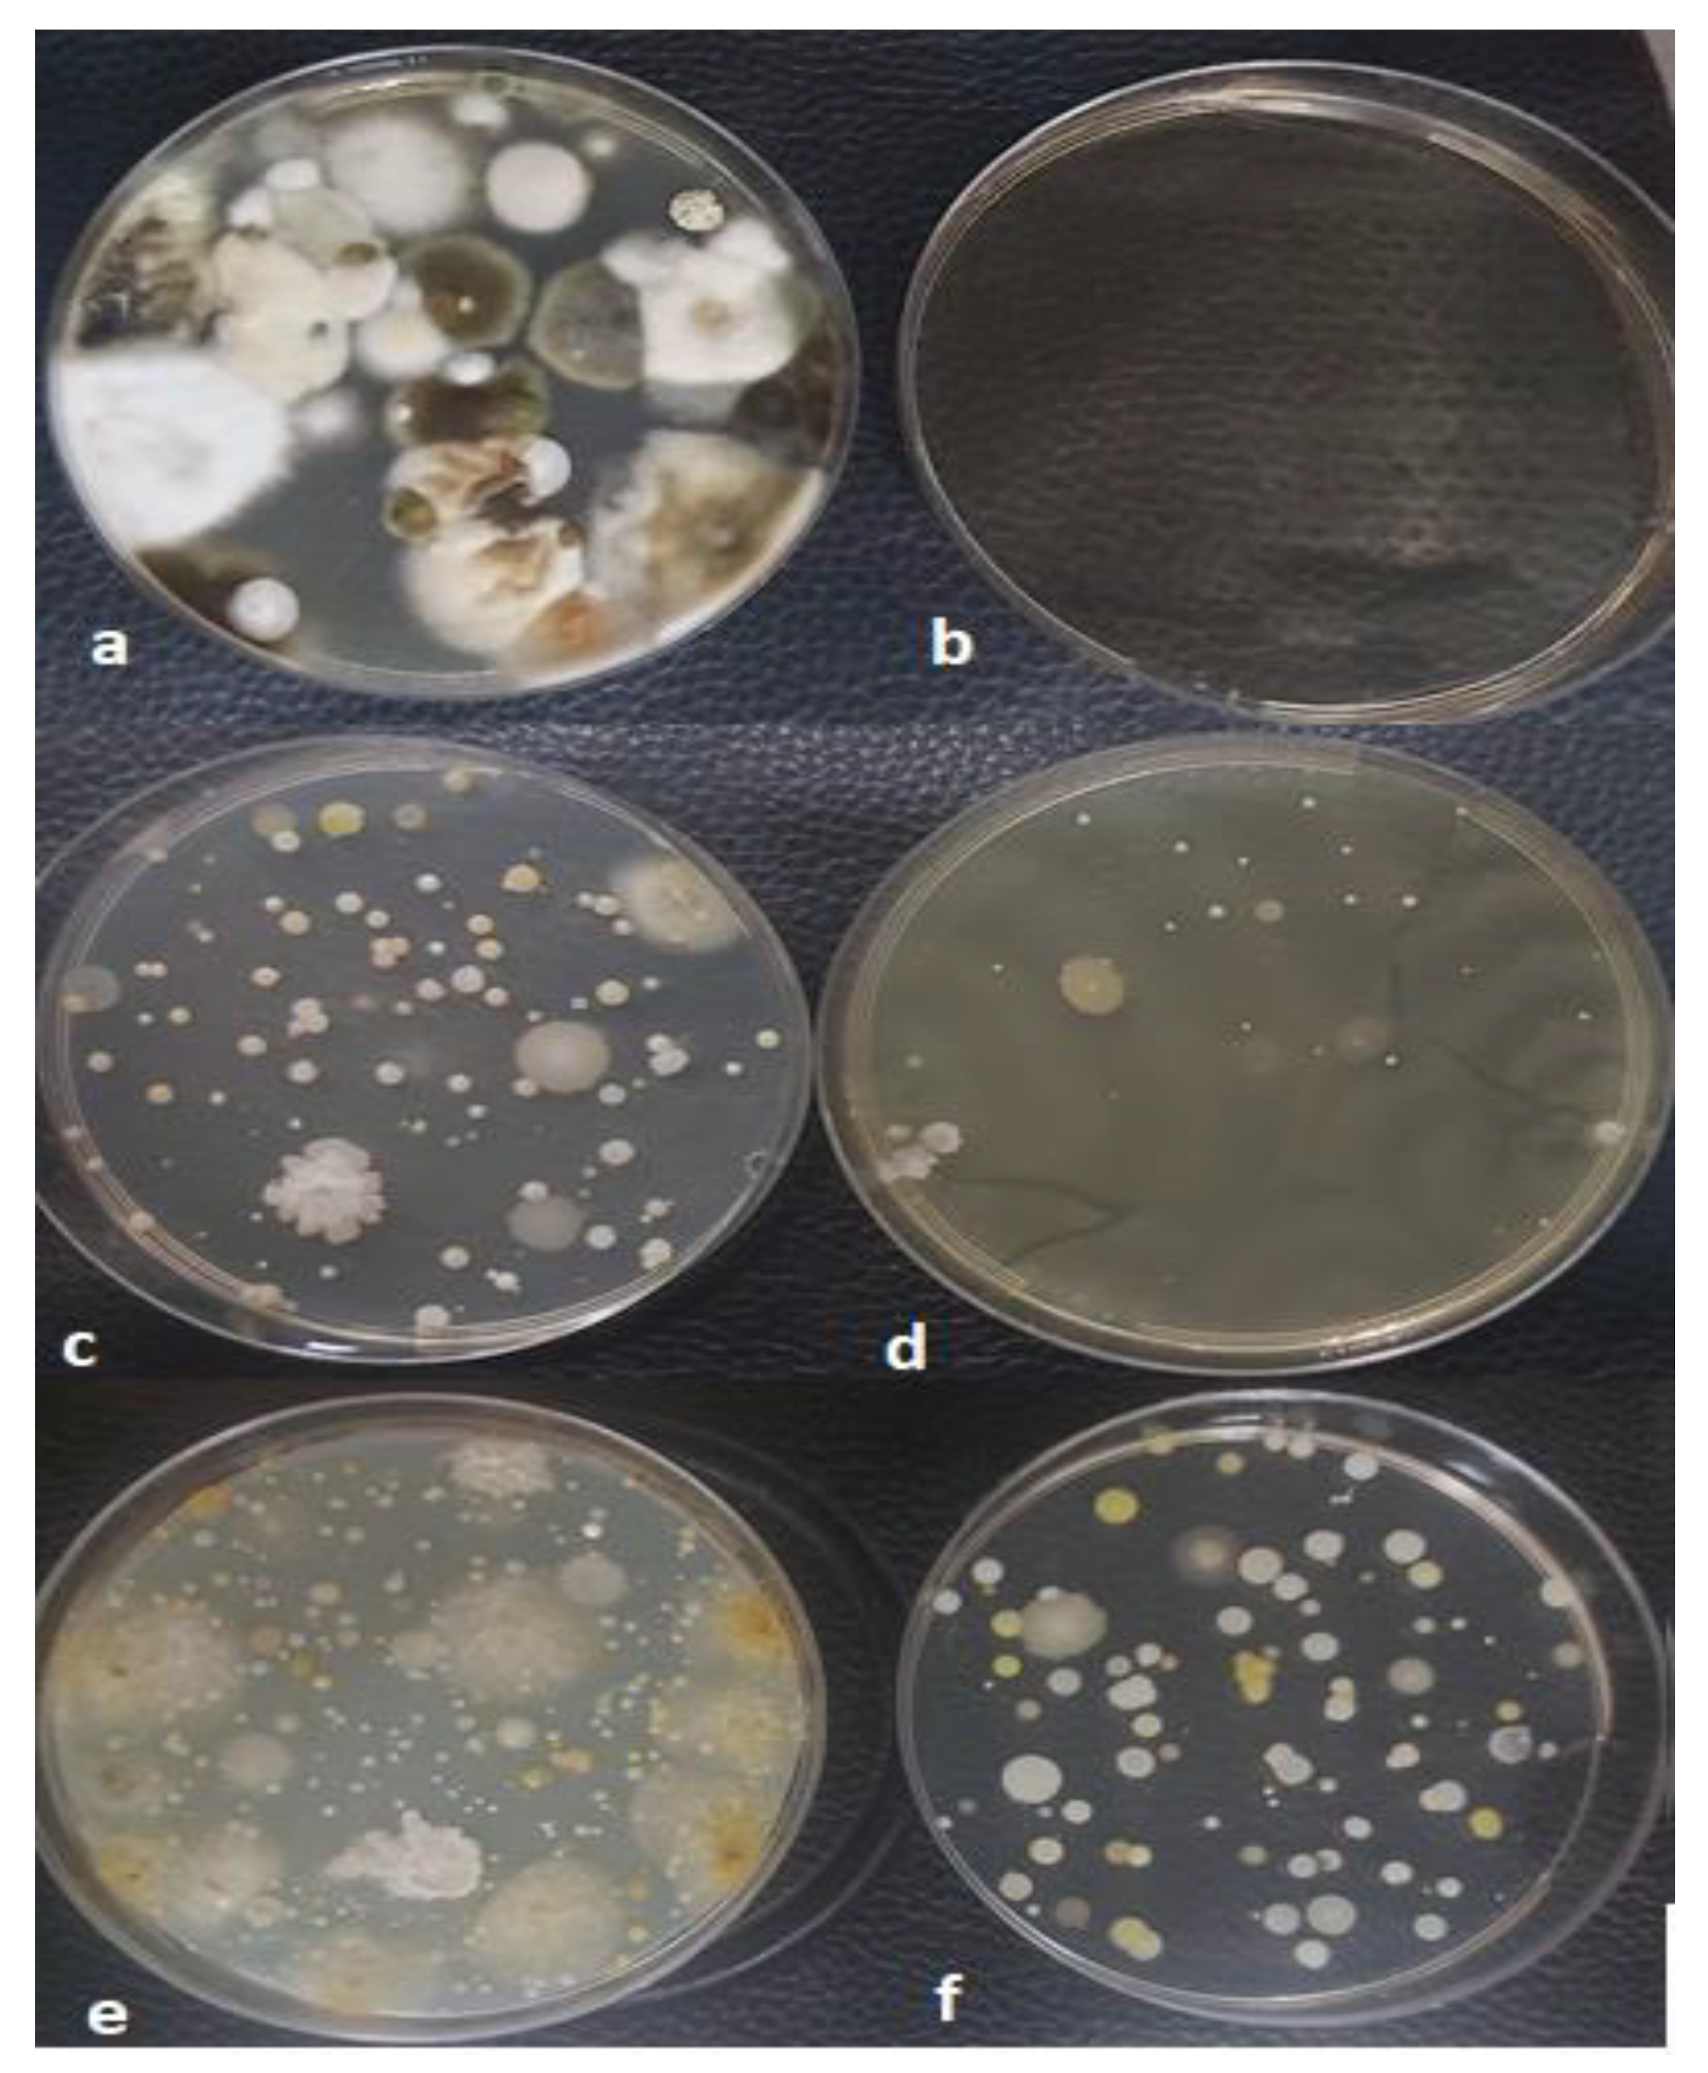
In this work, the culture settling plate method was used to support the results of active sampling and to provide a more accurate picture of both surface pollution and microbiological air quality, where the culture settling plate approach is considered as a good choice when applied appropriately. The use of these two methods of sampling necessitate considering some variables such as the type of ventilation and indoor activities. Additionally, the microbial counts of settling plate method are commonly greater than their corresponding counts of active air sampling [57,58]. Nevertheless, we suggest that the results of active air sampling and settling plate be interpreted separately to avoid confusion in accordance with previous recommendations [59]. Figure 6 demonstrates that distinct bacterial and fungal colonies are obtained from both active sampling and settling plates. In accord with our findings, Canha, et al., 2015, reported correlations between results of passive sampling and active sampling. In general, total (bacteria and fungi) microbial loads were ≤500 CFUm3, suggesting normal microbial air quality [60,61]. Meanwhile, total microbial loads with a ratio of ≤1.5 suggest either a normal contamination level or a low impact of outdoor air [38].
As indicated in Table 1, the bacterial count in outdoor air samples for the entire monitoring campaign (pre- and post-cleaning) ranged from 177 (CFU/m3) to 495 (CFU/m3) after 3 days of incubation. Meanwhile, the total bacterial count in indoor air ranged from 28 (CFU/m3) to 350 (CFU/m3), which is closer to values previously reported for university classrooms, offices, and primary schools [40,62]. The bacterial count reported in this study is considered below the World Health Organization (WHO)’s exposure guidelines for indoor environment and workplaces, set at 1000 CFU/m3 and 300 CFU/m3, respectively [61,63]. Similarly, these bacterial counts are below standards provided by the American Conference of Governmental Industrial Hygienists (ACGIH), set at 500 CFU m3 [64], and international limits of some countries such as Brazil and Singapore [38]. The higher bacterial contamination reported in the main lobbies and toilet is considered a justified observation since these areas are frequently visited by individuals [65].
In contrast, fungal concentrations in the air ranged from 64 CFU/m3 to 189 CFU/m3 in outdoor air samples and from 14 CFU/m3 to 222 CFU/m3 in indoor air samples after 7 days of incubation. The investigation of fungal growth in indoor air and on surfaces is essential because excessive fungal concentrations may result in a wide spectrum of illnesses [66]. According to ACGIH, a fungal count of ≤ 100 CFU/m3 in indoor air is considered normal [67]. Broadly speaking, fungi grow ubiquitously in the indoor environment and resist changes in environmental conditions [68]. Overall, the fungal loads in the outdoor areas were found to be higher than bacterial loads by around 7-fold, which agrees with the literature [69]. It is expected that the influence of outdoor fungus on the indoor fungal count is minimal due to the implementation of modern heating, ventilation, and air conditioning (HVAC) in all buildings in the research area. Adding to that, there is no mass vegetation or debris mass gathering around these buildings that may contribute to fungal load in the air [55].
With respect to surface swabbing, our results agree with evidence from a recent study conducted in higher education institutions, where average concentrations of fungi on surfaces were generally lower than those of bacteria [42]. After cleaning, the total number of bacteria and fungi on indoor surfaces decreased significantly. The bacterial count before cleaning ranged from 1.3 × 10⁴ CFU/100 cm2 to 1.2 × 10³ CFU/100 cm2, compared to 1.4 × 10 CFU/100 cm2 to 1.1 × 10² CFU/100 cm2 after cleaning. Table 2 shows surface microbial counts recalculated as CFU/m2 after 3 days and 7 days of incubation of bacterial and fungi, respectively. Unfortunately, for fungal counts, eleven plates with the highest growth (maximum values) showed overlapping uncountable colonies, and therefore are regarded as infinite, with the average values being highly variable. There was a substantial association (r = 0.74; p 0.001) between bacterial and fungal counts on the reception desk and a moderate correlation (r = 0.55; p 0.001) between bacterial and fungal counts on tables in the main lobby. On the other hand, correlations between bacterial and fungal loads in samples taken from toilet doorknobs and school tables were inconclusive. Finally, bacterial counts collected with swab specimens were associated with ATP swab samples (r = 0.89; p ≤ 0.05), which is stronger than the correlation between ATP count and settled microbial counts stated before in this research, in agreement with a study conducted in a food establishment [43]. Contrariwise, no correlation between viable fungi and ATP has been reported. Consequently, these results confirm our claim that ATP bioluminescence could be a suitable surrogate for evaluating bacterial contamination, but not fungal contamination. In terms of contamination according to surface types, the trend of surface contamination after cleaning was comparable to that before cleaning. With respect to the impact of dilution, three levels of dilution were applied: first dilution (10−1), second dilution (10−2), and third dilution (10−3). All samples of the first dilution (10−1) and the second dilution (10−2) showed clear microbial growth compared to heterogeneous growth for the third dilution (10−3), where few samples of the third dilution revealed zero growth. The readings of all three levels of dilutions were recalculated to obtain final concentrations in CFU/100 cm2, a unit of measurement that is commonly used for expressing surface contamination.
3.4. VOCs and Formaldehyde (HCHO) Levels
The total VOC before cleaning was estimated at around 1.33 mg/m3 in main lobbies, 1.66 mg/m3 in the reception room, 1.5 mg/m3 in toilets, 2.0 mg/m3 in classrooms, around 1.25 mg/m3 in offices, and 0.9 mg/m3 close to outdoor areas. After cleaning, average VOC levels were approximately 5.036 mg/m3 in main lobbies, 3.44 mg/m3 in toilets, 3.025 mg/m3 in the reception room, 2.0 mg/m3 in classrooms, around 2.167 mg/m3 in offices, and 1.0 mg/m3 close to outdoor areas. Along with VOC, we measured formaldehyde due to its potential high carcinogenic risk level indoors, which frequently exceeds exposure limits [70,71,72]. The mean values of HCHO before cleaning in the main lobby, the reception room, the toilets, classrooms, offices, and the close to outdoor areas were 0.873 mg/m3, 0.911 mg/m3, 1.2 mg/m3, around 0.433 mg/m3, and 0.211 mg/m3. After cleaning, HCHO levels were around 0.822 mg/m3, 0.925 mg/m3, 1.3 mg/m3, around 0.531 mg/m3, and 0.206 mg/m3, respectively. It was obvious that levels of VOC in offices, the main lobby, and toilets were high and greatly influenced by cleaning, compared to levels of HCHO that did not change much. This variability in VOC and HCHO levels across the different parts of the university buildings is considered justifiable and was further studied by Solomon, et al., 2008. The general trend of higher VOC indoors compared to outdoors revealed in this study agrees with the findings of several studies carried out in different indoor microenvironments, with these findings having health implications due to the relatively long hours people spend in the indoor environment [73,74,75].
A Pearson correlation between VOC and HCHO for pre- and post-cleaning was calculated. The value of the coefficient “r” for the pre-cleaning relationship between VOC and HCHO was almost the same as that for the post-cleaning relationship, accounting for 0.58 and 0.57, respectively, p ≤ 0.001. However, for pre-cleaning, the data points were close to the regression line compared to post-cleaning, where the data points dispersed randomly over the x- and y-axes. This may suggest a possible impact of cleaning materials on the TVOC rather than on the HCHO, with this claim being supported by evidence from the literature [76]. In fact, HCHO is affected more substantially by building materials than by cleaning products [71,77], implying that levels of HCHO after cleaning apparently did not change. Furthermore, both indoor temperature and RH were within the normal ranges, as indicated in Table 1; hence, their impacts on HCHO and VOC are assumed to be negligible. The building materials, office appliances, and furniture play an essential role in the emission of VOC and formaldehyde mainly when temperature and RH are high [14,78]. Likewise, the impact of both smoking and mechanical ventilation are assumed negligible since all of the investigated buildings are smoking-free zones and equipped with modern HVAC systems. Lastly, the concentrations of HCHO did not exceed the “occupational limits” by OSHA set at 0.75 ppm (equivalent to 0.92 mg/m3). However, they exceeded the ACGIH TLV limit set at 0.3 ppm h8 TWA (equivalent to 0.37 mg/m3) [79].
3.5. Non-Microbial IAQ Parameters
The investigation of ventilation efficiency utilizing CO2 levels and I/O ratios as well as measurements of temperature and relative humidity are all considered essential aspects for the determination of indoor environmental quality [80]. The levels of indoor CO2 varied across the different parts of the buildings, and ranged from 400 ppm to 8500 ppm, with an overall value of 723 ppm. However, this variation was not statistically significant; hence, we assumed that air exchange rates are evenly distributed indoors, with the exception of heterogeneous CO2 levels in offices that could be attributed to variations in occupancy [81]. According to Hess-kosa, et al., 2019, CO2 levels reflect a reasonable impact of occupancy only if they exceed 1000 ppm. In the same regard, since an insignificant correlation was found between indoor CO2 and air bacterial counts (r = 0.018; p 0.001) and CO2 with air fungal counts (r = 0.012; p 0.001), we assumed that the ventilation was sufficient and the effect of outdoor pollution was negligible. Furthermore, all of the investigated buildings are free of smoking and cooking, suggesting that the CO2 levels reported indoors give strong evidence of ventilation status. In contrast, outdoor CO2 levels exhibited little variation, with the maximum, minimum, and average values (340 ppm, 300 ppm, and 311 ppm) being close (as in Table 1) and considered normal background levels [82]. Almost all of indoor and outdoor levels of CO2 comply with occupation exposure limits established by OSHA and ACGIH TLV, which both were set at 5000 8 h TWA ppm and were far below the short-term exposure limit (STEL 15 min) of 30,000 ppm [53,79].
In line with Horve et al., 2020, there was no correlation between indoor temperature and total bacterial (r = 0.22; p 0.05) and fungal (r = 0.32; p 0.05) loads, indicating that temperature alone is not a suitable predictor of indoor microbial growth, especially when relative humidity (RH) is within the normal range. As the indoor air temperature was constantly below 25 °C during the daytime in all sections of the building (offices, toilets, lobbies, etc.), it is expected that the measured temperature would enhance the growth of fungi but have a moderate impact on bacterial growth. This is due to moderately high temperatures and RH required by bacteria for growth [83]. However, the indoor temperature around 20 °C may not hinder multiplications of microbe growth under certain levels of RH [84]. On the other hand, outdoor temperature was persistently high, with an average of 39 °C. This high outdoor temperature along with relatively low outdoor RH of 31% average value may not support microbial growth. The vast majority of the indoor RH readings were relatively low (20–40%), which may discourage fungal growth [83]. However, this range of humidity brings other potential problems, such as the increase in the aerosolization and resuspension of fungi from surfaces to the air, and allowing particles to resuspend in smaller sizes that may last longer in the air. Moreover, such low humidity causes dryness in the mucous membranes of the exposed individuals, leading to a higher susceptibility to respiratory infections [85,86]. Although RH is considered as one of predictors of PM10, no clear association was found between RH and PM10 (r = 0.12; p ≥ 0.05).
Concentrations of indoor PM2.5 and PM10 were consistently low, exhibiting little variations, with typical values ranging from 24 µg/m3 to 26 µg/m3 for PM2.5 and from 45 µg/m3 to 55 µg/m3 for PM10. Both PM2.5 and PM10 revealed insignificant associations with viable airborne bacterial and fungal counts, with the coefficient r values ranging between 0.16 and 0.21, p ≥ 0.05. The average values of indoor aerosols did not exceed the exposure limits provided by WHO set at 15 µg/m3 and 45 µg/m3 24 h (time weighted average) TWA for PM2.5 and PM10, respectively [87]. In the meantime, outdoor concentrations of PM2.5 and PM10 were well below the U.S. Environmental Protection Agency’s exposure standards for ambient air, which are 35 g/m3 for PM2.5 and 150 g/m3 for PM10 [88,89].
4. Conclusions
The overall findings of this study are in favor of the usefulness of ATP bioluminescence in the verification of cleaning procedures and compliance with hygiene standards. This is supported by the stronger association of findings of ATP bioluminescence with bacterial counts collected with swab specimens and the fair correlation with viable settled bacterial counts compared to the insignificant reverse association with settled fungal counts and the weak association with settled fungi. For the entire sample (pre- and post-cleaning), the ATP values were heterogeneous in offices, classrooms, toilet doorknobs, reception desks, main lobbies (waiting halls), and exit doorknobs. The insignificant correlation between indoor and outdoor PM2.5, the I/O ratio of PM2.5 with an average value of 1.2, and the I/O ratio of CO2 exceeding 1 all suggest the significance of indoor sources over outdoor sources. There was a considerable reduction in the total bacterial and fungal counts on indoor surfaces after cleaning, implying the effectiveness of the cleaning procedures. Concentrations of VOC but not HCHO in indoor air were greatly influenced by cleaning, and possibly not impacted by indoor temperature and relative humidity (RH). We suggest ATP bioluminescence as a proxy for investigating bacterial but not fungal contamination, which needs further confirmation. We also suggest that the results of active microbial sampling (CFU/m3) and settling plates (CFU/m2/h) be interpreted separately to avoid confusion, although both are effective techniques for monitoring. Findings from the current research could therefore be utilized to inform QMRA models (quantitative microbial risk assessment), which are needed for estimating the interrelationship between bioburden and possible health outcomes.
5. Study Limitations
We consider the following points as limitations of our study. Firstly, it was difficult to determine the effect of occupancy, which is one of the important factors affecting indoor environmental quality, especially levels of CO2 and surface contamination. Secondly, since mixtures of chemical compounds are used in each cleaning product, the measure of exposure to airborne pollutants from these cleaning materials needs advanced monitoring capable of detecting individual volatile compounds. Finally, we relied on total microbial counts rather than isolating individual bacterial and fungal species that could be assumed to give better qualitative images of contamination.
Funding
This research project was partly funded by the author, who purchased the research tools and instruments, and funded also by the Deanship of Scientific Research at Saudi Electronic University under “Institutional Fund Research Initiative” research project number 8020-HS-2020-1-2020-I.
Institutional Review Board Statement
Not applicable.
Informed Consent Statement
Not applicable.
Data Availability Statement
Data gathered and analyzed in the current research are all included in the main article.
Acknowledgments
As the main author, I wish to express my appreciation to my colleagues at the College of Health Sciences (Saudi Electronic University) and the Faculty of Public and Environmental Health (University of Khartoum) for their support and valuable suggestions. My gratitude is extended to Deanship of Scientific Research at Saudi Electronic University for partial sponsorship of this project. Special thanks to Hoda Al-Muhanna, the medical director of the university medical center at Saudi electronic university for her support and permission to perform the microbial analysis at one of the SEU medial laboratories.
Conflicts of Interest
The author declares no conflict of interest.
References
- Ding, L.R.; Wang, K.; Fahmy, B.; Shen, H.H.; Cormier, S. Airborne fine particulate matter induced pulmonary inflammation as well as oxidative stress in neonate rats. Chin. Med. J. 2010, 123, 2895–2900. [Google Scholar] [PubMed]
- Wu, W.; Jin, Y.; Carlsten, C. Inflammatory health effects of indoor and outdoor particulate matter. J. Allergy Clin. Immunol. 2018, 141, 833–844. [Google Scholar] [CrossRef]
- JJedrychowski, W.A.; Perera, F.P.; Spengler, J.D.; Mroz, E.; Stigter, L.; Flak, E.; Majewska, R.; Klimaszewska-Rembiasz, M.; Jacek, R. Intrauterine exposure to fine particulate matter as a risk factor for increased susceptibility to acute broncho-pulmonary infections in early childhood. Int. J. Hyg. Environ. Health 2013, 216, 395–401. [Google Scholar] [CrossRef] [PubMed]
- Li, P.; Xin, J.; Wang, Y.; Wang, S.; Li, G.; Pan, X.; Liu, Z.; Wang, L. The acute effects of fine particles on respiratory mortality and morbidity in Beijing, 2004–2009. Environ. Sci. Pollut. Res. Int. 2013, 20, 6433–6444. [Google Scholar] [CrossRef] [PubMed]
- Feng, J.; Yang, W. Effects of particulate air pollution on cardiovascular health: A population health risk assessment. PLoS ONE 2012, 7, e33385. [Google Scholar] [CrossRef]
- Mar, T.F.; Koenig, J.Q.; Jansen, K.; Sullivan, J.; Kaufman, J.; Trenga, C.A.; Siahpush, S.H.; Liu, L.-J.S.; Neas, L. Fine particulate air pollution and cardiorespiratory effects in the elderly. Epidemiology 2005, 16, 681–687. [Google Scholar] [CrossRef]
- Pope, C.A., 3rd; Burnett, R.T.; Thurston, G.D.; Thun, M.J.; Calle, E.E.; Krewski, D.; Godleski, J.J. Cardiovascular mortality and long-term exposure to particulate air pollution: Epidemiological evidence of general pathophysiological pathways of disease. Circulation 2004, 109, 71–77. [Google Scholar] [CrossRef]
- GGualtieri, M.; Øvrevik, J.; Mollerup, S.; Asare, N.; Longhin, E.; Dahlman, H.-J.; Camatini, M.; Holme, J.A. Airborne urban particles (Milan winter-PM2.5) cause mitotic arrest and cell death: Effects on DNA, mitochondria, AhR binding and spindle organization. Mutat. Res. 2011, 713, 18–31. [Google Scholar] [CrossRef]
- Gutiérrez-Castillo, M.E.; Roubicek, D.A.; Cebrián-García, M.E.; De Vizcaya-Ruíz, A.; Sordo-Cedeño, M.; Ostrosky-Wegman, P. Effect of chemical composition on the induction of DNA damage by urban airborne particulate matter. Environ. Mol. Mutagen. 2006, 47, 199–211. [Google Scholar] [CrossRef]
- Moelling, K.; Broecker, F. Air Microbiome and Pollution: Composition and Potential Effects on Human Health, Including SARS Coronavirus Infection. J. Environ. Public Health 2020, 2020, 1646943. [Google Scholar] [CrossRef]
- Bousquet, J.; Khaltaev, N. (Eds.) Global Surveillance, Prevention and Control of Chronic Respiratory Diseases: A Comprehensive Approach; World Health Organization: Geneva, Switzerland, 2007; p. 51.
- Agier, L.; Basagaña, X.; Maitre, L.; Granum, B.; Bird, P.K.; Casas, M.; Oftedal, B.; Wright, J.; Andrusaityte, S.; de Castro, M.; et al. Early-life exposome and lung function in children in Europe: An analysis of data from the longitudinal, population-based HELIX cohort. Lancet Planet. Health 2019, 3, E81–E92. [Google Scholar] [CrossRef]
- Janssen, N.A.H.; Fischer, P.; Marra, M.; Ameling, C.; Cassee, F.R. Short-term effects of PM2.5, PM10 and PM2.5–10 on daily mortality in the Netherlands. Sci. Total Environ. 2013, 463, 20–26. [Google Scholar] [CrossRef]
- Tran, V.V.; Park, D.; Lee, Y.C. Indoor Air Pollution, Related Human Diseases, and Recent Trends in the Control and Improvement of Indoor Air Quality. Int. J. Environ. Res. Public Health 2020, 17, 2927. [Google Scholar] [CrossRef]
- Moreno-Rangel, A.; Sharpe, T.; McGill, G.; Musau, F. Indoor Air Quality in Passivhaus Dwellings: A Literature Review. Int. J. Environ. Res. Public Health 2020, 17, 4749. [Google Scholar] [CrossRef]
- Institute of Medicine; Board on Population Health and Public Health Practice; Committee on the Effect of Climate Change on Indoor Air Quality and Public Health. Climate Change, the Indoor Environment, and Health; National Academies Press: Washington, DC, USA, 2011. [Google Scholar]
- D’Alessandro, D.; Fara, G.M. Hospital Environments and Epidemiology of Healthcare-Associated Infections. In Indoor Air Quality in Healthcare Facilities; Springer: Cham, Switzerland, 2017; pp. 41–52. [Google Scholar]
- Urso, P.; Cattaneo, A.; Garramone, G.; Peruzzo, C.; Cavallo, D.M.; Carrer, P. Identification of particulate matter determinants in residential homes. Build. Environ. 2015, 86, 61–69. [Google Scholar] [CrossRef]
- Fattorini, M.; Ceriale, E.; Nante, N.; Lenzi, D.; Manzi, P.; Basagni, C.; Messina, G. Use of a fluorescent marker for assessing hospital bathroom cleanliness. Am. J. Infect. Control. 2016, 44, 1066–1068. [Google Scholar] [CrossRef]
- Deshpande, A.; Donskey, C.J. Practical Approaches for Assessment of Daily and Post-discharge Room Disinfection in Healthcare Facilities. Curr. Infect. Dis. Rep. 2017, 19, 32. [Google Scholar] [CrossRef]
- Moretro, T.; Normann, M.A.; Saebo, H.R.; Langsrud, S. Evaluation of ATP bioluminescence-based methods for hygienic assessment in fish industry. J. Appl. Microbiol. 2019, 127, 186–195. [Google Scholar] [CrossRef]
- Gillespie, E.; Sievert, W.; Swan, M.; Kaye, C.; Edridge, I.; Stuart, R.L. Adenosine triphosphate bioluminescence to validate decontamination of endoscopes. J. Hosp. Infect. 2017, 97, 353–356. [Google Scholar] [CrossRef]
- Mildenhall, K.B.; Rankin, S.A. Implications of Adenylate Metabolism in Hygiene Assessment: A Review. J. Food Prot. 2020, 83, 1619–1631. [Google Scholar] [CrossRef]
- Macovei, G.; Andrian, S.; Iovan, G.; Gheorghe, A.; Nica, I.; Topoliceanu, C.; Bolat, M.; Tofan, N.; Stoleriu, S.; Pancu, G. Assessment of Bacterial Biofilm on Patients with Orthodontic Fixed Appliances Following non Operative/Preventive Treatments. Rom. J. Oral Rehabil. 2016, 8, 52–56. [Google Scholar]
- Tisan, M.; Vehovc, M.; Seme, K.; Srcic, S. Evaluation of ATP bioluminescence for monitoring surface hygiene in a hospital pharmacy cleanroom. J. Microbiol. Methods 2020, 168, 105785. [Google Scholar]
- Mohamad, M.; Ishak, S.; Jaafar, R.; Sani, N.A. ATP Bioluminescence: Surface Hygiene Monitoring in Milk Preparation Room of Neonatal Intensive Care Unit. In The 2017 UKM FST Postgraduate Colloquium; Ibrahim, K., Hanafiah, M.M., Jumali, M.H.H., Ibrahim, N., Hasbullah, S.A., Eds.; AIP Conference Proceedings: Selangor, Malaysia, 2018; Volume 1940. [Google Scholar]
- Rodrigues, L.B.; dos Santos, L.R.; Rizzo, N.N.; Ferreira, D.; de Oliveira, A.P.; Levandowski, R.; Webber, B.; do Nascimento, V.P. ATP-Bioluminescence and Conventional Microbiology for Hygiene Evaluation of Cutting Room Surfaces in Poultry Slaughterhouse. Acta Sci. Vet. 2018, 46, 6. [Google Scholar] [CrossRef]
- Trsan, M.; Seme, K.; Srcic, S. The environmental monitoring in hospital pharmacy cleanroom and microbiota catalogue preparation. Saudi Pharm. J. 2019, 27, 455–462. [Google Scholar] [CrossRef] [PubMed]
- Osimani, A.; Garofalo, C.; Clementi, F.; Tavoletti, S.; Aquilanti, L. Bioluminescence ATP Monitoring for the Routine Assessment of Food Contact Surface Cleanliness in a University Canteen. Int. J. Environ. Res. Public Health 2014, 11, 10824–10837. [Google Scholar] [CrossRef]
- Oza, H.H.; Fisher, M.B.; Abebe, L.; Cronk, R.; McCord, R.; Reuland, F.; Behnke, N.; Kafanikhale, H.; Mofolo, I.; Hoffman, I.; et al. Application of tools to monitor environmental conditions, identify exposures, and inform decision-making to improve infection prevention and control practices in Malawian maternity wards. Environ. Monit. Assess. 2020, 192, 134. [Google Scholar] [CrossRef]
- Hess-Kosa, K. Indoor Air Quality: The Latest Sampling and Analytical Methods, 3rd ed.; CRC Press: Boca Raton, FL, USA, 2018. [Google Scholar]
- Bonadonna, L.; Briancesco, R.; Coccia, A.M. Analysis of Microorganisms in Hospital Environments and Potential Risks. In Indoor Air Quality in Healthcare Facilities; Springer: Cham, Switzerland, 2017; pp. 53–62. [Google Scholar]
- Carling, P.C.; Bartley, J.M. Evaluating hygienic cleaning in health care settings: What you do not know can harm your patients. Am. J. Infect. Control. 2010, 38, S41–S50. [Google Scholar] [CrossRef]
- Moldenhauer, J. Disinfection and Decontamination: A Practical Handbook; Taylor & Francis: Abingdon, UK, 2018. [Google Scholar]
- Wang, Y.; Qiao, F.; Zhou, F.L.; Yuan, Y.F. Surface distribution of severe acute respiratory syndrome coronavirus 2 in Leishenshan Hospital in China. Indoor Built Environ. 2020, 31, 1193–1201. [Google Scholar] [CrossRef]
- Heinemann, C.; Meyer, I.; Bogel, F.T.; Schmid, S.M.; Hayer, J.J.; Steinhoff-Wagner, J. Individual training for farmers based on results from protein and ATP rapid tests and microbiological conventional cultural methods improves hygiene in pig fattening pens. J. Anim. Sci. 2020, 98, skz389. [Google Scholar] [CrossRef]
- Clontz, L. Microbial Limit and Bioburden Tests: Validation Approaches and Global Requirements, 2nd ed.; CRC Press: Boca Raton, FL, USA, 2008. [Google Scholar]
- Castellanos-Arévalo, A.P.; Camarena-Pozos, D.A.; Castellanos-Arévalo, D.C.; Rangel-Córdova, A.A.; Peña-Cabriales, J.J.; Arévalo-Rivas, B.; de Peña, D.G.; Maldonado-Vega, M. Microbial contamination in the indoor environment of tanneries in Leon, Mexico. Indoor Built Environ. 2016, 25, 524–540. [Google Scholar] [CrossRef]
- Mirhoseini, S.H.; Didehdar, M.; Akbari, M.; Moradzadeh, R.; Jamshidi, R.; Torabi, S. Indoor exposure to airborne bacteria and fungi in sensitive wards of an academic pediatric hospital. Aerobiologia 2020, 36, 225–232. [Google Scholar] [CrossRef]
- Mentese, S.; Arisoy, M.; Rad, A.Y.; Gullu, G. Bacteria and Fungi Levels in Various Indoor and Outdoor Environments in Ankara, Turkey. Clean-Soil Air Water 2009, 37, 487–493. [Google Scholar] [CrossRef]
- Ilies, D.C.; Onet, A.; Wendt, J.A.; Ilies, M.; Timar, A.; Ilies, A.; Baias, Ș.; Herman, G.V. Study on microbial and fungal contamination of air and wooden surfaces inside of a historical Church from Romania. J. Environ. Biol. 2018, 39, 980–984. [Google Scholar] [CrossRef]
- Viegas, C.; Pimenta, R.; Dias, M.; Gomes, B.; Brito, M.; Caetano, L.A.; Carolino, E.; Gomes, A.Q. Microbiological Contamination Assessment in Higher Education Institutes. Atmosphere 2021, 12, 1079. [Google Scholar] [CrossRef]
- Davidson, C.A.; Griffith, C.J.; Peters, A.C.; Fielding, L.M. Evaluation of two methods for monitoring surface cleanliness—ATP bioluminescence and traditional hygiene swabbing. Luminescence 1999, 14, 33–38. [Google Scholar] [CrossRef]
- Ye, J.; Qian, H.; Zhang, J.; Sun, F.; Zhuge, Y.; Zheng, X.; Cao, G. Concentrations and size-resolved I/O ratios of household airborne bacteria and fungi in Nanjing, southeast China. Sci. Total Environ. 2021, 774, 145559. [Google Scholar] [CrossRef]
- Canha, N.; Almeida, S.M.; Freitas, M.D.; Wolterbeek, H.T. Assessment of bioaerosols in urban and rural primary schools using passive and active sampling methodologies. Arch. Environ. Prot. 2015, 41, 11–22. [Google Scholar] [CrossRef]
- Sanna, T.; Dallolio, L.; Raggi, A.; Mazzetti, M.; Lorusso, G.; Zanni, A.; Farruggia, P.; Leoni, E. ATP bioluminescence assay for evaluating cleaning practices in operating theatres: Applicability and limitations. BMC Infect. Dis. 2018, 18, 583. [Google Scholar] [CrossRef]
- Rivas, I.; Viana, M.; Moreno, T.; Bouso, L.; Pandolfi, M.; Alvarez-Pedrerol, M.; Forns, J.; Alastuey, A.; Sunyer, J.; Querol, X. Outdoor infiltration and indoor contribution of UFP and BC, OC, secondary inorganic ions and metals in PM2.5 in schools. Atmos. Environ. 2015, 106, 129–138. [Google Scholar] [CrossRef]
- Szigeti, T.; Kertész, Z.; Dunster, C.; Kelly, F.J.; Záray, G.; Mihucz, V.G. Exposure to PM2.5 in modern office buildings through elemental characterization and oxidative potential. Atmos. Environ. 2014, 94, 44–52. [Google Scholar] [CrossRef]
- Lim, J.M.; Jeong, J.H.; Lee, J.H.; Moon, J.H.; Chung, Y.S.; Kim, K.H. The analysis of PM2.5 and associated elements and their indoor/outdoor pollution status in an urban area. Indoor Air 2011, 21, 145–155. [Google Scholar] [CrossRef] [PubMed]
- Long, C.M.; Sarnat, J.A. Indoor-outdoor relationships and infiltration behavior of elemental components of outdoor PM2.5 for Boston-area homes. Aerosol Sci. Technol. 2004, 38, 91–104. [Google Scholar] [CrossRef]
- Yang, Z.; Shen, J.L.; Gao, Z. Ventilation and Air Quality in Student Dormitories in China: A Case Study during Summer in Nanjing. Int. J. Environ. Res. Public Health 2018, 15, 1328. [Google Scholar] [CrossRef] [PubMed]
- Godish, T. Indoor Environmental Quality; CRC Press: Boca Raton, FL, USA, 2016. [Google Scholar]
- de Gennaro, G.; Dambruoso, P.R.; Loiotile, A.D.; Di Gilio, A.; Giungato, P.; Tutino, M.; Marzocca, A.; Mazzone, A.; Palmisani, J.; Porcelli, F. Indoor air quality in schools. Environ. Chem. Lett. 2014, 12, 467–482. [Google Scholar] [CrossRef]
- Amodio, E.; Dino, C. Use of ATP bioluminescence for assessing the cleanliness of hospital surfaces: A review of the published literature (1990–2012). J. Infect. Public Health 2014, 7, 92–98. [Google Scholar] [CrossRef]
- Flannigan, B. Microorganisms in Indoor Air. In Microorganisms in Home and Indoor Work Environments: Diversity, Health Impacts, Investigation and Control, 2nd ed.; Flannigan, B., Samson, R., Miller, J., Eds.; CRC Press: Boca Raton, FL, USA, 2011. [Google Scholar]
- Haverinen-Shaughnessy, U.; Shaughnessy, R.J.; Cole, E.C.; Toyinbo, O.; Moschandreas, D.J. An assessment of indoor environmental quality in schools and its association with health and performance. Build. Environ. 2015, 93, 35–40. [Google Scholar] [CrossRef]
- Friberg, B.; Friberg, S.; Burman, L.G. Correlation between surface and air counts of particles carrying aerobic bacteria in operating rooms with turbulent ventilation: An experimental study. J. Hosp. Infect. 1999, 42, 61–68. [Google Scholar] [CrossRef]
- Friberg, B.E.E.; Burman, L.G.; Friberg, S. Zoned exponential, vertical and horizontal ultra-clean laminar airflows: No differences in bacteriological efficiency. Acta Orthop. Scand. 1998, 69, 169–172. [Google Scholar] [CrossRef]
- Napoli, C.; Marcotrigiano, V.; Montagna, M.T. Air sampling procedures to evaluate microbial contamination: A comparison between active and passive methods in operating theatres. BMC Public Health 2012, 12, 594. [Google Scholar] [CrossRef]
- Rocha, C.A.; Silva, R.J.; Monzon, A.E.; Alfonzo, J. Characterization of Indoor Air Bioaerosols in an Electrical Headquarter Building. Indoor Built Environ. 2013, 22, 910–919. [Google Scholar] [CrossRef]
- Dehghani, M.; Sorooshian, A.; Nazmara, S.; Baghani, A.N.; Delikhoon, M. Concentration and type of bioaerosols before and after conventional disinfection and sterilization procedures inside hospital operating rooms. Ecotoxicol. Environ. Saf. 2018, 164, 277–282. [Google Scholar] [CrossRef]
- Li, Y.J.; Ge, Y.H.; Wu, C.B.; Guan, D.X.; Liu, J.B.; Wang, F.Y. Assessment of culturable airborne bacteria of indoor environments in classrooms, dormitories and dining hall at university: A case study in China. Aerobiologia 2020, 36, 313–324. [Google Scholar] [CrossRef]
- Abdelrahman, H.; Abu-Rub, L.; Al Mana, H.; Alhorr, Y.; Al Thani, A.; Qotba, H.; Yassine, H.M.; Eltai, N.O. Assessment of Indoor Air Quality of Four Primary Health Care Centers in Qatar. Microorganisms 2022, 10, 2055. [Google Scholar] [CrossRef]
- Hsu, C.-S.; Lu, M.-C.; Huang, D.-J. Application of chlorine dioxide for disinfection of student health centers. Environ. Monit. Assess. 2012, 184, 741–747. [Google Scholar] [CrossRef]
- Kalwasinska, A.; Burkowska, A.; Wilk, I. Microbial air contamination in indoor environment of a university library. Ann. Agric. Environ. Med. 2012, 19, 25–29. [Google Scholar]
- Kumar, P.; Kausar, M.A.; Singh, A.B.; Singh, R. Biological contaminants in the indoor air environment and their impacts on human health. Air Qual. Atmos. Health 2021, 14, 1723–1736. [Google Scholar] [CrossRef]
- Chaudhuri, A.; Basu, C.; Bhattacharyya, S.; Chaudhuri, P. Developement of health risk rating scale for indoor airborne fungal exposure. Arch. Environ. Occup. Health 2020, 75, 375–383. [Google Scholar] [CrossRef]
- Haleem Khan, A.A.; Mohan Karuppayil, S. Fungal pollution of indoor environments and its management. Saudi J. Biol. Sci. 2012, 19, 405–426. [Google Scholar] [CrossRef]
- Viegas, C.; Monteiro, A.; Carolino, E.; Viegas, S. Occupational exposure to bioburden in Portuguese bakeries: An approach to sampling viable microbial load. Arh. Za Hig. Rada I Toksikol. Arch. Ind. Hyg. Toxicol. 2018, 69, 250–257. [Google Scholar] [CrossRef]
- Cheng, Z.; Li, B.; Yu, W.; Wang, H.; Zhang, T.; Xiong, J.; Bu, Z. Risk assessment of inhalation exposure to VOCs in dwellings in Chongqing, China. Toxicol. Res. 2018, 7, 59–72. [Google Scholar] [CrossRef]
- Won, S.R.; Ghim, Y.S.; Kim, J.; Ryu, J.; Shim, I.K.; Lee, J. Volatile Organic Compounds in Underground Shopping Districts in Korea. Int. J. Environ. Res. Public Health 2021, 18, 5508. [Google Scholar] [CrossRef] [PubMed]
- TTunsaringkarn, T.; Prueksasit, T.; Morknoy, D.; Sawatsing, R.; Chinveschakitvanich, V.; Rungsiyothin, A.; Zapaung, K. Indoor air assessment, health risks, and their relationship among elderly residents in urban warrens of Bangkok, Thailand. Air Qual. Atmos. Health 2015, 8, 603–615. [Google Scholar] [CrossRef]
- Goodman, N.B.; Steinemann, A.; Wheeler, A.J.; Paevere, P.J.; Cheng, M.; Brown, S.K. Volatile organic compounds within indoor environments in Australia. Build. Environ. 2017, 122, 116–125. [Google Scholar] [CrossRef]
- Shrubsole, C.; Dimitroulopoulou, S.; Foxall, K.; Gadeberg, B.; Doutsi, A. IAQ guidelines for selected volatile organic compounds (VOCs) in the UK. Build. Environ. 2019, 165, 106382. [Google Scholar] [CrossRef]
- Villanueva, F.; Tapia, A.; Amo-Salas, M.; Notario, A.; Cabanas, B.; Martinez, E. Levels and sources of volatile organic compounds including carbonyls in indoor air of homes of Puertollano, the most industrialized city in central Iberian Peninsula. Estimation of health risk. Int. J. Hyg. Environ. Health 2015, 218, 522–534. [Google Scholar] [CrossRef]
- Solomon, S.J.; Schade, G.W.; Kuttippurath, J.; Ladstatter-Weissenmayer, A.; Burrows, J.P. VOC concentrations in an indoor workplace environment of a university building. Indoor Built Environ. 2008, 17, 260–268. [Google Scholar] [CrossRef]
- Lin, N.; Rosemberg, M.A.; Li, W.; Meza-Wilson, E.; Godwin, C.; Batterman, S. Occupational exposure and health risks of volatile organic compounds of hotel housekeepers: Field measurements of exposure and health risks. Indoor Air 2021, 31, 26–39. [Google Scholar] [CrossRef]
- Huang, L.H.; Wei, Y.R.; Zhang, L.Y.; Ma, Z.; Zhao, W.P. Estimates of emission strengths of 43 VOCs in wintertime residential indoor environments, Beijing. Sci. Total Environ. 2021, 793, 148623. [Google Scholar] [CrossRef]
- American Society of Heating, Refrigerating and Air-Conditioning Engineers (ASHRAE). ASHRAE Fundamentals; American Society of Heating Refrigerating and Air-Conditioning Engineers: Washington, DC, USA, 2017; p. 224. [Google Scholar]
- Zhong, L.X.; Yuan, J.; Fleck, B. Indoor Environmental Quality Evaluation of Lecture Classrooms in an Institutional Building in a Cold Climate. Sustainability 2019, 11, 6591. [Google Scholar] [CrossRef]
- Lee, S.C.; Guo, H.; Li, W.M.; Chan, L.Y. Inter-comparison of air pollutant concentrations in different indoor environments in Hong Kong. Atmos. Environ. 2002, 36, 1929–1940. [Google Scholar] [CrossRef]
- Yanes, Y.; Yapp, C.J. Indoor and outdoor urban atmospheric CO2: Stable carbon isotope constraints on mixing and mass balance. Appl. Geochem. 2010, 25, 1339–1349. [Google Scholar] [CrossRef]
- Salonen, H.; Duchaine, C.; Mazaheri, M.; Clifford, S.; Morawska, L. Airborne culturable fungi in naturally ventilated primary school environments in a subtropical climate. Atmos. Environ. 2015, 106, 412–418. [Google Scholar] [CrossRef]
- Syne, S.-M.; Ramsubhag, A.; Adesiyun, A.A. Microbiological hazard analysis of ready-to-eat meats processed at a food plant in Trinidad, West Indies. Infect. Ecol. Epidemiol. 2013, 3, 20450. [Google Scholar] [CrossRef]
- Horve, P.F.; Lloyd, S.; Mhuireach, G.A.; Dietz, L.; Fretz, M.; MacCrone, G.; Wymelenberg, K.V.D.; Ishaq, S.L. Building upon current knowledge and techniques of indoor microbiology to construct the next era of theory into microorganisms, health, and the built environment. J. Expo. Sci. Environ. Epidemiol. 2020, 30, 219–235. [Google Scholar] [CrossRef]
- Wolkoff, P.; Azuma, K.; Carrer, P. Health, work performance, and risk of infection in office-like environments: The role of indoor temperature, air humidity, and ventilation. Int. J. Hyg. Environ. Health 2021, 233, 113709. [Google Scholar] [CrossRef]
- WHO. WHO Global Air Quality Guidelines: Particulate Matter (PM2.5 and PM10), Ozone, Nitrogen Dioxide, Sulfur Dioxide and Carbon Monoxide; World Health Organization: Geneva, Switzerland, 2021.
- Zhang, L.; Ou, C.J.; Magana-Arachchi, D.; Vithanage, M.; Vanka, K.S.; Palanisami, T.; Masakorala, K.; Wijesekara, H.; Yan, Y.; Bolan, N.; et al. Indoor Particulate Matter in Urban Households: Sources, Pathways, Characteristics, Health Effects, and Exposure Mitigation. Int. J. Environ. Res. Public Health 2021, 18, 11055. [Google Scholar] [CrossRef]
- Abdel-Salam, M.M.M. Investigation of indoor air quality at urban schools in Qatar. Indoor Built Environ. 2019, 28, 278–288. [Google Scholar] [CrossRef]
Figure 1.
Study flow diagram.

Figure 2.
Bacterial count vs. fungal count from active sampling of air.

Figure 3.
Correlation between indoor and outdoor (a) PM2.5 and (b) PM10.

Figure 4.
The link between settled bacteria (CFU/m2/h), settled fungi (CFU/m2/h), and ATP (RLU/100 cm2).
Figure 4.
The link between settled bacteria (CFU/m2/h), settled fungi (CFU/m2/h), and ATP (RLU/100 cm2).

Figure 5.
Illustration of ATP readings (RLU/100 cm2) prior to cleaning of indoor surfaces and after cleaning.
Figure 5.
Illustration of ATP readings (RLU/100 cm2) prior to cleaning of indoor surfaces and after cleaning.

Figure 6.
Selected samples collected with open settling plates. Passive sampling of fungi close to outdoor areas with settling plate for (a) 4 h and (b) 8 h settling periods, 7 days incubation. Passive sampling of bacteria with settling plate at office desk for (c) 4 h and (d) 8 h. Passive sampling of bacteria with settling plate at table of main hall, (e) 4 h and (f) 8 h sampling periods.


Table 1.
Descriptive statistics about the environmental quality parameters measured in this study.
| Descriptive Statistics | ||||||
|---|---|---|---|---|---|---|
| Indoor/Outdoor Levels | N | Minimum | Maximum | Mean | S.D. | |
| Indoor Environment | PM2.5 (µg/m3) | 78 | 20 | 33 | 26 | 4 |
| PM10 (µg/m3) | 78 | 40 | 66 | 50 | 7 | |
| ATP (RLU/100 cm2) | 78 | 10 | 230 | 95 | 43 | |
| VOC (mg/m3) | 78 | 0.04 | 10 | 3 | 3 | |
| HCHO (mg/m3) | 78 | 0.1 | 2 | 1 | 0.08 | |
| CO2 in ppm | 78 | 400 | 8500 | 723 | 898 | |
| Temperature (Celsius) | 78 | 21 | 27 | 24 | 1 | |
| RH (%) | 78 | 31 | 59 | 42 | 8 | |
| Settled bacteria (CFU/m2/h) | 78 | 39 | 8647 | 3209 | 2324 | |
| Settled fungi (CFU/m2/h) | 78 | 39 | 3891 | 703 | 823 | |
| Bacteria in air (CFU/m3) | 32 | 28 | 350 | 266 | 67 | |
| Fungi in air (CFU/m3) | 32 | 14 | 222 | 78 | 66 | |
| Outdoor Environment | PM2.5 (µg/m3) | 38 | 23 | 34 | 32 | 3 |
| PM10 (µg/m3) | 38 | 52 | 79 | 55 | 2 | |
| ATP (RLU/100 cm2) | 38 | 80 | 95 | 85 | 6 | |
| VOC in (mg/m3) | 38 | 1 | 2 | 1 | 1 | |
| HCHO (mg/m3) | 38 | 0 | 0.02 | 0.01 | 0.002 | |
| CO2 in ppm | 38 | 300 | 340 | 311 | 16 | |
| Temperature (Celsius) | 38 | 38 | 42 | 39 | 1 | |
| RH (%) | 38 | 25 | 44 | 32 | 4 | |
| Settled bacteria (CFU/m2/h) | 38 | 900 | 8254 | 4876 | 1909 | |
| Settled fungi (CFU/m2/h)) | 786 | 3891 | 2703 | 1204 | 786 | |
| Bacteria in air (CFU/m3) | 32 | 177 | 495 | 320 | 99 | |
| Fungi in air(CFU/m3) | 32 | 64 | 233 | 189 | 25 | |
Table 2.
Descriptive statistics of surface swabbing.
| N | Bacteria (CFU/m2) | Fungi (CFU/m2) | |||||
|---|---|---|---|---|---|---|---|
| Min. | Max. | Mean | Min. | Max. | Mean | ||
| Pre-Cleaning | |||||||
| Tables in main lobbies | 22 | n.d. | 1.3 × 10⁶ | 5.0 × 10⁴ | n.d. | ꝏ | 1.3 × 10⁴ |
| Reception desks | 14 | n.d. | 1.4 × 10⁵ | 1.2 × 10⁴ | n.d. | ꝏ | ꝏ |
| Classroom tables | 22 | n.d. | 2.6 × 10⁶ | 4.0 × 10⁵ | n.d. | ꝏ | 4 × 10³ |
| Office desks | 20 | n.d. | 1.2 × 10⁵ | 0.9 × 10⁴ | n.d. | ꝏ | ꝏ |
| Post-Cleaning | |||||||
| Tables in main lobbies | 22 | n.d. | 1.1 × 10⁴ | 0.2 × 10⁴ | n.d. | ꝏ | 2 × 10³ |
| Reception desks | 14 | n.d. | 0.8 × 10⁴ | 0.7 × 10⁴ | n.d. | ꝏ | 6 × 10³ |
| Classroom tables | 22 | n.d. | 1.4 × 10³ | 1.0 × 10³ | n.d. | ꝏ | 1 × 10³ |
| Office desks | 20 | n.d. | 1.8 × 10³ | 0.6 × 10³ | n.d. | ꝏ | ꝏ |
Note: n.d. not detected; ꝏ indicates overlapping of fungal colonies that are difficult to count. A total of six samples of the third dilution were discarded because they showed zero growth. Samples with zero values (i.e., minimum values) reported as n.d. for bacteria and fungi were excluded from the calculation of average values shown in the table. Meantime, for fungi, both samples with zero values and those with infinite/uncountable number of colonies (i.e., maximum values) were excluded from calculating average values.
Disclaimer/Publisher’s Note: The statements, opinions and data contained in all publications are solely those of the individual author(s) and contributor(s) and not of MDPI and/or the editor(s). MDPI and/or the editor(s) disclaim responsibility for any injury to people or property resulting from any ideas, methods, instructions or products referred to in the content. |
© 2023 by the author. Licensee MDPI, Basel, Switzerland. This article is an open access article distributed under the terms and conditions of the Creative Commons Attribution (CC BY) license (https://creativecommons.org/licenses/by/4.0/).
Share and Cite
MDPI and ACS Style
Mohammed, M.O.A. Surface Microbial Contamination and Air Quality before and after Regular Cleaning Procedures. Atmosphere 2023, 14, 352. https://doi.org/10.3390/atmos14020352
AMA Style
Mohammed MOA. Surface Microbial Contamination and Air Quality before and after Regular Cleaning Procedures. Atmosphere. 2023; 14(2):352. https://doi.org/10.3390/atmos14020352
Chicago/Turabian StyleMohammed, Mohammed O. A. 2023. "Surface Microbial Contamination and Air Quality before and after Regular Cleaning Procedures" Atmosphere 14, no. 2: 352. https://doi.org/10.3390/atmos14020352
Note that from the first issue of 2016, this journal uses article numbers instead of page numbers. See further details here.