
Identification of Patterns and Relationships of Jet Stream Position with Flood-Prone Precipitation in Iran during 2006–2019

 , and
, and 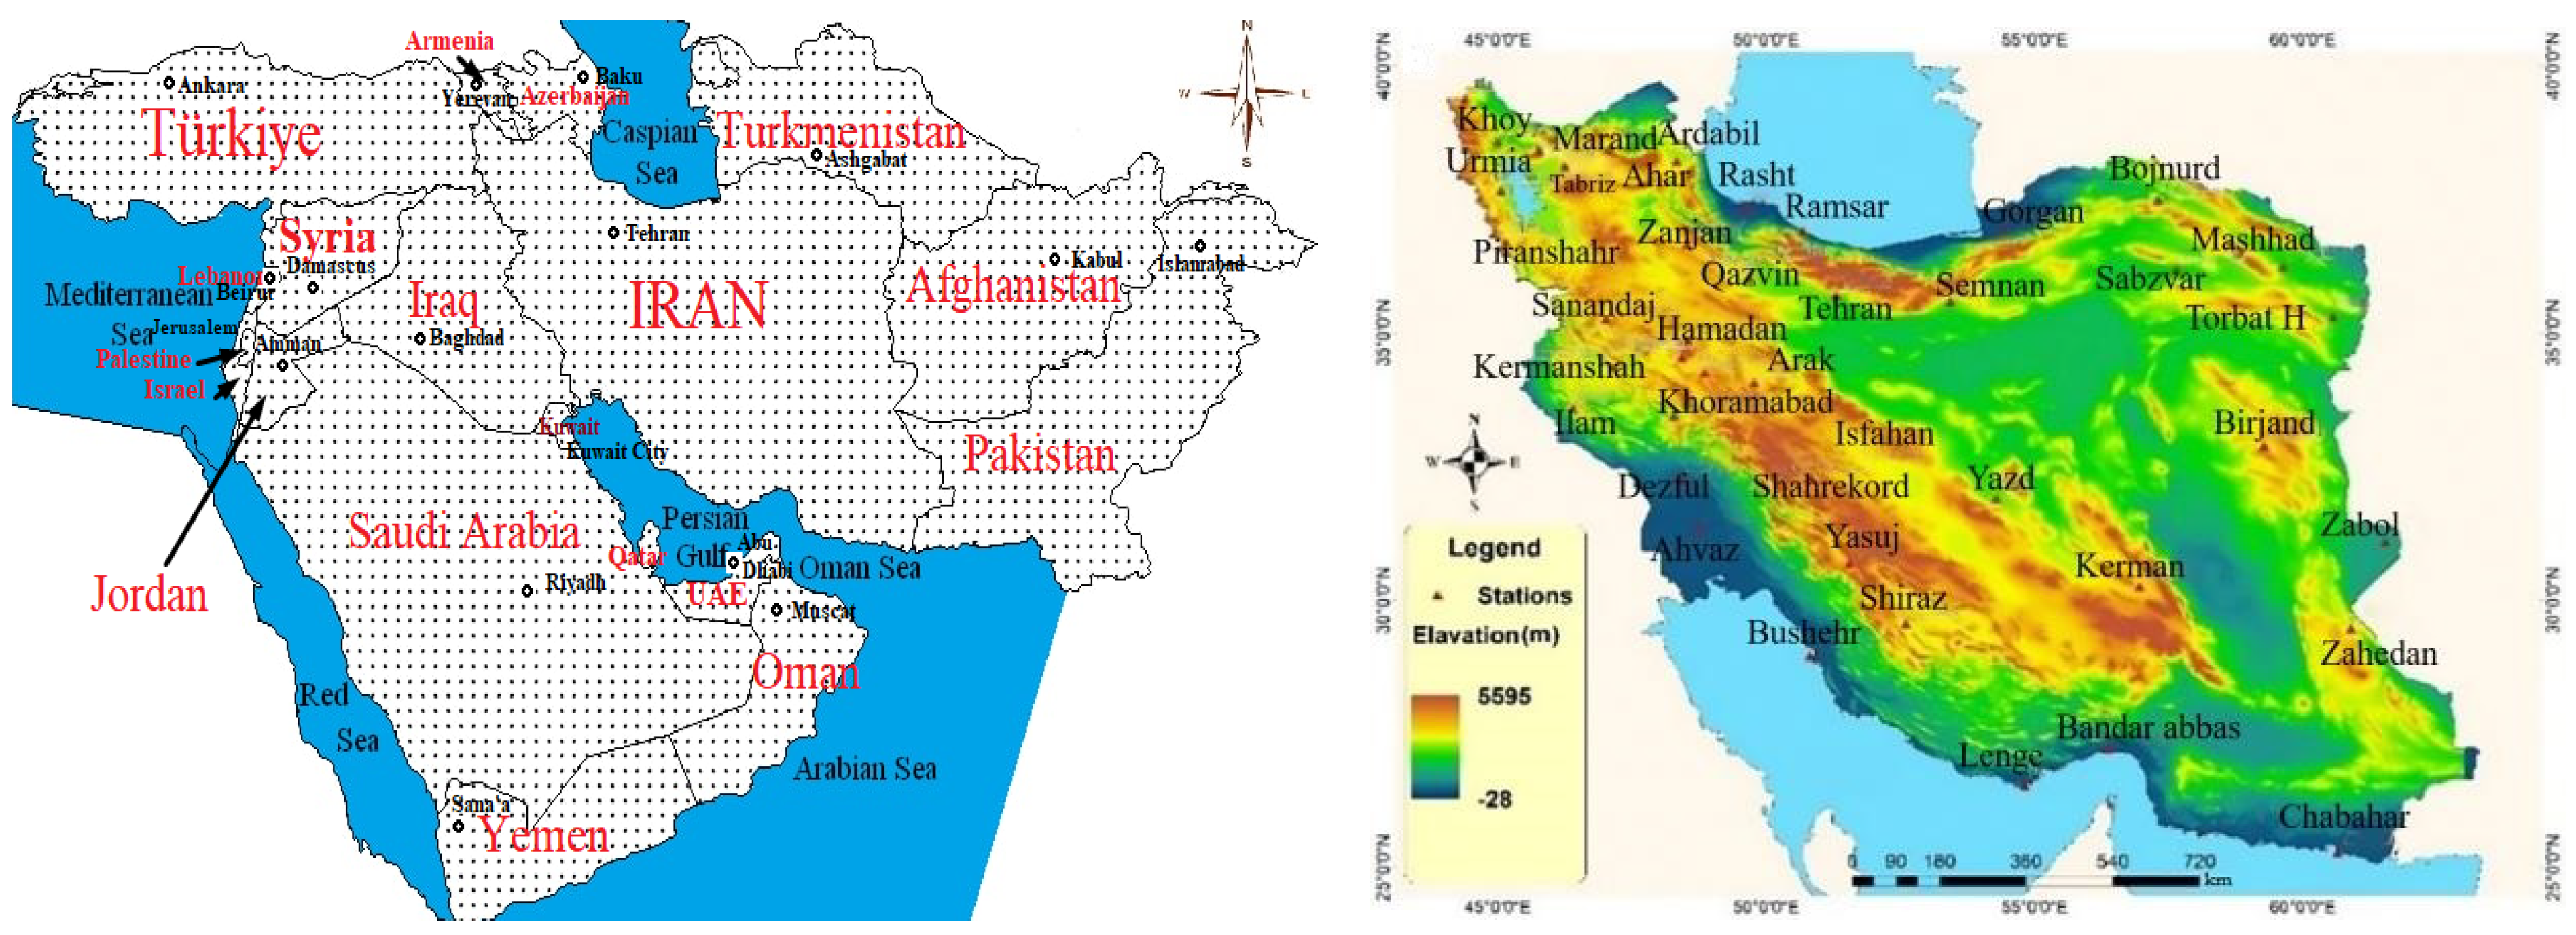
Abstract
:1. Introduction
2. Material and Methods
3. Results and Discussion
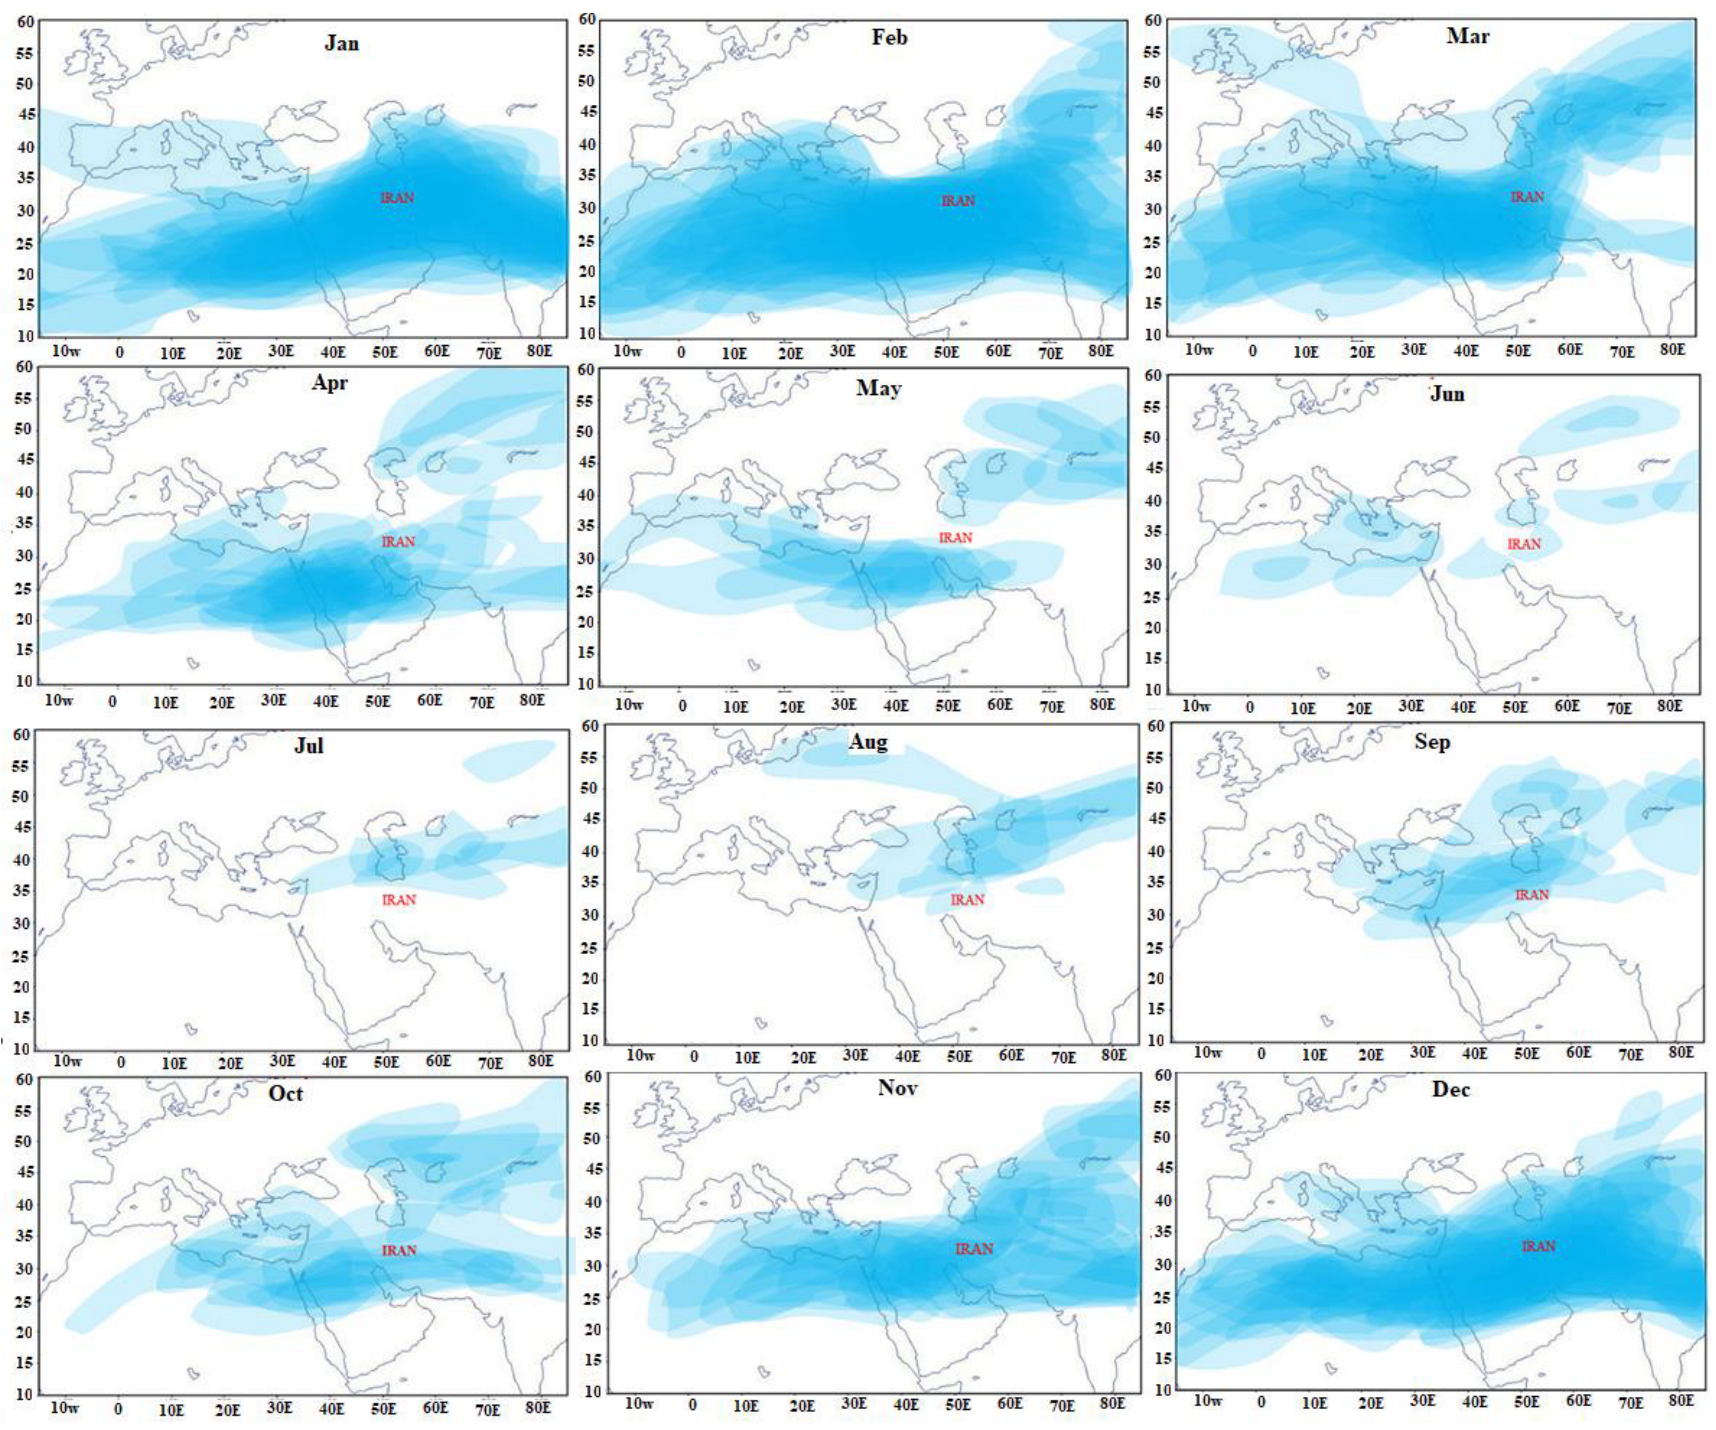
3.1. Monthly Patterns of Jet Stream Positions at 300 hPa
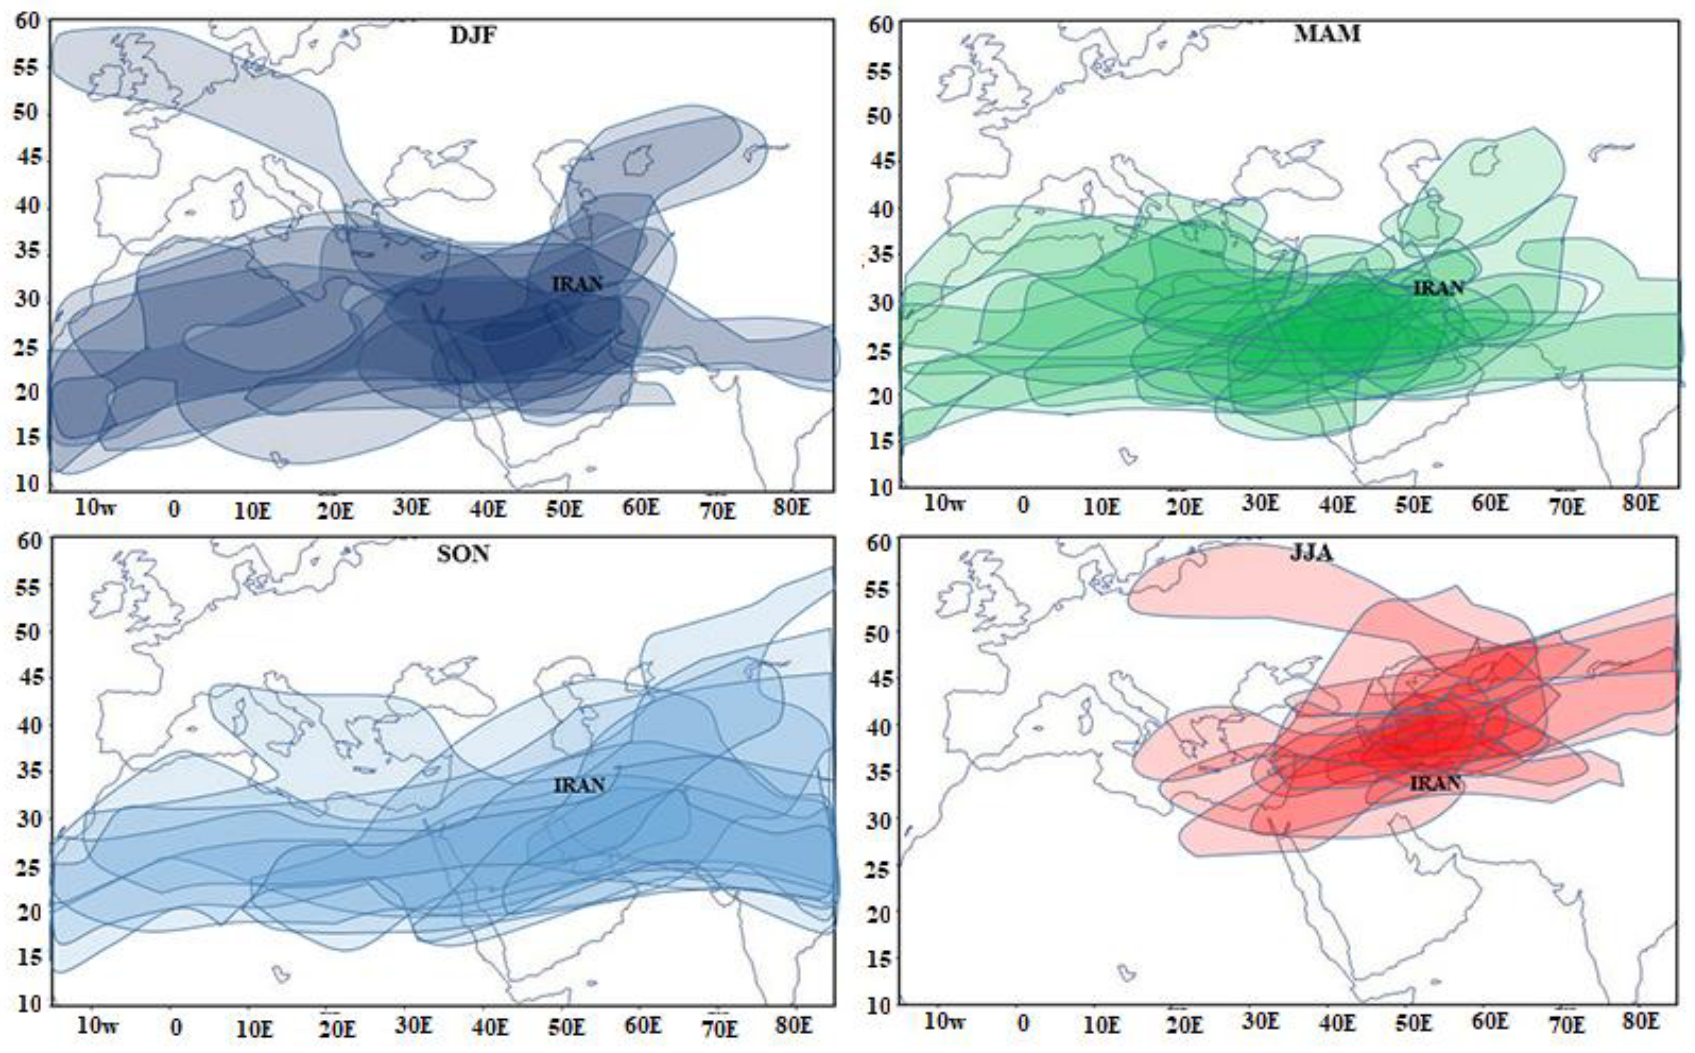
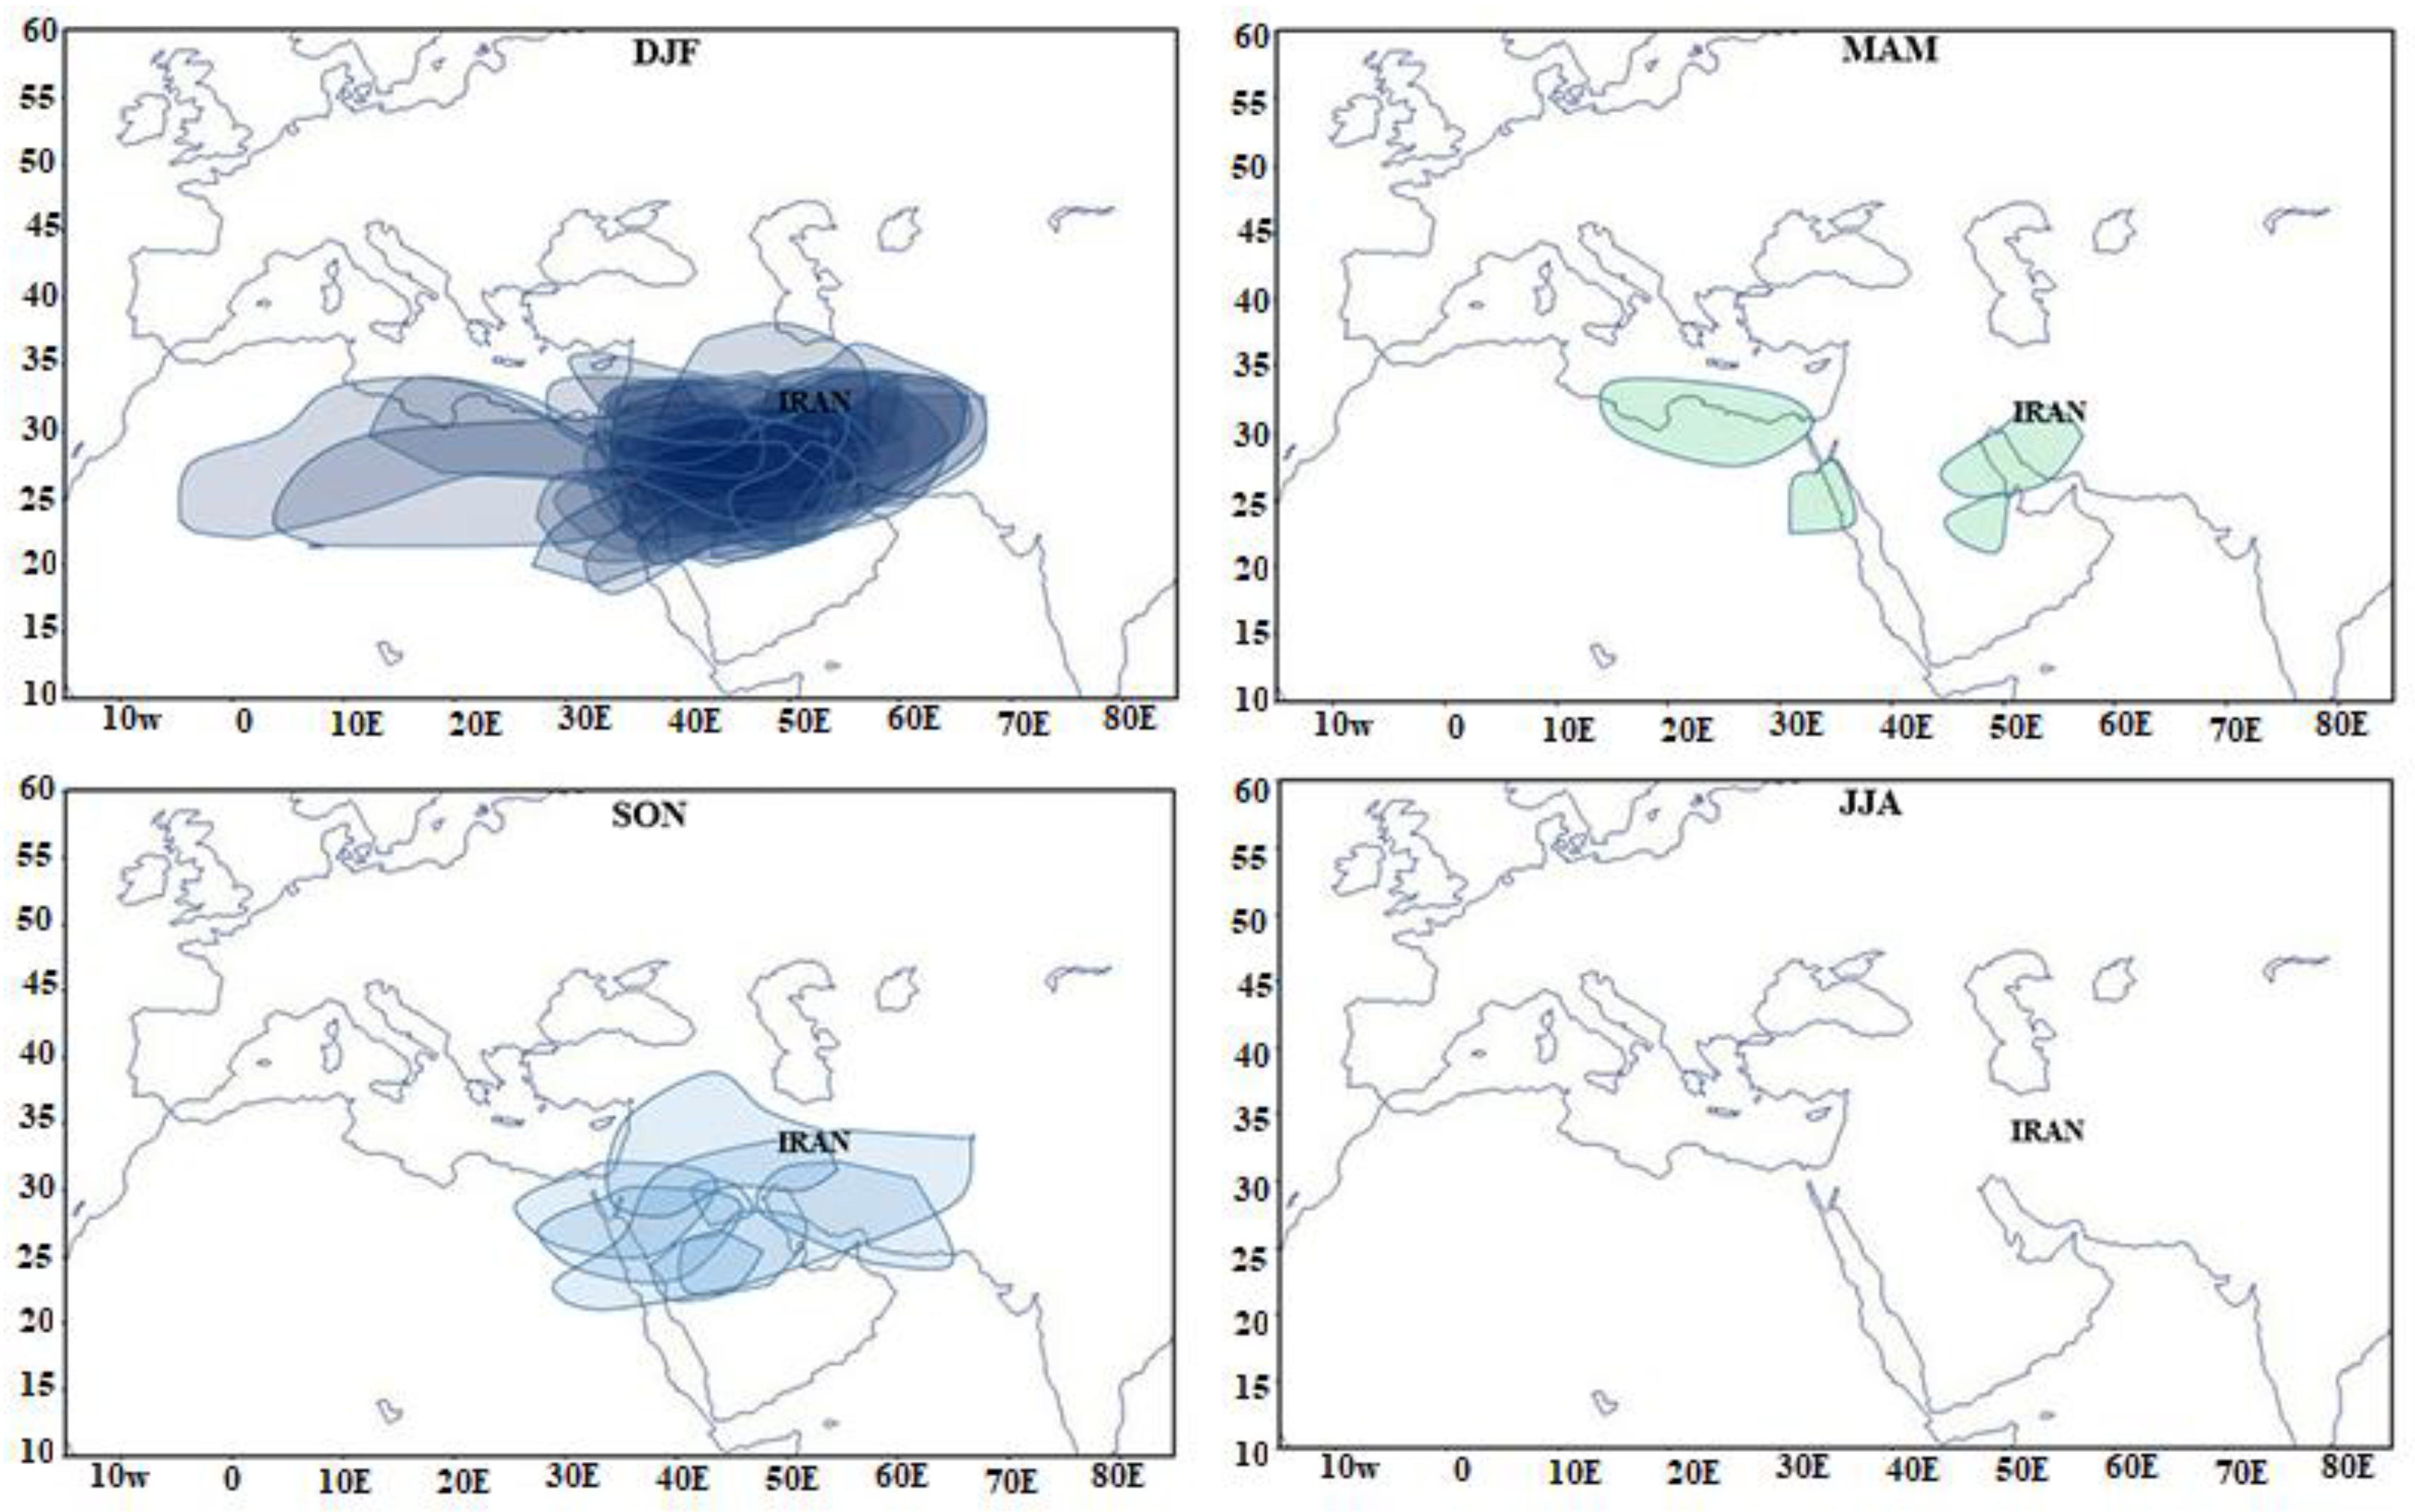
3.2. Seasonal Pattern of Jet Stream Positions at 300 hPa
3.3. Jet Stream Position at 500 hPa
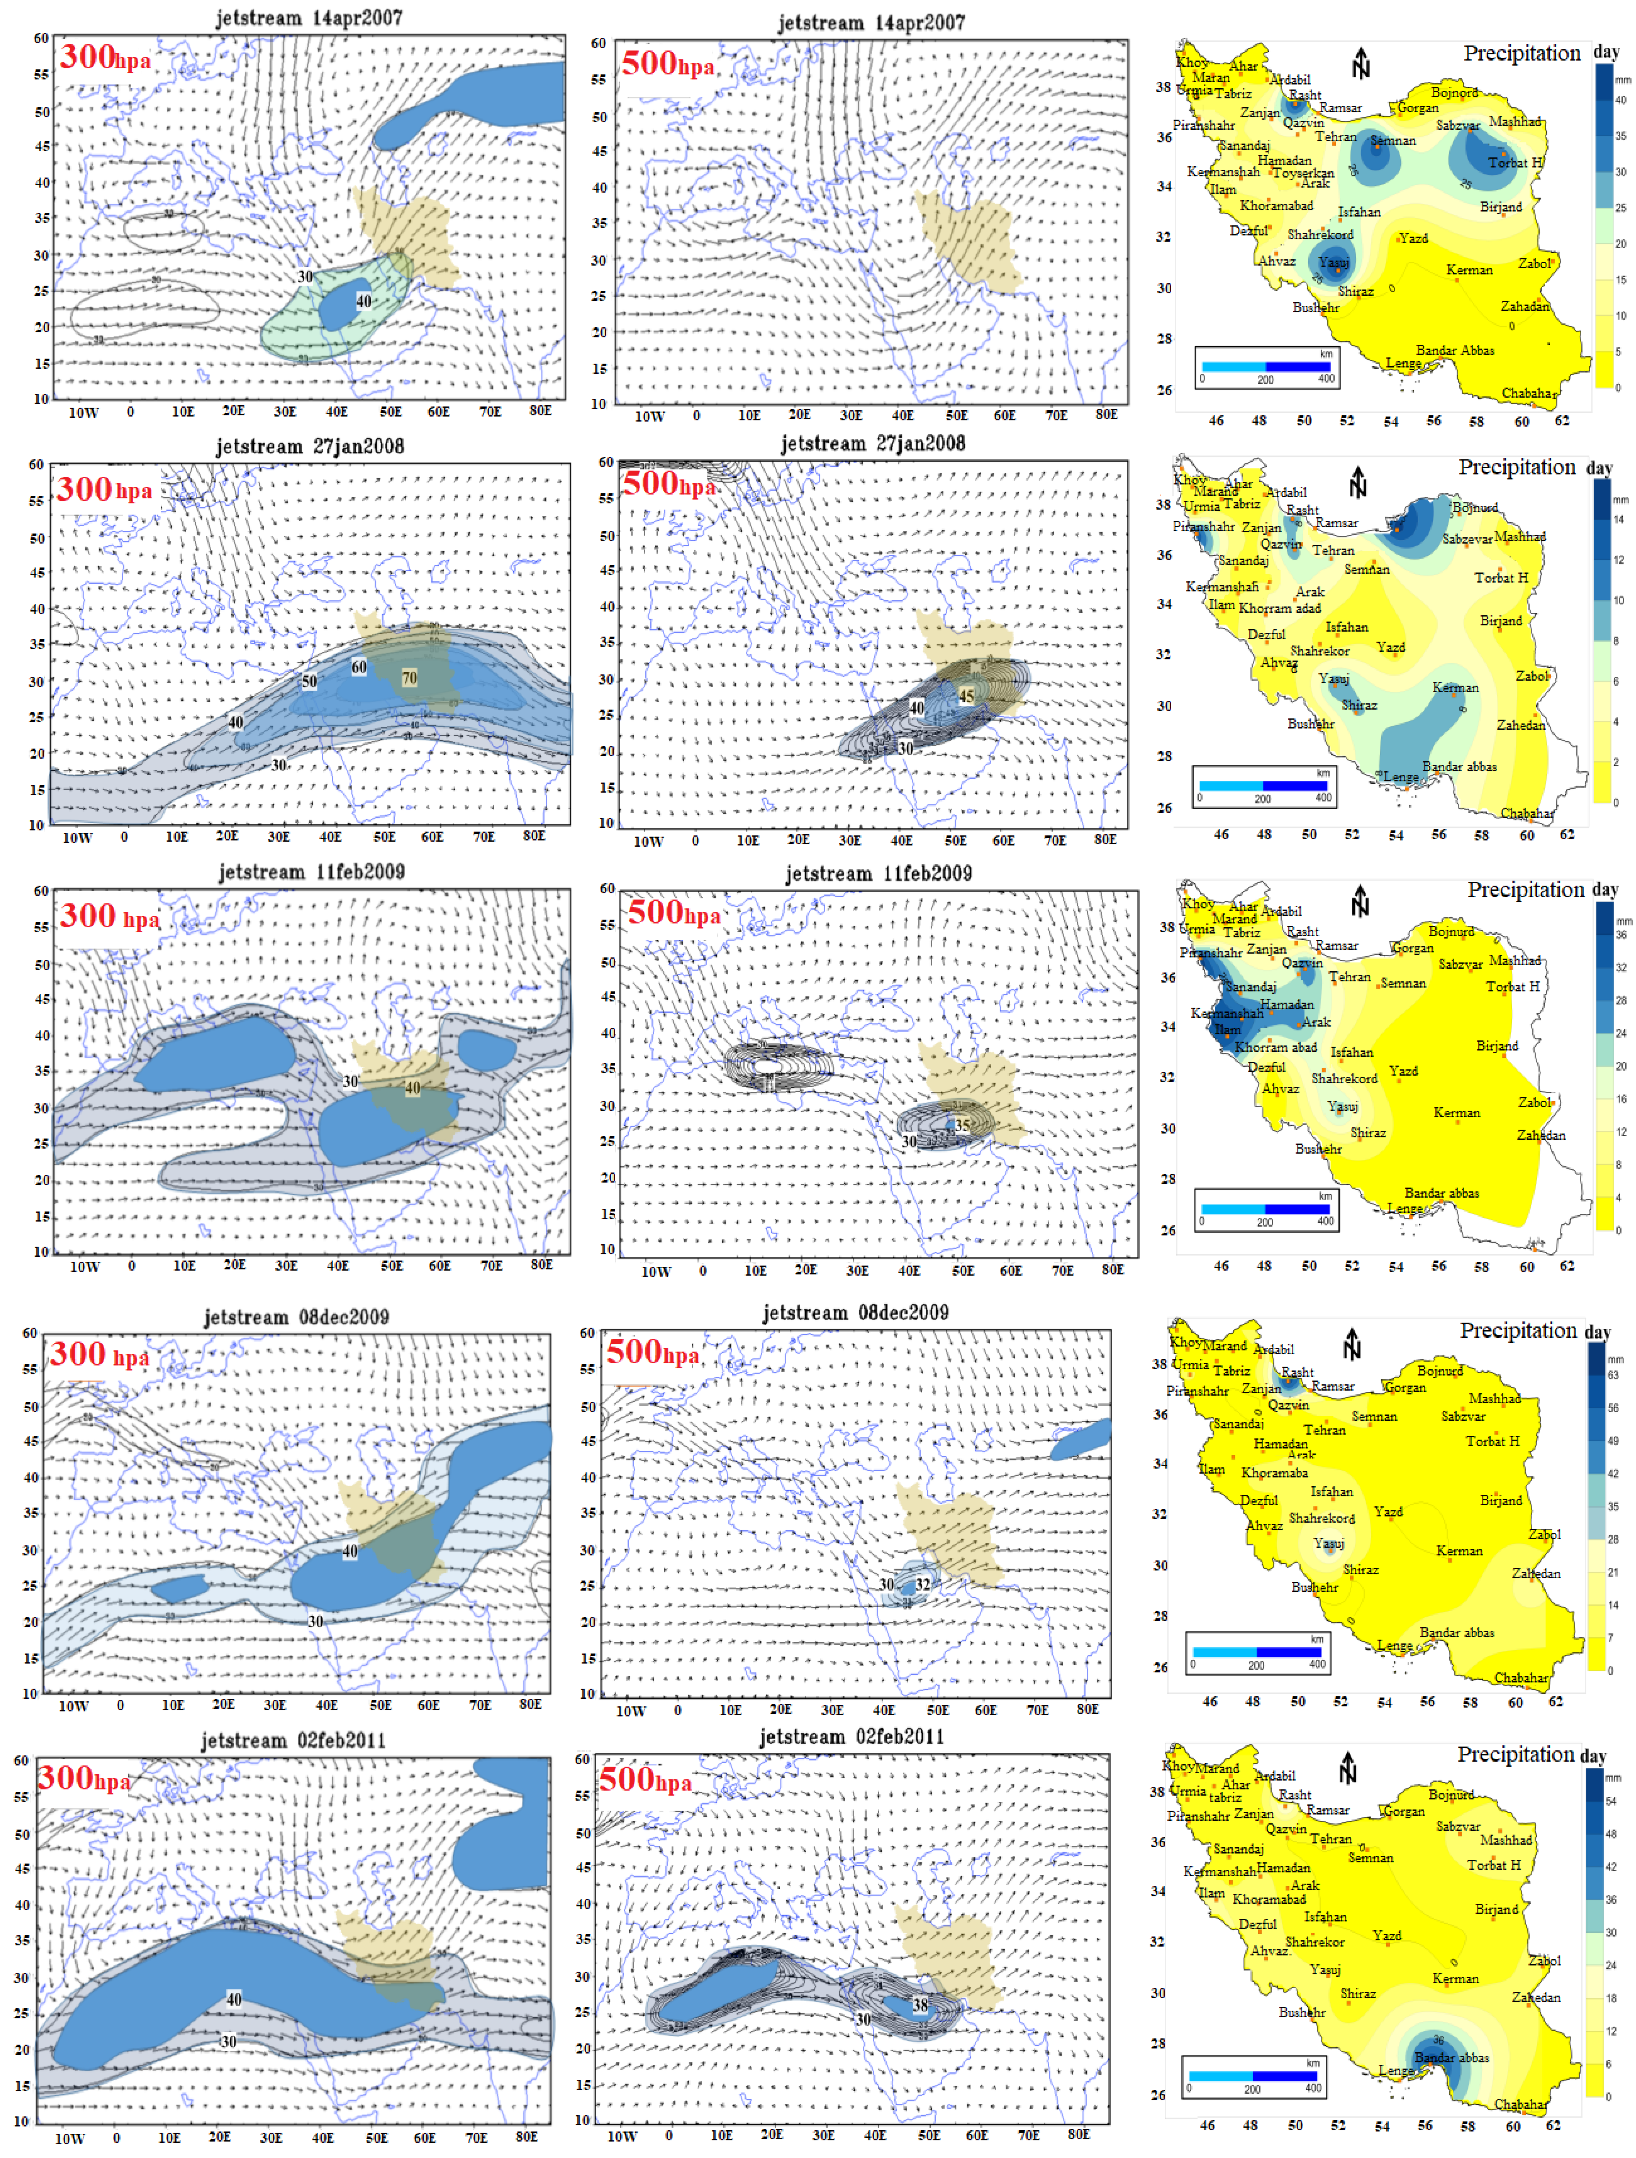
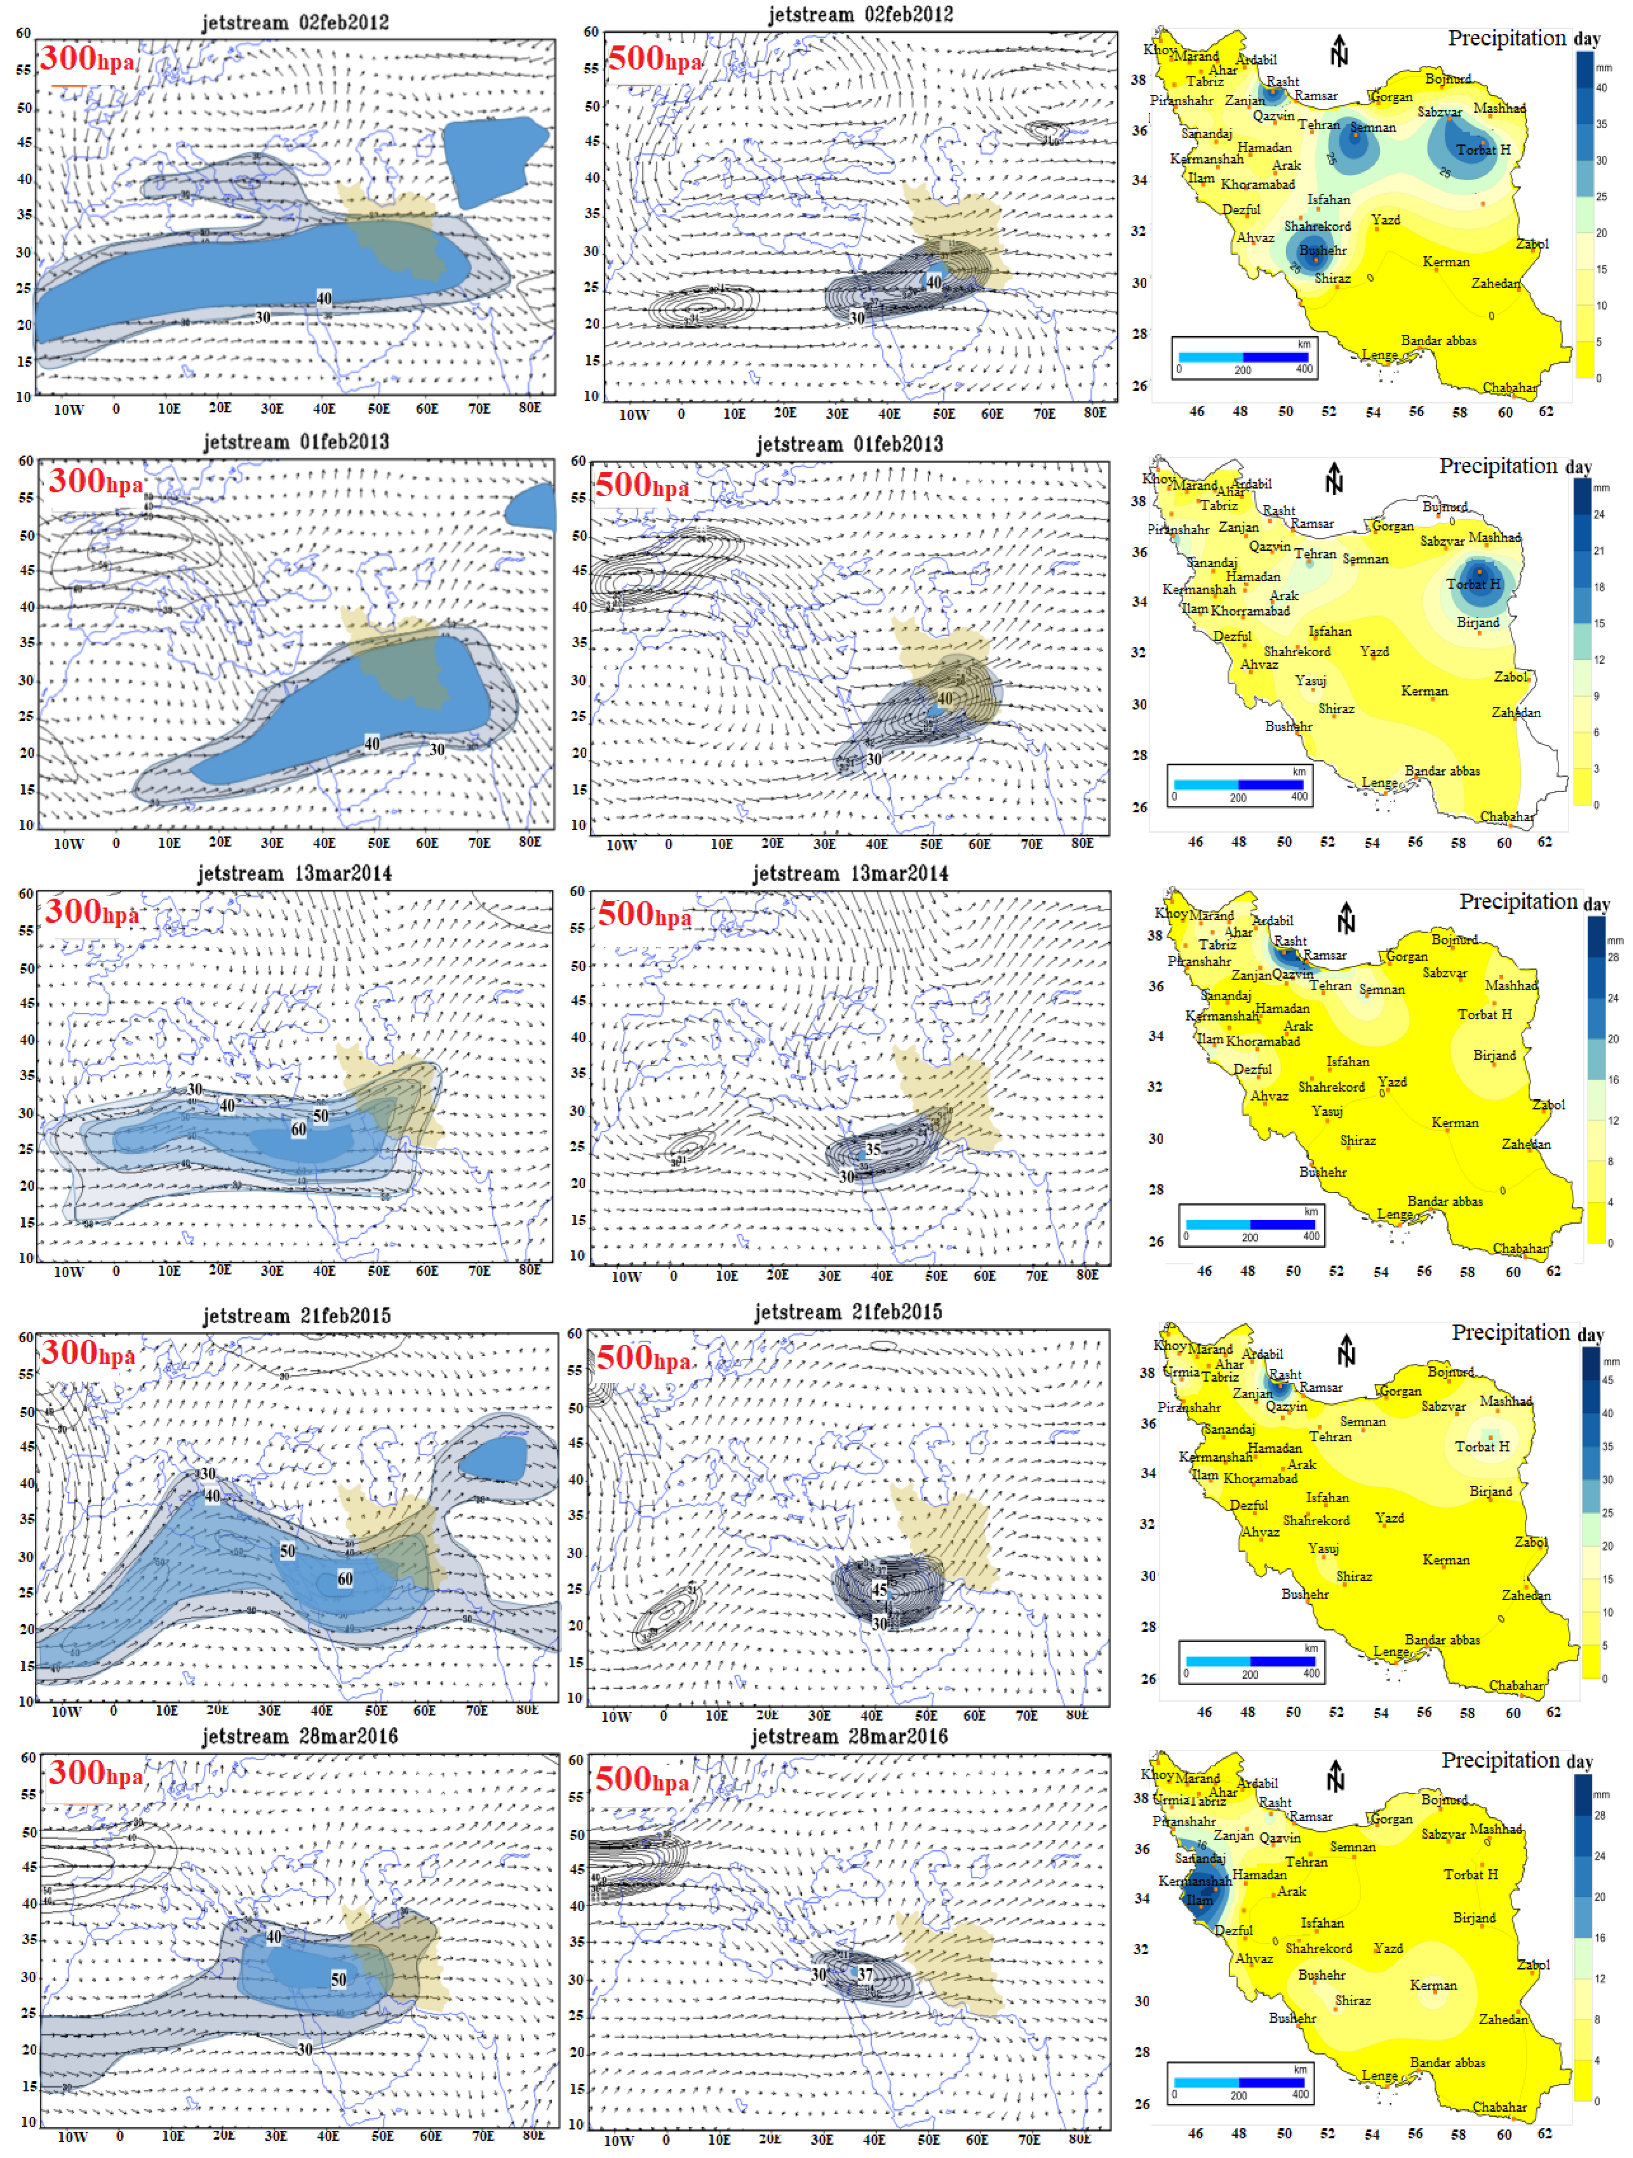
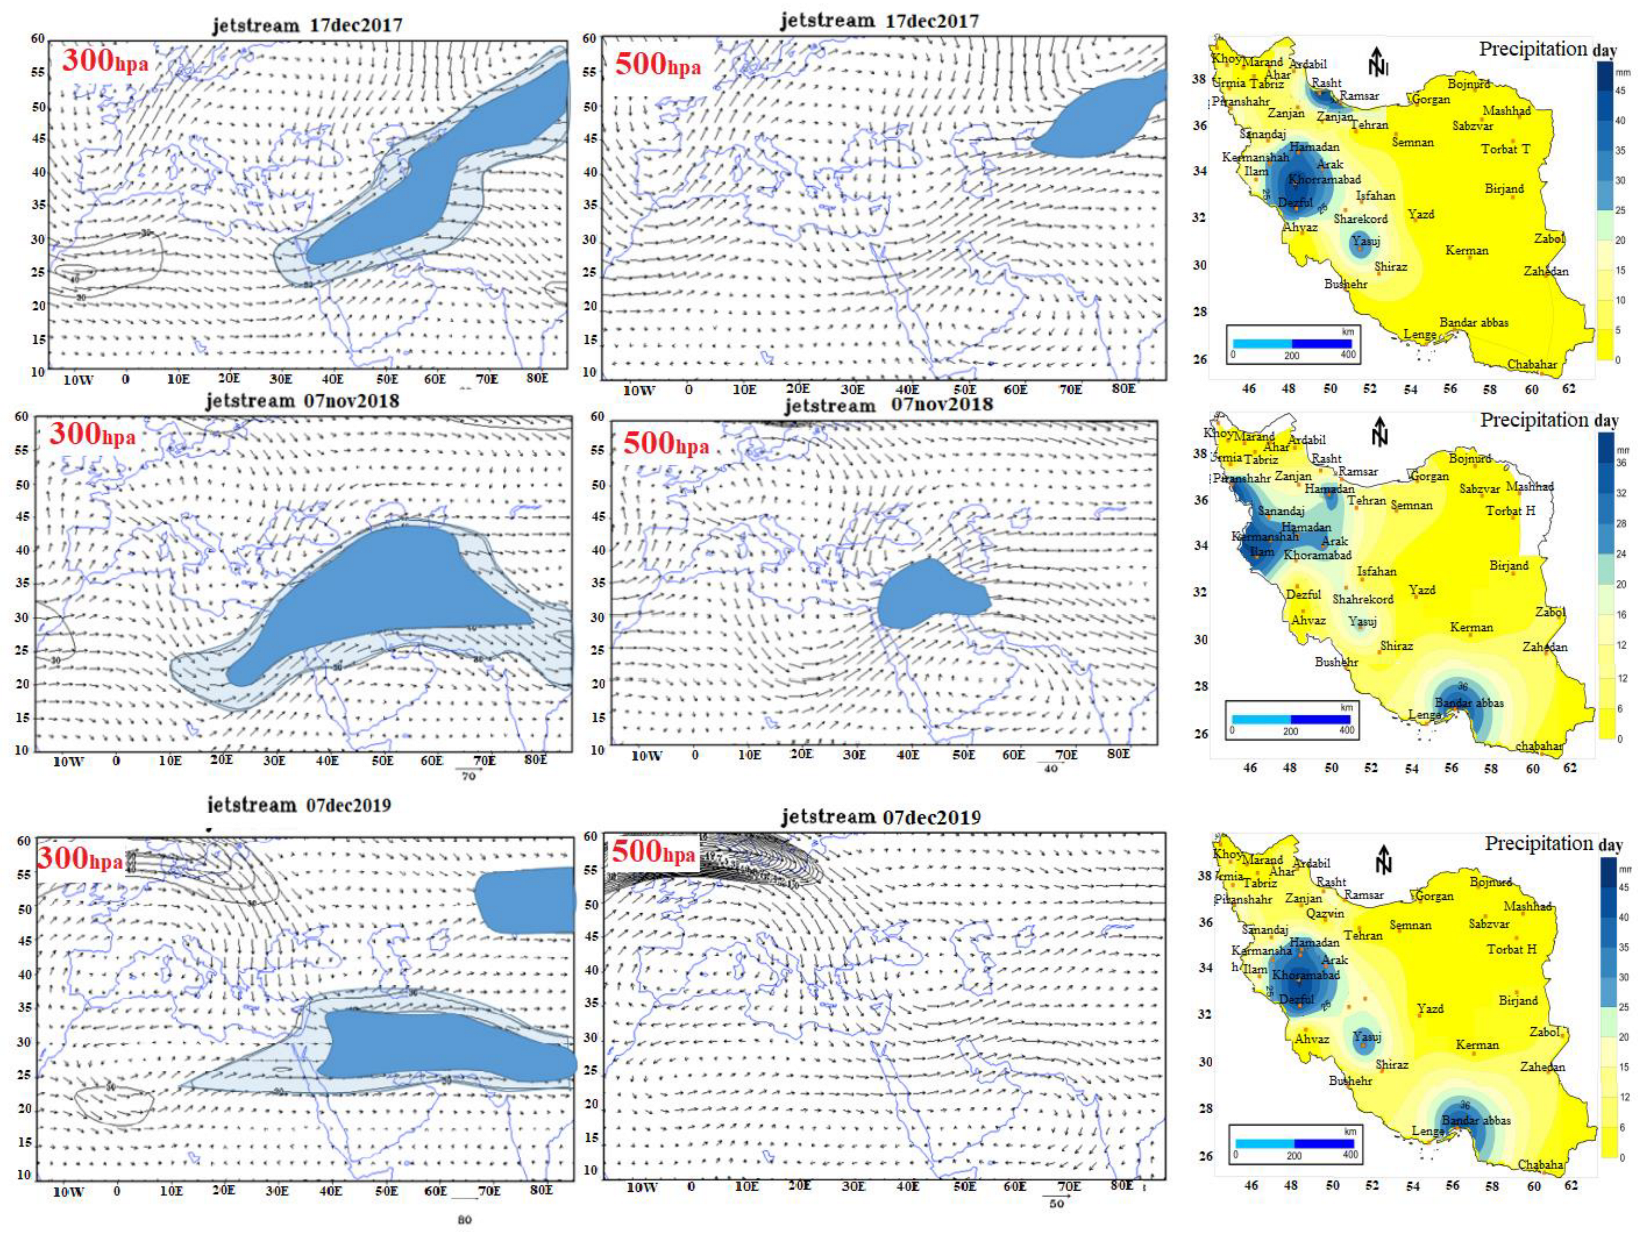
3.4. Jet Stream Location over Iran during the Most Pervasive Rainy Days
4. Conclusions
Author Contributions
Funding
Institutional Review Board Statement
Informed Consent Statement
Data Availability Statement
Acknowledgments
Conflicts of Interest
References
- Barry, R.; Perry, A. Synoptic climatology and its applications. Synop. Dyn. Climatol. 2001, 547, 603. [Google Scholar]
- Geer, I.W. Glossary of weather and climate. Bull. Am. Meteorol. Soc. 2013, 94, 1936–1937. [Google Scholar]
- Carr, M.; Carr, M.W. International Marine’s Weather Predicting Simplified: How to Read Weather Charts and Satellite Images; McGraw Hill Professional: New York, NY, USA, 1999. [Google Scholar]
- Archer, C.L.; Caldeira, K. Historical trends in the jet streams. Geophys. Res. Lett. 2008, 35, L08803. [Google Scholar] [CrossRef]
- Halabian, A.; Hossainali Purjezi, F. The Frequency of Heavy Precipitation and comprehensive analysis of jet streams in the West Bank Caspian. Geogr. Res. 2014, 112, 205–220. [Google Scholar]
- Sheng, C. An introduction to the Climate of China. Beijing Sci. Press 1986, 85, 89. [Google Scholar]
- Phillips, N. Jet stream revisited II. Bull. Am. Meteorol. Soc. 1999, 80, 2629–2630. [Google Scholar]
- Kington, J.W. Clement Ley: Nineteenth-Century cloud study and the European jet stream. Bull. Am. Meteorol. Soc. 1999, 80, 901–903. [Google Scholar]
- Liao, Q. Anomalies of the extratropical westerly jet in the north hemisphere and their impacts on east Asian summer climate anomalies. Chin. J. Geophys. 2004, 47, 11–18. [Google Scholar] [CrossRef]
- Yang, S.; Lau, K.; Kim, K. Variations of the East Asian jet stream and Asian–Pacific–American winter climate anomalies. J. Clim. 2002, 15, 306–325. [Google Scholar] [CrossRef]
- Rousta, I.; Doostkamian, M.; Haghighi, E.; Mirzakhani, B. Statistical-synoptic analysis of the atmosphere thickness pattern of iran’s pervasive frosts. Climate 2016, 4, 41. [Google Scholar] [CrossRef]
- Rousta, I.; Karampour, M.; Doostkamian, M.; Olafsson, H.; Zhang, H.; Mushore, T.D.; Karimvandi, A.S.; Vargas, E.R.M. Synoptic-dynamic analysis of extreme precipitation in Karoun River Basin, Iran. Arab. J. Geosci. 2020, 13, 1–16. [Google Scholar] [CrossRef]
- Zhu, X.; Xu, Z.; Liu, Z.; Liu, M.; Yin, Z.; Yin, L.; Zheng, W. Impact of dam construction on precipitation: A regional perspective. Mar. Freshw. Res. 2022, 16, 104043. [Google Scholar] [CrossRef]
- Yao, L.; Shen, J.; Zhang, F.; Gu, X.; Jiang, S. Influence of environmental values on the typhoon risk perceptions of high school students: A case study in Ningbo, China. Sustainability 2021, 13, 4145. [Google Scholar] [CrossRef]
- Olafsson, H.; Rousta, I. Influence of atmospheric patterns and North Atlantic Oscillation (NAO) on vegetation dynamics in Iceland using Remote Sensing. Eur. J. Remote Sens. 2021, 54, 351–363. [Google Scholar] [CrossRef]
- Jain, P.; Flannigan, M. The relationship between the polar jet stream and extreme wildfire events in North America. J. Clim. 2021, 34, 6247–6265. [Google Scholar] [CrossRef]
- Reiter, E.R.; Whitney, L.F. Interaction between subtropical and polar-front jet stream. Mon. Weather Rev. 1969, 97, 432–438. [Google Scholar] [CrossRef]
- Handlos, Z.J.; Martin, J.E. Composite analysis of large-scale environments conducive to western Pacific polar/subtropical jet superposition. J. Clim. 2016, 29, 7145–7165. [Google Scholar] [CrossRef]
- Rousta, I.; Nasserzadeh, M.H.; Jalali, M.; Haghighi, E.; Ólafsson, H.; Ashrafi, S.; Doostkamian, M.; Ghasemi, A. Decadal spatial-temporal variations in the spatial pattern of anomalies of extreme precipitation thresholds (Case Study: Northwest Iran). Atmosphere 2017, 8, 135. [Google Scholar] [CrossRef]
- Rousta, I.; Doostkamian, M.; Taherian, A.M.; Haghighi, E.; Ghafarian Malamiri, H.R.; Ólafsson, H. Investigation of the spatio-temporal variations in atmosphere thickness pattern of Iran and the Middle East with special focus on precipitation in Iran. Climate 2017, 5, 82. [Google Scholar] [CrossRef]
- Li, Q.; Song, D.; Yuan, C.; Nie, W. An image recognition method for the deformation area of open-pit rock slopes under variable rainfall. Measurement 2022, 188, 110544. [Google Scholar] [CrossRef]
- Kuang, X.; Zhang, Y. Seasonal variation of the East Asian subtropical westerly jet and its association with the heating field over East Asia. Adv. Atmos. Sci. 2005, 22, 831–840. [Google Scholar]
- Schiemann, R.; Lüthi, D.; Schär, C. Seasonality and interannual variability of the westerly jet in the Tibetan Plateau region. J. Clim. 2009, 22, 2940–2957. [Google Scholar] [CrossRef]
- Gong, T.; Feldstein, S.B.; Luo, D. The impact of ENSO on wave breaking and southern annular mode events. J. Atmos. Sci. 2010, 67, 2854–2870. [Google Scholar] [CrossRef]
- Fu, Q.; Lin, P. Poleward shift of subtropical jets inferred from satellite-observed lower-stratospheric temperatures. J. Clim. 2011, 24, 5597–5603. [Google Scholar] [CrossRef]
- Eltantawy, A. Jet stream clouds in the Middle East. Geofis. Appl. 1960, 46, 352–359. [Google Scholar] [CrossRef]
- Grover, E.K.; Sousounis, P.J. The influence of large-scale flow on fall precipitation systems in the Great Lakes Basin. J. Clim. 2002, 15, 1943–1956. [Google Scholar] [CrossRef]
- Xie, Z.; Du, Y.; Yang, S. Zonal extension and retraction of the subtropical westerly jet stream and evolution of precipitation over East Asia and the western Pacific. J. Clim. 2015, 28, 6783–6798. [Google Scholar] [CrossRef]
- Luo, X.; Zhang, Y. The linkage between upper-level jet streams over East Asia and East Asian winter monsoon variability. J. Clim. 2015, 28, 9013–9028. [Google Scholar] [CrossRef]
- Leroux, S.; Hall, N.M. On the relationship between African easterly waves and the African easterly jet. J. Atmos. Sci. 2009, 66, 2303–2316. [Google Scholar] [CrossRef]
- Seager, R.; Harnik, N.; Robinson, W.; Kushnir, Y.; Ting, M.; Huang, H.P.; Velez, J. Mechanisms of ENSO-forcing of hemispherically symmetric precipitation variability. Q. J. R. Meteorol. Soc. A J. Atmos. Sci. Appl. Meteorol. Phys. Oceanogr. 2005, 131, 1501–1527. [Google Scholar] [CrossRef]
- Rodionov, S.; Assel, R. A new look at the Pacific/North American index. Geophys. Res. Lett. 2001, 28, 1519–1522. [Google Scholar] [CrossRef]
- Prezerakos, N.; Flocas, H.; Brikas, D. The role of the interaction between polar and subtropical jet in a case of depression rejuvenation over the Eastern Mediterranean. Meteorol. Atmos. Phys. 2006, 92, 139–151. [Google Scholar] [CrossRef]
- Masoodian, S.; Mohammadi, B. Analysis of jet stream frequencies associated with super heavy rainfalls of Iran. Iran-Water Resour. Res. 2011, 7, 80–91. [Google Scholar]
- Wang, Y.; Hu, K.; Huang, G.; Tao, W. Asymmetric impacts of El Niño and La Niña on the Pacific–North American teleconnection pattern: The role of subtropical jet stream. Environ. Res. Lett. 2021, 16, 114040. [Google Scholar] [CrossRef]
- Du, Y.; Chen, G. Climatology of low-level jets and their impact on rainfall over southern China during the early-summer rainy season. J. Clim. 2019, 32, 8813–8833. [Google Scholar] [CrossRef]
- Fu, P.; Zhu, K.; Zhao, K.; Zhou, B.; Xue, M. Role of the nocturnal low-level jet in the formation of the morning precipitation peak over the Dabie Mountains. Adv. Atmos. Sci. 2019, 36, 15–28. [Google Scholar] [CrossRef]
- Liu, Y.; Zhang, K.; Li, Z.; Liu, Z.; Wang, J.; Huang, P. A hybrid runoff generation modelling framework based on spatial combination of three runoff generation schemes for semi-humid and semi-arid watersheds. J. Hydrol. 2020, 590, 125440. [Google Scholar] [CrossRef]
- Huang, Y.; Bárdossy, A.; Zhang, K. Sensitivity of hydrological models to temporal<? xmltex\break?> and spatial resolutions of rainfall data. Hydrol. Earth Syst. Sci. 2019, 23, 2647–2663. [Google Scholar]
- Wang, G.; Zhao, B.; Lan, R.; Liu, D.; Wu, B.; Li, Y.; Li, Q.; Zhou, H.; Liu, M.; Liu, W. Experimental study on failure model of tailing dam overtopping under heavy rainfall. Lithosphere 2022, 2022, 5922501. [Google Scholar] [CrossRef]
- Park, C.; Son, S.-W.; Kim, H.; Ham, Y.-G.; Kim, J.; Cha, D.-H.; Chang, E.-C.; Lee, G.; Kug, J.-S.; Lee, W.-S. Record-breaking summer rainfall in South Korea in 2020: Synoptic characteristics and the role of large-scale circulations. Mon. Weather Rev. 2021, 149, 3085–3100. [Google Scholar] [CrossRef]
- Araki, K.; Kato, T.; Hirockawa, Y.; Mashiko, W. Characteristics of atmospheric environments of quasi-stationary convective bands in Kyushu, Japan during the July 2020 heavy rainfall event. SOLA 2021, 17, 8–15. [Google Scholar] [CrossRef]
- Zhang, W.; Huang, Z.; Jiang, F.; Stuecker, M.F.; Chen, G.; Jin, F.F. Exceptionally persistent Madden-Julian Oscillation activity contributes to the extreme 2020 East Asian summer monsoon rainfall. Geophys. Res. Lett. 2021, 48, e2020GL091588. [Google Scholar] [CrossRef]
- Zhou, Z.-Q.; Xie, S.-P.; Zhang, R. Historic Yangtze flooding of 2020 tied to extreme Indian Ocean conditions. Proc. Natl. Acad. Sci. USA 2021, 118, e2022255118. [Google Scholar] [CrossRef] [PubMed]
- Horinouchi, T.; Kosaka, Y.; Nakamigawa, H.; Nakamura, H.; Fujikawa, N.; Takayabu, Y.N. Moisture supply, jet, and Silk-Road wave train associated with the prolonged heavy rainfall in Kyushu, Japan in early July 2020. Sola 2022, 2022, 5922501. [Google Scholar] [CrossRef]
- Saligheh, M. The Effect of Merging Subtropical Jet Stream and Polar Fronts Jet Stream on Heavy Rainfall in Southwest Asia (Version 1). Res. Sq. 2021. preprint. [Google Scholar] [CrossRef]
- Rao, X.; Zhao, K.; Chen, X.; Huang, A.; Xue, M.; Zhang, Q.; Wang, M. Influence of synoptic pattern and low-level wind speed on intensity and diurnal variations of orographic convection in summer over Pearl River Delta, South China. J. Geophys. Res. Atmos. 2019, 124, 6157–6179. [Google Scholar] [CrossRef]
- Chen, X.; Zhang, F.; Zhao, K. Influence of monsoonal wind speed and moisture content on intensity and diurnal variations of the mei-yu season coastal rainfall over south China. J. Atmos. Sci. 2017, 74, 2835–2856. [Google Scholar] [CrossRef]
- Zhang, K.; Ali, A.; Antonarakis, A.; Moghaddam, M.; Saatchi, S.; Tabatabaeenejad, A.; Chen, R.; Jaruwatanadilok, S.; Cuenca, R.; Crow, W.T. The sensitivity of North American terrestrial carbon fluxes to spatial and temporal variation in soil moisture: An analysis using radar-derived estimates of root-zone soil moisture. J. Geophys. Res. Biogeosci. 2019, 124, 3208–3231. [Google Scholar] [CrossRef]
- Yue, Z.; Zhou, W.; Li, T. Impact of the Indian Ocean dipole on evolution of the subsequent ENSO: Relative roles of dynamic and thermodynamic processes. J. Clim. 2021, 34, 3591–3607. [Google Scholar] [CrossRef]
- Quan, Q.; Liang, W.; Yan, D.; Lei, J. Influences of joint action of natural and social factors on atmospheric process of hydrological cycle in Inner Mongolia, China. Urban Clim. 2022, 41, 101043. [Google Scholar] [CrossRef]
- Huo, W.; Li, Z.; Wang, J.; Yao, C.; Zhang, K.; Huang, Y. Multiple hydrological models comparison and an improved Bayesian model averaging approach for ensemble prediction over semi-humid regions. Stoch. Environ. Res. Risk Assess. 2019, 33, 217–238. [Google Scholar] [CrossRef]
- Tu, C.-C.; Chen, Y.-L.; Lin, P.-L.; Du, Y. Characteristics of the marine boundary layer jet over the South China Sea during the early summer rainy season of Taiwan. Mon. Weather Rev. 2019, 147, 457–475. [Google Scholar] [CrossRef]
- SaeedAbadi, R.; Abkharabat, S.; Najafi, M.S. An Analysis of polar Jest Stream (PJS) location Associated with Low Level Moisture Flux and Heavy Rainfalls in West of Iran. J. Environ. Stud. 2016, 41, 783–798. [Google Scholar]
- Kaviani, M.R.; Alijani, B. Principles of Climatology; SAMT Press: Tehran, Iran, 2001; Volume 1, p. 592. [Google Scholar]


Disclaimer/Publisher’s Note: The statements, opinions and data contained in all publications are solely those of the individual author(s) and contributor(s) and not of MDPI and/or the editor(s). MDPI and/or the editor(s) disclaim responsibility for any injury to people or property resulting from any ideas, methods, instructions or products referred to in the content. |
© 2023 by the authors. Licensee MDPI, Basel, Switzerland. This article is an open access article distributed under the terms and conditions of the Creative Commons Attribution (CC BY) license (https://creativecommons.org/licenses/by/4.0/).
Share and Cite
Rousta, I.; Esmaeili Mahmoudabadi, A.; Amini, P.; Nikkhah, A.; Olafsson, H.; Krzyszczak, J.; Baranowski, P. Identification of Patterns and Relationships of Jet Stream Position with Flood-Prone Precipitation in Iran during 2006–2019. Atmosphere 2023, 14, 351. https://doi.org/10.3390/atmos14020351
Rousta I, Esmaeili Mahmoudabadi A, Amini P, Nikkhah A, Olafsson H, Krzyszczak J, Baranowski P. Identification of Patterns and Relationships of Jet Stream Position with Flood-Prone Precipitation in Iran during 2006–2019. Atmosphere. 2023; 14(2):351. https://doi.org/10.3390/atmos14020351
Chicago/Turabian StyleRousta, Iman, Abazar Esmaeili Mahmoudabadi, Parisa Amini, Armin Nikkhah, Haraldur Olafsson, Jaromir Krzyszczak, and Piotr Baranowski. 2023. "Identification of Patterns and Relationships of Jet Stream Position with Flood-Prone Precipitation in Iran during 2006–2019" Atmosphere 14, no. 2: 351. https://doi.org/10.3390/atmos14020351