
The Spring Drought in Yunnan Province of China: Variation Characteristics, Leading Impact Factors, and Physical Mechanisms

1
National Marine Environmental Forecasting Center, Beijing 100081, China
2
State Key Laboratory of Severe Weather, Institute of Climate System, Chinese Academy of Meteorological Sciences, Beijing 100081, China
3
College of Life Sciences and Oceanography, Shenzhen University, Shenzhen 518061, China
*
Author to whom correspondence should be addressed.
Atmosphere 2023, 14(2), 294; https://doi.org/10.3390/atmos14020294
Submission received: 28 December 2022
/
Revised: 28 January 2023
/
Accepted: 30 January 2023
/
Published: 1 February 2023
(This article belongs to the Special Issue Climate Change on Ocean Dynamics)
Abstract
:Yunnan Province in Southwest China is vulnerable to droughts due to its distinctive topography and local climate. Spring drought in Yunnan (SDY), which accounts for 70% of all drought events, causes the most severe devastation. By examining the variation characteristics of droughts in Yunnan from 1961 to 2020 in terms of the standardized precipitation evapotranspiration index (SPEI), this present study shows that droughts in Yunnan have worsened in the past 60 years on different timescales. Especially, the SDY exhibits notable interannual and interdecadal variations, with no significant long-term trend, although the spring average regional temperatures have risen at a rate of 0.33 °C/10a since 1961. Here, in order to quantify the contribution of the precipitation and temperature, the two main meteorological impact factors, to the SDY under the exacerbation of climate warming, the statistical analyses reveal that precipitation plays a more crucial role than temperature in interannual and interdecadal SDY variations. Further, a diagnostic analysis of the moisture budget equation indicates that suppressed vertical moisture advection is the most important physical process affecting the reduced rainfall amount in spring, followed by the restricted horizontal water vapor transport. Meanwhile, the weak Bay of Bengal (BOB) summer monsoon, which is likely regulated by El Niño-like sea surface temperature anomalies (SSTAs) in spring, is closely linked with the SDY. This mechanism provides the possibility of SDY predictability on a seasonal scale.
1. Introduction
The IPCC-AR6 states that the rate of increase in global surface temperatures since 1970 is obviously faster than that in any other 50-year period during the past 2000 years (high confidence), and the warming over land is greater than the global average [1]. Under continuous and rapid global warming, the frequency and intensity of extreme weather and climate events with devastating impacts (e.g., heavy precipitation, river floods, heat waves, tropical cyclones, severe storms, and droughts) have globally increased since the 1950s [2,3,4]. Among these weather-related natural disasters, droughts can have serious adverse impacts on the ecological environment and agricultural production, cause huge economic losses on both global and regional scales, and even cause regional conflicts [5,6,7].
In the Yunnan Province of China, although the average annual precipitation in this region is more than 1100 mm, the region is vulnerable to drought disasters due to its unique topography and landforms [8]. For instance, a severe drought occurred in Yunnan during the spring of 2005 [9,10]. In 2010, Yunnan suffered from a once-in-a-century severe spring drought, leaving more than 7 million people without adequate drinking water [11,12]. From spring to summer of 2019, an extremely rare drought with a rainfall deficiency and high temperatures hit Yunnan. This drought event seriously disrupted water supplies and agriculture and caused economic losses totaling more than those of the previous five years [13].
As one of the most serious disasters affecting human society, the definition of drought varies in different discipline specialties. According to the American Meteorological Society, drought can be classified into meteorological drought, agricultural drought, hydrological drought, and socioeconomic drought [14]. Among them, water shortage is basic to drought [7,15], and meteorological drought is the foundation for the occurrence of the other three types of drought. Meteorological drought refers to the water shortage phenomenon caused by the imbalance between the income and expenditure of evaporation and precipitation in a certain period, with water expenditure exceeding water income [16]. Many meteorological drought indexes are used to evaluate the frequency, intensity, and duration of drought [16,17,18,19,20]. However, because of the regional difference in weather and climate, the regional applicability of the drought index needs to be considered in drought analyses. For example, Li et al. [21] revealed that the standardized precipitation evapotranspiration index (SPEI) is more applicable to the drought in Southwest China than the comprehensive meteorological drought index (Ci) [22]. Previous studies have shown that droughts in Yunnan exhibit significant variation characteristics on multiple timescales. Based on the SPEI analysis, Huang et al. [23] found that the frequency and intensity of droughts in Southwest China have obviously increased in the past 50 years, especially in the Yunnan area. In addition to the obvious increasing trend variation, droughts in Yunnan exhibited notable interdecadal, interannual, and seasonal variations [20]. The reason for the obvious seasonal variation is the excessive concentration of dry and wet seasons in Yunnan. Furthermore, the occurrence of the spring (March–April–May) drought in Yunnan (SDY), which causes the most serious devastation, accounts for 70% of all drought events [24,25,26,27]. Therefore, analyzing the characteristics and causes of the SDY is important for drought prediction and warning.
For the occurrence and development of drought, precipitation is certainly the most essential of all these linked meteorological elements. A cumulative precipitation deficiency causes severe droughts in Yunnan, such as those that occurred in 2005 and 2010. Meanwhile, the temperature, which is used for calculating the potential evapotranspiration (PET), also plays a major role in drought. Yao et al. [28] found that increasing temperature is the main factor influencing the occurrence of drought disasters in Southwest China. Notably, numerous studies have revealed that the frequency, duration, and cumulative intensity of extreme drought events in Yunnan Province have significantly increased since the 21st century with the background of global warming [28,29,30,31]. Previous reports have shown that with global warming, the precipitation in Yunnan decreases, and the intensity and frequency of high temperature and drought events tend to increase [32,33]. Especially in the 21st century, the general decrease in the annual precipitation and the obvious warming in Yunnan Province have led to a further intensification of drought events [34,35]. Furthermore, Yunnan has recently experienced more frequent extreme heat events in spring and summer [10,36], and long, persistent heat waves hit Yunnan from April to June 2019, together with severe drought disasters in some areas [37]. In addition, the results of a model simulation suggested that climate change would exacerbate droughts in Yunnan in the future [19]. Therefore, it is necessary to study how droughts in Yunnan Province have responded to global warming, as this information is crucial for regional drought forecasting and early warning.
Previous studies have discussed the typical atmospheric circulations associated with severe drought events in Yunnan. Due to the seasonal variation of atmospheric circulation, the factors affecting droughts in Yunnan are different among seasons. For the winter droughts in Yunnan, the westward and stronger Western Pacific Subtropical High (WPSH), the mid-latitude westerlies anomalies, the weaker Southern Trough, and the North Atlantic Oscillation (NAO) are mainly impact factors [11,12]. In addition, the ENSO, as the most notable external forcing factor, has an important effect on the formation of droughts by regulating the anomalies of atmospheric circulations [38,39,40,41]. Although some studies have discussed the influence of the El Niño on these above atmospheric circulations associated with the climate anomalies in Yunnan [42,43], others disputed that these anomalous atmospheric circulations are not forced by El Niño [44] but by La Niña [45]. Further, the different types of ENSO events also have different effects on precipitation and temperature anomalies in Yunnan [46]. In addition to the above factors, the weaker tropical convective activity and the later onset of a weaker Bay of Bengal (BOB) summer monsoon are more important influencing factors for summer droughts in Yunnan [47]. However, as a transitional season, the occurrence of droughts in spring is usually considered to be the continuation of the previous winter droughts or the beginning of the following summer droughts. In recent years, the analysis of individual cases of spring droughts is increasing gradually. Liu et al. [9,10] suggested that the stronger WPSH with a westward and southward location plays an important role in the spring drought of 2005. In addition to the stronger WPSH, the anomalous anticyclonic in the BOB also affects the anomalous spring precipitation in Yunnan by hindering water vapor transport and strengthening the local descending motion [37]. The results of Ma et al. [43] revealed that the significant anomalous anticyclone in the upper troposphere over Yunnan and the increased solar radiation reaching the ground were the notable causes for the extreme spring drought event in 2019. Nonetheless, the general analysis of the major atmospheric circulation factors affecting the SDY and their physical mechanisms remain unclear.
Despite significant advances in our understanding of the causes of SDY, there are still some aspects that need to be further confirmed. For the Yunnan region, most researchers have focused on the causes of individual drought events in spring and have rarely studied the relative contribution of meteorological factors (e.g., precipitation and temperature) to spring droughts nor their leading impact factors and physical mechanisms. Therefore, this study aims to study the variation characteristics, direct impact factors, and physical mechanisms of SDY with the background of global warming by (1) analyzing the variation characteristics of droughts in Yunnan with the SPEI, (2) investigating the contributions of precipitation and temperature to the SDY, (3) diagnosing the physical processes of the moisture budget equation and associated atmospheric circulations, and (4) discussing the foundation and possible external forcing of the SDY. The article is organized as follows: Section 2 introduces the data and methods applied. Section 3 analyzes the variation characteristics of droughts in Yunnan and discusses the contributions of precipitation and temperature to the SDY. The diagnostic results of the moisture budget equation and associated atmospheric circulations are also revealed in Section 3. Section 4 and Section 5 provide the discussion and conclusion, respectively. This study can provide reliable and scientific theoretical support to better understand and forecast the evolution of dry conditions in spring over Yunnan with the background of global warming.
2. Data and Methodology
2.1. Study Area
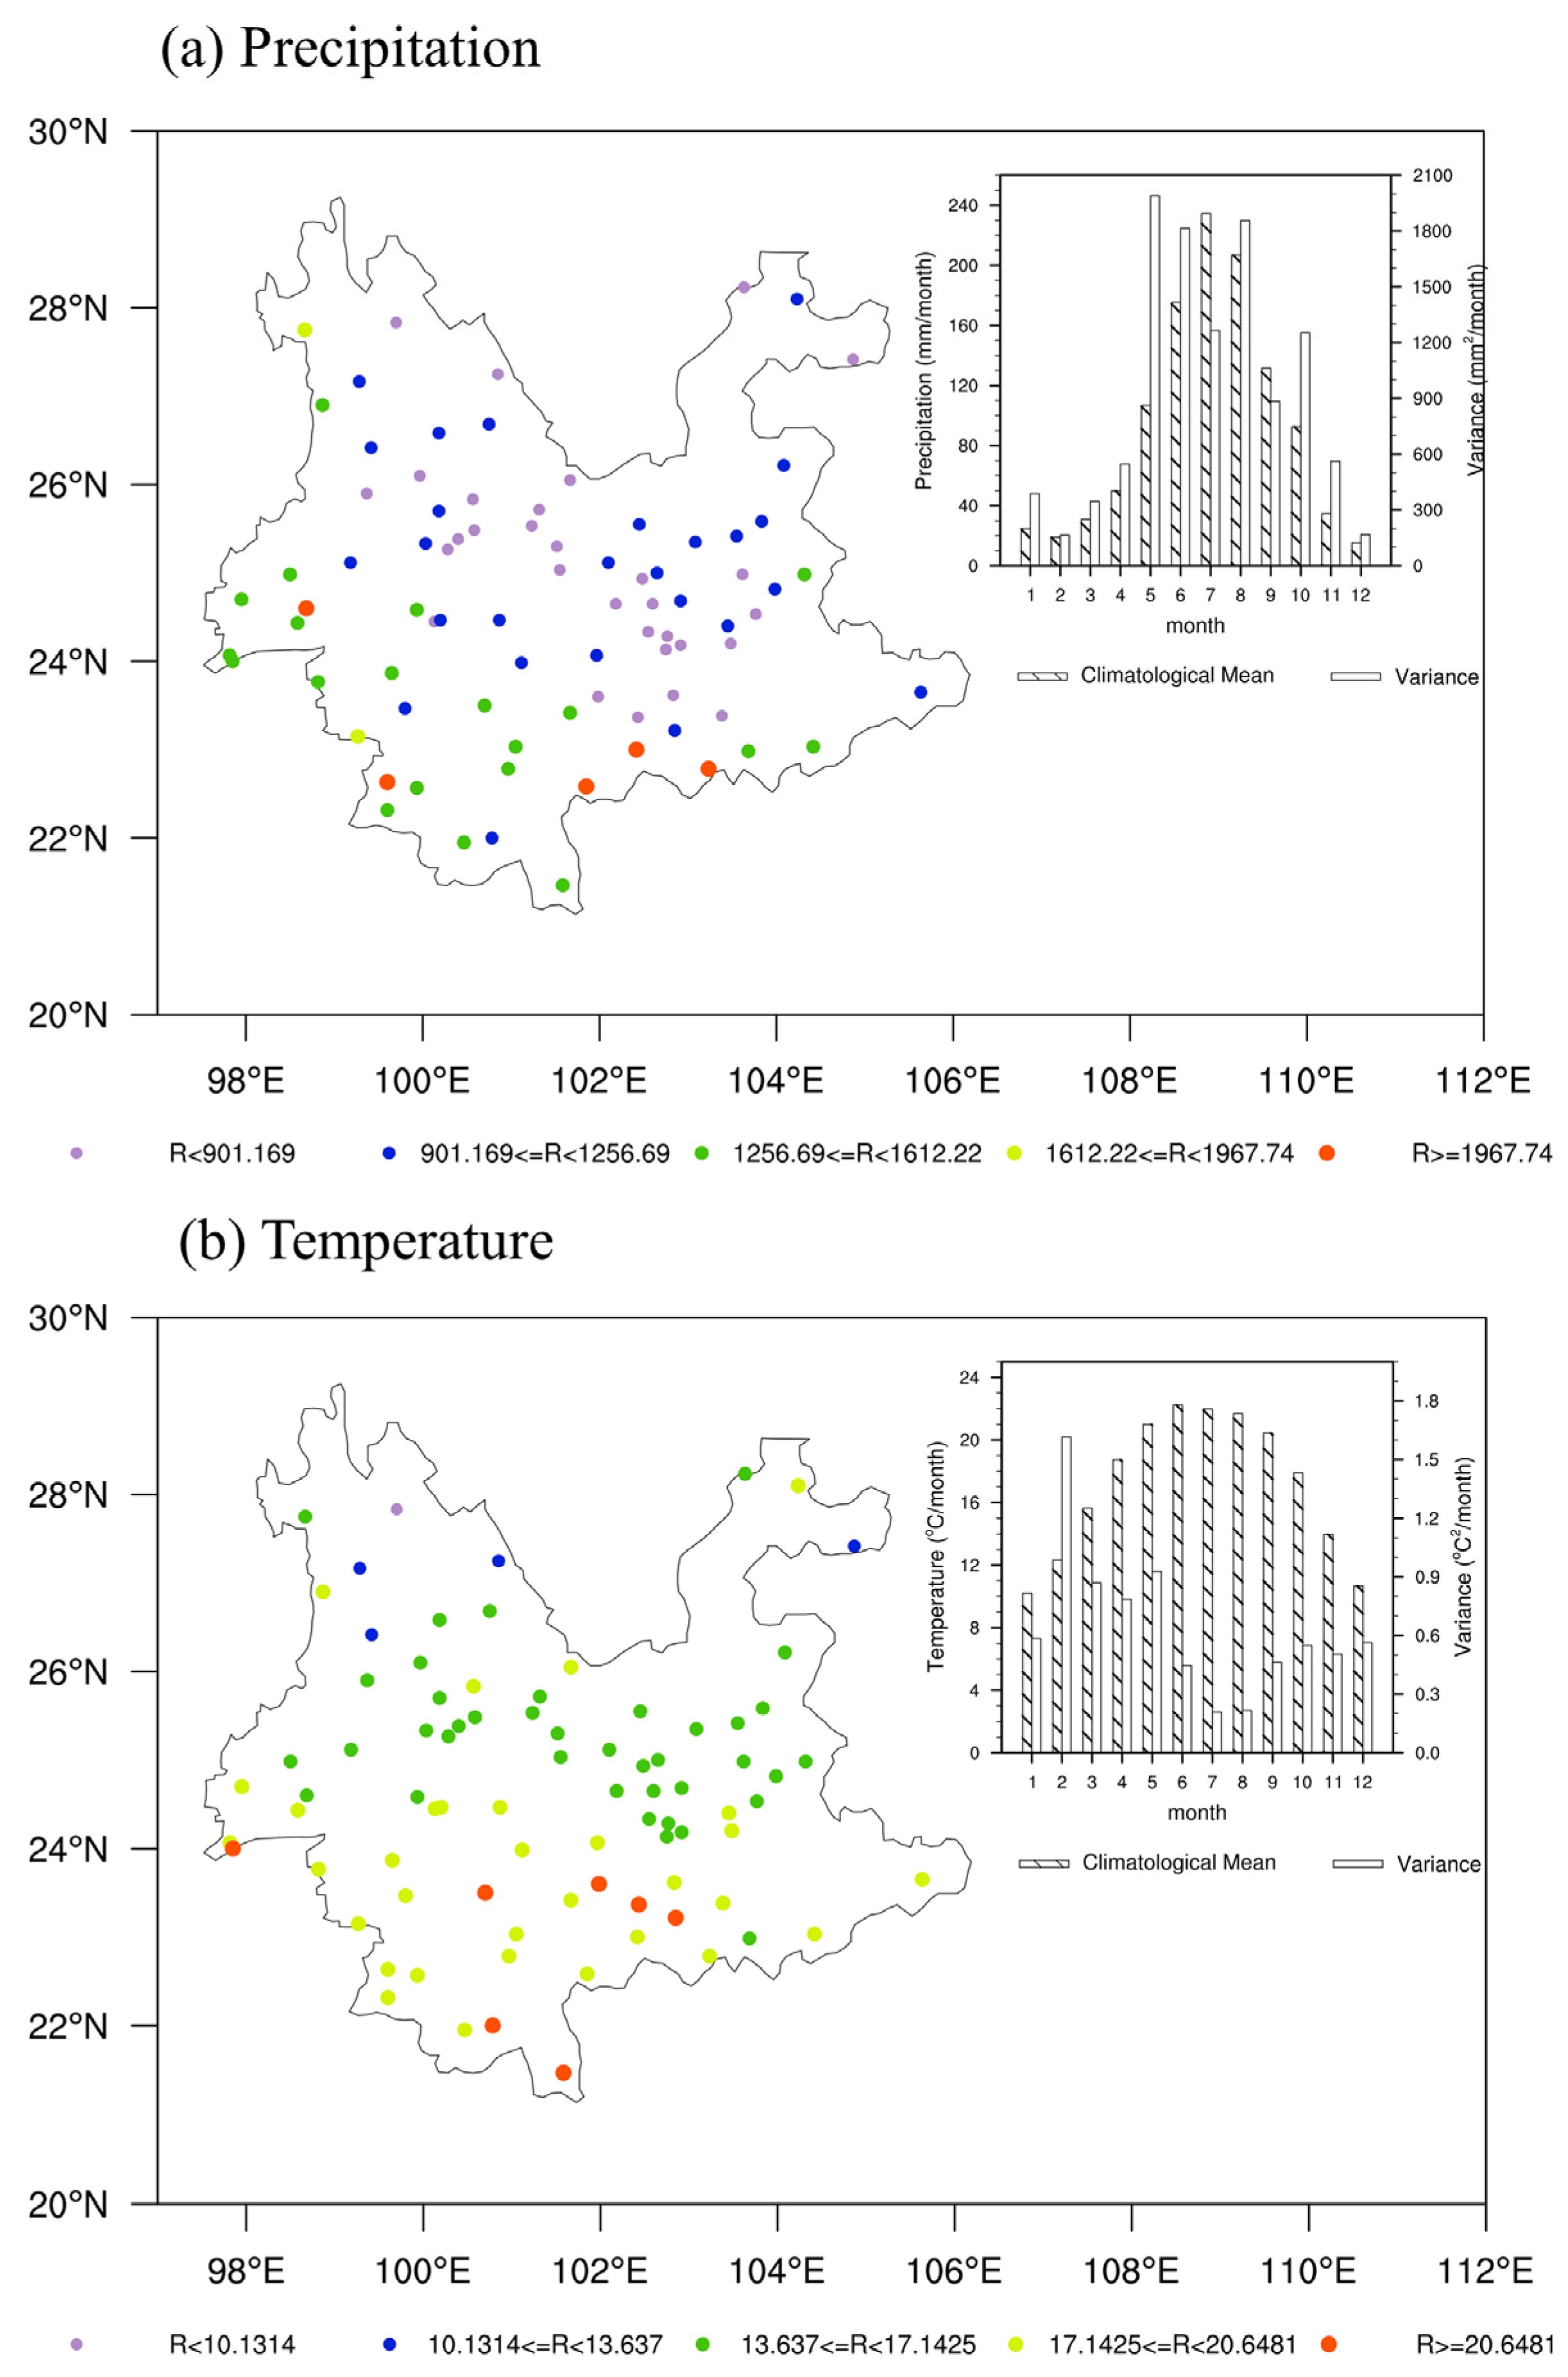
Yunnan Province (21° N–30° N, 97° E–107° E) is located on the Yunnan–Guizhou Plateau to the southeast of the Tibetan Plateau in Southwest China (Figure 1) in the junction of East Asian monsoon and South Asian monsoon. The climate in Yunnan is greatly influenced by its geographic location and diverse landform and topographical features. Thus, it is significantly different from other regions at the same latitudes. As its altitude descends in a stepwise pattern from northwest to southeast, the temporal and spatial distributions of droughts in Yunnan are nonuniform [48]. The annual cumulative precipitation is between 550 and 2350 mm, and the precipitation shows a decreasing pattern from southwest to northeast (Figure 2a). The bar chart in Figure 2a shows that the heaviest rainfall amounts are concentrated in summer (from June to August), and the dry period with less than 30 mm/month of precipitation is from November to April. In spring, as the area experiences a transition between the dry and wet seasons, the climatological precipitation is approximately 60 mm/month with the greatest variance in May, indicating that the precipitation variability in May dominates the spring rainfall. The average annual temperature is 6–25 °C, with little interannual variation (bar chart in Figure 2b). Due to the influence of its topography, the annual mean temperature is lower in northwestern Yunnan, followed by central and eastern Yunnan, and the highest is in western and southwestern Yunnan (Figure 2b).
2.2. Observation and Reanalysis Datasets and Statistical Methods
The monthly cumulative precipitation and the mean temperature at 83 in situ stations in Yunnan (shown in Figure 2a,b) are obtained from the National Meteorological Information Center of the China Meteorological Administration (CMA). The daily mean atmospheric field datasets, gridded to a 2.5° × 2.5° horizontal resolution on standard pressure surfaces, are from the National Centers for Environmental Prediction Reanalysis I (NCEP I) [49]. The monthly mean sea surface temperature (SST) with a horizontal resolution of 1.0° × 1.0° is derived from the Hadley Centre Sea Ice and Sea Surface Temperature (HadISST) dataset [50]. The study period is from January 1961 to December 2020, and anomalies of all variables are derived by subtracting the climatological mean of 30 years (1991–2020).
To separate the interdecadal and interannual components, the variations in all examined variables on the interdecadal timescale are calculated using a 13-year moving average from the original datasets. Then, the interannual variations are extracted by subtracting the interdecadal variations from the original datasets. Linear regression analysis is employed to determine the relative contributions of temperature and precipitation anomalies to the SDY. A composite analysis is also applied to clarify the common atmospheric circulation associated with the SDY, and statistical significance is assessed using Student’s t-test.
2.3. Meteorological Drought Index
According to the analysis of the regional adaptability of the drought indices, the SPEI has a better applicability in the humid zone of China, especially in Southwest China [17,51,52]. The SPEI is constructed from the SPI index by introducing a PET term. Generally, the PET can be calculated based on the Thornthwaite method and the Penman–Monteith method [53,54,55,56]. Following the Thornthwaite method [57], the PET can be calculated in terms of temperature, while the Penman–Monteith method considers not only the temperature but also the wind speed, water vapor pressure, net radiation, and soil heat flux [58]. According to [59], the SPEI index based on these two algorithms has good applicability in drought assessment over the Yunnan region. In this study, we focus on the contribution of precipitation and temperature to the SDY, especially the influence of the increasing temperature with the background of global warming. Therefore, the PET here is calculated based on the Thornthwaite method. The specific calculation procedure is described by Vincente Serrano [52]. The SPEI has multitemporal scale characteristics and considers the influence of temperature change on dry/wet variations. In this study, SPEI values of 3, 6, and 12 months, which represent drought variations on seasonal, semiannual, and annual timescales, respectively, are calculated from 1961 to 2020. According to the SPEI values, the drought grades are divided as shown in Table 1. In general, positive (negative) values indicate wet (dry) conditions.
2.4. Diagnosis of the P-E Equation
In this paper, a vertically integrated moisture budget equation [60], which is widely applied in diagnosing the physical processes of precipitation [61,62,63], is used to identify specific processes that cause moisture budget anomalies in spring drought years in Yunnan. The daily value of each term in the P-E equation is calculated based on the daily datasets from 1961 to 2020. Then, the seasonal average for each term of the P-E equation is calculated based on the average of daily values. Anomalies are derived by subtracting the climatological mean of 30 years (1991–2020).
where P is the precipitation, E is the surface evaporation, g is the acceleration of gravity, and PS and PT are the integration limits at the Earth’s surface and atmospheric top, respectively. Generally, the values of P-E can be used to represent dry/wet conditions, with positive (negative) values indicating wet (drought) conditions. The first term of the right side of Equation (1) is the moisture variation term with time, which can be approximated as zero under climatic conditions, the second term represents the moisture horizontal advection caused by horizontal motion, and the third term indicates the moisture vertical advection caused by low-level convergence and vertical motion. These three terms in the equation are vertically integrated from the PS layer (surface pressure) to 300 hPa. The residual term in Equation (1), which includes a nonlinear term and transient eddies, can be ignored [64].
3. Results
3.1. Variation Characteristics of Droughts in Yunnan
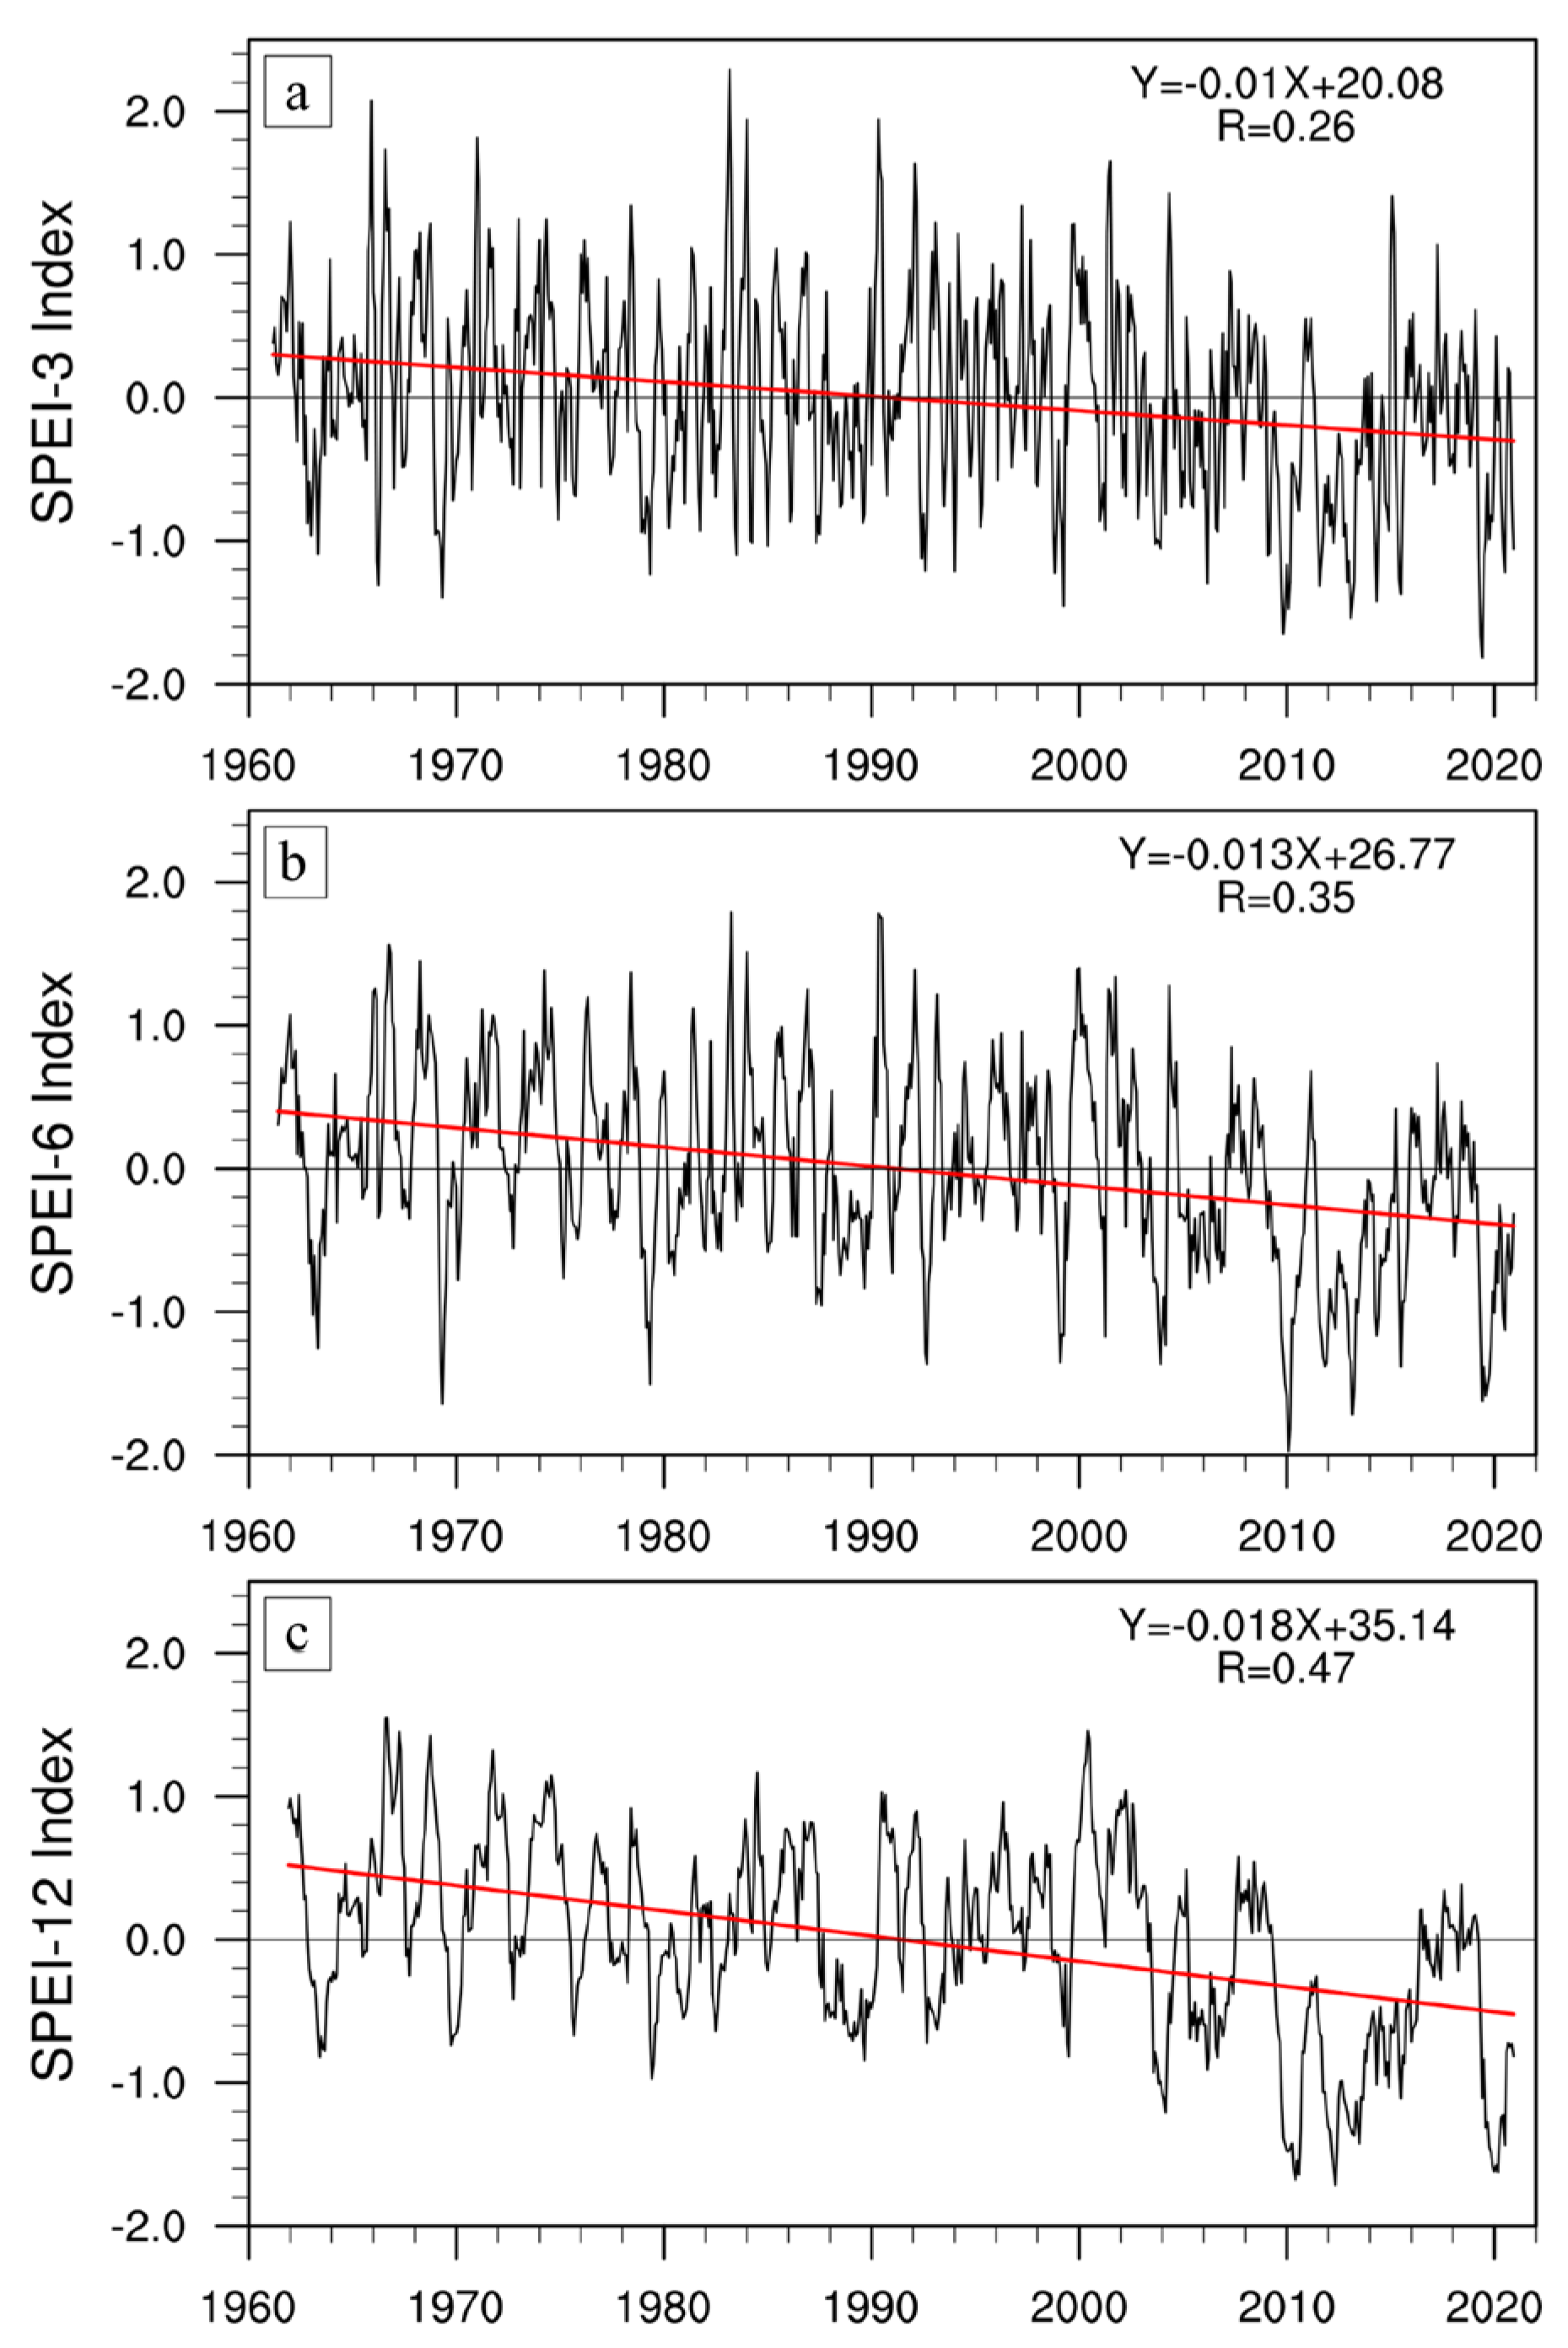
The SPEI can be used to describe the dry/wet conditions of Yunnan on multiple time scales. Based on the observed monthly precipitation and temperature datasets from 1961 to 2020, we analyzed the variation characteristics of SPEI values at 3-month (SPEI-3), 6-month (SPEI-6), and 12-month (SPEI-12) timescales (Figure 3a–c), which represent the drought variation characteristics at the seasonal scale, semiannual scale, and annual scale, respectively. As shown in Figure 3, the SPEI at multiple timescales exhibits significant decreasing trend variations. The SPEI-3 shows a significantly decreasing trend at a 99% confidence level (R = 0.26), and both the SPEI-6 and SPEI-12 present decreasing trends at a 99.9% confidence level with R = 0.35 and R = 0.47, respectively. Since the 21st century, the frequency and amplitude of negative SPEI values have notably increased, indicating that the frequency and intensity of droughts in this period are higher than those in the past. Meanwhile, the shorter the timescale, the higher the amplitude and frequency of alternation of the SPEI.
Since severe drought events frequently occur on the seasonal timescale, the variation characteristics of dry/wet conditions across the four seasons in Yunnan were further analyzed below. Figure 4 depicts the variations of the SPEI-3 values on interdecadal and interannual timescales for each season. There are significant decreasing trends in summer and autumn droughts at a 99% confidence level (R = 0.43, R = 0.40) (Figure 4b,c), while there are no significant decreasing trends in spring and winter droughts (Figure 4a,d), which is different from the results of Yang et al. [20]. This is probably because their conclusions were not tested for significance. Moreover, droughts in four seasons show notable interdecadal and interannual variations, with obvious phase differences. Around 2000, the SPEI of summer, autumn, and winter shift to a negative phase of interdecadal variation and turned from negative to positive recently (Figure 4b–d). The spring SPEI, on the other hand, turns into a negative phase around 2009 and lasts (Figure 4a). Compared with other seasons, the frequency and severity of droughts are highest in spring. For example, moderate to severe spring droughts occurred in 1963, 1969, 1979, 1987, 2014, and 2019, with corresponding SPEI-3 values of −1.09, −1.39, −1.23, −1.01, −1.42, and −1.66, respectively (Figure 4a). Among them, droughts also occurred in the previous winters of 1963, 1969, and 1979, whereas the previous winter of 2019 was wet, followed by a severe spring drought (Figure 4d).
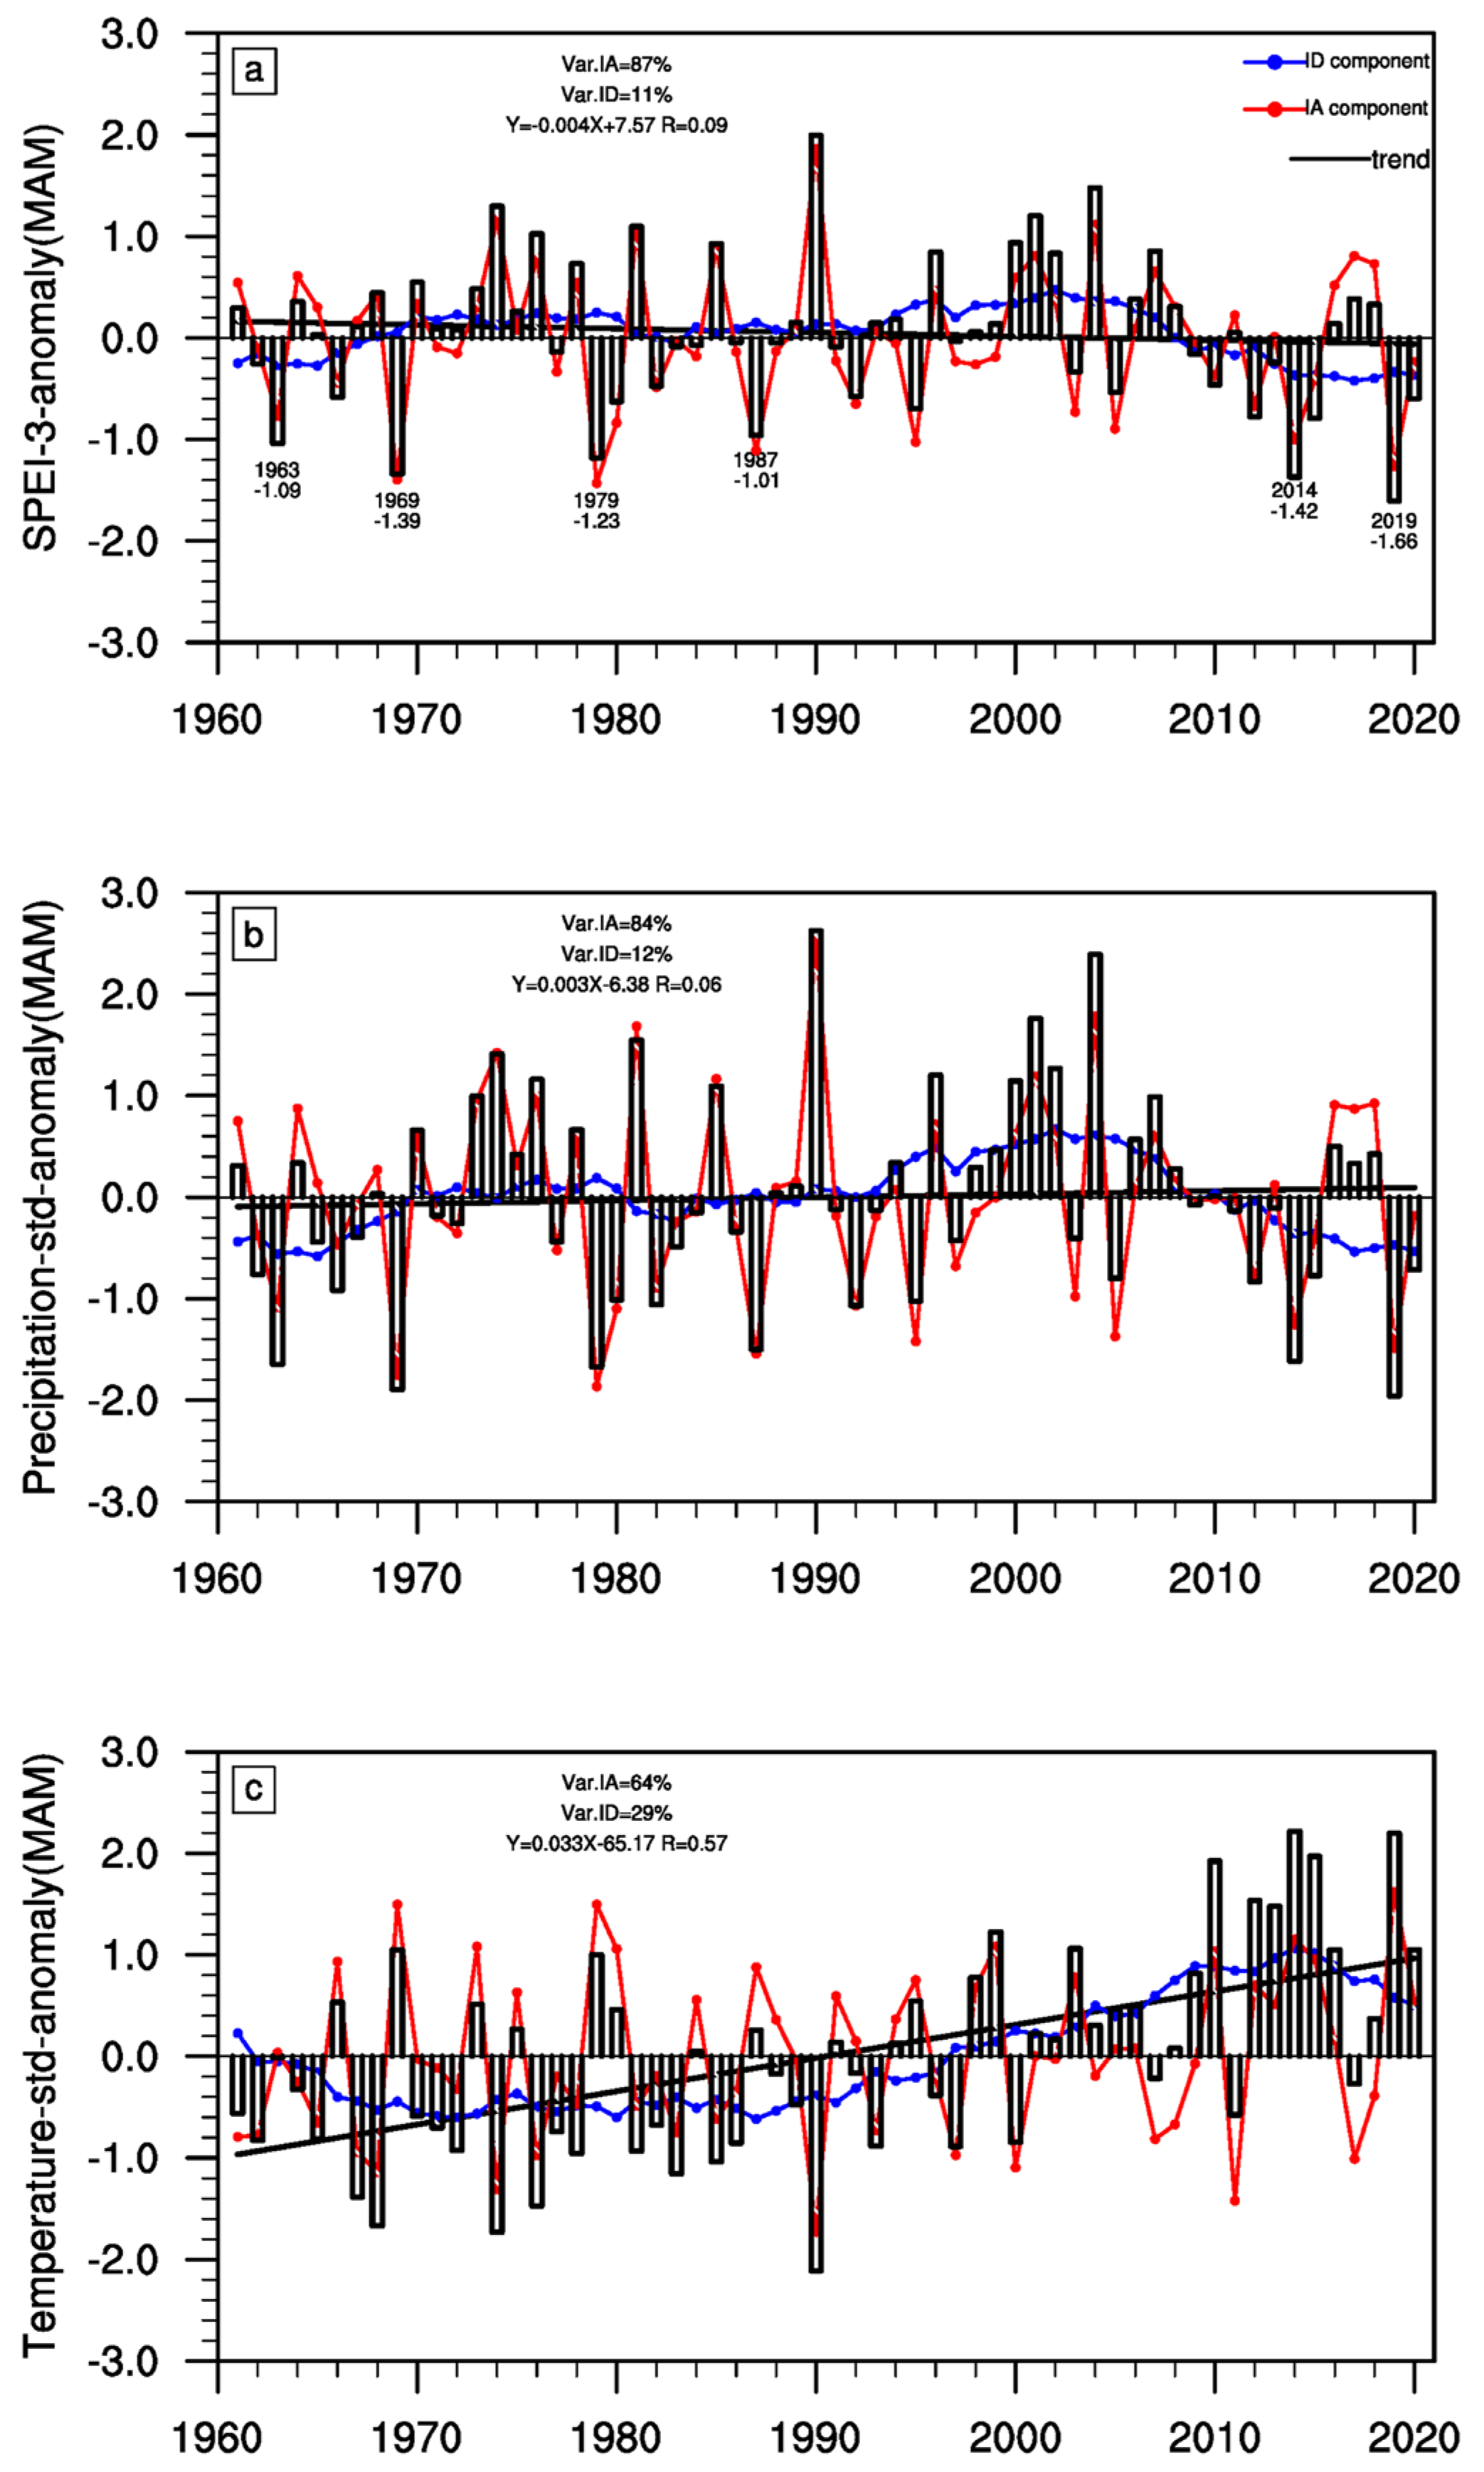
To better understand the causes of the SDY, we further analyzed the spring SPEI-3 values on interdecadal and interannual timescales with timescale separation. Figure 5a shows that the interdecadal variation (blue line) in spring dry/wet conditions accounts for 11% of the total variance. The notably wet spring periods indicated by positive spring SPEI-3 values are in the 1970s, the 1990s, and the first decade of the 21st century, while dry spring periods with negative spring SPEI-3 values occur in the 1960s and after 2008. The interannual variation (red line) in spring dry/wet conditions is more significant (accounting for 87% of the total variance), and spring drought events occur in both the wet and dry periods. Meanwhile, as the key drivers of meteorological drought formation, the variation characteristics of precipitation and temperature were also analyzed on interdecadal and interannual timescales. Figure 5b shows that spring precipitation exhibits a weak increasing trend (black line). Its interdecadal and interannual variations are similar to those of the spring SPEI-3, and it has a significant interannual variation accounting for 84% of the total variance. However, unlike the spring SPEI-3 and precipitation, the spring temperature shows a significant increasing trend at a 99% confidence level (Figure 5c). On the interdecadal timescale, the spring temperature enters a negative phase in the 1960s and transitions to a positive phase at the end of the 1990s. Although its interannual variation is not as significant as that of precipitation, it still accounts for 64% of the total variance.
Based on their trend variations, the spring droughts seem to be unrelated to the significantly increasing temperature trend, suggesting that the spring droughts are relatively unaffected by global warming. To measure the extent of precipitation and temperature effects on spring droughts in Yunnan, multiple linear regression analysis was conducted on interdecadal and interannual variables. The standardized regression coefficients calculated using this method can be used to determine the most influential variables [65]. Table 2 shows that the standardized regression coefficients of spring precipitation and SPEI-3 are 0.22 on the interdecadal timescale and 0.56 on the interannual timescale, while those of temperature and SPEI-3 are −0.09 and −0.17, respectively. The above analyses indicate that the impact of precipitation is more significant than that of temperature on spring dry/wet conditions over Yunnan, especially on the interannual timescale (significant at the 99% confidence level), illustrating that precipitation is the most effective variable affecting the development of spring droughts in Yunnan. As the spring droughts in Yunnan are significantly dominated by interannual variation, and the influence of precipitation on these droughts is mainly on the interannual timescale, the following analyses focus only on the interannual variations.
The spatial patterns of the precipitation and temperature contributions to SPEI-3 on the interannual timescale are displayed in Figure 6. The contributions of precipitation and temperature to the spring SPEI-3 can be represented by the standardized regression coefficients of the multiple linear regression [65,66]. As shown in Figure 6a, the precipitation standardized regression coefficients are greater than 0.8 at most stations, excluding a few stations in central Yunnan. In southern and western Yunnan, the temperature standardized regression coefficients are greater than −0.15, and those of other stations are between −0.15 and −0.25 (Figure 6b). It should be noted that the standardized regression coefficient of temperature at the Fu-gong station, which is located in northwestern Yunnan, is higher than that of precipitation. This may be related to the local climate characteristic of abundant spring precipitation in this region, which leads to the low sensitivity of SPEI-3 to precipitation [66]. Furthermore, the topographic characteristics of Yunnan play an important role in the magnitude of the contribution of precipitation. The contribution values of precipitation in the southern region (low altitude) are generally higher than those in the northern region (high altitude), while the contribution of temperature is smaller in low-altitude regions, such as western and southern Yunnan. The uneven distributions of the standardized regression coefficients further indicate the diversity and complexity of the causes of the SDY.
The above analyses show that SDY has significant interannual variation characteristics, with high frequency and intensity, that are more dependent on spring rainfall. Therefore, we focused on the physical processes that contribute to the interannual precipitation anomalies in terms of the water vapor budget equation and analyzed the characteristics of atmospheric circulations of the above spring drought years (1963, 1969, 1979, 1987, 2014, 2019).
3.2. Analysis of the Physical Mechanism of Spring Precipitation Anomaly
Adequate moisture and ascending motion are essential requirements for rainfall formation [67]. A vertically integrated moisture budget was diagnosed to identify the specific physical processes that cause the interannual precipitation anomalies in the spring drought years in Yunnan. As shown in Figure 7a, the horizontal moisture advection term shows a negative value over most areas of Yunnan, which indicates that the water vapor entering Yunnan from the horizontal direction is notably less than normal. In Figure 7b, the significant negative vertical moisture advection illustrates that the suppressed ascending motion, which is unfavorable for precipitation, is mainly located in Yunnan, the BOB, and the South China Sea (SCS) and its surrounding areas. In addition, a positive q tendency exceeding the 95% confidence level covers the region from the east coast of the Arabian Sea to the Yunnan area, with the center located in the northern BOB (Figure 7c). The order of magnitude of the q tendency is much smaller than those of the horizontal and vertical moisture advection; thus, its contribution can be ignored. As the terms of both the horizontal and vertical moisture advection contribute negatively to the spring precipitation in Yunnan, their contributions are quantified by calculating the regional average values. As shown in Figure 7d, the regional average values of the horizontal and vertical moisture advection in Yunnan are −0.24 kg/(m2 × day) and −0.93 kg/(m2 × day), respectively, which indicates that the suppressed vertical moisture advection is mainly responsible for the spring precipitation shortage in Yunnan.
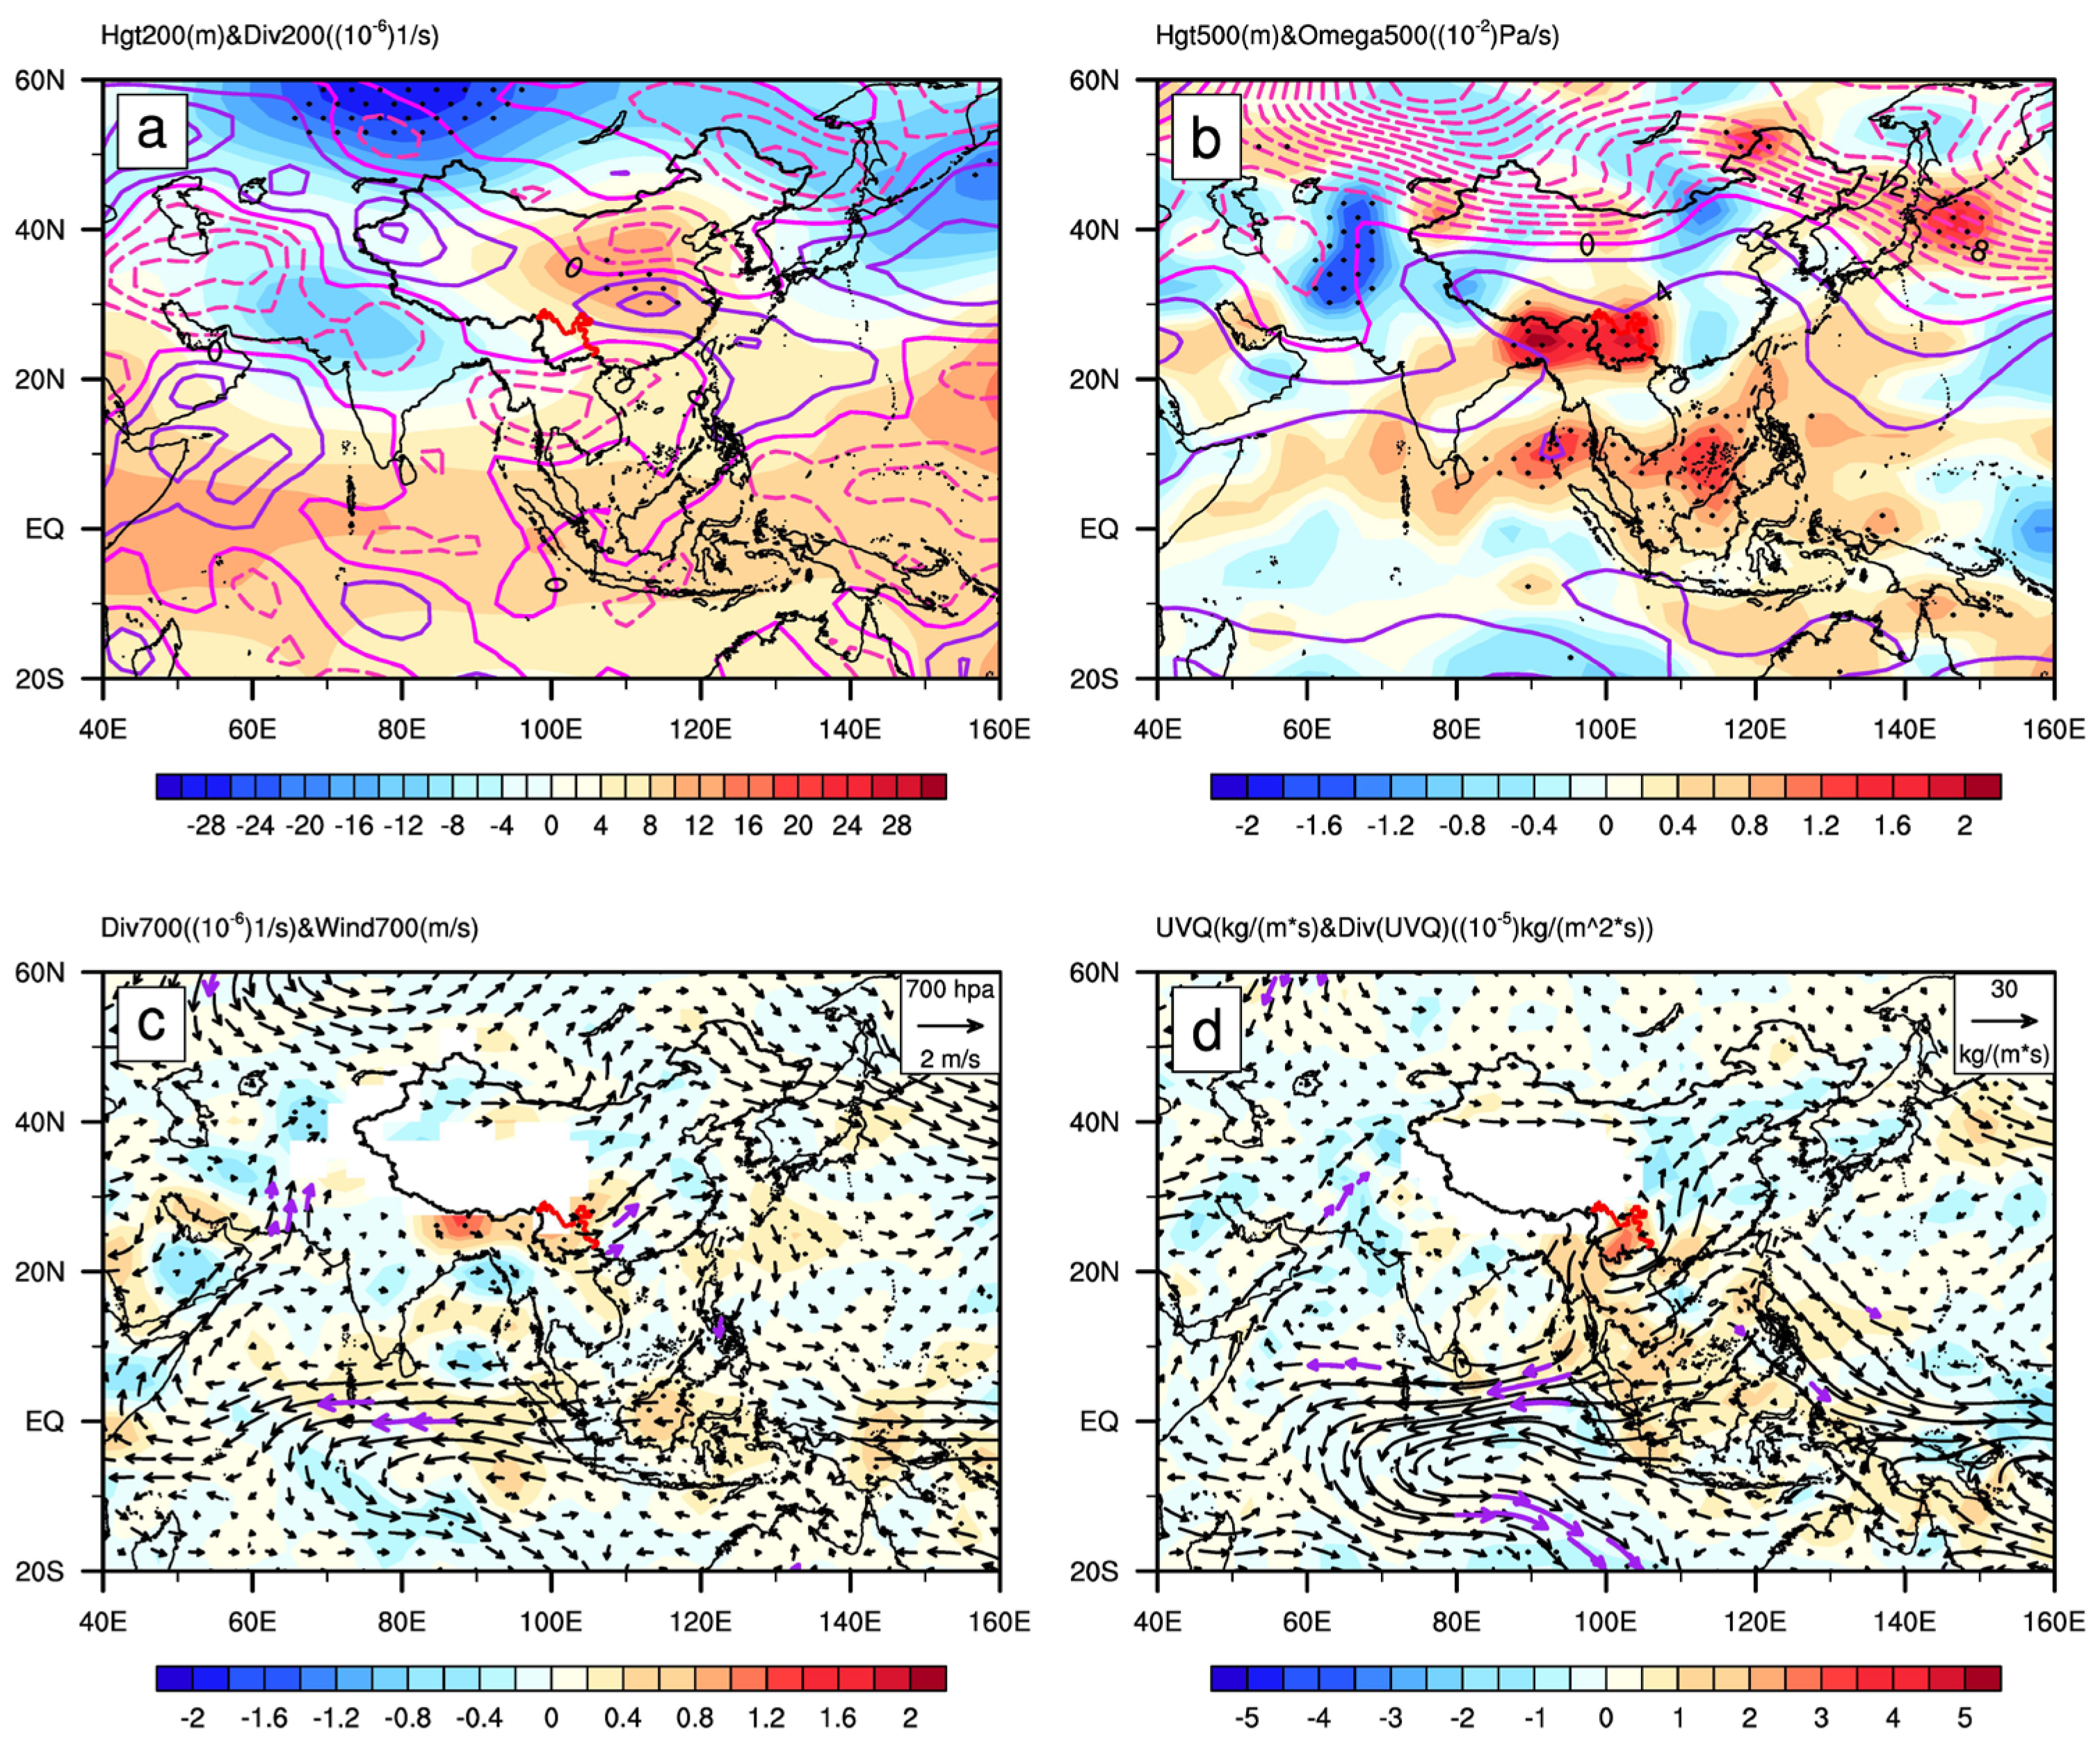
The above diagnostic analysis of the moisture budget equation indicates that the suppressed vertical moisture advection plays the most important role in the precipitation deficit; in addition, the reduced horizontal water vapor transport is also a crucial physical process causing the shortage of rainfall. The characteristics of interannual atmospheric circulation anomalies associated with the abnormal moisture budget are further revealed through the composite analysis of the 6 spring drought years above. As shown in Figure 8, at 200 hPa (Figure 8a), negative geopotential height anomalies cover the middle-high latitudes of East Asia, while positive geopotential height anomalies dominate most of China, including the Yunnan area. In addition, a negative center is located in South Asia, which indicates that the South Asia High (SAH) is weaker than normal. Previous studies have documented that the SAH is highly correlated with moisture transport from the BOB to the subtropical continent [68] and rainfall in Yunnan [69,70]. At 500 hPa, the Yunnan area is controlled by positive geopotential height anomalies and a significant descending motion (Figure 8b), which suppress the local ascending motion of convergence, favoring precipitation. Moreover, in the lower troposphere at 700 hPa, westerly and northwesterly winds prevail over Yunnan with a significant divergence (Figure 8c). The vertical pattern of atmospheric circulations in the troposphere, with a divergence in the lower troposphere and descending motion in the middle and upper troposphere, is unfavorable for the formation of rainfall. From the perspective of the horizontal water vapor transport anomalies (Figure 8d), Yunnan is a water vapor divergence area controlled by abnormal cyclonic circulation. In the eastern BOB, the anomalous northeasterly wind replaces the original southwesterly wind, and no southwesterly wind carries sufficient water vapor to enter Yunnan from the BOB. It has been noted that the water vapor in Yunnan mainly comes from the BOB [43]. Generally, the BOB summer monsoon breaks around late April to early May, with stronger southwesterly winds carrying abundant water vapor [71]. Figure 8d depicts a similar water vapor transport characteristic to that of the weak BOB monsoon. Therefore, the local descending motion and less water vapor transport are the direct impact factors contributing to the spring rainfall deficit.
4. Discussion
In contrast to the humid regions of China at the same latitude, Yunnan presents a unique subtropical plateau monsoon climate and is vulnerable to droughts. The region on which we focused in this study exhibits distinct wet and dry seasons, with the greatest precipitation in summer. Under the continuous and rapid global warming over the past 60 years, analyses of the SPEI drought index on multiple timescales illustrate that droughts in Yunnan are worsening, which is consistent with the findings of previous studies [18,24,25,72]. The response of droughts to global warming is remarkably complex, mainly because almost all factors affecting drought formation and development will respond to climate warming and even have chain reactions. For instance, precipitation, as the most crucial factor in drought formation, does not show a clear trend with temperature changes but has disparate responses to global warming across different places and periods [73]. Here, the SPEI-3 analysis reveals that the variation in droughts in Yunnan is distinct in different seasons. Droughts in summer and autumn show significant increasing trends, while droughts in spring have the highest frequency but show no obvious trend variation and depend more on precipitation anomalies on the interdecadal and interannual timescales.
Complex variations in droughts in Yunnan can be seen. In spring, drought events are most likely to occur, mainly due to the reduced rainfall. Previous studies have discussed the typical atmospheric circulations associated with spring rainfall deficit in Yunnan, including a stronger Western Pacific Subtropical High (WPSH) with a western and southern location [10], an anomalous anticyclonic in the BOB [37], a later onset of and a weaker Asia summer monsoon [74], and anomalous atmospheric circulations in mid-high latitudes, such as the North Atlantic Oscillation (NAO) [11,12] and Arctic Oscillation (AO) [42]. In this study, we further diagnosed the physical process that directly contributes to the below-normal spring precipitation on the interannual timescale. The results show that under the influence of the local high pressure and anomalous northeasterly wind in the BOB, the Yunnan area is dominated by a strong descending motion and water vapor divergence, which result in notable reductions in terms of vertical and horizontal moisture advection in the P-E equation, leading to the spring rainfall deficit. Generally, after the onset of the BOB summer monsoon, a southwesterly wind prevailing over the BOB enters the Yunnan area in May. The strong southwesterly wind not only brings abundant water vapor to Yunnan but also enhances the local convergence, which is conducive to precipitation [75,76,77,78]. Moreover, according to the definitions in Xing et al. [77], the onset pentad and intensity of the BOB summer monsoon in the above spring drought years was calculated. The results show that the spring drought years correspond to the later and weaker BOB summer monsoon, except for the strong monsoon in 1969 and the earlier monsoon in 1979. Therefore, the anomalous atmospheric circulation associated with the SDY is closely linked with a weaker BOB summer monsoon.
Previous studies have stated that the El Niño-Southern Oscillation (ENSO), as an external forcing factor with the most significant interannual variability, is associated with the onset of the BOB monsoon [79]. However, a consensus on this has not yet been reached. Some studies have revealed that these anomalous atmospheric circulations are linked to El Niño events [42,43], while other studies have disputed this [12,44] or argued that they are forced by La Niña events [45]. By analyzing the evolution characteristics of sea surface temperature anomalies (SSTAs) from the previous winter to the spring in the above spring drought years, we find that the SSTAs exhibit disparate patterns in the tropical eastern Pacific in the previous winter, but all show El Niño-like patterns in spring. Figure 9 shows the global SSTAs in the previous winter and spring regressed onto the spring precipitation anomalies in Yunnan. The correlation between spring precipitation anomalies in Yunnan and the spring SSTAs in the tropical central-eastern Pacific is more significant than that of the previous winter. This is consistent with the results of Liu et al. [80], who found that the correlation coefficients between the onset of the BOB monsoon and ENSO are highest in April. El Niño will delay the onset of the BOB monsoon by modulating the associated circulations in South Asia [80], resulting in less precipitation in the spring in Yunnan.
Although temperature shows little influence on the SDY, the extremely high temperature caused by global warming would undoubtedly aggravate the development of droughts by enhancing PET [81,82]. The IPCC-AR6 report noted that as global warming increases, more drought and heatwave events are expected to occur globally [1]. In fact, the concurrence of drought and extreme heat events has increased significantly, such as the Millennium Australia drought event during 1997–2010 [83], the 2011 drought in Texas [84], the California drought in 2013–2014 [85], and the 2016–2017 drought in the Horn of Africa [65]. In addition, Ma et al. [43] showed that persistent extreme spring heat played a critical role in the severe 2019 drought in Yunnan. Therefore, it is important to note that the deteriorative effects of extremely high temperatures on drought will intensify and compound drought events accompanied by below-normal precipitation, and extremely hot conditions will increase with the background of global warming. In addition, other meteorological factors, such as solar radiation and the soil water budget, as well as the unique landform, agriculture, hydrology, and environmental changes of anthropogenic, lead to more complex causes of drought in Yunnan [48]. Therefore, the droughts in Yunnan may experience a more complex evolution in each season, which requires further study.
5. Conclusions
In this study, we focus on the variations, leading impact factors, and physical mechanisms of SDY. By analyzing the variation characteristics of droughts in Yunnan with the SPEI on multiple time scales, investigating the relative contributions of precipitation and temperature to the SDY, diagnosing the physical mechanism of the rainfall deficit, and discussing typical atmospheric circulations and possible external forcing of the SDY, the conclusions are as follows:
- From 1961 to 2020, the frequency and intensity of droughts increase significantly on different time scales. The shorter the timescale is, the higher the frequency and amplitude of dryness/wetness alternation. The variation characteristics of droughts in the four seasons are significantly different. There are no obvious trend variations in spring and winter droughts, in contrast to the significantly increasing trends of summer and autumn droughts. Compared with other seasons, spring droughts are characterized by a more remarkable interannual variation with the most frequent occurrence of moderate and severe drought events.
- In terms of the long-term trend, SDY is not affected by increasing temperature in the context of global warming. Precipitation plays a more important role than the temperature in the interannual and interdecadal variations in SDY. Therefore, precipitation deficiency is the dominant factor for the occurrence of SDY.
- On the interannual timescale, both the negative vertical and horizontal moisture advection terms affected by the local descending motion and weak horizontal water vapor transport are the main physical processes that cause the precipitation deficit in the spring in Yunnan. As the two most direct impact factors, the locally anomalous high pressure and restricted water vapor transport are closely linked with the weak BOB summer monsoon, which is more likely affected by an El Niño-like SSTAs pattern in spring.
Author Contributions
Conceptualization, L.G., X.H. and X.C.; methodology, X.H. and B.L.; software, L.G.; validation, L.G.; formal analysis, L.G.; investigation, L.G. and X.H.; resources, X.H., X.C. and B.L.; data curation, L.G.; writing—original draft preparation, L.G.; writing—review and editing, X.H., X.C., B.L. and Y.L.; visualization, L.G.; supervision, X.H., X.C., B.L. and Y.L.; project administration, X.H. and X.C.; funding acquisition, X.C. and Y.L. All authors have read and agreed to the published version of the manuscript.
Funding
This research was funded by the National Natural Science Foundation of China (No. 42192561, No. 42176017) and the National Key Research and Development Plan of China (No. 2019YFA0606703).
Institutional Review Board Statement
Not applicable.
Informed Consent Statement
Not applicable.
Data Availability Statement
The monthly cumulative precipitation and the mean temperature at 83 in situ stations in Yunnan are obtained from the National Meteorological Information Center of the China Meteorological Administration (CMA) (https://data.cma.cn/) (accessed on 27 December 2022). The NCEP I data is downloaded from the National Centers for Environmental Prediction (NCEP) (https://psl.noaa.gov/data/gridded/data.ncep.reanalysis.html) (accessed on 27 December 2022). The SST data is derived from the Hadley Centre Sea Ice and Sea Surface Temperature (HadISST). (https://climatedataguide.ucar.edu/climate-data/sst-data-hadisst-v11) (accessed on 27 December 2022).
Acknowledgments
The authors appreciate the constructive comments and insightful suggestions from the three reviewers and editors of this paper.
Conflicts of Interest
The authors declare no conflict of interest.
References
- Masson-Delmotte, V.; Zhai, P.; Pirani, A.; Connors, S.L.; Péan, C.; Berger, S.; Caud, N.; Chen, Y.; Goldfarb, L.; Gomis, M.I.; et al. Technical Summary. In Climate Change 2021: The Physical Science Basis. Contribution of Working Group I to the Sixth Assessment Report of the Intergovernmental Panel on Climate Change; Cambridge University Press: Cambridge, UK; New York, NY, USA, 2021; pp. 33–144. [Google Scholar]
- Trenberth, K.E.; Fasullo, J.T.; Shepherd, T.G. Attribution of climate extreme events. Nat. Clim. Change 2015, 5, 725–730. [Google Scholar] [CrossRef]
- Diffenbaugh, N.S.; Singh, D.; Mankin, J.S.; Horton, D.E.; Swain, D.L.; Touma, D.; Charland, A.; Liu, Y.; Haugen, M.; Tsiang, M.; et al. Quantifying the influence of global warming on unprecedented extreme climate events. Proc. Natl. Acad. Sci. USA 2017, 114, 4881–4886. [Google Scholar] [CrossRef]
- Coumou, D.; Rahmstorf, S. A decade of weather extremes. Nat. Clim. Chang. 2012, 2, 491–496. [Google Scholar] [CrossRef]
- Mishra, A.K.; Singh, V.P. A review of drought concepts. J. Hydrol. 2010, 391, 202–216. [Google Scholar] [CrossRef]
- Seneviratne, S.; Abid, M.; Badi, W.; Dereczynski, C.; Di Luca, A.; Ghosh, S.; Iskandar, I.; Kossin, J.; Lewis, S.; Otto, F.; et al. Chapter 11: Weather and Climate. In Climate Change 2021: The Physical Science Basis. Contribution of Working Group I to the Sixth Assessment Report of the Intergovernmental Panel on Climate Change; Cambridge University Press: Cambridge, UK; New York, NY, USA, 2021. [Google Scholar]
- Wilhite, D.A. Drought as a natural hazard—Concepts and definitions, In Drought: A Global Assessment; Routledge: London, UK, 2000; pp. 3–18. [Google Scholar]
- Xu, K.; Yang, D.; Yang, H.; Li, Z.; Qin, Y.; Shen, Y. Spatio-temporal variation of drought in China during 1961–2012: A climatic perspective. J. Hydrol. 2015, 526, 253–264. [Google Scholar] [CrossRef]
- Liu, Y.; Zhao, E.; Peng, G.; Yang, S. Anomalous drought and mid- and high-latitude circulation in Yunnan in late spring and early summer 2005. J. Arid Meteorol. 2007, 25, 32. [Google Scholar]
- Yu, L.I.U.; Erxu, Z.; Wei, H.; Dan, S.U.N.; Jianhua, J.U. Diagnostic Analysis of the Severe Drought over Yunnan Area in the Early Summer of 2005. J. Trop. Meteorol. 2007, 23, 35–40. [Google Scholar]
- Song, J.; Yang, H.; Li, C. A Further Study of Causes of the Severe Drought in Yunnan Province during the 2009/2010 Winter. Chin. J. Atmos. Sci. 2011, 35, 1009–1019. [Google Scholar]
- Yang, H.; Song, J.; Yan, H.; Li, C. Cause of the Severe Drought in Yunnan Province during Winter of 2009 to 2010. Clim. Environ. Res. 2012, 17, 315–326. [Google Scholar]
- Ding, T.; Gao, H. The Record-Breaking Extreme Drought in Yunnan Province, Southwest China during Spring-Early Summer of 2019 and Possible Causes. J. Meteorol. Res. 2020, 34, 997–1012. [Google Scholar] [CrossRef]
- Society, A.M. Meteorological drought-policy statement. Bull. Am. Meteorol. Soc. 1997, 78, 847–849. [Google Scholar]
- World Meteorological Organization; Working Group on the Assessment of Drought. Drought and Agriculture: Report of the CAgM Working Group on the Assessment of Drought; World Meteorological Organization: Geneva, Switzerland, 1975. [Google Scholar]
- Zhao, L.; Feng, B.; Zhang, S. Research progress of drought and drought indicators at home and abroad. Jiangsu Agric. Sci. 2012, 40, 345–348. [Google Scholar]
- Yang, Q.; Li, M.; Zheng, Z.; Ma, Z. Regional adaptation of seven meteorological drought indices in China. Sci. Sin. 2017, 47, 337–353. [Google Scholar]
- Cheng, Q.; Wang, P. Drought and Flood Change Characteristics Based on RDI Index from 1960 to 2013 in Yunnan Province. Resour. Environ. Yangtze Basin 2018, 27, 185–196. [Google Scholar]
- Liu, X.; Leng, X.; Sun, G.; Peng, Y.; Huang, Y.; Yang, Q. Assessment of Drought Characteristics in Yunnan Province Based on SPI and SPEI from 1961 to 2100. Trans. Chin. Soc. Agric. Mach. 2018, 49, 236. [Google Scholar]
- Yang, C.; Tuo, Y.; Ma, J.; Zhang, D. Spatial and Temporal Evolution Characteristics of Drought in Yunnan Province from 1969 to 2018 Based on SPI/SPEI. Water Air Soil Pollut. 2019, 230, 269. [Google Scholar] [CrossRef]
- Li, Y.; Li, Y. Advances in Adaptability of Meteorological Drought Indices in China. J. Arid Meteorol. 2017, 35, 709–723. [Google Scholar]
- Huang, Z.; Zhong, C.; Zhang, M.; Xie, G. Applicability Analysis for Several Drought Indices to Agricultural Drought Evaluation during the Severe Drought Year in Yunnan. Chin. J. Agrometeorol. 2013, 34, 221–228. [Google Scholar]
- Huang, J.; Li, X.; Wang, L. Analysis on Spatial and Temporal Variations of Drought in Southwest of China in Recent 42 Years based on SPEI Index. J. Chengdu Univ. Inf. Technol. 2020, 35, 359–366. [Google Scholar]
- Zhang, W.; Zheng, J.; Ren, J. Climate Characteristics of Extreme Drought Events in Yunnan. J. Catastrophology 2013, 28, 59–64. [Google Scholar]
- Yu, H.; Wang, L.; Wen, J.; Yang, R. Study on spatial and temporal distribution of drought disaster in 500 years in Yunnan province. J. Arid Land Resour. Environ. 2014, 28, 38–44. [Google Scholar]
- Zhou, D.; Yan, H.; Zhou, J. Analysis of the spatial and temporal variability of meteorological droughts in Yunnan since the 1970s. J. Guizhou Meteorol. 2014, 38, 34–37. [Google Scholar]
- Yu, L. Analysis of seasonal drought characteristics in Yunnan. Agric. Technol. 2018, 38, 149–150. [Google Scholar]
- Yao, Y.; Zhang, Q.; Wang, J.; Shang, J.; Wang, Y.; Shi, J.; Han, L. Temporal-spatial abnormity of drought for climate warming in Southwest China. Resour. Sci. 2015, 37, 1774–1784. [Google Scholar]
- Wang, Y. Introduction to Climate Change in Yunnan; China Meteorological Press: Beijing, China, 1996. [Google Scholar]
- Duan, X.; You, W.; Zheng, J. Drought and flood characteristics in Yunnan. Plateau Meteorol. 2000, 19, 84–90. [Google Scholar]
- Lu, J.; Yan, J.; Li, Y. The temporal variation characteristics of drought in Yunnan-Guizhou area during 1960 to 2014 based on SPEI and runlength theory. J. Zhejiang Univ. Sci. Ed. 2018, 45, 363–372. [Google Scholar]
- Xie, Y.; Huang, H.; Zhao, H. A preliminary study of drought hazards in Yunnan Province. Available online: http://caod.oriprobe.com/articles/35137964/yun_nan_gan_han_zai_hai_chu_bu_yan_jiu_htm (accessed on 27 December 2022).
- Jiangang, C.; Mingen, X.I.E. The Analysis of Regional Climate Change Features over Yunnan in Recent 50 Years. Prog. Geogr. 2008, 27, 19–26. [Google Scholar]
- Zheng, J.; Ren, J.; Zhang, W. Analysis on Variation Characteristics of Temperature and Rainfall in Yunnan in the Last 100 Years. J. Catastrophol. 2010, 25, 24–31. [Google Scholar]
- Zhang, L.; Wang, J.; Huang, Y.; Wu, H.; Duan, C. SPEI-based drought change characteristics analysis in Yunnan Province, 1961–2010. J. Meteorol. Environ. 2015, 31, 141–146. [Google Scholar]
- Xie, M.; Cheng, J.; Fan, B.; Gao, X. A diagnostic study of the rare summer heat and drought in Yunnan in 2003. Meteorol. Mon. 2005, 31, 32–37. [Google Scholar]
- Wang, S.; Huang, J.; Yuan, X. Attribution of 2019 Extreme Spring–Early Summer Hot Drought over Yunnan in Southwestern China. Bull. Am. Meteorol. Soc. 2021, 102, S91–S96. [Google Scholar] [CrossRef]
- Xiao, M.; Zhang, Q.; Singh, V.P. Influences of ENSO, NAO, IOD and PDO on seasonal precipitation regimes in the Yangtze River basin, China. Int. J. Climatol. 2015, 35, 3556–3567. [Google Scholar] [CrossRef]
- Li, T.-r.; Zhang, R.-h.; Wen, M. Impact of Enso on the Precipitation over China in Winter Half-Years. J. Trop. Meteorol. 2015, 21, 161–170. [Google Scholar]
- Tan, J.; Wang, Z.-g.; Huang, R.-h.; Chen, X.-r.; Cai, Y.; Huang, Y.-y. Analysis of tropical sea surface temperature and atmospheric circulation anomalies and their relationship with abnormal precipitation in Yunnan during rainy season. J. Trop. Oceanogr. 2015, 34, 15–23. [Google Scholar] [CrossRef]
- Liu, M.; Xu, X.; Sun, A. Decreasing spatial variability in precipitation extremes in southwestern China and the local/large-scale influencing factors. J. Geophys. Res. Atmos. 2015, 120, 6480–6488. [Google Scholar] [CrossRef]
- Huang, R.; Liu, Y.; Wang, L.; Wang, L. Analyses of the Causes of Severe Drought Occurring in Southwest China from the Fall of 2009 to the Spring of 2010. Chin. J. Atmos. Sci. 2012, 36, 443–457. [Google Scholar]
- Ma, S.; Zhu, C.; Liu, B. Possible Causes of Persistently Extreme-Hot-Days-Related Circulation Anomalies in Yunnan from April to June 2019. Chin. J. Atmos. Sci. 2021, 45, 165–180. [Google Scholar]
- Jiang, X.; Li, Y. The Spatio-temporal Variation of Winter Climate Anomalies in Southwestern China and the Possible Influencing Factors. Acta Geogr. Sin. 2010, 65, 1325–1335. [Google Scholar]
- Feng, L.; Li, T.; Yu, W.D. Cause of severe droughts in Southwest China during 1951–2010. Clim. Dyn. 2014, 43, 2033–2042. [Google Scholar] [CrossRef]
- Ren, H.-L.; Lu, B.; Wan, J.; Tian, B.; Zhang, P. Identification Standard for ENSO Events and Its Application to Climate Monitoring and Prediction in China. J. Meteorol. Res. 2018, 32, 923–936. [Google Scholar] [CrossRef]
- Liu, Y.; Zhao, E.; Sun, D.; Ju, J. Impacts of Anomaly of Summer Monsoon over the Southeast Asia on the Early Summer Drought of Yunnan in 2005. Meteorol. Mon. 2006, 6, 91–96. [Google Scholar]
- Wang, M. Research Progress of Drought in Yunnan Province of China. Heilongjiang Agric. Sci. 2017, 280, 122–124. [Google Scholar]
- Kalnay, E.; Kanamitsu, M.; Kistler, R.; Collins, W.; Deaven, D.; Gandin, L.; Iredell, M.; Saha, S.; White, G.; Woollen, J.; et al. The NCEP/NCAR 40-year reanalysis project. Bull. Am. Meteorol. Soc. 1996, 77, 437–471. [Google Scholar] [CrossRef]
- Rayner, N.A.; Parker, D.E.; Horton, E.B.; Folland, C.K.; Alexander, L.V.; Rowell, D.P.; Kent, E.C.; Kaplan, A. Global analyses of sea surface temperature, sea ice, and night marine air temperature since the late nineteenth century. J. Geophys. Res. Atmos. 2003, 108. [Google Scholar] [CrossRef]
- Wang, L.; Chen, W. Applicability Analysis of Standardized Precipitation Evapotranspiration Index in Drought Monitoring in China. Plateau Meteorol. 2014, 33, 423–431. [Google Scholar]
- Vicente-Serrano, S.M.; Beguería, S.; López-Moreno, J. A Multiscalar Drought Index Sensitive to Global Warming: The Standardized Precipitation Evapotranspiration Index. J. Clim. 2010, 23, 1696–1718. [Google Scholar] [CrossRef]
- Liu, K.; Jiang, D. Analysis of Dryness/Wetness over China Using Standardized Precipitation Evapotranspiration Index Based on Two Evapotranspiration Algorithms. Chin. J. Atmos. Sci. 2015, 39, 23–36. [Google Scholar]
- Smerdon, J.E.; Cook, B.I.; Cook, E.R.; Seager, R. Bridging Past and Future Climate across Paleoclimatic Reconstructions, Observations, and Models: A Hydroclimate Case Study. J. Clim. 2015, 28, 3212–3231. [Google Scholar] [CrossRef]
- Zhao, J.; Yan, D.-H.; Yang, Z.-Y.; Hu, Y.; Weng, B.-S.; Gong, B.-Y. Improvement and adaptability evaluation of standardized precipitation evapotranspiration index. Acta Phys. Sin. 2015, 64. [Google Scholar] [CrossRef]
- Dai, A. Drought under global warming: A review. WIREs Clim. Change 2011, 2, 45–65. [Google Scholar] [CrossRef]
- Thornthwaite, C.W. An Approach Toward a Rational Classification of Climate. Soil Sci. 1948, 66, 55–94. [Google Scholar] [CrossRef] [Green Version]
- Allan, R.; Pereira, L.; Smith, M. Crop Evapotranspiration—Guidelines for Computing Crop Water Requirements; FAO Irrigation and Drainage Paper 56; FAO: Rome, Italy, 1998; Volume 56. [Google Scholar]
- Li, B. Application of SPEI with two Different Potential Evapotranspiration Formulations. 2016. Available online: https://doc.mbalib.com/view/ee5f57d34f2eb63b929375daffd73c75.html (accessed on 23 January 2023).
- Huang, X.; Zhou, T.; Wu, B.; Chen, X. South Asian Summer Monsoon Simulated by Two Versions of FGOALS Climate System Model: Model Biases and Mechanims. Chin. J. Atmos. Sci. 2019, 43, 437–455. [Google Scholar]
- Chou, C.; Neelin, J.D.; Chen, C.A.; Tu, J.Y. Evaluating the “Rich-Get-Richer’’ Mechanism in Tropical Precipitation Change under Global Warming. J. Clim. 2009, 22, 1982–2005. [Google Scholar] [CrossRef]
- Seager, R.; Naik, N.; Vecchi, G.A. Thermodynamic and Dynamic Mechanisms for Large-Scale Changes in the Hydrological Cycle in Response to Global Warming. J. Clim. 2010, 23, 4651–4668. [Google Scholar] [CrossRef]
- Seager, R.; Henderson, N. Diagnostic Computation of Moisture Budgets in the ERA-Interim Reanalysis with Reference to Analysis of CMIP-Archived Atmospheric Model Data. J. Clim. 2013, 26, 7876–7901. [Google Scholar] [CrossRef]
- Zhou, S.; Huang, G.; Huang, P. Changes in the East Asian summer monsoon rainfall under global warming: Moisture budget decompositions and the sources of uncertainty. Clim. Dyn. 2018, 51, 1363–1373. [Google Scholar] [CrossRef]
- Han, X.; Li, Y.; Yu, W.; Feng, L. Attribution of the Extreme Drought in the Horn of Africa during Short-Rains of 2016 and Long-Rains of 2017. Water 2022, 14, 409. [Google Scholar] [CrossRef]
- Sun, S.; Chen, H.; Li, J.; Wei, J.; Wang, G.; Sun, G.; Hua, W.; Zhou, S.; Deng, P. Dependence of 3-month Standardized Precipitation-Evapotranspiration Index dryness/wetness sensitivity on climatological precipitation over southwest China. Int. J. Climatol. 2018, 38, 4568–4578. [Google Scholar] [CrossRef]
- Zhang, Q.; Xu, C.-Y.; Gemmer, M.; Chen, Y.; Liu, C. Changing properties of precipitation concentration in the Pearl River basin, China. Stoch. Environ. Res. Risk Assess. 2009, 23, 377–385. [Google Scholar] [CrossRef]
- Liu, B.; Wu, G.; Mao, J.; He, J. Genesis of the South Asian High and Its Impact on the Asian Summer Monsoon Onset. J. Clim. 2013, 26, 2976–2991. [Google Scholar] [CrossRef]
- Qian, Y.; Zhang, Q.; Zhang, X. The South Asian High and Its Effects on China’s Mid-summer Climate Abnormality. Acta Sci. Nat. Univ. Nankinensis 2002, 38, 295–307. [Google Scholar]
- Li, Y.; Qing, J.; Li, Q.; Luo, W. Inter-annual and Inter-decadal Variations of South Asian High in Summer and Its Influences on Flood/Drought Over Western Southwest China. J. Southwest Univ. Nat. Sci. Ed. 2012, 34, 71–81. [Google Scholar]
- Yu, W.; Li, K.; Jian-Wei, S.H.I.; Liu, L.; Hui-Wu, W.; Liu, Y. The Onset of the Monsoon over the Bay of Bengal: The Year-to-Year Variations. Atmos. Ocean. Sci. Lett. 2012, 5, 342–347. [Google Scholar] [CrossRef]
- Jin, Y.; Kuang, X.; Yan, H.; Wan, Y.; Wang, P. Studies on Distribution Characteristics and Variation Trend of the Regional Drought Events over Yunnan in Recent 55 Years. Meteorol. Mon. 2018, 44, 1169–1178. [Google Scholar]
- Zhang, Q.; Yao, Y.; Li, Y.; Huang, J.; Ma, Z.; Wang, Z.; Wang, S.; Wang, Y.; Zhang, Y. Progress and prospect on the study of causes and variation regularity of droughts in China. Acta Meteorol. Sin. 2020, 78, 500–521. [Google Scholar] [CrossRef]
- Zheng, J.; Zhang, W.; Ma, T.; Zhou, J. Composite Characteristics of the Abnormal Circulation in May between Extreme Drought Years and Rainy Years of Yunnan. Plateau Meteorol. 2014, 33, 916–924. [Google Scholar]
- He, J.; Ju, J.; Wen, Z.; Lue, J.; Jin, Q. A review of recent advances in research on Asian monsoon in China. Adv. Atmos. Sci. 2007, 24, 972–992. [Google Scholar] [CrossRef]
- Liu, Y.; Ding, Y. Teleconnection between the Indian summer monsoon onset and the Meiyu over the Yangtze River Valley. Sci. China Ser. D Earth Sci. 2008, 51, 1021–1035. [Google Scholar] [CrossRef]
- Xing, N.; Li, J.; Wang, L. Effect of the early and late onset of summer monsoon over the Bay of Bengal on Asian precipitation in May. Clim. Dyn. 2016, 47, 1961–1970. [Google Scholar] [CrossRef]
- Xing, N.; Li, J.; Jiang, X.; Wang, L. Local Oceanic Precursors for the Summer Monsoon Onset over the Bay of Bengal and the Underlying Processes. J. Clim. 2016, 29, 8455–8470. [Google Scholar] [CrossRef]
- Mao, J.; Wu, G. Interannual variability in the onset of the summer monsoon over the Eastern Bay of Bengal. Theor. Appl. Climatol. 2007, 89, 155–170. [Google Scholar] [CrossRef]
- Liu, B.; Wu, G.; Ren, R. Influences of ENSO on the vertical coupling of atmospheric circulation during the onset of South Asian summer monsoon. Clim. Dyn. 2015, 45, 1859–1875. [Google Scholar] [CrossRef]
- Fu, Q.; Feng, S. Responses of terrestrial aridity to global warming. J. Geophys. Res. Atmos. 2014, 119, 7863–7875. [Google Scholar] [CrossRef]
- Dai, A.; Zhao, T.; Chen, J. Climate Change and Drought: A Precipitation and Evaporation Perspective. Curr. Clim. Chang. Rep. 2018, 4, 301–312. [Google Scholar] [CrossRef]
- Kiem, A.S.; Johnson, F.; Westra, S.; van Dijk, A.; Evans, J.P.; O’Donnell, A.; Rouillard, A.; Barr, C.; Tyler, J.; Thyer, M.; et al. Natural hazards in Australia: Droughts. Clim. Chang. 2016, 139, 37–54. [Google Scholar] [CrossRef]
- Livneh, B.; Hoerling, M.P. The Physics of Drought in the US Central Great Plains. J. Clim. 2016, 29, 6783–6804. [Google Scholar] [CrossRef]
- Shukla, S.; Safeeq, M.; AghaKouchak, A.; Guan, K.; Funk, C. Temperature impacts on the water year 2014 drought in California. Geophys. Res. Lett. 2015, 42, 4384–4393. [Google Scholar] [CrossRef] [Green Version]
Figure 1.
Geographical location and topographic elevation (m) of Yunnan.

Figure 2.
The spatial distribution of the climatological annual cumulative precipitation (a) and annual average temperature (b) at 83 in situ stations in Yunnan and the annual cycle of climatology (1991–2020) and variance (1991–2020) of the area-averaged cumulative precipitation (bar chart of (a)) and average temperature (bar chart of (b)) in Yunnan.

Figure 3.
Temporal variation (black line) and trend analysis (red line) of the SPEI in Yunnan at (a) 3-month timescale, (b) 6-month timescale, and (c) 12-month timescale from 1961 to 2020.
Figure 3.
Temporal variation (black line) and trend analysis (red line) of the SPEI in Yunnan at (a) 3-month timescale, (b) 6-month timescale, and (c) 12-month timescale from 1961 to 2020.

Figure 4.
Temporal variation (black bar) and trend analysis (black line) of the SPEI-3 in each season: (a) spring, (b) summer, (c) autumn, and (d) winter from 1961 to 2020. (Blue dotted line: interdecadal component of SPEI-3; red dotted line: interannual component of SPEI-3).
Figure 4.
Temporal variation (black bar) and trend analysis (black line) of the SPEI-3 in each season: (a) spring, (b) summer, (c) autumn, and (d) winter from 1961 to 2020. (Blue dotted line: interdecadal component of SPEI-3; red dotted line: interannual component of SPEI-3).

Figure 5.
Temporal variation (black bar) and trend analysis (black line) of the (a) SPEI-3, (b) standardized cumulative precipitation, and (c) mean temperature anomalies in spring from 1961 to 2020. (Blue dotted line: interdecadal component of SPEI-3, precipitation, and air temperature; red dotted line: interannual component of SPEI-3, precipitation, and air temperature).

Figure 6.
The spatial distribution of the contributions of precipitation (a) and temperature (b) anomalies to SPEI 3 anomalies on the interannual timescale at 83 in situ stations in Yunnan.
Figure 6.
The spatial distribution of the contributions of precipitation (a) and temperature (b) anomalies to SPEI 3 anomalies on the interannual timescale at 83 in situ stations in Yunnan.

Figure 7.
Composite spatial distributions of the vertically integrated (1000 300 hPa) anomalies of the (a) horizontal moisture advection term, (b) vertical moisture advection term, (c) q tendency, and (d) Yunnan regional average of the water vapor equation items (unit: kg/(m2*day)) on the right of Equation (1) during spring drought years. The white shading denotes that there are fewer than 3 integral layers affected by topography (black dots in the graph indicate significance at a 95% level, determined using t test).

Figure 8.
Composite horizontal distributions of anomalies of (a) 200 hPa geopotential height (shading, m) and divergence (contour, 10−6 s−1), (b) 500 hPa geopotential height (contour, m) and vertical velocity (shading, 10−2 Pa/s), (c) 700 hPa wind (vector, m/s) and divergence (shading, 10−6 s−1), and (d) 1000–300 hPa integrated water vapor flux (vectors, kg/(m × s)) and its divergence (shading, 10−5 kg/(m2 × s)) in spring drought years (black dots and purple vectors indicate significance at a 90% level, determined using t-test).

Figure 9.
Composite horizontal distributions of standardized regression coefficients of (a) Yunnan spring precipitation anomalies and global pre-winter sea surface temperature anomalies (SSTAs) and (b) Yunnan spring precipitation anomalies and global spring SSTAs (dotted areas are the regression coefficients that are significant at the 95% level, determined using t-test).


Table 1.
Standardized precipitation evapotranspiration index (SPEI) drought classification criteria.
Table 1.
Standardized precipitation evapotranspiration index (SPEI) drought classification criteria.
| Drought Grade | SPEI |
|---|---|
| Wet | 0.5 < SPEI |
| No drought | −0.5 < SPEI ≤ 0.5 |
| Light drought | −1.0 < SPEI ≤ −0.5 |
| Moderate drought | −1.5 < SPEI ≤ −1.0 |
| Severe drought | −2.0 < SPEI ≤ −1.5 |
| Extreme drought | SPEI ≤ −2.0 |
Table 2.
Standardized regression coefficients of the SPEI with precipitation and air temperature in spring.
Table 2.
Standardized regression coefficients of the SPEI with precipitation and air temperature in spring.
| SPEI-3 (MAM) | Precipitation | Temperature |
|---|---|---|
| ID | 0.22 | −0.09 |
| IA | 0.56 * | −0.17 |
* a = 0.01.
Disclaimer/Publisher’s Note: The statements, opinions and data contained in all publications are solely those of the individual author(s) and contributor(s) and not of MDPI and/or the editor(s). MDPI and/or the editor(s) disclaim responsibility for any injury to people or property resulting from any ideas, methods, instructions or products referred to in the content. |
© 2023 by the authors. Licensee MDPI, Basel, Switzerland. This article is an open access article distributed under the terms and conditions of the Creative Commons Attribution (CC BY) license (https://creativecommons.org/licenses/by/4.0/).
Share and Cite
MDPI and ACS Style
Gao, L.; Han, X.; Chen, X.; Liu, B.; Li, Y. The Spring Drought in Yunnan Province of China: Variation Characteristics, Leading Impact Factors, and Physical Mechanisms. Atmosphere 2023, 14, 294. https://doi.org/10.3390/atmos14020294
AMA Style
Gao L, Han X, Chen X, Liu B, Li Y. The Spring Drought in Yunnan Province of China: Variation Characteristics, Leading Impact Factors, and Physical Mechanisms. Atmosphere. 2023; 14(2):294. https://doi.org/10.3390/atmos14020294
Chicago/Turabian StyleGao, Lu, Xue Han, Xingrong Chen, Boqi Liu, and Yan Li. 2023. "The Spring Drought in Yunnan Province of China: Variation Characteristics, Leading Impact Factors, and Physical Mechanisms" Atmosphere 14, no. 2: 294. https://doi.org/10.3390/atmos14020294
Note that from the first issue of 2016, this journal uses article numbers instead of page numbers. See further details here.