1. Introduction
The propagation of very-low-frequency (VLF) (3–30 kHz) and low-frequency (LF) (30–300 kHz) radio waves is very sensitive to the conductivity changes in the lower ionosphere height (60–100 km). Regular ionization by solar flux dominates the day–night cycle of the ionosphere and is responsible for the diurnal variation of the VLF/LF signals received at the ground, which provides a good opportunity to study the lower ionospheric physics continuously. Moreover, regular solar flux variation, soft X-rays from solar flares [
1,
2,
3,
4], and energetic particle precipitation associated with geomagnetic storms [
5,
6,
7,
8,
9,
10,
11] cause excess ionospheric ionization detectable in VLF/LF signals and are very well-known phenomena in ionospheric studies.
Any ionizing photons coming from outer space other than the Sun can also cause terrestrial ionospheric disturbances. The first such event was reported by Fishman and Inan [
12], which was associated with a gamma-ray burst (GRB) that ionized the ionosphere abnormally and caused VLF signal perturbations. Thereafter, a few researchers reported VLF signal disturbances due to the giant gamma-ray flares from a related class of extra-solar events known as soft gamma-ray repeater (SGR) or magnetars [
13,
14,
15]. Energetic photons from these events upon incidence on the ionosphere create ionization disturbances that last for a few seconds to tens of minutes depending on the ionospheric heights. On average, there is at least one GRB event recorded every day by various satellites, but not all affect the ionosphere. The events that affect the ionosphere are very rare and depend on their energy spectrum. VLF/LF signals detect not only the ionospheric perturbations associated with the GRB or SGR but also provide an opportunity to estimate the energy spectrum of these events [
13,
15], impinging on the ionosphere that helps in case of missed detection by satellites.
The magnitude of VLF amplitude and phase perturbations on a VLF propagation path depends on many factors, such as the propagating distance, the interference between various propagating modes, the frequency of the signal, and latitudes of the VLF path. Inan et al. [
13] observed an amplitude reduction of ∼9 dB to ∼24 dB on the NPM VLF signal received over nighttime propagation paths with recovery time scales of ∼200–300 s. Tanaka et al. [
15] reported different VLF amplitude changes (∼9 dB to 30 dB) and recovery time scales (∼10 min to 20 min) due to the SGR 1900 + 14 in JJI, NWC, and NPM signals received in Chofu, Japan around evening time (∼7:30 p.m. LT). An interesting case of three instances of VLF disturbances received by a receiver in Brazil on the same day by short repeated bursts from the magnetar SGR J1550–5418 was reported by Tanaka et al. [
16]. The propagation path was under nighttime conditions, and less than half of the path was illuminated by the SGR flare, resulting in ∼0.3 to 4.0 dB amplitude changes. Inan et al. [
14] showed strong disturbances in the daytime lower ionosphere over the long propagation path (∼12 Mm) NPM to Plamer, Antarctica due to the SGR 1806-20. The SGR ionized the day-side ionosphere around noon and the NPM signal showed a ∼26 dB reduction in amplitude followed by a long recovery time of ∼1 hour. Intense and long ionospheric disturbances due to a GRB during complete daytime propagation conditions are not observed yet. Further, the difference in ionospheric response or VLF/LF signals response to a GRB during both day and night has not been studied well.
In this paper, we have presented a preliminary report on the global sub-ionospheric VLF signals response to the brightest GRB so far recorded on 9 October 2022. This is the first report of lower ionospheric disturbances observed simultaneously in both the day and night side parts of the globe using global VLF/LF transmitter signal receiver networks. The organization of the paper is as follows. In
Section 2, we briefly describe the data and methodology part;
Section 3 deals with the observed results and lower ionospheric characteristic changes due to the GRB; and
Section 4 is our conclusion.
2. Data and Methodology
The radio data used here to diagnose the effects of the GRB221009A are obtained from four VLF/LF networks around the world. The Japanese VLF network operated by the University of Electro-Communications (UEC) provides a great opportunity to study the effects of the GRB on the nighttime ionosphere. This network consists of two receiving stations—Nakashibetsu (NSB) and Yamaguchi (YMG)—in Japan.
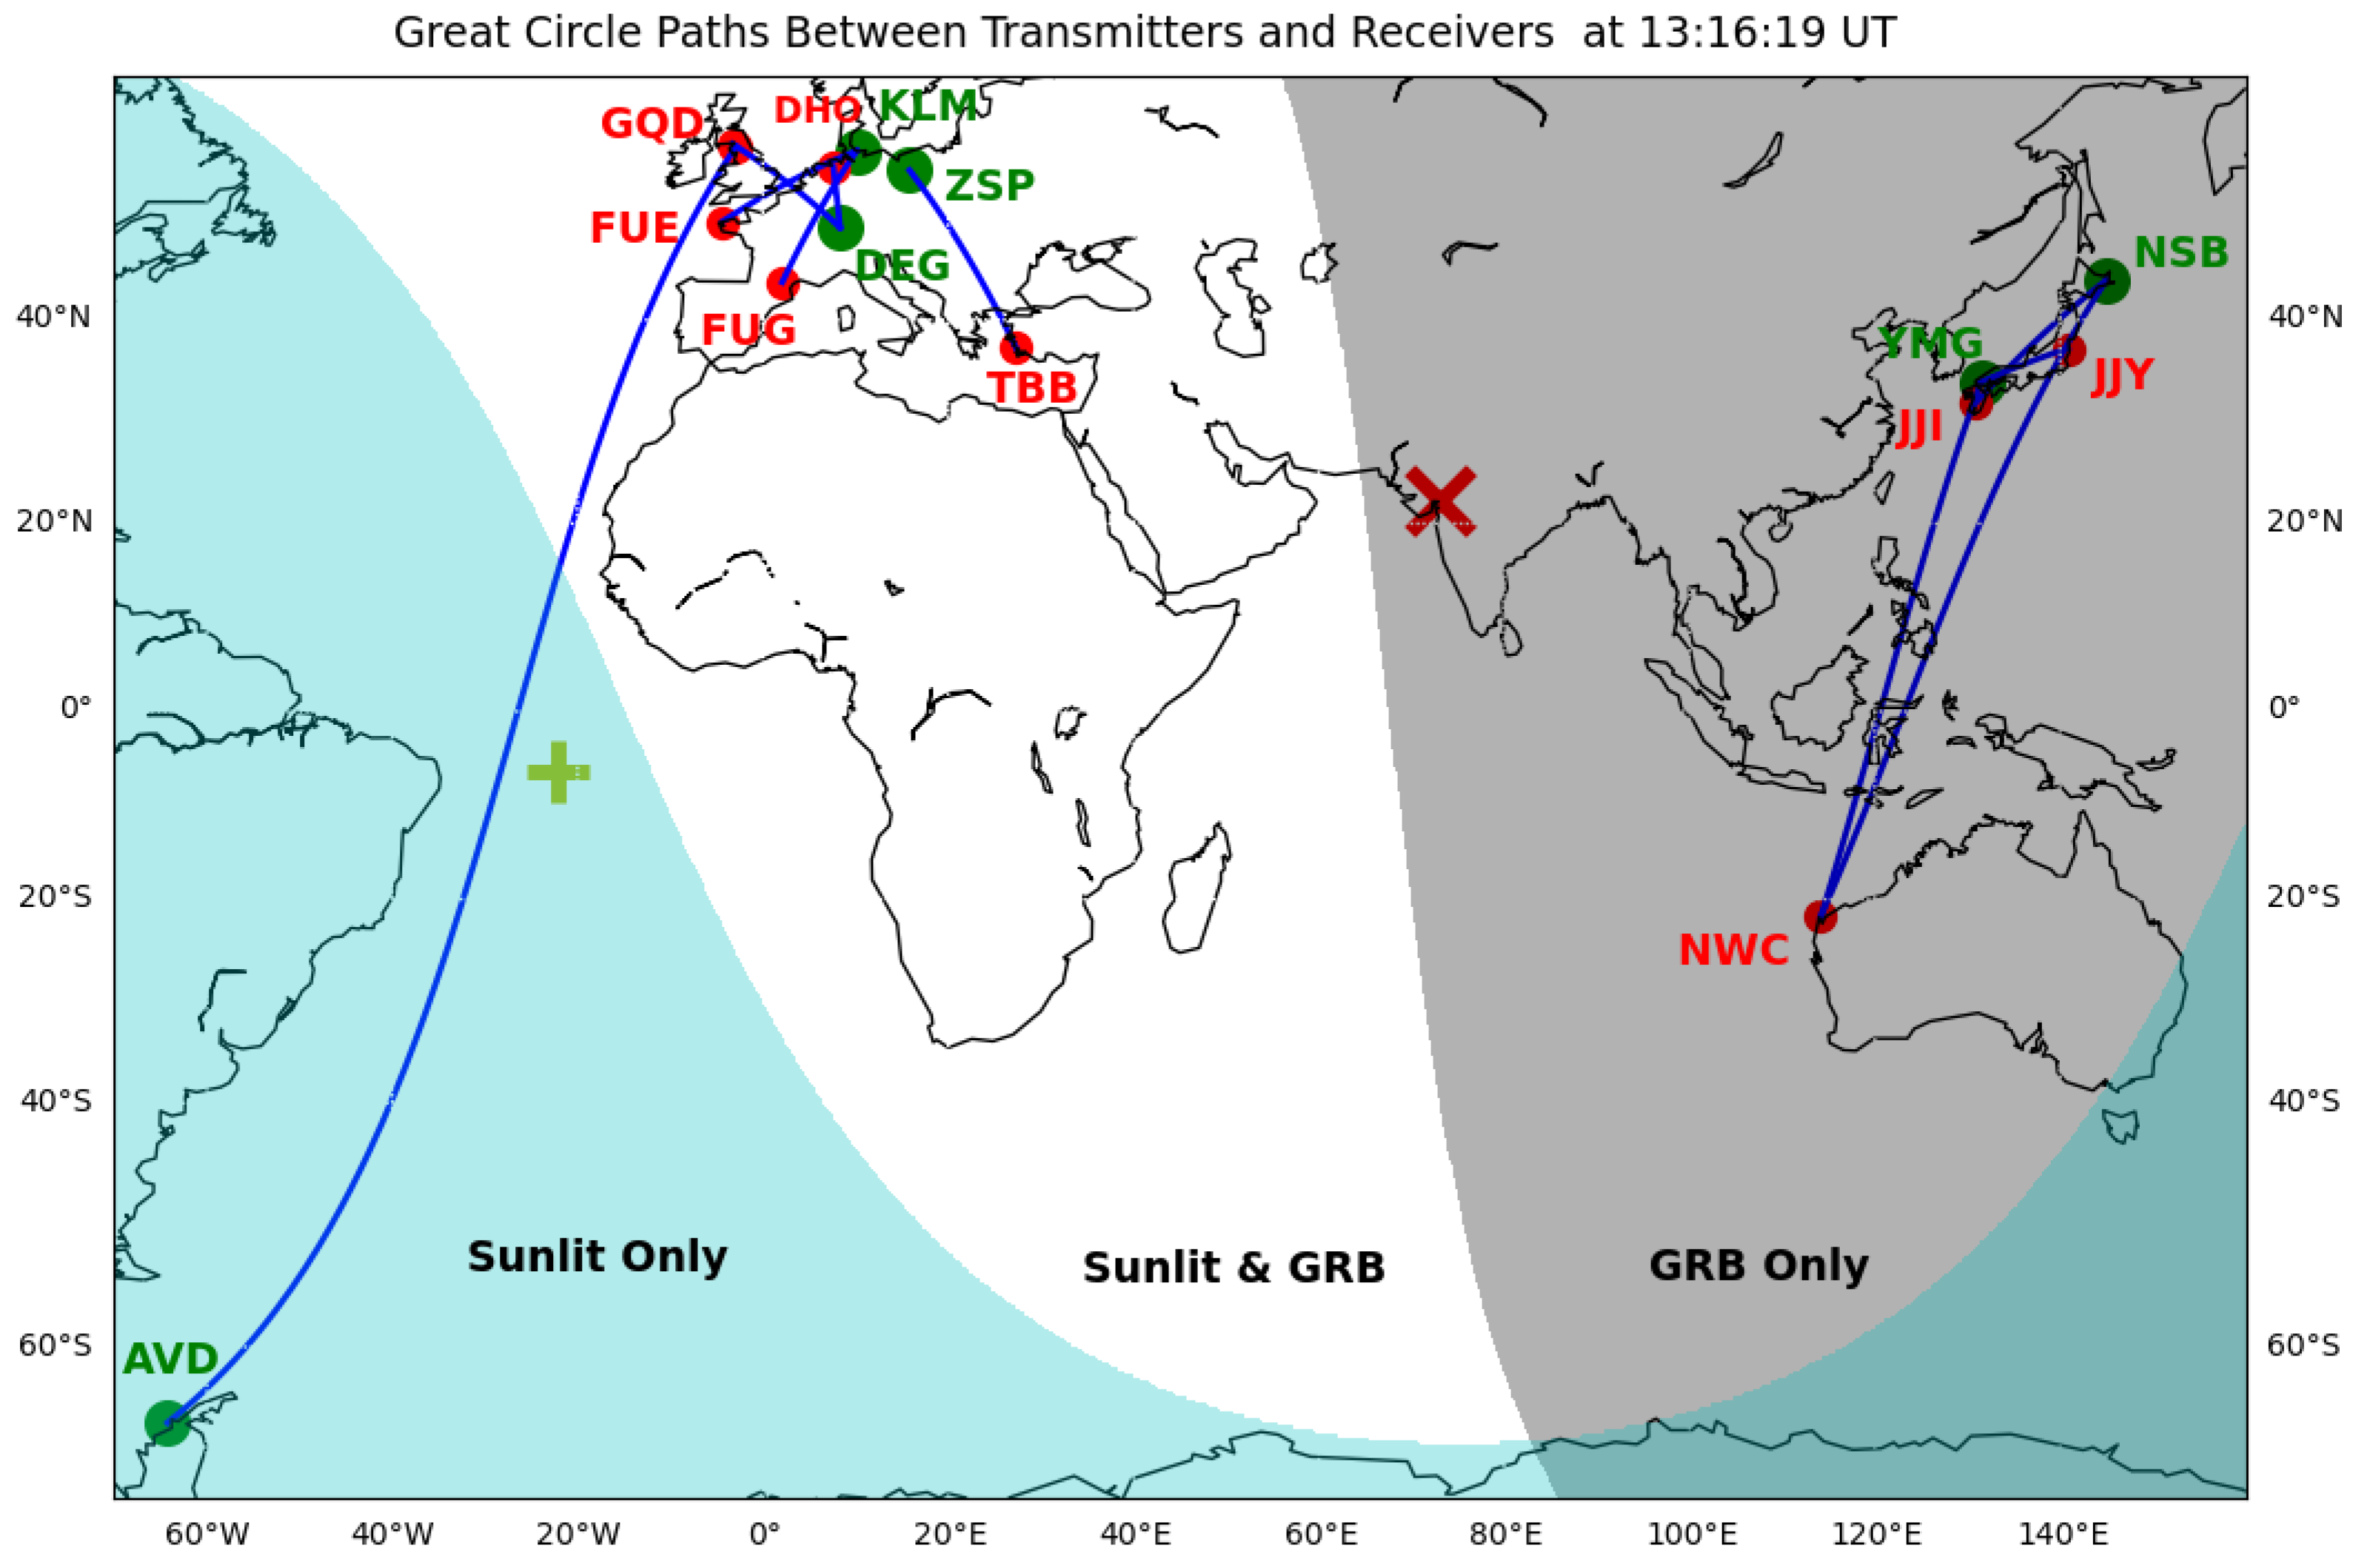
Figure 1 shows the locations of all the receiving stations (green dots) and transmitters (red dots) along with the great circle paths (GCPs) (blue lines). The shaded area in grey shows the night side part of the globe, and the area in cyan shows the part of the earth that was not illuminated by the GRB221009A. The white part shows the area illuminated by both the Sun and GRB221009A. There are many radio propagation paths on the day side consisting of GCPs from the Kiel long-wave monitor (KLM, Germany), Supersid (Germany and Poland), and Ukrainian VLF networks. Since the four networks use different types of antennas and receivers, we focus on the relative changes in the field amplitudes of the VLF/LF signals. All of the VLF/LF data are used here with 1 s time resolution, except the Supersid network (DHO-ZSP, GQD-DEG, and TBB-ZSP), for which 5 s time resolution data are available. We compare the timings of the GRB221009A with VLF amplitude disturbances and find the amplitude deviation with respect to the amplitude before the GRB event. We have also checked the VLF signals recovery time
, and the time difference between the maximum GRB flux and maximum VLF perturbation, which characterizes the ionospheric recombination processes.
The GRB flux data are obtained from the Spectrometer/Telescope for Imaging X-rays (STIX) mission on board the Solar Orbiter of ESA in two energy bands 25–50 keV and 50–84 keV (
https://datacenter.stix.i4ds.net/, accessed on 13 January 2023). This burst was a record-breaking event detected so far by any space satellites. The event was recorded first with early trigger time 13:16:59.00 UT (t
of the event) by NASA’s Fermi Gamma-ray burst monitor (GBM, GCN 32636) on board the Fermi satellite. Energetic photons were detected even 25 ksec after the burst occurred [
17]. The most energetic photon (∼99 GeV) was detected at (t
+ 240 s) (GCN 32658), making it a once-in-a-century event. The DAMPE (dark matter particle explorer) satellite also observed 34.7 GeV photons about 1 h after the Fermi GBM trigger (GCN 32973). The first brightest peak of the GRB flux occurred at 48,036.4 s of the day (13:20:36.4 UT). It is believed that a supernova explosion of a massive star that occurred 2.4 billion light-years away from Earth triggered the event and can also be thought of as the ’birth cry of a black hole’ (
https://www.nasa.gov/feature/goddard/2022/nasa-s-swift-fermi-missions-detect-exceptional-cosmic-blast, accessed on 13 January 2023). The sub-stellar point of the GRB is shown using the red cross sign in
Figure 1, and the yellow plus sign indicates the sub-solar point. All the VLF propagation paths were exposed by the GRB photons.
3. Results and Discussion
The lower ionosphere is vulnerable to any incoming radiation from outer space responsible for photoionization process. The energetic photons from the GRB fall on the ionosphere creating excess ionization. The level of ionization will be different for day side and night side ionosphere, since day side ionosphere is dominated by the effect of Sun and night side ionosphere becomes weak in ionization. Consequently, the propagation characteristics of the sub-ionospheric radio signals will be different for day-side and night-side regions. At first, we present the VLF/LF characteristics in the nighttime ionosphere followed by the daytime ionosphere.
3.1. Night Side Ionosphere
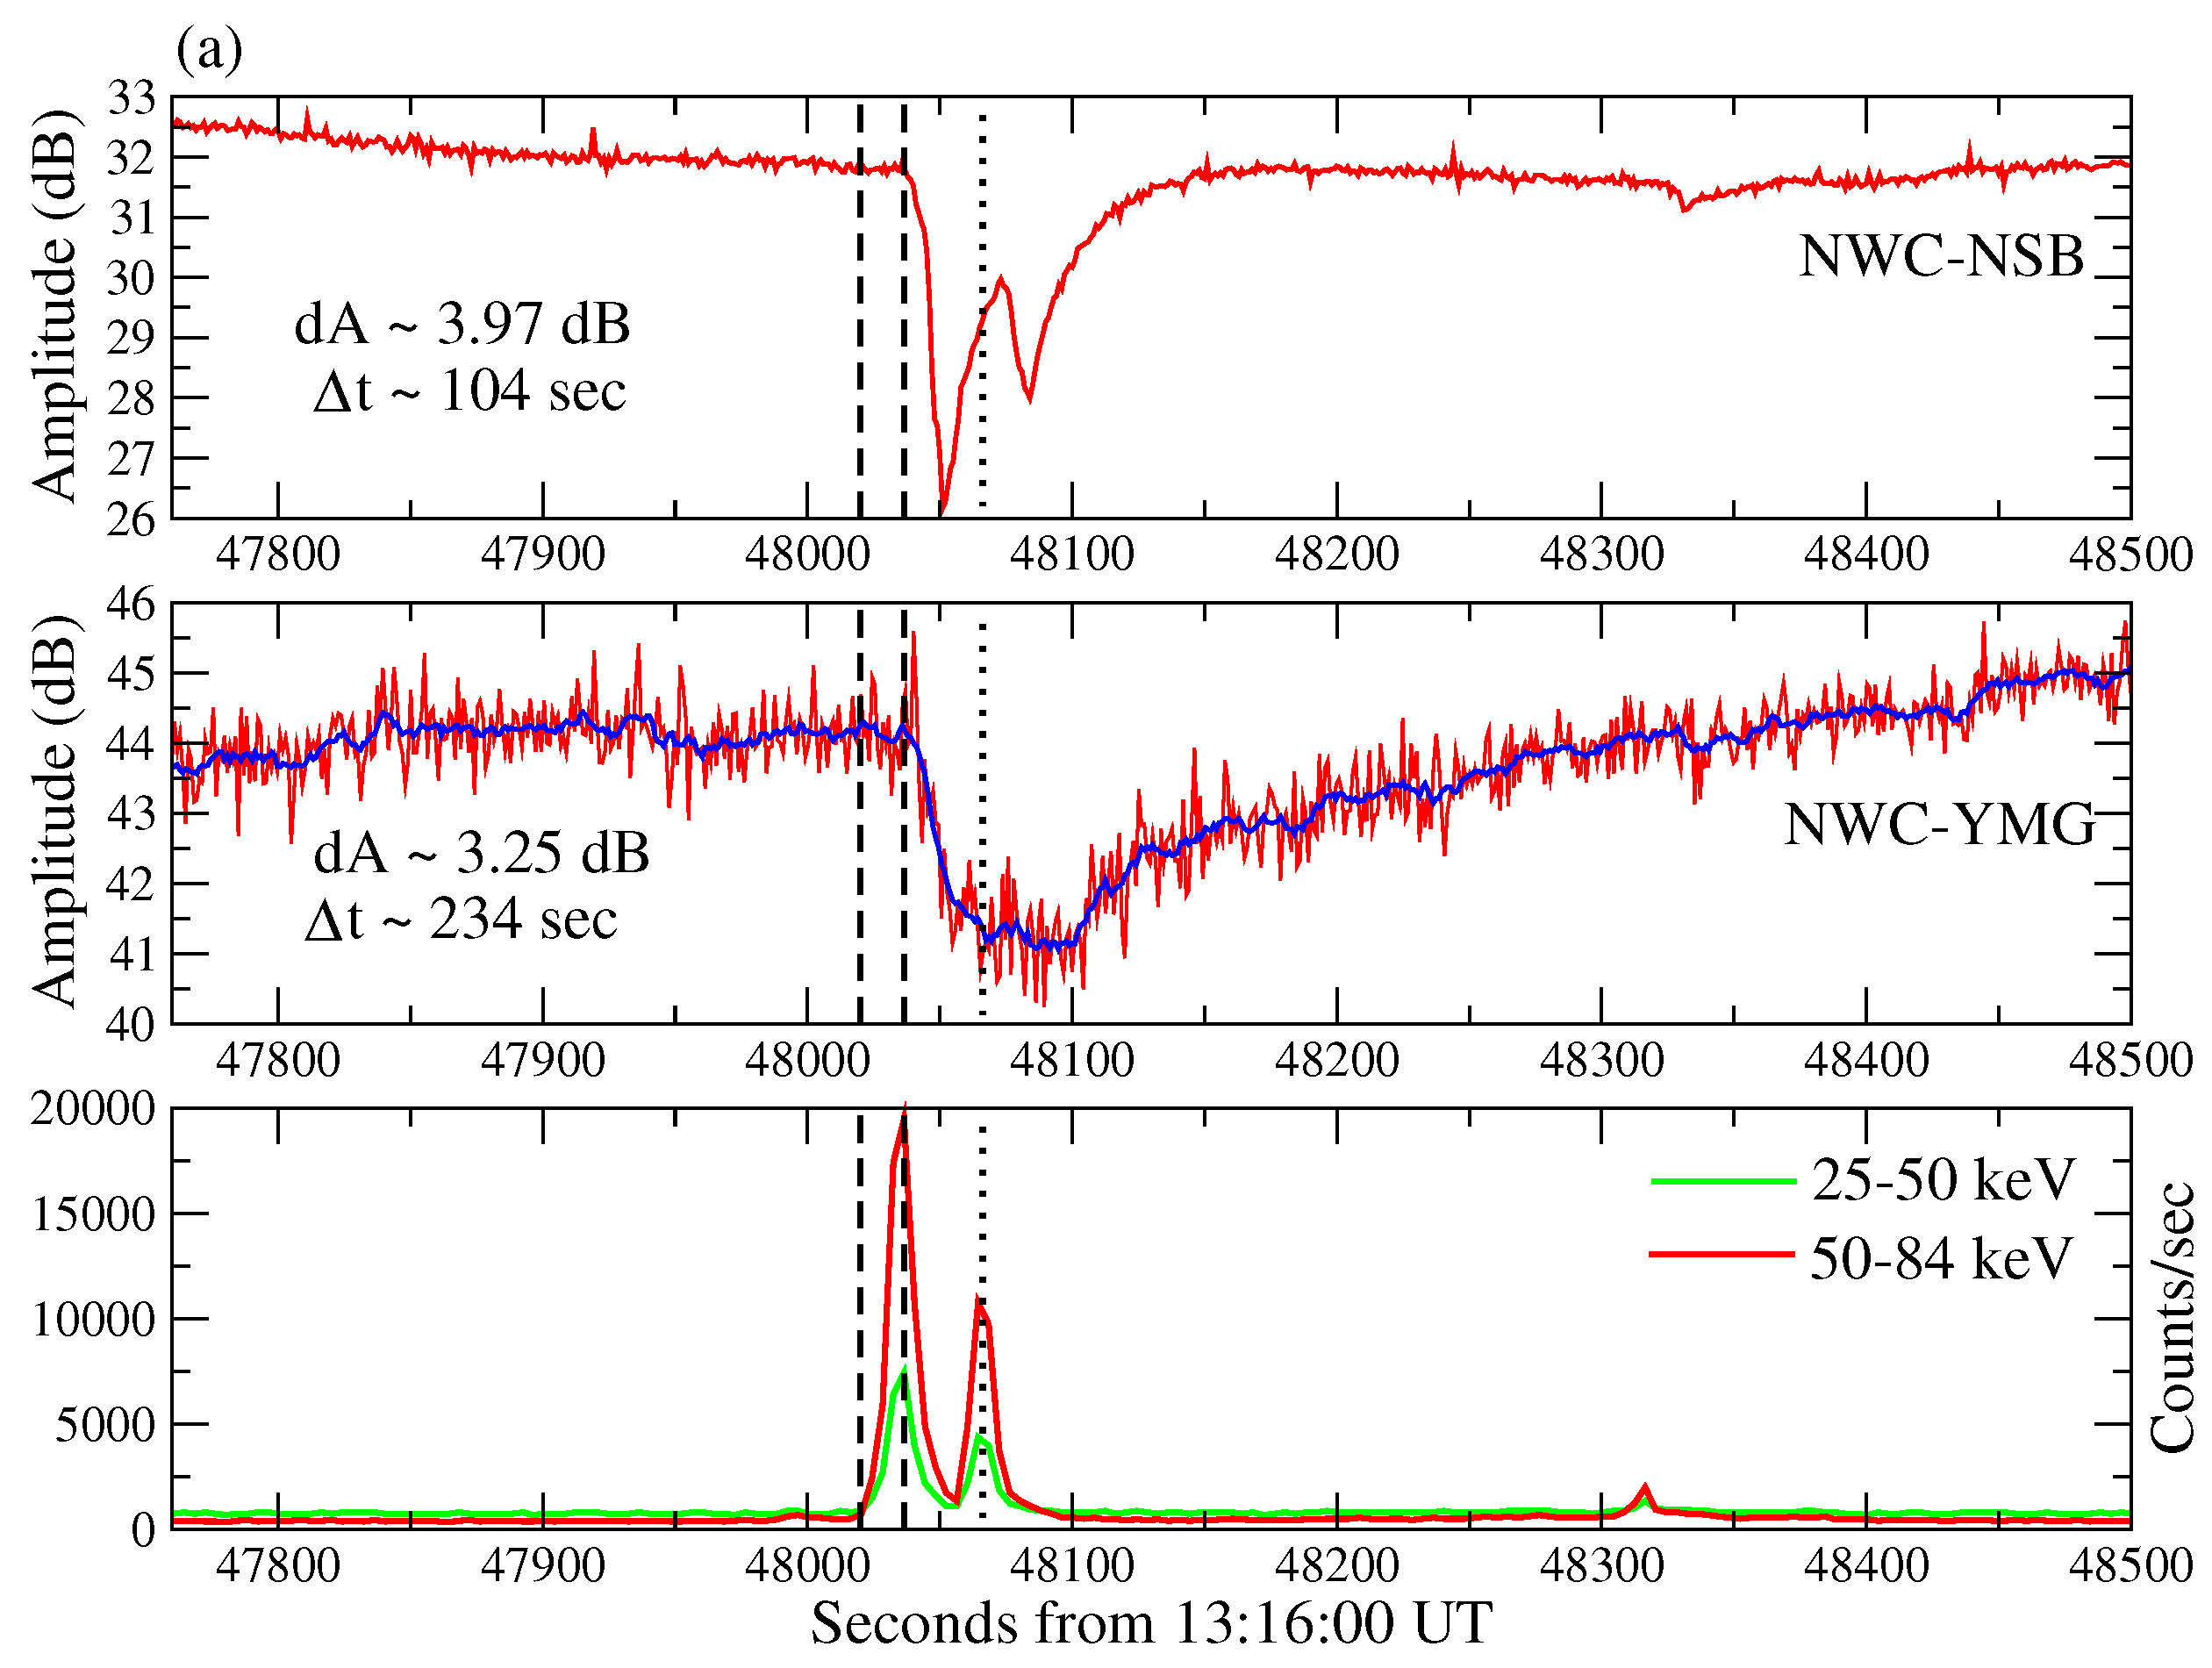
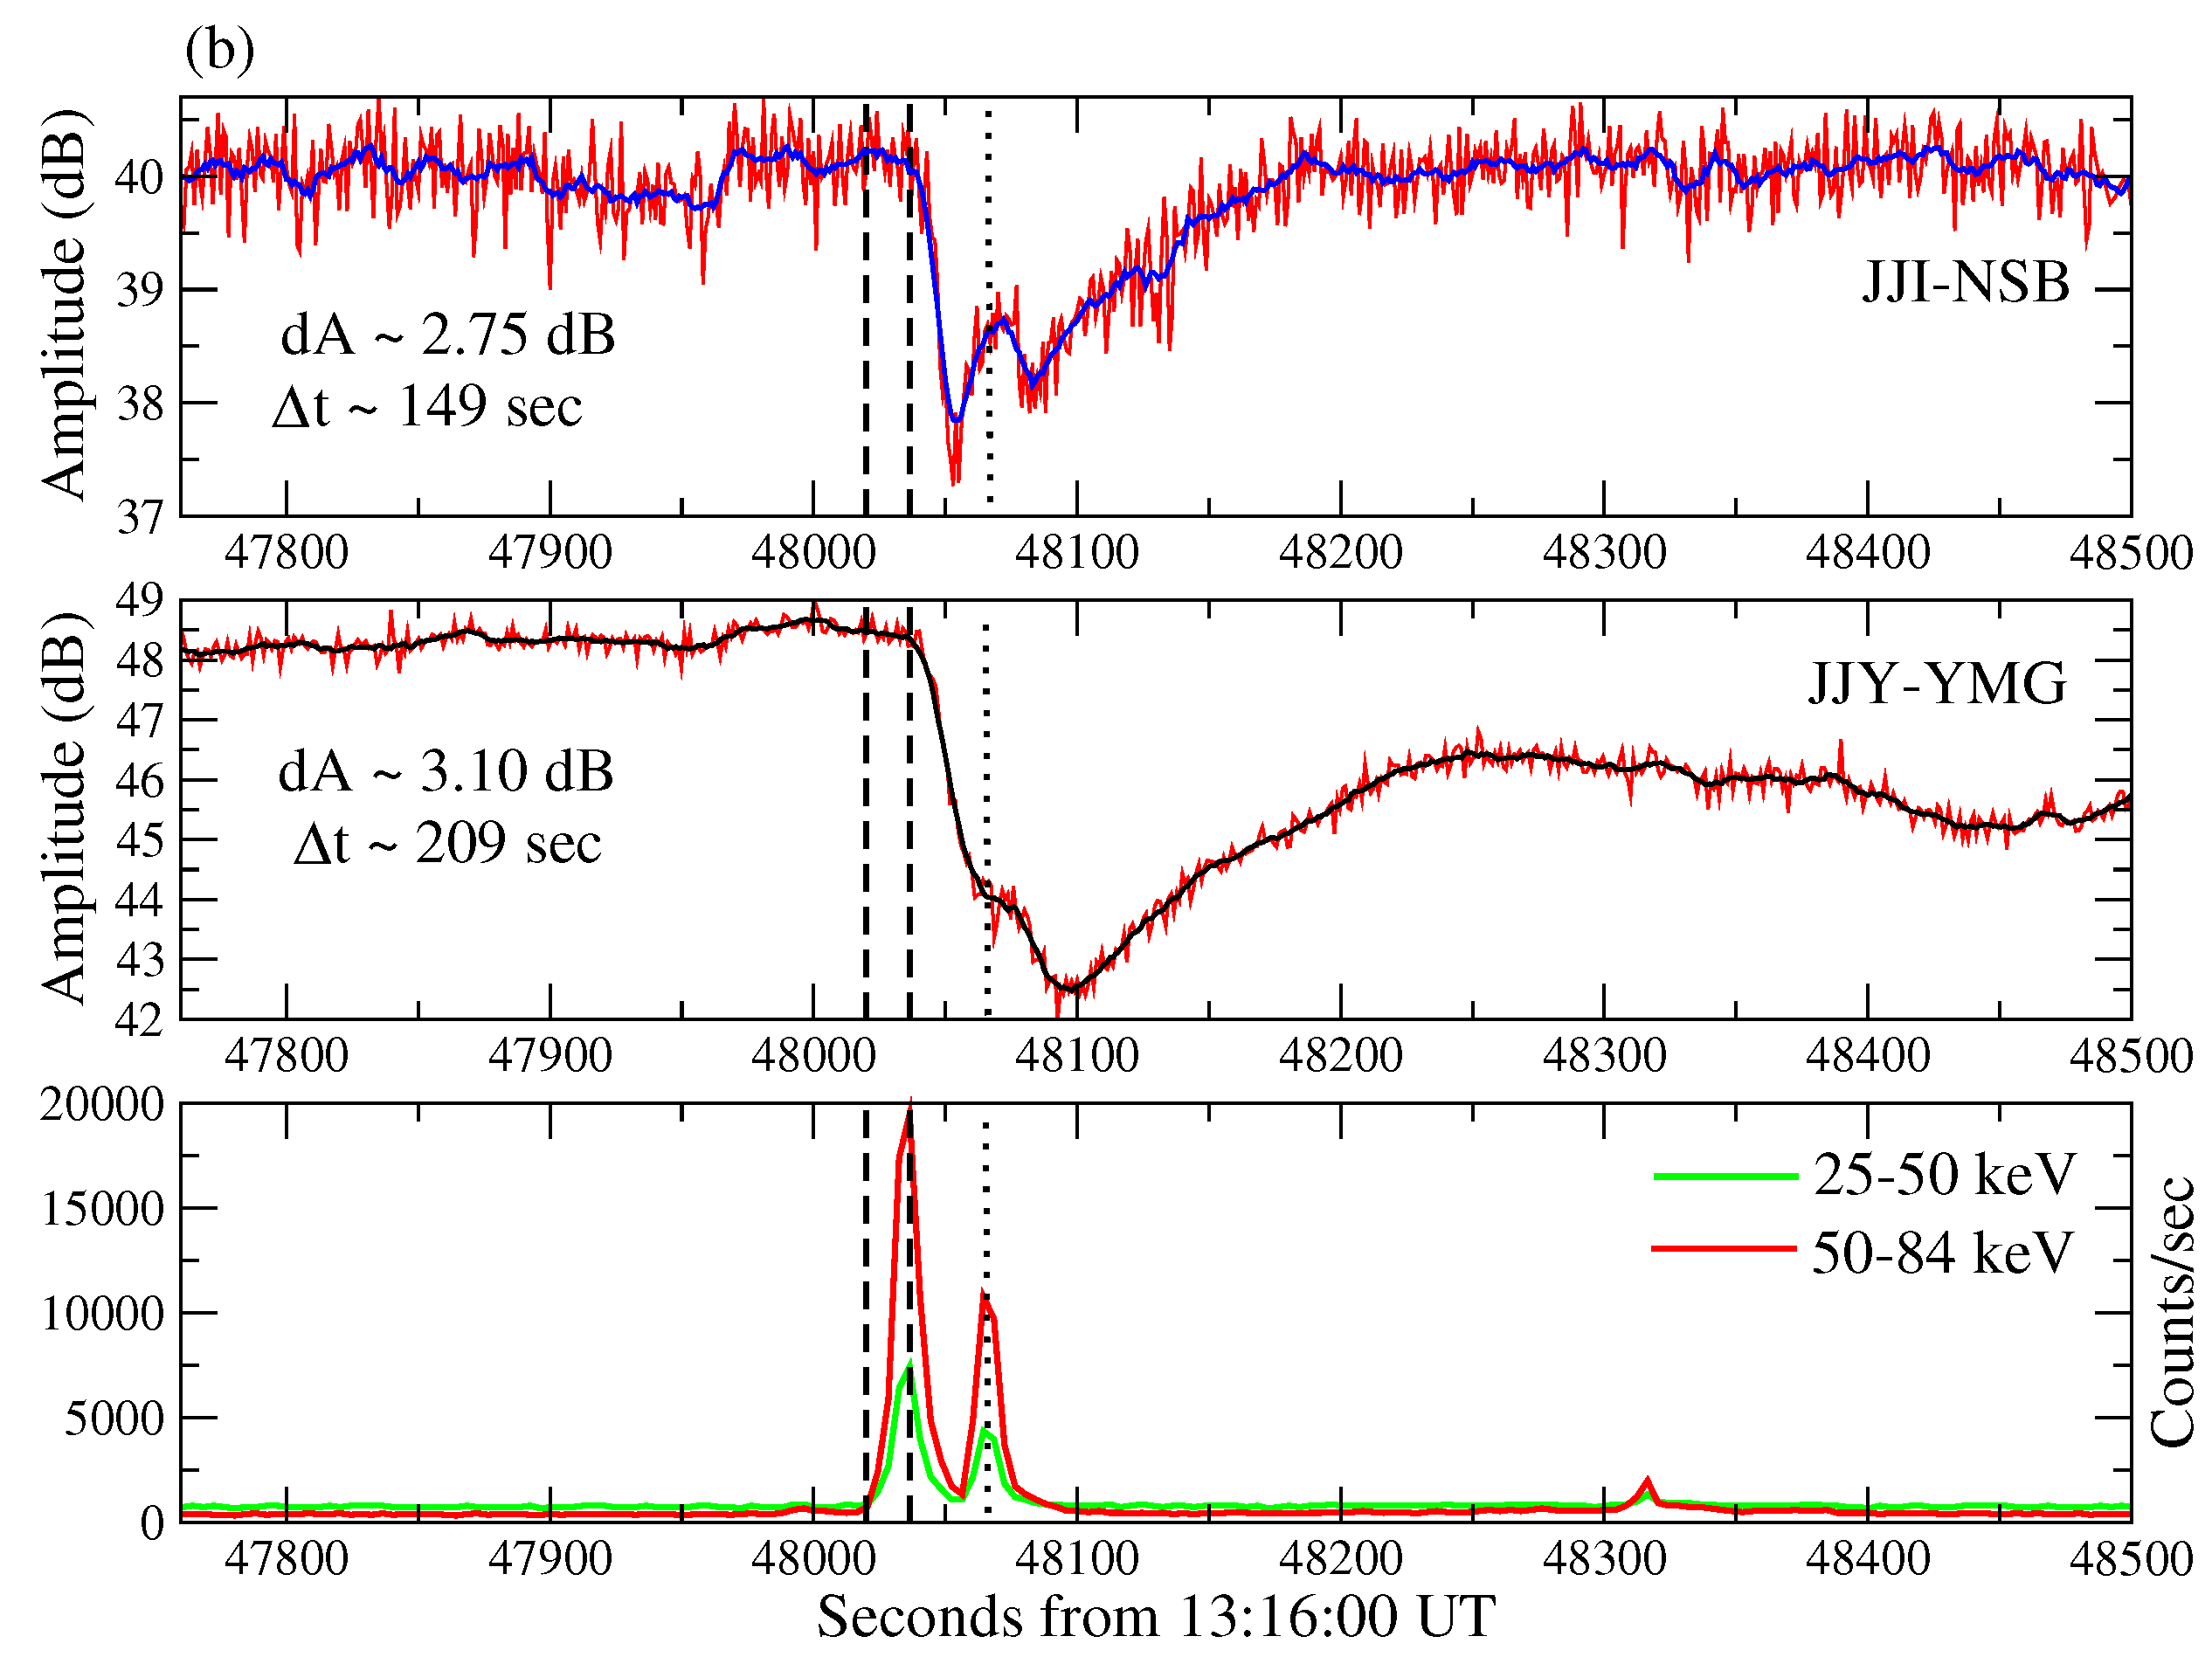
Figure 2 shows perturbations of VLF signals during the GRB period in the Japanese VLF network. Mainly, the NWC signal at 19.8 kHz received at NSB and YMG over the long propagation paths is presented in
Figure 2a, while
Figure 2b presents disturbances in JJI (22.2 kHz) and JJY (40.0 kHz) signals received at NSB and YMG, respectively, over the shorter propagation paths than from the NWC paths. The lowest panels in both (a) and (b) show the light curves of energetic photons in 25–50 and 50–84 keV bands from the GRB as detected by the STIX. The three vertical lines indicate the GRB onset time, peak flux time of the 1st burst, and peak flux time of the 2nd burst, respectively, from left to right. The x-axis represents the seconds of the day. The NWC-NSB path showed a maximum of ∼3.97 dB negative perturbation (or amplitude decrease) 15 Section (48,051 s) after the GRB peak flux at 48,036 s and the signal recovered to its pre-GRB level after ∼102 s from the peak flux time. Since the ionospheric recombination and ionization processes both continue at the same time, the electron-ion density cannot reach the maximum level at the time of maximum ionizing flux. Thus, there is a time lag or time delay between the GRB peak flux and maximum VLF response. When incoming radiation from the GRB stops, the recombination or electron-attachment process dominates and the ionosphere takes time to get back to its unperturbed level. We have defined the recovery time as the time taken by the VLF/LF signals to get back to their pre-perturbed level (within 10–25%). The time delay and recovery times both signify ionospheric recombination processes that vary with neutral density or height [
1,
18,
19], suggesting different time delays and recovery times for the daytime and nighttime ionospheres.
The NWC-YMG signal showed that a maximum negative perturbation of ∼3.25 dB occurred 49 s after the GRB peak flux time and the signal recovered to its pre-GRB level is ∼230 s after the peak flux time. It is very interesting to note that the NWC and JJI signals at the NSB and JJY signals at YMG showed a very clear response to the 2nd burst as detected by the STIX, which is not clear in the NWC-YMG path. This could be due to the increased noise in the received signal or due to the large recovery times or due to the propagation distance and modal interference effects. Further, both the recovery times and time delay for the NWC and JJY signals received in YMG are large compared to the two signals received in NSB, which could suggest greater ionization in the YMG paths due to the greater exposure by the GRB photons.
3.2. Day Side Ionosphere
During the daytime, ionospheric ionization is dominated by solar flux variation. Strong ionizing photons comparable to or greater than the Sun such as during a GRB can cause detectable changes in the received VLF signals [
13,
15]. The European and African continents were under daylight conditions (as seen in
Figure 1) and were also illuminated by the GRB221009A. We expect effects on VLF signals propagating here due to the energetic photons from the GRB221009A. The Supersid network in Europe and the Ukrainian VLF network in Antarctica detected the effects of the GRB on VLF signals in three frequencies.
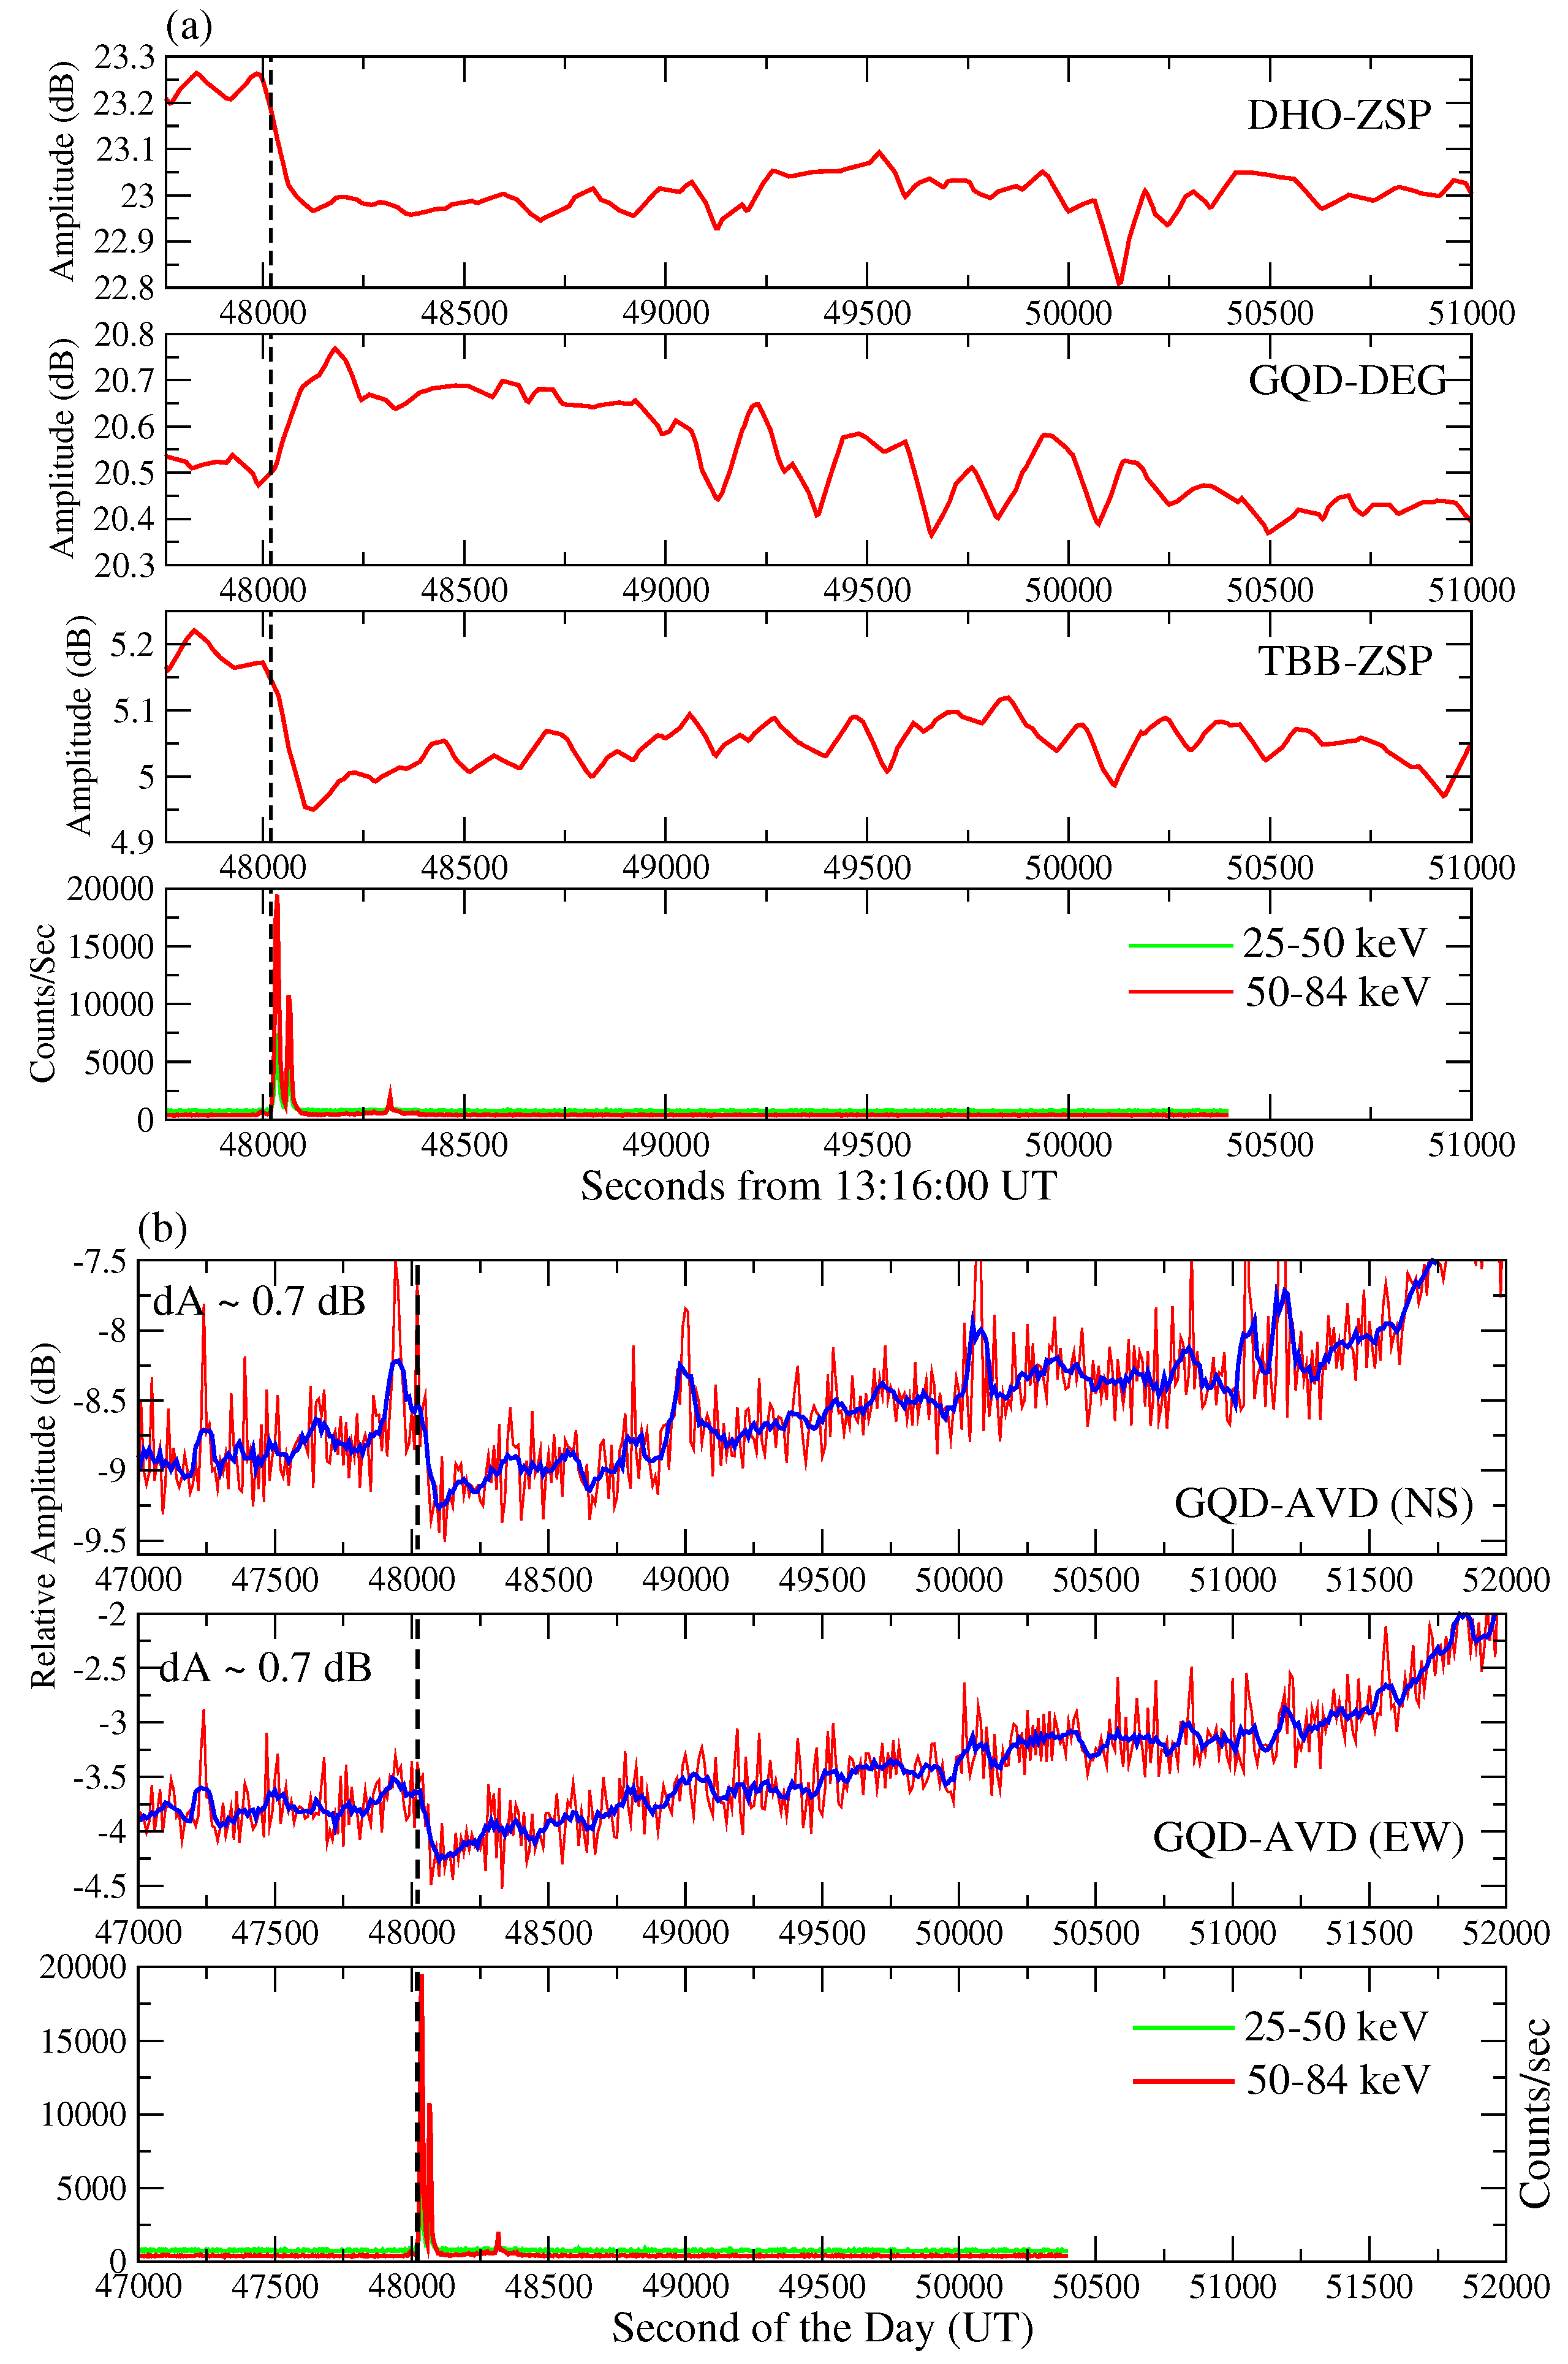
Figure 3a shows the effects on the DHO (23.4 kHz), GQD (19.58 kHz), and TBB (26.7 kHz) signals as received in ZSP and DEG, respectively, with 5 s time resolution. The vertical line indicates the GRB onset time. The amplitude disturbances in all three short propagation paths are low (∼0.3 dB) compared to nighttime VLF paths in the Japanese network. Similarly,
Figure 3b shows VLF amplitude disturbance associated with the GRB in a very long propagation path from GQD, UK to AVD in Antarctica. This path was illuminated by the GRB221009A only about one-third of its total length, and the observed amplitude disturbance was small
0.7 dB.
Effects on LF Signals
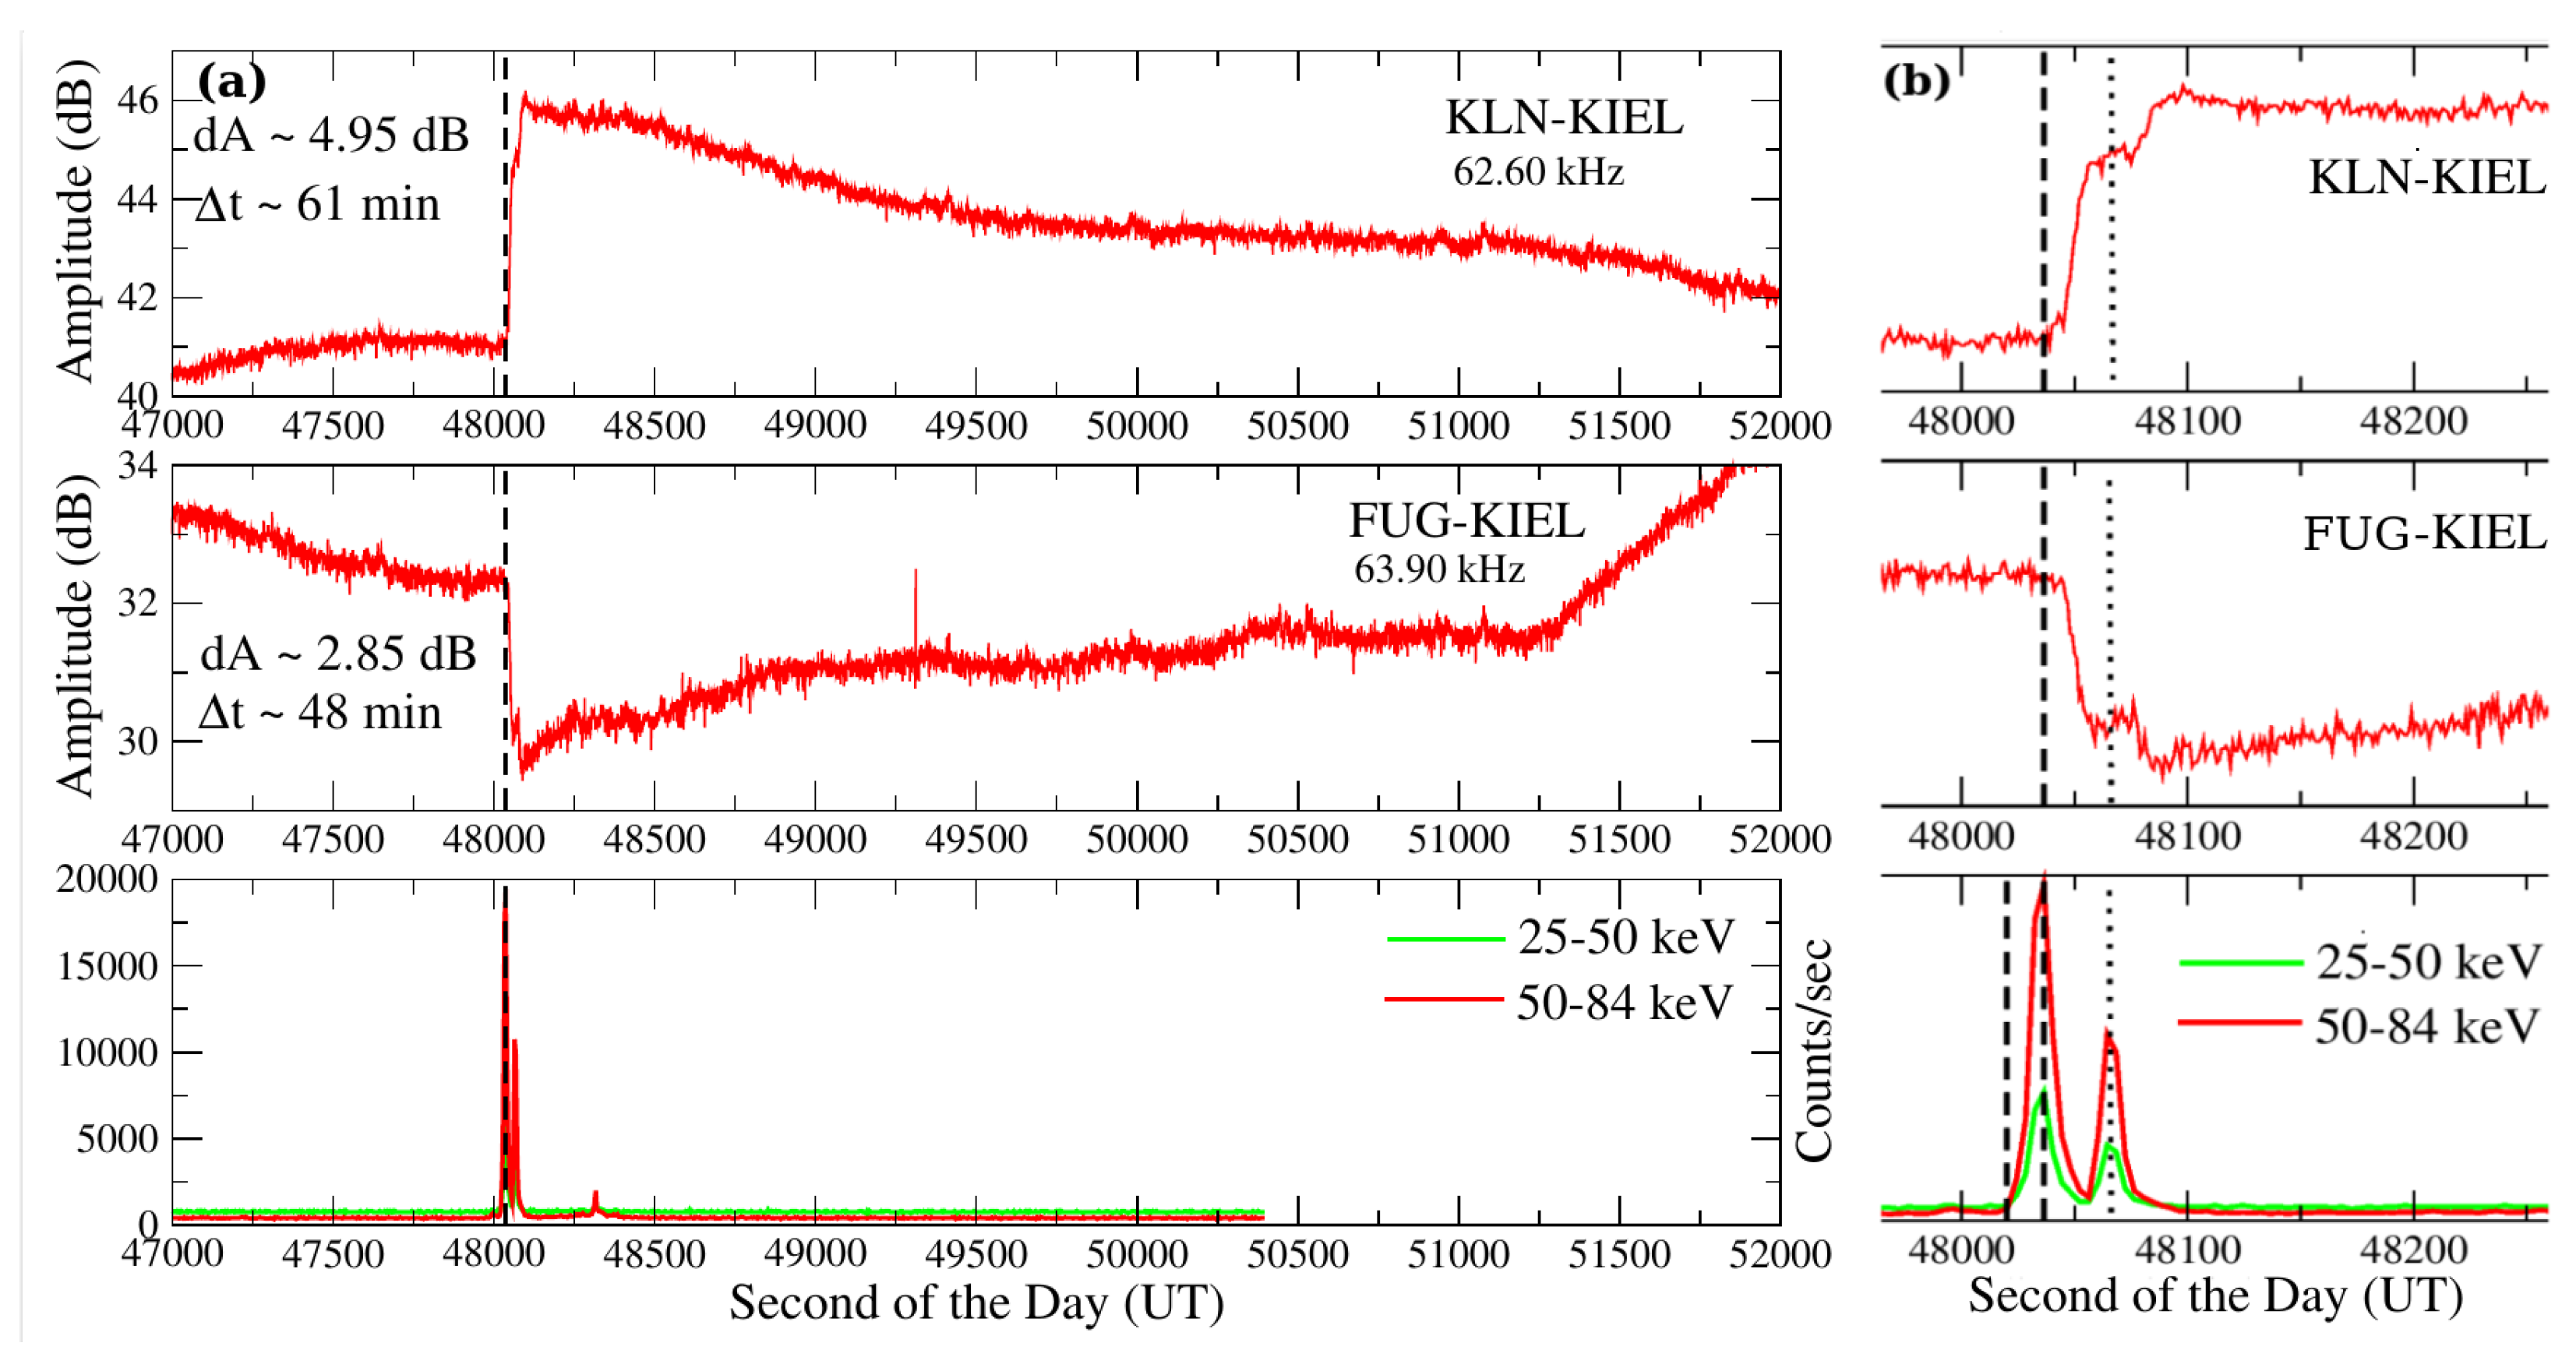
Figure 4a shows the amplitude disturbances over daytime short propagation paths (1100–1340 km) at frequencies 62.6 kHz (1st panel) and 63.90 kHz (2nd panel) as received in Kiel, Germany with 1 s time resolution associated with the GRB event (3rd panel). Both signals responded strongly to the main GRB event with positive and negative amplitude perturbations by ∼4.95 dB and ∼2.85 dB, respectively. The two signals also reacted to the second event at 48,065 s (UT) shown clearly in
Figure 4b. The FUE signal recovered (came back within 25% of the pre-GRB level) after 61 min, and the FUG signal recovered after 48 min (within 25% of the pre-GRB level) of the peak GRB time. All of the observations are summarized in
Table 1. Interestingly, the recovery times for both of these LF signals are very long compared to the daytime VLF and nighttime VLF signals. This could be possible as the FUE and FUG signals get reflected from the lower E-region ionosphere where the neutral air component is low compared to the D-region, which reflects the VLF waves. Further, the positive and negative amplitude deviations for these signals can be explained by the constructive and destructive interference between different daytime waveguide modes propagating in the earth-ionosphere waveguide during the GRB period.
4. Conclusions
We present the first report of global ionospheric disturbances (both day and night) associated with the GRB221009A using VLF/LF sub-ionospheric signals. Four nighttime propagation paths and six daytime propagation paths showed very clear effects of the GRB221009A in terms of amplitude perturbations and recovery times, which varied with the propagation distance and frequency of the VLF/LF signals. All of the nighttime propagation paths showed negative amplitude perturbations irrespective of propagation distance and frequency, but daytime propagation paths showed both positive and negative amplitude perturbations mainly depending on propagation distance and modal interference effects. Positive amplitude perturbations were observed on daytime paths with a propagation distance up to 1100 km, and negative amplitude perturbations were observed on paths with a propagation distance greater than 1100 km except for the very short propagation path DHO-ZSP, for which we also observe negative amplitude perturbation. VLF/LF amplitude perturbations with respect to the quiet time signals depend on the constructive or destructive interference pattern between the waveguide modes, which changes along the propagation path from transmitter to the receiver in the case of increased (or decreased) ionization in the lower ionosphere, which can be predicted using the FDTD method or long-wave propagation capability (LWPC) code [
15,
20].
The time lag between the peak GRB flux and observed VLF/LF maximum perturbation depends mainly on the amount of energy deposited in the ionosphere by the GRB and the deposition height of the incoming radiation. However, the recovery times of the VLF/LF signals greatly vary with propagation distance and VLF/LF frequency. The recovery times for VLF/LF signals here varied from ∼2–60 min. In general, the long propagation paths and also the paths far from the sub-stellar point of the GRB experienced lower recovery times. The recovery times for the LF signals are large compared to the VLF signals since the LF signals reflected from higher D-region or lower E-region heights where the density of neutral components such as , and O are less compared to low or mid-D-region heights. This results in a slower recombination process in the reflection heights of the LF signals, leading to a large recovery time than the VLF signals. The daytime VLF/LF recovery times are much greater than the nighttime recovery times, suggesting greater ionospheric disturbances in the daytime ionosphere by the GRB. Additionally, the perturbation is more on the E-region than the D-region ionosphere, as is evident from the perturbation observed on the LF signals. More detailed analysis in terms of the theoretical simulation of the VLF/LF changes due to the GRB and finding dominant chemical reactions leading to the large recovery times will be communicated shortly.

 ,
, 


