Article

Secondary Organic Aerosol Formation from Semi-Volatile and Intermediate Volatility Organic Compounds in the Fall in Beijing

1
School of Earth Science and Engineering, Hebei University of Engineering, Handan 056038, China
2
State Key Joint Laboratory of Environmental Simulation and Pollution Control, International Joint Laboratory for Regional Pollution Control, Ministry of Education (IJRC), College of Environmental Sciences and Engineering, Peking University, Beijing 100871, China
3
Collaborative Innovation Center of Atmospheric Environment and Equipment Technology, School of Environmental Science and Engineering, Nanjing University of Information Science & Technology, Nanjing 210044, China
*
Authors to whom correspondence should be addressed.
Atmosphere 2023, 14(1), 94; https://doi.org/10.3390/atmos14010094
Submission received: 2 December 2022 / Revised: 19 December 2022 / Accepted: 20 December 2022 / Published: 31 December 2022
(This article belongs to the Special Issue Chemical Composition and Sources of Particles in the Atmosphere)

Abstract

:
Intermediate volatility organic compounds (IVOCs) and semi-volatile organic compounds (SVOCs) have recently been proposed as important precursors of secondary organic aerosol (SOA). In the present work, 97 volatile organic compounds (VOCs) and 80 intermediate volatility and semi-volatile organic compounds (IVOCs and SVOCs) were measured by online gas chromatography-mass spectrometer/flame ionization detection (GC-MS/FID), and offline thermal desorption gas chromatography-mass spectrometer (TD-GC-MS), respectively. The average concentration of speciated VOCs, IVOCs, and SVOCs were 22.36 ± 9.02 μg m−3, 1.01 ± 0.32 μg m−3, and 0.10 ± 0.17 μg m−3. Alkanes and polycyclic aromatic hydrocarbons (PAHs) are the main compounds of total S/IVOCs. With the increase in molecular weight, the concentrations decreased in the gas phase, while increasing in the particle phase. Vehicular emission is the most significant source according to the carbon preference index (CPI) and the carbon of the most abundant alkane (Cmax). The yield method was used to estimate SOA from the oxidation of VOCs and S/IVOCs. The estimated SOA mass from IVOCs and SVOCs (0.70 ± 0.57 μg m−3) was comparable to that of VOCs (0.62 ± 0.61 μg m−3), and the oxidation of PAHs and alkanes took up 28.70 ± 8.26% and 51.97 ± 20.77% of the total SOA estimation, respectively. Compared to previous work, our study provided detailed molecular information of ambient S/IVOC species and elucidated their importance on SOA formation. Despite their low concentration, S/IVOCs species are important SOA precursors which shared comparable contribution compared with VOCs.

1. Introduction

Fine particulate matter (PM) pollution is becoming an important environmental problem faced by China’s sustainable development [1,2], especially in rapidly developing megacities. Organic aerosols (OA) are a crucial component of fine particle matter, which accounts for 20~90% of fine particle matter mass. It has been reported that OA has a great impact on air quality, climate change, and human health [3,4]. OA can be derived from direct emissions, i.e., primary organic aerosol (POA), or be formed from the complex chemical reactions of gas precursors, i.e., second organic aerosol (SOA). The mass fraction of SOA in OA can reach as high as more than 60%, which is a crucial part of atmospheric particles [5]. However, there is a significant gap between the model simulation and the field observation of SOA. SOA is highly underestimated due to the unclear mechanisms of SOA and the absence of precursors [6,7,8,9].
Laboratory experiments and field observation have found that intermediate volatility organic compounds (IVOCs) and semi-volatility organic compounds (SVOCs) have high SOA yields, such as long-chain n-alkanes, polycyclic aromatic hydrocarbons (PAHs), and single-ring aromatics [10,11,12,13]. These compounds are mainly from different sources, e.g., vehicular emissions, cooking emissions [14], and the use of volatile chemical products (VCPs). S/IVOCs can improve the simulation capability of the SOA model. In the SOA simulations in the Yangtze River Delta region, IVOCs enhanced SOA mass by 5~26% [15]; Yang.et.al [16] found that the enhancement of IVOCs could reduce the gap between the model and the field observation. The oxidation IVOCs and SVOCs play an important role in SOA formation. However, knowledge about the molecular composition of S/IVOCs, and SOA production of S/IVOCs, especially in the North China Plain (NCP), is still limited. In this study, we measured and identified 80 S/IVOCs in Beijing. Alkanes, PAHs, aromatics, nitrogen-containing compounds, halogenated compounds, siloxanes, and phthalates esters (PAEs) were included. 97 VOCs were also measured, which were implemented to estimate the ambient SOA formation. The yield method was applied to estimate SOA formation from oxidation VOCs, IVOCs, and SVOCs in fall Beijing.

2. Materials and Methods

2.1. Measurement Location

The measurements were conducted at an urban site at the Peking University atmosphere Environment monitoring Station (PKUERS; 39°59′21 N,116°18′25 E). The location of the site is shown in Figure S1 (Supplementary Material). Detailed information for this site can be found in the previous work [17,18]. The sampling site is representative of the urban environment of Beijing.
18 gas-phase and 8 particle-phase S/IVOC samples were collected from September 11th September to 6th October 2020. The sampling duration of each sample range from 8:00 AM to the next day at 8:00 AM. Throughout the observation period, the concentration of PM2.5 (PM10) was 34.76 ± 19.45 μg m−3 (48.63 ± 25.90 μg m−3), and air quality was mostly excellent (24 h average concentration of PM2.5 < 35 μg m−3, PM10 < 75 μg m−3) or good (24 h average concentration of PM2.5 < 50 μg m−3, PM10 < 150 μg m−3), with only light pollution on 26 and 28 September 2020. PM2.5, PM10, CO, SO2, NO2, O3, and meteorological data are exhibited in Figure S2.

2.2. Measurement of VOCs and S/IVOCs

Ambient VOC samples were measured by using an online gas chromatography-mass spectrometer/flame ionization detection (GC-MS/FID) system (Shimadzu, QP-2010S) with an original time resolution of 1 h, following the EPA TO-15 method (U.S. EPA, 1999). The VOC data were converted to mass concentration (μg m−3) and averaged according to the sample time of S/IVOCs. The system consists of a cryogen-free cooling unit, which features the function of concentrating VOCs species and removing H2O and CO2, a separation unit, and two detectors (MS and FID detectors). When the concentrated sample was injected into the separation unit, it was switched into two channels. C2-C5 Hydrocarbons were separated by a PLOT-Al2O3 column (15 m × 0.32 mm × 6.0 mm ID, J&W Scientific) in channel I and analyzed by an FID detector. Meanwhile, C5-C12 non-methane hydrocarbons (NMHCs), C3-C6 carbonyl compounds, and C1-C2 halocarbons were separated by a DB-624 column (60 m × 0.25 mm × 1.4 mm, J&W Scientific) and analyzed by a quadrupole MS detector (MSD, QP-2010S, Shimadzu, Japan). A total of 97 VOC species, including 28 alkanes, 12 alkenes and alkynes, 16 aromatics, 28 halocarbons, and 13 oxygenated VOCs (OVOCs) were analyzed in this study. More detailed information about species can be found in previous work [19].
The gas-phase and particle-phase S/IVOC samples were collected through a custom-made sampling system as shown in Figure S3. Ambient air passed through an inert steel pipe at a total flow rate of 10 L/min to a 47 mm quartz filter (Whatman®- Sigma-Aldrich), which was used to collect particulate matter. The flow was split into three paths, among which two passed through two desorption tubes (Gerstel 6 mm OD, 4.5 mm ID glass tube filled with ∼290 mg Tenax TA) at a flow rate of 0.5 L/min to collect gaseous constituents. The excess air was bypassed with a flow of 9 L/min. The quartz filters were baked at 550 °C for 6 h to remove all the contaminations. All the samples were stored at −20 °C after sampling until being analyzed.
The Tenax TA samples (gas phase) were directly analyzed by thermal desorption (Gerstel, TDS-C506) gas chromatography-mass spectrometer (Shimadzu, GCMS-TQ8050) (TD-GC-MS) system. The quartz filter (particle phase) was punched into 4 mm round pieces and deposited into empty tubes (Gerstel 6 mm OD, 4.5 mm ID glass tube), and then analyzed by the TD-GC-MS system. The organics were thermally desorbed from the tube inside a Gerstel thermal desorption unit (Thermal desorption system, TDS3, Gerstel) at a splitless flow mode with a helium flow of 50 mL/min. During the thermal desorption, the temperature of the TDS3 was ramped from 30 to 280 °C at a rate of 60 °C/min and isothermally held at 280 °C for 5 minutes. Organics desorbed from each tube were enriched by a Gerstel-cooled injection system (CIS4) at −90 °C. After the thermal desorption, organics enriched by the CIS were thermally injected into GC-MS with a split ratio of 15 by heating the CIS from −90 to 320 °C at a rate of 12 °C/s followed by an isothermally hold at 320 °C for 10 min. The column (Shimadzu SH-Rtx-5 MS, 30 m × 0.25 mm × 0.25 μm) temperature was ramped from 60 °C to 320 °C at a rate of 5 °C/min followed by an isothermal hold for 5 min. The GC was operated at a constant column flow (helium) of 1.2 mL/min. The MS was operated in scanning mode from m/z 33 to 500 at an electron ionization of 70 eV. The mass acquisition rate was 33 Hz.

2.3. Quantification of S/IVOCs

The S/IVOCs are identified based on retention time on Total Ions Current (TIC), and the mass spectrogram in the National Institute of Standards and Technology (NIST) library. Previous studies have found a linear relationship between the retention time of hydrocarbons and effective saturation concentrations [20]. Because n-alkanes are distributed in S/IVOCs and the effective saturation concentrations of n-alkanes increase with the increase of carbon number, TIC was divided into 25 bins (B12~B36) according to the retention time of n-alkanes (C12~C36).
A standard mixture of 56 S/IVOCs species was used for the quantification. Deuterated terphenyl of known concentration was injected into the tube before analysis to calibrate the instrument. A serial concentration gradient (7 levels: 1.0, 2.0, 4.0, 5.0, 6.0, 8.0, 10.0 μg mL−1) for each target S/IVOC species was used to plot the calibration curves. The correlation coefficients (R2) of calibration curves were >0.99 for all species. The measurement accuracy of each species was within 5%. Due to the diversity of organic compounds in the ambient environment, it is impossible to quantify all the S/IVOCs by external standards. The compounds without standards are semi-quantified. Given the assumption that organic compounds in the same volatility bin have similar chemical properties, the semi-quantified S/IVOCs are calibrated by surrogates of standards in the same volatility bins.

2.4. Estimated SOA Formation

The SOA mass from measured VOC and S/IVOC species was estimated by Equation (1) [21,22].
Δ M S O A , i = [ H C i ] × { 1 e k O H , i [ O H ] Δ t e k O H , i [ O H ] Δ t } × Y i
where [HCi] is the measured concentration of SOA precursor i (μg m−3); Yi is the SOA yield of the precursor, and kOH i is its reaction rate constant with OH radicals (cm3 molecule−1 s−1); [OH] is the OH radical concentration; Δt is the OH exposure time. The OH exposure, [OHt (molecules cm−3 s), is estimated by the ratio of ethylbenzene to m/p-xylene at 12:00–15:00 when the photooxidation ability is the strongest of a day [13,23].
The OH reaction rate constant kOH for each compound was taken from [24,25] or estimated based on a structure-reactivity relationship [26]. SOA yield for each compound was taken from several published smog chamber experiments [22,27,28,29]. The semi-quantified S/IVOCs are calibrated by surrogates of standards in the same volatility bins.

2.5. Diagnostic Parameters and Gas-Particle Partitioning

Many diagnostic parameters have been applied to identify anthropogenic or biogenic sources. Previous studies have used the carbon preference index (CPI), the carbon number of the most abundant n-alkanes (Cmax) [30].
CPI index is defined as the ratio of total odd n-alkanes to the total even n-alkanes over the same range of carbon numbers, which identifies the anthropogenic or biogenic sources. The CPI index can be calculated by Equation (2). It has been shown that plant emissions are dominant when CPI > 5. When CPI is close to 1, anthropogenic sources originating from fossil fuel combustions are predominant.
C P I = i = 1 N C o d d j = 1 M C e v e n
Cmax represents the carbon number of the most abundant n-alkanes.
Furthermore, the ratio of particle-phase fraction (φ) in the S/IVOCs was calculated by the following equation, Where Cp and Cg were the concentration of S/IVOCs.
φ = C p C p + C g

3. Results

3.1. Molecular Composition and Volatility of Ambient Organic Compounds

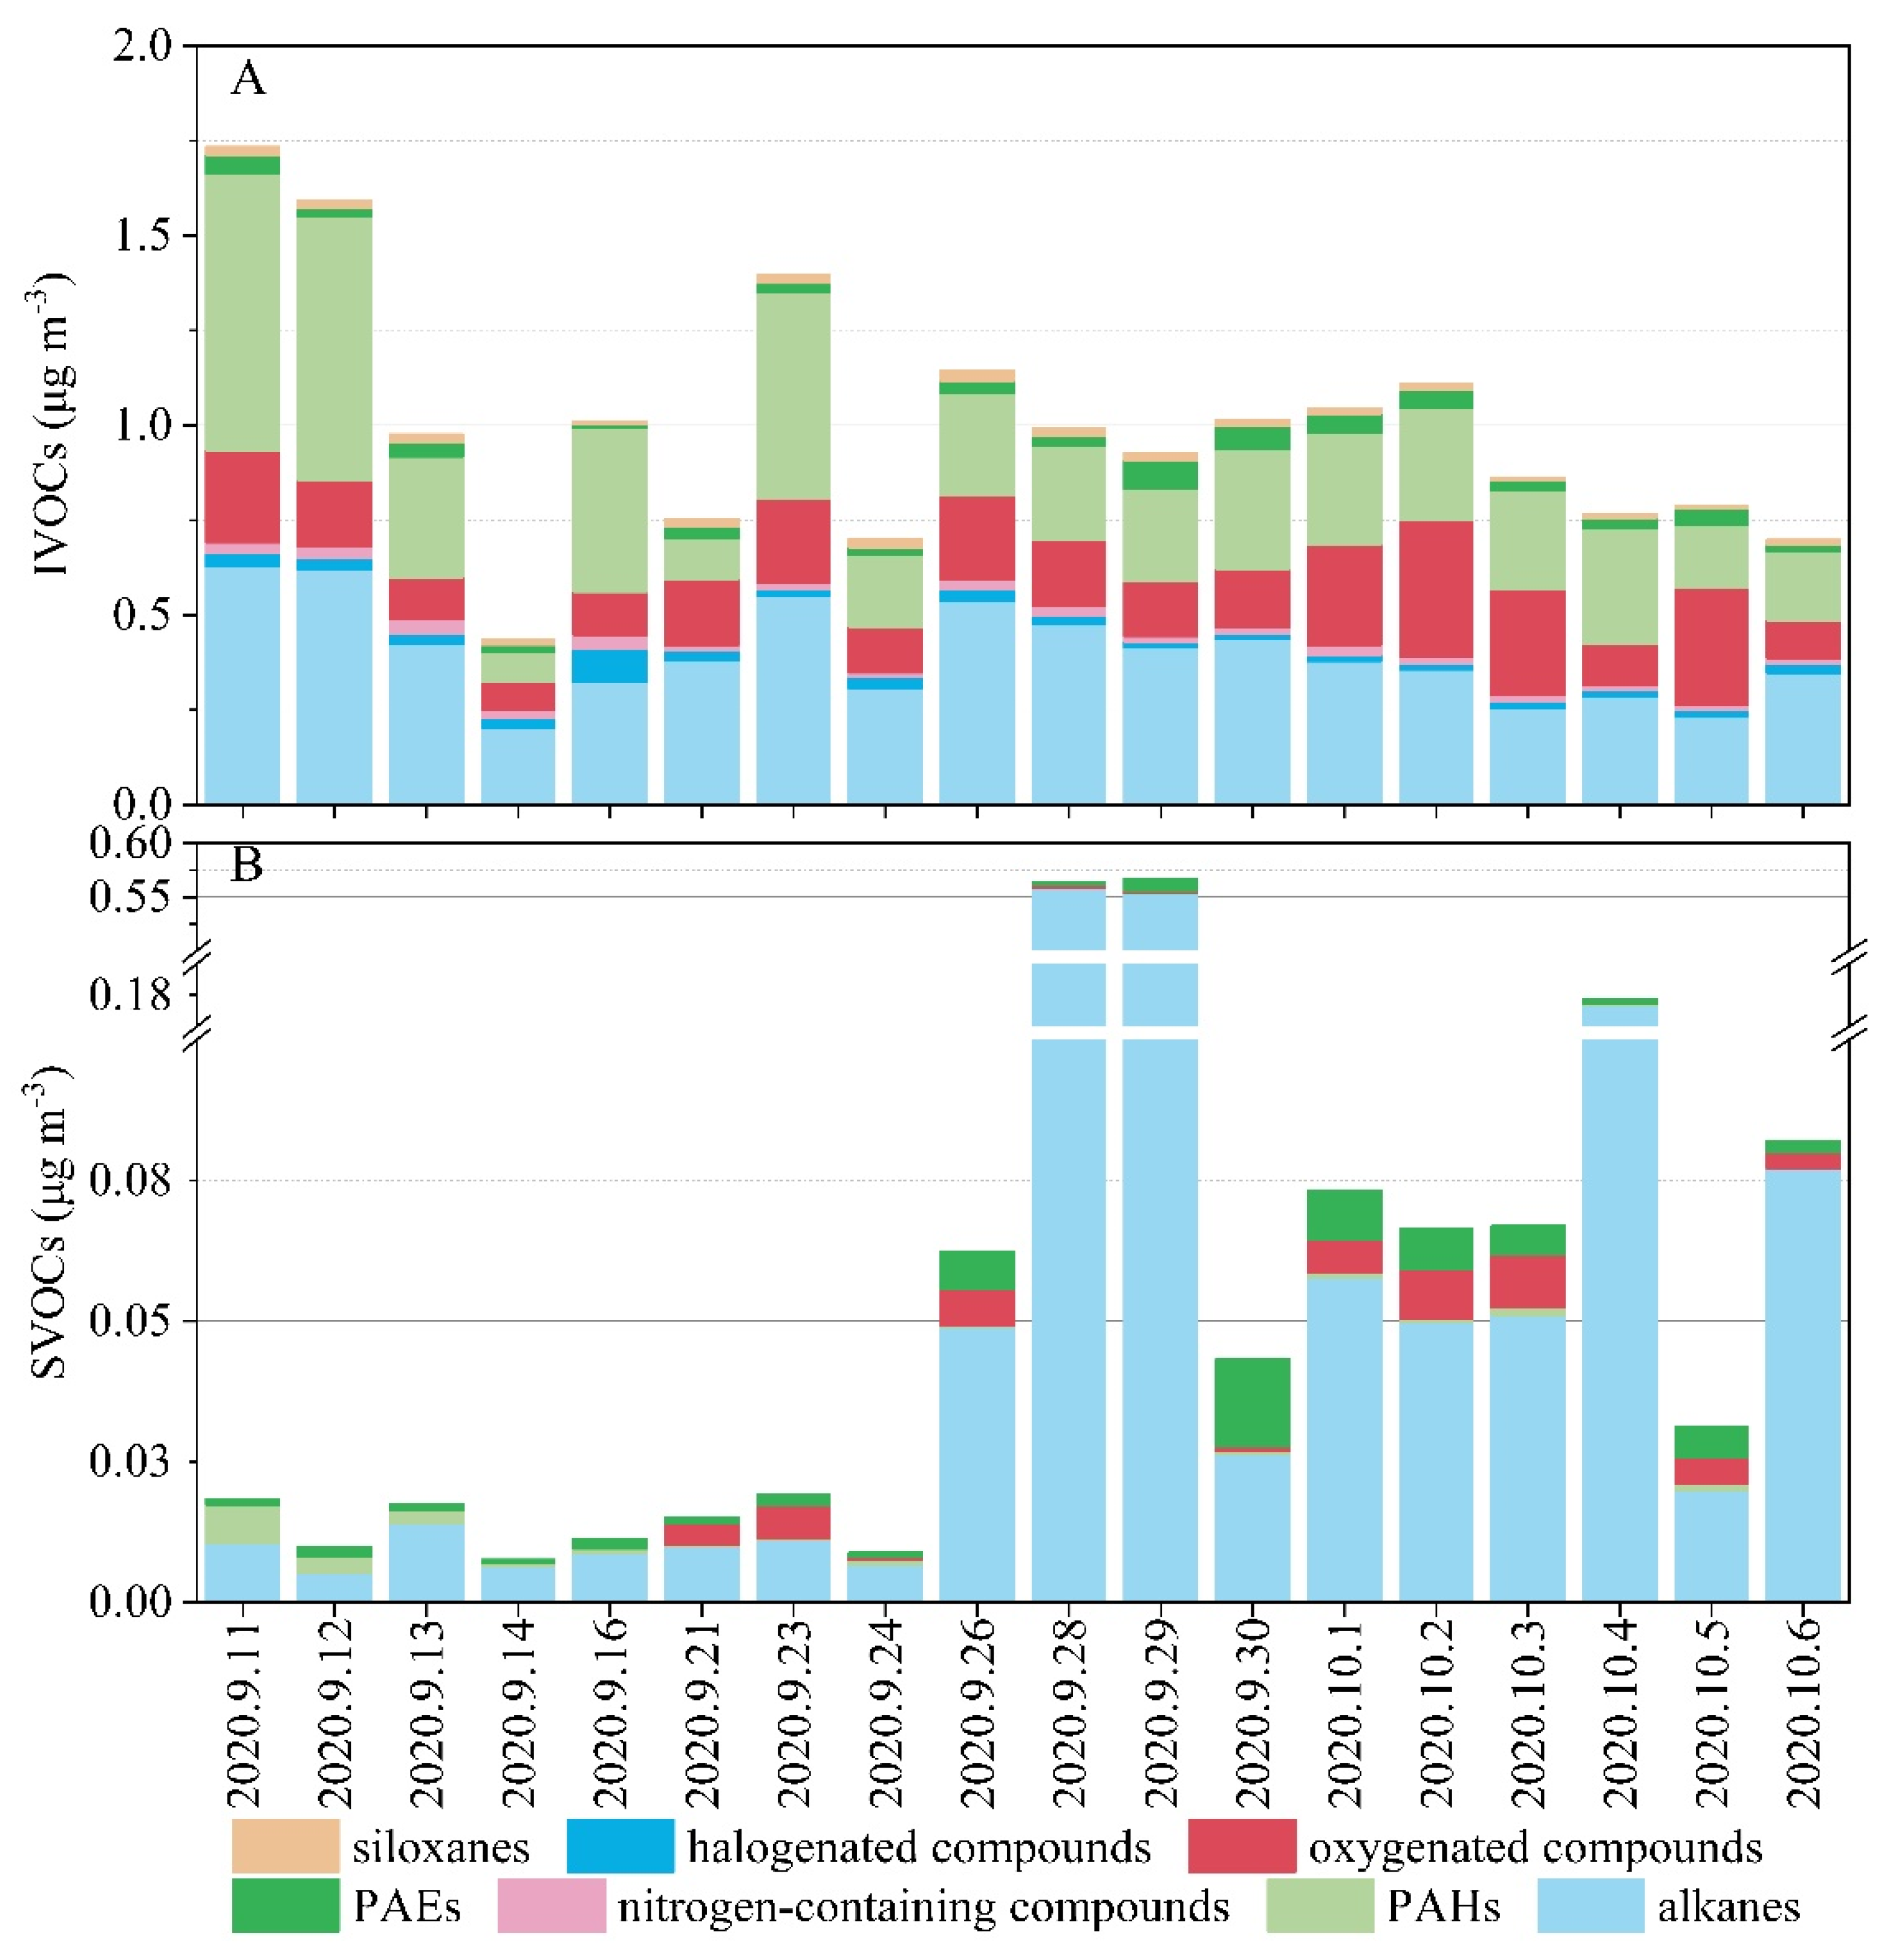
3.1.1. Total S/IVOCs

VOCs, IVOCs, and SVOCs were sampled from 11 September to 6 October 2020. Total IVOCs were 7.56 ± 3.50 μg m−3 (1.41~13.51 μg m−3), comparable with previous study shown in Table 1, Pasadena, California in CalNex (6.3 ± 1.9 μg m−3), and Yangshan Port during the G20 period (5.1 ± 0.8 μg m−3) [31], but lower than Shanghai in winter (35.1 ± 16.1 μg m−3). The concentration of SVOCs was lower than that of IVOCs by about 0.18 ± 0.34 μg m−3 (0.01~1.12 μg m−3), close to the report in Istanbul (7.1~80.8 and 55.3~204.2, PAHs and n-alkanes).
The average concentration of speciated compounds (including n-alkanes, PAHs, oxygenated compounds, nitrogen-containing compounds, phthalate esters, and siloxanes) was 1.01 ± 0.32 μg m−3, and 0.10 ± 0.17μg m−3, taking up 12.70%, and 57.05% of total IVOCs and SVOCs concentration. The concentration of quantified IVOCs was within the range of 0.43~1.73 μg m−3, with alkanes, PAHs, and oxygenated compounds accounting for nearly 90% concentration. Alkanes accounted for more than 75% of the total SVOC concentration. Furthermore, 28 and 29 September 2020, alkanes accounted for nearly 100% of SVOCs. It can be found that from September 27 to September 29 air quality reaches light pollution levels (a short-term pollution process). UCMs (Unresolved Complex Mixture, including b-alkanes and other UCM) still took up a large part of the S/IVOCs 9.19% and 75.16% of the total S/IVOC concentrations.

3.1.2. Speciated S/IVOCs

The identified S/IVOCs compounds were C12-C36 n-alkanes, 2 b-alkanes, 9 oxygenated compounds (2 alcohols and 9 acids), 12 halogenated compounds, 5 nitrogen-containing compounds, 15 PAHs, 6 PAEs, and 2 siloxanes. The detailed concentrations of IVOCs and SVOCs are shown in Table S2. Naphthalene (158.93 ± 156 ng m−3) was the most abundant in S/IVOCs, which is higher than the previous study by Feng.et.al [34] (90.4 ± 23.1 ng m−3). In addition, C13, C14, nonanoic acid, and n-hexadecanoic acid were also abundant in mass concentration. The time series of concentrations of speciated S/IVOCs during sampling episodes is shown in Figure 1. Alkanes, were the most abundant compounds in IVOCs, followed by PAHs, accounting for 39.73% and 31.58%, respectively. Furthermore, oxygenated compounds, PAEs, halogenated compounds, nitrogen-containing compounds, and siloxanes, according for nearly 30% of IVOCs mass concentration. Alkanes and PAHs have comparable concentrations with a previous study in London [35].
Concentrations of oxygenated compounds (alkanols and fatty acids) were 0.22 μg m−3 (19.57%), lower than alkanes and PAHs, which should not be ignored. 2 alkanols and 4 fatty acids were measured, which may be related to cooking emissions [36]. PAEs, siloxanes, and some halogenated compounds were also known as VCPs. Despite conventional emissions such as vehicle exhaust, VCPs have become an important unconventional source of SOA [37,38,39]. However, halogenated compounds take up only 5.6% part of the total IVOCs mass while PAEs and siloxanes with a proportion of 4.2%. Speciated SVOCs, alkanes, PAEs, oxygenated compounds, and PAHs accounted for 0.10 μg m−3. Alkanes took up nearly 80% of SVOCs, while the rest part divided equally between phthalates, oxygenated compounds, and PAHs.

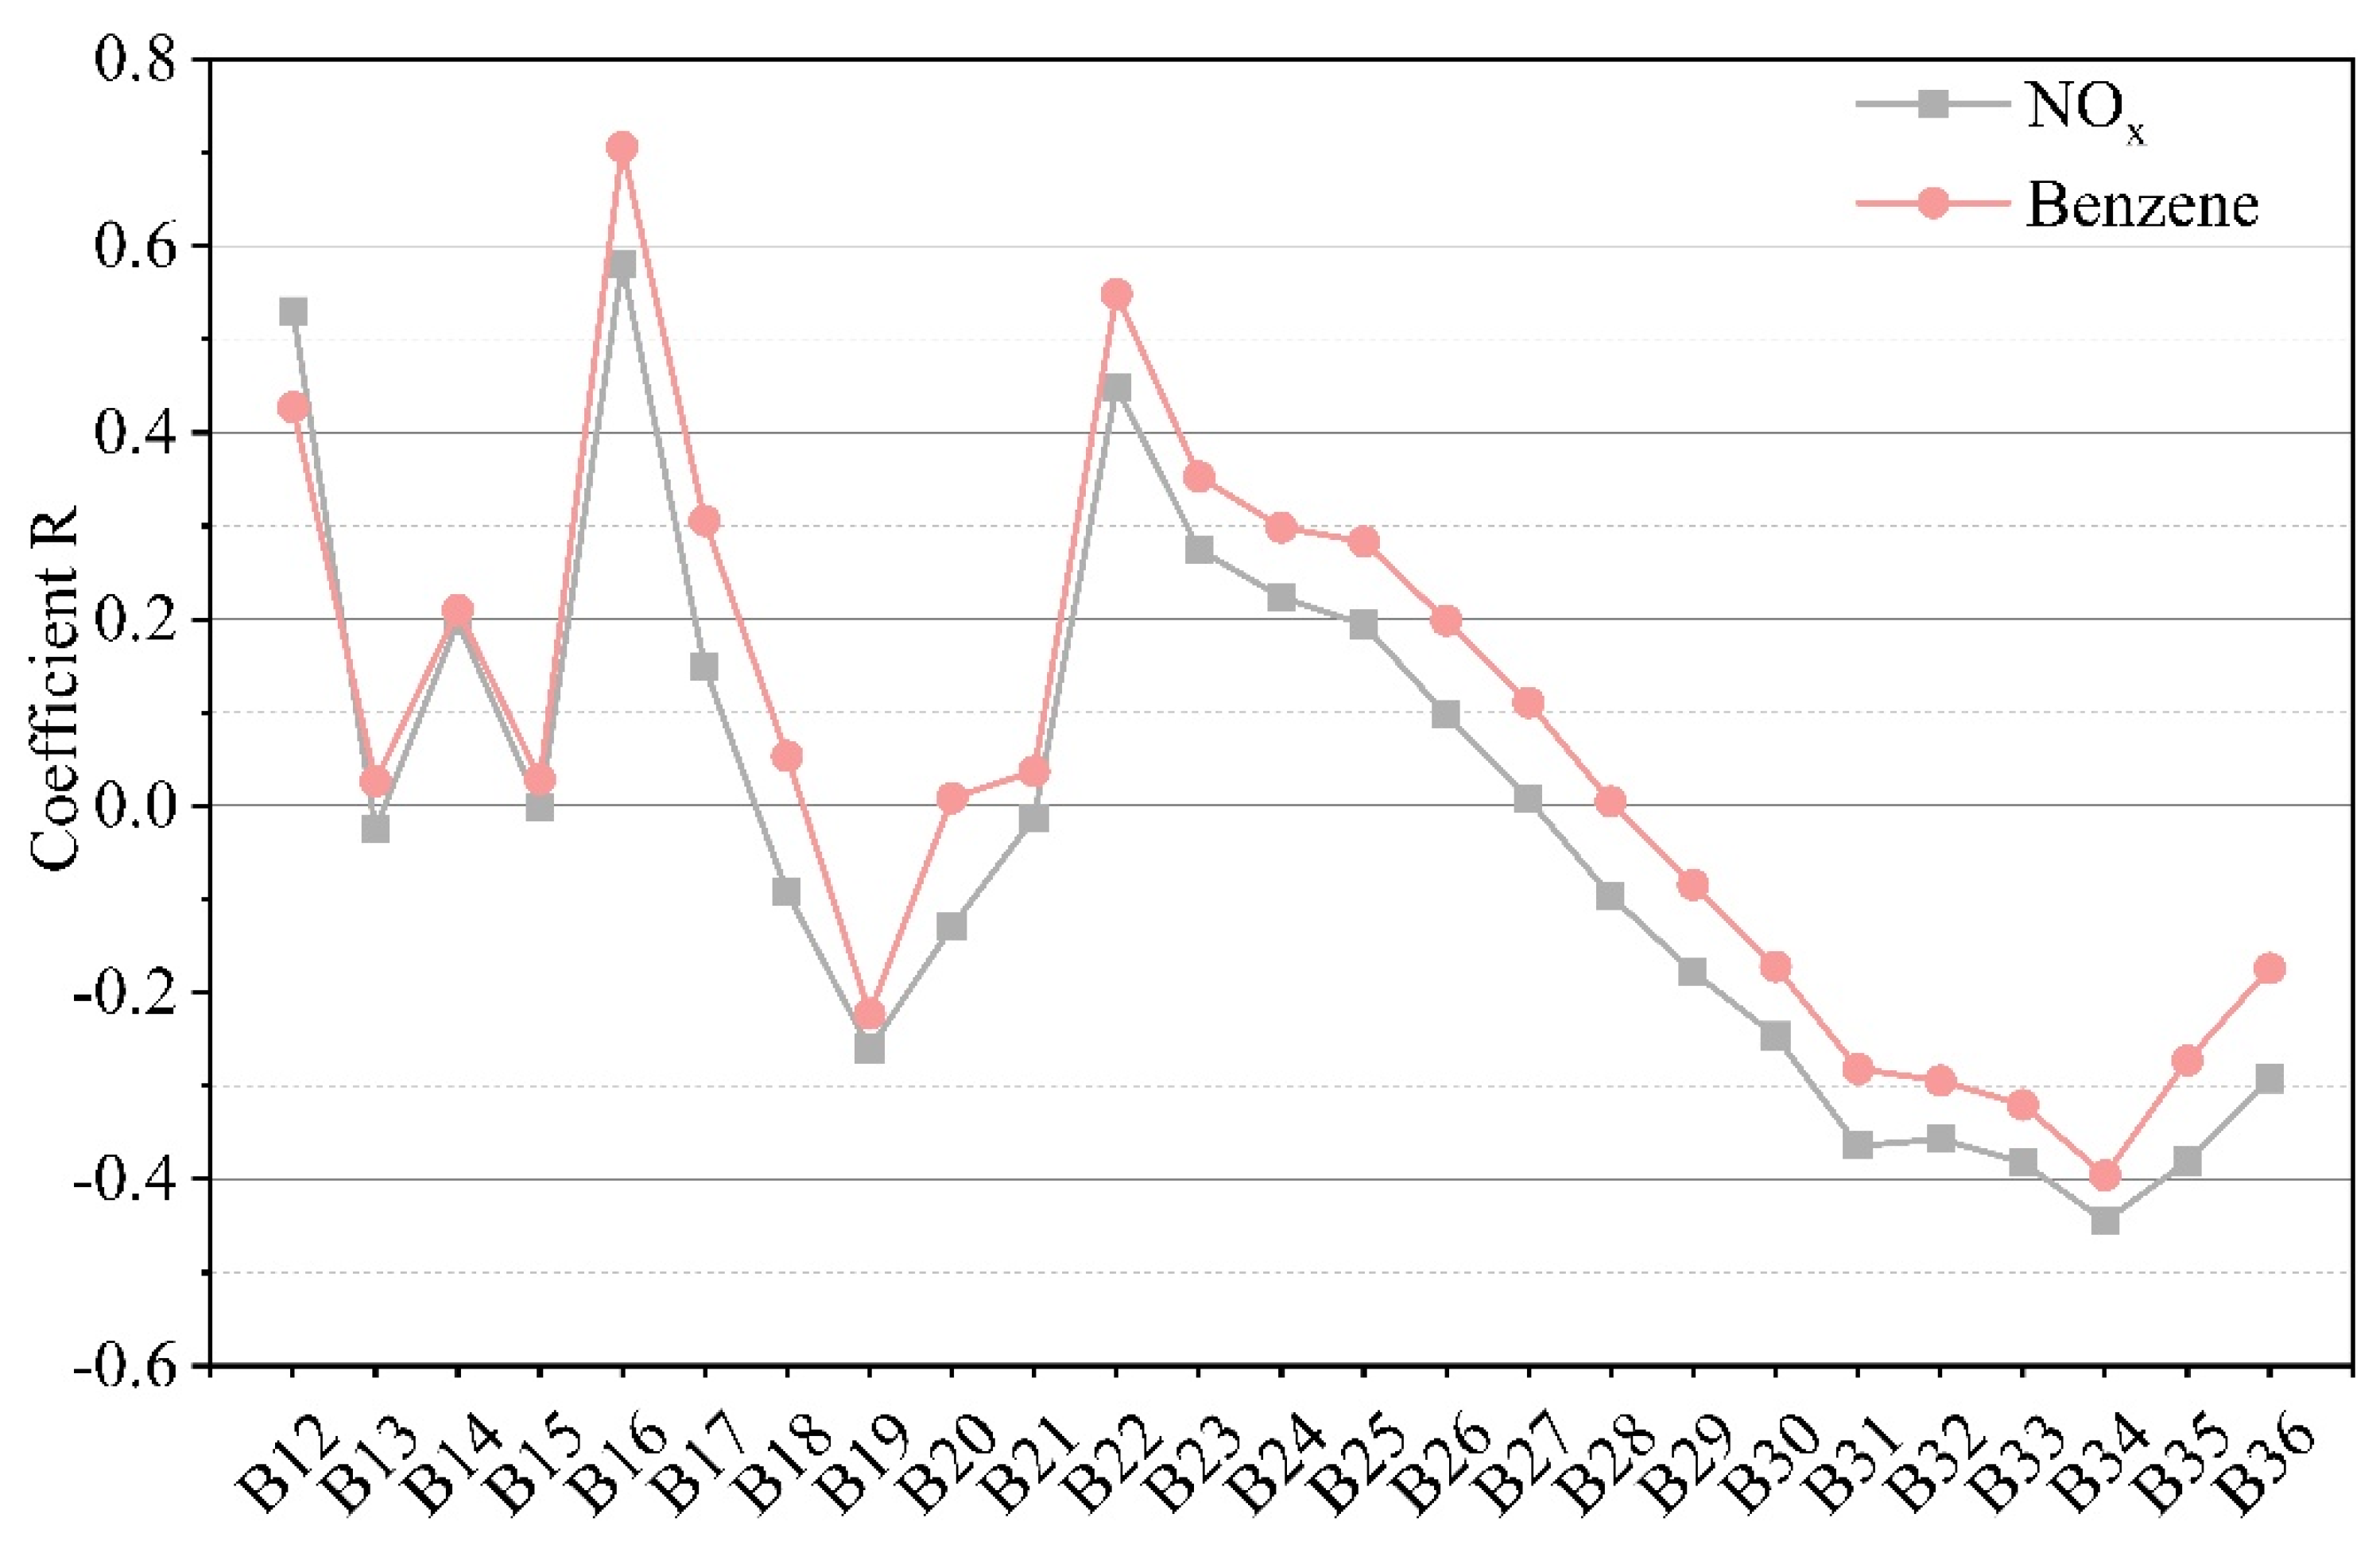
3.2. Correlations with Traffic Source

Harrison et al. [40] used NOx as an indicator of diesel vehicle emissions, and the occurrence of NOX increased in a cold start [41]. Benzene was used to trace the sources of S/IVOC [42]. Correlations (coefficient R) between the S/IVOC (gas-phase and particle-phase) concentration, and NOx and benzene as a function of the carbon number are shown in Figure 2.
B12, B16, and B22 compounds have the highest correlations with benzene and NOx than other bins. n-alkanes and PAHs are the dominant compounds in these bins, as they are the indispensable mass fraction observed in diesel and gasoline vehicle emissions [43,44], indicating vehicle emission origins of B12, B16, and B22 compounds. Coefficient R decreases with the increase of carbon numbers and may be affected by biogenic-oriented sources such as plant wax [35]. The PKUER near the North Fourth Ring Road in Beijing has larger vehicle flux, and S/IVOCs emitted by vehicular emission can be considered as the main source.
The correlations of S/IVOC components with gas pollutants and atmospheric conditions were further carried out. Some air pollutants have been monitored during the same period, such as PM (PM2.5 and PM10), O3, SO2, and CO. Total S/IVOC also shows the highest correlation with PM2.5 (0.76), PM10 (0.76), and O3 (0.73). PM and O3 have a significant impact on total S/IVOC, similar to the research results in Shanghai [32]. S/IVOC does not suppress O3 formation, based on simulated urban air reactive organic gas (ROG) mixtures chamber results confirming some IVOC could enhance O3 formation [45]. Moreover, the temperature (0.48) may be considered an important factor, the concentration of S/IVOCs increase with temperature. Relative humidity (0.26) and wind speed (0.22) have little correlation with the concentration of S/IVOCs.

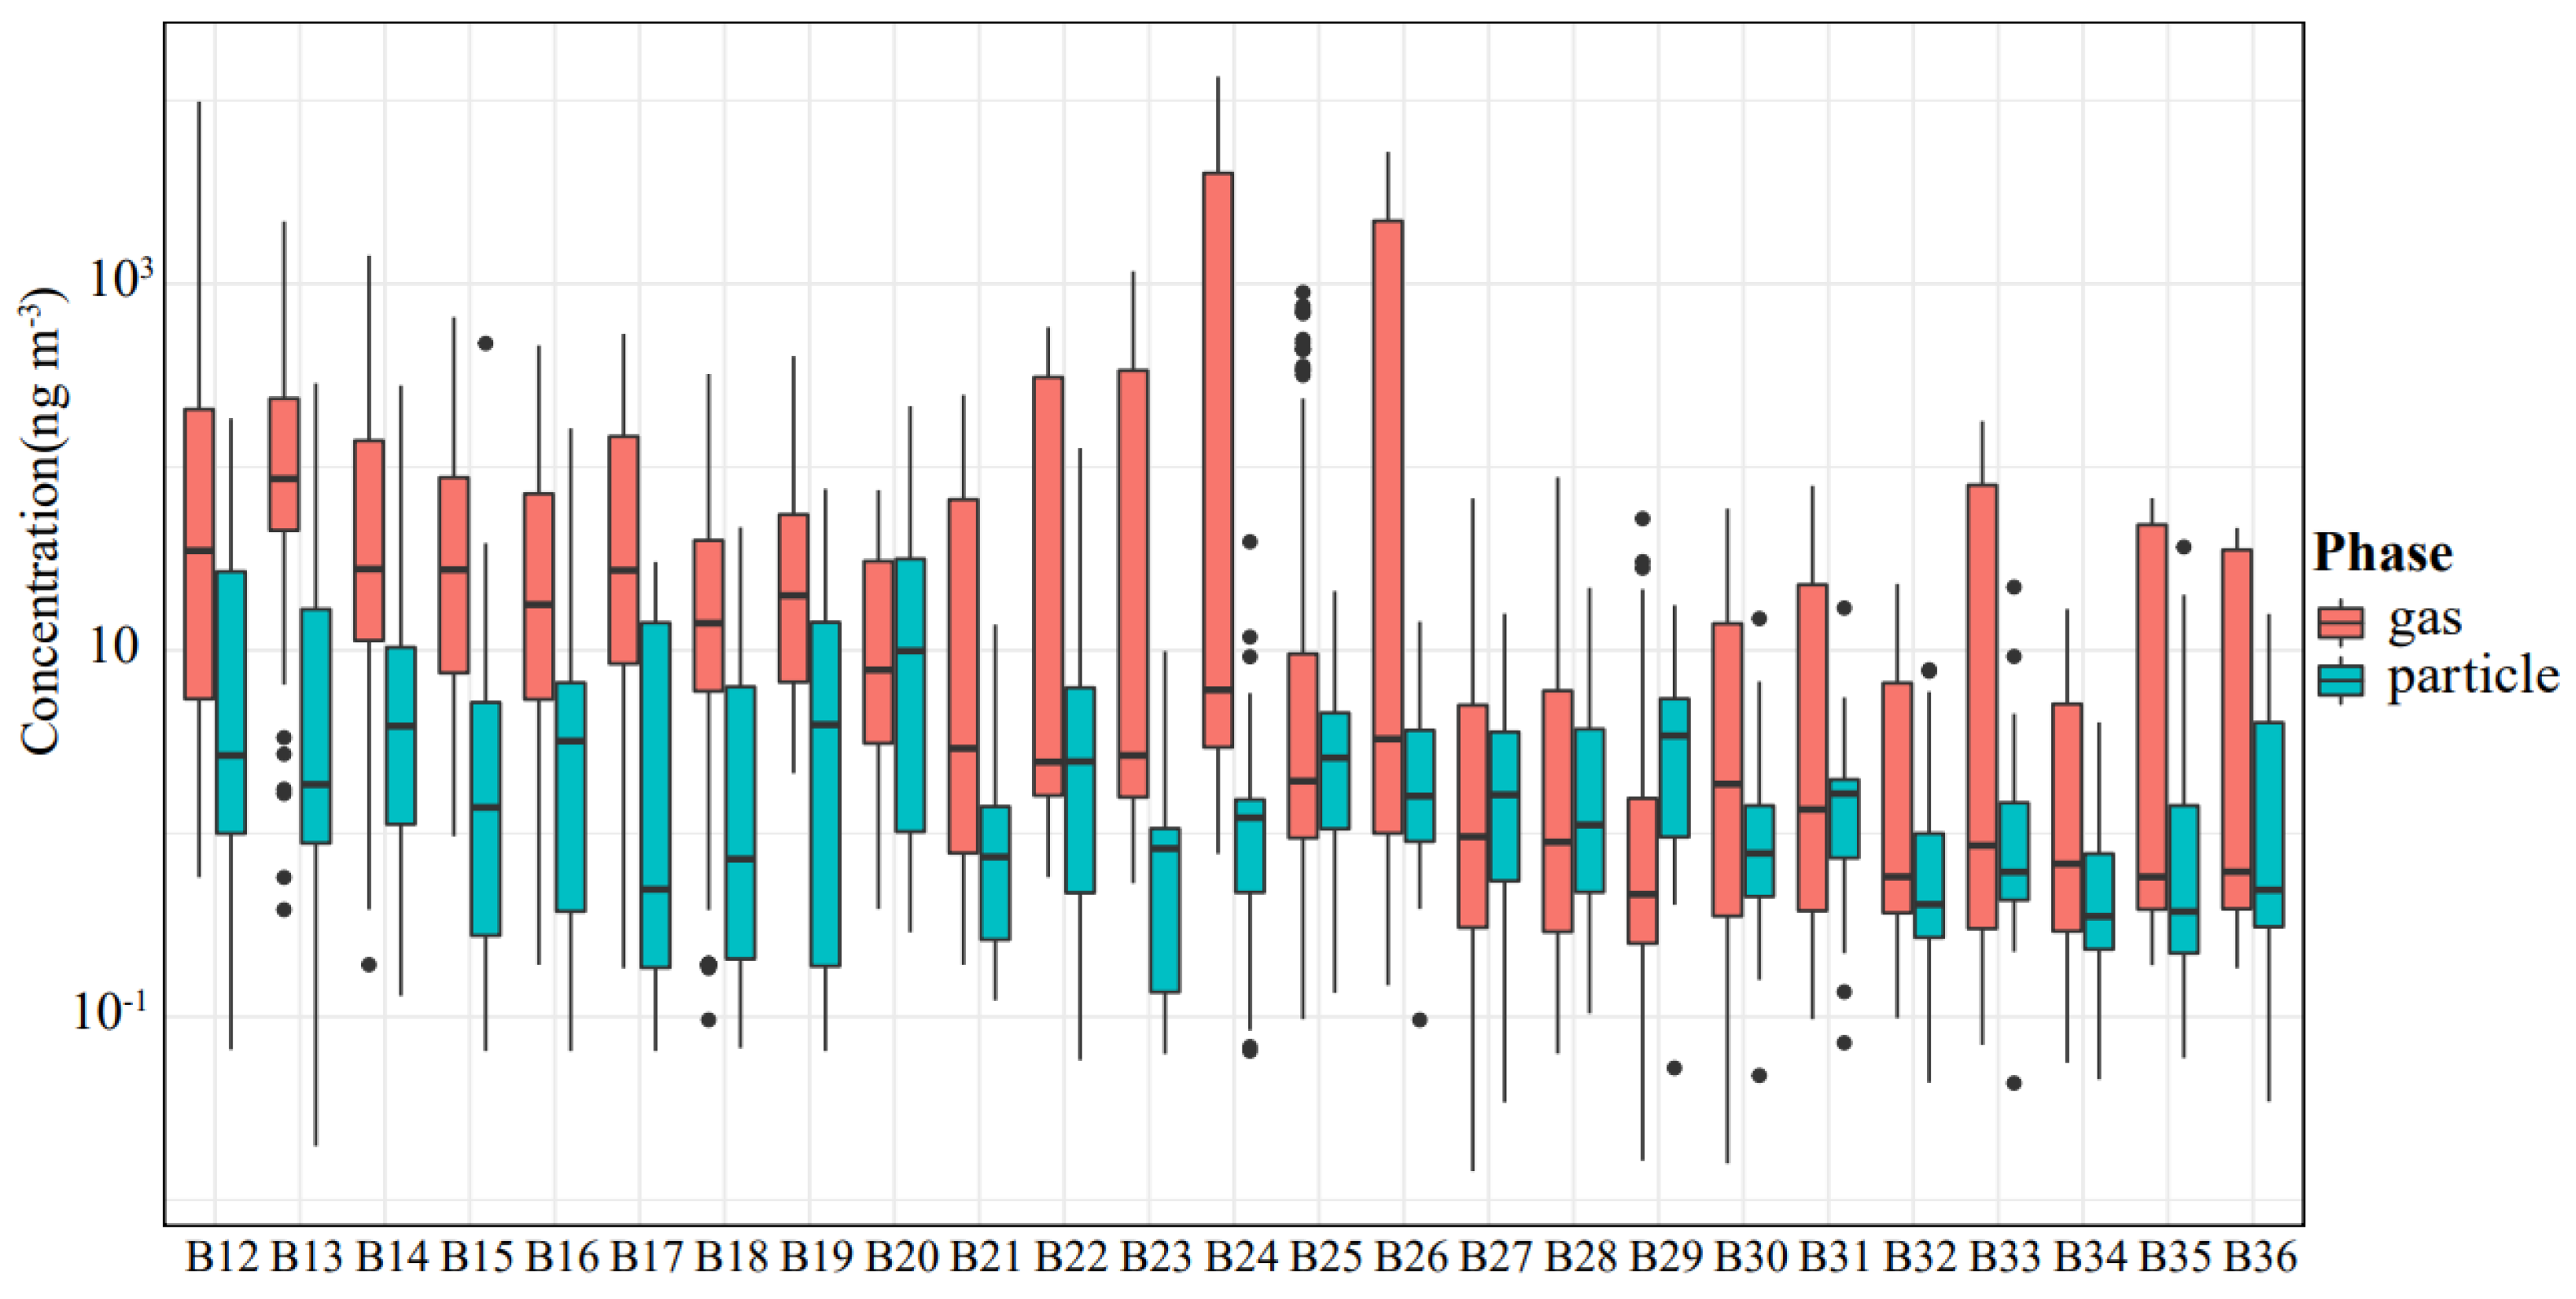
3.3. Diagnostic Parameters and Gas-Particle Partitioning of S/IVOCs

Gas-particle partitioning is an important factor of S/IVOC behavior in the atmosphere and could affect the transport of S/IVOCs. The average concentration of S/IVOCs in the gas phase was higher than that in the particle phase, especially in volatility bins from B12 to B24, while the concentrations of gas-phase compounds in the B25 to B36 range were comparable with those in the particle phase (Figure 3).
The particle-phase fraction (φ) of S/IVOCs is calculated by Equation (3). With the increase in molecular weight, the particle-phase fractions increased significantly. Some compounds with high molecule weight, such as PAEs, and 3 and 4-ring PAHs, have a higher φ value than 50%.
The average mass concentrations of the n-alkanes from C12 to C36 that co-existed in both gas and particle phases were from 0.50 to 91.46 ng m−3 and 0.28 to 5.93 ng m−3, respectively. The φ value of C12 to C22 n-alkanes ranges from 0.2% to 20.9%, and 0.9% to 94.6% in C23 to C36. CPI values and carbon of the most abundant alkane (Cmax) were calculated, which also as an indicator to illustrate the organic source [35,46]. The CPI value in the gas phase is close to 1 with a range from 0.79 to 1.11 (0.93 ± 0.08) with Cmax at C13. Gas-phase pollutants were mainly influenced by vehicular emissions and other anthropogenic emissions, similar to a previous study in central London [35]. The CPI in the particle phase was higher than that in the gas phase with a CPI range from 1.25 to 2.78 (1.66 ± 0.52) with Cmax at C23. Particle-phase pollutants are not only influenced by vehicular emission but also influenced by biogenic emissions, such as plant wax, which emits higher molecular weight n-alkanes with odd carbon number predominance.
The φ range of short-chain alkanes C12~C22 varied between 0.2% and 37.0%, and between 0.9% and 94.6% in long-chain alkanes, respectively. The results were similar to the study of Han.et.al [31], who calculated φ of C22~C24 between 21.2% and 62.5%. The average temperature ranged from 13.4 °C to 17.7 °C, and humidity was between 28.2% and 68.7% during the sampling period. The short-chain alkanes showed negative correlations with temperature (r = −0.45) and humidity (r = −0.69), but the long-chain alkanes showed only negative correlations with humidity (r = −0.46) and insignificant correlations with temperature.
The concentration of PAHs in urban air can range from 10 to 4700 ng m−3 [47], in this study total concentration of PAHs in S/IVOCs is less than n-alkanes. The occurrence of PAHs was 0.25 to 228.45 ng m−3 in the gas phase and 0.09 to 2.41 ng m−3 in the particle phase, respectively. Naphthalene is an important SOA precursor, and higher levels of naphthalene have been observed at urban sites significantly affected by vehicles [22,48]. The measured concentration of naphthalene in this study was 230.90 ng m−3, in the range of representative urban concentration (10 to 820 ng m−3) [47], but higher than the previous study in the Pearl River Delta region (94 ng m−3) [34].
Only nine species of the detected PAHs were distributed in both the gas phase and particle phase. It can be seen that as the number of rings of PAHs increases, the φ value also increases gradually. PAHs are insignificantly positively related to temperature and negatively related to humidity (−0.77). However, some high molecular mass PAHs (e.g., pyrene and chrysene) have high φ (>40%) regardless of temperature and humidity. Similar to the φ values in previous studies calculated by Han.et.al [30] and Xie.et.al [49] for PAHs.

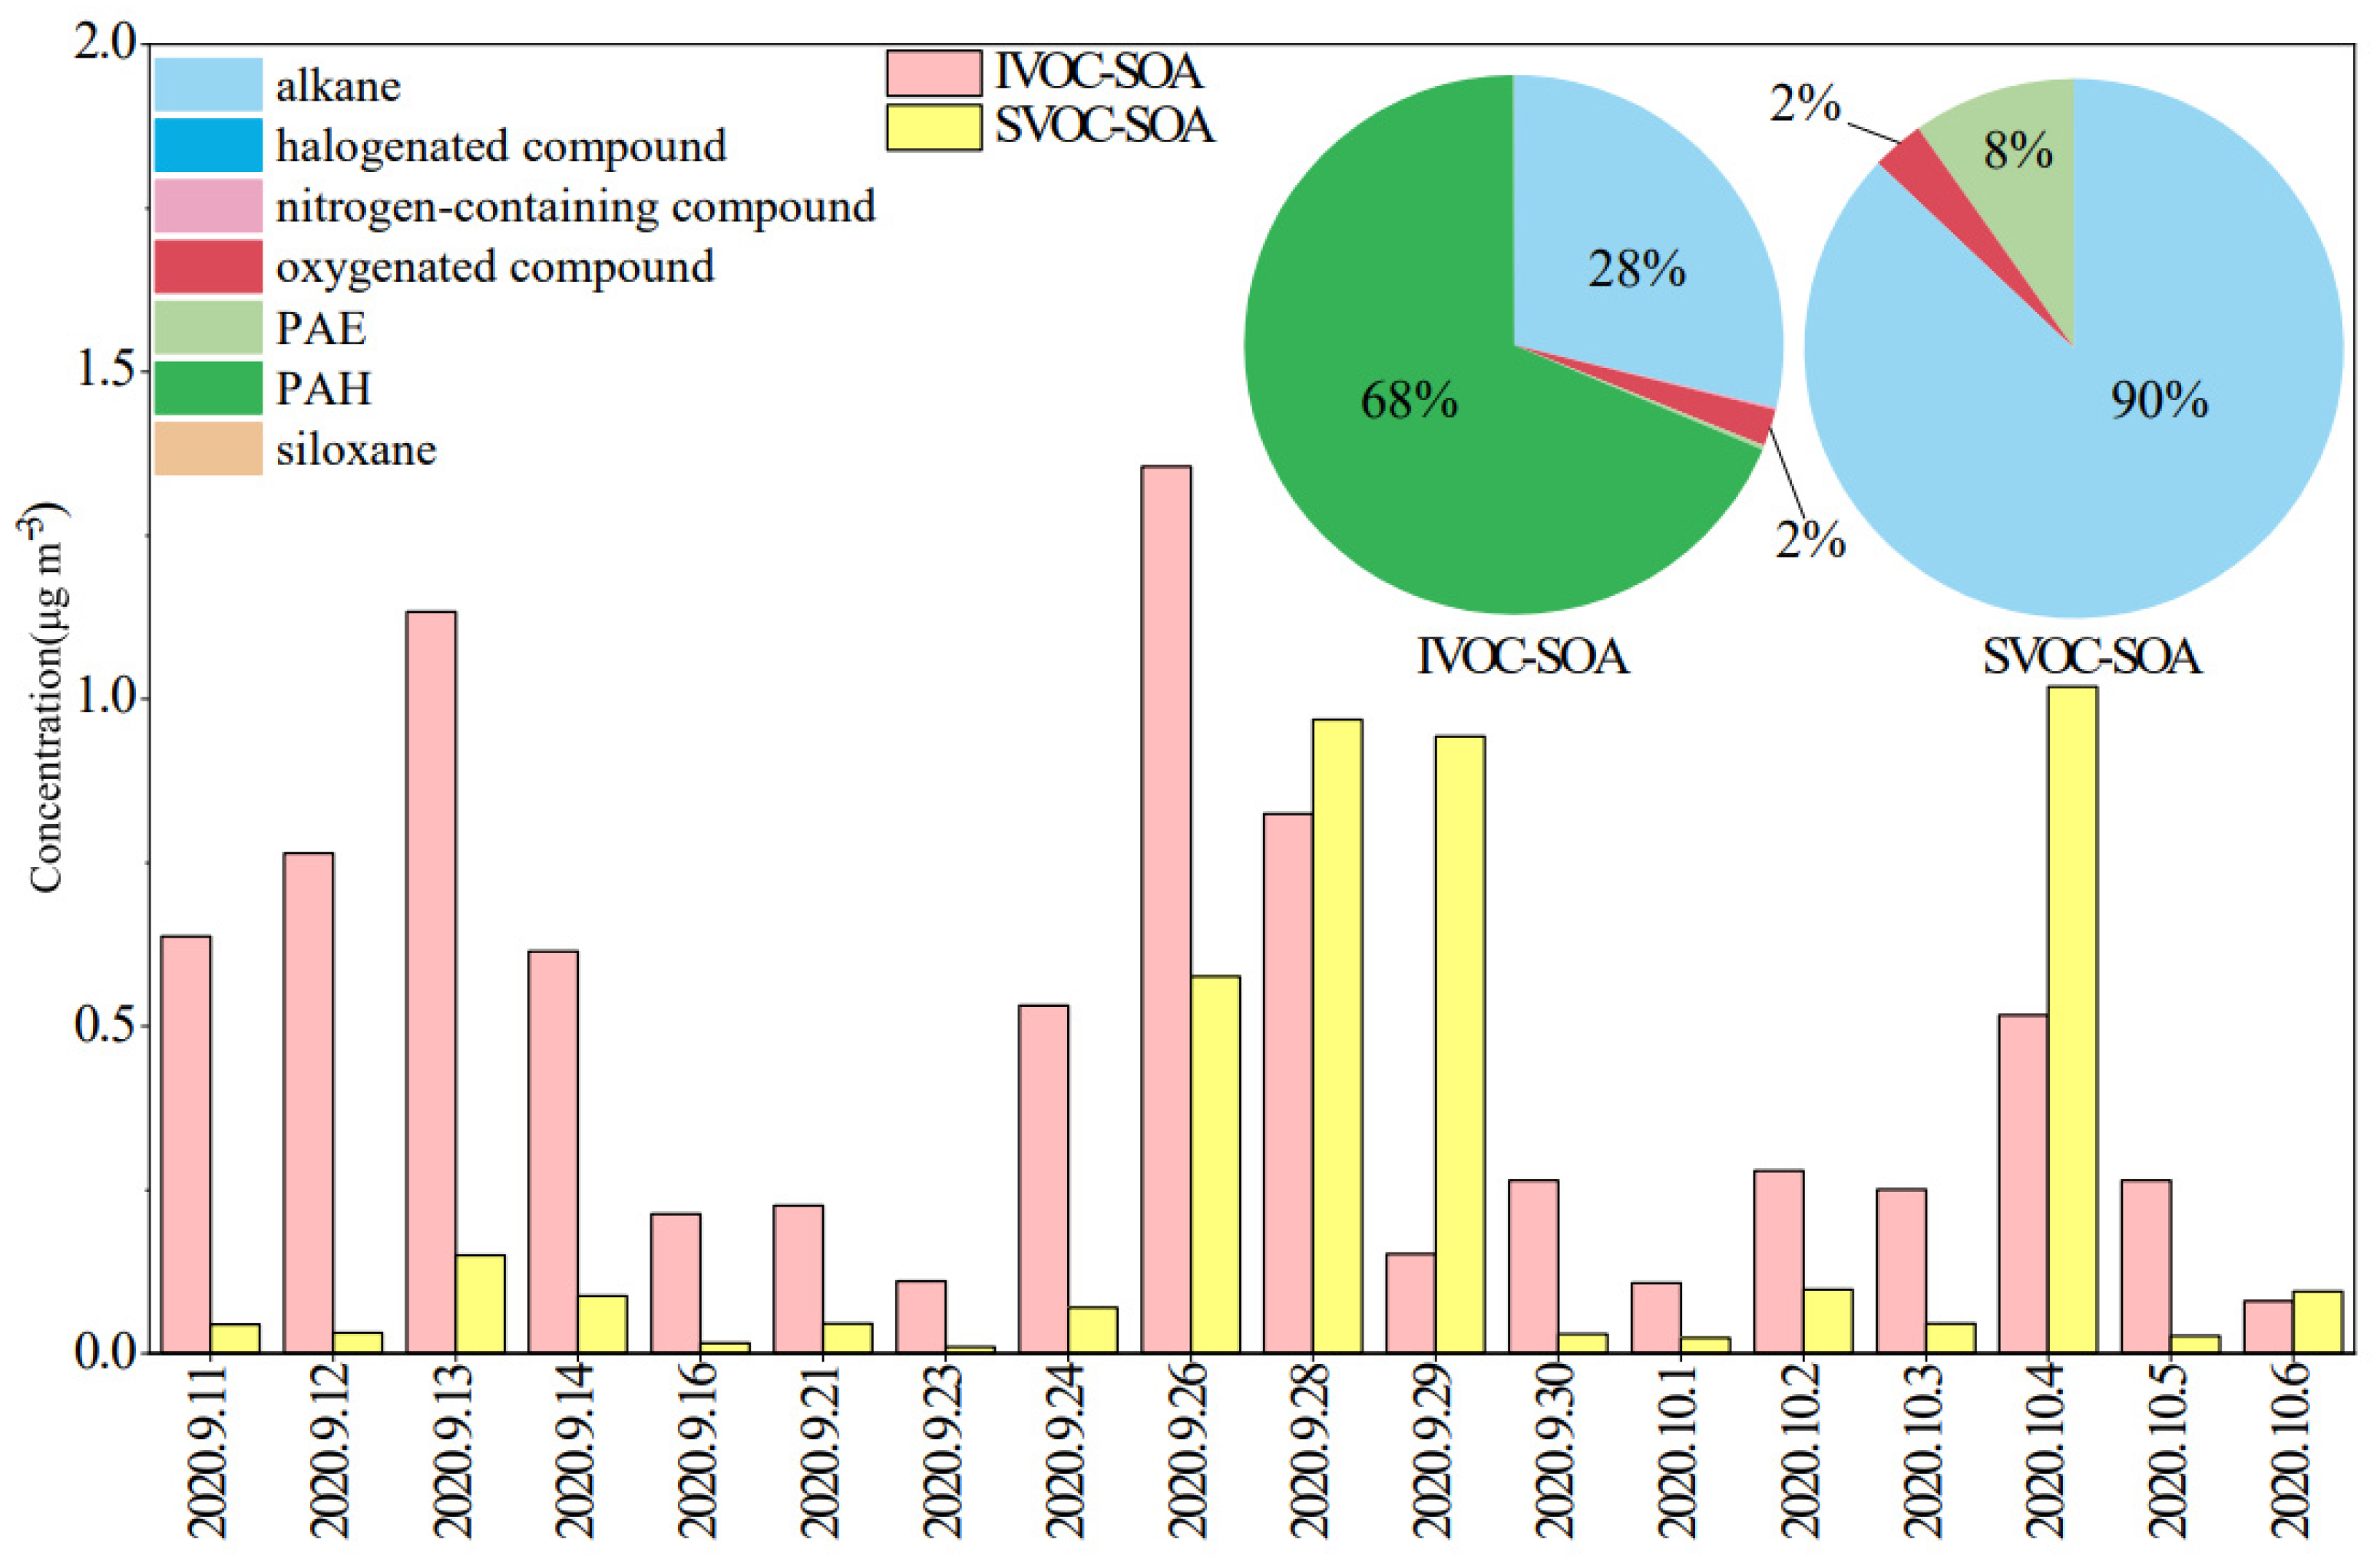
3.4. SOA Estimation from the Oxidation of VOCs and S/IVOCs

SOA was estimated using a bottom-up yield method. The total estimated SOA mass concentration of VOCs, IVOCs, and SVOCs were 0.62 ± 0.61, 0.46 ± 0.36, and 0.24 ± 0.35 μg m−3. Interestingly, the average SOA estimated from S/IVOCs accounted for 53% of the total estimated SOA, although their mass concentration was only 5% of VOCs. The oxidation of n-alkanes and PAHs contributed the most to SOA mass, accounting for 28.70 ± 8.26% and 51.97 ± 20.77% of total SOA. Due to their low SOA yield, oxygenated compound, halogenated compound, nitrogen-containing compound, siloxane, and PAE only contribute 0.78% and 0.12% of the total estimated SOA mass from IVOC and SVOC.
The mass concentration of SOA from the oxidation of IVOC, and SVOC precursors were shown in Figure 4. Previous studies have found that alkanes and single aromatics were important precursors to SOA in a laboratory experiment, alkanes and aromatics accounted for 52~75% of measurement SOA on low NOX and 26~60% on high NOx in the laboratory experiment [10]. In addition, PAHs and alkanes contributed to 68.70 ± 8.81% and 28.70 ± 21.18% of the total mass of IVOC-SOA, respectively. Differently, n-alkanes were the dominant precursors for SVOC-SOA, with a contribution of 89.92 ± 14.81%. The oxidation of PAHs contributed only 8.32% to the SVOC-SOA. In total, PAHs were the major precursors of SOA in urban Beijing due to their higher SOA yield than that of n-alkanes under high NOx conditions [50]. A large number of vehicles in Beijing will increase NOx concentration, and increase the SOA mass from PAHs. Alkanes and PAHs from vehicular emission indicated that mobile source is still an important source accounting for the formation of SOA.

4. Conclusions

VOCs, IVOCs, and SVOCs species in Beijing were measured from 11th September to 6th October 2020. The average concentration of speciated VOCs, IVOCs, and SVOCs were 22.36 ± 9.01 μg m−3, 1.01 ± 0.32 μg m−3, and 0.10 ± 0.17 μg m−3. Judging from the gas-particle partitioning of IVOCs and SVOCs, the speciated species distribute more in the particle phase and less in the gas phase with a decrease in volatility. The concentration of total S/IVOC has a higher correlation with vehicular emission tracers, indicating that vehicular may be the dominant source. CPI and Cmax show that IVOCs and SVOCs mainly originated from vehicular emissions. The estimated SOA mass from IVOCs and SVOCs was comparable to that of VOCs. Alkanes and PAHs are important S/IVOC precursors, which took up 28.70% and 51.97% of the total SOA formation. Although the mass proportions of S/IVOCs are only 5%, their contribution to SOA estimation is almost the same as VOCs, demonstrating that it is urgent to measure S/IVOC species in megacities for a better understanding of urban SOA formation.

Supplementary Materials

The following are available online at https://www.mdpi.com/article/10.3390/atmos14010094/s1, Table S1. The concentration of speciated IVOCs. Table S2. The concentration of speciated SVOCs. Figure S1. The location of the sample site. Figure S2. Gaseous pollutants and meteorological conditions during the observation period. Figure S3. Schematic diagram of gas and particle phase sampling device.

Author Contributions

Methodology, Y.Z. and K.S.; validation, Y.Z., K.S., Y.G., D.L., Z.W., C.Z. and T.L.; formal analysis, Y.Z. and K.S.; writing—original draft preparation, Y.Z.; writing—review and editing, Y.Z., J.F., K.S. and S.G.; supervision, S.G.; L.Z., S.C. and S.L.; funding acquisition, S.G. All authors have read and agreed to the published version of the manuscript.

Funding

The work was funded by This research is supported by the National Natural Science Foundation of China (No. 91844301, 41977179), the special fund of State Key Joint Laboratory of Environment Simulation and Pollution Control (No. 22Y01SSPCP).

Institutional Review Board Statement

Not applicable.

Informed Consent Statement

Informed consent was obtained from all subjects involved in the study.

Data Availability Statement

Data are available upon request from the corresponding author.

Acknowledgments

The authors are sincerely grateful for the support of the National Natural Science Foundation of China.

Conflicts of Interest

The authors declare no conflict of interest.

References

  1. Huang, R.; Zhang, Y.; Bozzetti, C.; Ho, K.; Cao, J.; Han, Y.; Daellenbach, K.R.; Slowik, J.G.; Platt, S.M.; Canonaco, F.; et al. High secondary aerosol contribution to particulate pollution during haze events in China. Nature 2014, 514, 218–222. [Google Scholar] [CrossRef] [Green Version]
  2. Guo, S.; Hu, M.; Zamora, M.L.; Peng, J.; Shang, D.; Zheng, J.; Du, Z.; Wu, Z.; Shao, M.; Zeng, L.; et al. Elucidating severe urban haze formation in China. Proc. Natl. Acad. Sci. USA 2014, 111, 17373–17378. [Google Scholar] [CrossRef] [PubMed] [Green Version]
  3. Kanakidou, M.; Seinfeld, J.H.; Pandis, S.N.; Barnes, I.; Dentener, F.J.; Facchini, M.C.; van Dingenen, R.; Ervens, B.; Nenes, A.; Nielsen, C.J.; et al. Organic aerosol and global climate modelling: A review. Atmos. Chem. Phys. 2005, 5, 1053–2005. [Google Scholar] [CrossRef] [Green Version]
  4. Fuzzi, S.; Baltensperger, U.; Carslaw, K.; Decesari, S.; Denier Van Der Gon, H.; Facchini, M.C.; Fowler, D.; Koren, I.; Langford, B.; Lohmann, U.; et al. Particulate matter, air quality and climate: Lessons learned and future needs. Atmos. Chem. Phys. 2015, 15, 8217–8299. [Google Scholar] [CrossRef] [Green Version]
  5. Zhang, Q.; Jimenez, J.L.; Canagaratna, M.R.; Allan, J.D.; Coe, H.; Ulbrich, I.; Alfarra, M.R.; Takami, A.; Middlebrook, A.M.; Sun, Y.L.; et al. Ubiquity and dominance of oxygenated species in organic aerosols in anthropogenically-influenced Northern Hemisphere midlatitudes. Geophys. Res. Lett. 2007, 34. [Google Scholar] [CrossRef] [Green Version]
  6. Presto, A.A.; Miracolo, M.A.; Donahue, N.M.; Robinson, A.L. Secondary organic aerosol formation from high-NO(x) photo-oxidation of low volatility precursors: N-alkanes. Environ. Sci. Technol. 2010, 44, 2029–2034. [Google Scholar] [CrossRef] [PubMed]
  7. Yao, T.; Li, Y.; Gao, J.; Fung, J.C.H.; Wang, S.; Li, Y.; Chan, C.K.; Lau, A.K.H. Source apportionment of secondary organic aerosols in the Pearl River Delta region: Contribution from the oxidation of semi-volatile and intermediate volatility primary organic aerosols. Atmos. Environ. 2020, 222, 117111. [Google Scholar] [CrossRef]
  8. Robinson, A.L.; Donahue, N.M.; Shrivastava, M.K.; Weitkamp, E.A.; Sage, A.M.; Grieshop, A.P.; Lane, T.E.; Pierce, J.R.; Pandis, S.N. Rethinking Organic Aerosols: Semivolatile Emissions and Photochemical Aging. Science 2007, 315, 1259–1262. [Google Scholar] [CrossRef]
  9. Wan, Z.; Song, K.; Zhu, W.; Yu, Y.; Wang, H.; Shen, R.; Tan, R.; Lv, D.; Gong, Y.; Yu, X.; et al. A Closure Study of Secondary Organic Aerosol Estimation at an Urban Site of Yangtze River Delta, China. Atmosphere 2022, 13, 1679. [Google Scholar] [CrossRef]
  10. Hu, W.; Huaishan, Z.; Wei, C.; Yuqing, Y.; Tianle, P.; Yingkun, W.; Wei, S.; Huina, Z.; Wei, D.; Ming, Z.; et al. Oxidation Flow Reactor Results in a Chinese Megacity Emphasize the Important Contribution of S/IVOCs to Ambient SOA Formation. Environ. Sci. Technol. 2021, 56, 6880–6893. [Google Scholar] [CrossRef]
  11. Presto, A.A.; Miracolo, M.A.; Kroll, J.H.; Worsnop, D.R.; Robinson, A.L.; Donahue, N.M. Intermediate-Volatility Organic Compounds: A Potential Source of Ambient Oxidized Organic Aerosol. Environ. Sci. Technol. 2009, 43, 4744–4749. [Google Scholar] [CrossRef] [PubMed]
  12. Liu, Y.; Li, Y.; Yuan, Z.; Wang, H.; Sha, Q.E.; Lou, S.; Liu, Y.; Hao, Y.; Duan, L.; Ye, P.; et al. Identification of two main origins of intermediate-volatility organic compound emissions from vehicles in China through two-phase simultaneous characterization. Environ. Pollut. 2021, 281, 117020. [Google Scholar] [CrossRef] [PubMed]
  13. Zhao, Y.; Hennigan, C.J.; May, A.A.; Tkacik, D.S.; de Gouw, J.A.; Gilman, J.B.; Kuster, W.C.; Borbon, A.; Robinson, A.L. Intermediate-Volatility Organic Compounds: A Large Source of Secondary Organic Aerosol. Environ. Sci. Technol. 2014, 48, 13743–13750. [Google Scholar] [CrossRef] [PubMed]
  14. Song, K.; Guo, S.; Gong, Y.; Lv, D.; Zhang, Y.; Wan, Z.; Li, T.; Zhu, W.; Wang, H.; Yu, Y.; et al. Impact of cooking style and oil on semi-volatile and intermediate volatility organic compound emissions from Chinese domestic cooking. Atmos. Chem. Phys. 2022, 22, 9827–9841. [Google Scholar] [CrossRef]
  15. Huang, L.; Wang, Q.; Wang, Y.; Emery, C.; Zhu, A.; Zhu, Y.; Yin, S.; Yarwood, G.; Zhang, K.; Li, L. Simulation of secondary organic aerosol over the Yangtze River Delta region: The impacts from the emissions of intermediate volatility organic compounds and the SOA modeling framework. Atmos. Environ. 2021, 246, 118079. [Google Scholar] [CrossRef]
  16. Yang, W.; Li, J.; Wang, W.; Li, J.; Ge, M.; Sun, Y.; Chen, X.; Ge, B.; Tong, S.; Wang, Q.; et al. Investigating secondary organic aerosol formation pathways in China during 2014. Atmos. Environ. 2019, 213, 133–147. [Google Scholar] [CrossRef]
  17. Tang, R.; Wu, Z.; Li, X.; Wang, Y.; Shang, D.; Xiao, Y.; Li, M.; Zeng, L.; Wu, Z.; Hallquist, M.; et al. Primary and secondary organic aerosols in summer 2016 in Beijing. Atmos. Chem. Phys. 2018, 18, 4055–4068. [Google Scholar] [CrossRef] [Green Version]
  18. Guo, S.; Hu, M.; Guo, Q.; Zhang, X.; Zheng, M.; Zheng, J.; Chang, C.C.; Schauer, J.J.; Zhang, R. Primary Sources and Secondary Formation of Organic Aerosols in Beijing, China. Environ. Sci. Technol. 2012, 46, 9846–9853. [Google Scholar] [CrossRef]
  19. Lv, D.; Lu, S.; He, S.; Song, K.; Shao, M.; Xie, S.; Gong, Y. Research on accounting and detection of volatile organic compounds from a typical petroleum refinery in Hebei, North China. Chemosphere 2021, 281, 130653. [Google Scholar] [CrossRef]
  20. Presto, A.A.; Hennigan, C.J.; Nguyen, N.T.; Robinson, A.L. Determination of Volatility Distributions of Primary Organic Aerosol Emissions from Internal Combustion Engines Using Thermal Desorption Gas Chromatography Mass Spectrometry. Aerosol Sci. Technol. 2012, 46, 1129–1139. [Google Scholar] [CrossRef]
  21. Ensberg, J.J.; Hayes, P.L.; Jimenez, J.L.; Gilman, J.B.; Kuster, W.C.; de Gouw, J.A.; Holloway, J.S.; Gordon, T.D.; Jathar, S.; Robinson, A.L.; et al. Emission factor ratios, SOA mass yields, and the impact of vehicular emissions on SOA formation. Atmos. Chem. Phys. 2014, 14, 2383–2397. [Google Scholar] [CrossRef] [Green Version]
  22. Chan, A.W.H.; Kautzman, K.E.; Chhabra, P.S.; Surratt, J.D.; Chan, M.N.; Crounse, J.D.; Kürten, A.; Wennberg, P.O.; Flagan, R.C.; Seinfeld, J.H. Secondary organic aerosol formation from photooxidation of naphthalene and alkylnaphthalenes: Implications for oxidation of intermediate volatility organic compounds (IVOCs). Atmos. Chem. Phys. 2009, 9, 3049–3060. [Google Scholar] [CrossRef] [Green Version]
  23. Yu, Y.; Wang, H.; Wang, T.; Song, K.; Tan, T.; Wan, Z.; Gao, Y.; Dong, H.; Chen, S.; Zeng, L.; et al. Elucidating the importance of semi-volatile organic compounds to secondary organic aerosol formation at a regional site during the EXPLORE-YRD campaign. Atmos. Environ. 2021, 246, 118043. [Google Scholar] [CrossRef]
  24. Atkinson, R.; Arey, J. Atmospheric Degradation of Volatile Organic Compounds. Chem. Rev. 2003, 103, 4605–4638. [Google Scholar] [CrossRef] [PubMed]
  25. Chan, A.W.H.; Chan, M.N.; Surratt, J.D.; Chhabra, P.S.; Loza, C.L.; Crounse, J.D.; Yee, L.D.; Flagan, R.C.; Wennberg, P.O.; Seinfeld, J.H. Role of aldehyde chemistry and NOx concentrations in secondary organic aerosol formation. Atmos. Chem. Phys. 2010, 10, 7169–7188. [Google Scholar] [CrossRef] [Green Version]
  26. Meylan, W.M.; Howard, P.H. Computer estimation of the Atmospheric gas-phase reaction rate of organic compounds with hydroxyl radicals and ozone. Chemosphere 1993, 26, 2293–2299. [Google Scholar] [CrossRef]
  27. Gentner, D.R.; Isaacman, G.; Worton, D.R.; Chan, A.W.H.; Dallmann, T.R.; Davis, L.; Liu, S.; Day, D.A.; Russell, L.M.; Wilson, K.R.; et al. Elucidating secondary organic aerosol from diesel and gasoline vehicles through detailed characterization of organic carbon emissions. Proc. Natl. Acad. Sci. USA 2012, 109, 18318–18323. [Google Scholar] [CrossRef] [Green Version]
  28. Fang, Z.; Deng, W.; Zhang, Y.; Ding, X.; Tang, M.; Liu, T.; Hu, Q.; Zhu, M.; Wang, Z.; Yang, W.; et al. Open burning of rice, corn and wheat straws: Primary emissions, photochemical aging, and secondary organic aerosol formation. Atmos. Chem. Phys. 2017, 17, 14821–14839. [Google Scholar] [CrossRef] [Green Version]
  29. Lee, A.; Goldstein, A.H.; Keywood, M.D.; Gao, S.; Varutbangkul, V.; Bahreini, R.; Ng, N.L.; Flagan, R.C.; Seinfeld, J.H. Gas-phase products and secondary aerosol yields from the ozonolysis of ten different terpenes. J. Geophys. Res. 2006, 111, D07302. [Google Scholar] [CrossRef]
  30. Han, D.; Fu, Q.; Gao, S.; Li, L.; Ma, Y.; Qiao, L.; Xu, H.; Liang, S.; Cheng, P.; Chen, X.; et al. Non-polar organic compounds in autumn and winter aerosols in a typical city of eastern China: Size distribution and impact of gas–particle partitioning on PM2.5 source apportionment. Atmos. Chem. Phys. 2018, 18, 9375–9391. [Google Scholar] [CrossRef]
  31. Wang, P.; Li, Y.; Zhang, F.; Chen, Y.; Feng, Y.; Xu, J.; Ma, Y.; Huang, C.; Li, L.; Li, J.; et al. Concentration, composition and variation of ambient IVOCs in Shanghai Port during the G20 summit. GEOCHIMICA 2018, 47, 313–321. [Google Scholar]
  32. Li, Y.; Ren, B.; Qiao, Z.; Zhu, J.; Wang, H.; Zhou, M.; Qiao, L.; Lou, S.; Jing, S.; Huang, C.; et al. Characteristics of atmospheric intermediate volatility organic compounds (IVOCs) in winter and summer under different air pollution levels. Atmos. Environ. 2019, 210, 58–65. [Google Scholar] [CrossRef]
  33. Flores, R.M.; özdemir, H.; ünal, A.; Tayanç, M. Distribution and sources of SVOCs in fine and coarse aerosols in the megacity of Istanbul. Atmos. Res. 2022, 271, 106100. [Google Scholar] [CrossRef]
  34. Fang, H.; Luo, S.; Huang, X.; Fu, X.; Xiao, S.; Zeng, J.; Wang, J.; Zhang, Y.; Wang, X. Ambient naphthalene and methylnaphthalenes observed at an urban site in the Pearl River Delta region: Sources and contributions to secondary organic aerosol. Atmos. Environ. 2021, 252, 118295. [Google Scholar] [CrossRef]
  35. Xu, R.; Alam, M.S.; Stark, C.; Harrison, R.M. Composition and emission factors of traffic- emitted intermediate volatility and semi-volatile hydrocarbons (C10–C36) at a street canyon and urban background sites in central London, UK. Atmos. Environ. 2020, 231, 117448. [Google Scholar] [CrossRef]
  36. Klein, F.; Farren, N.J.; Bozzetti, C.; Daellenbach, K.R.; Kilic, D.; Kumar, N.K.; Pieber, S.M.; Slowik, J.G.; Tuthill, R.N.; Hamilton, J.F.; et al. Indoor terpene emissions from cooking with herbs and pepper and their secondary organic aerosol production potential. Sci. Rep. 2016, 6, 36623. [Google Scholar] [CrossRef]
  37. Mcdonald, B.C.; de Gouw, J.A.; Gilman, J.B.; Jathar, S.H.; Akherati, A.; Cappa, C.D.; Jimenez, J.L.; Lee-Taylor, J.; Hayes, P.L.; Mckeen, S.A.; et al. Volatile chemical products emerging as largest petrochemical source of urban organic emissions. Science 2018, 359, 760–764. [Google Scholar] [CrossRef] [PubMed] [Green Version]
  38. Shah, R.U.; Coggon, M.M.; Gkatzelis, G.I.; Mcdonald, B.C.; Tasoglou, A.; Huber, H.; Gilman, J.; Warneke, C.; Robinson, A.L.; Presto, A.A. Urban Oxidation Flow Reactor Measurements Reveal Significant Secondary Organic Aerosol Contributions from Volatile Emissions of Emerging Importance. Environ. Sci. Technol. 2020, 54, 714–725. [Google Scholar] [CrossRef]
  39. Humes, M.B.; Wang, M.; Kim, S.; Machesky, J.E.; Gentner, D.R.; Robinson, A.L.; Donahue, N.M.; Presto, A.A. Limited Secondary Organic Aerosol Production from Acyclic Oxygenated Volatile Chemical Products. Environ. Sci. Technol. 2022, 56, 4806–4815. [Google Scholar] [CrossRef]
  40. Harrison, R.M.; Beddows, D.C. Efficacy of Recent Emissions Controls on Road Vehicles in Europe and Implications for Public Health. Sci. Rep. 2017, 7, 1152. [Google Scholar] [CrossRef] [Green Version]
  41. Wen, Y.; Zhang, S.; He, L.; Yang, S.; Wu, X.; Wu, Y. Characterizing start emissions of gasoline vehicles and the seasonal, diurnal and spatial variabilities in China. Atmos. Environ. 2021, 245, 118040. [Google Scholar] [CrossRef]
  42. Xu, R.; Alam, M.S.; Stark, C.; Harrison, R.M. Behaviour of traffic emitted semi-volatile and intermediate volatility organic compounds within the urban atmosphere. Sci. Total Environ. 2020, 720, 137470. [Google Scholar] [CrossRef] [PubMed]
  43. He, X.; Zheng, X.; You, Y.; Zhang, S.; Zhao, B.; Wang, X.; Huang, G.; Chen, T.; Cao, Y.; He, L.; et al. Comprehensive chemical characterization of gaseous I/SVOC emissions from heavy-duty diesel vehicles using two-dimensional gas chromatography time-of-flight mass spectrometry. Environ. Pollut. 2022, 305, 119284. [Google Scholar] [CrossRef] [PubMed]
  44. Zhang, Z.; Man, H.; Zhao, J.; Jiang, Y.; Zeng, M.; Cai, Z.; Huang, C.; Huang, W.; Zhao, H.; Jing, S.; et al. Primary organic gas emissions in vehicle cold start events: Rates, compositions and temperature effects. J. Hazard. Mater. 2022, 435, 128979. [Google Scholar] [CrossRef]
  45. Li, W.; Li, L.; Chen, C.; Kacarab, M.; Peng, W.; Price, D.; Xu, J.; Cocker, D.R. Potential of select intermediate-volatility organic compounds and consumer products for secondary organic aerosol and ozone formation under relevant urban conditions. Atmos. Environ. 2018, 178, 109–117. [Google Scholar] [CrossRef] [Green Version]
  46. Chen, Y.; Bian, S.; Gao, K.; Cao, Y.; Wu, H.; Liu, C.; Jiang, X.; Sun, X. Studies on the meso-sized selectivity of a novel organic/inorganic hybrid mesoporous silica membrane. J. Membr. Sci. 2014, 457, 9–18. [Google Scholar] [CrossRef]
  47. Jia, C.; Batterman, S. A Critical Review of Naphthalene Sources and Exposures Relevant to Indoor and Outdoor Air. Int. J. Env. Res. Pub. He. 2010, 7, 2903–2939. [Google Scholar] [CrossRef] [PubMed]
  48. Drozd, G.T.; Zhao, Y.; Saliba, G.; Frodin, B.; Maddox, C.; Oliver Chang, M.C.; Maldonado, H.; Sardar, S.; Weber, R.J.; Robinson, A.L.; et al. Detailed Speciation of Intermediate Volatility and Semivolatile Organic Compound Emissions from Gasoline Vehicles: Effects of Cold-Starts and Implications for Secondary Organic Aerosol Formation. Environ. Sci. Technol. 2019, 53, 1706–1714. [Google Scholar] [CrossRef]
  49. Xie, M.; Barsanti, K.C.; Hannigan, M.P.; Dutton, S.J.; Vedal, S. Positive matrix factorization of PM2.5 –eliminating the effects of gas/particle partitioning of semivolatile organic compounds. Atmos. Chem. Phys. 2013, 13, 7381–7393. [Google Scholar] [CrossRef] [Green Version]
  50. Ling, Z.; Wu, L.; Wang, Y.; Shao, M.; Wang, X.; Huang, W. Roles of semivolatile and intermediate-volatility organic compounds in secondary organic aerosol formation and its implication: A review. J. Environ. Sci. 2022, 114, 259–285. [Google Scholar] [CrossRef]
Figure 1. The concentration and composition of speciated IVOCs (A) and SVOCs (B) from 11 September to 6 October 2020 in Beijing.
Atmosphere 14 00094 g001
Figure 2. Pearson correlation coefficient R between S/IVOC and NOx and benzene.
Atmosphere 14 00094 g002
Figure 3. The distribution of B12~B36 in gas-phase and particle-phase. The center line of each box is the median of the data, the top, and bottom of the box are 75th and 25th percentiles, and the top and bottom whiskers are 90th and 10th percentiles.
Atmosphere 14 00094 g003
Figure 4. The concentration of estimated SOA mass from measured gas-phase IVOCs and SVOCs.
Atmosphere 14 00094 g004
Table 1. Comparison of IVOCs and SVOCs level (mean ± standard deviation) in Beijing and other studies.
IVOCsLocationDateConcentration (μg m−3)Reference
Primary IVOCsUrban air, Shanghai5 December 2016~3 January 201735.1 ± 16.1[32]
Primary IVOCsAmbient air, California17 May 2010~11 June 20106.3 ± 1.9[13]
Primary IVOCsCoastal, Yang Shan PortAugust~September 20165.1 ± 0.8[31]
Total IVOCUrban air,
Beijing
11 September 2020~6 October 20207.56 ± 3.50 (speciated 1.01 ± 0.32 )This study
PAHs
n-alkanes
Urban air, IstanbulJanuary 2017~January 201855.3~204.2
7.1~80.8
[33]
Total SVOCUrban air, Beijing11 September 2020~6 October 2020104.85 ± 164.67This study
Disclaimer/Publisher’s Note: The statements, opinions and data contained in all publications are solely those of the individual author(s) and contributor(s) and not of MDPI and/or the editor(s). MDPI and/or the editor(s) disclaim responsibility for any injury to people or property resulting from any ideas, methods, instructions or products referred to in the content.

