1. Introduction
The uneven distribution of precipitation on Earth is exacerbated by climate change, leading to a further decrease in precipitation in arid and semi-arid regions and its increase in sufficiently humid regions [
1,
2]. Fresh water scarcity is also aggravating due to population growth and increased water consumption [
3,
4].
According to UN estimates, in 2025, about 1.8 billion people will live in regions with “absolute water scarcity” [
5]. By 2050, the world’s population growth could increase the demand for potable water by 55%, and 40% of the world’s population will experience acute water shortage.
To mitigate the shortage of fresh water, technologies for extracting groundwater, desalination of sea water, reuse of wastewater [
5,
6,
7], etc. are used. One of the promising ways to replenish fresh water reserves is the use of rain enhancement methods, which are used in more than 50 countries [
8,
9,
10,
11]. Traditional methods are generally focused on enhancing the precipitation formation efficacy in natural clouds by seeding them with glaciogenic and hygroscopic aerosol using aviation, rocket, artillery and ground technical means [
9,
11]. However, in regions with an arid climate the number of suitable clouds is usually very limited [
12,
13]. In this paper we studied method of stimulating clouds forming convection, proposed in [
14].
The scientific prerequisites for creating artificial clouds are, firstly, that the Earth’s atmosphere contains about 1.27 × 10
16 kg of water vapor. These reserves of water vapor are continuously renewed due to the cycle of evaporation-condensation and precipitation, making annually eight–nine hydrological cycles lasting about 40–45 days [
15]. Continuous replenishment of water vapor content in the atmosphere due to evaporation from the surface of the oceans, seas, moist soil and plants is an inexhaustible source of moisture for rain enhancement.
Secondly, even in antiquity it was found [
16] that convective clouds and precipitation often form over powerful heat sources. Such heat sources that generate convective clouds and precipitation are forest and other large fires [
17,
18,
19], active volcanoes, mountain peaks heated by the sun, “heat islands” over large cities, nuclear power plants, oil refineries and thermal power plants [
20,
21,
22,
23,
24,
25,
26]. The air heated above the heat sources becomes lighter than the surrounding air and rises, stimulating the development of thermal convection and the formation of clouds, called “Pyro clouds” and “Urban clouds” or sometimes called “Industry clouds” [
20,
21,
22,
23,
24,
25]. These clouds can sometimes produce showers under conditions where natural clouds and precipitation would not form without such heat sources. Methods for creating artificial clouds, like Pyro clouds and Urban clouds, are based on heating the near ground layer of the atmosphere with the help of various stationary heat sources.
The ancient method of causing rain during a drought involved creating artificial fires in the prairies and savannas of South America and Equatorial Africa [
16]. Better known are the attempts to create clouds in the period 1960–1985 with the help of meteotrons that warm up the surface air due to the heat of burning oil products:
The Dessens meteotrons used in Cuba [
27] and France [
28] and contained 100 jet oil burners placed in a circle with a radius of 33 m. They consumed about 60 and 105 tons/hour of gas oil and had a power of 600 and 1000 MW, respectively.
The meteotron of the Institute of Geology and Geophysics of the Siberian Branch of the Russian Academy of Sciences had 60 jet flamethrowers located along the perimeter of an octagon with a side of 53 m, developed a power of 5000 MW or more, while consuming about 432 tons/hour of diesel fuel [
29]. The smoke column in some of the eight experiments rose up to 3 km.
The meteotrons of the Chelyabinsk Polytechnic Institute (eight variants) were designed to ventilate coal mines, create clouds and dissipate fogs. They contained from 10 to 100 centrifugal nozzles with diesel fuel consumption from 7 to 30 tons/h, and developed a power of 80 to 400 MW. Fine atomization of diesel fuel in combination with various nozzle placement options ensured complete combustion of the fuel and a smokeless jet [
30].
The meteotrons of the Institute of Applied Geophysics of the USSR State Committee for Hydrometeorology with four and ten RD-3M jet engines, designed to study the possibility of creating artificial clouds and precipitation, had a capacity of 200 and 500 MW, and the “Supermeteotron” with a capacity of 500 MW, built on the shores of the high-mountain lake Sevan in Armenia, for replenishment the water level in it, contained six RM-3M-500 jet engines and a common afterburner with the consumption of jet fuel [
29].
As an alternative to these meteotrons for heating the surface air, solar meteotrons were proposed, which provided the heating of the surface air due to the energy of solar radiation. The principle of their operation is based on reducing the albedo of local areas of the Earth’s surface and increasing the absorption of solar radiation by:
- –
covering areas of the Earth’s surface with asphalt or black cloth, which effectively absorb solar radiation [
31,
32];
- –
creating a blackened screen surrounded by a system of rotary mirrors that focus the sun’s rays on this screen, raised above the ground, to prevent energy leakage into the ground [
33];
- –
landscaping of territories by planting forests and other vegetation [
34,
35] and coloring the Earth’s surface in order to increase the absorption of solar radiation.
Also known is the method of updraft creation using the Heliator device, which is a sun-heated vertically oriented multi-tiered garland of round screens with a blackened surface [
36].
None of the listed methods for creating artificial clouds and precipitation are used in practice for the following reasons:
- –
Prairie and savannah fires are unacceptable due to the damage to flora and fauna;
- –
Torch and flamethrower meteotrons require high fuel consumption and lead to environmental pollution;
- –
The Heliator device is not operational due to low energy capacity and vulnerability to the wind transfer destructing the garlands axis;
- –
Efficiency of solar meteotrons is reduced by heat leakage into the ground. The elimination of these losses by mounting a blackened screen on supports that isolated from the ground [
33] is not feasible due to the huge dimensions of the screen and the cumbersome system of mirrors surrounding the screen. To initiate thermal convection and develop artificial clouds, the area of these meteotrons should be commensurate with the area of large forest fires, volcano craters, mountain peaks (about 1–10 km
2). Furthermore, screens of this scale have not yet been built due to their large dimensions and cost.
This project examines another way to create artificial clouds and precipitation using a solar meteotron, in which as a screen the air heated by solar radiation is used, instead of asphalt, cloth and other coverings of the Earth’s surface. For this an artificial aerosol layer is created, consisting of particles of optimal dispersion, effectively absorbing solar radiation [
14]. Such a screen can be created using special smoke checkers, which is much easier and many times cheaper.
The purpose of this work is to describe the method and technical means for creating such a solar meteotron and assess the possibility of stimulating thermal convection and artificial clouds with such a meteotron based on numerical simulation and field testing of the developed technical means.
The structure of this paper is as follows.
Section 2 describes a conceptual model for the formation of convective flows due to the heating of the near ground atmospheric air and presents the calculations of the radiative heat balance due to the action of solar radiation and the aerosol layer. In addition, it describes models for calculating the transfer and diffusion of aerosols and the CFD model for a detailed calculation of the movement of thermals taking into account the processes of mass and heat transfer, energy and balance of water vapor, and meteorological conditions.
Section 3 contains the results of CFD simulations under various atmospheric meteorological conditions.
Section 4 is devoted to the development of special pyrotechnic compositions and aerosol checkers for the formation of an optimized aerosol that absorbs solar radiation to the maximum. Moreover,
Section 5 and
Section 6 are the Discussions and Conclusions.
2. Methodology
2.1. Aerosol Layer Method
An aerosol layer with the required optical density and low albedo is proposed to be created in the surface atmosphere using smoke checkers that generate an aerosol of such dispersion that effectively absorbs solar radiation in the wavelength range from 0.3 to 1.6 μm. The concentration of aerosol in the aerosol layer should be such as to ensure almost complete absorption of solar radiation and the creation of a heat island against the background of the environment. It is assumed that the air heated in the aerosol layer will rise and lead to the development of thermal convection, which contributes to the development of cloud forming convection. To improve the efficiency of this method, the aerosol layer is created from hygroscopic and electrically charged particles, which are active centers for the water vapor condensation, contributing to the cloud and precipitation formation.
The following scientific and technical tasks were solved by the implementation of such a study:
- –
The choice of the optimal dispersion of the aerosol, which effectively absorbs solar radiation, slowly sediments, has hygroscopic properties and is environmentally safe;
- –
The modeling of aerosol propagation due to turbulent diffusion and wind transfer and the choice of aerosol dosage;
- –
Development of smoke compositions, their laboratory testing and selection of promising ones;
- –
The development and production of aerosol checkers;
- –
The numerical modeling of convection stimulated by an aerosol layer under various atmospheric conditions;
- –
The field testing of aerosol checkers and assessing their number to create an aerosol layer with an area of about 1–10 km2.
2.2. Aerosol Dispersion and Dosage
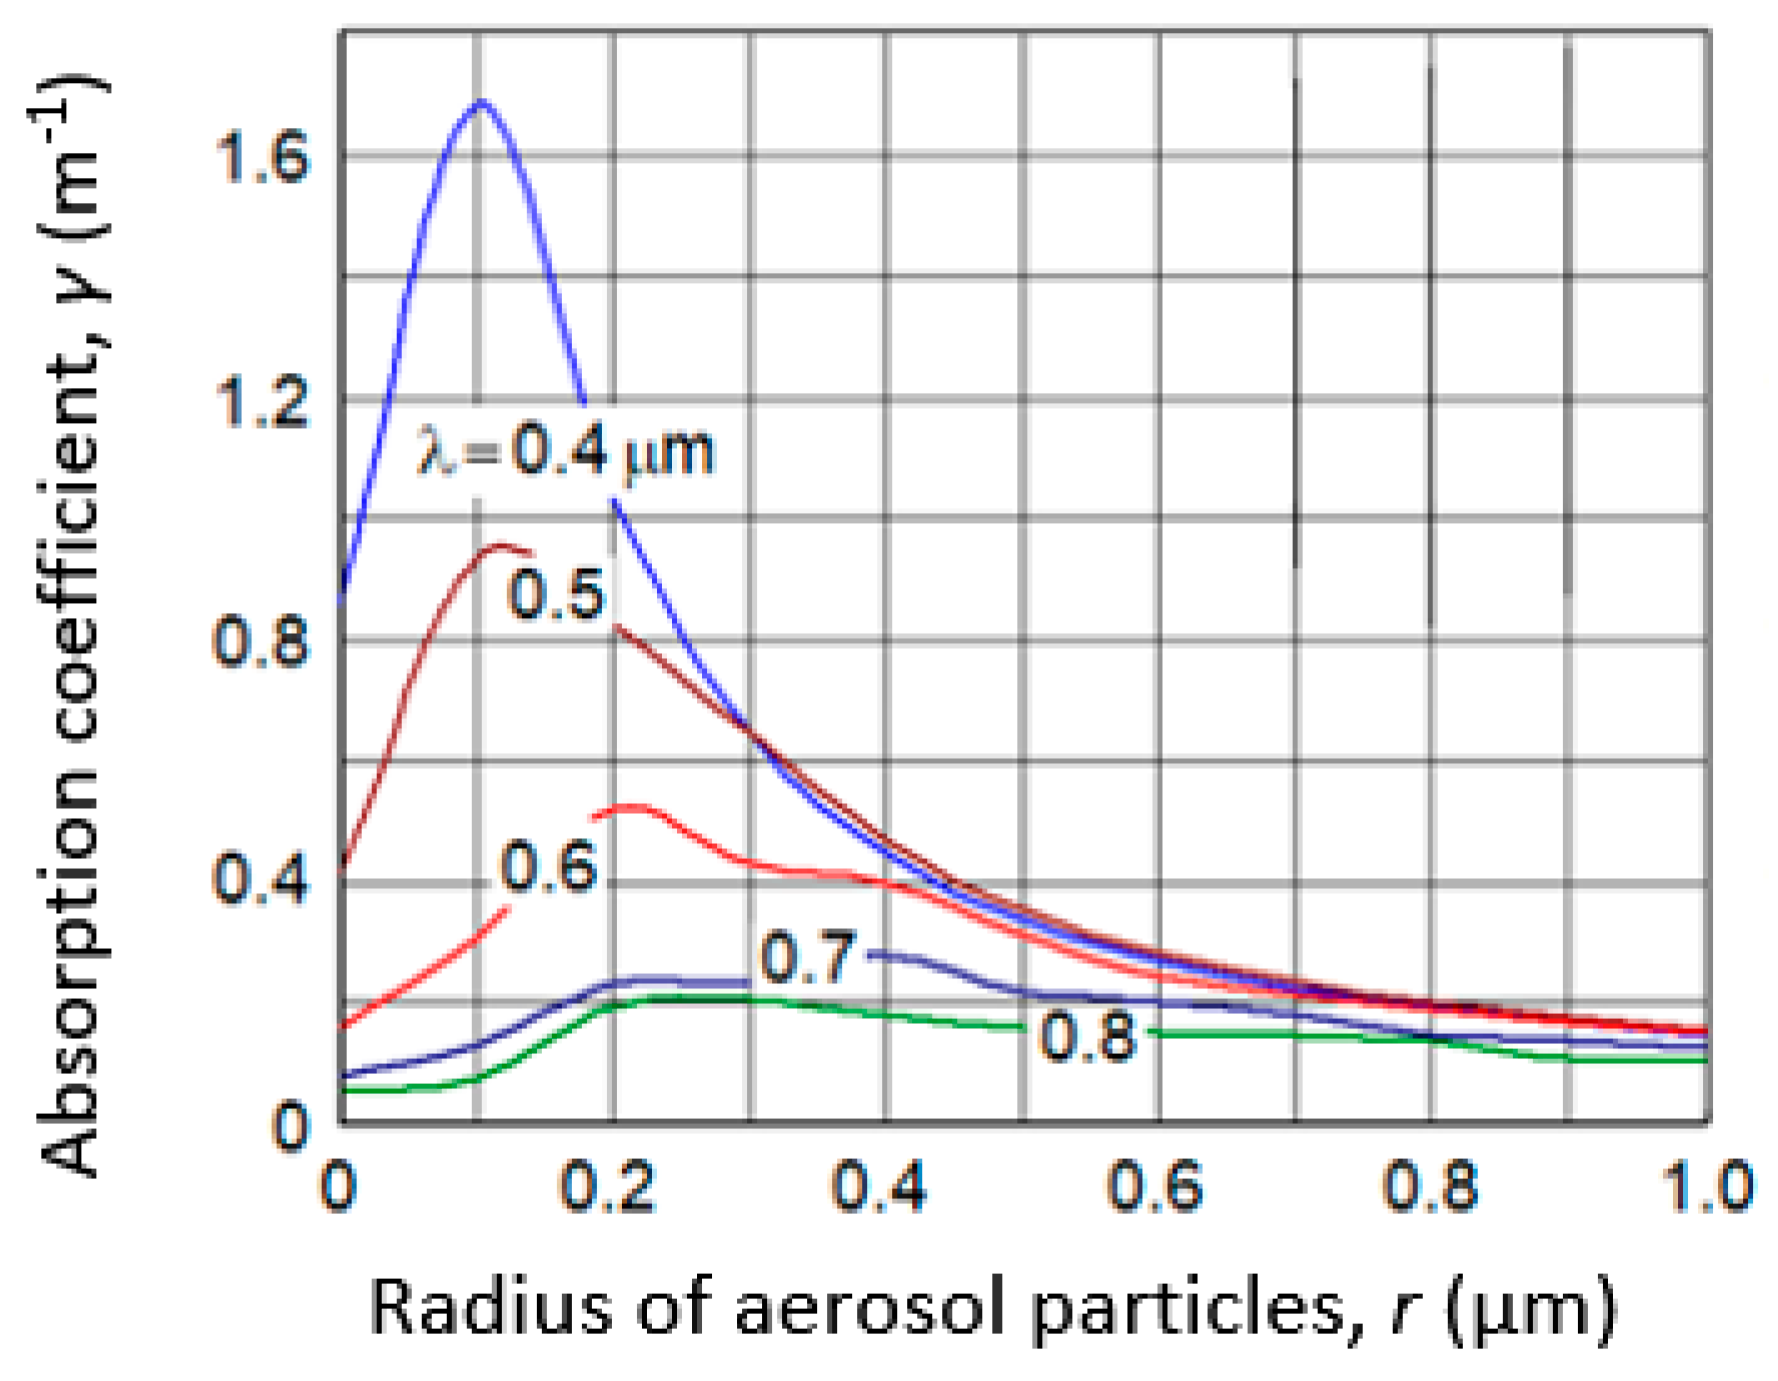
The dispersity of the aerosol should be such that its absorption spectrum is in the wavelength band from 0.3 to 1.6 µm, where the main flux of solar radiation is concentrated.
The absorption coefficient of solar radiation γ(
λ,
m,
r) of a unit volume of the aerosol layer was calculated by the formula:
where
r is the radius of aerosol particles;
λ—wavelength;
m =
l −
ik is the complex refractive index of the particle substance;
l—refractive index;
k—absorption index;
n(
r)—size distribution function of aerosol particles;
σa(
λ,
m,
r)—absorption cross section of aerosol particles. For soot particle
l = 0.047·
λ + 1.4317;
κ = −0.008·
λ + 0.756 [
37] which at wavelength
λ = 550 nm corresponds to
m = 1.474 − 0.7515
i.
The size distribution of aerosol particles was represented by a Gamma function of the type:
where
N is the total number of all particles per unit volume of the aerosol layer;
ra is the average cubic radius of the particle spectrum.
During the combustion of the smoke composition the concentration of aerosol particles
N is created, which depends on the mass of the combusted smoke composition
M and the size of the aerosol
r:
where
ρ ≈ 1.5 g/cm
3—smoke particles density;
V =
X∙Y∙H—their distribution volume expressed in cubic meters;
X,
Y and
H—horizontal dimensions and thickness of aerosol layer in meters.
Assuming that the mass of aerosol introduced per unit volume is
M/
V = 1 g/m
3, we have:
where
γ is expressed in m
−1;
σa in m
2 and
r in m.
Calculations of the value of
γ(
λ,
m,
r) were carried out [
38] using strict diffraction formulas by Mie G. [
39] and it was found that its value in the wavelength range of 0.3–1.6 μm has a maximum with an aerosol radius of 0.05 <
r < 0.15 µm, having a minimum gravitational sedimentation rate.
An analysis of the dependence of the solar radiation absorption coefficient by the aerosol layer (
γ, m
−1) on the aerosol size (
Figure 1) showed that with the number of particles in the vertical column of the aerosol layer
NAS ≥ 10
12 m
−2, almost complete absorption of solar radiation in the visible wavelength range is provided. This concentration of particles is created when the smoke composition dosage is about 0.25–0.3 g/m
2.
Figure 1b shows the aerosol layer absorbance at a dosage of 0.25 g/m
2 as a function of wavelength.
2.3. Aerosol Propagation
To study the propagation of aerosol due to turbulent diffusion and wind transfer, a theoretical model [
38] was developed based on the numerical solution of the equation:
where
—volume concentration of aerosol particles;
u and
w are the horizontal and vertical components of the air flow velocity;
—rate of aerosol particles sedimentation;
—sedimentation rate of a particle of radius
r;
ρ and
ρ0 are the density of an aerosol particle and air, respectively;
η—air dynamic viscosity;
D is the turbulent diffusion coefficient.
The cases of turbulent diffusion of an aerosol of optimal dispersity introduced by three types of sources are considered:
- –
instantaneous point source;
- –
continuous point source;
- –
moving linear source.
For the numerical solution of Equation (5), the origin of coordinates is placed at the point of aerosol release, the X and Y axes are directed along and perpendicular to the wind direction respectively, and the Z axis is vertically upward. On the surface of the earth, the condition of complete absorption of aerosol particles is set, and on the upper boundary of the inversion layer, the condition of total reflection, which leads to the aerosol particles accumulation in this layer.
The mathematical problem was considered in the domain D = Ω × [0, t], where t is a given time interval, Ω = {−L ≤ x ≤ L, −L ≤ y ≤ L, 0 ≤ z ≤ H} is a parallelepiped with side 2L and height H.
The computational domain is approximated by a system of Euler grids. The spatial approximation of the operators of turbulent diffusion and advection was carried out on a three-point stencil of the central difference scheme of the second order of accuracy. To discretize the problem with respect to time, an implicit scheme with a splitting operator is taken. The systems of linear equations with three diagonal matrices resulting from the splitting were solved by the flow sweep method. The size of the computational domain was 10 km in length and width and 250 m in height, the grid step was equal to 50 m along the X and Y axes and 25 m along the Z axis.
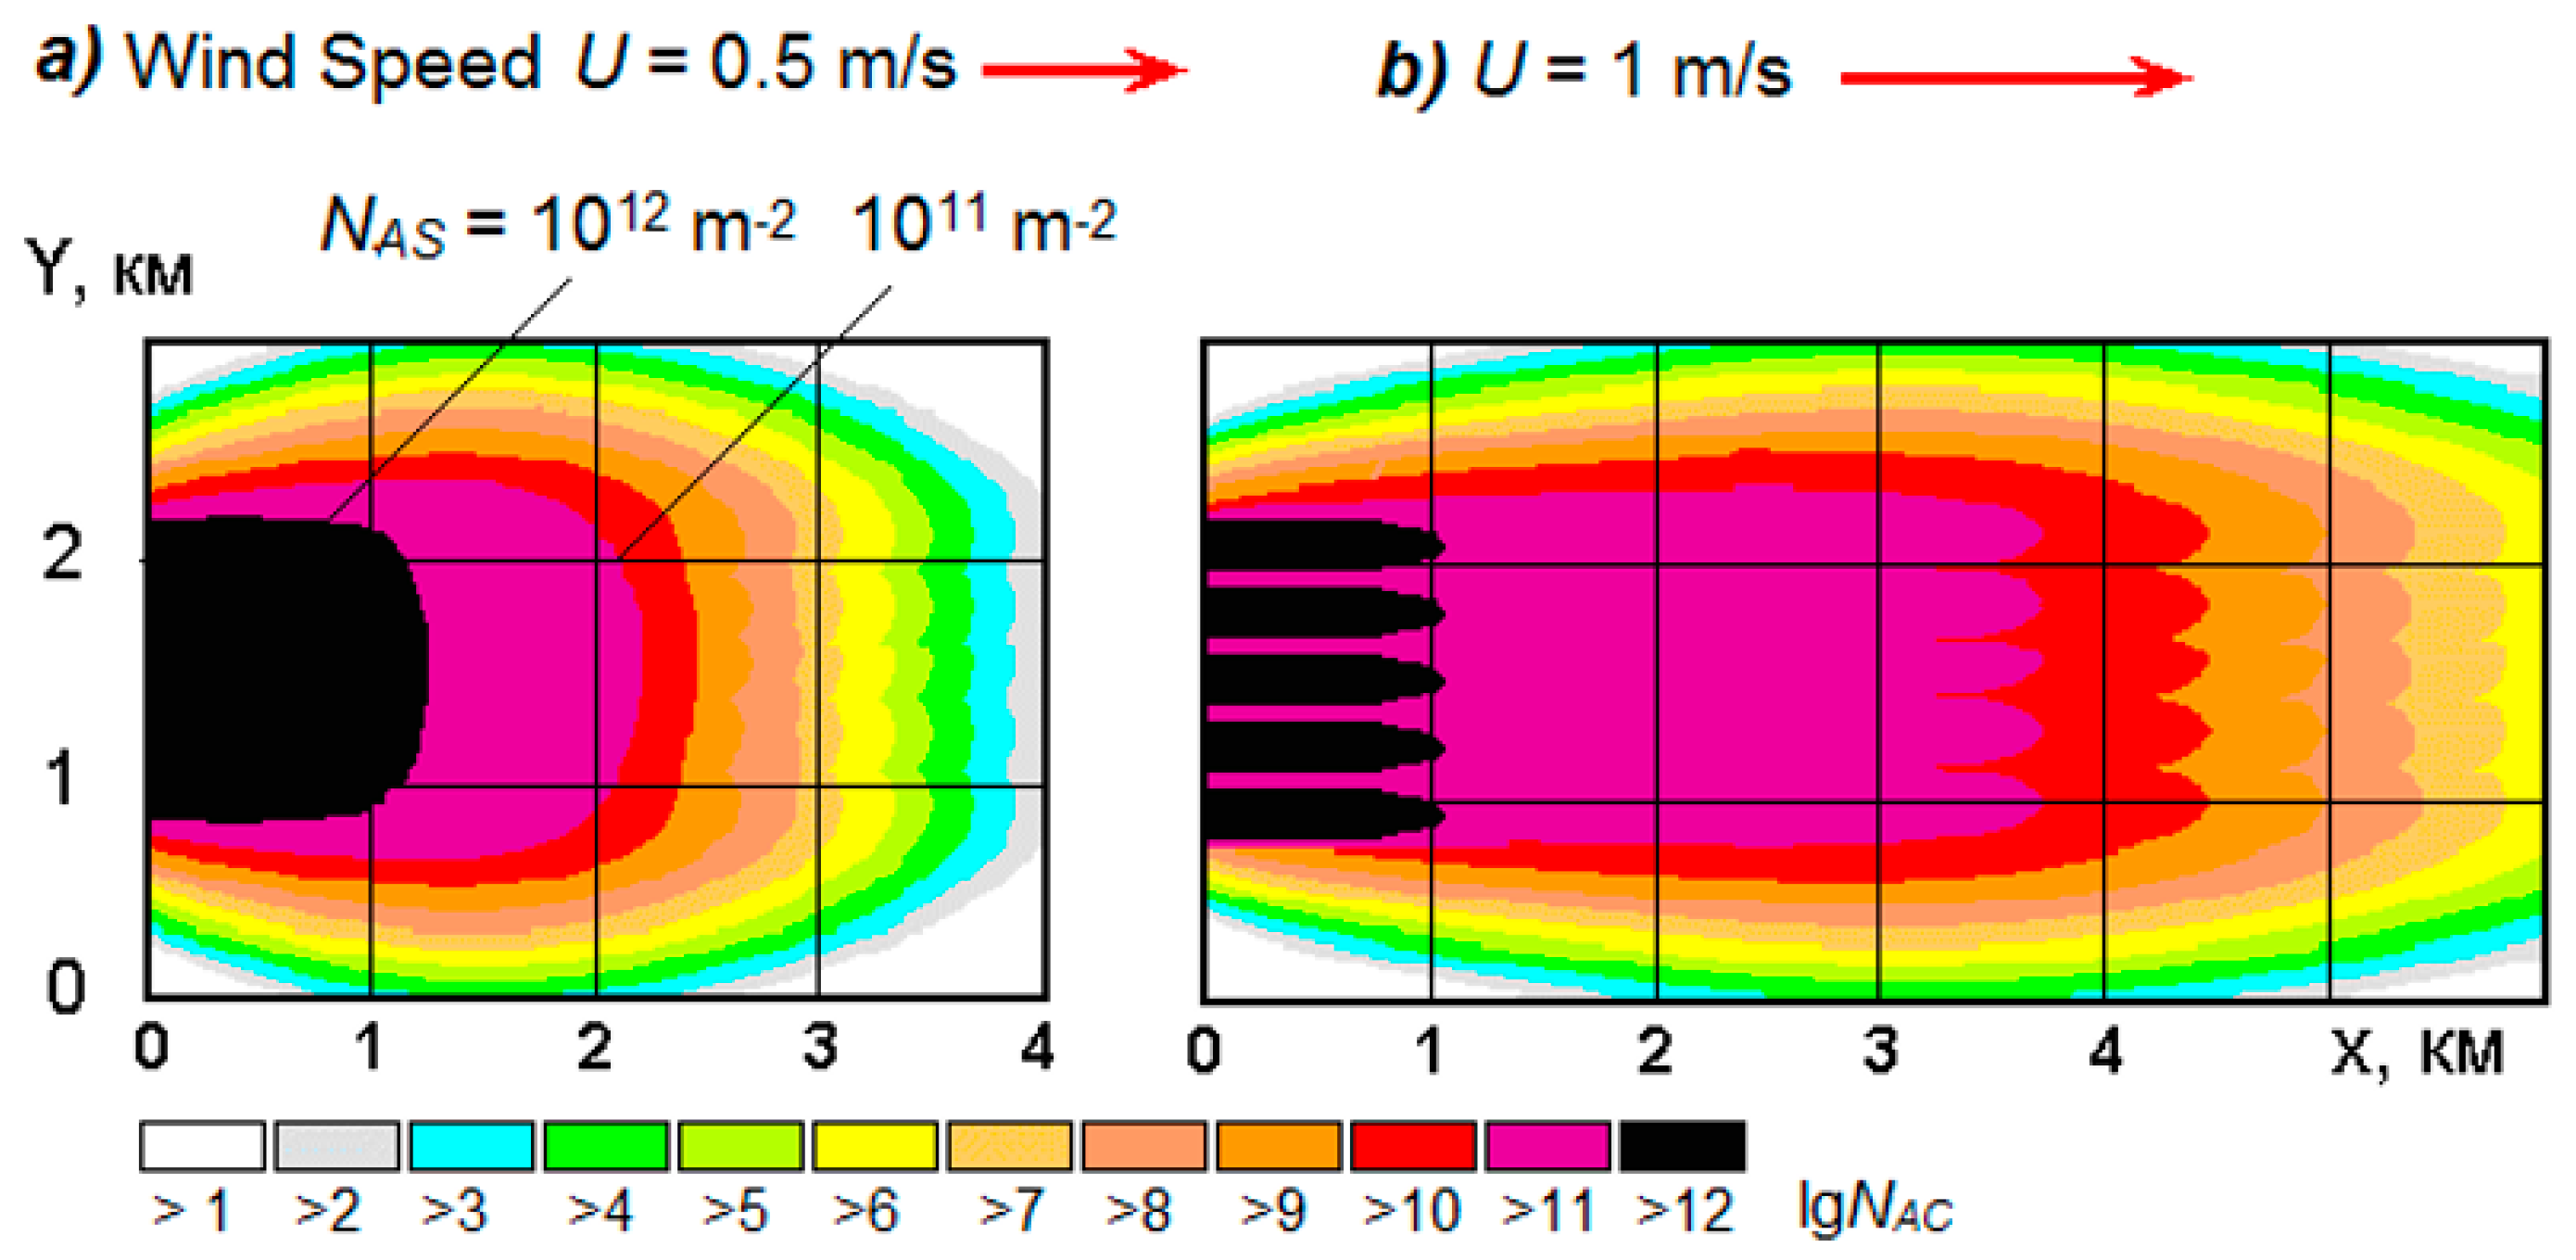
Calculations have shown that the aerosol concentration increases with increasing time of the source action, and the aerosol plume is stretched downwind. Five stationary sources placed 200 m from each other across the wind direction at a wind speed of 0.5 m/s can create a continuous aerosol layer with a particle concentration of
NAS > 10
12 m
−2 over an area of about 1.5 km
2 and with
NAS > 10
11 m
−2 over an area of about 3 km
2. As the wind speed increases to 1 m/s, the area of the layer with
NAS > 10
12 m
−2 remains almost the same, and the area of the layer with
NAS > 10
11 m
−2 reaches 6 km
2 (
Figure 2).
2.4. Heat Absorbed by the Aerosol Layer
The absorption of solar radiation in the aerosol layer will be directly proportional to the number of aerosol particles per unit area of the
NAS layer. At an aerosol concentration of
NAS > 2·10
12 m
−2, 90–100% absorption of solar radiation in the visible wavelength range is provided. Nearby the aerosol layer, the air also warms up due to the absorption of solar radiation. However, it is smaller the greater the albedo of the Earth’s surface (
A) and proportional to (1 −
A). With this in mind, the excess amount of energy absorbed by the aerosol layer will be equal to:
where
P(
λ)—spectral density of solar radiation;
λ—wavelength; Δ
λ—width of the absorption band of the aerosol layer;
γ—solar radiation absorption coefficient;
S—area of aerosol layer;
θ—angular position of the Sun;
A—albedo of the landscape surrounding the aerosol layer;
t—time from the moment of creation of the aerosol layer
t0.
Heat
Q goes to heat the air in the aerosol layer and can lead to an increase in its temperature above the environment by Δ
T, equal to:
where
cp = 1.005 kJ/(kg·°C) is the heat capacity of air at constant pressure, and
MA is the mass of heated air, equal to:
where
VA—volume of aerosol layer;
h—vertical thickness of aerosol layer;
ρ—air density.
Assuming that at the Earth’s surface
P(
λ) ≈ 0.6 W/(m
2·nm); Δ
λ = 1300 nm;
γ ≈ 0.9 m
−1; area of the aerosol layer
S = 10
6 m
2;
θ = 70°; environment albedo (for example, desert)
A = 0.35;
t = 0.5 h, we find that the amount of heat absorbed by the aerosol layer is
Q ≈ 115.5 MWh = 4.16 × 10
8 kJ. With the layer thickness
h = 30 m, the volume of the heated aerosol layer is
VA = 3 × 10
7 m
3. At an altitude of 1000 m above sea level, where the air density
ρ = 1.11 kg/m
3, the mass of heated air will be equal to
MA ≈ 3.33 × 10
7 kg. At the same time, 6 min after the creation of the aerosol layer, the excess air temperature in it will reach
.
Such an excess of the air temperature in the aerosol layer relative to the environment will lead to forced air rise and intense convection, since under natural conditions thermal convection begins at ΔT ≈ 0.2–0.3 °C.
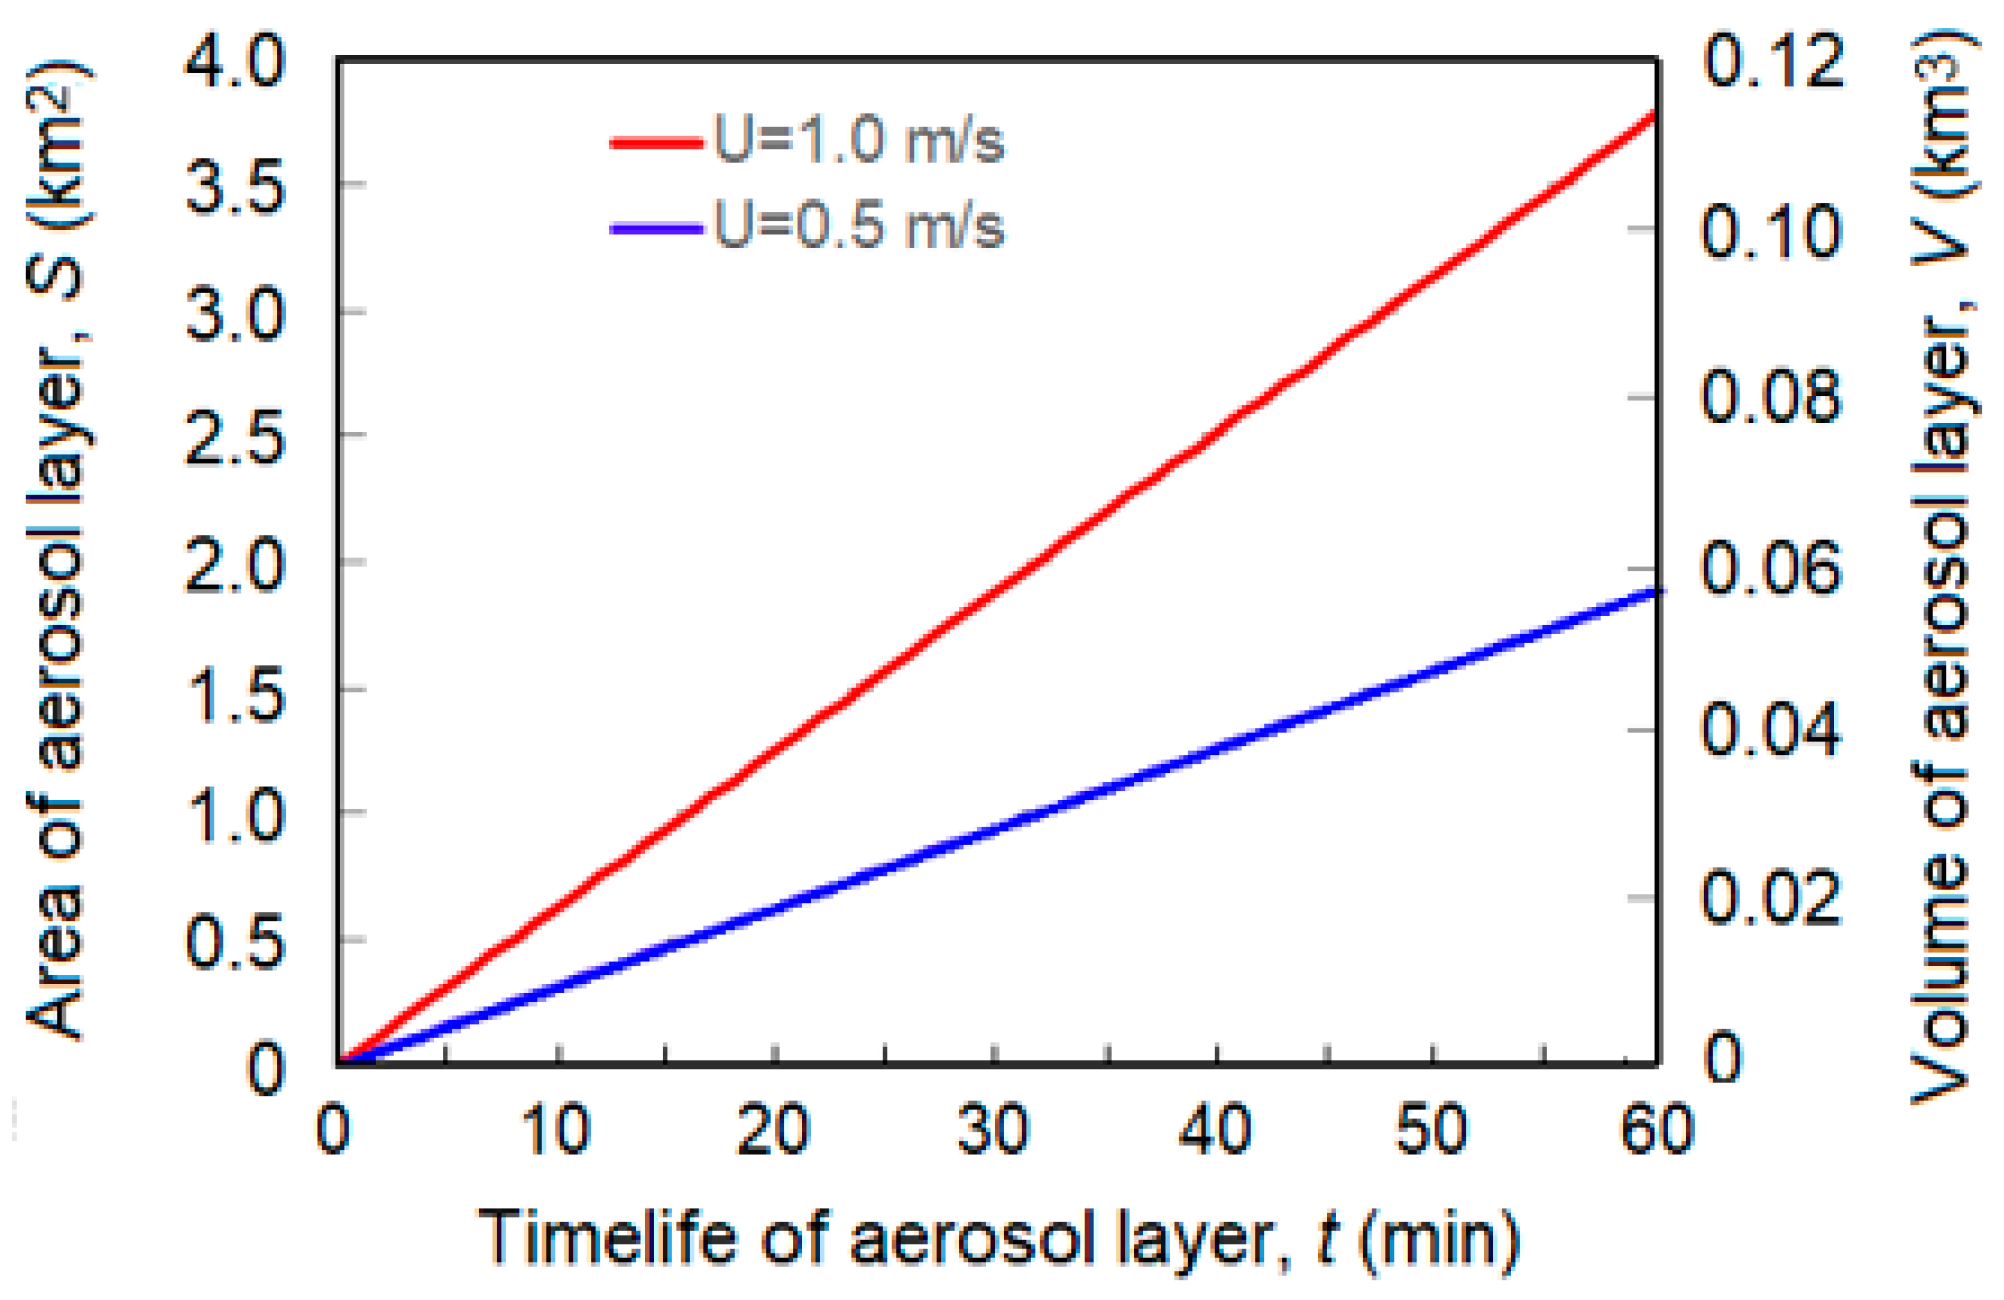
The continuous action of five stationary aerosol sources can lead to an increase in the area of the aerosol layer up to several km
2 and the volume of the updraft up to 0.1 km
3 (
Figure 3), which is comparable to the area and volume of large natural thermals.
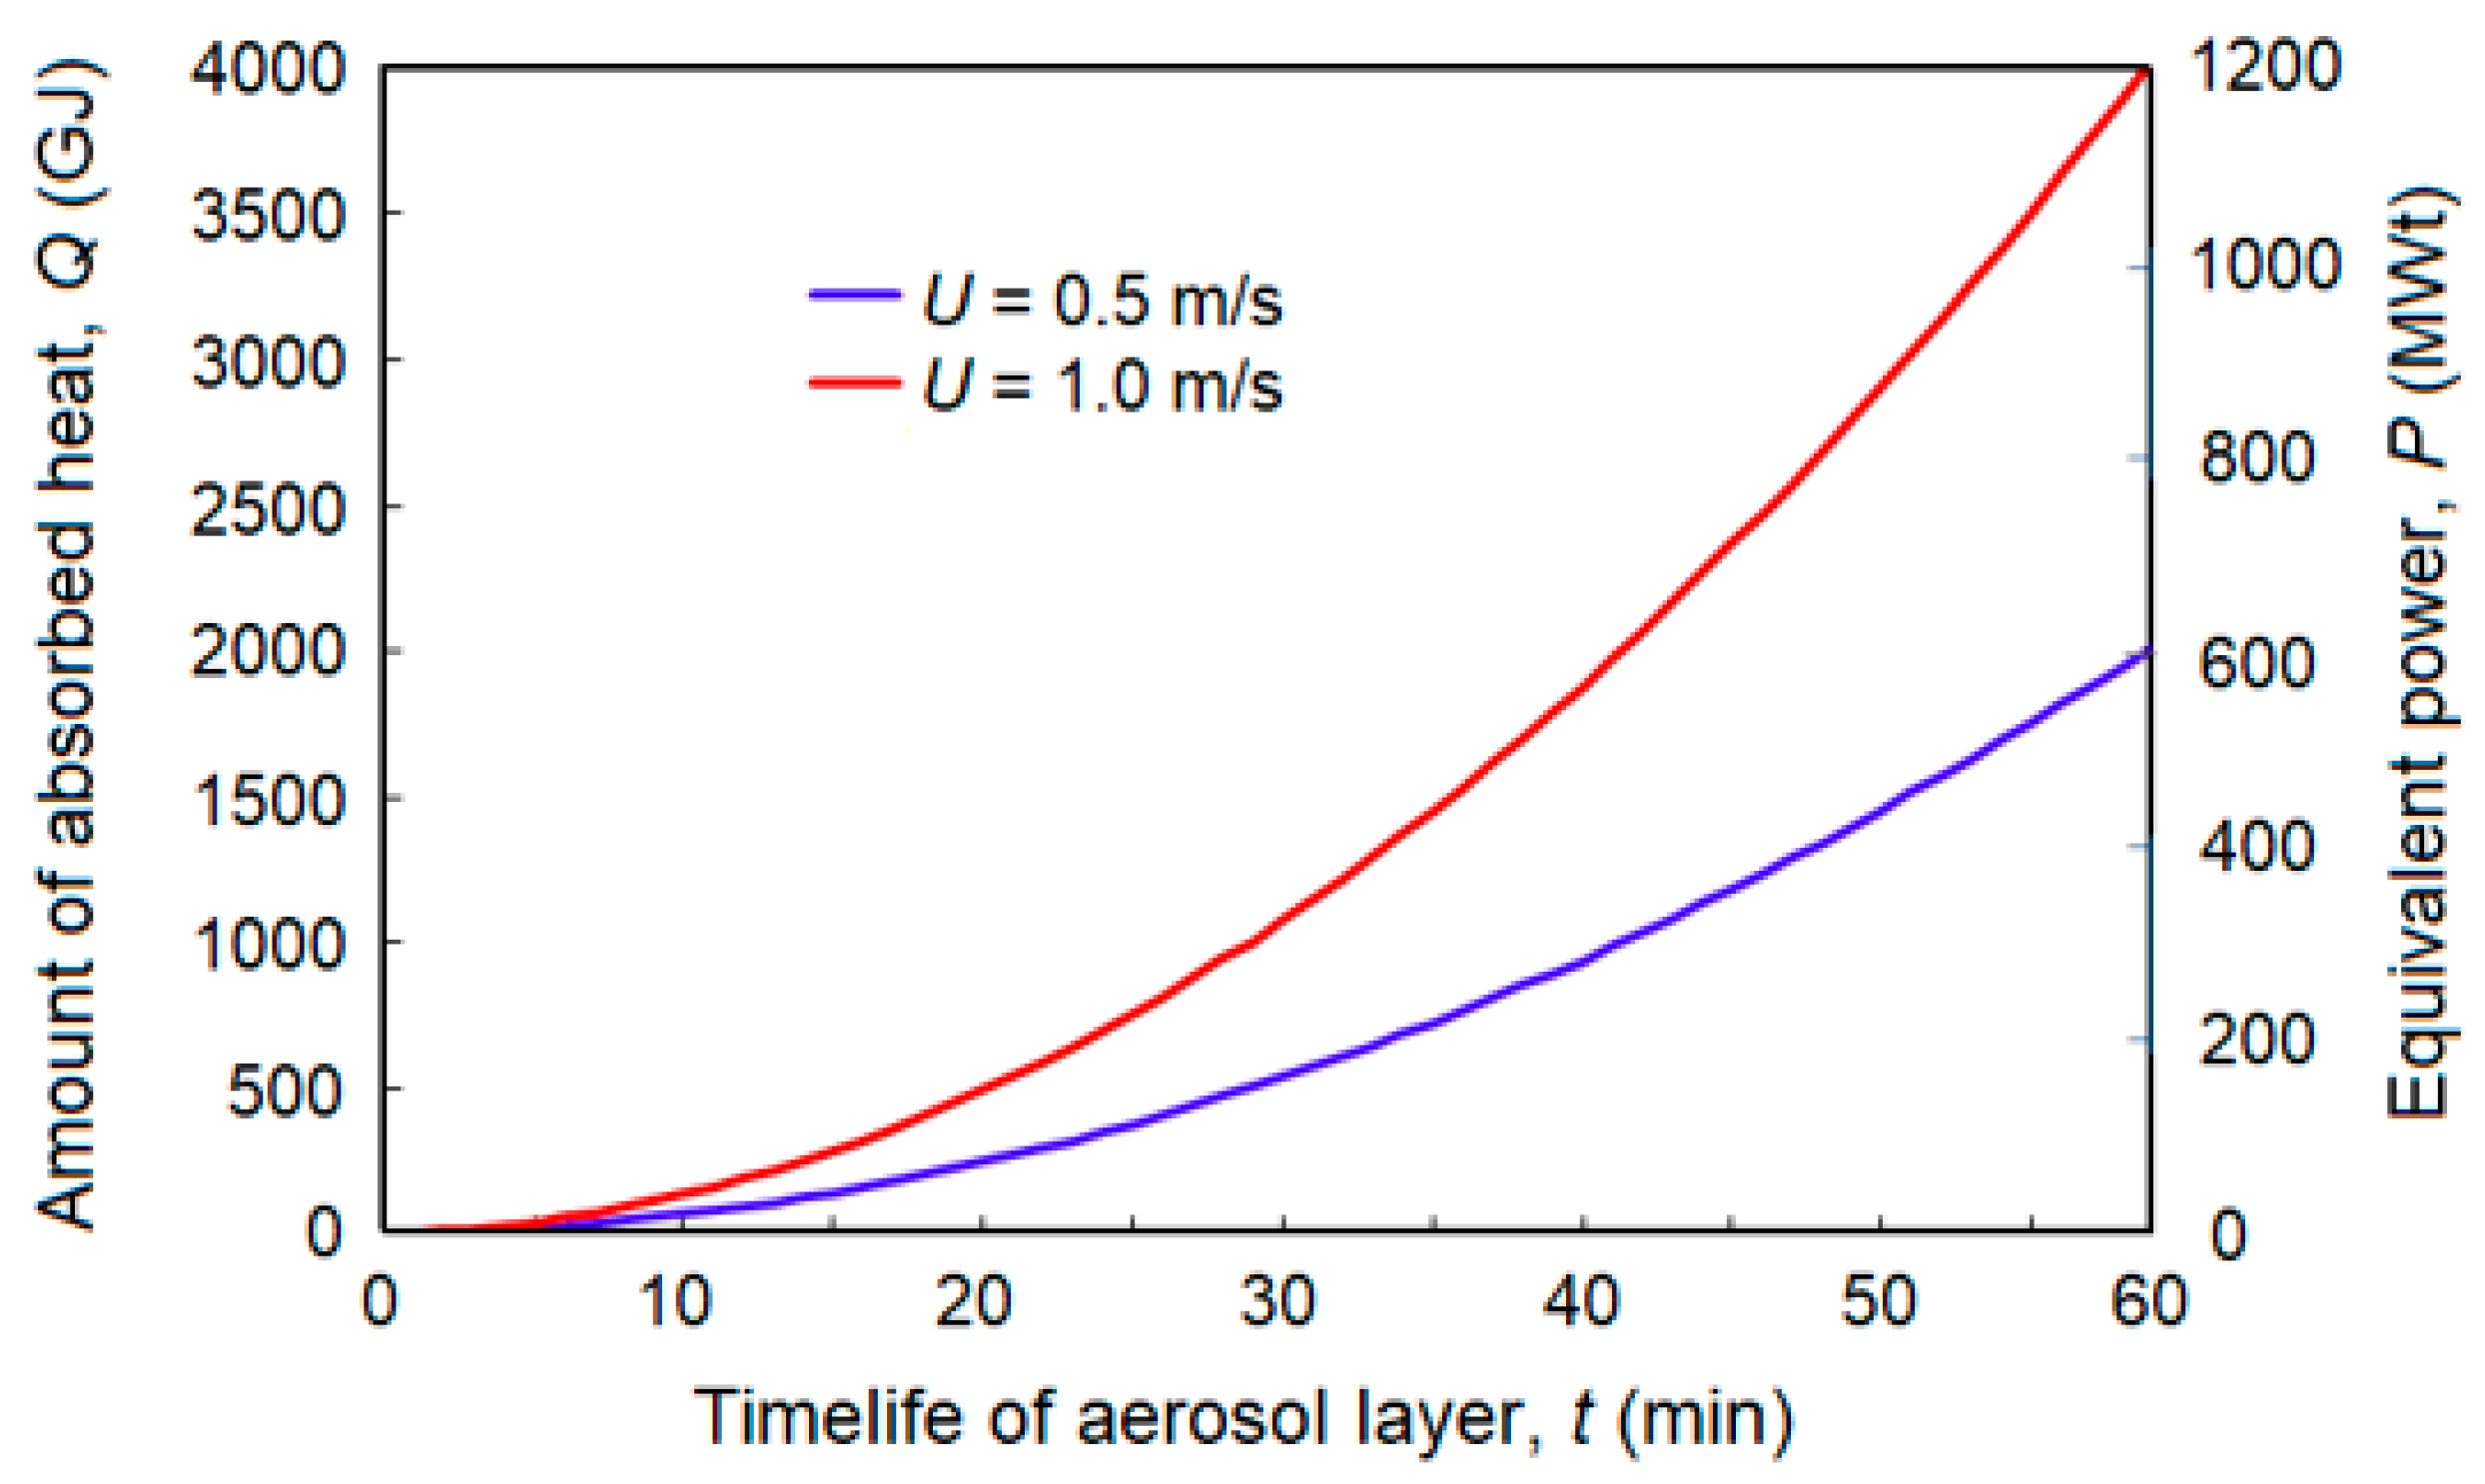
The amount of solar radiation energy absorbed by the aerosol layer and the equivalent power of the solar meteotron are shown in
Figure 4.
It follows from
Figure 3 and
Figure 4 that the updraft area and volume that can be initiated by an aerosol layer is comparable to the updraft area and volume of a powerful cumulus cloud (Cu Cong) and a small cumulonimbus cloud (Cb) even without taking into account the entrainment of ambient air. The power of such a solar meteotron after 1 h of continuous action of aerosol sources reaches 500–1000 MW, which is comparable to the power of the Dessens [
28] and Vulfson & Levin [
29] meteotrons, in which about 60–100 tons/h of gas oil or diesel fuel were burned.
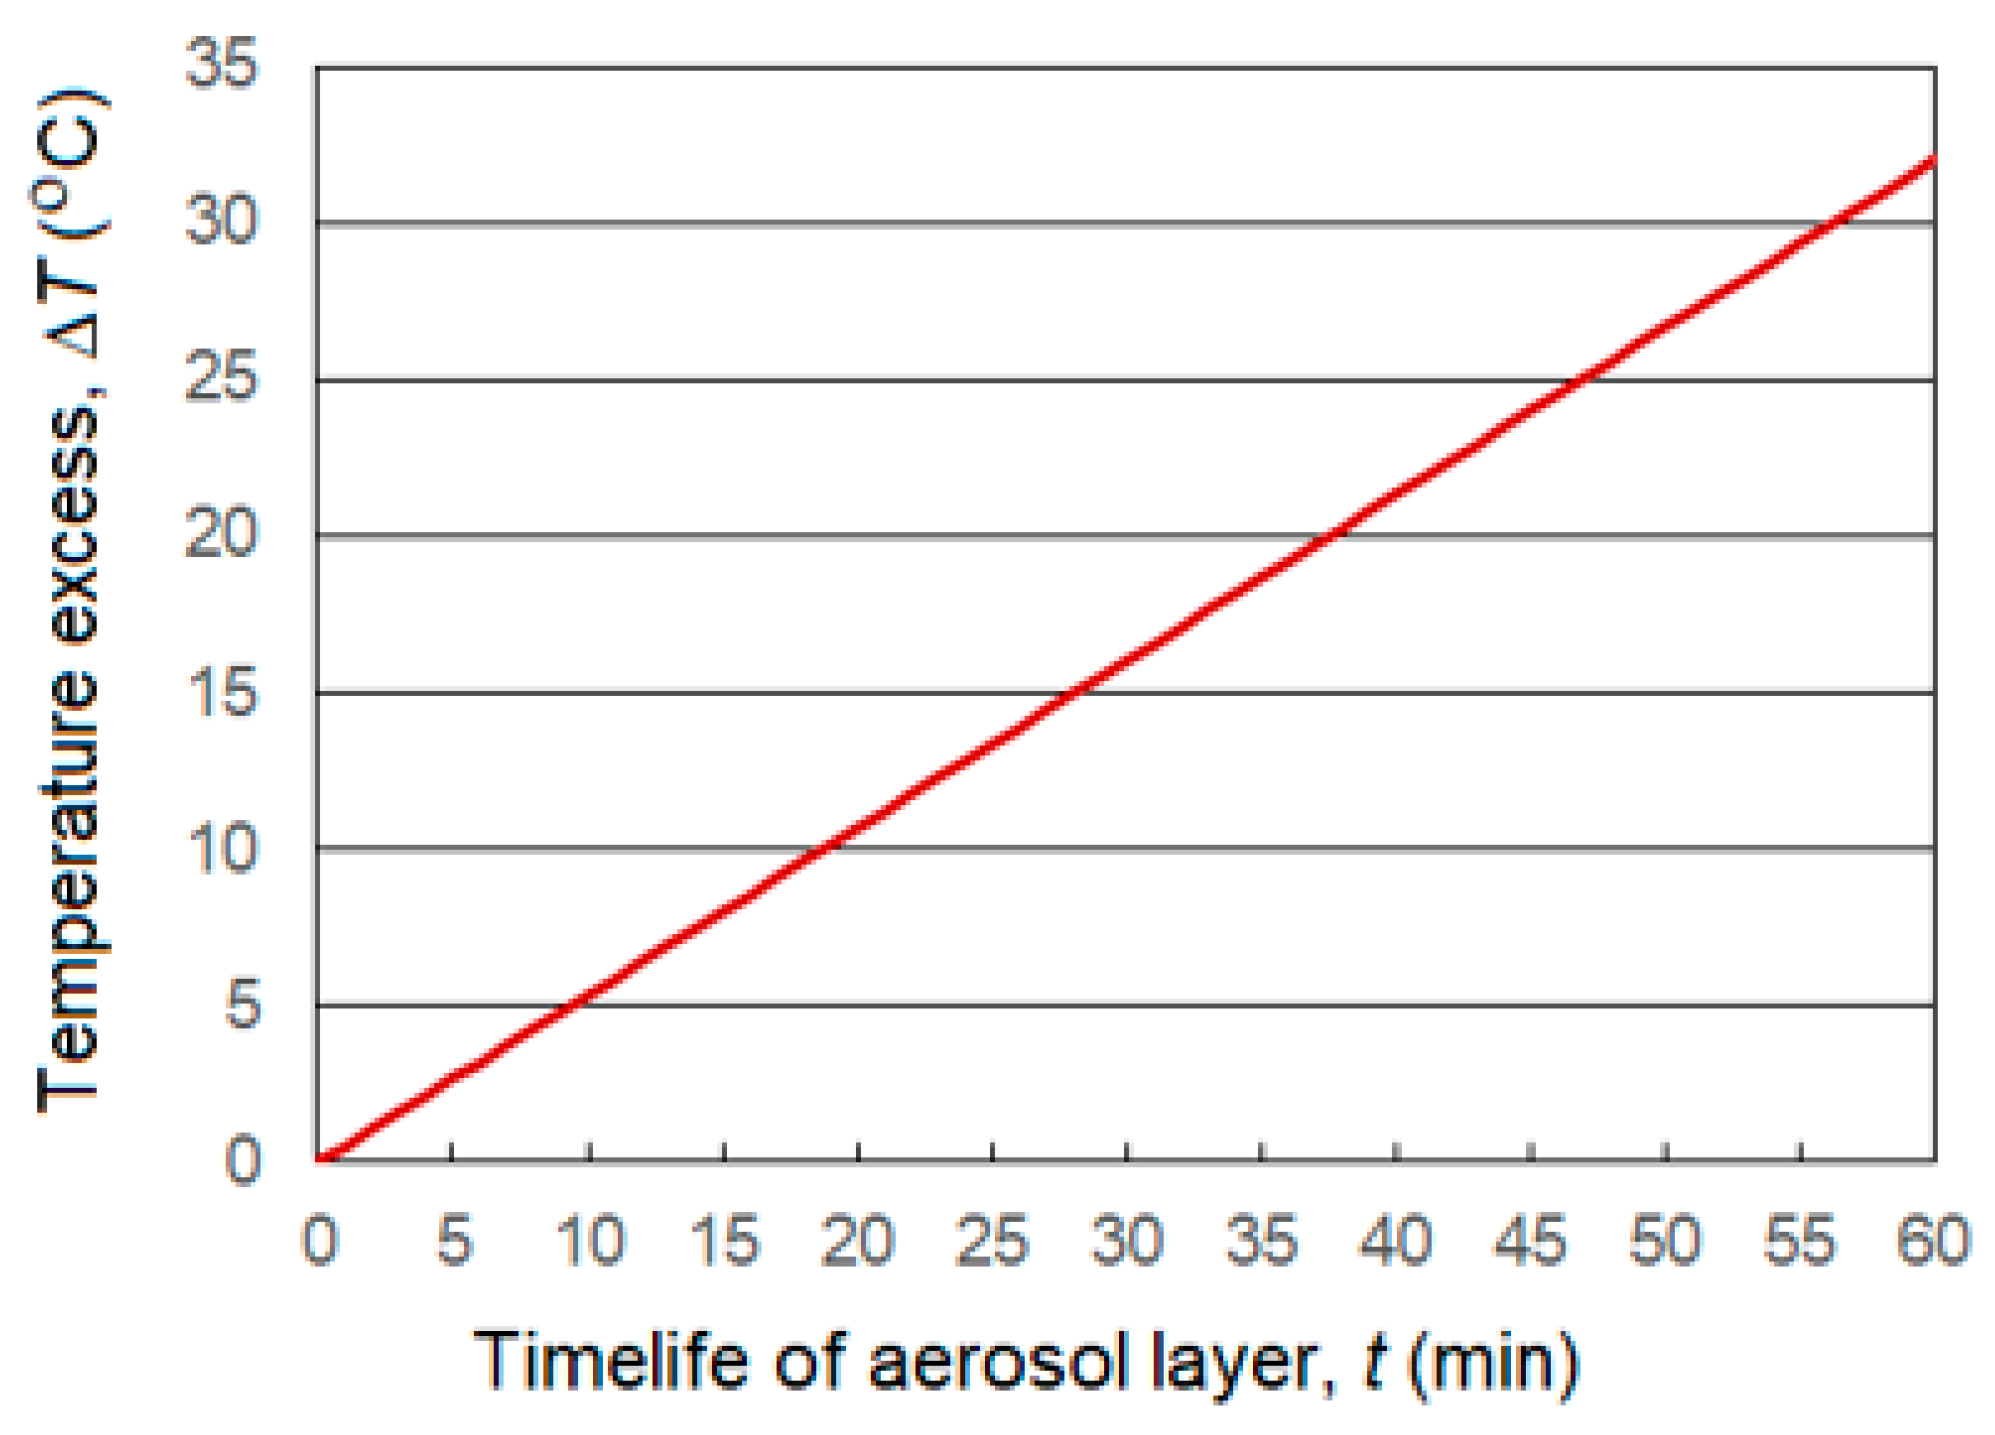
If the aerosol layer remained in the surface layer of the atmosphere without rising up, then after 1 h of action of five continuous aerosol sources located 200 m along the line across the wind direction, the air temperature in the aerosol layer would exceed the ambient air temperature by 32 °C (
Figure 5). However, this cannot occur, because as it heats up, the air will rise, forming an upward flow.
2.5. Convection Stimulated by Aerosol Layer
Numerical simulation of an axisymmetric convective flow with the simplest algebraic model of turbulence was studied in [
40]. A simplified two-dimensional mathematical model of moist air convection in the sub-cloud and cloud layers that was approximately solved by an analytical solution showed the strong influence of near ground atmospheric parameters [
41]. A combined method based on the use of a turbojet engine creating an aerosol plume that absorbs shortwave solar radiation and a mathematical model of convective jet solved analytically in cylindrical coordinates showed that for an artificially created stream to contribute to development of cloud convection, the temperature equalization height should be equal to or greater than the condensation level [
42]. The possibility of creating artificial clouds based on theoretical modeling of a vertically directed buoyancy jet was analyzed in [
43] considering vertical temperature lapse rate (TLR), wind speed, relative humidity of the near-ground atmospheric layer, and thickness of the inversion layer. The basis of most mathematical models, as noted in the article [
44], is the Boussinesq approximation or some generalization of this model, as a special case — the ascent of thermals presented in studies [
44]. The development of a mathematical model for the application of nonlinear Boussinesq equations, taking into account a significant density gradient with height, is described in [
45].
In all the above models of convective jets in the surface layers of the atmosphere, the influence of real atmospheric conditions was not taken into account: temperature, wind speed and humidity profiles, which can have a significant impact on the propagation of convective currents and, consequently, on the possibility of creating artificial clouds. In addition, to study various methods of local heating, a universal mathematical model is needed, which should take into account air flows and temperature fields, the presence of humidity, as well as phase transitions. As a result of scientific work, a mathematical model for the study of ascending convective flows in the atmosphere is described, which provides a stable 3D solution, the presented model is implemented in the CFD FlowVision software package suite [
46].
2.5.1. Mathematical Model of Large-Scale Atmospheric Currents FlowVision
Theoretical modeling of artificial convection stimulated by the aerosol layer due to the absorption of solar radiation energy and heating of local areas of the surface atmosphere was carried out on the basis of the FlowVision [
46], created to solve problems of gas-hydrodynamics and heat transfer. FlowVision is a package for multidisciplinary simulation such as internal and external flows, radiation and heat transfer, chemical reactions and combustion, multiphase flows (with particles or with an interface), fluid-structure interaction, electromagnetic hydrodynamic processes, etc.
This mathematical model is used to study convective flows in the atmosphere up to several kilometers high. The hydrostatic pressure component in the problem under consideration is much larger than the pressure changes that occur during the development of convective flows in the atmosphere (thermals). On a global scale, devices for creating convective currents can provide air speeds of the order of 1–5 m/s. Such speeds will lead to pressure fluctuations of the order of 1–10 Pa. If the calculation cell (globally) has a vertical extent of about 50 m, and a significantly smaller size of the calculation cells will lead to unjustified machine costs, the change in pressure in the cell due to gravity will be about 500 Pa-much more (
Figure 6). Therefore, numerical calculations are carried out in relative terms.
2.5.2. System of Equations
When modeling, the following equations are solved.
where ρ—air density; ∇—time;
V—air velocity vector.
where
—viscous stress tensor effective;
g—acceleration vector of the free sedimentation;
μ—molecular coefficient of dynamic viscosity;
μt—turbulent coefficient of dynamic viscosity;
—strain rate tensor.
where
H—total enthalpy;
Jq—heat flux density vector;
λ—molecular thermal conductivity;
Cp—specific heat capacity;
Prt—turbulent Prandtl number;
Le—Lewis molecular number;
Le t—turbulent Lewis number;
ℎi—thermodynamic enthalpy of the
i-th component;
Yi—mass fraction of the
i-th component of the mixture.
For the transfer of water vapor, as well as another gas mixed with air (combustion products), the following equation is calculated:
where
mass fraction of the component;
—source term of the
i-th component;
—diffusion flux of the
i-th component;
—molecular Schmidt number of the
i-th component;
—turbulent Schmidt number of the
i-th component.
To simulate turbulent momentum transfer, the
k-
ε model of turbulence-KEFV model [
47,
48,
49] is used. It determines turbulent viscosity and turbulent heat conductivity. The turbulence model described by KEFV is suitable for both low and high Reynolds calculations [
48]. To set the boundary conditions on solid walls, the equilibrium near-wall functions are used in FlowVision, other variables are described in [
46].
3. Results
3.1. Model Verification
Verification of the equations’ solution using the FlowVision large-scale atmospheric flow model using the example of calculating the adiabatic rise of heated air without friction in a vertical pipe 6 km high showed that the relative output error does not exceed 0.1% (see
Figure 7). The computational grid was selected based on the results of the convergence study. The total number of computational cells depends on the task (large computational area for a larger area) and ranges from 63 thousand cells to 200 thousand cells for a larger option. The minimum size of the computational cell in the area of local grid thickening near the heat release is 0.625 m.
3.2. Computing Resources
During the study, it was necessary to conduct more than 100 numerical experiments. Since the dimension of the computational grid reached 12 million computational cells, there was a need to carry out calculations on a supercomputer. Moreover, 3D calculations with wind were carried out using the “Tornado” supercomputer of South-Ural State University. The number of nodes for each task was chosen based on the general recommendations for loading cores and the optimal number of cells per core, carried out for the FlowVision in the study [
50,
51]. Simulation of one design case takes about 20 h when working in the optimal mode.
3.3. Simulations of Aerosol Layer
Modeling of the heated air layer was carried out by setting a constant heat source Q = 400 W/m2 (for Russia) and 1000 W/m2 (for the United Arab Emirates), taking into account the albedo.
Figure 8 shows the vertical section of a thermal that can form in a calm atmosphere due to the heat of solar radiation absorbed in the aerosol layer created by a pulsed (short-term) aerosol source. It follows from this figure that 30 s after the creation of the aerosol layer, the temperature in it can exceed the ambient air temperature by Δ
T = 0.14 °C. After 5 min, the Δ
T value may rise to 1.42 °C and the thermal will begin to lift off the ground. After 10 min, according to the calculation data, the thermal breaks off the ground and rises in the atmosphere to a height of 150 m at Δ
T = 1.37 °C. After 15 min, the top of the thermal reaches a height of 360 m, and after 20 min it reaches 570 m. The ascent rate is about 0.7 m/s. As it rises, the excessive temperature of the thermal decreases to Δ
T = 0.6 °C at the 15-th minute and to Δ
T = 0.18 °C at the 20-th minute. Decreasing the Δ
T value causes the thermal’s rate of ascent to decrease and further ascent to cease gradually.
The vertical extent of the convection layer stimulated in a calm atmosphere by an aerosol layer created by continuous aerosol sources strongly depends on the area of the aerosol layer.
Figure 9 shows that with the area of the aerosol layer
S1 = 0.01 km
2 the height of the convection layer does not exceed 500 m; with
S2 = 0.1 km
2 it reaches 760 m; with
S3 = 1 km
2 the upper edge of convection can reach a height of 2300 m, and with
S4 = 10 km
2 thermal convection covers the near ground atmosphere layer up to a height of more than 3 km and has a significant horizontal extent.
Thus, according to numerical simulation, it turns out that in order to initiate artificial thermal convection and develop convective clouds in a windless atmosphere, the area of the aerosol layer should be about 1 km
2 or more, and its duration should be about 0.5 h or more. With an increase in the area of the aerosol layer to 10 km
2, comparable to the size of Cu Cong, the penetration height and the velocity of the updraft in a windless atmosphere increase sharply (
Figure 9d).
After 1 h of action in a calm atmosphere of five aerosol sources located 200 m apart along a line perpendicular to the wind direction, the aerosol concentration in the surface layer exceeds
NAS = 10
12 m
−2 (
Figure 10a), the velocity of the initiated updraft reaches 8 m/s (
Figure 10c), and the temperature rise near the ground in the center of the jet is Δ
T = 1.2 °C (
Figure 10b). The updraft jet rises to a height of about 1000 m.
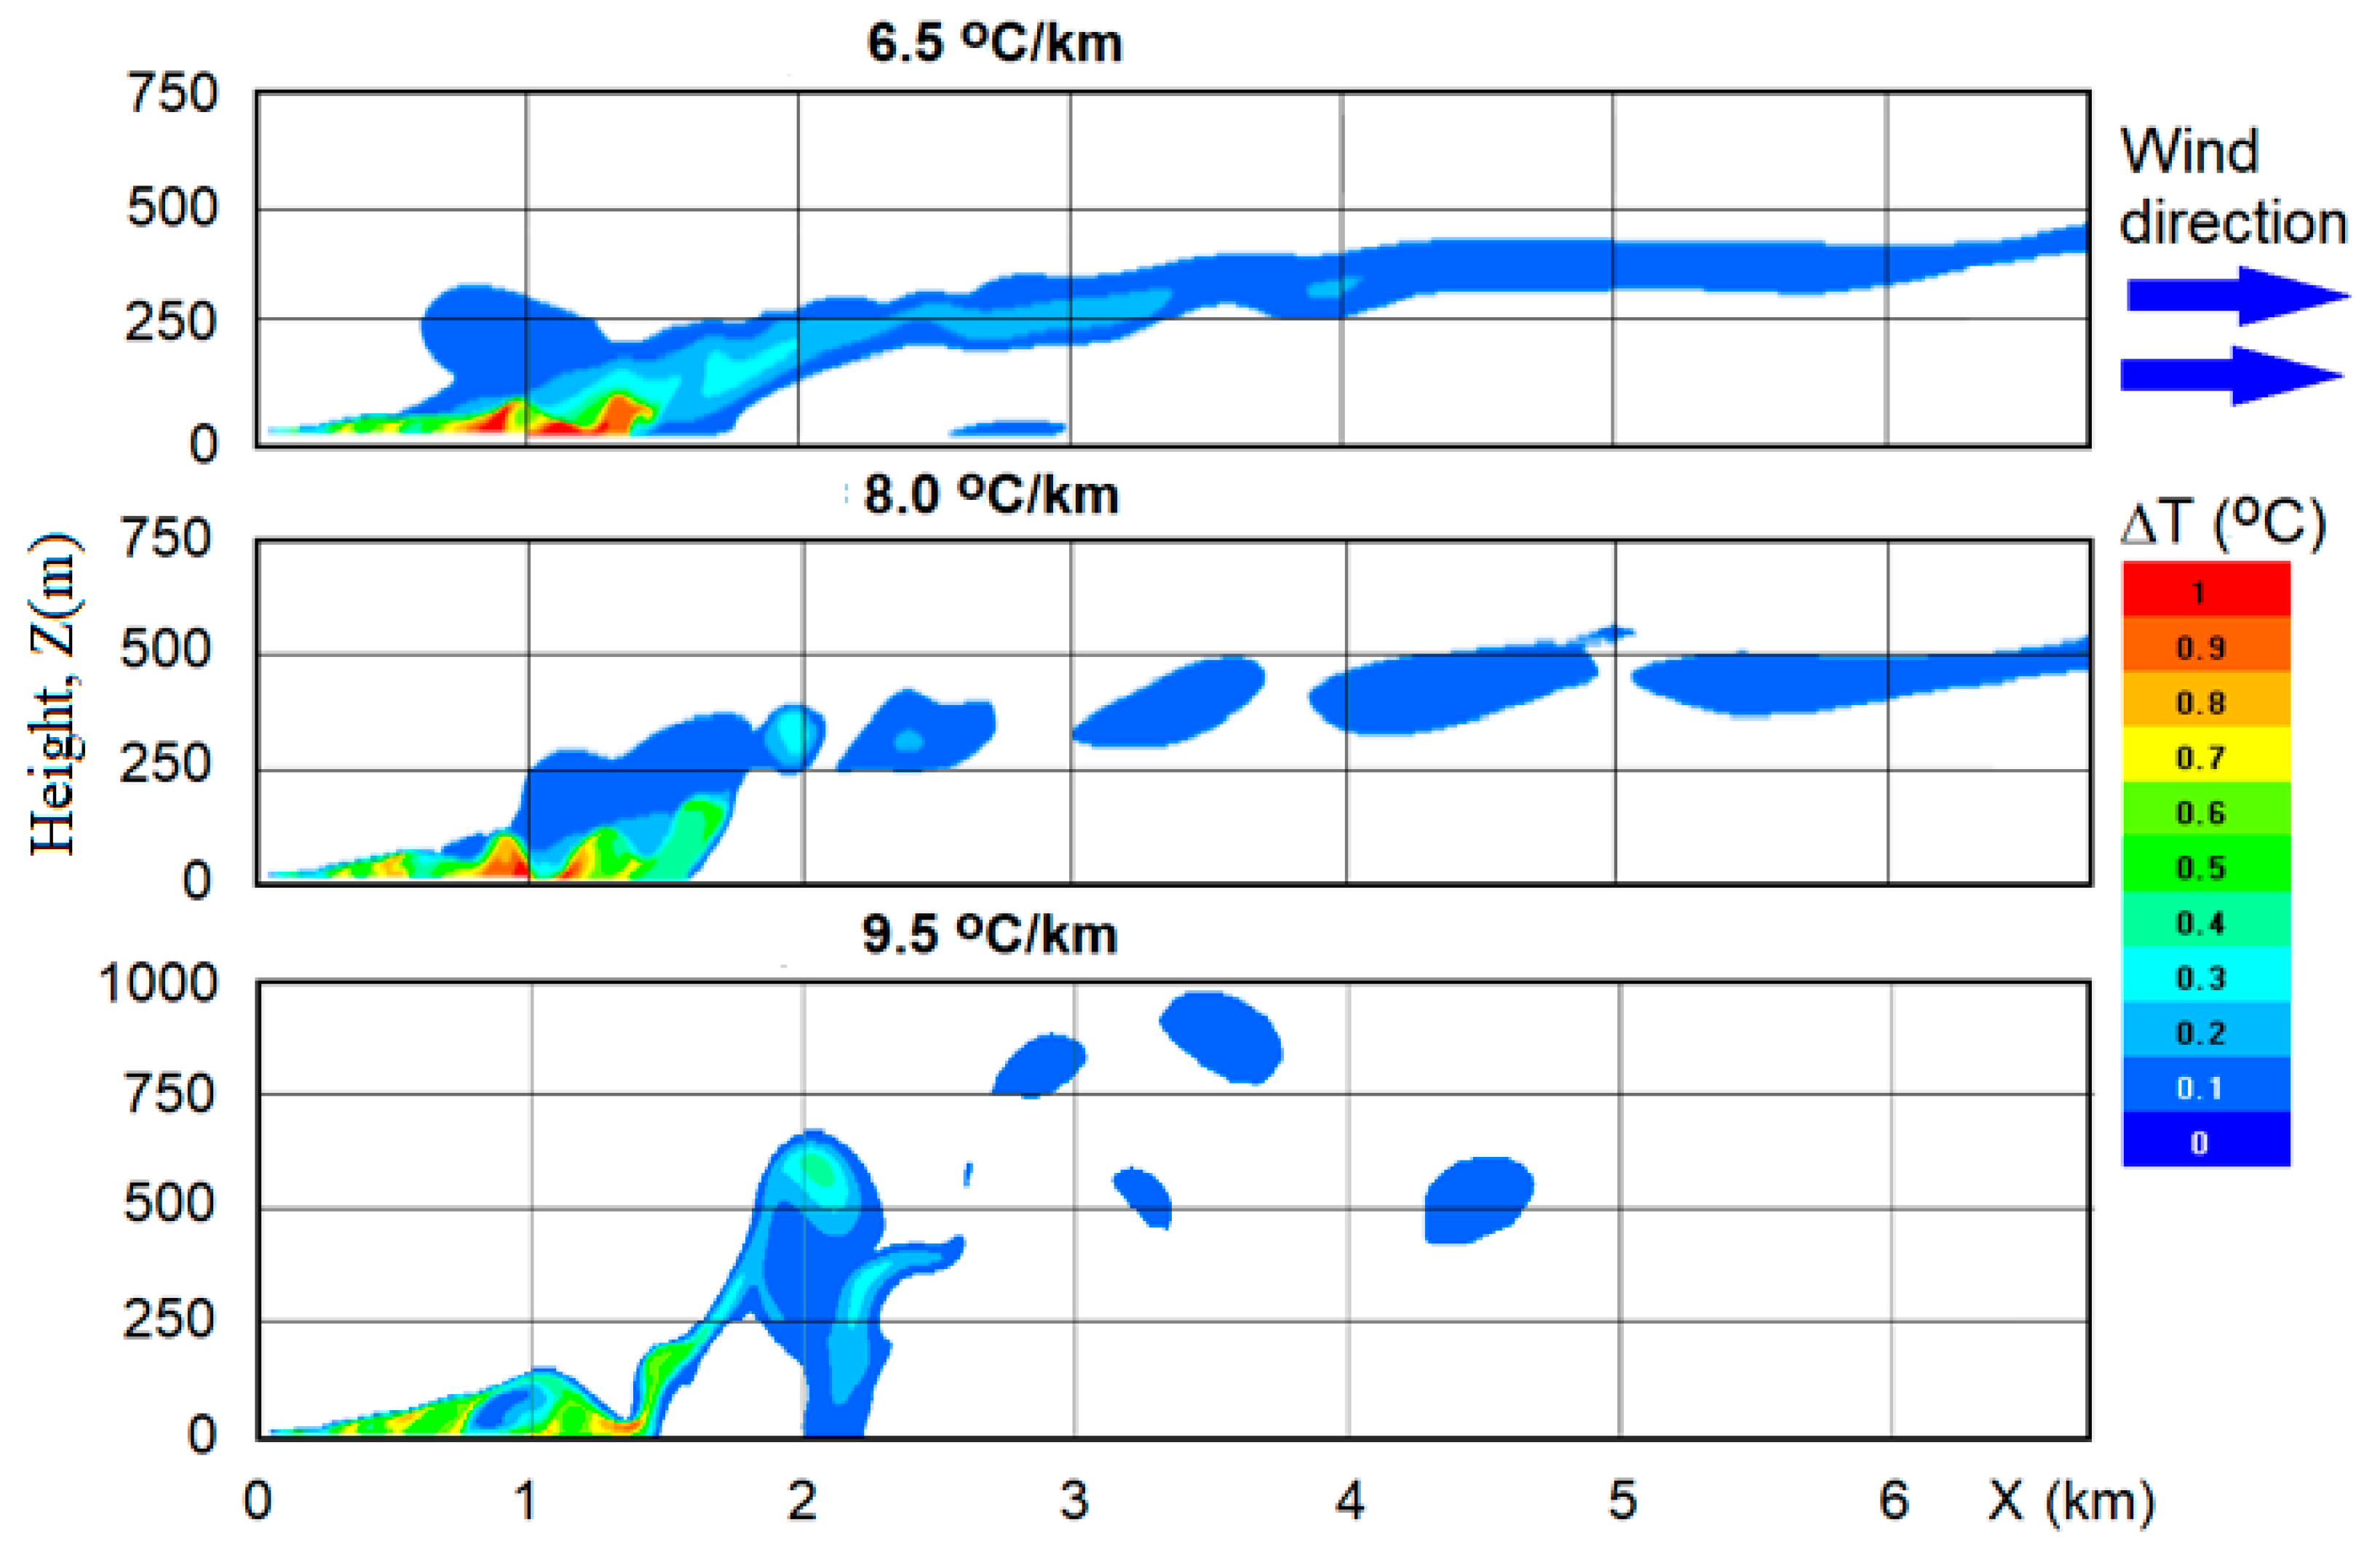
In a real atmosphere, there is always a horizontal wind that blows away thermal convection. Modeling of this process showed that even with a vertical wind speed gradient
U = 1 + 0.005
Z the air heated in the aerosol layer is blown away and the convection level is greatly reduced. It follows from
Figure 11a that with an aerosol layer area of 1 km
2 and TLR 6.5 °C/km the convection height does not exceed 420 m. At TLR = 8.0 °C/km it reaches 550 m and only at TLR = 9.5 °C/km does it approach 1000 m.
This indicates that even with a weak wind, an aerosol layer with an area of 1 km2 is insufficient to stimulate deep cloud convection. To do this, it is necessary to create an aerosol layer with an area of about 5–10 km2 and a lifetime of at least 0.5 h. However, if the surface wind speed exceeds 3–5 m/s and its speed increases rapidly with altitude, then attempts to stimulate the development of artificial clouds are doomed to fail, even at TLR = 9.5 °C/km.
Thus, according to numerical simulations data, it follows that the initiation of thermal convection and the creation of artificial convective clouds by the aerosol layer method is possible only with an aerosol layer area of more than 1 km2 and the following favorable atmospheric conditions:
- –
low speeds of surface wind and low wind shear to the level of condensation;
- –
temperature lapse rate more than 8–9 °C/km;
- –
high moisture content of the atmosphere, contributing to a decrease in the level of condensation.
It can be assumed that these conclusions are also acceptable for other solar meteotrons based on covering the Earth’s surface with asphalt, black cloth, and other light-absorbing screens.
4. Development and Testing of Aerosol Checkers
An aerosol layer that absorbs solar radiation can be created using smoke checkers [
52] designed to mask large objects (ships, airports, etc.). Within the framework of the UAEREP [
53] project No. APP-REP-2017-02120 for the implementation of the aerosol method for creating artificial clouds [
14], formulations of pyrotechnic compositions generating an aerosol of optimal dispersion for absorbing solar radiation were developed and tested, designs were created and pilot batches of large aerosol checkers ADSH-1 and ADSH-2.
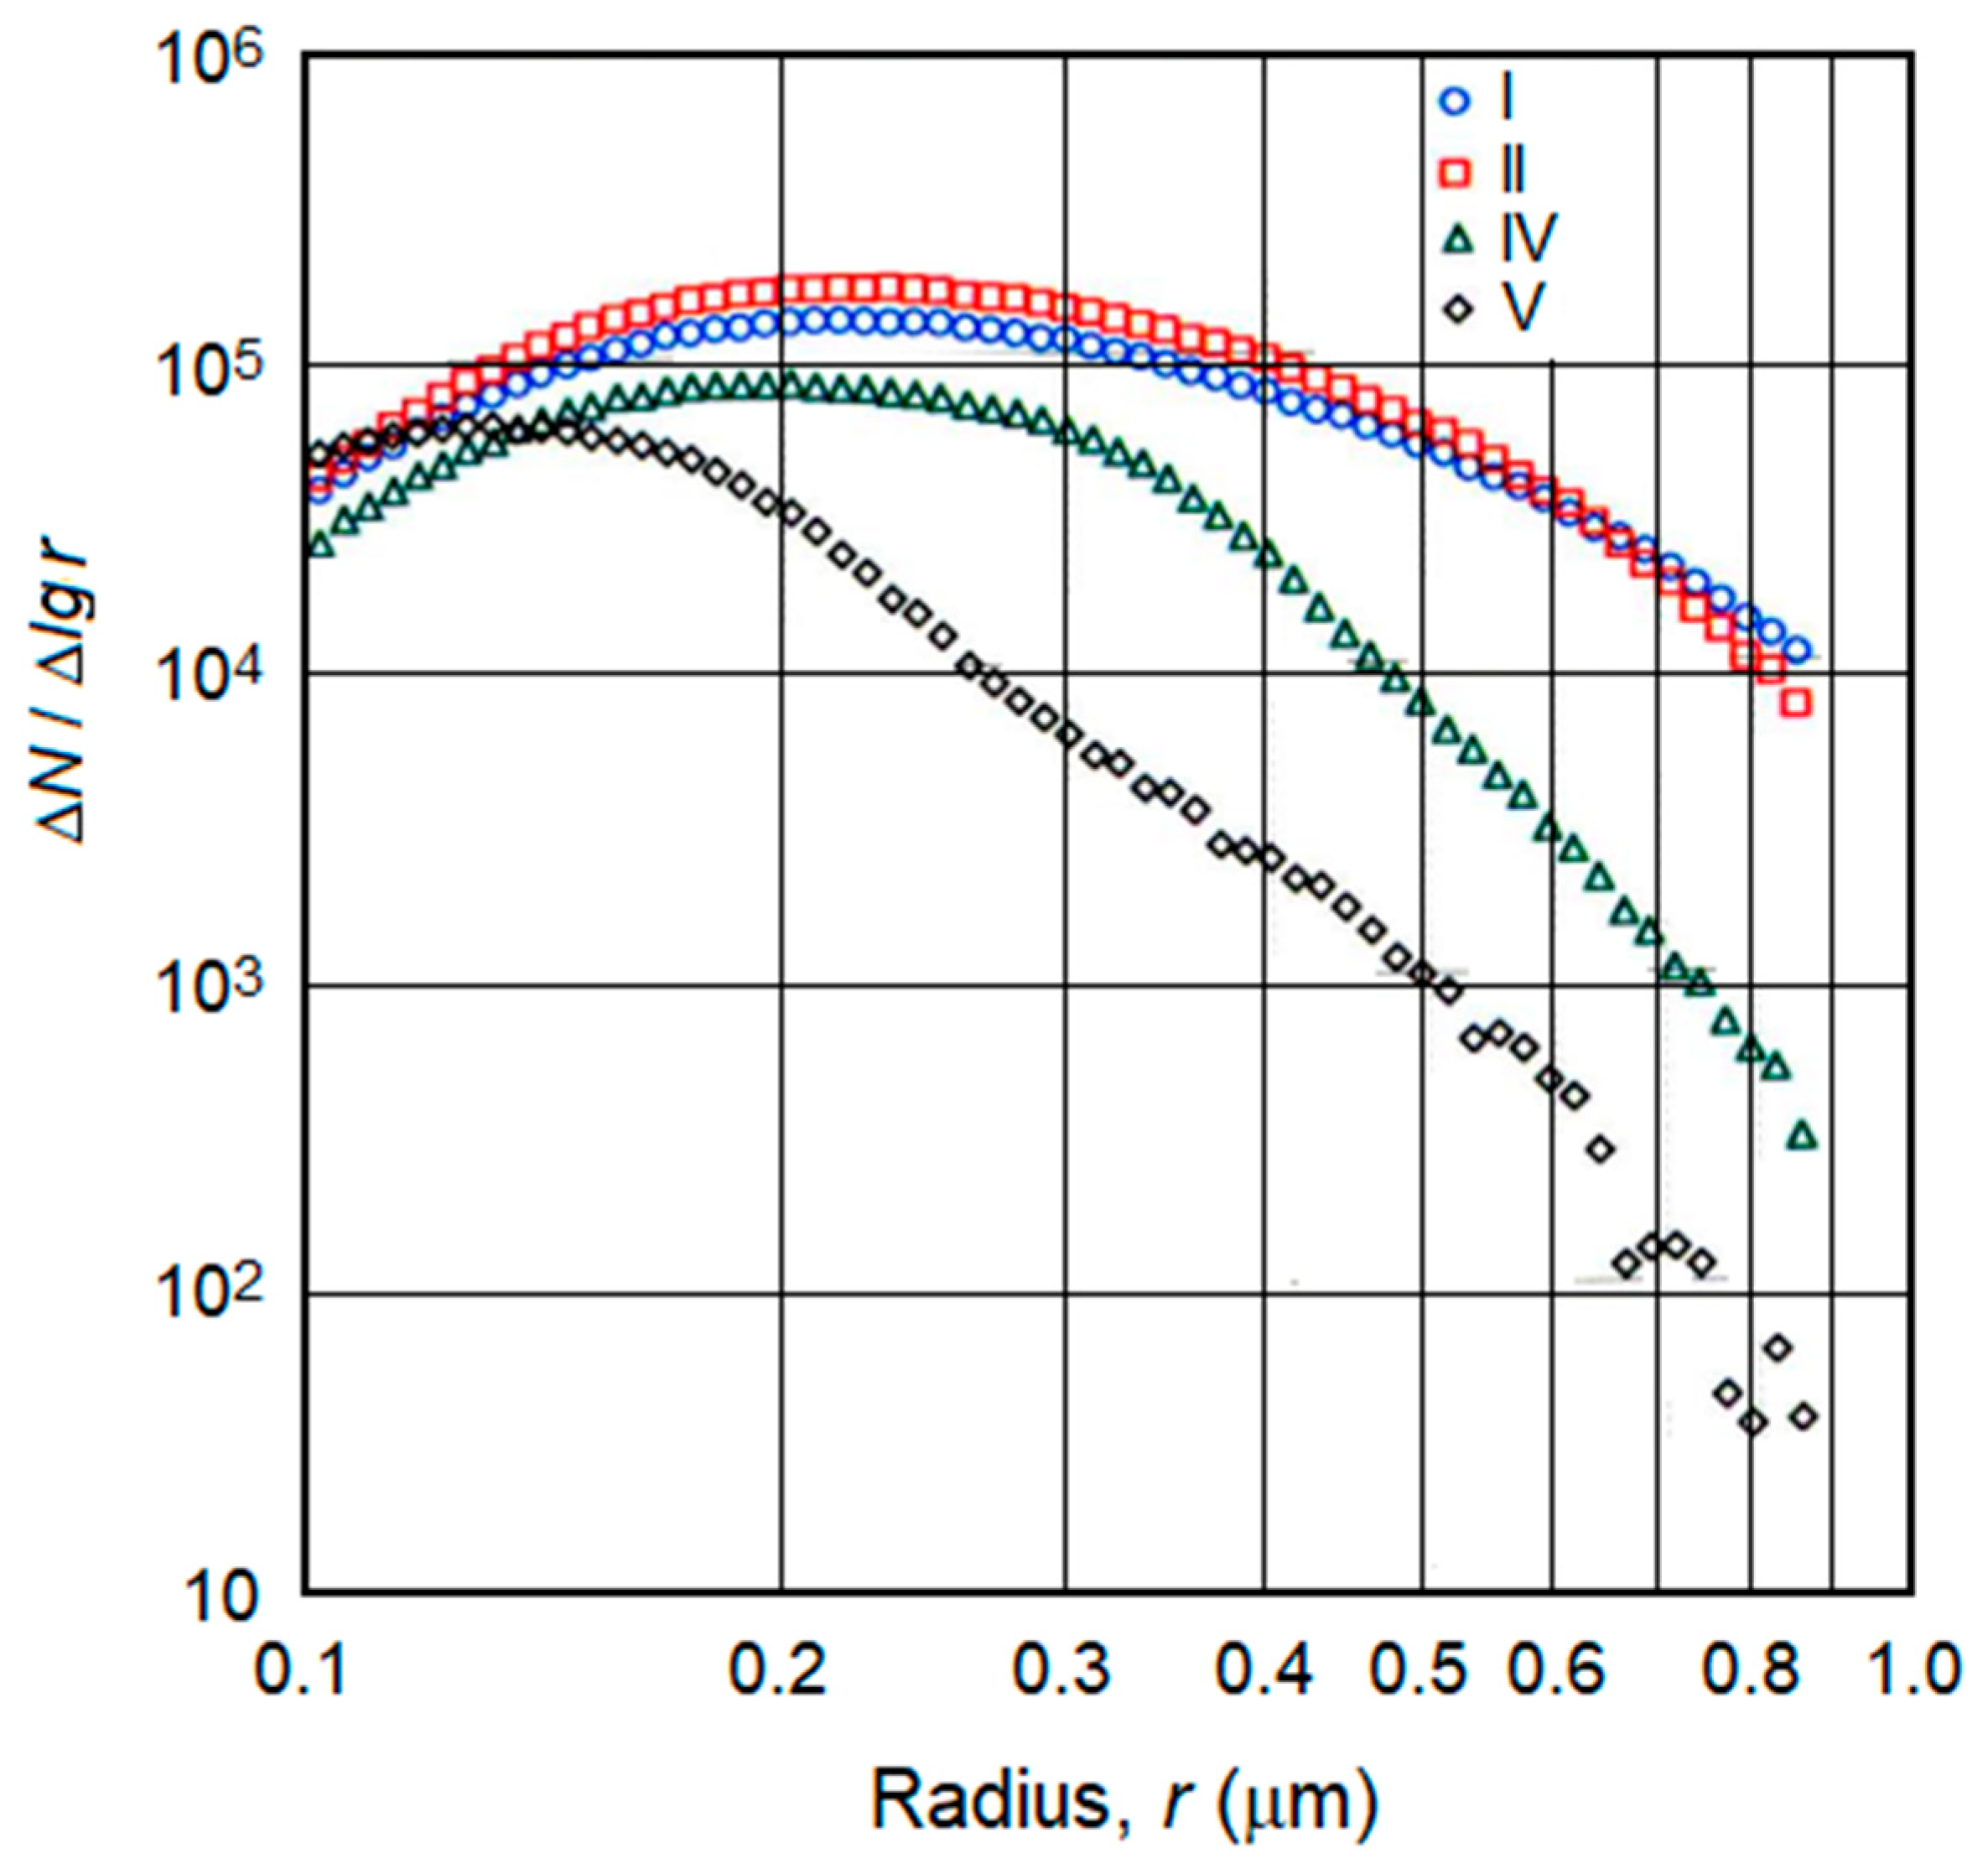
Together with Cheboksary Production Association Chapaev (Cheboksary, Russia) and Kazan Federal University (Kazan, Russia), five variants of smoke compositions were first developed. For their testing, checkers with a diameter of 26 mm and a mass of 10 g were made. Laboratory tests of these checkers (two pieces of each option) were carried out at the Typhoon Research and Production Association (Obninsk, Russia). Igniters were burned in a horizontal wind tunnel at a blowing speed of 2 m/s (videos of the combustion of smoke checkers can be seen in the resource:
https://youtu.be/KcxanooVAMw and
https://youtu.be/W3IF9rpw43E). After aerosol sampling, the samples were introduced into a cloud chamber with a volume of 12 m
3. The particle spectrum was measured using Laser Aerosol Spectrometer 3340 and Electrostatic Classifiers TSI 3080 analyzers. The test results are presented in
Table 1 and
Figure 12.
According to the results of these tests, composition II was chosen, which gives 5.6 × 10
13 particles with a modal radius of 0.225 μm from 1 g. Using this composition, an experimental batch of ADSH-1 aerosol checkers weighing 25 kg was made in the amount of 10 pcs. These checkers had a metal case in the form of a cylinder with a radius of 360 mm and a height of 600 mm (
Figure 13a) and a remote electric ignition device. According to laboratory tests, one such checker can generate about 1.4 × 10
18 aerosol particles.
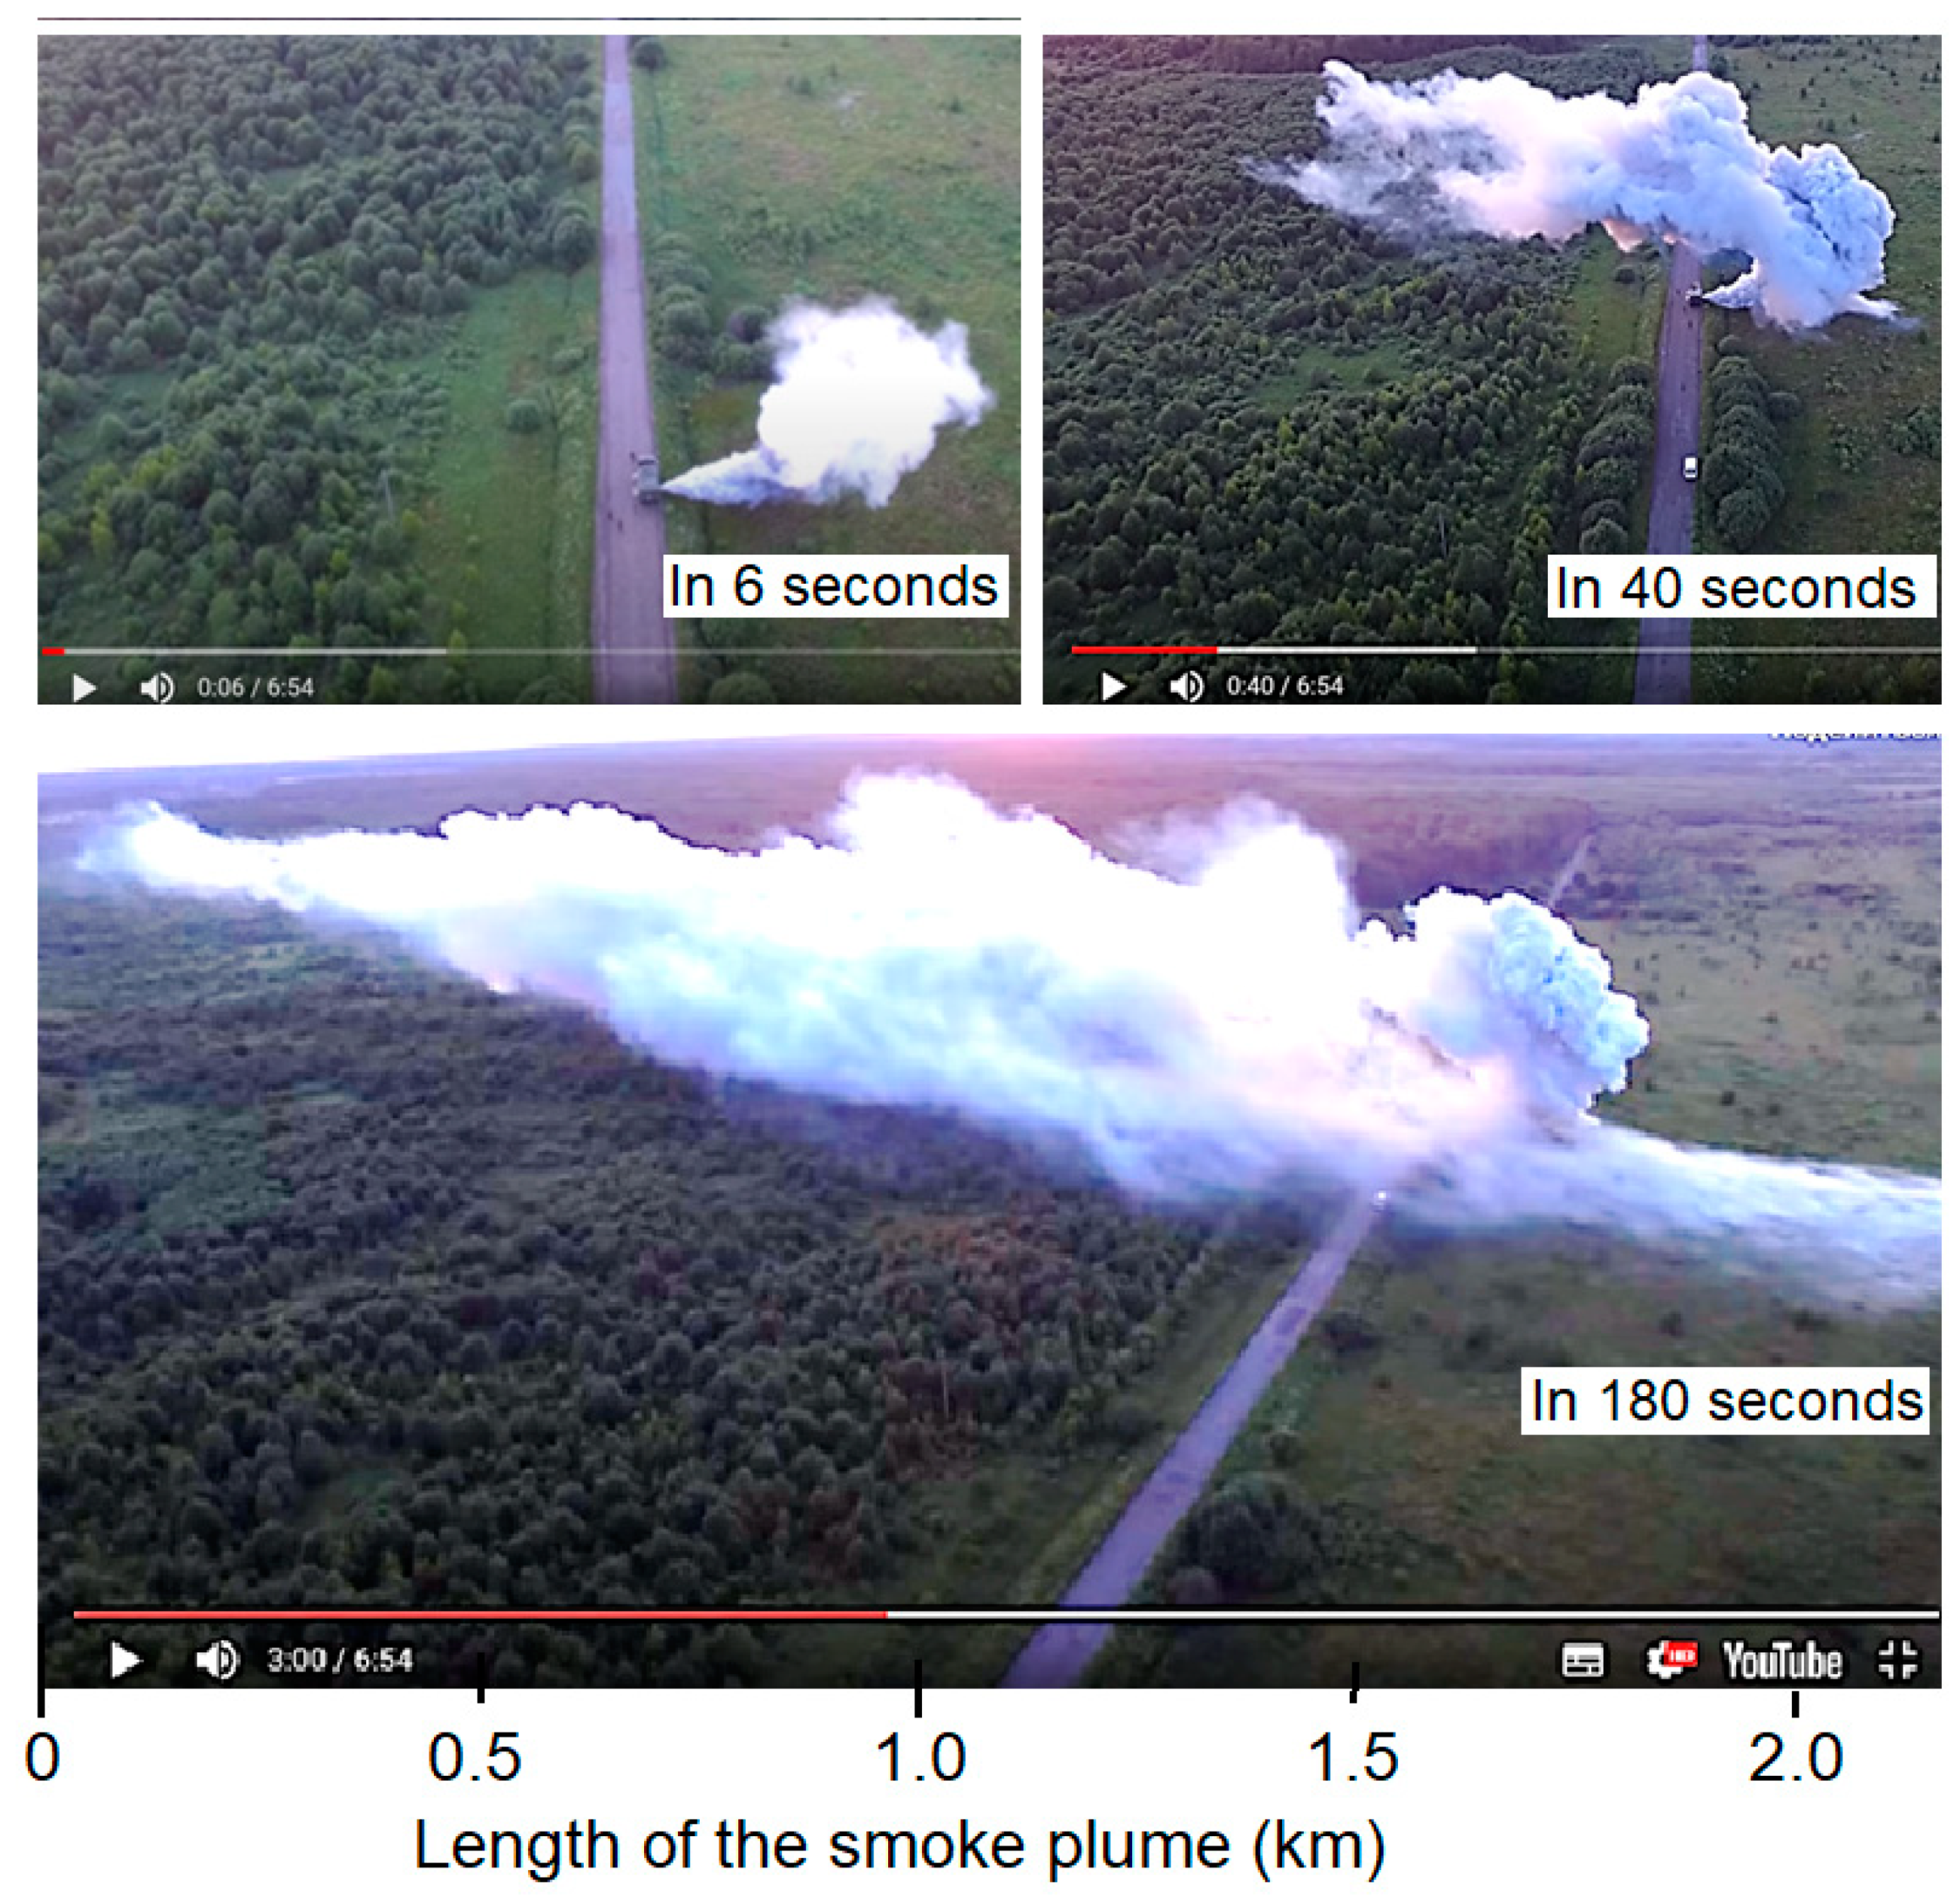
Field tests of an experimental batch of ADSH-1 checkers were carried out at the testing site of the Cheboksary Production Association Chapaev from 2 October to 12 November 2019. The tests were carried out on days with a wind speed of about 3–7 m/s. Aerosol plumes stretched downwind (
Figure 13b). The aerosol practically did not sediment due to its small size, but its concentration rapidly decreased due to turbulent diffusion and wind transport. The burning time of the checkers was, on average,
Dt1 = 9.3 min. The dissipation time of the aerosol plumes after the end of the checkers combustion was about
Dt2 = 3.7 min. Thus, the aerosol trail of each checker existed for about
Dt3 =
Dt1 +
Dt2 = 13 min. The area of the aerosol layer created by one checker is about
DS = 4000 m
2. The aerosol concentration in such a layer is at least
NAS ≥ 3.5 × 10
14 m
−2. This is sufficient to completely absorb solar radiation.
To create an aerosol layer on an area of 10 km2, lasting for t = 30 min, it is necessary to burn about n = 5770 ADSH-1 checkers ( pcs). In this case, the consumption of the aerosol composition will be about 144 tons.
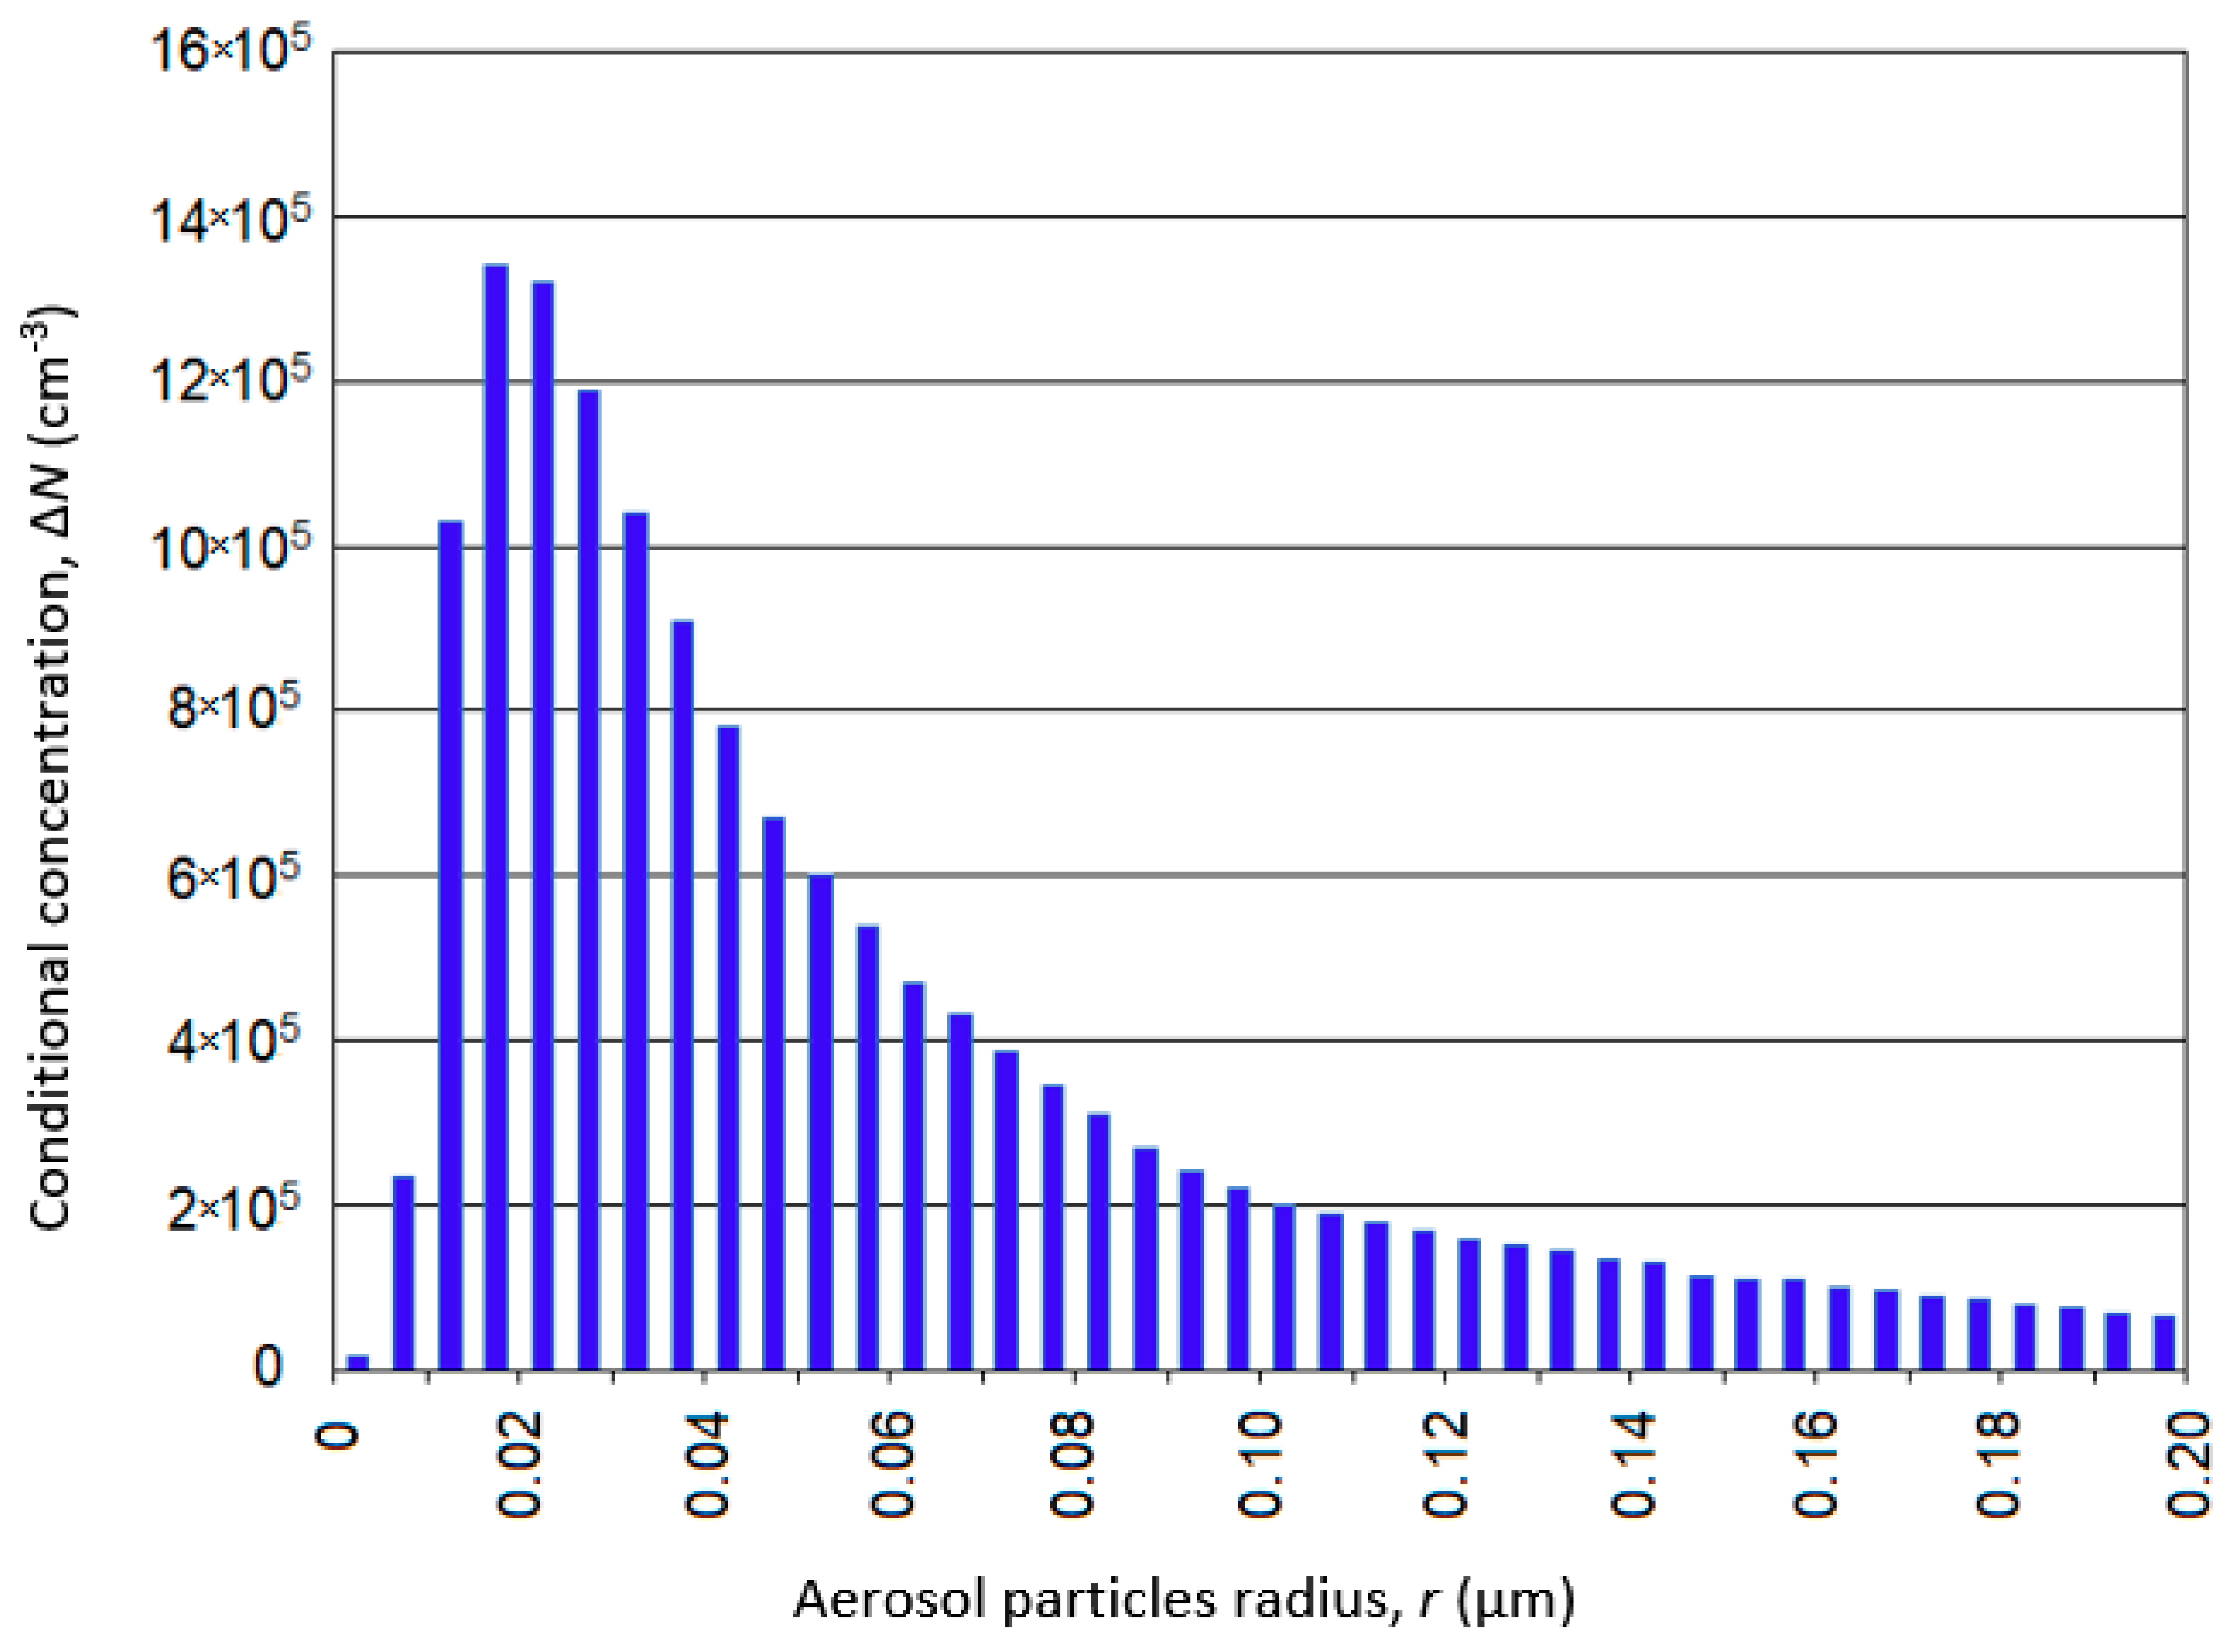
In order to reduce such a large consumption, two more options for smoke compositions were developed that generate a finer aerosol with a modal radius of 0.02–0.03 μm (
Figure 14) and a yield of about 5 × 10
15 particles per 1 g of composition.
Field tests of ADSH-2 checkers equipped with composition No. 6 showed that the burning time of these cartridges is 14 min, the area of the aerosol plume (
Figure 13c) reaches 5000 m
2, and the dissipation time of the aerosol plume in wind speeds of 3–5 m/s is 4–5 min. With these parameters of the ADSH-2 cartridges, it takes about 3160 checkers with a total consumption of the aerosol composition of 79 tons to create an aerosol layer on an area of 10 km
2 with a lifetime of 30 min. The use of ADSH-2 cartridges is more preferable compared to ADSH-1 cartridges, since the consumption of cartridges and smoke composition is reduced by almost 1.8 times. At the same time, the consumption of such a number of aerosol checkers calls into question the feasibility of using such a method.
5. Discussion
The power of such a solar meteotron, due to the absorption of solar radiation at an aerosol layer area S = 10 km2, is P = P(λ)⋅Δλ⋅γ⋅S⋅sinθ⋅A ≈ 640 kW. When burning 79 tons of pyrotechnic composition within 30 min, about 1300 MJ/s can be released, which will be equivalent to a power of 1300 MW. Therefore, the energy absorbed by the aerosol layer from solar radiation is only a small fraction of the energy of burning pyrotechnic checkers.
Comparison of the power of various meteotrons and the consumption of combustible material (
Table 2) shows that the solar meteotron requires 1.3–1.5 times less combustible material than other meteotrons. However, this method becomes even more economical if, instead of smoke checkers, TDA-3 smoke machines and their analogues are used [
54], which can create an aerosol layer over an area of up to 3–5 km
2 (
Figure 15) by burning a liquid smoke mixture or a powder composition in quantity up to 2.5 m
3/h. One TDA-3 filling is enough for 2–3 h of operation.
The creation of an aerosol layer is simpler and many times cheaper than the creation of asphalt, fabric and other coatings of large areas. The aerosol solar meteotron has no losses due to energy leakage into the soil, like asphalt and cloth soil coverings. The advantage of the aerosol method is also that the aerosol generated by smoke checkers has electric charges, a branched shape [
52], which can contribute to the condensation of water vapor even in unsaturated air and accelerate precipitation formation. However, it should be noted that soot particles without impurities are not good cloud condensation nuclei [
55].
The combination of these advantages makes it promising and preferable to use the aerosol method to create artificial clouds and precipitation in comparison with other types of meteotrons. Favorable conditions for its use are days with low wind speeds, the presence of potential energy of instability above the level of condensation, high humidity and low level of condensation. The most acceptable time of day for the creation of artificial clouds is the period of maximum heating of the surface air from 15:00 to 18:00 local time, and a more acceptable place is the windward flank of a hill.
6. Conclusions
To create artificial clouds and precipitation, a method is proposed for initiating thermal convection by heating the surface air from solar radiation [
14] by creating an artificial aerosol layer that absorbs solar radiation.
Based on the theory of light wave scattering in an aerosol medium, it has been established that the main spectrum of solar radiation is best absorbed by aerosol particles with a radius of 0.01 to 0.2 µm. Calculations of the values of the absorption coefficient, carried out according to the exact diffraction formulas of the scattering theory, showed that with a dosage of such an aerosol of more than 0.25 g/m2, the number of aerosol particles in the vertical column reaches NAS ≥ 1012 m−2, which ensures almost complete absorption of solar radiation.
Based on the model of turbulent diffusion and wind transfer of aerosol from stationary and mobile sources of instantaneous and continuous action and the calculation of particle concentration fields at different wind speeds, it is shown that the area of the aerosol layer with a dosage for the complete absorption of solar radiation created by five continuous sources for 30 min, can reach from 1.5 to 5 km2. Estimates of the time dependence of the amount of solar radiation absorbed by the aerosol layer and the power of the solar meteotron have been carried out.
Numerical modeling of ascending flows stimulated by an aerosol layer in a cloudless and cloudy atmosphere, based on the 3-D CFD model of the FlowVision software package suite, showed that in order to stimulate convection, which can reach the level of condensation even at low wind speeds and TLR ≥ 8 °C/km, it is necessary to create an aerosol layer on an area of about 5–10 km2.
A total of eight formulations of smoke compositions and experimental batches of ADSH-1 and ADSH-2 aerosol checkers were developed and tested, generating an aerosol of optimal dispersion to create an aerosol layer. Field tests of these checkers have shown that even at a surface wind speed of 5–7 m/s they can create a dense aerosol layer over an area of 3000–5000 m2, but turbulent diffusion and wind transfer lead to dispersion of aerosol plumes in 4 and 5 min, respectively.
Calculations carried out taking into account the test results showed that to create an aerosol layer on an area of 10 km2 with a duration of 30 min requires about 79 tons of pyrotechnic composition. This is approximately 1.3–1.5 times less than the consumption of oil products in the meteotrons of Dessence, Vulfson–Levin, etc.
These preliminary findings show only the principal possibility of initiating thermal convection. What kind of clouds can be formed in this case, whether they will produce rain, and how often there can be favorable conditions for the creation of artificial clouds and precipitation in arid regions can be established on the basis of full-scale field experiments and statistical studies of 3D structure of wind, humidity and temperature in the atmosphere.
In conclusion, it should be noted that the pyrotechnic compositions used do not contain toxic and harmful components. The aerosol plume, due to the high initial temperature, immediately rises upwards of 10 to 30 m. Nevertheless, the aerosol method for creating artificial convection should be used away from populated areas.
7. Patents
Abshaev M.T., Abshaev A.M., Al Mandous A., 2020. Method of creating artificial clouds and precipitation. Patent RU No. 2732710. C1, A01G 15/00 (2006.01). Filed on 11.04.19, published on 22.09.2020. Bulletin No. 27.


 ,
, 


