

Air Quality at Ponta Delgada City (Azores) Is Unaffected so Far by Growing Cruise Ship Transit in Recent Years

1
Faculty of Sciences and Technology, University of the Azores, 9501-801 Ponta Delgada, Portugal
2
IVAR, Institute of Volcanology and Risks Assessment, University of the Azores, 9501-801 Ponta Delgada, Portugal
3
Centre for Ecology, Evolution and Environmental Changes, Faculdade de Ciências, Universidade de Lisboa (cE3c-FC-ULisboa), 1749-016 Lisboa, Portugal
4
Centre for Ecology, Evolution and Environmental Changes, Azorean Biodiversity Group (cE3c-GBA), University of the Azores, 9501-801 Ponta Delgada, Portugal
*
Author to whom correspondence should be addressed.
Atmosphere 2023, 14(1), 188; https://doi.org/10.3390/atmos14010188
Submission received: 30 November 2022
/
Revised: 9 January 2023
/
Accepted: 14 January 2023
/
Published: 16 January 2023
(This article belongs to the Special Issue Feature Papers in Air Pollution, Health Effects Indicators, Exposome, and One Health)
Abstract
:The ease of travel allowed by contemporary means of long-range transportation has brought increasingly higher numbers of visitors to remote and relatively undisturbed insular territories. In a framework of environmental conservation of the natural patrimony, sustainably accommodating touristic flooding and the associated polluting footprint poses a demanding challenge. Over the past decade, Ponta Delgada, the largest city of the mid-Atlantic Azores archipelago, has become a hotspot for transatlantic cruise ship (CS) lines in spring and autumn. CSs are substantial contributors to the emissions of greenhouse gases (GHG), as well as hazardous sulphur (SOx) and nitrogen (NOx) oxides. It is hereby retrospectively investigated whether the background levels of air pollutants were raised following the CS influx at Ponta Delgada, which conventionally displays great air quality. The daily CS traffic at the local harbor was associated with the daily concentrations of air pollutants (SO2, O3, NO2, NOx, PM10 and PM2.5), monitored by the local urban background monitoring station (~1.3 km northwards). Exceedances above daily legislated limits from 2013 until 2020 only occurred sporadically for PM10 and PM2.5, often during episodes of natural dust storms. No major correlation was found between CS parameters with the recorded values of pollutants, although a noticeable signal of NOX increase of southern origin is observed during spring days with CS presence. Daily data suggest CS influx has not strongly influenced background air quality. A near-source, real-time monitoring network should be implemented in the city to provide the necessary spatial and temporal resolution for tracking short-term fluctuations in air pollutants during CS arrivals and departures.
1. Introduction
Socio-economic development is exceptionally challenging in insular regions, given their isolation, confinement, territorial fragmentation, complex orography, restricted land availability and limited supply of natural resources [1,2,3]. Travel accessibility, allowed by contemporary means of long-range transportation, has allowed for increasingly higher numbers of visitors to reach remote islands around the world, long sought after as adventurous destinations [4]. Capitalizing on island touristic appeal has created the opportunity to grow their weak economies, compensating for the exceeding costs of development inherent to insularity and dependence on subsidization from central governments [5,6]. However, sustainably accommodating the demands of touristic flooding in a framework of environmental conservation of the natural patrimony of insular territories is a primary concern. The propensity for tourism massification is a vector of dramatic landscape changes and aggravates the contaminating footprint from anthropogenic pollution [6,7].
Coastal and marine tourism provided by the cruise industry remains one of the fastest-growing economic sectors, reaching almost 30 million passengers worldwide in 2019 [8]. Considering their massive size, luxuries, and population aboard, akin to floating hotels, long-distance travels and reliance on combustion engines, cruise ships (CS) have become principal pollution sources in marine ecosystems and substantial contributors to the emissions of greenhouse gases (GHG) such as CO2 and CH4, as well as sulphur (SOx) and nitrogen (NOx) oxides [9,10]. It was recently estimated that CS NOX emissions in Europe are equivalent to 15% of the yearly volume emitted by Europe’s whole passenger car fleet. Moreover, CSs belonging to the world’s largest luxury cruise operator were responsible for 10× more SOx in ports from European coasts than 260 million European cars [11]. CS engines can use up to 10× as much fuel as a standard cargo bulk carrier [12]. Even the most efficient CS currently operating emit up to twice as much CO2 per passenger per kilometre (CO2/pax-km) than common passenger jet planes [13]. The increasing environmental and health impacts of cruise tourism warrant closer monitoring and regulation [14].
There is a vast and ever-growing body of evidence sustaining the global concern about the adverse effects and burden of disease associated with air pollution. Tropospheric, outdoors air pollution, especially particulate matter, is a leading cause of premature death globally and is linked to a higher risk of congenital anomalies [15,16]. Thurston et al. (2017) provide an overview of diseases, conditions and biomarkers affected by pollutants such as gaseous and particulate emissions from traffic activity. Multiple organs are deeply affected, contributing to respiratory diseases, lung cancer, pneumonia and decreased lung function, cardiovascular diseases, arrhythmia and congestive heart failure, neurodegenerative diseases, metabolic diseases such as diabetes, high blood pressure, deep vein thrombosis, decreased birthweight or premature birth, cutaneous conditions/skin ageing and decreased sperm quality. The disease burden from short-term exposure is not to be neglected either, particularly the exacerbations in patients suffering from chronic respiratory diseases such as asthma, COPD and cystic fibrosis [17].
In view of the magnitude of CS emissions for coastal air pollution, the main goal of this article is to retrospectively investigate whether the onset of CS influx had a significant effect on urban background levels of regularly monitored air pollutants. The setting is Ponta Delgada city, remotely located in the mid-Atlantic Azores archipelago, whose population habitually enjoys clean air favoured by the relatively smaller scale human activities and the oceanic surrounding, allowing for a greater regeneration capacity of the atmosphere. Nevertheless, a precedent of concern with preserving air quality is motivated by the increase in emissions of atmospheric pollutants resulting from the intensification of agricultural and touristic activities in the region [18]. Data since 1990 for the Azores show that fossil fuel combustion, mainly for transportation and electricity, has contributed to a 73% increase in CO2 and 45% in CH4 emissions [19]. Legal standards for preserving ambient air quality and protecting the atmosphere in the Azores follow the conjugation of European Commission directives and their adaptation to the national legal framework, namely EU Directive 2008/50/EC on ambient air quality and cleaner air for Europe. This framework requires that specific goals are met to preserve air quality and take corrective action when air quality is worsening, hence the pertinence of continuously monitoring the impact of new or increasing emission sources in the region [20,21].
In this setting, naturally characterized by lower levels of disturbance, it is reasonable to conjecture that CS influx, as a relevant incoming source of fuel emissions, may have a more nefarious impact over this cleaner atmospheric background, as opposed to a major continental city, whose baseline levels of air pollution are inherently higher. With this purpose, the daily CS traffic at the local harbor was associated with the daily average concentrations of air pollutants monitored by the air quality monitoring station. The data analysis, ranging from 2013 to 2020, not only looks for exceedances to local legislated limits for the protection of the environment and human health, but also for the degree of variation in the concentrations of air pollutants during CS seasons.
2. Methods
2.1. Setting
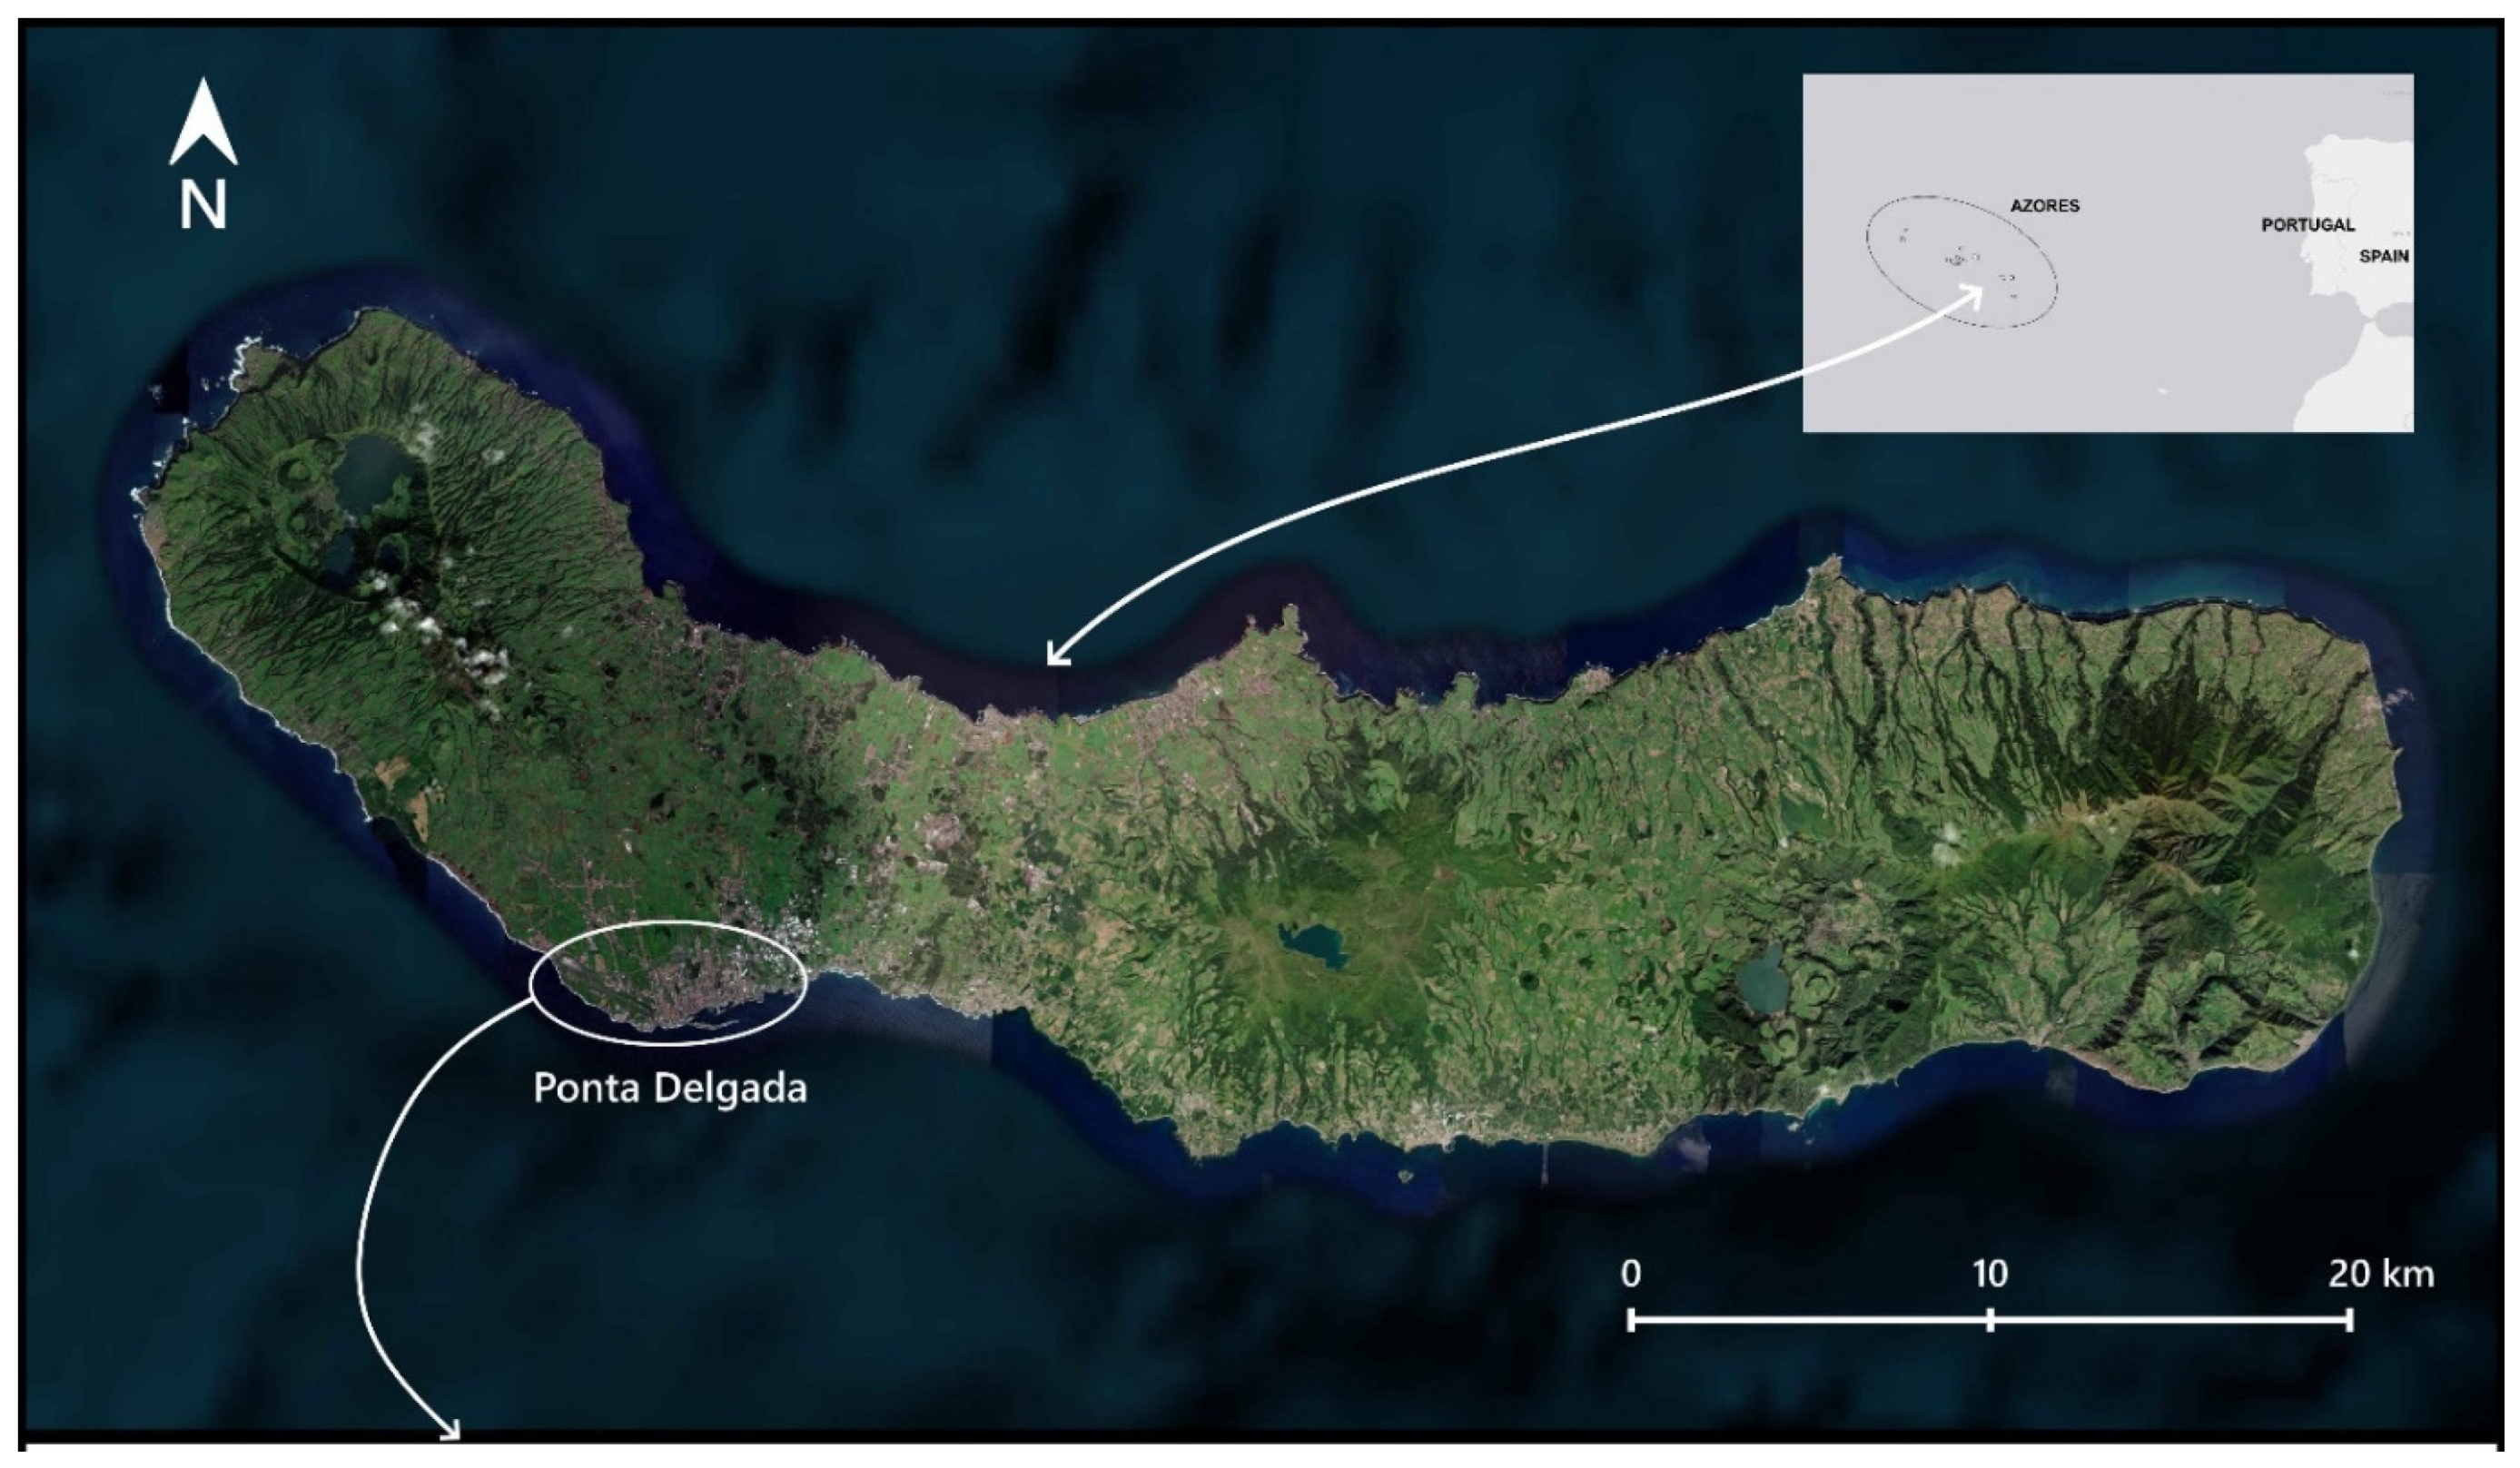
Ponta Delgada is the main city of São Miguel Island, the largest and most populated of the Azores archipelago, a group of peaks of volcanic origin rising from the Mid-Atlantic Ridge. The city is located on the southwest coast (Figure 1), in between two of its central volcanoes with caldera (Sete Cidades and Fogo), within Picos fissural volcanic system. The island is under a typical temperate oceanic seasonal climate, generally characterized by mild temperatures, high air humidity and a distinct wet season (October–March) [20,22]. Given the altitudinal slope of the island, Ponta Delgada’s coastal location is relatively warmer and drier than sites at higher elevations, especially during summertime. The city is also inserted in a geomorphological unit lacking relevant water streams [23]. Daily records of meteorological data registered by the Ponta Delgada air quality monitoring station, in the years between 2013 and 2020, show annual mean temperatures of around 17 to 18 °C, annual mean air humidity around 74 to 79%, and total annual accumulated precipitation between 400 and 800 mm. The average wind speed in the windier season (October–May) is 2.39 m/s as opposed to 1.70 m/s during summer months, while predominant wind directions were from southwest (225°) to northwest (315°) in 46% of daily records and southeast (135°) to southwest (225°) in 38% of daily records. In Figure 1, it is shown that Ponta Delgada city directly faces the ocean in orientation from SE to SW. São Gonçalo (SG) air quality monitoring station (of the urban background type) is located about 1.3 km north of the ship harbor, at an elevation of only 55 m (Figure 1). Consequently, the monitoring station is not only placed on a straightforward pathway from the seafront through the historical centre, without relevant orographic or manmade barriers to obstruct the wind and dispersal of pollutants (most buildings are not higher than 3 floors), but also it is in alignment with the frequently predominant southwestern winds. Hence, on most days of the year, the atmospheric transport of airborne pollutants is not opposed by wind against the SG monitoring station.
The city centre extends to a radius of about 2 km north of the bay (Figure 1), holding a resident population of 17,304 inhabitants between the three civil parishes within this innermost radius (according to the 2021 census) [24]. Despite being a small city with a stable population number (by mainland standards), the influx of visitors has steadily increased year after year, noticeable by greater crowding at the city centre during peak seasons. This is the consequence of better travel accessibility and the heavy touristic promotion of the Azores to traditional and new markets. Whether by air or by the ocean, Ponta Delgada is the main gateway for visitors to the island and to the rest of the archipelago. The city has become a hotspot for transatlantic CS lines in spring and autumn, especially since the last renovation of the seafront and construction of the cruise terminal in 2008. Since 2015, air transport liberalization has allowed operation by low-cost airlines. The generated transit of aircraft, watercraft and associated road traffic is unprecedented and presents a sustainability challenge for the region. Consequently, transportation is bound to intensify as the major polluting activity in the city, since industrial facilities or other strikingly focal sources of air pollution are located further away.
2.2. Datasets
The two datasets explored for the aim of this study were obtained by the authors in early 2022. Both datasets range from 1 January 2013 to 31 December 2020. The daily movement of cruise ships at Ponta Delgada city harbour was provided by Portos dos Açores, S.A. (PA), the entity responsible for the management of the Azorean harbors and marinas. This dataset includes the date of docking, CS name and flag, ship length, as well as the total number of passengers and crew in route. The authors also further obtained publicly available data of the CS gross tonnage (GT), type of fuel powering the main engines, combined power (kW) of the main engines and the year of first service deployment, neatly compiled by nedcruise.info [25]. In cases of retrofitted ships, the most updated data was considered. The grouping of ships by GT follows an informal classification defined by Marine Insight [26].
The compilation of the average daily concentrations of air pollutants and weather parameters by the air quality monitoring station were provided by Direção Regional do Ambiente e Alterações Climáticas do Governo dos Açores, the regional governmental branch dealing with the environment and climate change. The station has certified automatic analyzers continually monitoring the concentrations (µg/m3) of SO2 by UV fluorescence, O3 by UV absorption, NOx by chemiluminescence and PM10 + PM2.5 by beta radiation method. The analyzers can calculate mean values every 15 min, which are then validated before official hourly and daily mean concentrations are calculated. Only the daily means for each pollutant were provided to the authors. Meteorological parameters monitored include wind velocity (m/s) and direction (°), temperature (°C), solar radiation intensity (W/m2), precipitation (mm H2O) and relative air humidity (%). All are provided as daily means except for precipitation which is defined as total daily precipitation [20]. Wind direction was converted in an ordinal variable by assuming a maximum value of 4 if the wind is originating from SE (135°) to SW (225°) (from the south towards the monitoring station to the north), and a minimum value of 1 if the wind is originating from NW (315°) to NE (45°) towards the south.
2.3. Data Analysis
The total number of daily and yearly exceedances to legislated limits were counted from 2013 to 2020, except in the case of NOx for which a daily limit is not established. The number of daily exceedances on the subset of days with CS docking was also accounted for. The percentage of daily records for each year is provided for each monitored pollutant. Missing daily records are most often attributable to anomalous analytical errors or downtime for equipment maintenance. The differences in mean values of the pollutant concentrations between periods with and without CS docking were checked by Welch’s t-test with Cohen’s d effect size. Mean values are reported followed by the standard error of the mean (mean ± SEM). Correlations between variables were tested by Spearman’s rank correlation coefficient (ρ). The levels of statistical significance were set at p ≤ 0.05 (*), p ≤ 0.01 (**) and p ≤ 0.001 (***). A linear regression model was tested for the relationship between CS features. A principal component analysis was carried out to overview the pattern of correlations between pollutant concentrations, weather parameters and CS features. Factors were assumed to be correlated, thus a method for oblique rotation was used, direct oblimin with Kaiser normalization and a Delta of 0. The variable loadings on each principal component were obtained for the obliquely rotated factor solution. Statistical analysis was performed with JASP v0.16.3 [27], IBM SPSS Statistics v.28.0.1.0 [28] and the latest MS Office Excel [29].
3. Results and Discussion
3.1. Cruise Ships
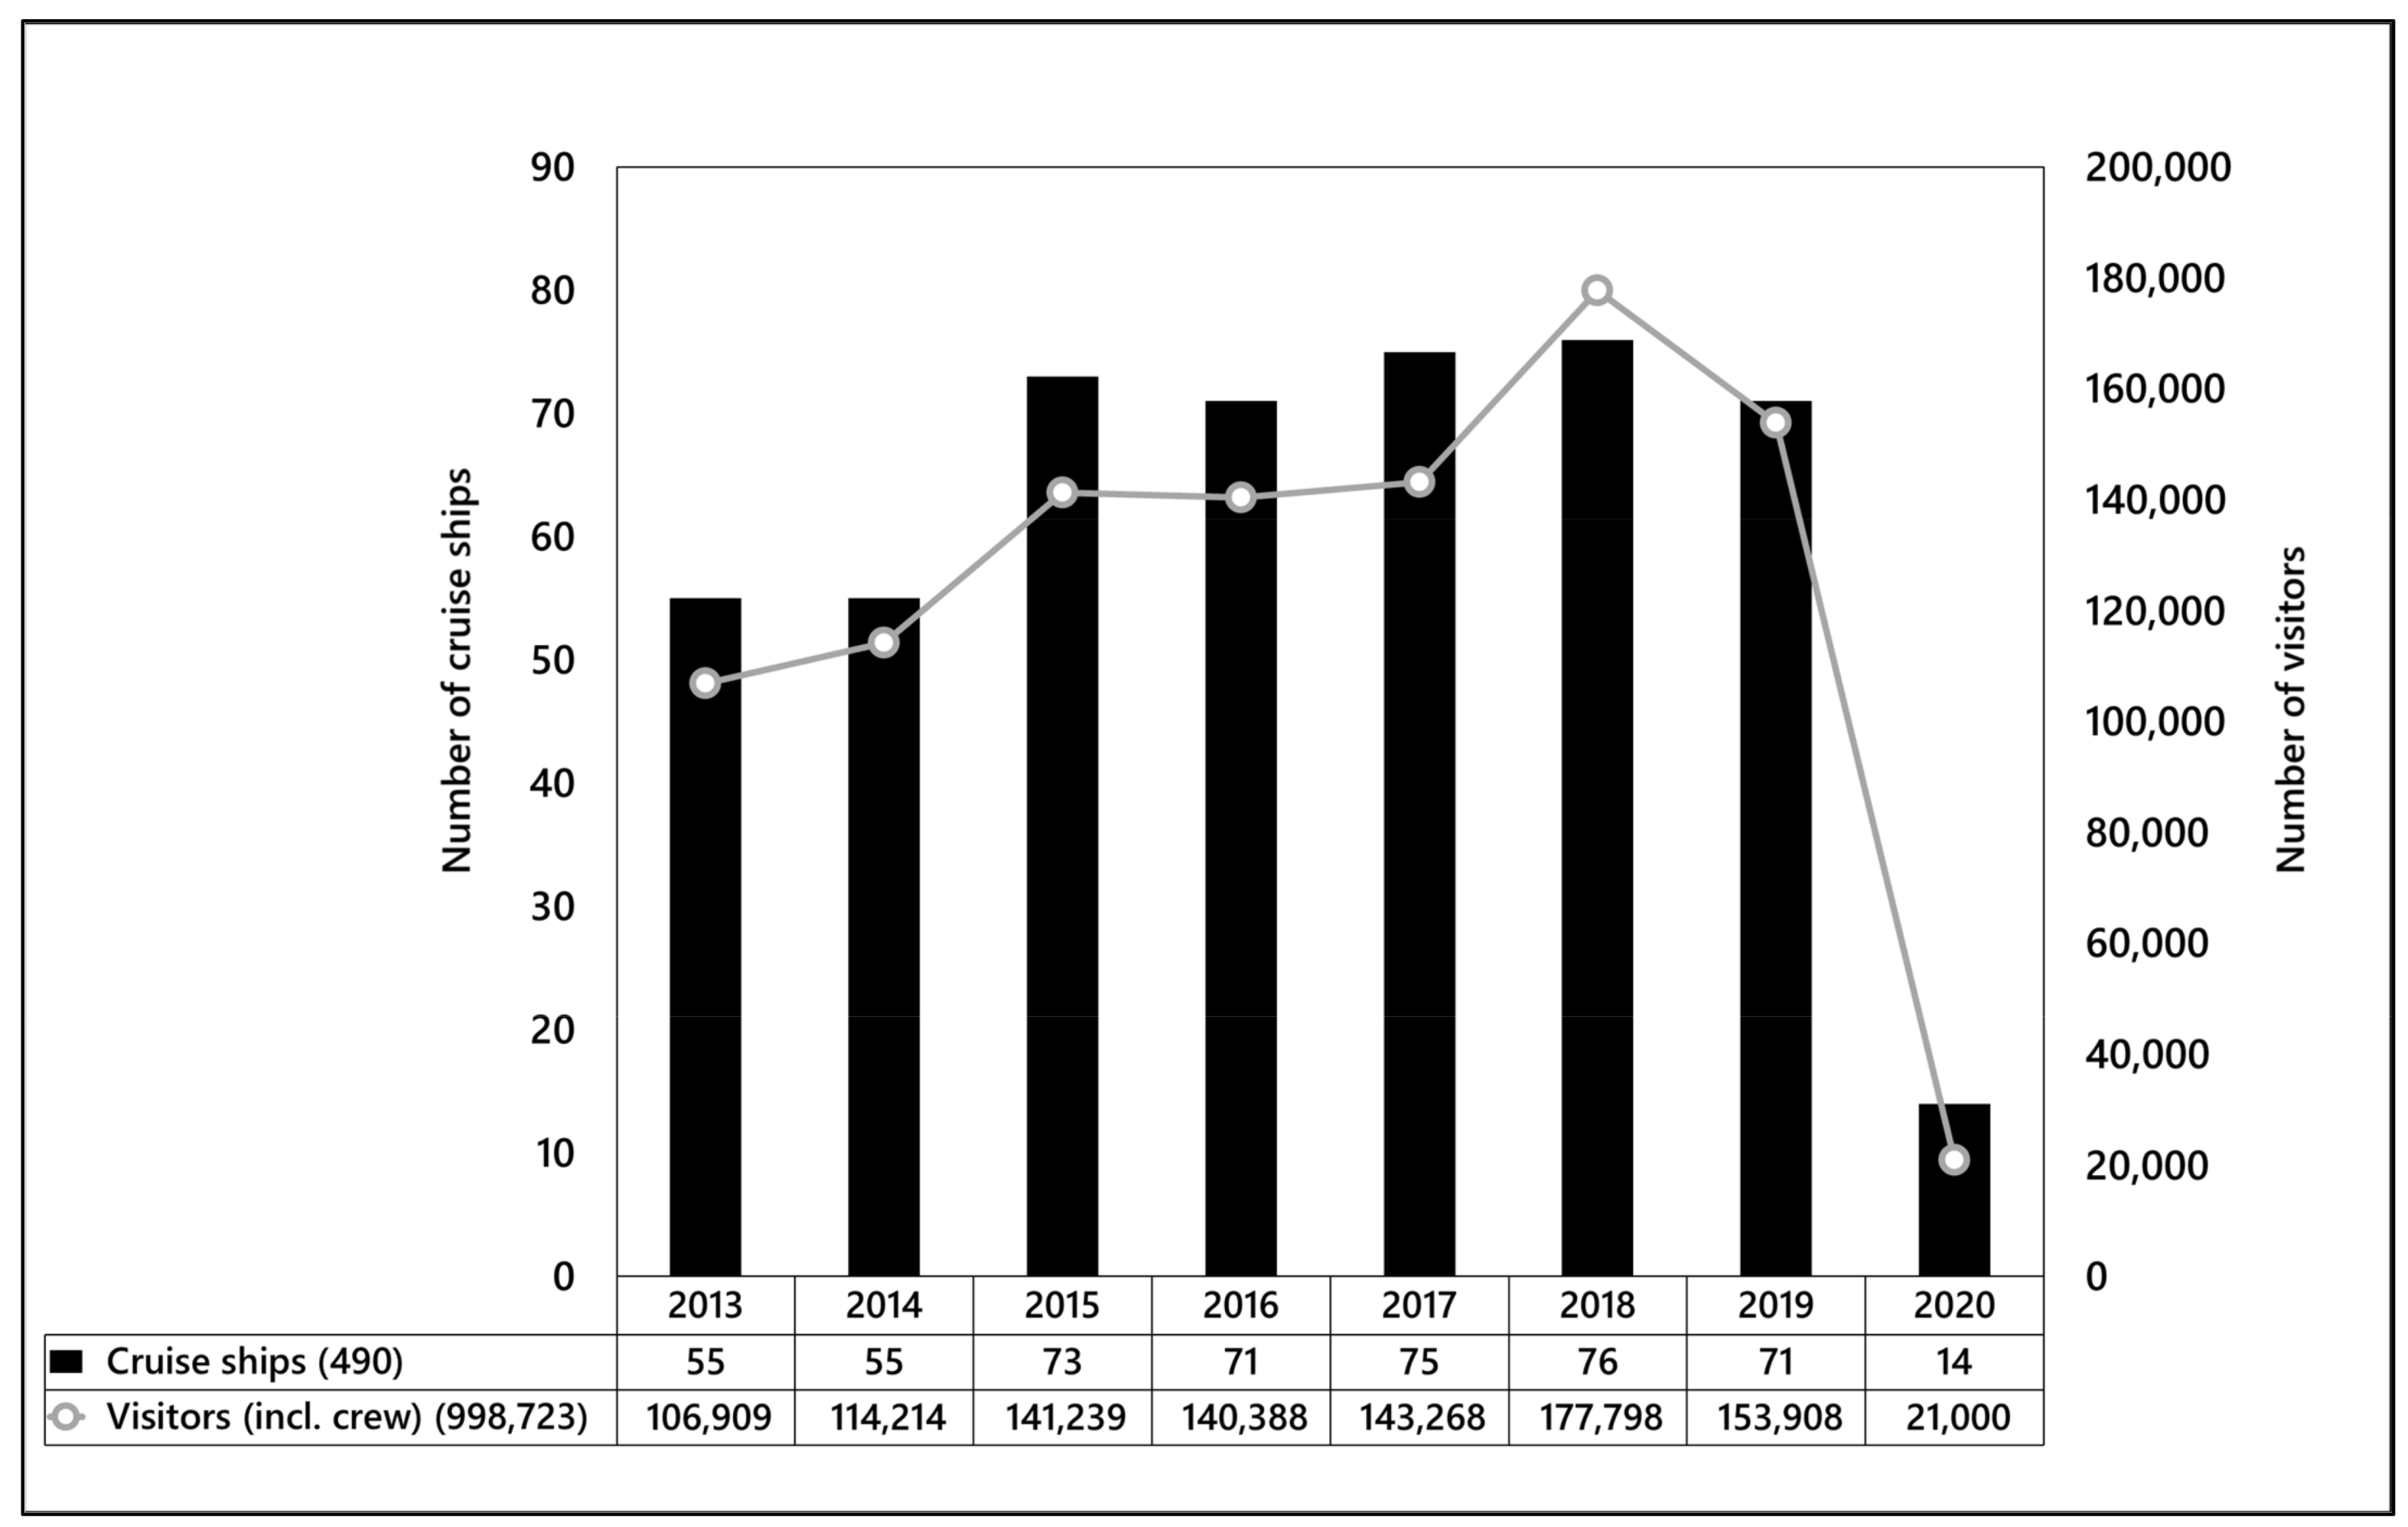
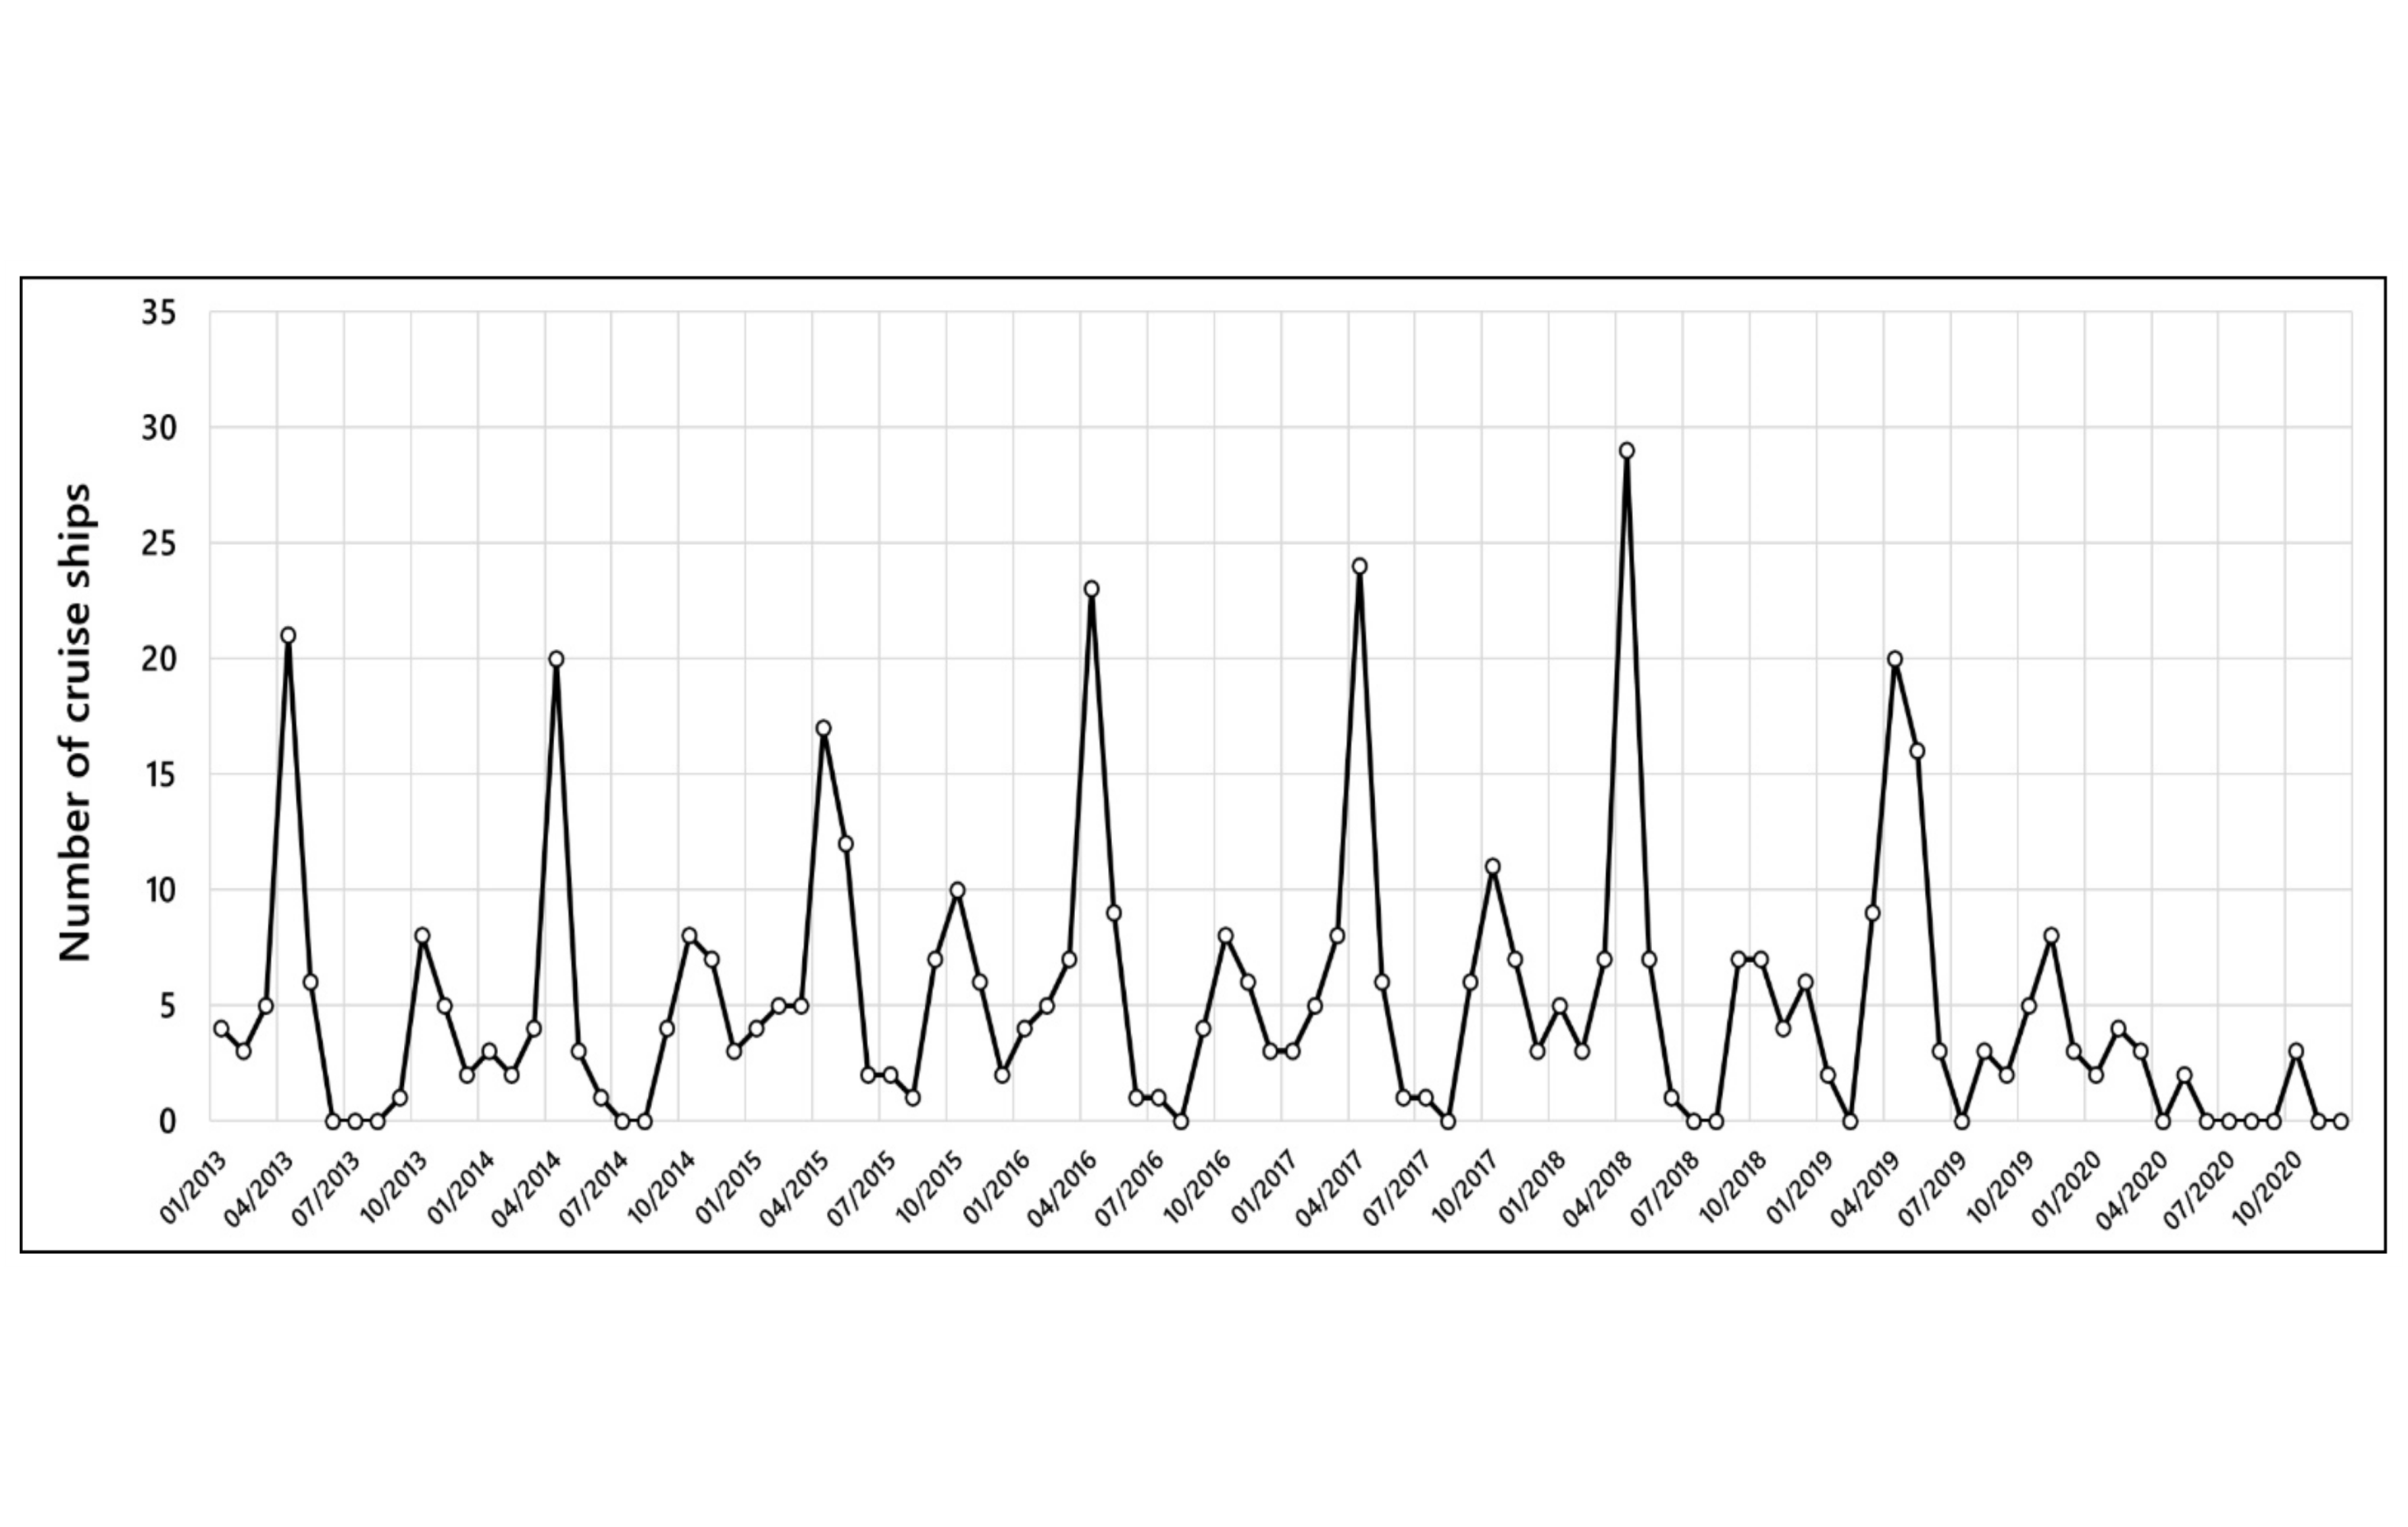
In the 2922 days between 1 January 2013 and 31 December 2020, 414 days (14%) had CS visits at Ponta Delgada city harbour, 58 of which (2%) had more than 1 CS docking simultaneously. In this period, 490 visits were made by 135 different CSs, 95 of them with at least one returning visit (Figure 2), mostly distributed between two main docking seasons: spring season, usually peaking in April with 20–25 CSs; autumn season, usually peaking in October with 5 to 10 CSs (Figure 3). A growing trend is observed over the years, reaching its highest peak in the year 2018 with 76 CS dockings carrying 117,798 visitors (passengers and crew). This increasing tendency was interrupted by a sharp decline in 2020 due to the restrictions imposed by the COVID-19 pandemic. In total, over the span of these 8 years, close to 1 million CS visitors passed by Ponta Delgada harbor, representing an unprecedented mark highlighting the contemporary touristic demand at the remote Azores archipelago.
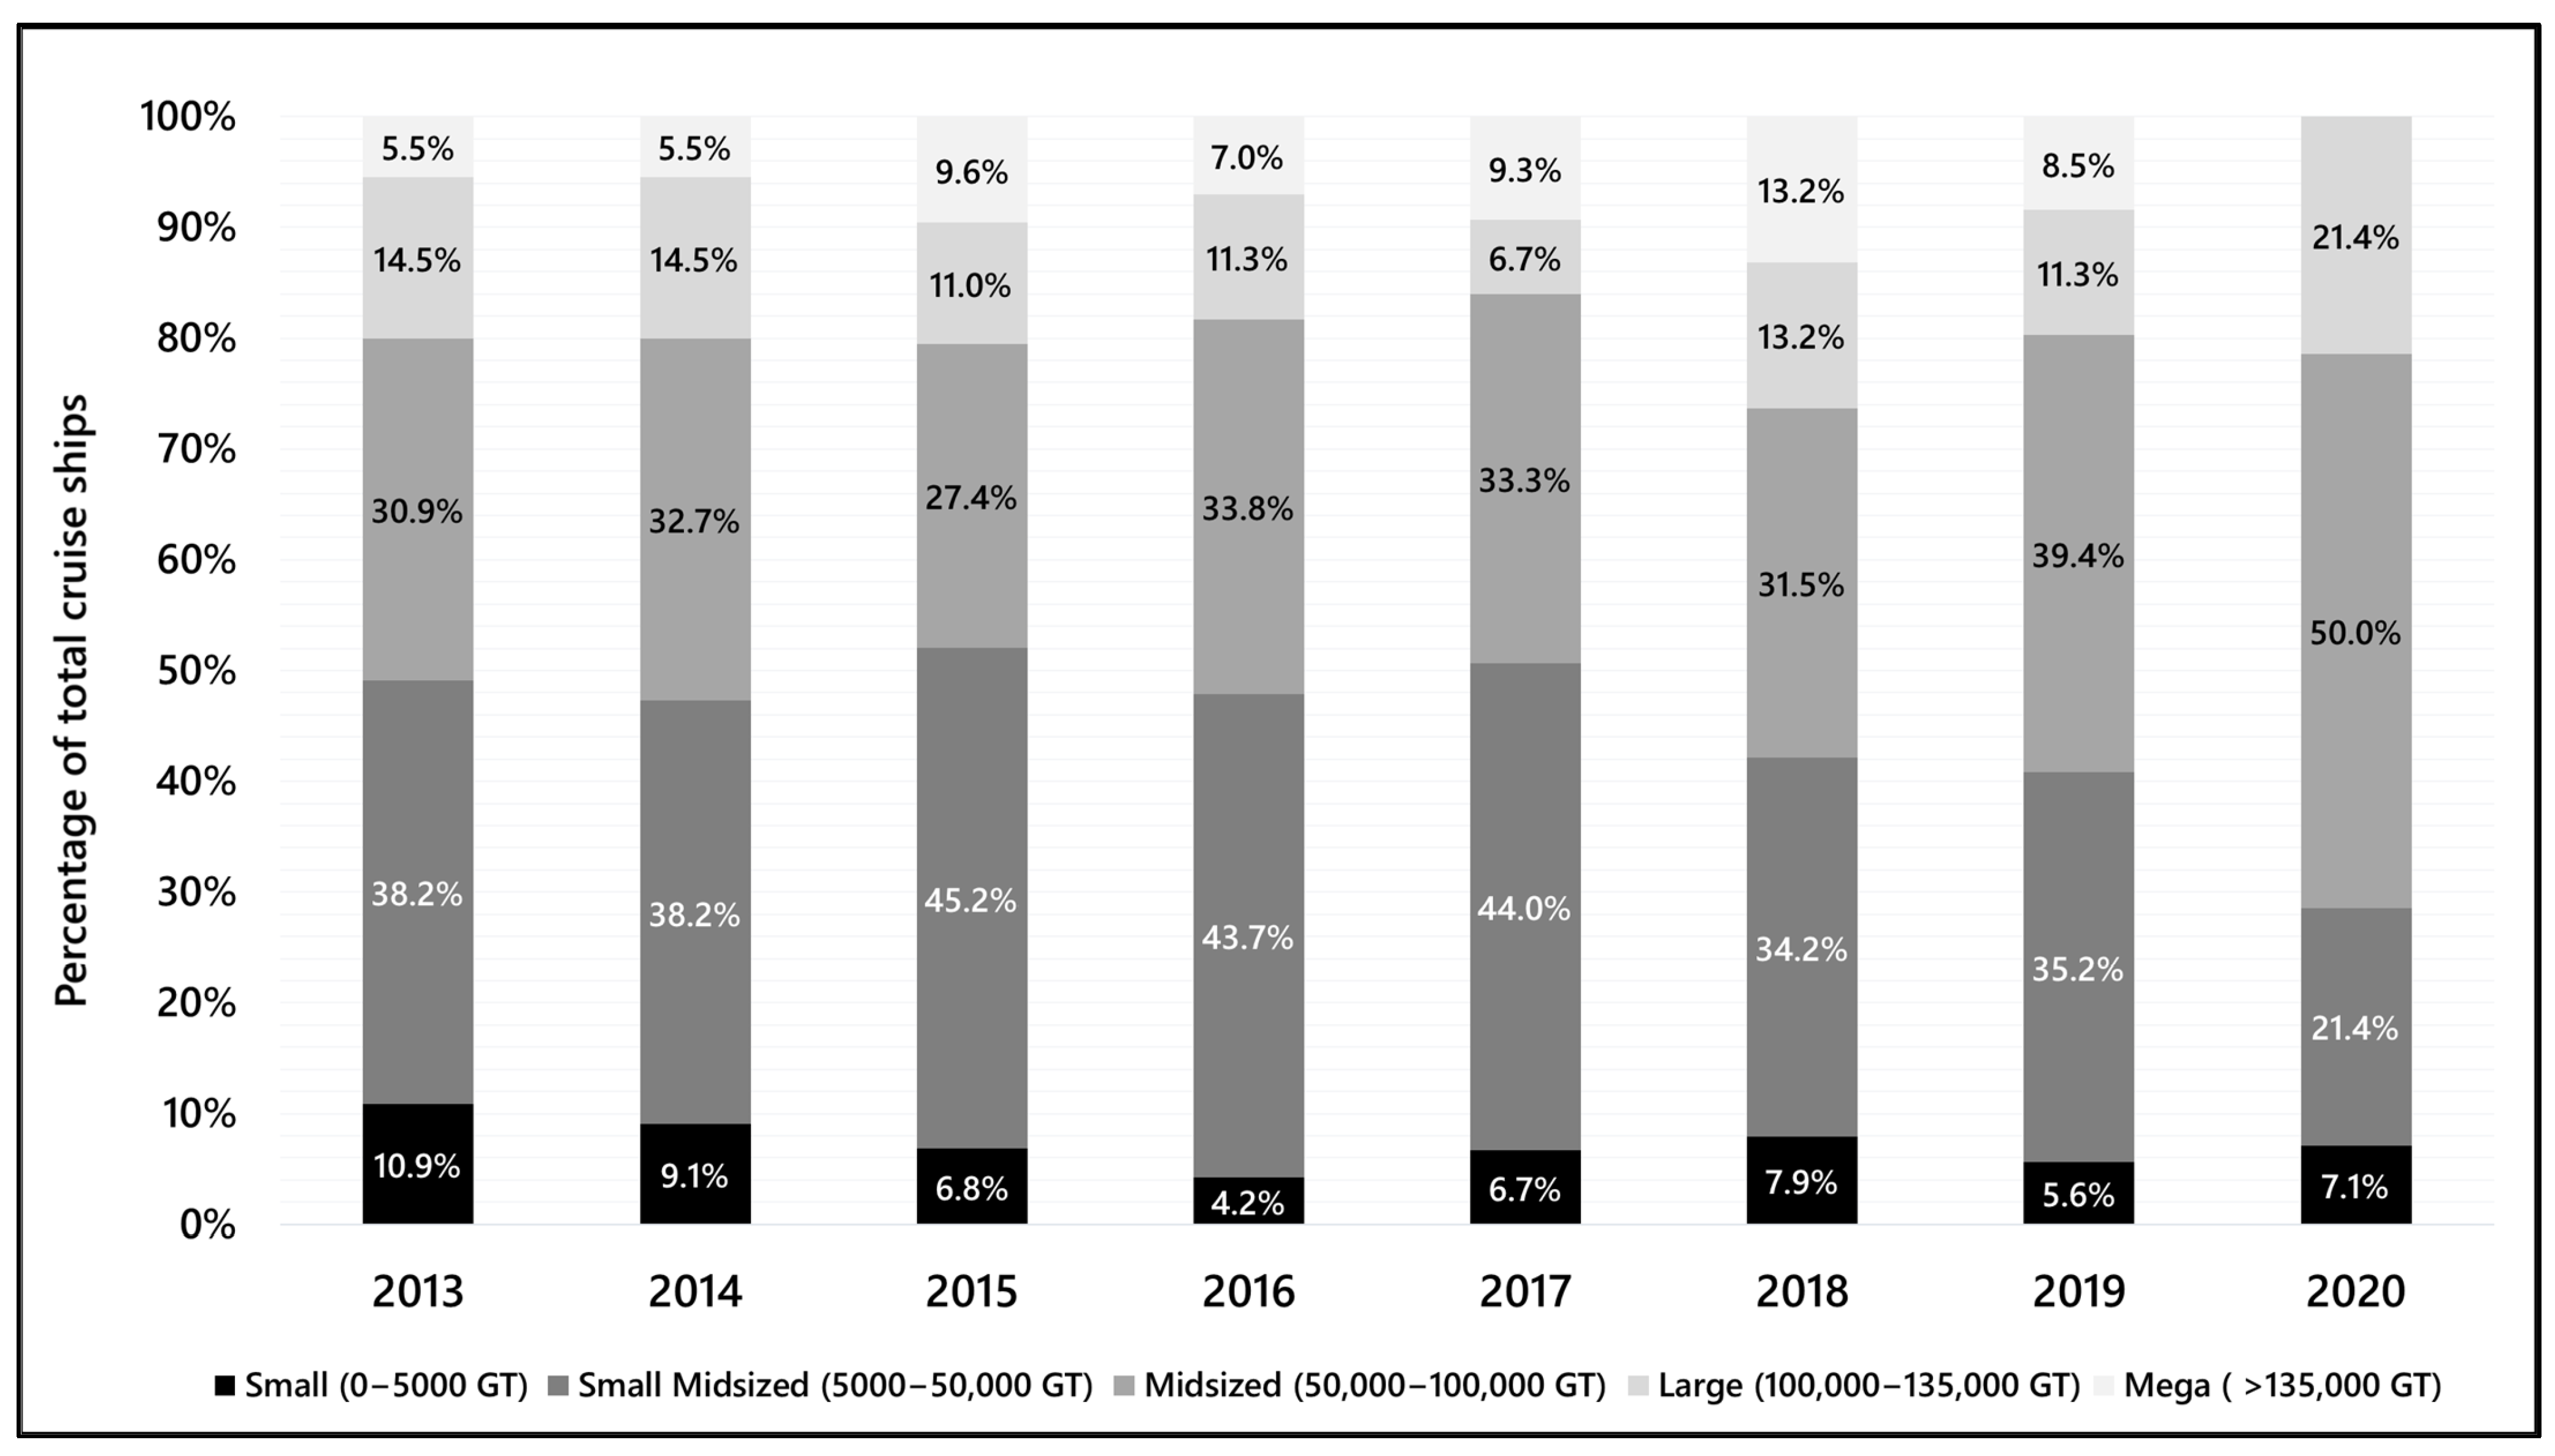
The vast majority (119) of the 135 visiting CSs have both main and propulsion diesel engines, with an additional 9 propelled by wind sails but possessing also auxiliary propulsion diesel engines, leaving only a minority of 4 CSs powered by gas turbines. Therefore, exhaust emissions from diesel hydrocarbon combustion are expected to be the main concern regarding potential air pollution associated with the influx of CSs, potentially including each of the pollutants monitored by SG station (PM10 and PM2.5, SO2, NOx and O3) [30]. A primary factor determining a ship’s diesel consumption is the combined power of the main engines (EP), which is dependent on the volume (GT) of the ship they must support. A model of linear regression was found to best fit the relationship between GT and EP, validating the use of the latter as a proxy variable for diesel consumption (F (1, 397) = 3099.955, p < 0.001, EP = 0.546GT + 2911.879; R2 = 0.886). Except for 2015 and 2017, over half of the CS dockings at Ponta Delgada harbor are classified midsized or greater in terms of GT (>50,000) (Figure 4). Docking by mega cruise ships (>135,000 GT) has also risen over the years, reaching its highest percentage of 13.2% in the peak year of 2018.
3.2. Compliance with Air Quality Monitoring Data
Table 1 summarizes SG monitoring data by pollutant according to exceedances over legislated limits applicable to the Autonomous Region of the Azores from 2013 until 2020. During the periods with daily records of each year, SO2, O3, and NO2 daily values have never exceeded daily limits. Their subsequent yearly average values (as well as NOx) also remained far below yearly limits. It is noteworthy that the lowest daily maximum values and the lowest yearly averages for O3, NOx and NO2 were observed in 2020, suggesting that the interruption of the normal patterns of urban activity, during the COVID-19 pandemic restrictions, somewhat contributed to reducing the emission of these pollutants.
Regarding particulate matter, a total of 15 out of 2813 daily exceedances (>50 μg/m3) were recorded for PM10, only 2 were coincident with CS docking in Ponta Delgada, whereas 32 out of 2411 daily exceedances (>20 μg/m3) were recorded for PM2.5, only 3 of which were on days with CS docking (Figure 5). A small exceedance of the yearly average occurred for PM2.5 in 2019, although possibly skewed by the incomplete dataset with over 30% of missing daily PM2.5 records in that year. Unlike O3, NOx and NO2, PM daily maximum and yearly average concentrations were not particularly decreased in 2020, further corroborating that the sporadic exceedances of PM levels at Ponta Delgada are more influenced by natural long-range transport of Saharan dusts over the Atlantic than by emissions from local sources [20,31]. Overall, background air quality over these 8 years remained well within legislated safety limits for the environment and human health.
3.3. Cruise Ship Presence and Air Pollutants
Table 2 presents an overview of the pattern of correlations between pollutant concentrations, weather parameters and CS combined engine power for the full 8-year datasets (Barlett’s χ2 (78) = 12113.998, p ≤ 0.001; KMO = 0.580). Three principal components (PC) were extracted with eigenvalues higher than 1.5, cumulatively accounting for 50% of variance. The presence of CSs has no effect in contributing to positive loadings of SO2, PM10 and PM2.5. Meanwhile, O3, NOx and NO2 load most positively when CS engine power also loads positively, suggesting that the second PC might be expressing a faint association of CS docking with the variations of O3 and NOx at the city centre. On the other hand, PM10 and PM2.5 load most positively when the wind velocity is highest and originates from the south quadrant (SE-SW), matching the southern origin of the Saharan dusts and conveying the wind’s assistance in carrying these particles towards the monitoring station. SO2 is indifferent to either CS presence or weather variables.
Gauging fluctuations in atmospheric levels of pollutants on days with CS docking, even within compliance with legislated limits, requires the cognizance that: (i) over 81% of the total CS visits between 2013 and 2020 are concentrated in either the spring season (54%) or the autumn season (27%) (Figure 3); (ii) pollutant levels naturally fluctuate throughout the year with seasonality. This fluctuation is verified cyclically in the full datasets from 2013 to 2020, even if excluding data points from days with CS docking. Except for PM2.5, whose levels remain statistically even throughout the year, the other pollutants show a seasonal pattern, with higher daily mean concentrations of O3 and PM10 in the spring season (March to May), while SO2, NO2 and NOx are more elevated in the autumn season (September to November) (Kruskal–Wallis H + Dunn’s post-hoc test not shown for the sake of conciseness).
Hence, given the patently seasonal pattern of CS visits at Ponta Delgada, a direct contrast between days with and without CS docking is more legitimate if considering only data points within the same season, thus minimizing the bias of natural variability if comparing days from different seasons. In harmony with the PCA overview, CS engine power shows a modest positive correlation with mean daily concentrations of O3, NOx and NO2 in the spring season, a correlation which is weakened in the autumn season (Table 3). Within the spring season, daily mean concentrations of all pollutants were increased on days with CS docking, although only NO2 and NOx showed a significant difference (with a small effect size) (Table 4). The same tendency is observed in the autumn season except for PM10 and PM2.5, but no significant differences were found.
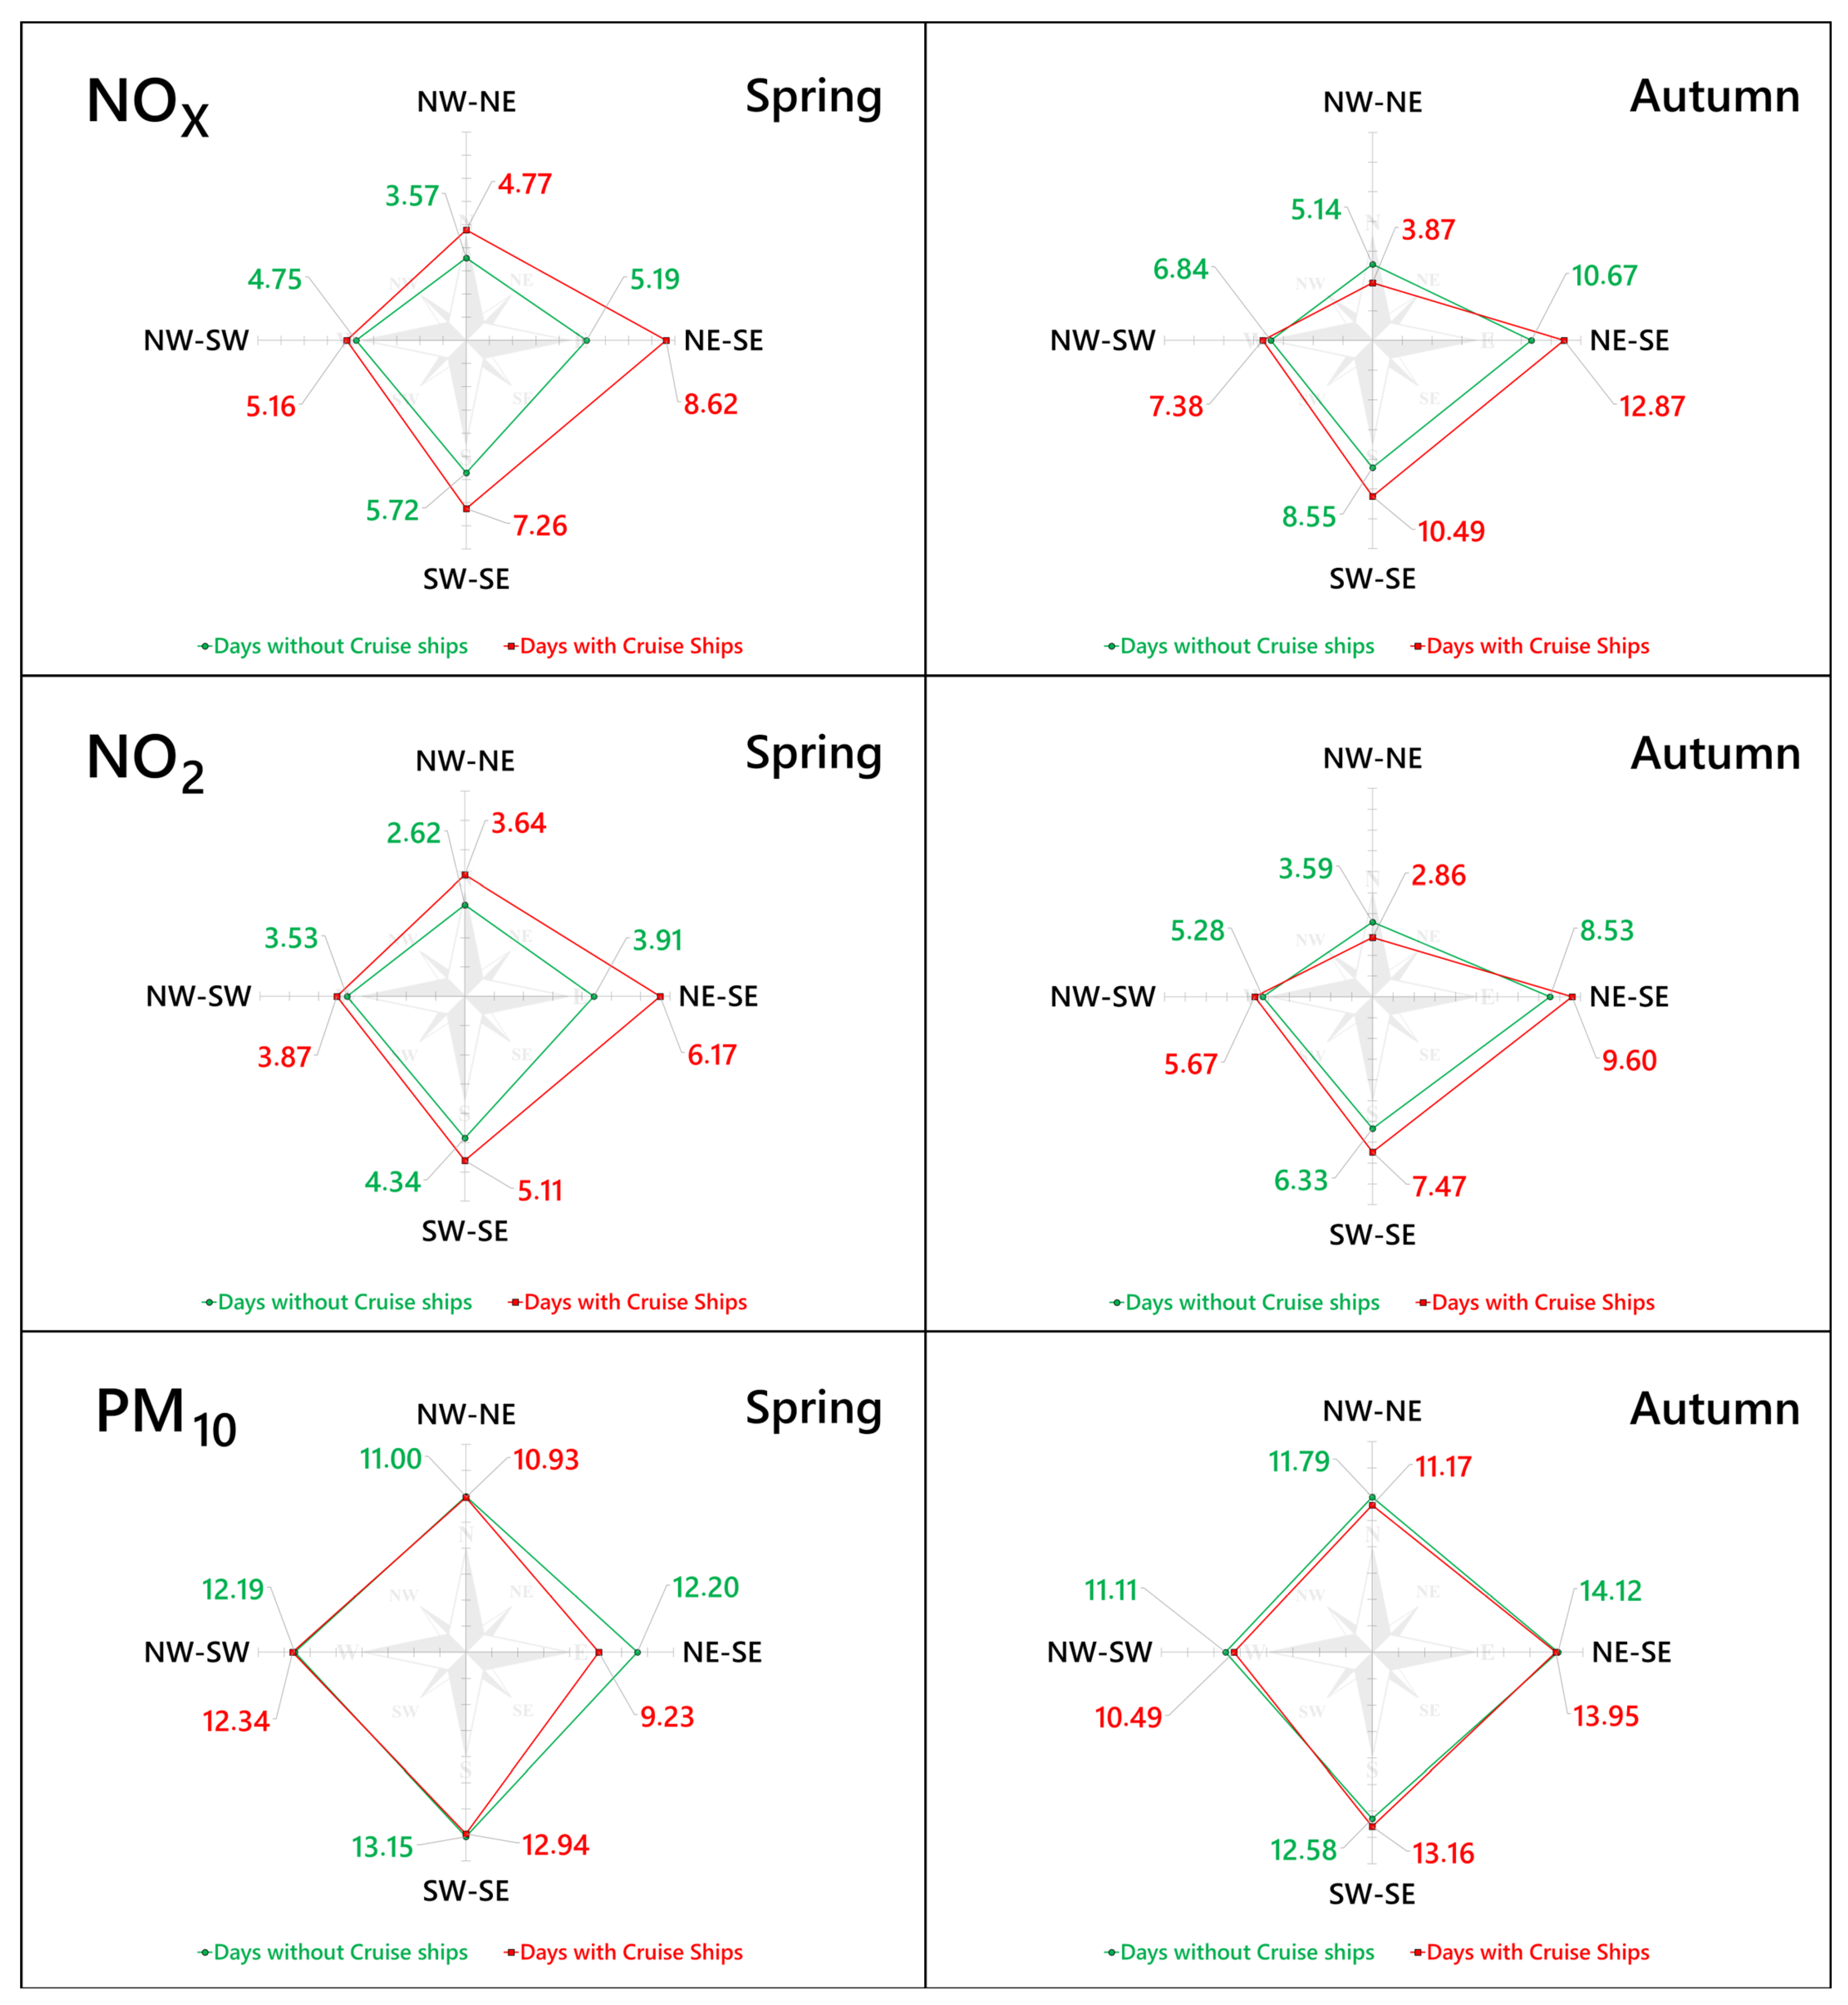
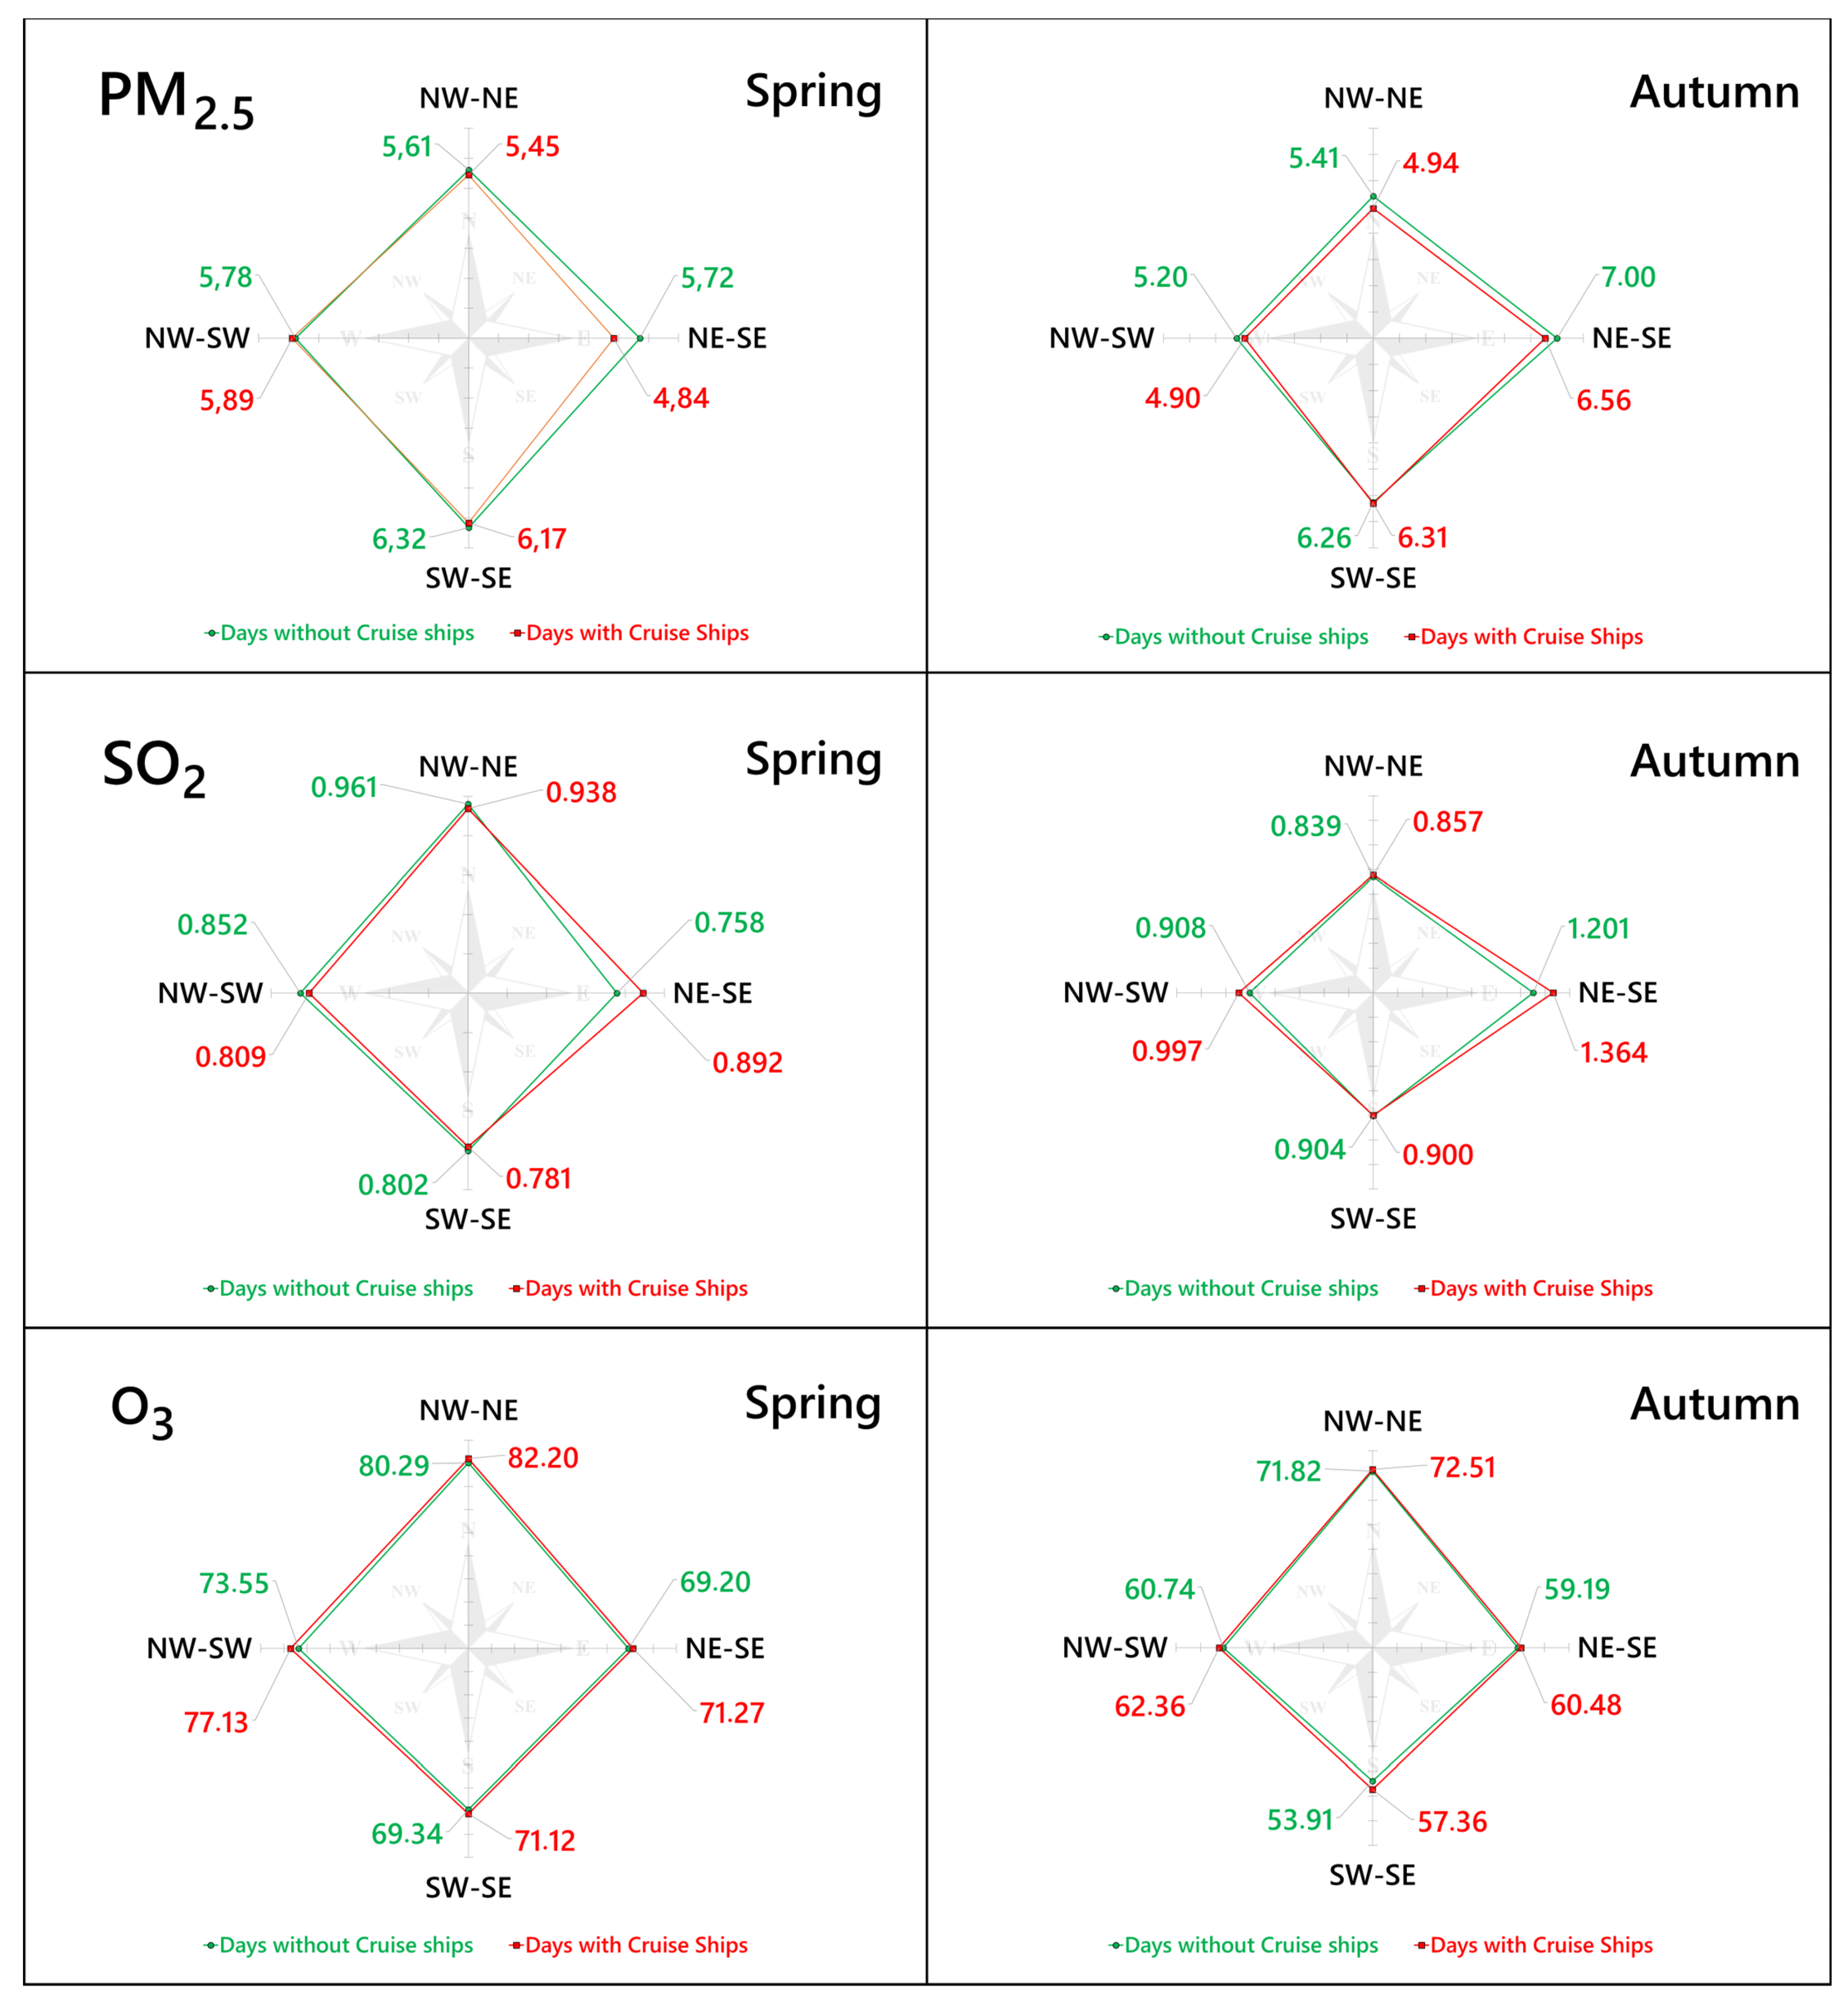
A more detailed analysis of the daily mean concentrations by the predominant wind quadrant (Figure 6) further confirms the increase in NOx/NO2 in days with CS docking. Both in the spring and autumn seasons, nitrogenous emissions are overall higher for any quadrant except the opposing NW-NE when CS are present. Their mean concentration values are noticeably skewed by wind originating from NE-SE (by as much as 3.4 μg/m3 in spring) and SE-SW (by as much as 1.94 μg/m3 in autumn), thus matching a possible influence of the CS terminal as emission source at the south of the monitoring station. SO2 mean concentrations also show slight skewing to the NE-SE quadrant in days with CS docking for both seasons, though by thinner margins which were otherwise unnoticed. O3 is likewise generally higher on days with CS docking, however without a clear origin from any specific quadrant. As for PM10 and PM2.5, mean concentrations are generally the same or slightly higher on days without CS docking, with a noticeable skewing in the NE-SE quadrant in the spring season, matching consistently with the southeastern arrival of the Saharan dusts and thus, once again, displaying no relationship with the presence of CSs.
Though noteworthy in the context of historically clean air quality of the study area, these are rather small increments for SO2, O3 and NOx, far below the respective legislated limits for the protection of the environment and human health. At most, CS traffic, at current levels, had a marginal contribution to the overall regular patterns of background air quality of the city, mostly with nitrogenous emissions. Nevertheless, this early signal is not to be neglected [32], bearing in mind that these are 24-h average concentrations from background monitoring (with significant dissipation over distance) rather than real-time and near-source monitoring. Further increases in the concentrations of NOx and tropospheric O3 might become worrisome due to their nefarious environmental impacts. The former has a long residence time in the environment and contributes to acid rains, vegetation damage, eutrophication phenomena, depletion of the ozone layer, greenhouse effect, formation of tropospheric ozone and particular matter [33,34]. The latter is also a greenhouse gas contributing to global warming, with potentially adverse effects on natural vegetation and crop productivity by reducing plant photosynthetic activity [35,36,37].
CS influx at Ponta Delgada is bound to continue escalating. As of September 2022, the total number of CS stopovers at the Azores harbours has already surpassed the previous maximum recorded in 2017. It is foreseen that, by the end of 2022, for the first time in history, over 200,000 maritime passengers will have visited the Azores within a single year [38]. Collecting real-time data for short-time pollutant concentrations at a distance gradient funnelling nearer the harbour is fundamental for evaluating with robustness the concrete contribution of CS emissions, notwithstanding the increasingly efficient CS emission control systems (in modern and retrofitted ships) and the adoption of cleaner (e.g., low-S marine diesel) or alternative (LNG) fuels [39,40]. Such a refined monitoring approach would lessen the dissipation of pollutants over distance, while the temporal window could be narrowed to periods of CSs arrival and departure. CS engines are usually not on full throttle outside the deep ocean and remain in low-performance eco mode during the docking period [12]. Just like rush hour road traffic, monitoring data is particularly relevant in shorter, specific periods of the day when the rate of emissions and the degree of exposure of the population are highest. Previous studies have shown that the impact of cruise ship emissions can be relevant for short-time concentration levels [32]. It is also a fitting scenario for applying isotopic analysis, with the use of biomonitors, to disentangle between overlapping emission sources of SOx or NOx over time, an approach that has been widely successful even when total elemental concentrations are low [18,41,42,43,44].
4. Conclusions
Data at the daily level suggest the growing CS transit at Ponta Delgada has not meaningfully influenced background levels of air pollutants at the city centre in a manner that would deviate from the usual patterns of air quality corresponding to local urban activities. The concentrations of nitrogen oxides are the only ones that display a clear though slight association with the presence of CS, but far from jeopardizing the daily maximum limit. The emissions of combustion by-products from diesel engines into the atmosphere are likely mitigated by the intermittency of CS engine loads (running on low-performance mode during most of the docking period), and the adoption of low-sulphur diesel fuel and emission control systems. Dissipation over the distance to the monitoring station could also further dilute the contribution of CS emissions to the overall urban background levels of air pollution. Touristic inflow is bound to continue in remote destinations worldwide and thus, appropriate air quality monitoring routines are warranted to correspond to the maritime, aerial and road transit. Future assessments should complement urban background monitoring with near-source, real-time monitoring networks providing the necessary spatial and temporal resolution for tracking short-term fluctuations in air pollutants during busier periods of CS arrivals and departures, as well as discriminating their specific influence amongst other urban sources. Eventually, this will be useful for gauging the efficacy of measures to reduce atmospheric emissions, most notably the adoption of alternative fuels.
Author Contributions
Conceptualization, F.B., P.G. and A.R.; Data curation, F.B.; Formal analysis, F.B.; Funding acquisition, P.G. and A.R.; Investigation, F.B.; Methodology, F.B. and A.R.; Project administration, P.G. and A.R.; Resources, P.G. and A.R.; Supervision, P.G. and A.R.; Validation, F.B.; Visualization, F.B.; Writing—original draft, F.B.; Writing—review and editing, A.R. All authors have read and agreed to the published version of the manuscript.
Funding
The first author was supported through a contract under the project with reference M1.1.C/I.E./001/2021—SAREPA, financed by PRO-SCIENTIA—Programa de incentivos do Sistema Científico e Tecnológico dos Açores (SCTA) (Regional Government of the Azores). The study was supported by FCT—Fundação para a Ciência e a Tecnologia, within the project with reference UIDP/00643/2020. The funding entities were not involved in the study design, in the collection, analysis and interpretation of data, in the writing of the report and in the decision to submit the article for publication.
Institutional Review Board Statement
Not applicable.
Informed Consent Statement
Not applicable.
Data Availability Statement
A publicly available dataset of daily air quality monitoring measurements from Ponta Delgada was analyzed in this study. This data can be found here: http://qualidadedoar.azores.gov.pt/DadosValidados.aspx (Select station—São Gonçalo São Miguel) (accessed on 29 November 2022). Data on cruise ship movement in Ponta Delgada harbor was obtained from Portos dos Açores, S. A. and might be provided on request via the official email contact ([email protected]).
Acknowledgments
The authors are thankful to Portos dos Açores, S.A. and Direção Regional do Ambiente e Alterações Climáticas do Governo dos Açores for freely providing the datasets to the authors. Maps in this article were created using ArcGIS® world imagery basemap by Esri. ArcGIS® and ArcMap™ are the intellectual property of Esri and are used herein under license. Copyright© Esri. All rights reserved. For more information about Esri® software, please visit www.esri.com (accessed on 23 December 2022).
Conflicts of Interest
The authors declare no conflict of interest.
References
- Borges, P.; Azevedo, E.; Borba, A.; Dinis, F.; Gabriel, R.; Silva, E. Ilhas Oceânicas. In Ecossistemas e Bem-Estar Humano: Avaliação para Portugal do Millennium Ecosystem Assessment; Pereira, H., Domingos, T., Vicente, L., Eds.; Escolar Editora: Lisboa, Portugal, 2009; pp. 463–510. Available online: https://hdl.handle.net/10400.3/2011 (accessed on 10 October 2022).
- Scandurra, G.; Romano, A.; Ronghi, M.; Carfora, A. On the vulnerability of Small Island Developing States: A dynamic analysis. Ecol. Indic. 2018, 84, 382–392. [Google Scholar] [CrossRef]
- Calado, H.; Borges, P.; Ng, K.; Vergílio, M. Case Study Portugal: Addressing Tourism Development and Climate Change in Small Atlantic Islands: The Case of the Azores. In Global Climate Change and Coastal Tourism: Recognizing Problems, Managing Solution and Future Expectations; Jones, A., Phillips, M., Eds.; CABI: Oxfordshire, UK, 2018; pp. 125–137. ISBN 9781780648439. [Google Scholar]
- Bird, G.; Thomlinson, M. Globalization and the Tourism Industry. In Introduction to Tourism and Hospitality in B.C., 2nd ed.; Anderson, W., Butler, R., Eds.; BCcampus Open Publishing: North Vancouver, BC, Canada, 2021; Chapter 14.1; ISBN 978-1-77420-081-0. [Google Scholar]
- Cannonier, C.; Burke, M.G. The economic growth impact of tourism in Small Island Developing States—Evidence from the Caribbean. Tour. Econ. 2019, 25, 85–108. [Google Scholar] [CrossRef]
- Carlsen, J.; Butler, R. Introducing sustainable perspectives of island tourism. In Island Tourism: Sustainable Perspectives; Carlsen, J., Butler, R., Eds.; CABI: Oxfordshire, UK, 2011; pp. 1–7. ISBN 978-1-84593-699-0. [Google Scholar]
- Brtnický, M.; Pecina, V.; Vašinová Galiová, M.; Prokeš, L.; Zvěřina, O.; Juřička, D.; Klimánek, M.; Kynický, J. The impact of tourism on extremely visited volcanic island: Link between environmental pollution and transportation modes. Chemosphere 2020, 249, 126118:1–126118:9. [Google Scholar] [CrossRef] [PubMed]
- Lin, L.-Y.; Tsai, C.-C.; Lee, J.-Y. A Study on the Trends of the Global Cruise Tourism Industry, Sustainable Development, and the Impacts of the COVID-19 Pandemic. Sustainability 2022, 14, 6890. [Google Scholar] [CrossRef]
- Jeftic, L.; Sheavly, R.; Adler, E. Marine Litter: A Global Challenge; Meith, N., Ed.; United Nations Environment Programme (UNEP): Nairobi, Kenya, 2009; ISBN 978-92-807-3029-6. [Google Scholar]
- Perdiguero, J.; Sanz, A. Cruise activity and pollution: The case of Barcelona. Transp. Res. D Transp. Environ. 2020, 78, 102181:1–102181:52. [Google Scholar] [CrossRef]
- Abbasov, F. One Corporation to Pollute Them All: Luxury Cruise Air Emissions in Europe (In-House Analysis); European Federation for Transport and Environment AISBL: Brussels, Belgium, 2019; Available online: https://www.transportenvironment.org/discover/one-corporation-pollute-them-all/ (accessed on 23 December 2022).
- Sinha, S. Marine Insight—How Much Fuel Does a Cruise Ship Use? Available online: https://www.marineinsight.com/know-more/how-much-fuel-does-a-cruise-ship-use (accessed on 10 October 2022).
- Comer, B. The International Council on Clean Transportation Blog—What If I Told You Cruising Is Worse for the Climate Than Flying? Available online: https://theicct.org/marine-cruising-flying-may22/ (accessed on 10 October 2022).
- Lloret, J.; Carreño, A.; Carić, H.; San, J.; Fleming, L.E. Environmental and human health impacts of cruise tourism: A review. Mar. Pollut. Bull. 2021, 173, 112979:1–112979:13. [Google Scholar] [CrossRef]
- Liu, R.A.; Wei, Y.; Qiu, X.; Kosheleva, A.; Schwartz, J.D. Short Term Exposure to Air Pollution and Mortality in the US: A Double Negative Control Analysis. Environ. Health 2022, 21, 2–12. [Google Scholar] [CrossRef]
- Padula, A.M.; Tager, I.B.; Carmichael, S.L.; Hammond, S.K.; Lurmann, F.; Shaw, G.M. The Association of Ambient Air Pollution and Traffic Exposures with Selected Congenital Anomalies in the San Joaquin Valley of California. Am. J. Epidemiol. 2013, 177, 1074–1085. [Google Scholar] [CrossRef]
- Thurston, G.D.; Kipen, H.; Annesi-Maesano, I.; Balmes, J.; Brook, R.D.; Cromar, K.; Matteis, S.D.; Forastiere, F.; Forsberg, B.; Frampton, M.W.; et al. A Joint ERS/ATS Policy Statement: What Constitutes an Adverse Health Effect of Air Pollution? An Analytical Framework. Eur. Respir. J. 2017, 49, 1–19. [Google Scholar] [CrossRef] [Green Version]
- Bernardo, F.; Rodrigues, A.; Branquinho, C.; Garcia, P. Elemental profile of native lichens displaying the impact by agricultural and artificial land uses in the Atlantic Island of São Miguel (Azores). Chemosphere 2021, 267, 128887:1–128887:9. [Google Scholar] [CrossRef]
- Direção Regional do Ambiente do Governo dos Açores. IRERPA—Inventário Regional de Emissões por Fontes e Remoção por Sumidouros de Poluentes Atmosféricos 2019; Secretaria Regional da Energia Ambiente e Turismo, Ed.; Direção Regional do Ambiente do Governo dos Açores: Horta, Portugal, 2019. Available online: http://www.azores.gov.pt/Gra/srrn-ambiente/conteudos/destaques/2017/Setembro/IRERPA.htm (accessed on 10 October 2022).
- Direção Regional do Ambiente e Alterações Climáticas do Governo dos Açores. Relatório da Qualidade do Ar da Região Autónoma dos Açores 2020; Secretaria Regional do Ambiente e Alterações Climáticas, Direção Regional do Ambiente e Alterações Climáticas, Direção de Serviços da Qualidade Ambiental, Ed.; Direção Regional do Ambiente e Alterações Climáticas: Horta, Portugal, 2021. Available online: http://qualidadedoar.azores.gov.pt/pmqa/464/relatorios (accessed on 10 October 2022).
- Directive 2008/50/EC of the European Parliament and of the Council of 21 May 2008 on ambient air quality and cleaner air for Europe. Off. J. Eur. Union 2008, L152, 1–44. Available online: https://eur-lex.europa.eu/eli/dir/2008/50/oj (accessed on 23 December 2022).
- Direção Regional do Ambiente do Governo dos Açores. Clima e Alterações Climáticas. In Relatório do Estado do Ambiente dos Açores 2014–2016; Secretaria Regional da Energia Ambiente e Turismo, Ed.; Direção Regional do Ambiente do Governo dos Açores: Açores, Portugal, 2017; pp. 50–61. Available online: http://rea.azores.gov.pt/EdicoesAnteriores.aspx (accessed on 10 October 2022).
- Direção Regional do Ambiente do Governo dos Açores. Plano de Gestão da Região Hidrográfica (PGRH) dos Açores 2016-2021; Secretaria Regional da Agricultura e Ambiente—Direção Regional do Ambiente: Açores, Portugal, 2015; Chapter 2. Available online: https://www.azores.gov.pt/Gra/srrn-drotrh/conteudos/livres/PGRH-A%C3%A7ores+2016-2021.htm (accessed on 10 October 2022).
- Instituto Nacional de Estatística. CENSOS 2021—Portugal. Available online: https://tabulador.ine.pt/indicador/?id=0011609 (accessed on 10 October 2022).
- Nedcruise. Independent, Non-Commercial Cruise Information Site. Available online: https://www.nedcruise.info/eersteeng.htm (accessed on 10 October 2022).
- Ghosh, S. Marine Insight—Different Types of Cruise Ships Explained. Available online: https://www.marineinsight.com/naval-architecture/different-types-of-cruise-ships-explained/ (accessed on 10 October 2022).
- JASP Team. JASP Statistics—A Fresh Way to Do Statistics (Version 0.16.3). Available online: https://jasp-stats.org/ (accessed on 10 October 2022).
- IBM Corp. IBM SPSS Software (Version 28.0). Available online: https://www.ibm.com/analytics/spss-statistics-software (accessed on 10 October 2022).
- Microsoft Corp. Microsoft 365 (Version 2209). Available online: http://www.office.com/ (accessed on 10 October 2022).
- Reşitoğlu, İ.A.; Altinişik, K.; Keskin, A. The pollutant emissions from diesel-engine vehicles and exhaust aftertreatment systems. Clean Technol. Environ. Policy 2015, 17, 15–27. [Google Scholar] [CrossRef] [Green Version]
- Atmosphere Monitoring Service of the Copernicus Programme by the European Comission. CAMS Accurately Forecasts First Saharan Dust Transports of 2022. Available online: https://atmosphere.copernicus.eu/cams-accurately-forecasts-first-saharan-dust-transports-2022 (accessed on 10 October 2022).
- Murena, F.; Mocerino, L.; Quaranta, F.; Toscano, D. Impact on air quality of cruise ship emissions in Naples, Italy. Atmos. Environ. 2018, 187, 70–83. [Google Scholar] [CrossRef]
- de Vries, W. Impacts of Nitrogen Emissions on Ecosystems and Human Health: A Mini Review. Curr. Opin. Environ. Sci. Health 2021, 21, 100249:1–100248:8. [Google Scholar] [CrossRef]
- Manisalidis, I.; Stavropoulou, E.; Stavropoulos, A.; Bezirtzoglou, E. Environmental and Health Impacts of Air Pollution: A Review. Front. Public Health 2020, 8, 14. [Google Scholar] [CrossRef] [Green Version]
- Zhang, J.; Wei, Y.; Fang, Z. Ozone Pollution: A Major Health Hazard Worldwide. Front. Immunol. 2019, 10, 1–10. [Google Scholar] [CrossRef] [Green Version]
- Ebi, K.L.; McGregor, G. Climate Change, Tropospheric Ozone and Particulate Matter, and Health Impacts. Environ. Health Perspect. 2008, 116, 1449–1455. [Google Scholar] [CrossRef]
- Ainsworth, E.A.; Yendrek, C.R.; Sitch, S.; Collins, W.J.; Emberson, L.D. The Effects of Tropospheric Ozone on Net Primary Productivity and Implications for Climate Change. Annu. Rev. Plant Biol. 2012, 63, 637–661. [Google Scholar] [CrossRef] [Green Version]
- Secretaria Regional do Turismo, Mobilidade e Infraestruturas do Governo dos Açores. Navios de Cruzeiro Ultrapassam Recorde de Escalas nos Açores. Available online: https://portal.azores.gov.pt/web/comunicacao/news-detail?id=8345154 (accessed on 10 October 2022).
- International Maritime Organization. IMO 2020—Cutting Sulphur Oxide Emissions. Available online: https://imo.org/en/MediaCentre/HotTopics/Pages/Sulphur-2020.aspx (accessed on 10 October 2022).
- Global Maritime Forum. Getting to Zero Coalition—Accelerating Maritime Shipping’s Decarbonization with the Development and Deployment of Commercially Viable Deep Sea Zero Emission Vessels by 2030 towards Full Decarbonization by 2050. Available online: https://www.globalmaritimeforum.org/getting-to-zero-coalition (accessed on 10 October 2022).
- Batts, J.E.; Calder, L.J.; Batts, B.D. Utilizing stable isotope abundances of lichens to monitor environmental change. Chem. Geol. 2004, 204, 345–368. [Google Scholar] [CrossRef]
- Boltersdorf, S.H.; Werner, W. Lichens as a useful mapping tool?—An approach to assess atmospheric N loads in Germany by total N content and stable isotope signature. Environ. Monit. Assess. 2014, 186, 4767–4778. [Google Scholar] [CrossRef]
- Barros, C.; Pinho, P.; Durão, R.; Augusto, S.; Máguas, C.; Pereira, M.J.; Branquinho, C. Disentangling natural and anthropogenic sources of atmospheric sulfur in an industrial region using biomonitors. Environ. Sci. Technol. 2015, 49, 2222–2229. [Google Scholar] [CrossRef] [PubMed]
- Pinho, P.; Barros, C.; Augusto, S.; Pereira, M.J.; Máguas, C.; Branquinho, C. Using nitrogen concentration and isotopic composition in lichens to spatially assess the relative contribution of atmospheric nitrogen sources in complex landscapes. Environ. Pollut. 2017, 230, 632–638. [Google Scholar] [CrossRef] [PubMed]
Figure 1.
Locations of the São Gonçalo air quality monitoring station and the cruise ship terminal at the harbor of the city of Ponta Delgada, São Miguel Island, Azores. Map created with ArcGIS® world imagery online basemap by Esri (attributions provided below the image).
Figure 1.
Locations of the São Gonçalo air quality monitoring station and the cruise ship terminal at the harbor of the city of Ponta Delgada, São Miguel Island, Azores. Map created with ArcGIS® world imagery online basemap by Esri (attributions provided below the image).


Figure 2.
Yearly number of cruise ships and visitors (passengers + crew) which docked at Ponta Delgada city harbor in the period between January 2013 to December 2020.
Figure 2.
Yearly number of cruise ships and visitors (passengers + crew) which docked at Ponta Delgada city harbor in the period between January 2013 to December 2020.

Figure 3.
Seasonal pattern of cruise ship docking at Ponta Delgada city harbor displayed by the monthly number of ships in the period between January 2013 and December 2020.
Figure 3.
Seasonal pattern of cruise ship docking at Ponta Delgada city harbor displayed by the monthly number of ships in the period between January 2013 and December 2020.

Figure 4.
Annual proportions of cruise ships, classified by gross tonnage (GT), which docked at Ponta Delgada in the period between January 2013 and December 2020.
Figure 4.
Annual proportions of cruise ships, classified by gross tonnage (GT), which docked at Ponta Delgada in the period between January 2013 and December 2020.

Figure 5.
Daily exceedances of PM10 and PM2.5 recorded in the period between January 2013 and December 2020.
Figure 5.
Daily exceedances of PM10 and PM2.5 recorded in the period between January 2013 and December 2020.

Figure 6.
Mean daily concentrations of NOx, NO2, PM10, PM2.5, SO2 and O3 for the corresponding daily predominant wind quadrant in the spring (March to May) and autumn (September to November) seasons between the years 2013 and 2020.
Figure 6.
Mean daily concentrations of NOx, NO2, PM10, PM2.5, SO2 and O3 for the corresponding daily predominant wind quadrant in the spring (March to May) and autumn (September to November) seasons between the years 2013 and 2020.


Table 1.
Daily and yearly exceedances of the legislated limits (μg/m3) for each of the monitored air pollutants from 2013 until 2020.
Table 1.
Daily and yearly exceedances of the legislated limits (μg/m3) for each of the monitored air pollutants from 2013 until 2020.
| Year | Daily Records | Daily Maximum | Daily Limit | Daily Exceedances | Exceedances on CS Days | Yearly Average | Yearly Limit | Yearly Exceedances | |
|---|---|---|---|---|---|---|---|---|---|
| SO2 | 2013 | 78.9% | 3.3 | >125 | 0 | 0 | 0.8 | >20 | 0 |
| 2014 | 99.2% | 2.4 | 0 | 0 | 0.8 | 0 | |||
| 2015 | 98.6% | 24 | 0 | 0 | 0.9 | 0 | |||
| 2016 | 97.8% | 3.7 | 0 | 0 | 0.9 | 0 | |||
| 2017 | 92.6% | 9.1 | 0 | 0 | 1 | 0 | |||
| 2018 | 98.6% | 3.2 | 0 | 0 | 0.9 | 0 | |||
| 2019 | 100.0% | 3.8 | 0 | 0 | 1 | 0 | |||
| 2020 | 86.3% | 3.3 | 0 | 0 | 0.9 | 0 | |||
| O3 | 2013 | 91.5% | 104.6 | >120 | 0 | 0 | 67.1 | >120 | 0 |
| 2014 | 99.2% | 101.6 | 0 | 0 | 61.1 | 0 | |||
| 2015 | 98.1% | 108.1 | 0 | 0 | 64.2 | 0 | |||
| 2016 | 99.7% | 99.5 | 0 | 0 | 62.5 | 0 | |||
| 2017 | 95.1% | 106.8 | 0 | 0 | 63.6 | 0 | |||
| 2018 | 99.7% | 105 | 0 | 0 | 63 | 0 | |||
| 2019 | 100.0% | 110.9 | 0 | 0 | 61.3 | 0 | |||
| 2020 | 99.7% | 81.8 | 0 | 0 | 50 | 0 | |||
| NOx | 2013 | 79.7% | 31.7 | Not applicable | 7.3 | >30 | 0 | ||
| 2014 | 98.4% | 24.7 | 6.5 | 0 | |||||
| 2015 | 96.2% | 31.1 | 7.1 | 0 | |||||
| 2016 | 96.2% | 35.5 | 6.8 | 0 | |||||
| 2017 | 96.2% | 26.5 | 7 | 0 | |||||
| 2018 | 57.5% | 43.1 | 8 | 0 | |||||
| 2019 | 97.3% | 41.7 | 7.3 | 0 | |||||
| 2020 | 100.0% | 24 | 5.1 | 0 | |||||
| NO2 | 2013 | 79.7% | 25.2 | >200 | 0 | 0 | 5.6 | >40 | 0 |
| 2014 | 98.4% | 19.3 | 0 | 0 | 4.8 | 0 | |||
| 2015 | 96.2% | 21 | 0 | 0 | 5.5 | 0 | |||
| 2016 | 96.2% | 25.2 | 0 | 0 | 4.8 | 0 | |||
| 2017 | 96.2% | 19.6 | 0 | 0 | 4.9 | 0 | |||
| 2018 | 57.5% | 28.1 | 0 | 0 | 5.8 | 0 | |||
| 2019 | 97.3% | 24.4 | 0 | 0 | 5.7 | 0 | |||
| 2020 | 100.0% | 18.4 | 0 | 0 | 3.9 | 0 | |||
| PM10 | 2013 | 97.3% | 55 | >50 | 1 | 0 | 11.8 | >40 | 0 |
| 2014 | 99.2% | 103.7 | 4 | 0 | 11.6 | 0 | |||
| 2015 | 96.4% | 51.6 | 2 | 1 | 5.5 | 0 | |||
| 2016 | 92.9% | 125.1 | 1 | 0 | 10.7 | 0 | |||
| 2017 | 97.0% | 55.8 | 1 | 0 | 11.3 | 0 | |||
| 2018 | 94.5% | 61.6 | 2 | 0 | 12.7 | 0 | |||
| 2019 | 98.1% | 50.7 | 1 | 1 | 13.9 | 0 | |||
| 2020 | 98.9% | 88.4 | 3 | 0 | 13.9 | 0 | |||
| PM2.5 | 2013 | 78.90% | 37.1 | >20 | 1 | 0 | 5.9 | >7 | 0 |
| 2014 | 94.50% | 60.7 | 6 | 0 | 5.8 | 0 | |||
| 2015 | 83.30% | 32.6 | 4 | 1 | 5.4 | 0 | |||
| 2016 | 85.50% | 73.4 | 4 | 0 | 5.2 | 0 | |||
| 2017 | 93.70% | 25.7 | 2 | 0 | 5 | 0 | |||
| 2018 | 77.80% | 33.3 | 4 | 1 | 6.6 | 0 | |||
| 2019 | 69.60% | 29.5 | 5 | 1 | 7.3 | 1 | |||
| 2020 | 85.50% | 55.2 | 6 | 0 | 7 | 0 | |||
Table 2.
Results of the principal component analysis. Eigenvalues, variance, and cumulative variance are shown for the three principal components, along with the variable loadings (sorted by decreasing size) for either component on the obliquely rotated factor solution. Loadings above 0.5 or below −0.5 are marked with (*).
| PC1 | PC2 | PC3 | |
| Eigenvalue | 2.73 | 2.15 | 1.63 |
| Variance (%) | 21.02 | 16.56 | 12.56 |
| Cumulative Variance (%) | 21.02 | 37.58 | 50.14 |
| Variables | Loadings | ||
| NO2 | −0.952 * | 0.253 | 0.091 |
| NOx | −0.945 * | 0.209 | 0.103 |
| Wind Velocity | 0.608 * | 0.320 | 0.304 |
| SO2 | −0.199 | −0.070 | −0.008 |
| Precipitation | 0.064 | −0.003 | 0.006 |
| Air Temperature | 0.055 | −0.895 * | 0.036 |
| O3 | 0.358 | 0.744 * | −0.034 |
| Solar Radiation | 0.210 | −0.523 * | −0.399 |
| Combined Engine Power | −0.053 | 0.205 | −0.121 |
| PM10 | 0.198 | 0.110 | 0.892 * |
| PM2.5 | 0.185 | 0.073 | 0.891 * |
| Wind Direction | −0.147 | −0.174 | 0.329 |
| Relative Humidity | −0.037 | −0.051 | 0.328 |
Table 3.
Spearman correlation coefficients and corresponding significance p values associating daily air pollutant concentrations with the combined engine power of all CSs which docked on the same day. Significant correlations are flagged at p ≤ 0.05 (*), p ≤ 0.01 (**) and p ≤ 0.001 (***). Total period: data from January to December of each year. CS spring season: data from March to May of each year; CS autumn season: data from September to November of each year.
| Correlation | Spearman’s ρ | SO2 | NO2 | NOx | O3 | PM10 | PM2.5 | |
|---|---|---|---|---|---|---|---|---|
| Combined Engine power | Total Period | Coefficients | 0.010 | 0.085 *** | 0.084 *** | 0.144 *** | 0.001 | −0.001 |
| p value | 0.595 | <0.001 | <0.001 | <0.001 | 0.939 | 0.953 | ||
| CS Spring Season | Coefficients | 0.040 | 0.116 ** | 0.129 ** | 0.133 ** | 0.006 | 0.012 | |
| p value | 0.341 | 0.004 | 0.001 | <0.001 | 0.883 | 0.774 | ||
| CS Autumn Season | Coefficients | 0.023 | 0.083 * | 0.093 * | 0.075 * | −0.022 | −0.023 | |
| p value | 0.537 | 0.035 | 0.018 | 0.045 | 0.556 | 0.567 |
Table 4.
Mean atmospheric pollutant concentrations (μg/m3) of days with cruise ships versus days without cruise ships in the spring and autumn docking seasons from 2013 until 2020. Significant mean differences within each line are flagged at p ≤ 0.01 (**) (independent samples Welch’s t-test + Cohen’s d effect size). Spring season: data from March to May of each year; CS autumn season: data from September to November of each year.
| Pollutant | Season | Days with no Cruise Ships | Days with Cruise Ships | Effect Size | ||
|---|---|---|---|---|---|---|
| n | Mean ± S.E.M | n | Mean ± S.E.M | |||
| SO2 | Spring | 483 | 0.822 ± 0.027 | 172 | 0.823 ± 0.039 | −0.002 |
| Autumn | 588 | 0.938 ± 0.024 | 120 | 0.994 ± 0.057 | −0.094 | |
| NO2 | Spring | 520 | 3.896 ± 0.105 ** | 188 | 4.515 ± 0.212 ** | −0.232 |
| Autumn | 539 | 6.012 ± 0.174 | 110 | 6.539 ± 0.348 | −0.137 | |
| NOx | Spring | 520 | 5.184 ± 0.125 ** | 188 | 6.274 ± 0.335 ** | −0.285 |
| Autumn | 539 | 7.911 ± 0.218 | 110 | 8.912 ± 0.481 | −0.198 | |
| O3 | Spring | 516 | 73.500 ± 0.754 | 196 | 76.042 ± 1.227 | −0.148 |
| Autumn | 599 | 58.921 ± 0.545 | 123 | 61.217 ± 1.205 | −0.172 | |
| PM10 | Spring | 513 | 12.417 ± 0.263 | 188 | 12.670 ± 0.496 | −0.039 |
| Autumn | 590 | 11.992 ± 0.290 | 122 | 11.688 ± 0.634 | 0.043 | |
| PM2.5 | Spring | 475 | 5.962 ± 0.153 | 171 | 6.191 ± 0.278 | −0.066 |
| Autumn | 503 | 5.804 ± 0.174 | 106 | 5.551 ± 0.374 | 0.066 | |
Disclaimer/Publisher’s Note: The statements, opinions and data contained in all publications are solely those of the individual author(s) and contributor(s) and not of MDPI and/or the editor(s). MDPI and/or the editor(s) disclaim responsibility for any injury to people or property resulting from any ideas, methods, instructions or products referred to in the content. |
© 2023 by the authors. Licensee MDPI, Basel, Switzerland. This article is an open access article distributed under the terms and conditions of the Creative Commons Attribution (CC BY) license (https://creativecommons.org/licenses/by/4.0/).
Share and Cite
MDPI and ACS Style
Bernardo, F.; Garcia, P.; Rodrigues, A. Air Quality at Ponta Delgada City (Azores) Is Unaffected so Far by Growing Cruise Ship Transit in Recent Years. Atmosphere 2023, 14, 188. https://doi.org/10.3390/atmos14010188
AMA Style
Bernardo F, Garcia P, Rodrigues A. Air Quality at Ponta Delgada City (Azores) Is Unaffected so Far by Growing Cruise Ship Transit in Recent Years. Atmosphere. 2023; 14(1):188. https://doi.org/10.3390/atmos14010188
Chicago/Turabian StyleBernardo, Filipe, Patrícia Garcia, and Armindo Rodrigues. 2023. "Air Quality at Ponta Delgada City (Azores) Is Unaffected so Far by Growing Cruise Ship Transit in Recent Years" Atmosphere 14, no. 1: 188. https://doi.org/10.3390/atmos14010188
Note that from the first issue of 2016, this journal uses article numbers instead of page numbers. See further details here.