
Significant Increases in Wet Nighttime and Daytime–Nighttime Compound Heat Waves in China from 1961 to 2020
National Institute of Natural Hazards, Ministry of Emergency Management of China, Beijing 100085, China
Atmosphere 2023, 14(1), 178; https://doi.org/10.3390/atmos14010178
Submission received: 28 December 2022
/
Revised: 9 January 2023
/
Accepted: 9 January 2023
/
Published: 13 January 2023
(This article belongs to the Section Biometeorology)
Abstract
:Heat waves (HWs) with high humidity are dangerous to human health. However, existing studies on different types of HWs considering the effect of humidity are still limited. This study defines three types of wet summer HWs (that is, wet independent daytime and nighttime HWs and wet daytime-nighttime compound HWs) and investigates their spatial-temporal changes across China during 1961–2020. Results show significant upward trends of wet nighttime and compound HWs in terms of frequency, occurring days, duration, intensity and spatial extent, while changes for wet daytime HWs are weak and insignificant in nearly all sub-regions of China except for southwest and eastern northwest China. Compared with wet compound and daytime HWs, wet nighttime HWs accompanied by more elevated relative humidity exhibit larger growth rates in frequency, occurring days, duration and affected areas. Additionally, most wet nighttime and compound HWs with the longest duration and/or the maximum intensity are found to occur after the mid-1990s, compared to fewer than half for wet daytime HWs. Our findings emphasize the prominent intensifying trends in wet nighttime HWs across China for the last 60 years, and suggest more efforts on exploring humid HWs.
1. Introduction
Heat waves (HWs), typically described as extended periods of excessively hot weather, can exert far-reaching influences on human society and ecosystems [1,2,3,4]. Over the past few decades, extreme HWs have become more frequent, longer-lasting, and more intense around the world [5,6]. Significant increases in HWs are also projected to continue with global warming [7,8,9], which would pose a great threat to human health and socioeconomic development [10,11,12,13]. As one of the countries that are particularly vulnerable to climate extremes [14], China has experienced considerable increases in extreme high temperature events in recent decades [15,16,17], which brought about severe impacts. For example, a record-breaking HW event hit central and eastern China in 2013, leading to great excess mortality and disrupting the normal functioning of society [18]. The extraordinary hot summer in western China in 2015 and in northeastern China in 2016 caused considerable agricultural production losses and economic losses [19,20].
Though there is no universal definition of a HW event, the historical or future changes in HWs addressed by numerous studies were basically based on high temperatures during the day. However, this univariate definition may lead to a confusion of different categories of HWs and tends to underestimate or ignore the impacts arising from daytime–nighttime compound HWs [21,22,23]. Recently, several studies have emphasized the importance of utilizing the bivariate definitional framework with both extreme daytime and nighttime temperatures restricted to determine different HW types [21,24,25]. Increasing efforts have been dedicated to investigating diverse types of HWs, especially for combined day-night HWs, such as their observational or future changes [21,26,27], the associated mechanism [28,29,30] and population exposure [31,32,33]. Several studies have also evaluated the urbanization effects on the features of compound hot extremes on a regional or global scale [34,35,36,37]. Nevertheless, research on different categories of HWs considering the effect of humidity are still limited.
Besides high temperatures, ambient humidity also plays an important role in affecting heat-related morbidity and mortality, as they are both closely related to body heat exchange [38,39]. Hot and humid conditions can weaken the ability of evaporative cooling of the human body, leading to an accumulation of heat in the body and elevating the risk of human health [40]. For instance, Russo et al. found that the magnitude of HWs was strongly amplified by humidity, which exacerbated health consequences of HWs such as the 1995 Chicago HW and the 2003 Shanghai HW [41]. Few studies have explored spatial-temporal variations of HWs across China considering the influence of humidity (and note that they only used the univariate definition to define HWs) [42,43,44]. Based on 850-hPa specific humidity data to identify humid and dry conditions, Ma et al. investigated characteristics and associated mechanisms for wet and dry compound day–night HWs over mid-eastern China [45]. However, geographical patterns and temporal variations of different types of wet HWs across China based on the bivariate definitional framework remain unknown.
Hence, this paper focuses on different categories of hot and humid extremes over China from 1961 to 2020, which consist of wet independent daytime, wet independent nighttime, and wet daytime-nighttime compound HWs. We aim to provide a quantitative analysis of spatial-temporal changes in various aspects of three types of wet HWs, including their frequency, number of days involved, duration and intensity. Moreover, areal exposure to different wet HW types and severe HWs characterized by the longest duration and/or the highest intensity are also assessed.
2. Materials and Methods
2.1. Data
Daily maximum/minimum temperature (/) and daily mean relative humidity () during 1961–2020 are provided by the CN05.1 dataset [46], which has been widely employed in climate change and model evaluation over China [25,44,47]. This dataset is built on observations at 2416 stations throughout China and has a horizontal resolution of 0.25° × 0.25° [46]. Based on the “anomaly approach”, a gridded mean climatology is calculated by employing the thin-plate smoothing splines interpolation method, and a gridded daily anomaly obtained using an angular distance weighting method is added to the climatology [48].
2.2. Definition of Wet HWs
This study focuses on wet HWs in summertime from June to August over China as they have the greatest detrimental impacts on human society. Here, a HW event was identified as a period of at least three consecutive days with daily or/and exceeding its respective 90th percentile threshold (that is, and ). For each calendar day in summer, its percentile threshold was determined by the 15-day samples surrounding this day (that is, 7 days before and after the specific day) over 1961–1990. Therefore, there were 450 days (that is, 15 days × 30 years = 450 days) as the total samples in calculating the threshold for a given day. According to the previous studies [21,22,25], we first identified three types of HWs as follows: (a) independent daytime HW—at least three consecutive hot days but without any accompanying hot nights (that is, and ); (b) independent nighttime HW—at least three consecutive hot nights but without any accompanying hot days (that is, and ); (c) compound HW—at least three consecutive days with hot days and hot nights concurrently (that is, and ). Wet HWs were then identified when exceeding 60% during extreme hot periods [21,42,44,49]. Therefore, a wet independent daytime HW refers to a period of at least three consecutive days with , and . The other two types of wet HWs were defined similarly. We utilized the absolute threshold of 60% for as physical equivalent temperature and mortality will increase rapidly once exceeds 60% under extreme hot days [50].
2.3. Characteristics of Wet HWs
Each HW type was measured by four characteristics: (1) HW number (HWN), that is, the number of HW occurrences; (2) HW frequency (HWF), namely, the total number of days involved in all HWs; (3) HW duration (HWD), that is, the mean temporal length of HWs; (4) HW intensity (HWI), which was calculated as the / exceedance above the respective threshold for independent wet daytime or nighttime HWs, and the intensity of compound HWs was the sum of exceedance and exceedance. For each HW type, we first calculated the intensity of each event, and then divided the sum of intensity of all HWs by the number of events. As such, HWI denotes the annual average intensity.
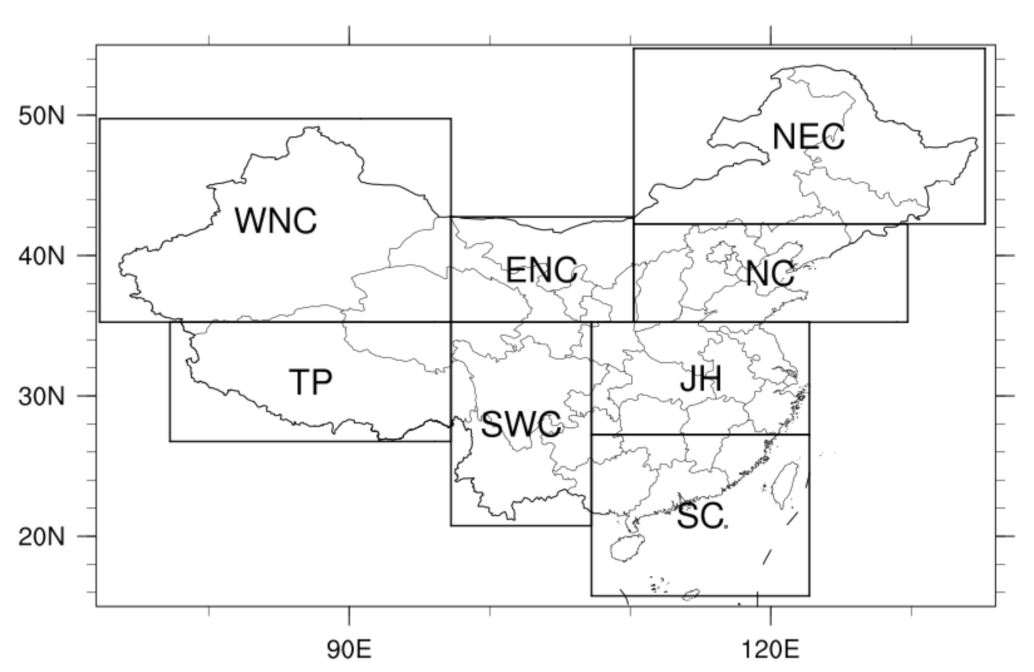
All characteristics were counted as yearly series from 1961 to 2020 for each grid point, and we only considered the wet HWs that occur during 1 June to 31 August. Linear trends of multiple characteristics of HWs were evaluated by employing the Theil-Sen’s estimator [51]. Statistical significance of linear trends was determined by the nonparametric Mann–Kendall test and was computed at the 0.05 level. To investigate the linear trends of diverse HW characteristics in sub-regions of China, following You et al. [17], we divided China into eight sub-regions (Figure 1).
3. Results
3.1. Main Features of Wet HWs
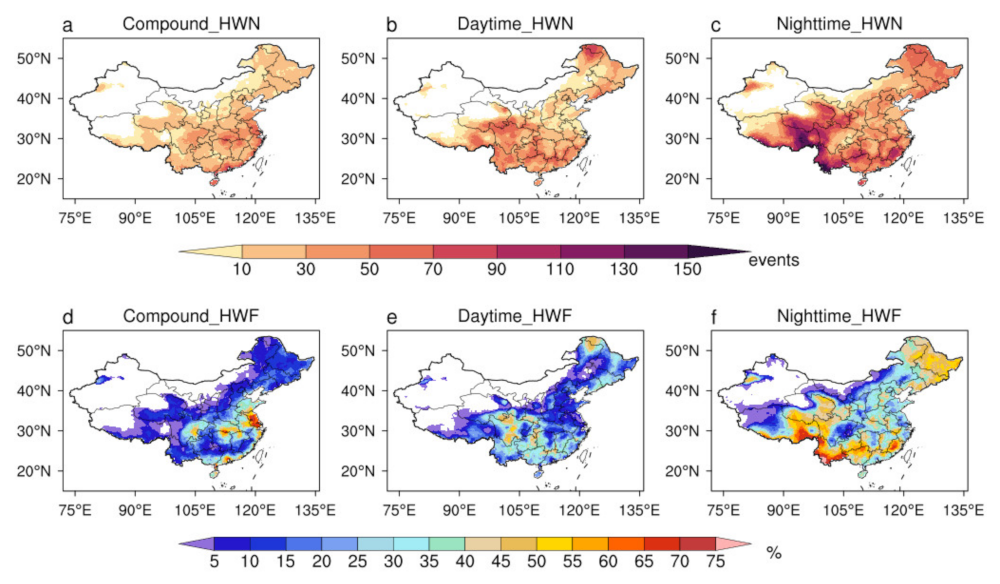
Figure 2a–c displays the accumulated occurrences (HWN) of three types of wet HWs over China from 1961 to 2020, and Figure 2d–f shows proportion of wet compound, daytime and nighttime HW days in total occurring days of each HW type. Wet HWs mainly appeared in eastern and southern China and were independent of HW types. There were clear location preferences in the prevalence of certain wet HWs. Wet compound HWs occurred most frequently across the middle and lower reaches of Yangtze River and in coastal regions of southern China, where the contribution of wet compound HW days to the total compound HW days reached 50%. Our results confirm the findings of Li et al., that the compound HWs in the mid-lower reaches of the Yangtze River are hot-humid [28]. The hot spots of wet daytime HWs showed good agreement with nighttime events, mainly distributed in South China and Southwest China. However, wet nighttime HWs were observed more frequently and their contribution to the total nighttime HW days was more significant than that of wet daytime HWs. For example, the maximum HWN of wet daytime HWs was less than 90 during 1961–2020, but for wet nighttime HWs, it exceeded 150. In the most affected areas of Southwest China, HWF of wet nighttime HWs accounted for more than 75% of the total nighttime HW days, compared to approximately 50% for wet daytime HWs.
Linear trends of wet compound, daytime and nighttime HWs in HWN, HWF, HWD and HWI across China are shown in Table 1. Significant upward trends in all characteristics of wet compound and nighttime HWs were detected. Note that, for wet daytime HWs, the only changes in HWI were significant, with a linear trend of 0.07 °C decade−1. The greatest increases in HWN, HWF and HWD were found in wet nighttime HWs with respective linear trends of 0.19 events decade−1, 0.82 days decade−1 and 0.33 days decade−1. Wet compound HWs exhibited the largest upward trend of HWI (that is, 0.48 °C decade−1), mainly owing to their HWI incorporated the temperature exceedances in both days and nights.
Trends of three wet HW types in eight sub-regions of China during 1961–2020 were further analyzed (Table 2). Four characteristics of wet compound HWs and wet nighttime HWs presented significant upward trends in all sub-regions. Compared with wet compound HWs and wet daytime HWs, the variations of wet nighttime HWs had the most prominent trends in almost all sub-regions. The exceptions are Jianghuai (JH) and South China (SC), where wet compound HWs exhibited the largest incremental trend in terms of HWI, that is, 0.83 °C decade−1 and 1.28 °C decade−1, respectively. In general, the largest increases of wet compound HWs were observed in SC, with a linear trend of 0.19 events decade−1 in HWN, 0.73 days decade−1 in HWF, 0.43 days decade−1 in HWD and 1.28 °C decade−1 in HWI. Regions such as Southwest China (SWC) and the Tibetan Plateau (TP) witnessed greater increases of wet nighttime HWs relative to other sub-regions. In contrast, changes for all four indicators of wet daytime HWs were weak and insignificant in nearly all sub-regions of China except for SWC and eastern Northwest China (ENC).
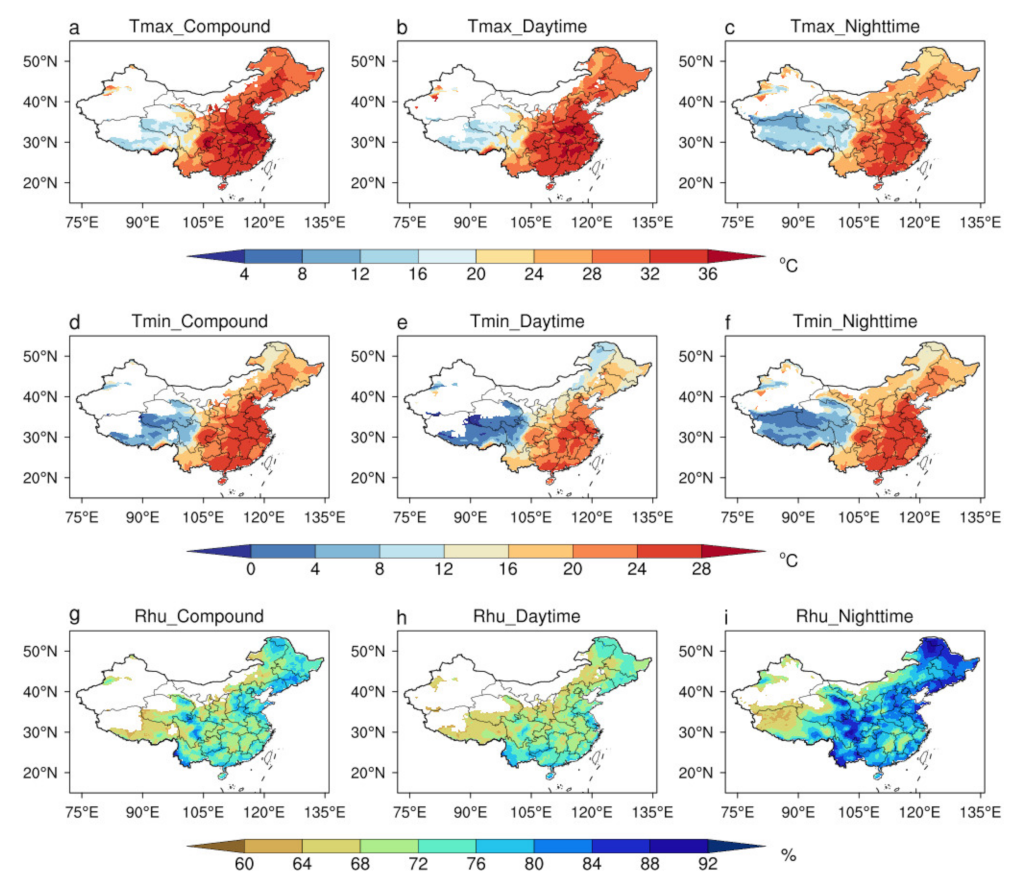
Figure 3 depicts the geographical distributions of , and during diverse types of wet HW days averaged over 1961–2020. Temperature featured obvious spatial variations, decreasing from eastern and southern China to western and northern China. Among all wet HW types, wet compound HWs had the highest and . Humidity during wet HW days was more spatially uniform, especially for nighttime and compound HWs. Particularly, wet nighttime HWs were accompanied by elevated humidity, with above 80% in many parts of China. Humid air during nights blocks outgoing long wave radiation and sends it to the ground, contributing to the establishment of warm environment near the surface and favoring the occurrence of nighttime HWs [29]. Persistent HWs with high nocturnal temperatures and humidity elevate nighttime heat stress, which could cause excessive human morbidity and mortality [52].
3.2. Variations of Areal Exposure to Wet HWs
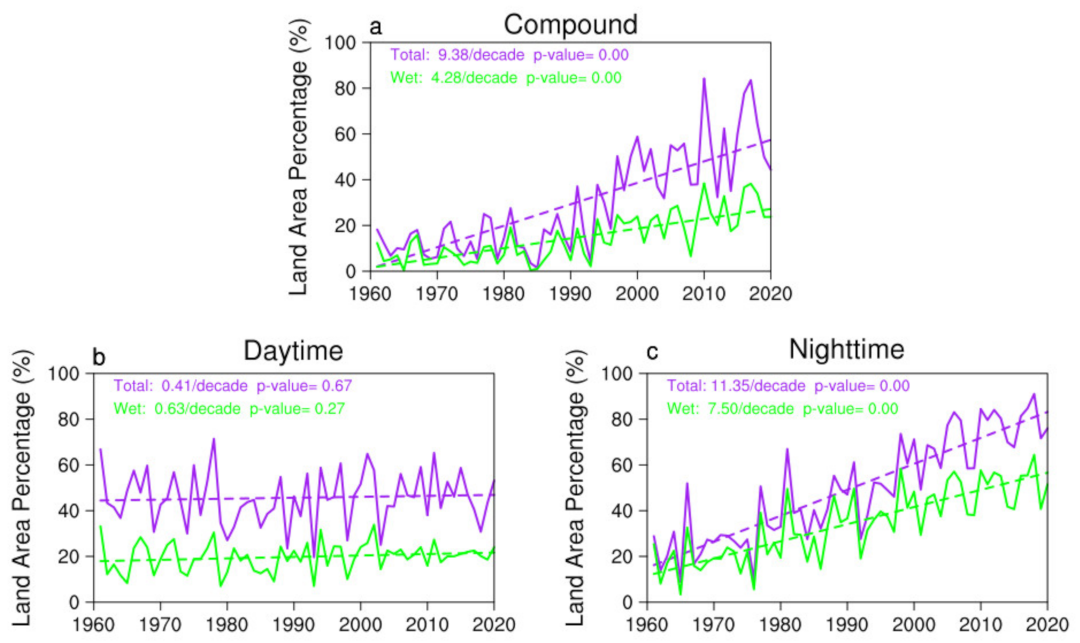
In order to highlight how the geographic extent of historical wet HWs has changed over time, we calculated the percentage of land areas exposed to each type of wet HW from 1961 to 2020 (Figure 4). Specifically, we divided the annual grid amounts experiencing different categories of HWs by the total number of grid points having observation data in the CN05.1 dataset. Results show that the spatial extent of wet compound HWs and wet nighttime HWs increased obviously with time, as well as all compound HWs and nighttime HWs without restricting the wetness level. In contrast, the percentage of areas affected by wet daytime HWs exhibited a negligible rising trend, which was not significant at the 0.05 significance level. From 1961 to 2020, there was a significant upward tendency of 4.3% per decade for the geographic extent of wet compound HWs. Before 1985, the spatial coverage of wet compound HWs decreased slightly; afterwards, a clear increase was detected (6.2% decade−1). For wet nighttime HWs, their spatial extent showed a monotonically upward tendency at a rate of 7.5% per decade.
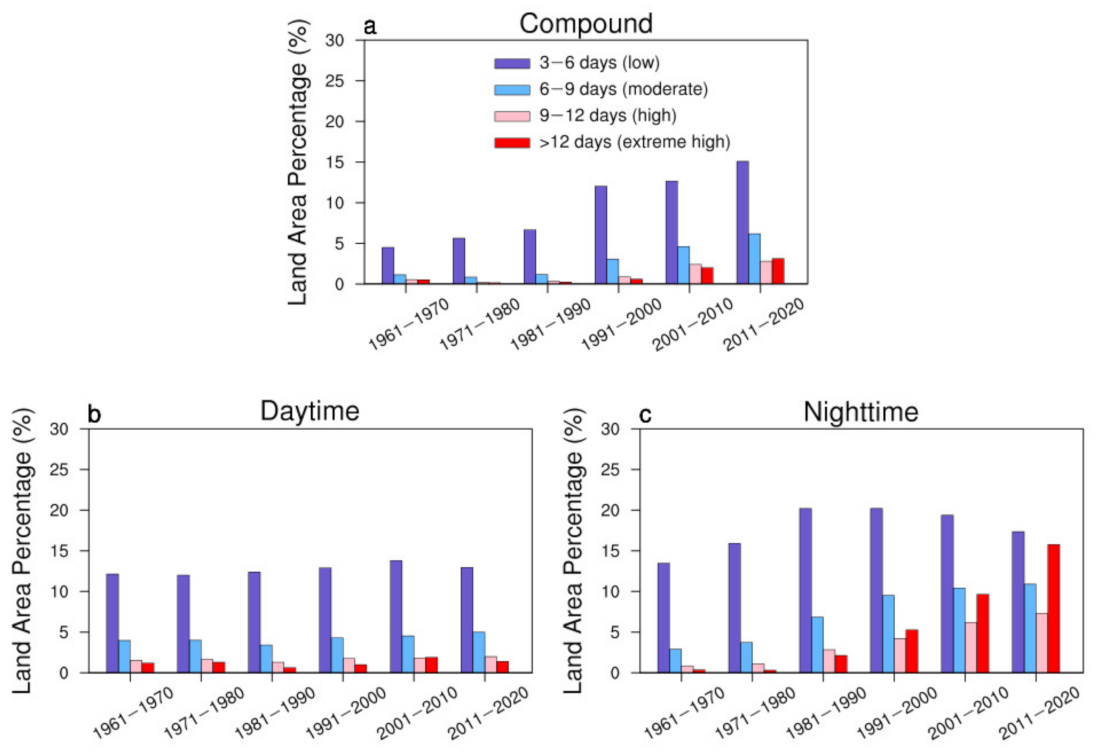
We also calculated the 10-year average fraction of land area experiencing different categories of wet HWs with HWF falling within a specified range (i.e., 3–6 days, 6–9 days, 9–12 days and >12 days) (Figure 5). Land area suffering wet compound HWs with low HWF (3–6 days) generally showed an upward trend from 1961 to 2020, but for HWs with moderate (6–9 days), high (9–12 days) and extreme high (>12 days) HWF, it first decreased and then increased from 1981 onward. In general, there was no obvious upward or downward trend in the affected areas of wet daytime HWs. The fraction of land area exposed to moderate, high and extreme high HWF of wet daytime HWs across six decades was almost no more than 5%. The land areas affected by wet nighttime HWs with low HWF first increased and then decreased. In contrast, the areal exposure to moderate, high and extreme high nighttime HWF exhibited an upward tendency. In the last three decades of 1961–2020, the fraction of land area experiencing wet nighttime HWs with extreme high HWF was even larger than that with high HWF, and gradually approached and surpassed the fraction of land area exposed to the wet nighttime HWs with moderate HWF.
The above-mentioned results distinctly point to a rapid increase in wet nighttime HWs across China in the last 60 years. Though wet compound HWs also showed an upward trend in the affected areas, the rising rate was smaller relative to wet nighttime HWs.
3.3. Severe Wet HWs
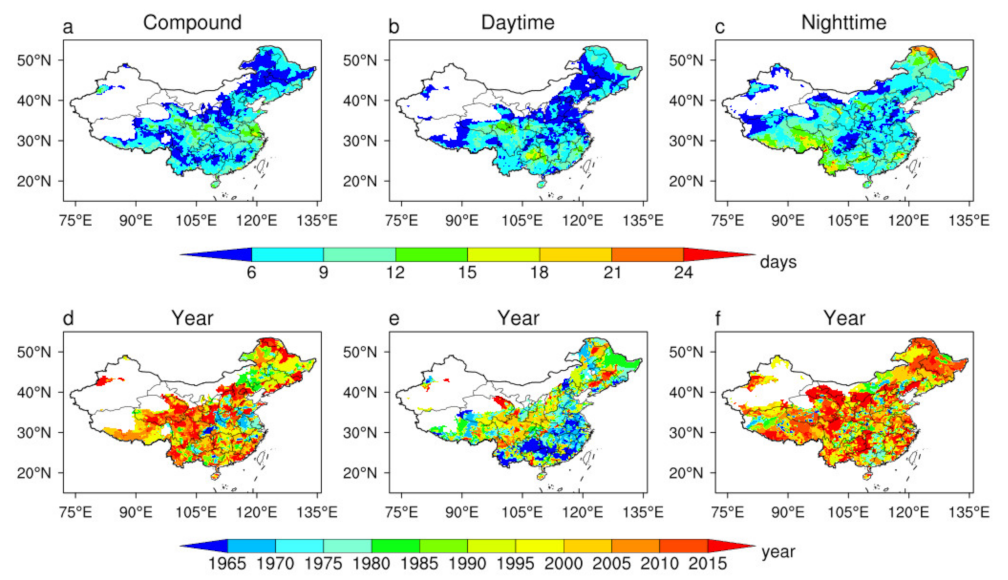
Compared with moderate HWs, severe hot extremes can cause more significant casualties as well as economic losses due to their extraordinary long duration and high intensity. Here, we discuss severe wet HWs in terms of long duration or high intensity. Figure 6a–c illustrates the longest duration of different types of wet HWs from 1961 to 2020. In most areas, the longest duration of wet HWs was below 9 days. However, in few regions of the middle and lower reaches of Yangtze River and Southwest China, the longest-lasting wet compound and daytime HW events reached 2 weeks. For the wet nighttime HWs, the longest duration in the northernmost and southwestern parts of China exceeded 24 and 15 days, respectively. The specific year in which severe events occurred on each grid point is also displayed in Figure 6d–f. The longest-lasting compound and nighttime HWs appeared in recent years after the mid-1990s, which accounted for 73% and 78% of all severe wet compound and nighttime HWs, respectively. In contrast, a large fraction of the wet daytime HWs with the longest duration, approximately 67%, occurred before the mid-1990s.
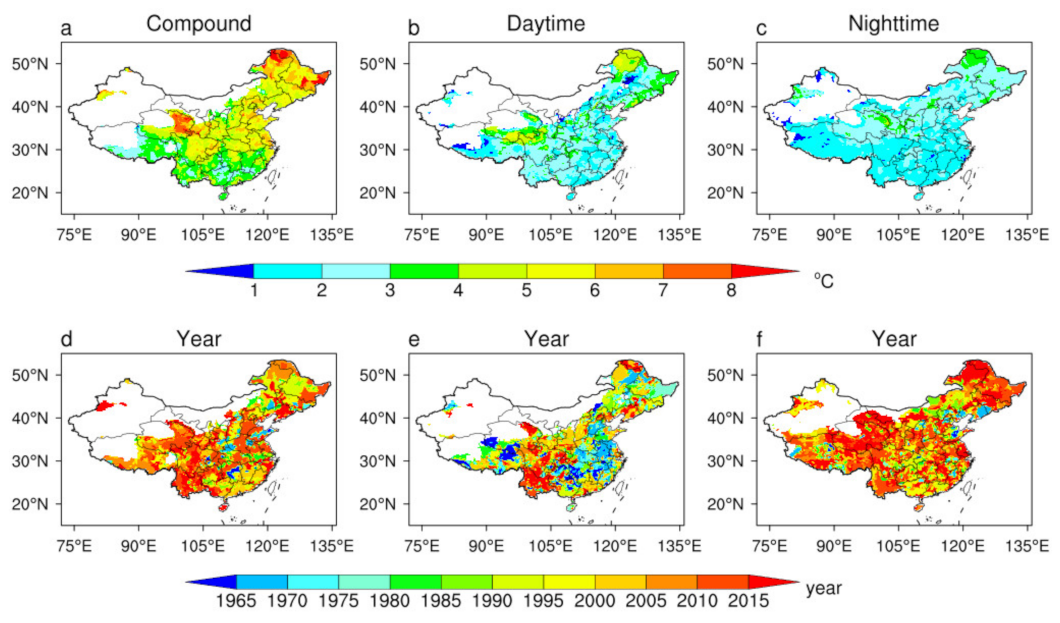
Figure 7 shows the maximum intensity of wet compound, daytime and nighttime HWs during 1961–2020 and the corresponding year. As expected, the maximum intensity of wet compound HWs was higher than that of wet daytime or nighttime events. The northeast and northwest parts of the nation witnessed the most severe HW events with the maximum intensity but did not suffer from the longest-lasting wet HWs. In these regions, the maximum intensity of wet compound HWs exceeded 8 °C, while for daytime and nighttime HWs, it was less than 6 and 5 °C, respectively. A larger fraction of the wet compound and nighttime HWs with the maximum intensity, both exceeding 80%, was detected to occur after the mid-1990s, compared to approximately 50% for wet daytime HWs.
4. Conclusions and Discussion
In this study, we defined three categories of wet summer HWs (wet independent daytime or nighttime HWs and wet daytime-nighttime compound HWs) over China based on high-resolution gridded data of daily maximum and minimum temperature and daily mean relative humidity during 1961–2020. Different wet HW types exhibited obvious location preferences. Wet compound HWs were most frequently observed in the Yangtze River Valley and in coastal regions of southern China. Wet daytime HWs and wet nighttime HWs had similar hot spots (mainly distributed in south and southwest China), yet the latter appeared more frequently. Significant upward trends in four indicators (frequency, occurring days, duration and intensity) of wet compound and nighttime HWs were detected across China, while changes for wet daytime HWs were weak and insignificant in nearly all sub-regions of China except for Southwest China and eastern Northwest China. Generally, the largest increases of wet compound HWs were found in South China. Southwest China and Tibetan Plateau experienced the largest incremental trends in wet nighttime HWs.
The largest upward trend in the spatial extent was found in wet nighttime HWs. Wet compound HWs also showed a rising trend in the affected areas but at a smaller rate relative to wet nighttime HWs. In contrast, the areal exposure to wet daytime HWs exhibited a slight and insignificant upward tendency. Decadal variations of land area exposed to wet HWs with different occurring days were also analyzed. Larger fraction of land area experienced more wet nighttime HW days, and a rapid extension of the areas affected by wet nighttime HWs with extreme high HWF (>12 days) was noticed in the second half of 1961–2020. Most severe wet compound and nighttime HWs characterized by the longest duration and/or the maximum intensity appeared after the mid-1990s, while for severe wet daytime HWs, they often occurred before the mid-1990s.
The intra-seasonally varying thresholds or a uniform threshold throughout the summertime for humidity were not adopted, as using relative thresholds here would result in too small sample sizes of three wet HW types. In one recent study, wet compound HWs were recognized when 850-hPa specific humidity anomalies surpassed 0.5 standard deviations of the humidity anomalies over all compound HW days and were observed more frequently in mid-lower reaches of the Yangtze River, the Sichuan–Chongqing region and coastal regions in southeast China [45]. The above-mentioned areas were also the location preferences of the occurrence of wet compound HWs in this work. In addition to distinct characteristics and impacts, the drivers and associated physical mechanisms for daytime-only, nighttime-only and daytime–nighttime compound HWs may also vary significantly. Some studies have analyzed physical mechanisms leading to three types of HWs [28,29,30]. For example, Luo et al. [29] suggested that all three categories of HWs in southern China are closely related to the strengthening and eastward extension of South Asian high and the strengthening and westward extension of western North Pacific subtropical high, but nighttime events are coupled with a stronger strengthening and more southward extension of South Asian high and western North Pacific subtropical high than daytime HWs. Several contribution studies have also demonstrated the important role of anthropogenic emissions in their observed changes [53,54,55]. For instance, Su and Dong [53] indicated that rises in greenhouse gas (GHG) concentrations have increased the frequency, intensity and spatial coverage of the three types of HWs over China since the mid-1990s, while changes in anthropogenic aerosol emissions have mainly affected daytime HWs. Nevertheless, the detailed processes responsible for different wet HW types remain less understood. One recent study analyzed the circulation anomalies of wet compound hot extremes in mid-eastern China, indicating that they are associated with eastward expansion of East Asian westerly jet stream and northeastward expansion of the South Asia high [45]. Overall, the specific physical mechanisms for formations and variations of different types of wet HWs over different sub-regions of China require further in-depth research.
In summary, this study provides a quantitative and systematic analysis of spatial-temporal variations in three types of wet HWs in terms of diverse aspects across China, highlighting the rapid increase of wet nighttime HWs for the last 60 years. The physical mechanisms, future projections and risks of different wet HW types need to be further explored.
Funding
This research was funded by the Research grants from National Institute of Natural Hazards, Ministry of Emergency Management of China (ZDJ2021-15) and China Postdoctoral Science Foundation (2021M702771).
Institutional Review Board Statement
Not applicable.
Informed Consent Statement
Not applicable.
Data Availability Statement
The CN05.1 dataset is available from the data producer upon reasonable request.
Conflicts of Interest
The authors declare no conflict of interest.
References
- Lesk, C.; Rowhani, P.; Ramankutty, N. Influence of extreme weather disasters on global crop production. Nature 2016, 529, 84–87. [Google Scholar] [CrossRef] [Green Version]
- Sun, Q.; Miao, C.; Hanel, M.; Borthwick, A.G.; Duan, Q.; Ji, D.; Li, H. Global heat stress on health, wildfires, and agricultural crops under different levels of climate warming. Environ. Int. 2019, 128, 125–136. [Google Scholar] [CrossRef] [PubMed]
- Xia, Y.; Li, Y.; Guan, D.; Tinoco, D.M.; Xia, J.; Yan, Z.; Yang, J.; Liu, Q.; Huo, H. Assessment of the economic impacts of heat waves: A case study of Nanjing, China. J. Clean. Prod. 2018, 171, 811–819. [Google Scholar] [CrossRef] [Green Version]
- Xu, Z.; FitzGerald, G.; Guo, Y.; Jalaludin, B.; Tong, S. Impact of heatwave on mortality under different heatwave definitions: A systematic review and meta-analysis. Environ. Int. 2016, 89, 193–203. [Google Scholar] [CrossRef] [PubMed]
- Alexander, L.V.; Zhang, X.; Peterson, T.C.; Caesar, J.; Gleason, B.; Klein Tank, A.M.G. Global observed changes in daily climate extremes of temperature and precipitation. J. Geophys. Res. Atmos. 2006, 111, D05109. [Google Scholar] [CrossRef] [Green Version]
- Perkins-Kirkpatrick, S.E.; Lewis, S.C. Increasing trends in regional heatwaves. Nat. Commun. 2020, 11, 3357. [Google Scholar] [CrossRef] [PubMed]
- Dosio, A.; Mentaschi, L.; Fischer, E.M.; Wyser, K. Extreme heat waves under 1.5 °C and 2 °C global warming. Environ. Res. Lett. 2018, 13, 054006. [Google Scholar] [CrossRef] [Green Version]
- Suarez-Gutierrez, L.; Müller, W.A.; Li, C.; Marotzke, J. Hotspots of extreme heat under global warming. Clim. Dyn. 2020, 55, 429–447. [Google Scholar] [CrossRef]
- Wang, P.; Hui, P.; Xue, D.; Tang, J. Future projection of heat waves over China under global warming within the CORDEX-EA-II project. Clim. Dyn. 2019, 53, 957–973. [Google Scholar] [CrossRef]
- Liu, Y.; Zhang, Z.; Chen, X.; Huang, C.; Han, F.; Li, N. Assessment of the regional and sectoral economic impacts of heat-related changes in labor productivity under climate change in China. Earth’s Future 2021, 9, e2021EF002028. [Google Scholar] [CrossRef]
- Mora, C.; Dousset, B.; Caldwell, I.R.; Powell, F.E.; Geronimo, R.C.; Bielecki, C.R.; Counsell, C.W.W.; Dietrich, B.S.; Johnston, E.T.; Louis, L.V.; et al. Global risk of deadly heat. Nat. Clim. Chang. 2017, 7, 501–506. [Google Scholar] [CrossRef] [Green Version]
- Orlov, A.; Sillmann, J.; Aunan, K.; Kjellstrom, T.; Aaheim, A. Economic costs of heat-induced reductions in worker productivity due to global warming. Global Environ. Chang. 2020, 63, 102087. [Google Scholar] [CrossRef]
- Yang, J.; Zhou, M.; Ren, Z.; Li, M.; Wang, B.; Liu, D.L.; Ou, C.-Q.; Yin, P.; Sun, J.; Tong, S.; et al. Projecting heat-related excess mortality under climate change scenarios in China. Nat. Commun. 2021, 12, 1039. [Google Scholar] [CrossRef]
- Wang, H.-J.; Sun, J.-Q.; Chen, H.-P.; Zhu, Y.-L.; Zhang, Y.; Jiang, D.-B.; Lang, X.-M.; Fan, K.; Yu, E.-T.; Yang, S. Extreme climate in China: Facts, simulation and projection. Meteorol. Z. 2012, 21, 279–304. [Google Scholar] [CrossRef]
- Deng, K.; Jiang, X.; Hu, C.; Chen, D. More frequent summer heat waves in southwestern China linked to the recent declining of Arctic sea ice. Environ. Res. Lett. 2020, 15, 074011. [Google Scholar] [CrossRef]
- Luo, M.; Lau, N.-C.; Liu, Z.; Wu, S.; Wang, X. An observational investigation of spatiotemporally contiguous heatwaves in China from a 3D perspective. Geophys. Res. Lett. 2022, 49, e2022GL097714. [Google Scholar] [CrossRef]
- You, Q.; Jiang, Z.; Kong, L.; Wu, Z.; Bao, Y.; Kang, S.; Pepin, N. A comparison of heat wave climatologies and trends in China based on multiple definitions. Clim. Dyn. 2017, 48, 3975–3989. [Google Scholar] [CrossRef] [Green Version]
- Sun, X.; Sun, Q.; Zhou, X.; Li, X.; Yang, M.; Yu, A.; Geng, F. Heat wave impact on mortality in Pudong New Area, China in 2013. Sci. Total Environ. 2014, 493, 789–794. [Google Scholar] [CrossRef] [PubMed]
- Li, H.; Chen, H.; Wang, H.; Sun, J.; Ma, J. Can Barents sea ice decline in spring enhance summer hot drought events over northeastern China? J. Clim. 2018, 31, 4705–4725. [Google Scholar] [CrossRef]
- Sun, Y.; Song, L.; Yin, H.; Zhou, B.; Hu, T.; Zhang, X.; Stott, P. Human influence on the 2015 extreme high temperature events in western China. Bull. Am. Meteorol. Soc. 2016, 97, S102–S106. [Google Scholar] [CrossRef]
- Chen, Y.; Li, Y. An inter-comparison of three heat wave types in China during 1961−2010: Observed basic features and linear trends. Sci. Rep. 2017, 7, 45619. [Google Scholar] [CrossRef] [PubMed] [Green Version]
- Chen, Y.; Zhou, B.; Zhai, P.; Moufouma-Okia, W. Half-a-degree matters for reducing and delaying global land exposure to combined daytime-nighttime hot extremes. Earth’s Future 2019, 7, 953–966. [Google Scholar] [CrossRef]
- Zscheischler, J.; Westra, S.; van den Hurk, B.J.J.M.; Seneviratne, S.I.; Ward, P.J.; Pitman, A.; AghaKouchak, A.; Bresch, D.N.; Leonard, M.; Wahl, T.; et al. Future climate risk from compound events. Nat. Clim. Chang. 2018, 8, 469–477. [Google Scholar] [CrossRef]
- Chen, Y.; Zhai, P. Revisiting summertime hot extremes in China during 1961–2015: Overlooked compound extremes and significant changes. Geophys. Res. Lett. 2017, 44, 5096–5103. [Google Scholar] [CrossRef]
- Wang, J.; Feng, J.; Yan, Z.; Chen, Y. Future risks of unprecedented compound heat waves over three vast urban agglomerations in China. Earth’s Future 2020, 8, e2020EF001716. [Google Scholar] [CrossRef]
- Li, Y.; Ding, Y.; Li, W. Observed trends in various aspects of compound heat waves across China from 1961 to 2015. J. Meteorol. Res. 2017, 31, 455–467. [Google Scholar] [CrossRef]
- Mukherjee, S.; Mishra, V. A sixfold rise in concurrent day and night-time heatwaves in India under 2 °C warming. Sci. Rep. 2018, 8, 16922. [Google Scholar] [CrossRef] [Green Version]
- Li, Y.; Ding, Y.; Liu, Y. Mechanisms for regional compound hot extremes in the mid-lower reaches of the Yangtze River. Int. J. Climatol. 2021, 41, 1292–1304. [Google Scholar] [CrossRef]
- Luo, M.; Lau, N.-C.; Liu, Z. Different mechanisms for daytime, nighttime, and compound heatwaves in southern China. Weather Clim. Extrem. 2022, 36, 100449. [Google Scholar] [CrossRef]
- Zhang, T.; Tam, C.-Y.; Lau, N.-C.; Wang, J.; Yang, S.; Chen, J.; Yu, W.; Jiang, X.; Gao, P. Influences of the boreal winter Arctic Oscillation on the peak-summer compound heat waves over the Yangtze–Huaihe River basin: The North Atlantic capacitor effect. Clim. Dyn. 2022, 59, 2331–2343. [Google Scholar] [CrossRef]
- Ma, F.; Yuan, X. Impact of climate and population changes on the increasing exposure to summertime compound hot extremes. Sci. Total Environ. 2021, 772, 145004. [Google Scholar] [CrossRef] [PubMed]
- Xie, W.; Zhou, B.; Han, Z.; Xu, Y. Substantial increase in daytime-nighttime compound heat waves and associated population exposure in China projected by the CMIP6 multimodel ensemble. Environ. Res. Lett. 2022, 17, 045007. [Google Scholar] [CrossRef]
- Zhang, Y.; Mao, G.; Chen, C.; Lu, Z.; Luo, Z.; Zhou, W. Population exposure to concurrent daytime and nighttime heatwaves in Huai River Basin, China. Sustain. Cities Soc. 2020, 61, 102309. [Google Scholar] [CrossRef]
- Liao, W.; Li, D.; Malyshev, S.; Shevliakova, E.; Zhang, H.; Liu, X. Amplified increases of compound hot extremes over urban land in China. Geophys. Res. Lett. 2021, 48, e2020GL091252. [Google Scholar] [CrossRef]
- Ma, F.; Yuan, X. More persistent summer compound hot extremes caused by global urbanization. Geophys. Res. Lett. 2021, 48, e2021GL093721. [Google Scholar] [CrossRef]
- Wang, J.; Chen, Y.; Liao, W.; He, G.; Tett, S.F.B.; Yan, Z.; Zhai, P.; Feng, J.; Ma, W.; Huang, C.; et al. Anthropogenic emissions and urbanization increase risk of compound hot extremes in cities. Nat. Clim. Chang. 2021, 11, 1084–1089. [Google Scholar] [CrossRef]
- Wu, S.; Wang, P.; Tong, X.; Tian, H.; Zhao, Y.; Luo, M. Urbanization-driven increases in summertime compound heat extremes across China. Sci. Total Environ. 2021, 799, 149166. [Google Scholar] [CrossRef]
- Basu, R.; Samet, J.M. Relation between elevated ambient temperature and mortality: A review of the epidemiologic evidence. Epidemiol. Rev. 2002, 24, 190–202. [Google Scholar] [CrossRef]
- Kovats, R.S.; Hajat, S. Heat stress and public health: A critical review. Annu. Rev. Public Health 2008, 29, 41–55. [Google Scholar] [CrossRef]
- Sherwood, S.C.; Huber, M. An adaptability limit to climate change due to heat stress. Proc. Natl Acad. Sci. USA. 2010, 107, 9552–9555. [Google Scholar] [CrossRef]
- Russo, S.; Sillmann, J.; Sterl, A. Humid heat waves at different warming levels. Sci. Rep. 2017, 7, 7477. [Google Scholar] [CrossRef] [Green Version]
- Ding, T.; Ke, Z. Characteristics and changes of regional wet and dry heat wave events in China during 1960−2013. Theor. Appl. Climatol. 2015, 122, 651–665. [Google Scholar] [CrossRef]
- Luo, M.; Lau, N.-C. Characteristics of summer heat stress in China during 1979–2014: Climatology and long-term trends. Clim. Dyn. 2019, 53, 5375–5388. [Google Scholar] [CrossRef]
- Xu, F.; Chan, T.O.; Luo, M. Different changes in dry and humid heat waves over China. Int. J. Climatol. 2021, 41, 1369–1382. [Google Scholar] [CrossRef]
- Ma, F.; Yuan, X.; Li, H. Characteristics and circulation patterns for wet and dry compound day-night heat waves in mid-eastern China. Global Planet. Chang. 2022, 213, 103839. [Google Scholar] [CrossRef]
- Wu, J.; Gao, X. A gridded daily observation dataset over China region and comparison with the other datasets. Chin. J. Geophys. 2013, 56, 1102–1111. (In Chinese) [Google Scholar]
- Chen, H.; He, W.; Sun, J.; Chen, L. Increases of extreme heat-humidity days endanger future populations living in China. Environ. Res. Lett. 2022, 17, 064013. [Google Scholar] [CrossRef]
- Wu, J.; Gao, X.; Giorgi, F.; Chen, D. Changes of effective temperature and cold/hot days in late decades over China based on a high resolution gridded observation dataset. Int. J. Climatol. 2017, 37, 788–800. [Google Scholar] [CrossRef]
- Gao, M.; Wang, B.; Yang, J.; Dong, W. Are peak summer sultry heat wave days over the Yangtze–Huaihe River Basin predictable? J. Clim. 2018, 31, 2185–2196. [Google Scholar] [CrossRef]
- Zheng, Y.; Yu, Y.; Tan, J.; Wu, R.; Xu, X. Influence of meteorological parameters on human comfort index. Meteor. Sci. Tech. 2007, 35, 827–831. (In Chinese) [Google Scholar]
- Sen, P.K. Estimates of the regression coefficient based on Kendall’s Tau. J. Am. Stat. Assoc. 1968, 63, 1379–1389. [Google Scholar] [CrossRef]
- Anderson, G.B.; Bell, M.L. Heat waves in the United States: Mortality risk during heat waves and effect modification by heat wave characteristics in 43 US communities. Environ. Health Perspect. 2011, 119, 210–218. [Google Scholar] [CrossRef]
- Su, Q.; Dong, B. Recent decadal changes in heat waves over China: Drivers and mechanisms. J. Clim. 2019, 32, 4215–4234. [Google Scholar] [CrossRef]
- Wang, J.; Chen, Y.; Tett, S.F.B.; Yan, Z.; Zhai, P.; Feng, J.; Xia, J. Anthropogenically-driven increases in the risks of summertime compound hot extremes. Nat. Commun. 2020, 11, 528. [Google Scholar] [CrossRef] [PubMed] [Green Version]
- Wang, X.; Lang, X.; Jiang, D. Detectable anthropogenic influence on summer compound hot events over China from 1965 to 2014. Environ. Res. Lett. 2022, 17, 034042. [Google Scholar] [CrossRef]
Figure 1.
Eight sub-regions of China including NEC (Northeast China, 42.25° N–54.75° N, 110.25° E–135.25° E), NC (North China, 35.25° N–42.25° N, 110.25° E–129.75° E), JH (Jianghuai, 27.25° N–35.25° N, 107.25° E–122.75° E), SC (South China, 15.75° N–27.25° N, 107.25° E–122.75° E), SWC (Southwest China, 20.75° N–35.25° N, 97.25° E–107.25° E), TP (Tibetan Plateau, 26.75° N–35.25° N, 97.25° E–107.25° E), WNC (Western Northwest China, 35.25° N–49.75° N, 7.25° E–97.25° E) and ENC (Eastern Northwest China, 35.25° N–42.75° N, 97.25° E–110.25° E).

Figure 2.
(a–c) Total number of wet compound, daytime and nighttime HW occurrences (HWN) during 1961–2020. (d–f) Percentage of wet compound, daytime and nighttime HW days (HWF) in total certain HW days. Blank areas, except Taiwan, indicate no wet HWs occurrence.
Figure 2.
(a–c) Total number of wet compound, daytime and nighttime HW occurrences (HWN) during 1961–2020. (d–f) Percentage of wet compound, daytime and nighttime HW days (HWF) in total certain HW days. Blank areas, except Taiwan, indicate no wet HWs occurrence.

Figure 3.
Spatial patterns of the average (a–c) maximum temperature (), (d–f) minimum temperature (), (g–i) relative humidity () during compound, daytime and nighttime HW days from 1961 to 2020.
Figure 3.
Spatial patterns of the average (a–c) maximum temperature (), (d–f) minimum temperature (), (g–i) relative humidity () during compound, daytime and nighttime HW days from 1961 to 2020.

Figure 4.
Temporal changes in percentage of land areas experiencing wet (a) compound, (b) daytime and (c) nighttime HWs from 1961 to 2020. Purple and green lines represent all HWs without restricting the wetness level and wet HWs with exceeding 60%, respectively.
Figure 4.
Temporal changes in percentage of land areas experiencing wet (a) compound, (b) daytime and (c) nighttime HWs from 1961 to 2020. Purple and green lines represent all HWs without restricting the wetness level and wet HWs with exceeding 60%, respectively.

Figure 5.
Temporal variations in proportion of land areas suffering wet (a) compound, (b) daytime and (c) nighttime HWs with HWF falling within a specified range, such as 3–6 days (purple), 6–9 days (blue), 9–12 days (pink) and >12 days (red). Results are averaged over each decade during 1961–2020.
Figure 5.
Temporal variations in proportion of land areas suffering wet (a) compound, (b) daytime and (c) nighttime HWs with HWF falling within a specified range, such as 3–6 days (purple), 6–9 days (blue), 9–12 days (pink) and >12 days (red). Results are averaged over each decade during 1961–2020.

Figure 6.
The longest duration of the wet (a) compound, (b) daytime and (c) nighttime HWs during 1961–2020, and (d–f) the year corresponding to the longest duration.
Figure 6.
The longest duration of the wet (a) compound, (b) daytime and (c) nighttime HWs during 1961–2020, and (d–f) the year corresponding to the longest duration.

Figure 7.
The maximum intensity of the wet (a) compound, (b) daytime and (c) nighttime HWs during 1961–2020, and (d–f) the year corresponding to the maximum intensity.
Figure 7.
The maximum intensity of the wet (a) compound, (b) daytime and (c) nighttime HWs during 1961–2020, and (d–f) the year corresponding to the maximum intensity.


Table 1.
Linear trends of wet compound, daytime and nighttime HWs in HWN (events decade−1), HWF (days decade−1), HWD (days decade−1) and HWI (°C decade−1) averaged over China during 1961–2020. Estimated trends with * indicate that they are significant at the 0.05 level.
Table 1.
Linear trends of wet compound, daytime and nighttime HWs in HWN (events decade−1), HWF (days decade−1), HWD (days decade−1) and HWI (°C decade−1) averaged over China during 1961–2020. Estimated trends with * indicate that they are significant at the 0.05 level.
| HW Type | HWN | HWF | HWD | HWI |
|---|---|---|---|---|
| Compound | 0.07 * | 0.27 * | 0.18 * | 0.48 * |
| Daytime | 0.02 | 0.06 | 0.02 | 0.07 * |
| Nighttime | 0.19 * | 0.82 * | 0.33 * | 0.35 * |
Table 2.
Same as Table 1, but for the eight sub-regions of China.
Table 2.
Same as Table 1, but for the eight sub-regions of China.
| Sub-Region | HW Type | HWN | HWF | HWD | HWI | |
|---|---|---|---|---|---|---|
| NEC | Compound | 0.04 * | 0.12 * | 0.11 * | 0.43 * | |
| Daytime | 0.03 | 0.10 | 0.05 | 0.19 | ||
| Nighttime | 0.19 * | 0.77 * | 0.42 * | 1.00 * | ||
| NC | Compound | 0.02 * | 0.08 * | 0.08 * | 0.22 * | |
| Daytime | 0.02 | 0.06 | 0.05 | 0.11 | ||
| Nighttime | 0.11 * | 0.39 * | 0.24 * | 0.39 * | ||
| JH | Compound | 0.10 * | 0.38 * | 0.24 * | 0.83 * | |
| Daytime | 0.00 | −0.01 | −0.03 | 0.03 | ||
| Nighttime | 0.16 * | 0.57 * | 0.32 * | 0.43 * | ||
| SC | Compound | 0.19 * | 0.73 * | 0.43 * | 1.28 * | |
| Daytime | 0.04 | 0.10 | 0.05 | 0.14 | ||
| Nighttime | 0.29* | 1.23 * | 0.52 * | 0.77 * | ||
| SWC | Compound | 0.11 * | 0.42 * | 0.31 * | 1.06 * | |
| Daytime | 0.08 * | 0.32 * | 0.17 * | 0.53 * | ||
| Nighttime | 0.36 * | 1.58 * | 0.52 * | 1.26 * | ||
| TP | Compound | 0.04 * | 0.15 * | 0.12 * | 0.30 * | |
| Daytime | 0.00 | 0.01 | 0.00 | 0.05 | ||
| Nighttime | 0.36 * | 1.77 * | 0.44 * | 1.36 * | ||
| WNC | Compound | 0.00 * | 0.01 * | 0.01 * | 0.02 * | |
| Daytime | 0.00 | 0.00 | 0.00 | 0.00 | ||
| Nighttime | 0.02 * | 0.09 * | 0.06 * | 0.11 * | ||
| ENC | Compound | 0.01 * | 0.02 * | 0.02 * | 0.05 * | |
| Daytime | 0.01 * | 0.03 * | 0.03 * | 0.05 * | ||
| Nighttime | 0.08 * | 0.33 * | 0.18 * | 0.44 * |
Estimated trends with * indicate that they are significant at the 0.05 level.
Disclaimer/Publisher’s Note: The statements, opinions and data contained in all publications are solely those of the individual author(s) and contributor(s) and not of MDPI and/or the editor(s). MDPI and/or the editor(s) disclaim responsibility for any injury to people or property resulting from any ideas, methods, instructions or products referred to in the content. |
© 2023 by the author. Licensee MDPI, Basel, Switzerland. This article is an open access article distributed under the terms and conditions of the Creative Commons Attribution (CC BY) license (https://creativecommons.org/licenses/by/4.0/).
Share and Cite
MDPI and ACS Style
Chen, X. Significant Increases in Wet Nighttime and Daytime–Nighttime Compound Heat Waves in China from 1961 to 2020. Atmosphere 2023, 14, 178. https://doi.org/10.3390/atmos14010178
AMA Style
Chen X. Significant Increases in Wet Nighttime and Daytime–Nighttime Compound Heat Waves in China from 1961 to 2020. Atmosphere. 2023; 14(1):178. https://doi.org/10.3390/atmos14010178
Chicago/Turabian StyleChen, Xi. 2023. "Significant Increases in Wet Nighttime and Daytime–Nighttime Compound Heat Waves in China from 1961 to 2020" Atmosphere 14, no. 1: 178. https://doi.org/10.3390/atmos14010178
Note that from the first issue of 2016, this journal uses article numbers instead of page numbers. See further details here.