Article

Assessment of Climatic Impact on Vegetation Spring Phenology in Northern China

1
School of Plant Protection, Joint International Research Laboratory of Agriculture and Agri-Product Safety of the Ministry of Education, Yangzhou University, Yangzhou 225009, China
2
College of Physical Science and Technology, Yangzhou University, Yangzhou 225002, China
3
Jiangsu Key Laboratory of Agricultural Meteorology, Collaborative Innovation Center on Forecast and Evaluation of Meteorological Disasters, Nanjing University of Information Science & Technology, Nanjing 210044, China
4
College of Hydraulic Science and Engineering, Yangzhou University, Yangzhou 225009, China
*
Author to whom correspondence should be addressed.
These authors contributed equally to this work.
Atmosphere 2023, 14(1), 117; https://doi.org/10.3390/atmos14010117
Submission received: 18 November 2022 / Revised: 29 December 2022 / Accepted: 1 January 2023 / Published: 5 January 2023

Abstract

:
Spring phenology is often considered the start of season (SOS) for vegetation, which can affect ecosystem photosynthesis, respiration, and evapotranspiration. However, the long-run variation of SOS remains unclear at the regional scale. In this research, the long-term variation of SOS in northern China was explored by using the updated normalized difference vegetation index and monthly climatic data during 1982–2014. Furthermore, the relative importance of climatic factors on SOS was analyzed through partial correlation and multivariate regression methods. The main results were as follows: (1) average SOS largely ranged between day 120 and 165 of the year and varied widely for different vegetation types; (2) SOS during 1982–2014 showed an advancing trend, but it appeared to be reversed after 1998; (3) preseason minimum temperature was a dominant factor controlling SOS in most pixels in northern China, followed by maximum temperature (Tmx). However, impacts of radiation and precipitation on the trend of SOS primarily depended on vegetation types; (4) impacts of climatic factors on SOS declined in the period after 1998, especially for Tmx. These findings provide important support for modeling vegetation phenology and growth in northern China.

1. Introduction

Vegetation, as an important component of terrestrial ecosystems, has a critical impact on terrestrial carbon balance and ecosystem productivity [1,2]. Moreover, it regulates the regional climate through biophysical and biogeochemical feedback [3]. Vegetation phenology is an indicator that reflects the timing of periodic biologic events or processes, which is very sensitive to regional climatic change [4,5]. For example, spring phenology is often considered the start of season (SOS) for vegetation, which can affect many ecosystem processes, such as photosynthesis, respiration, and evapotranspiration [6,7]. Therefore, a changing SOS provides an independent perspective on the understanding of how ecosystems respond to climatic change, which has become a widespread concern.
With the development of remote sensing technology, it is no longer difficult to obtain high-resolution and long-term satellite data [8,9,10]. In previous studies, more researchers have used green vegetation indices, such as the normalized difference vegetation index (NDVI), to monitor SOS at the regional scale, since regional SOS variation cannot be analyzed by using ground observation data [11,12,13]. NDVI-based studies found that SOS showed an advancing trend in different regions of the Northern Hemisphere [14,15,16]. Moreover, there was more heterogeneity in the advancing trend of SOS at the regional scale [17,18]. Recent studies indicated that SOS did not always show an advancing trend. For example, it showed a slight delay in the China–North Korea–Russia cross-border region from 1982 to 2015 [19]. Yu et al. [20] detected a rapidly delaying trend of SOS for steppes and meadows in the Tibetan Plateau after the mid-1990s. Furthermore, the advancing trend of SOS also appeared to be reversed during the recent decade in Xinjiang, northwestern China [21]. These previous works highlighted the complexity of SOS trends in the middle latitudes of the Northern Hemisphere, suggesting that the long-run variation of SOS remained unclear at the regional scale.
Generally, climatic factors such as temperature, precipitation (Pre), and radiation (Rad) have an important impact on SOS [22,23]. Although some existing studies found that the advance of SOS was induced by climatic warming, the impact of temperature on SOS was more complex than expected [24,25]. For instance, winter and spring warming caused the delay of SOS in the Qinghai–Tibet Plateau despite continuous warming [20]. In addition to the timing of warming, the effects of maximum temperature (Tmx) and minimum temperature (Tmn) on SOS were also more complex [26,27]. Piao et al. [28] argued that SOS was mainly triggered by Tmx in the Northern Hemisphere. In contrast, some researchers found that SOS was more responsive to Tmn in the Tibetan Plateau and temperate grasslands of China [29,30]. A recent study even highlighted the asymmetric effect of Tmx and Tmn on SOS [31]. It has been also reported that Pre can influence SOS in addition to temperature [32]. In arid and semi-arid regions, SOS was more sensitive to interannual changes in Pre [33]. Despite growing concern about the response of SOS to climatic factors, little progress has been made to evaluate the contribution of climatic factors.
Northern China covers an area of approximately 5,400,000 km2, accounting for 56.25% of China’s land area, and is located in middle latitudes of the Northern Hemisphere. In the context of global climate change, a rapid warming of 0.57 °C per decade and uneven precipitation patterns were found in this region, affecting vegetation growth [34]. There are complex and diverse vegetation types in northern China, including forests, grasslands, meadows, shrubs, and others. These characteristics make northern China an ideal region for analyzing SOS variation. Although some studies have reported an overall trend of SOS in northern China, the turning point of long-term SOS variation (>30 years) is still not clear [35,36]. In addition, the relationship between SOS and climatic factors (Tmn, Tmx, Pre, and Rad) is complex, with a lack of evaluation and comparison [37,38]. Therefore, the updated NDVI3g data of the Global Inventory Monitoring and Modeling Studies (GIMMS) and monthly climatic data from 1982 to 2014 were used to explore: (1) the long-term variation of SOS in northern China; and (2) the relative importance of climatic factors, including Tmn, Tmx, Pre, and Rad, affecting SOS variation at the regional scale. The result may provide important evidence for understanding the relationship between climate change and vegetation growth.

2. Materials and Methods
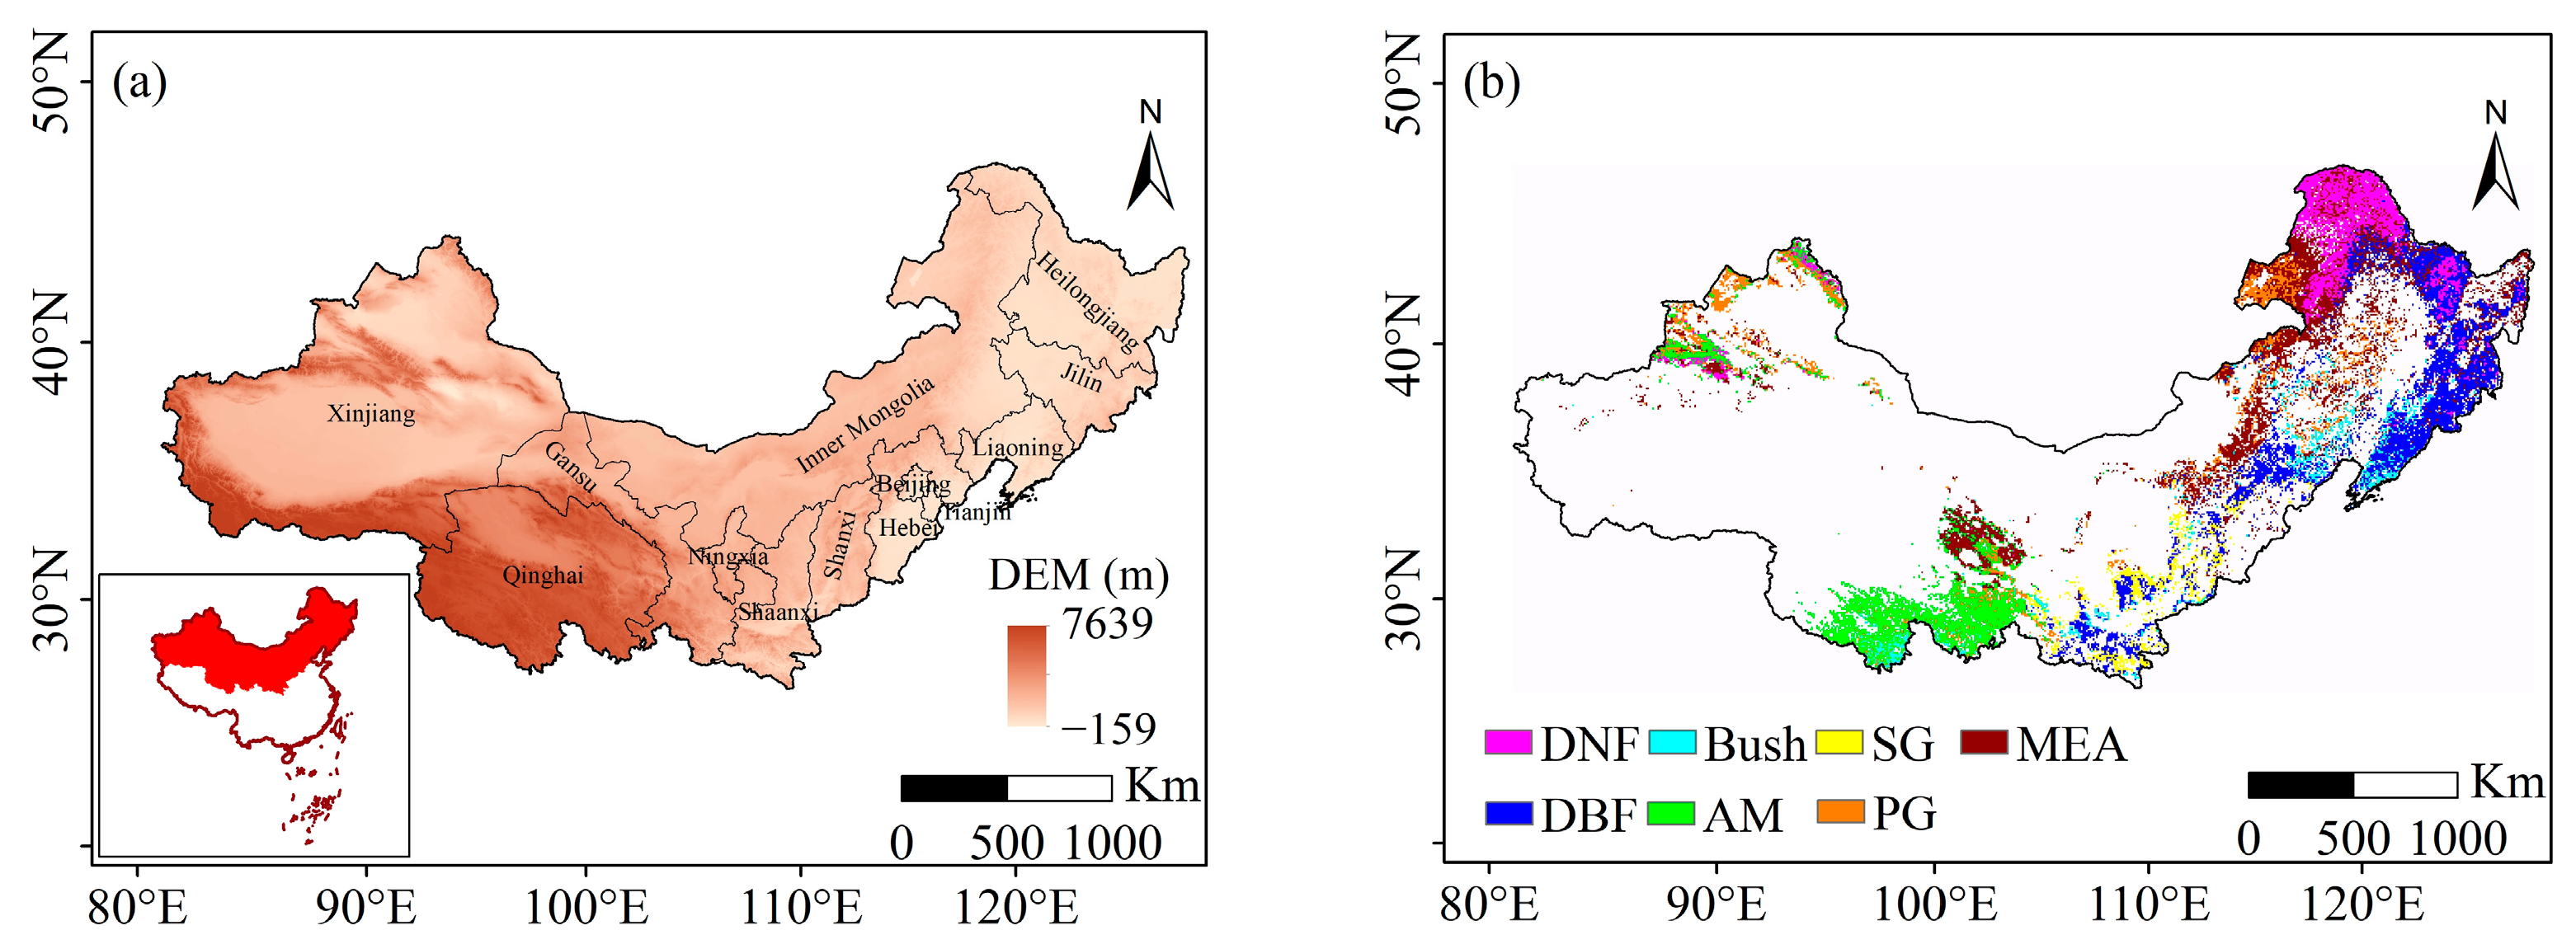
2.1. Study Region

Northern China ranges from 73°33′ E to 135°05′ E in longitude and from 34°34′ N to 53°33′ N in latitude, including Northeast China, North China, and Northwest China, with nine provinces, two municipalities, and two autonomous regions (Figure 1a). It covers four climatic zones, including cold temperate, middle temperate, warm temperate, and plateau temperate zones. The digital elevation model of northern China ranges from −159 to 7639 m. Annual average temperature increases from −2.5 °C in the north (Heilongjiang) to 15.7 °C in the south (Shaanxi), while annual Pre decreases from 861.5 mm/year in the south (Shaanxi) to 54.8 mm/year in the west (Xinjiang). Most of this region is characterized by a cold, dry winter and a warm, moist summer, with an annual sunshine duration of approximately 1700–3200 h. Due to the heterogeneous geographical and climatic conditions, a variety of plant functional types can be found in this region (Figure 1b), including deciduous needleleaf forest (DNF), deciduous broadleaf forest (DBF), bush, meadow (MEA), plain grassland (PG), slope grassland (SG), alpine and sub-alpine meadow (AM), etc.

2.2. Data

Due to the limitation of ground-based phenological observations, NDVI was widely used in vegetation phenology monitoring over the past few decades [39,40]. In this study, the semi-monthly GIMMS NDVI3g dataset was used to detect SOS from 1982 to 2014, with a spatial resolution of 8 × 8 km2. The NDVI dataset was modified for orbital drift, solar geometry, heavy aerosols, calibration, clouds, and other effects unrelated to vegetation variation, and was downloaded from http://www.nesdc.org.cn/sdo/detail?id=60f63b9e7e28174f0e7d8d46, (accessed on 2 September 2021).
Monthly climate time series datasets for Tmn, Tmx, Pre, and Rad ranged from 1981 to 2014. They were provided by the National Climate Center of China and obtained from 312 national meteorological observing stations. After collecting these datasets, the Kriging method was used to produce the monthly raster images of climate datasets with a spatial resolution of 8 × 8 km2.
A digitized 1:4,000,000 vegetation cluster map was released by the Chinese Academy of Sciences. There were seven main plant functional types in northern China. However, the cultivation area was excluded due to the severe effect of anthropogenic activities on phenology.

2.3. Methods

2.3.1. Retrieving SOS from Satellite Data

The threshold method was widely used to extract SOS because of its stability and robustness [41]. After smoothing the mutational noise of the original NDVI time series with a Savitzky–Golay filter, the dynamic threshold method was used to extract the specific day of year (DOY) for the SOS in this study [42]. The following formula determined the NDVI ratio for each pixel:
NDVIratio = (NDVI − NDVImin)/(NDVImax − NDVImin)
where NDVI is a daily NDVI value in one year; NDVImax and NDVImin are the maximum and minimum NDVI values, respectively.
Previous studies defined a value of 0.2 as a widely accepted threshold [43,44]. Therefore, SOS was extracted on the first day when the NDVIratio increased to 0.2 in northern China. The TIMESAT software (https://web.nateko.lu.se/timesat/timesat.asp?cat=4, (accessed on 12 September 2021)) was extracted SOS for each pixel.

2.3.2. Identifying the Trends of SOS

In this study, long-term trends of SOS were estimated by a linear least-squares regression analysis for each pixel. The calculation formula was as follows:
T r e n d S O S = n × i = 1 n i × S O S i i = 1 n i × i = 1 n S O S i n × i n i 2 ( i n i ) 2
where TrendSOS is a SOS trend, n is the year, and SOSi is the SOS of the i th year. A positive TrendSOS represents a delay of SOS, while a negative TrendSOS represents an advance of SOS. The significance level was set at p < 0.05.
Furthermore, turning points of annual SOS series were identified based on the ‘Segmented’ R software package. After completing the sensitivity examination of different initial values, this package could give the best linear fitting result.

2.3.3. Quantifying the Impact of Climatic Factors on SOS

Climatic factors have cumulative effects on SOS. Yuan et al. [45] suggested that partial correlation analysis was used to select a preseason length for different climatic factors. For instance, partial correlation coefficients between Tmn and SOS were calculated from 0 to 7 months before SOS for each pixel by controlling the corresponding Tmx, Pre, and Rad. Preseason length of Tmn was defined as the month with the highest absolute partial correlation coefficient for each pixel. Similar steps were used to determine the preseason length of Tmx, Pre, and Rad at the pixel scale.
To understand the impact of climatic factors on SOS, a multivariate regression analysis was performed on the relationship between SOS and preseason climatic factors. This method detected the independent effect of each climatic factor on SOS while eliminating effects of other factors. The formula was calculated as follows:
SOS = α × Tmn + β × Tmx + γ × Pre + δ × Rad + θ
where SOS is the annual SOS series; α, β, γ, and δ are regression coefficients of four climatic factors on SOS, respectively; θ is the intercept of this formula.
Moreover, Equation (3) was also used to calculate the standard regression coefficient of climatic factors. The dominant climatic factor affecting SOS was identified in this study based on the highest absolute regression coefficient.

3. Results

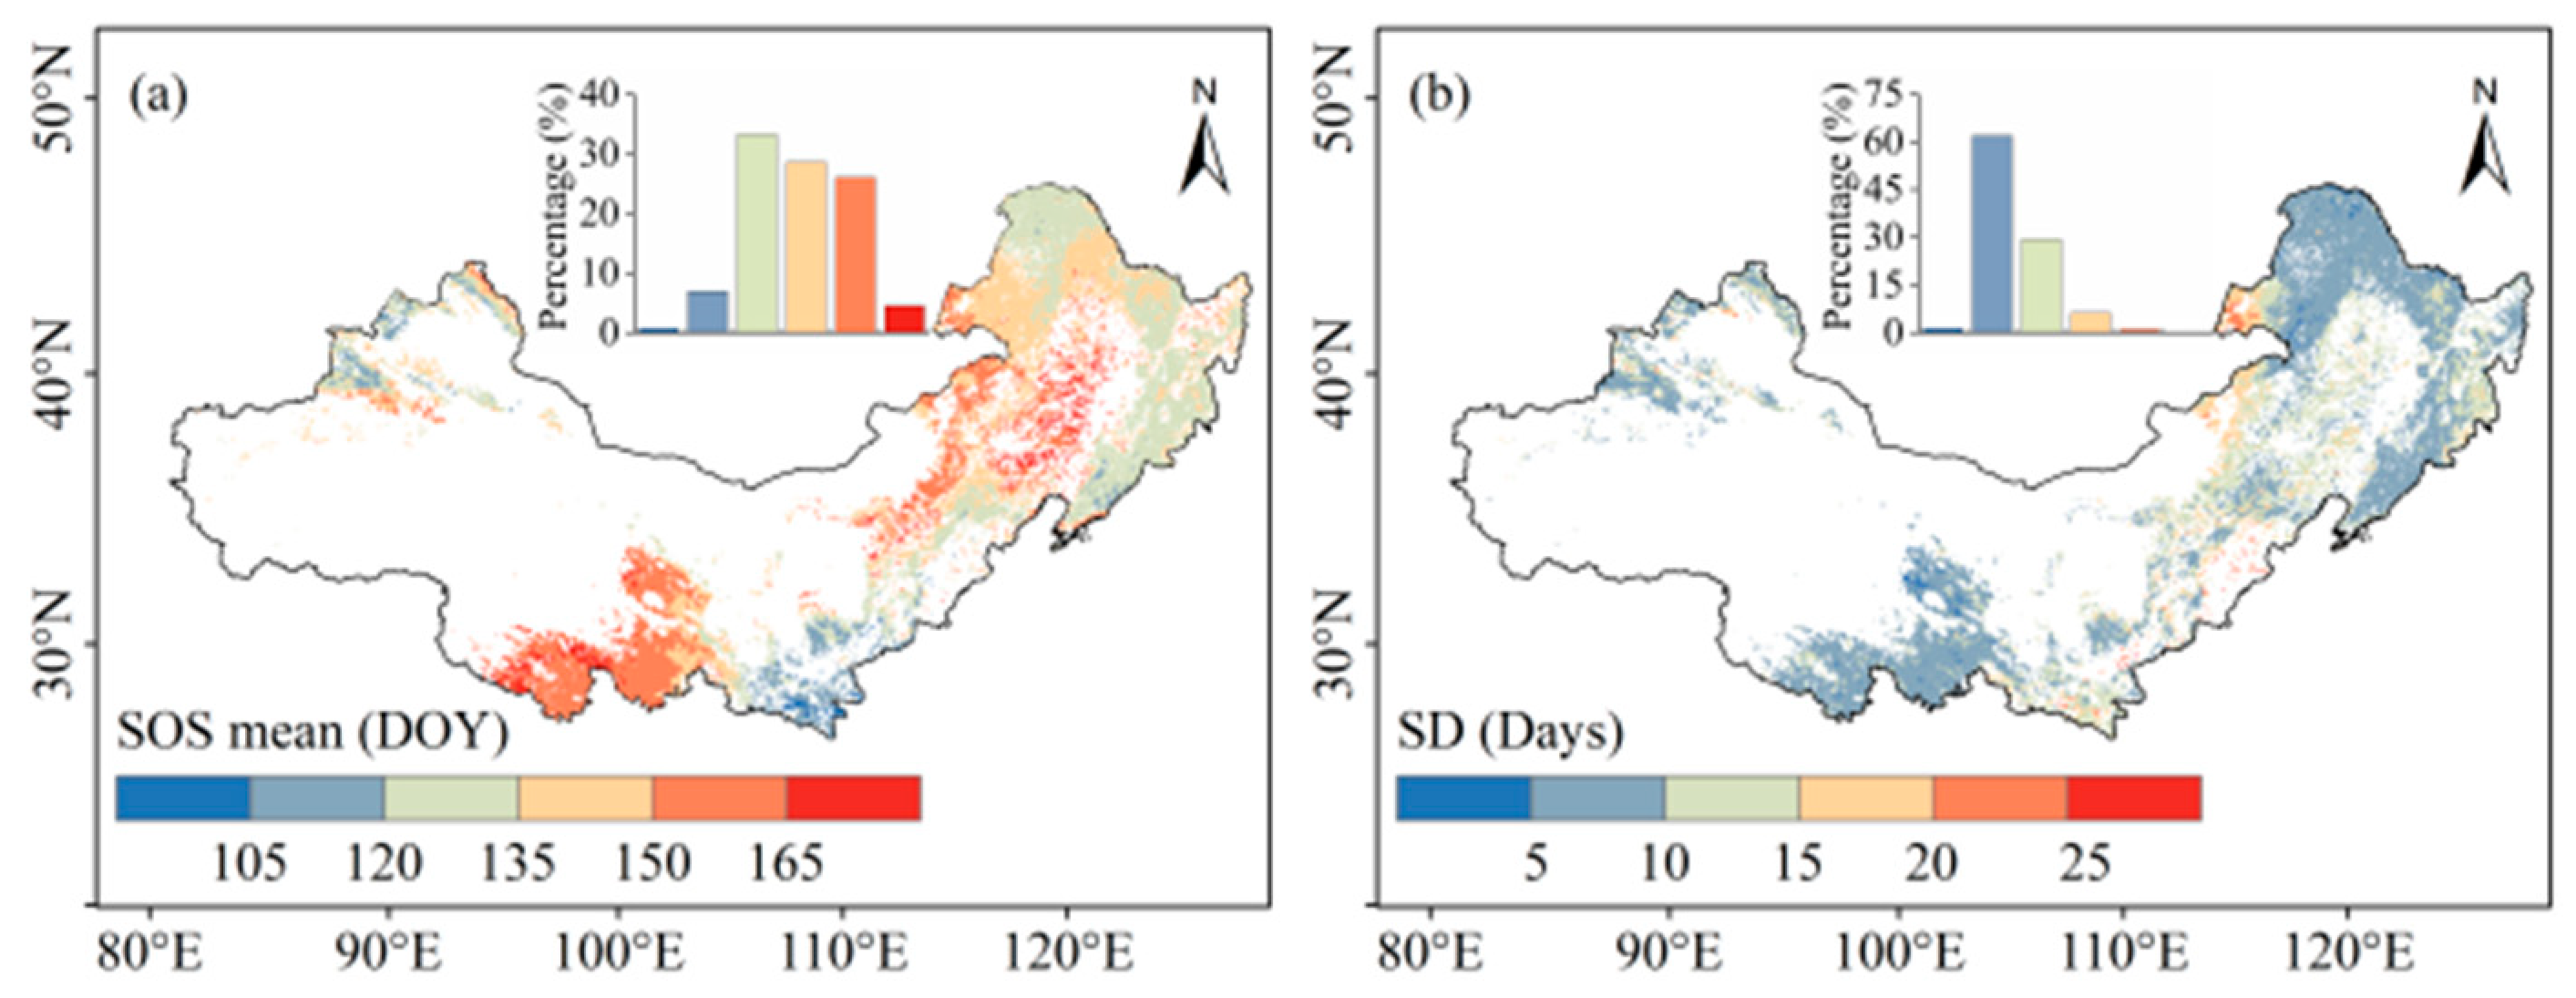
3.1. Spatial Patterns of SOS in Northern China

The annual average SOS largely ranged from 120 to 165 DOY, with a mean of 140 DOY in northern China from 1982 to 2014 (Figure 2a). An earlier SOS (<120 DOY) was mainly distributed in Shaanxi and Shanxi, accounting for 7.6% of the study area. On the contrary, pixels with a delayed SOS (>165 DOY) occupied only 4.5%, and were located in both Qinghai and eastern parts of Inner Mongolia. There was a certain spatial heterogeneity in the standard deviation (SD) of the SOS in northern China (Figure 2b). Although more than 63% of the pixels had an SD of SOS less than 10 days, 7.4% of the pixels had a higher SD values (>15 days) and were located in northeastern parts of Inner Mongolia.
The annual average SOS was different for each vegetation type (Table 1). An earlier SOS (<140 DOY) was shown in DNF, DBF, and SG, while a delayed SOS (>150 DOY) occurred in AM. SOS had a lower SD (<9 days) in DNF and AM, but a higher SD (>11 days) was shown in SG and PG.

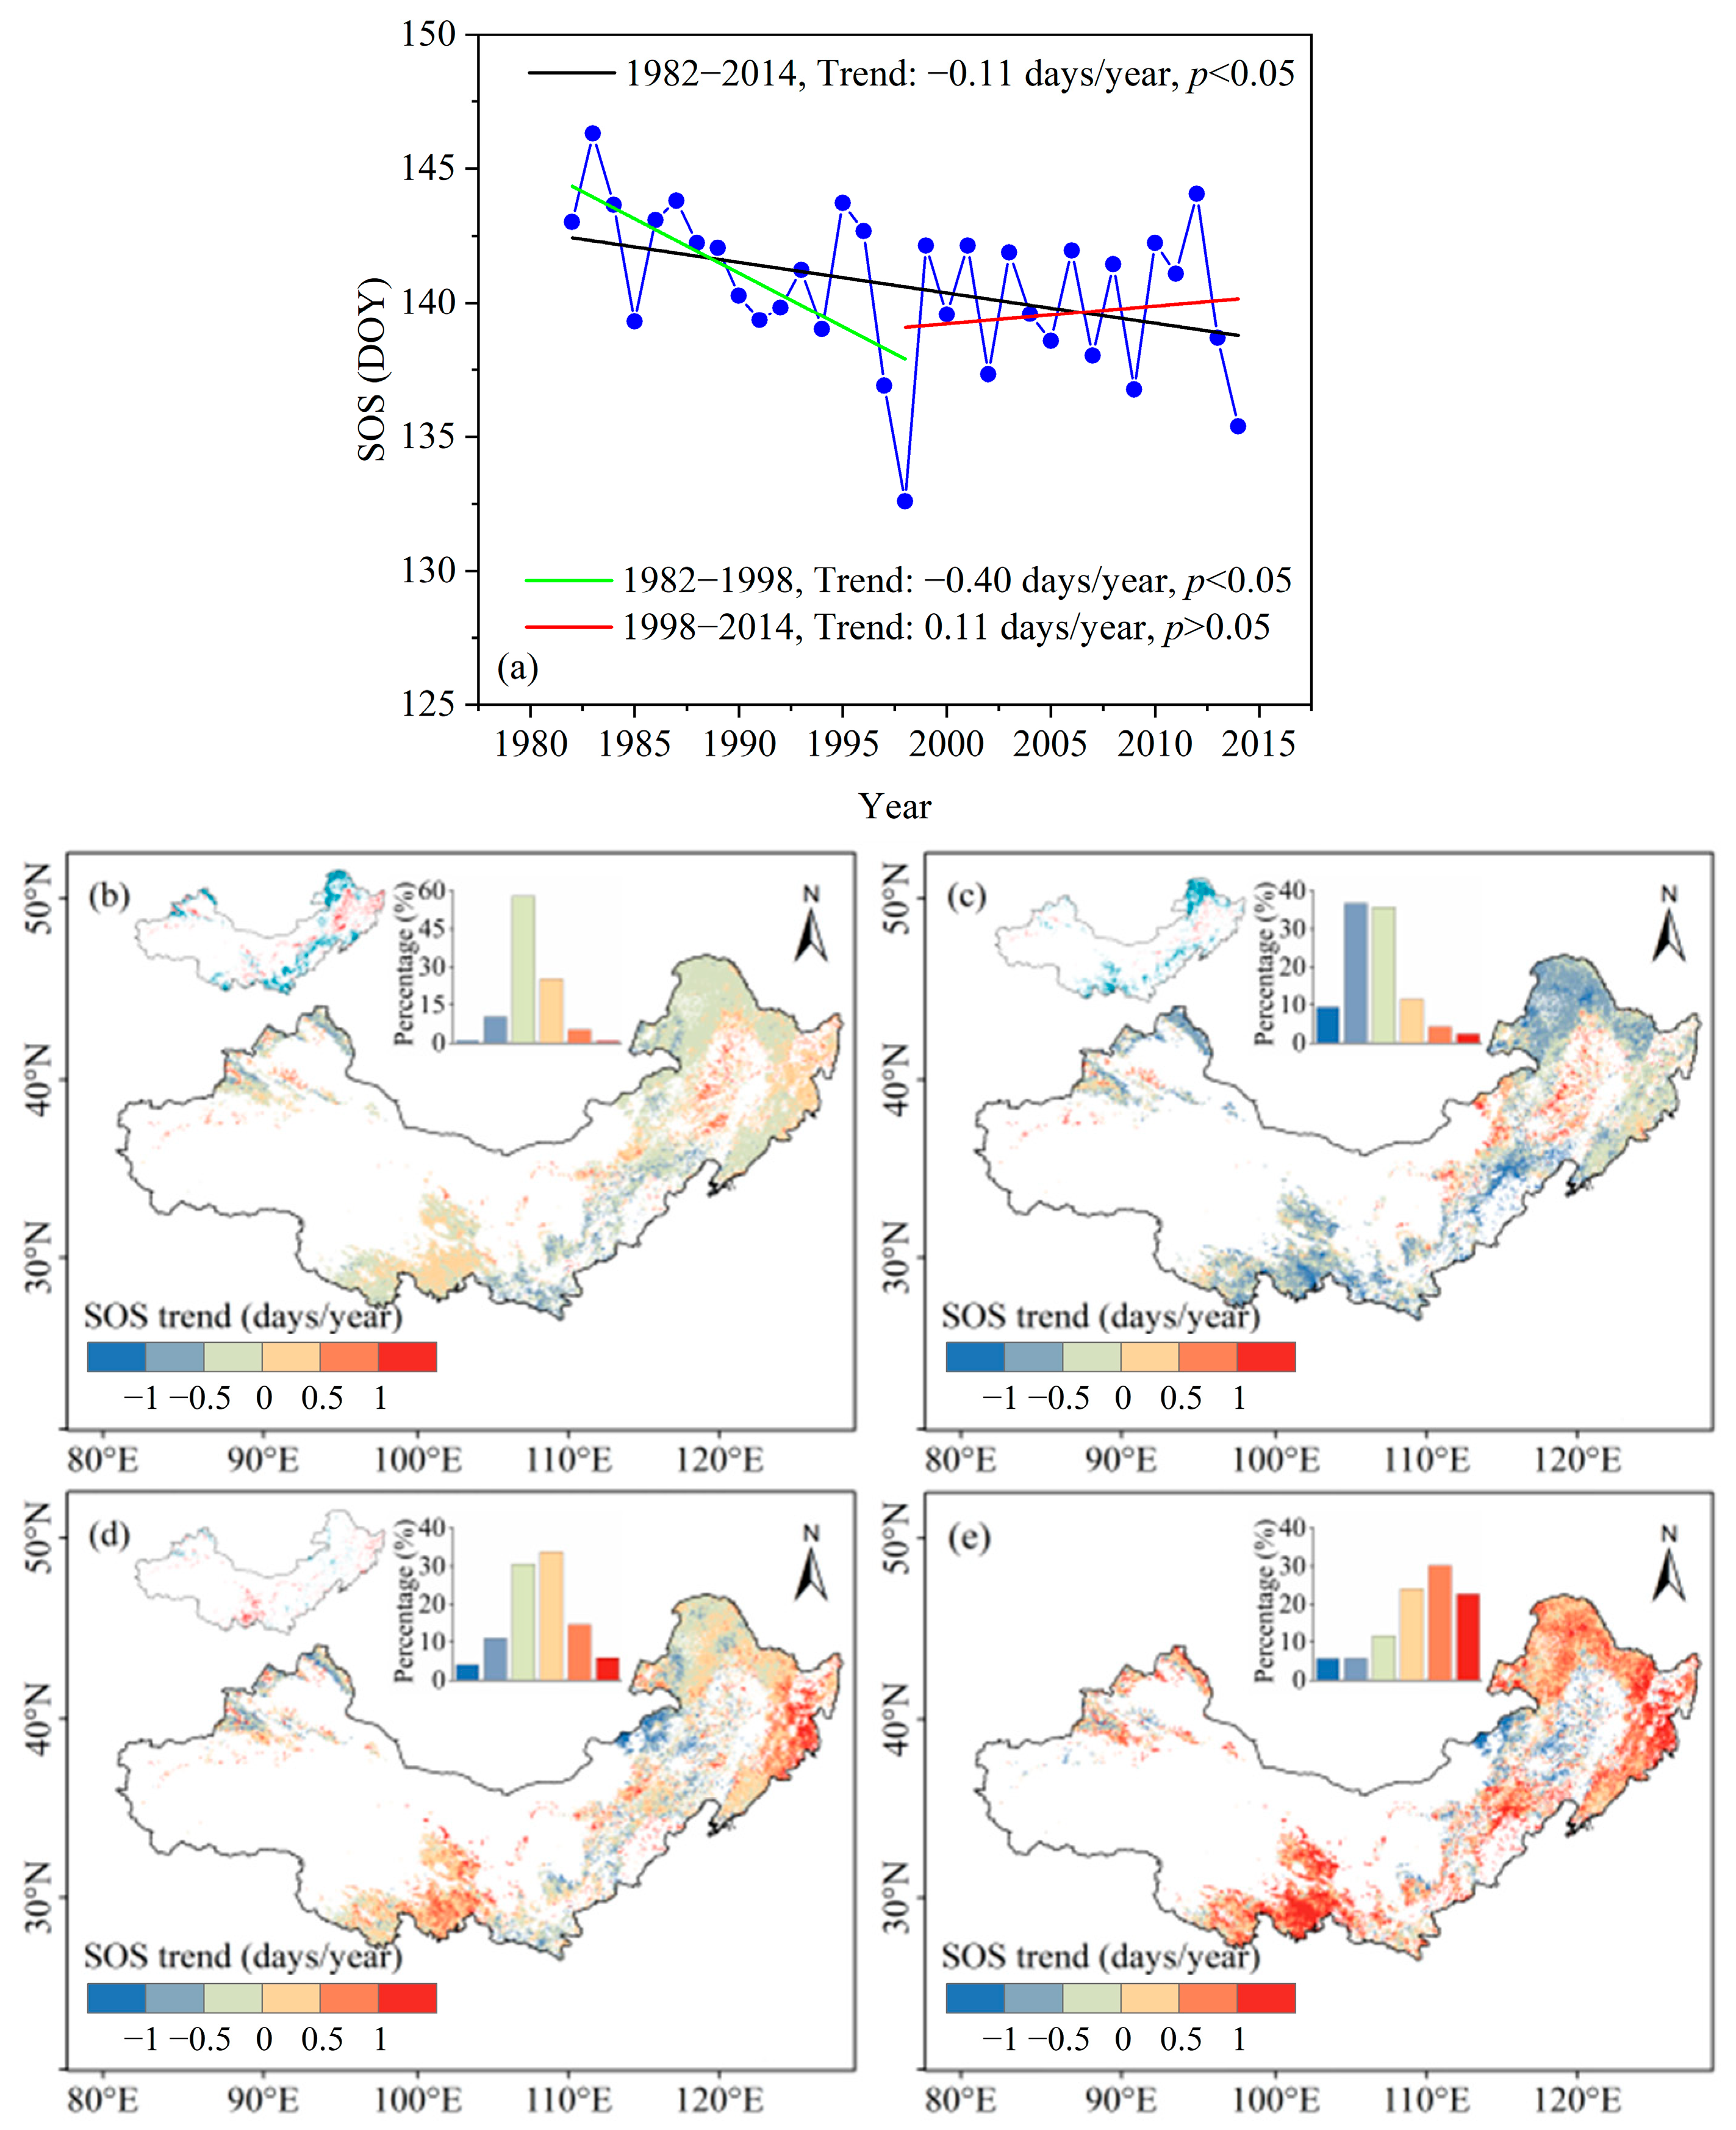
3.2. Trends of SOS in Northern China

The annual average SOS significantly advanced with a speed of −0.11 days/year in northern China from 1982 to 2014 (Figure 3a). However, it showed a delaying trend from 1998 to 2014. As shown in Figure 3b, the SOS trend ranged from −1.89 to 2.15 days/year at the pixel scale. Nearly 68.90% of the pixels exhibited an advancing trend, of which 41.8% were significant (p < 0.05). These regions were mainly distributed in Shaanxi, Shanxi, and northeastern parts of Inner Mongolia. From 1982 to 1998, advancing SOS trends accounted for approximately 81.82% of the pixels (Figure 3c). However, the proportion of pixels with an advancing trend decreased to 45.69% from 1998 to 2014 (Figure 3d). At the same time, differences in SOS trends between the two sub-periods were calculated for each pixel (Figure 3e). The result showed a larger positive difference in the SOS trend (>1.0 days/year) located in Jilin and eastern parts of Heilongjiang, accounting for 22.63% of the pixels. On the contrary, pixels with the larger negative difference in the SOS trend (<−1.0 days/year) were distributed in eastern parts of Inner Mongolia, accounting for 5.69% of the pixels.
As shown in Table 2, almost all vegetation types showed an advancing trend from 1982 to 2014, except for MEA. Among them, DNF, bush, and SG significantly advanced at the speeds of −0.20 days/year, −0.16 days/year, and −0.30 days/year, respectively. Similar to 1982–2014, all vegetation types showed an advancing trend during 1982–1998. However, SOS trends of DBF, AM, and MEA shifted from advancing to delaying after 1998.

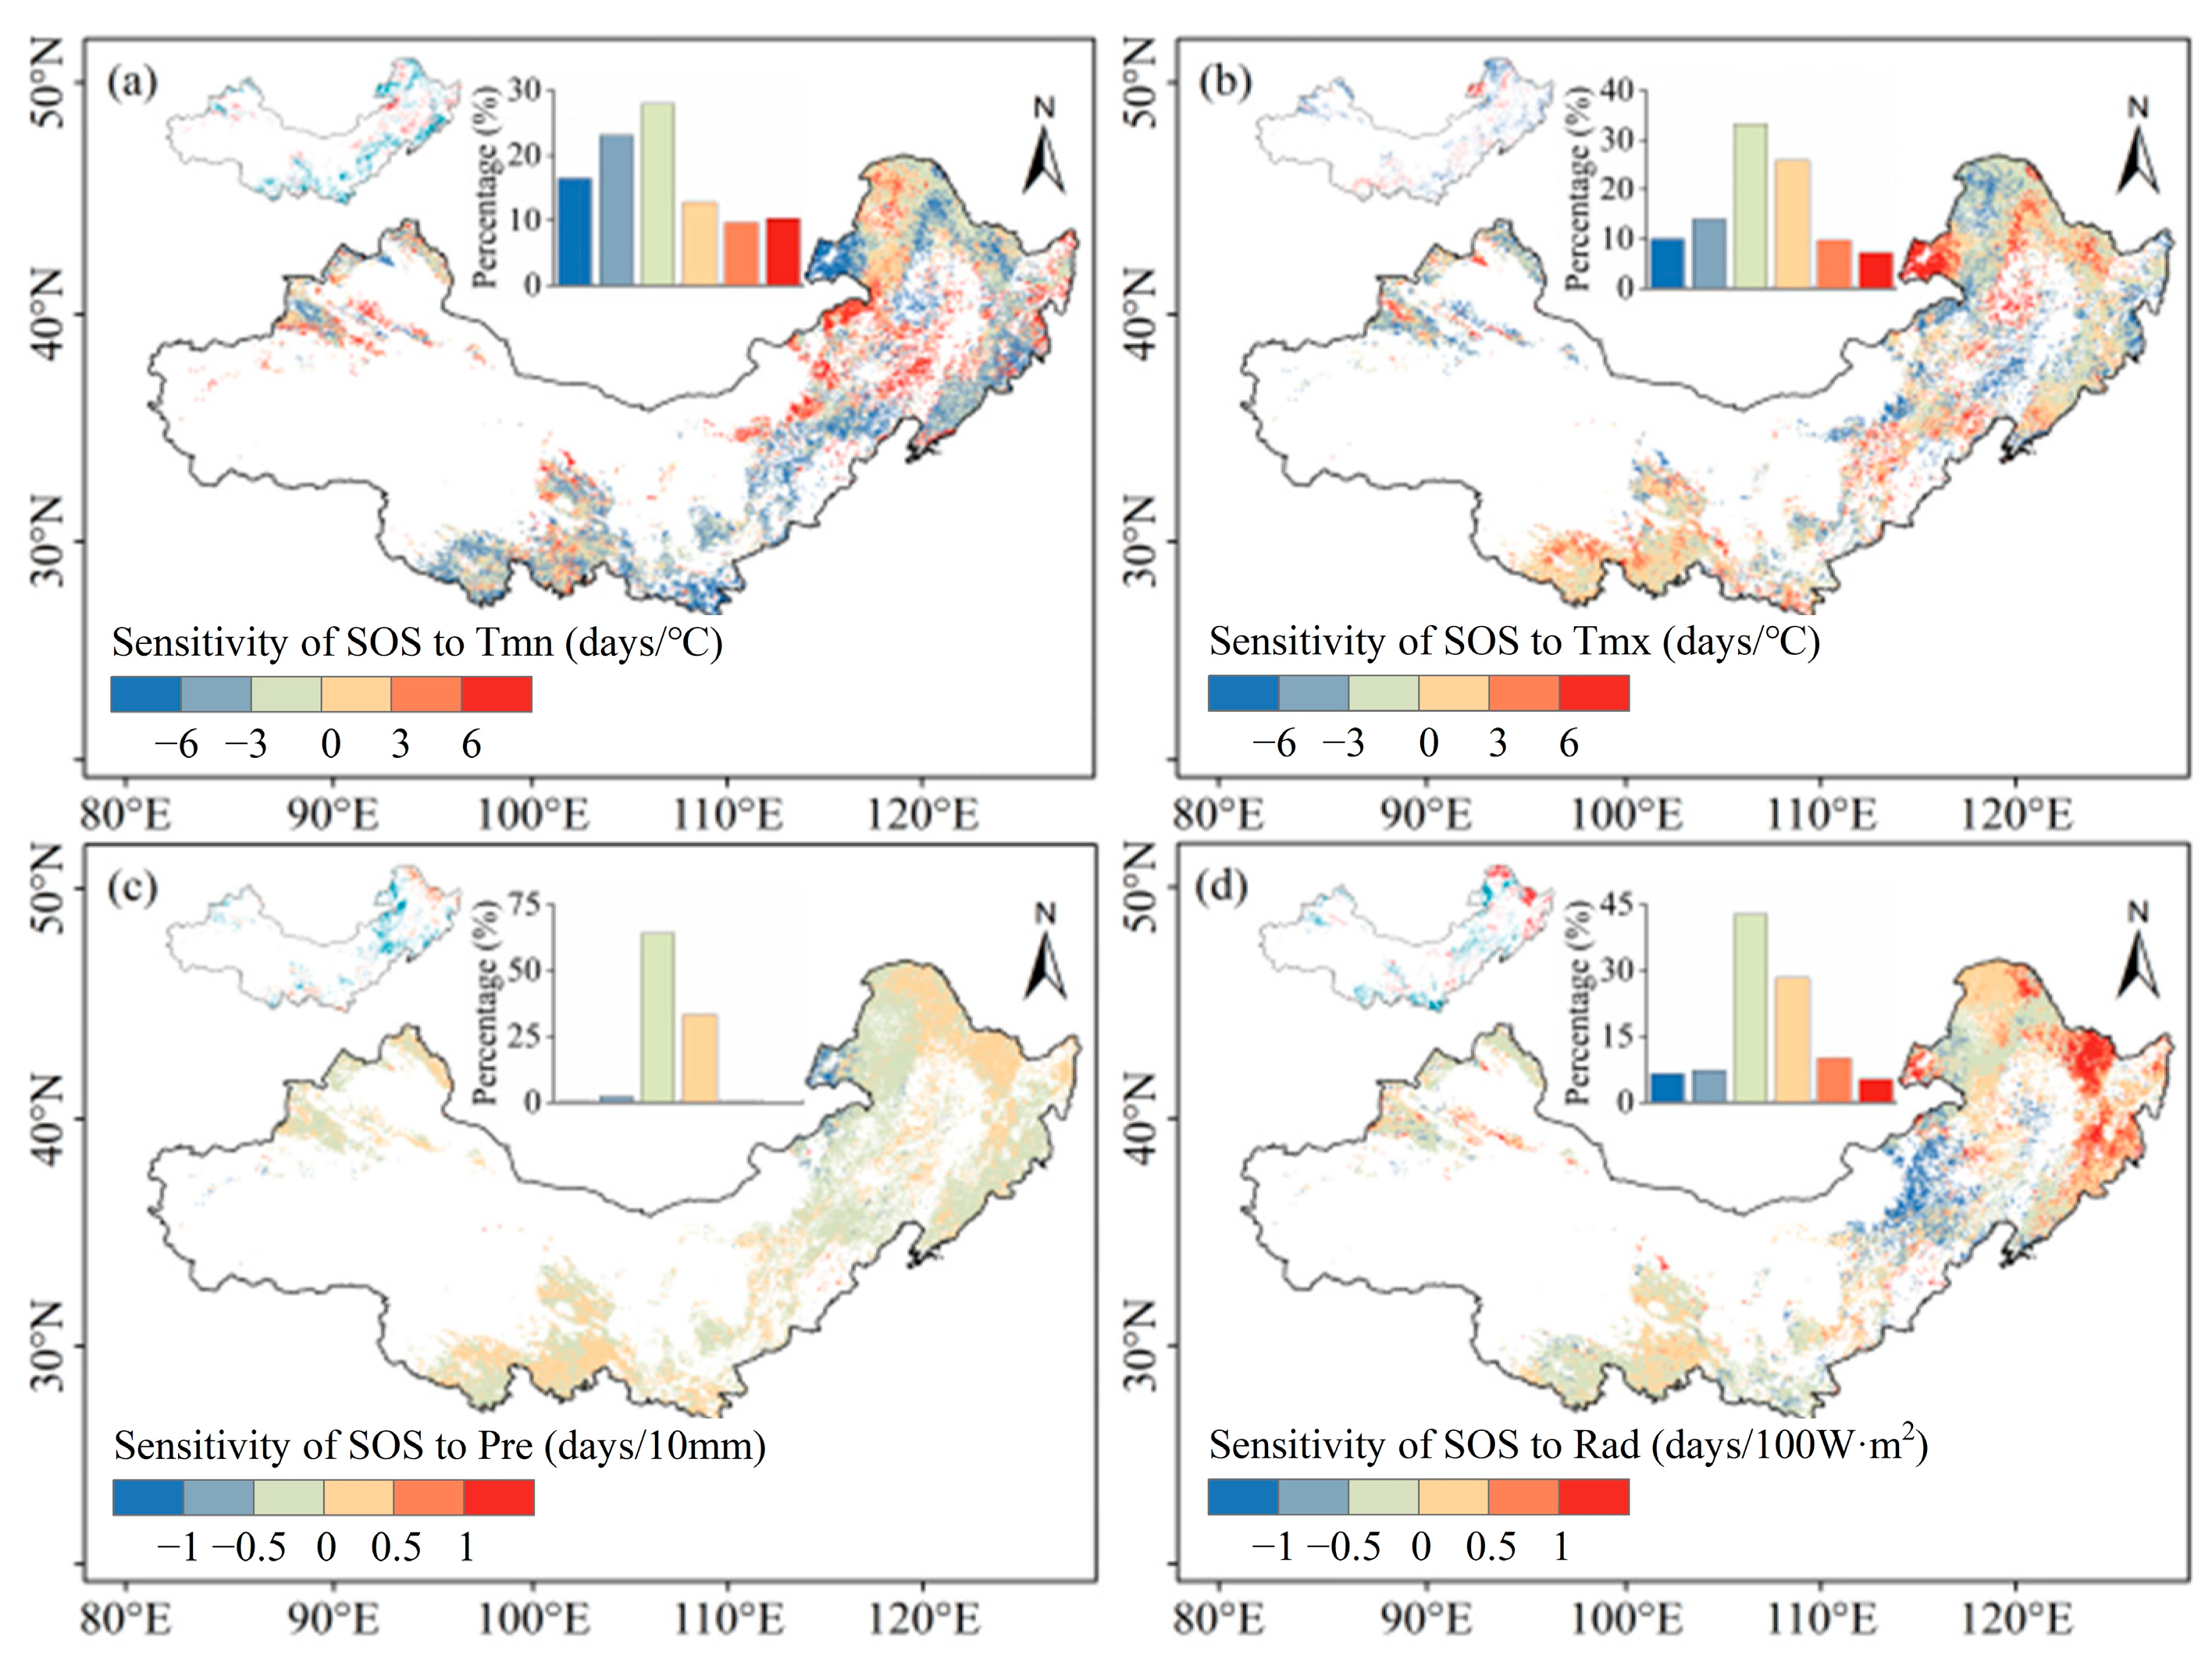
3.3. Sensitivity of SOS to Climatic Factors

The preseason length of each climatic factor generally ranged between 0 and 3 months (Figure 4). The sensitivity of SOS to each preseason climatic factor showed a distinct heterogeneity (Figure 5).
From 1982 to 2014, the negative sensitivity of preseason Tmn was dominant in 67.33% of the pixels, of which 21.19% showed significantly negative sensitivities, mainly distributed in southern parts of Northwest China, northeastern Inner Mongolia, northern Heilongjiang, southern Northeast China, and northern Xinjiang (Figure 5a). Similar to Tmn, the average sensitivity of SOS to Tmx throughout the region was −1.45 days/°C, and 57.24% of the pixels showed a negative sensitivity (Figure 5b), which were mostly located in northeastern Inner Mongolia, northern Heilongjiang, and parts of Xinjiang. These results suggested that an increase in the preseason temperature (including Tmn and Tmx) was conducive to an advanced SOS in most parts of northern China. Additionally, SOS was also found to be negatively sensitive to Pre and Rad in 66.48% and 56.49% of all pixels, respectively (Figure 5c,d). The negative sensitivities of Pre were mainly concentrated in the Beijing–Tianjin–Hebei region, north-central Inner Mongolia, and southern Northeast China. In comparison, negative sensitivities of Rad were located in southern parts of Northwest China, northeastern Inner Mongolia, and parts of Beijing–Tianjin–Hebei and Xinjiang.
Figure 6 shows the sensitivity of SOS to various climatic factors for different vegetation types. The sensitivity of Tmn to all vegetation types was negative (Figure 6a). Tmn had the greatest impact on SG, followed by DBF. Similarly, Tmx also showed a negative sensitivity to all vegetation types (Figure 6b), which had the greatest effect on DNF and PG. Moreover, the significant negative sensitivity of Pre and Rad was mainly detected for most vegetation types, except for DNF (Figure 6c,d).
The sensitivity of SOS to each climatic factor was also characterized within the two sub-periods (Figure S1). The negative sensitivity of Tmn rose from 63.43% during 1982–1998 to 66.40% during 1998–2014. Similarly, areas with negative sensitivity of Pre and Rad were expanded by 4.67% and 2.88%, respectively. However, the percentage of pixels with a negative sensitivity of Tmx declined from 65.79% to 51.35%, which was mainly concentrated in northeastern Inner Mongolia and northern Heilongjiang. As seen in Figure S2, the percentage of negative sensitivity for Tmn, Pre, and Rad showed a slight rise in most vegetation types, which was similar to the results at the pixel scale. As for Tmx, the percentage of negative sensitivity decreased for almost all vegetation types, except for bush (Figure S2).

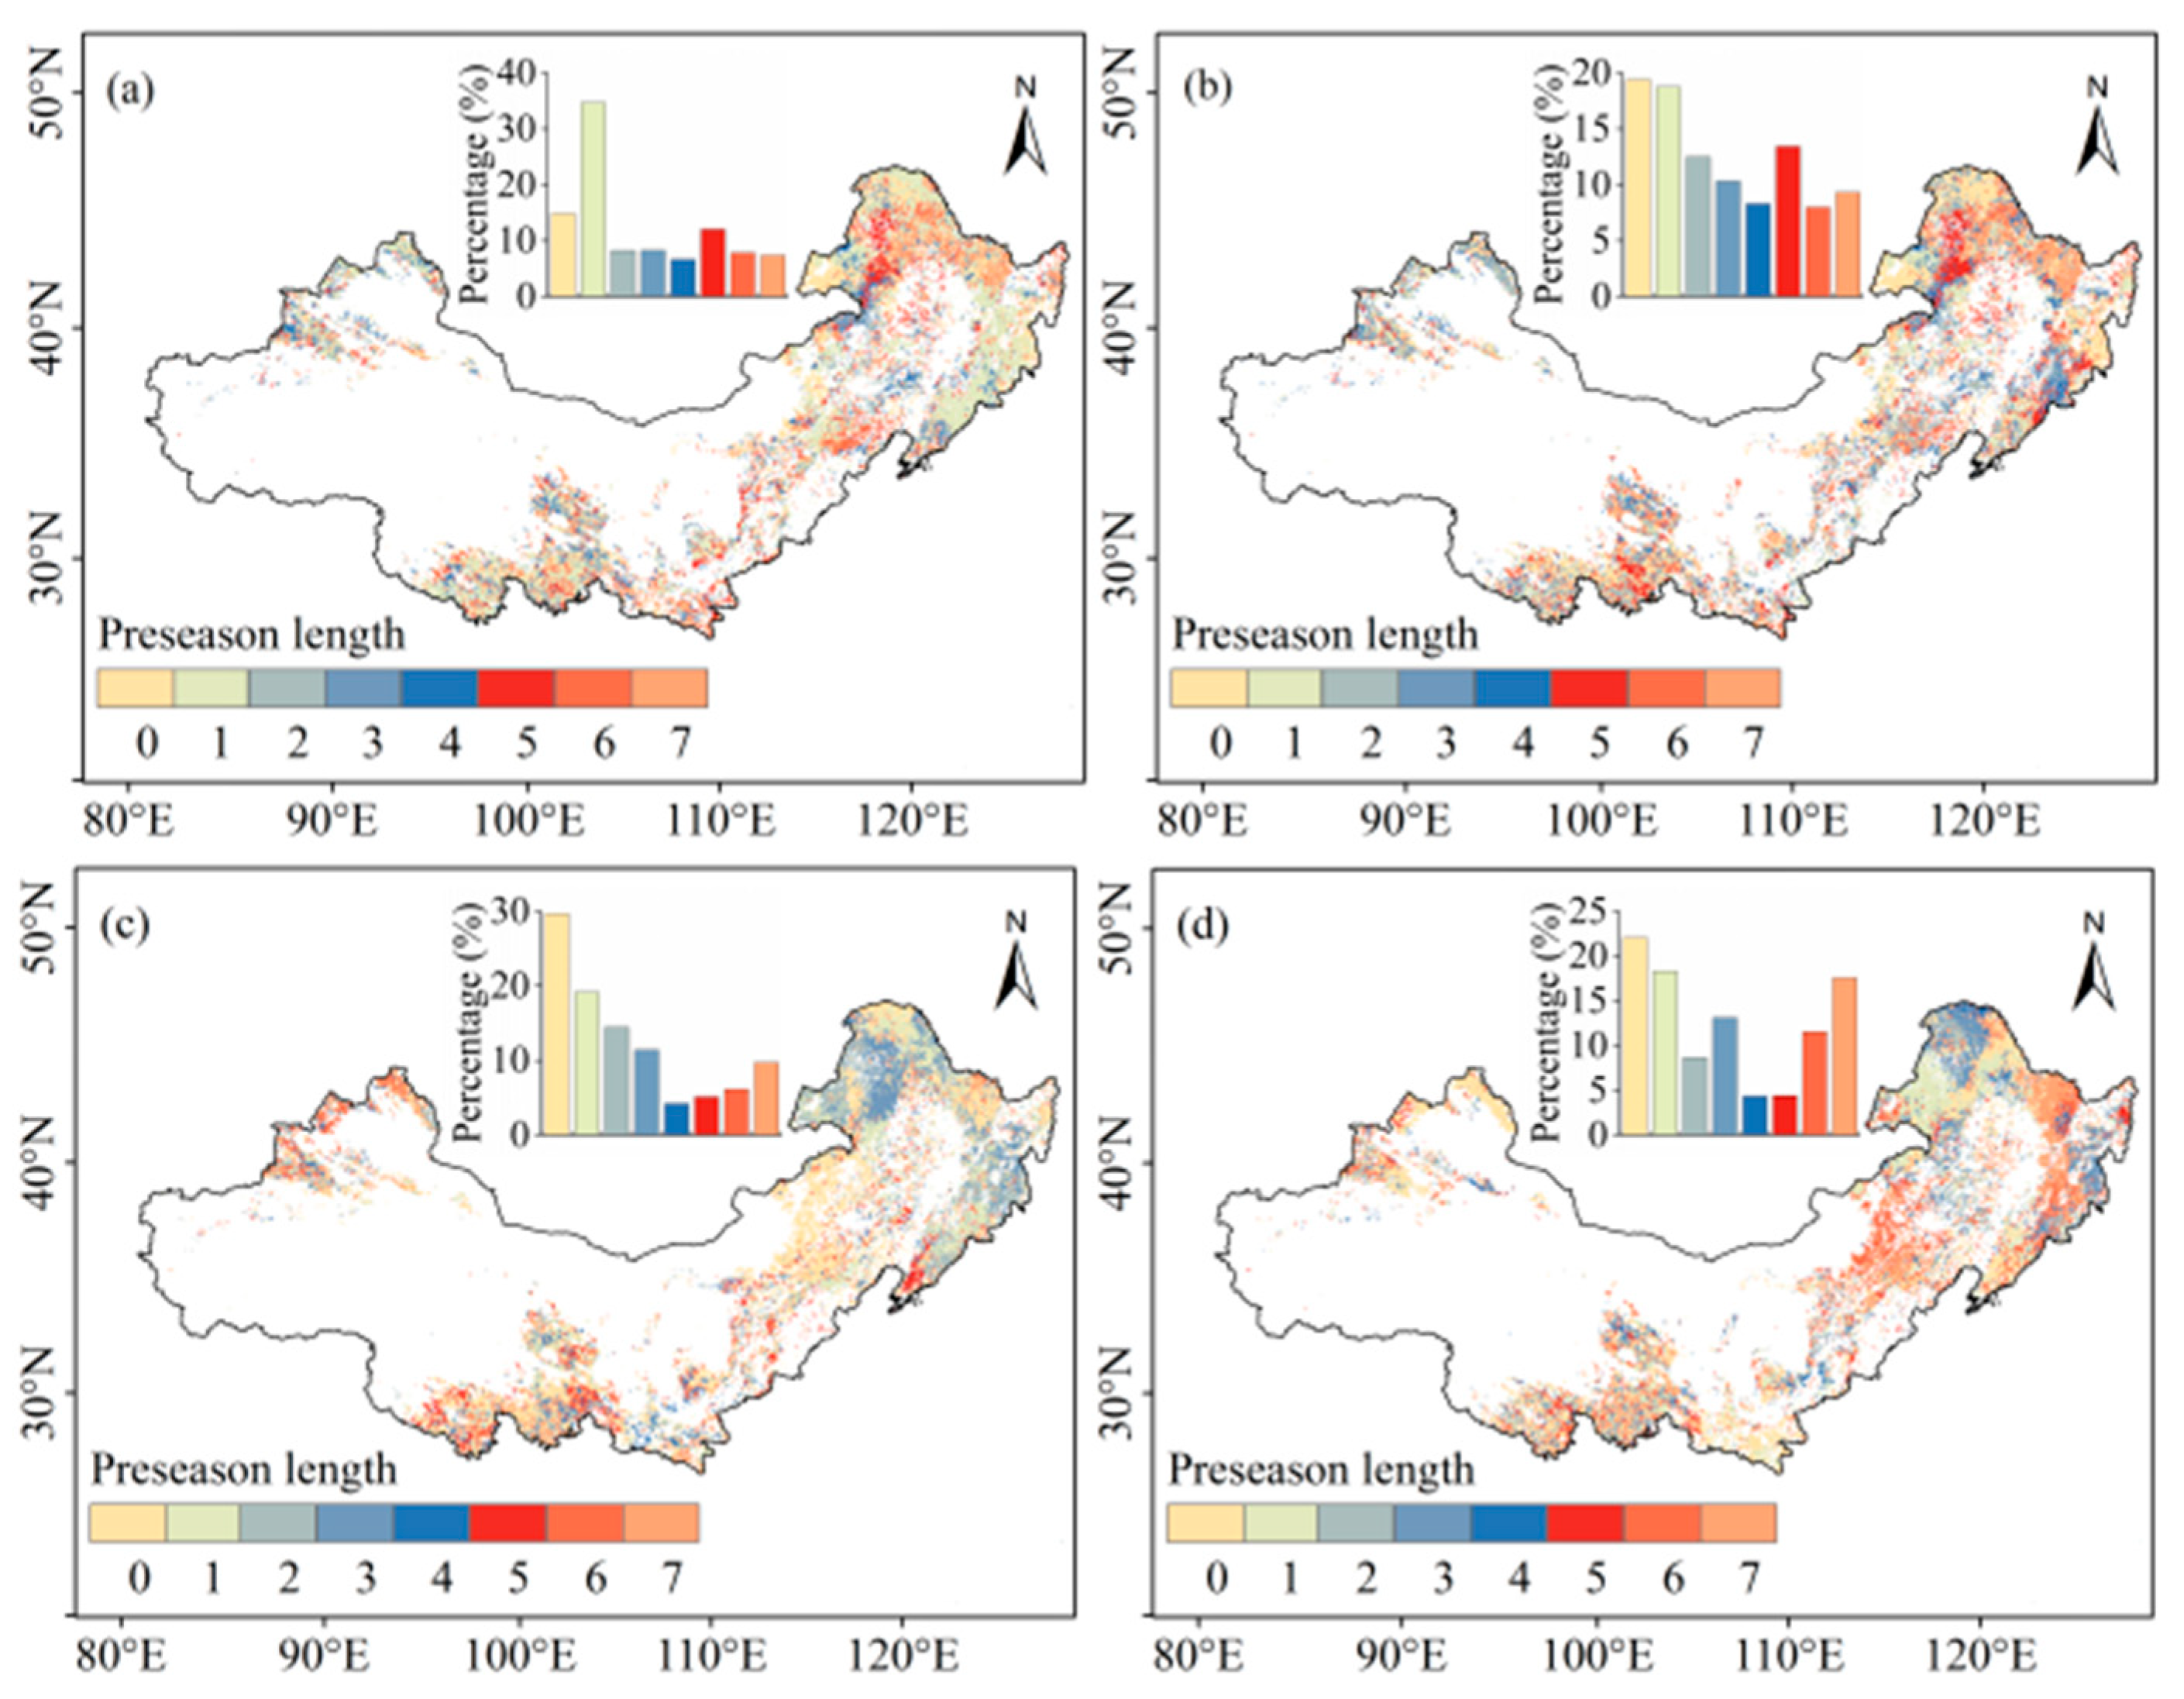
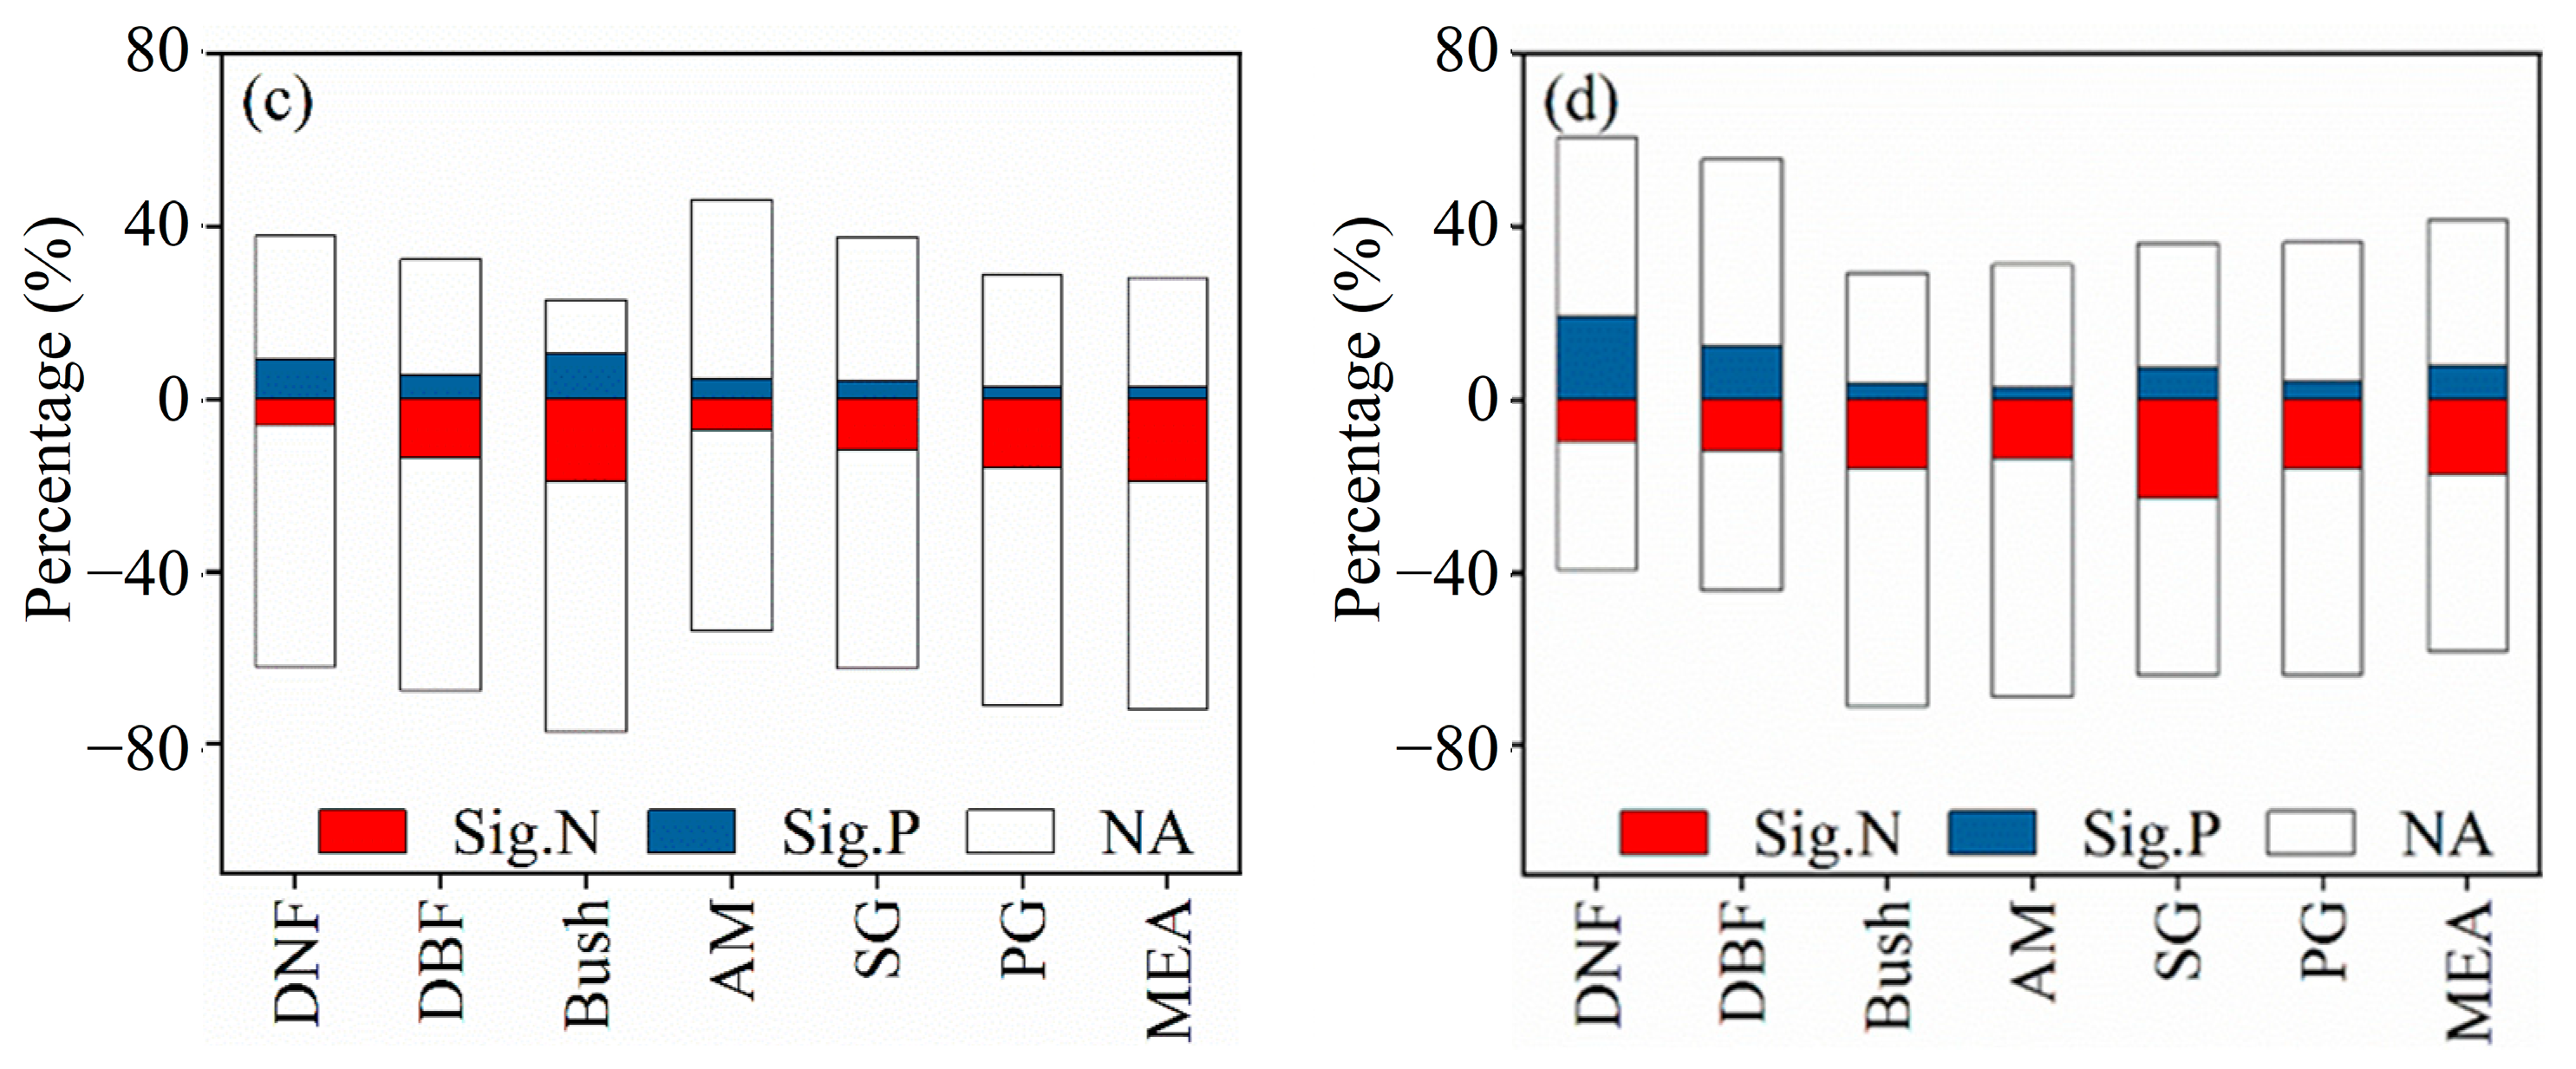
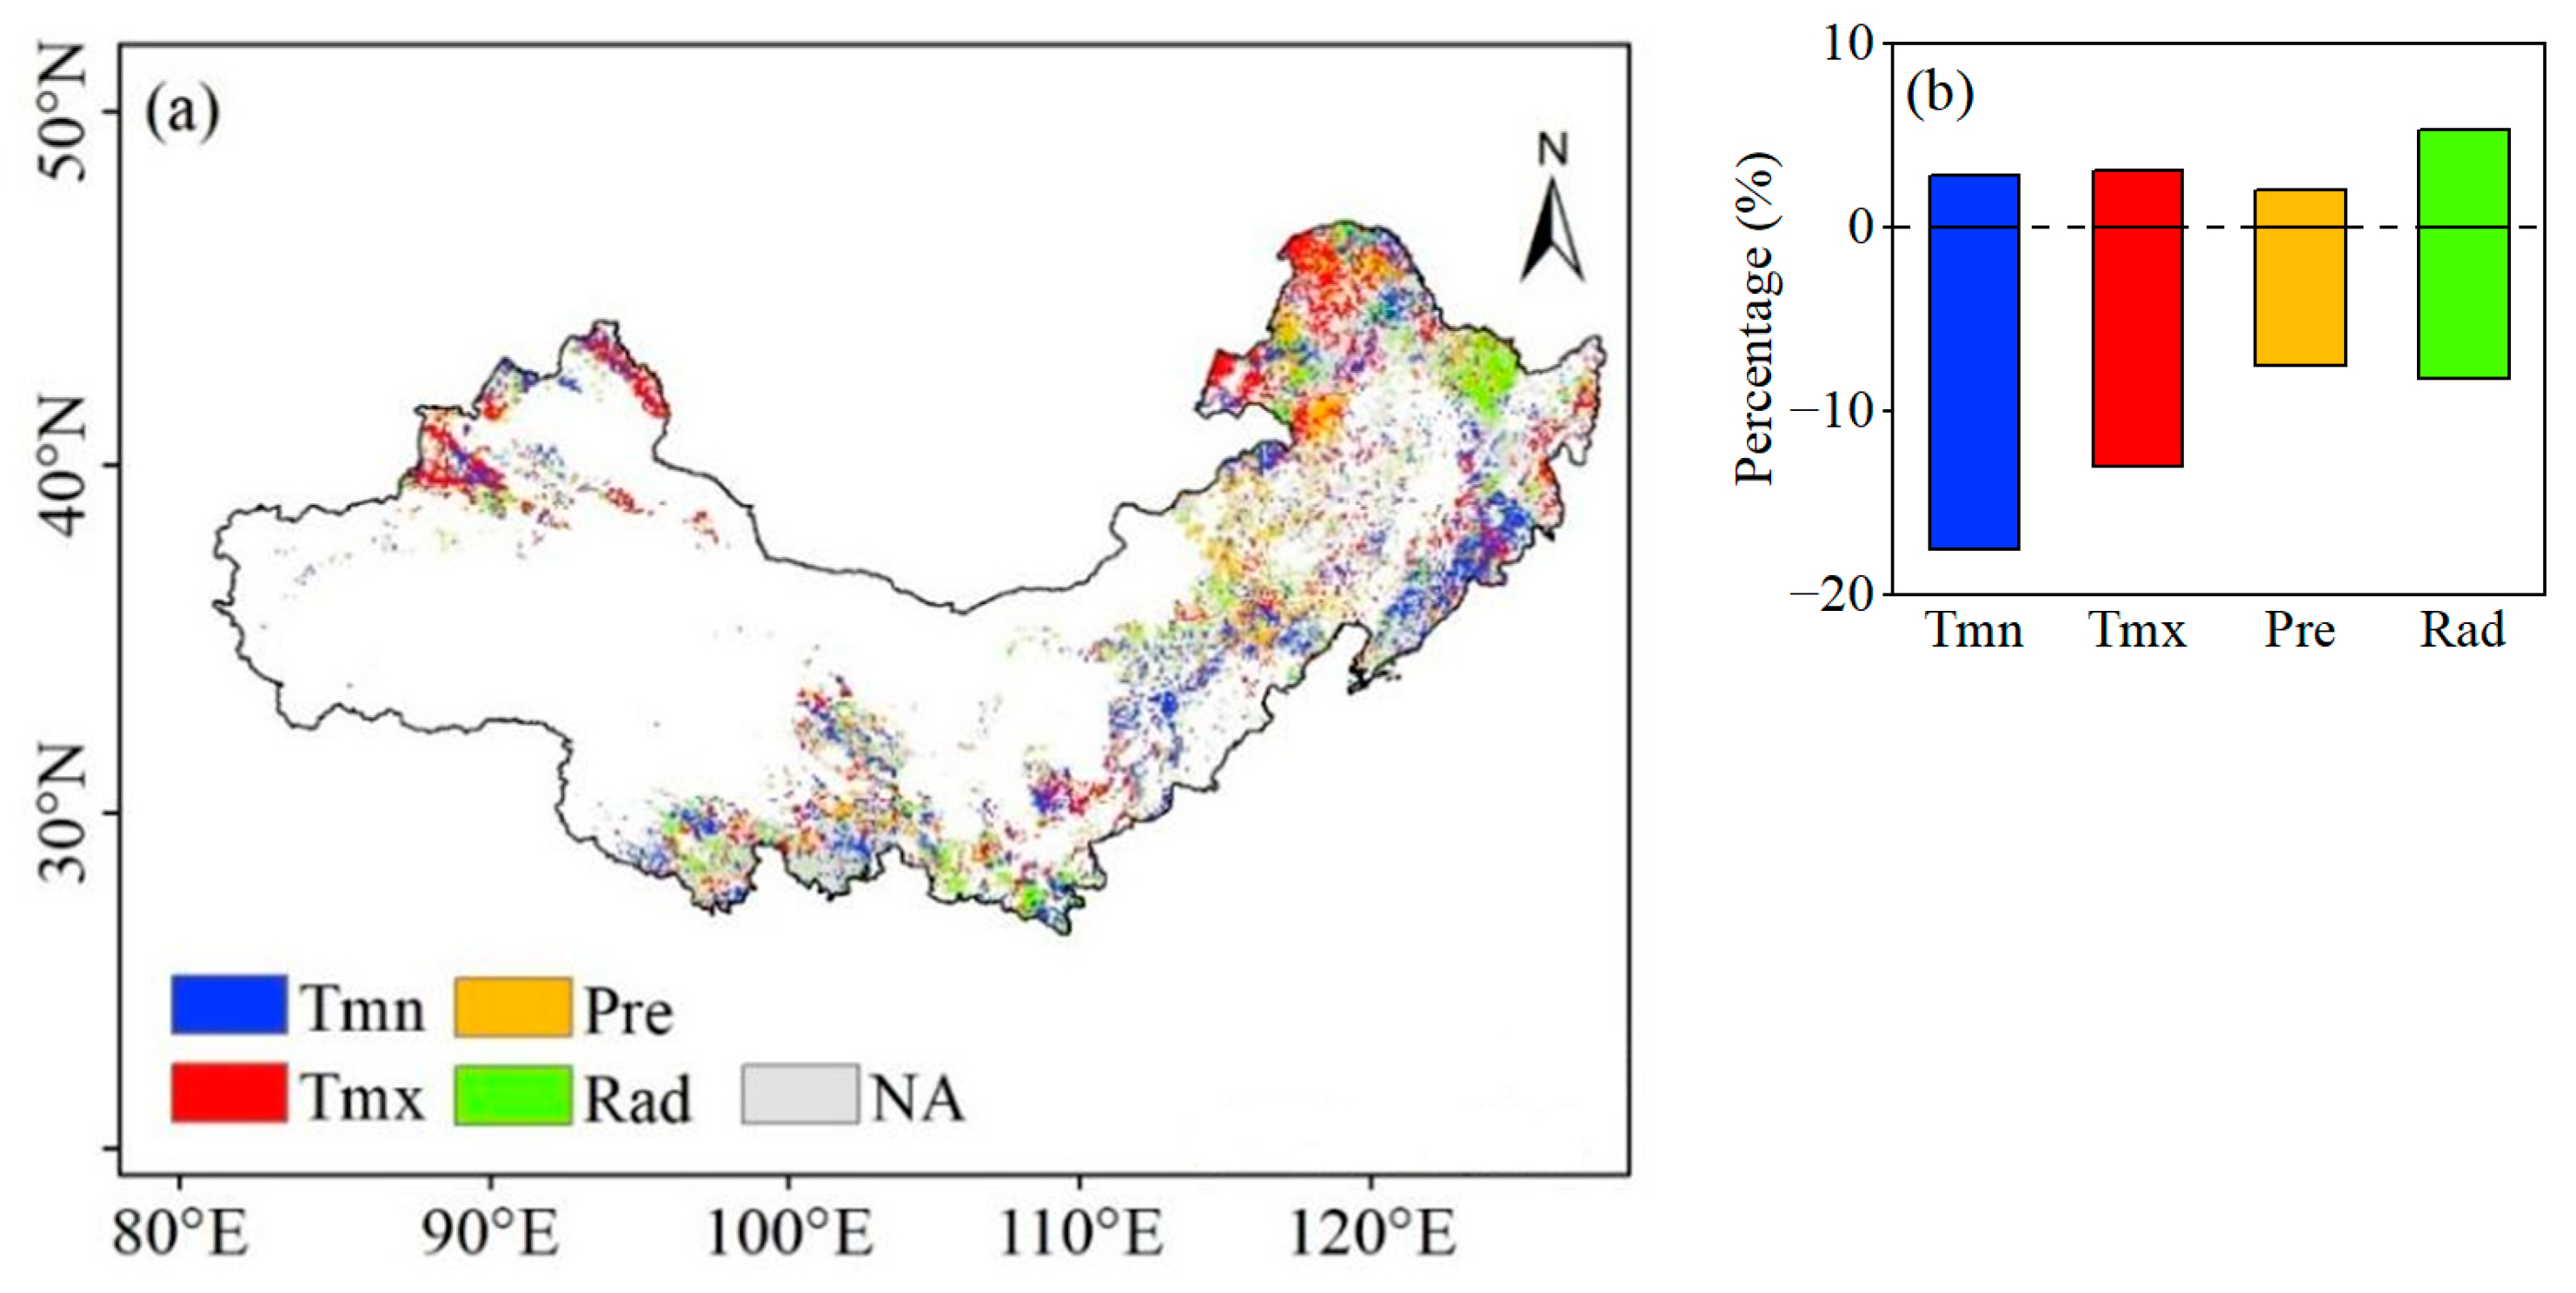
3.4. Identification of the Key Climatic Factor Driving SOS in Northern China

The most important factor affecting SOS was further investigated based on the largest standardized regression coefficient and significance level. As shown in Figure 7, the most important factors affecting SOS exhibited high spatial heterogeneity. Of the four climatic factors, Tmn was the most important factor at 20.37% of all pixels, followed by Tmx (16.12%) and Rad (13.60%). Although Tmn was considered the key factor in most parts of northern China, SOS was mainly influenced by Tmx in northern parts of northern China, including Xinjiang, northern Heilongjiang, and northeastern Inner Mongolia. In contrast, the spatial pattern of pixels affected by Pre and Rad was more fragmented. For example, Pre was dominant in eastern and northern parts of Inner Mongolia, accounting for 9.58%. Although the spatial distribution of dominant climatic factors was complex, the negative impact on SOS was mainly found in northern China. Table 3 shows that Tmn was dominant in SOS variation for most vegetation types, except for DNF and PG. In comparison, Tmx showed a dominant impact on DNF and PG.
As for the two sub-periods, Tmn was the most important factor in 12.22% of all pixels during 1982–1998, followed by Tmx, accounting for 11.43% of all pixels (Figure S3). From 1998 to 2014, however, the percentage of pixels dominated by Tmn and Tmx decreased by 4.92% and 3.58%, respectively. Similar characteristics were also shown in different vegetation types (Tables S1 and S2). For example, the dominant impact of Tmn declined in most vegetation types except for DNF, and that of Tmx also decreased in most vegetation types except for AM.

4. Discussion

4.1. Spatial and Temporal Differences of SOS in Northern China

The spatial pattern of average SOS showed significant heterogeneity in northern China. It was found that pixels with a delayed SOS were mainly distributed in high-altitude and arid regions. On the one hand, lower spring temperatures were found at higher altitudes [46]. On the other hand, germination and leaf growth were usually slow due to water limitation in arid and semi-arid regions, resulting in a delayed SOS. On the contrary, pixels with an earlier SOS were clustered at lower latitudes, such as Shaanxi and Shanxi, which were associated with warm-climate conditions and warm temperate species [47].
This study found a significant advancing trend for SOS in northern China, which was consistent with previous studies across different regions of the Northern Hemisphere. The advancing magnitude of SOS in this region (−0.11 days/year) was less than that in Xinjiang, temperate China, and middle and eastern Eurasia, but it was larger than that in the Mongolian Plateau (Table 4). The inconsistent results could be related to different regions and calculation periods. Furthermore, it was also found that a delaying trend of SOS was found after 1998, which may be related to the warming hiatus. The air temperature was the major influencing factor of SOS in northern China. As for two sub-periods (1982–1998 versus 1998–2014), trends of preseason Tmn decreased from 0.09 °C/year to −0.04 °C/year, and trends of preseason Tmx also decreased from 0.11 °C/year to −0.05 °C/year (Table S3), suggesting that an advancing rate of SOS appeared to be reversed during the warming hiatus period. However, delaying magnitudes of SOS were heterogeneous at a spatial scale during this period [48]. Future research should be conducted to analyze the spatiotemporal change of SOS during this period based on more datasets.

4.2. Response of SOS to Climatic Factors

Temperature is regarded as the major influencing factor of SOS, which has been reported in previous studies [56,57]. Unlike previous studies, the effects of Tmx and Tmn on SOS in northern China were further compared in this study, and the impact of Tmn was stronger than that of Tmx [58,59]. The area dominated by Tmn was distributed in most parts of northern China, especially in southern Northeast China and the Beijing–Tianjin–Hebei region. The warming Tmn made it easier for vegetation to accumulate heat requirements and to promote active growth resumption [29,31]. It could also reduce the risk of freezing damage in spring and change the frequency and intensity of soil thawing, thereby advancing the SOS [24]. Furthermore, Tmn was warming at a faster rate than Tmx under the background of climate change [27].
In addition, some studies showed that Tmx was the most important factor affecting SOS by regulating carbon-fixation and energy capture in the daytime [27,28]. However, our study found that the effect of Tmx was weaker than that of Tmn. There are two possible reasons for this phenomenon. First, meristem temperature instead of air temperature may be critical for SOS. During the daytime, the meristem temperature is susceptible to other factors, such as Rad [1,27]. Therefore, the difference between meristem temperature and air temperature tends to be much larger during the daytime than at nighttime. In other words, the effect of Tmx on SOS has a larger uncertainty than Tmn. Second, warming Tmx can exacerbate the drought impact in dry regions by enhancing evaporation, thereby weakening the advancing trend of SOS.
Pre is the most important factor affecting SOS in arid and semi-arid regions because water availability around roots often significantly limits the growth of vegetation [41,60]. Rad is also an important climatic factor affecting SOS, and shows a complex relationship with SOS. A higher Rad is usually accompanied by higher temperature, but more Pre may lead to lower Rad [23,57].

4.3. Limitations

The response of SOS to climatic factors was investigated in this study. However, it should be noted that the results have some limitations, which are reflected in four main aspects. First, 59.68% of all pixels were dominated by climatic factors from 1982 to 2014, with a significant decrease from 1998 to 2014 (Figure 7 and Figure S3), indicating that non-climatic factors in northern China could also control SOS. Rising atmospheric CO2 and nitrogen deposition had an impact on the change of SOS in the Northern Hemisphere [45]. Therefore, research on the impact of non-climatic factors should be undertaken in the next stage. Second, detailed climatic datasets at the site scale in northern China was obtained, which must be resampled to match the NDVI data at the regional scale. Although the Kriging method is a frequently used spatial interpolation method, it may introduce uncertainty in the resampling process and influence the final results. Third, the short time period for calculating trends is a limitation in our study because the current NDVI dataset has not been updated to 2020. Last, we also realized that there may be uncertainty in using statistical methods to identify key factors of SOS because it cannot be fully weighted for the importance of different factors, especially in the case that some indicators have similar importance. Given the above limitations, it is necessary to collect more refined spatial and observational datasets to explore the impact of climatic and non-climatic factors on SOS in northern China based on machine learning methods.

5. Conclusions

The average SOS largely ranged from 120 to 165 DOY in northern China, and the delayed SOS was mainly distributed in high-altitude and arid regions. Although SOS was dominated by an advancing trend from 1982 to 2014, such a trend shifted from advancing to delaying after 1998. Preseason Tmn dominated the most pixels (20.37%), followed by preseason Tmx (16.12%). However, the influence of climatic factors declined after 1998, especially for Tmx. These results indicated that the climate–SOS relationship should be carefully considered in current prediction models for vegetation growth.

Supplementary Materials

The following supporting information can be downloaded at: https://www.mdpi.com/article/10.3390/atmos14010117/s1, Figure S1: The spatial pattern of the sensitivity of SOS to preseason (a,b) Tmn, (c,d) Tmx, (e,f) Pre, and (g,h) Rad in two sub-periods; Figure S2: The sensitivity of SOS to preseason (a) Tmn, (b) Tmx, (c) Pre, and (d) Rad at the vegetation-type scale in two sub-periods; Figure S3: The spatial pattern of the most critical climatic factor in SOS in two sub-periods; Table S1: The proportion of the most critical climatic factor in SOS at the vegetation-type scale before 1998; Table S2: The proportion of the most critical climatic factor in SOS at the vegetation-type scale after 1998; Table S3: Trends of climatic factors over the study period.

Author Contributions

Conceptualization, Y.W., R.W. and C.L.; methodology, Z.L. and C.L.; software, Z.L.; writing—original draft preparation, Z.L. and C.L.; writing—review and editing, B.L., Z.Q., Y.W. and C.L. All authors have read and agreed to the published version of the manuscript.

Funding

This research was funded by the National Key Research and Development Program of China (2018YFE0109600), the National Natural Science Foundation of China (42275034, 42130610, 41875096, 41875097, 42275029, 41801013, and 41975062), Selective Support for Scientific and Technological Activities of Overseas Scholars of Shanxi province, and Outstanding Young Talents Support Plan of Shanxi province.

Institutional Review Board Statement

Not applicable.

Informed Consent Statement

Not applicable.

Data Availability Statement

The data presented in this study are available on request from the corresponding author.

Conflicts of Interest

The authors declare no conflict of interest.

References

  1. Piao, S.L.; Liu, Q.; Chen, A.P.; Janssens, I.A.; Fu, Y.S.; Dai, J.H.; Liu, L.L.; Lian, X.; Shen, M.G.; Zhu, X.L. Plant phenology and global climate change: Current progresses and challenges. Glob. Chang. Biol. 2019, 25, 1922–1940. [Google Scholar] [CrossRef]
  2. Li, C.; Li, Z.Z.; Zhang, F.M.; Lu, Y.Y.; Duan, C.F.; Xu, Y. Seasonal dynamics of carbon dioxide and water fluxes in a rice-wheat rotation system in the Yangtze-Huaihe region of China. Agric. Water Manag. 2023, 275, 107992. [Google Scholar] [CrossRef]
  3. Piao, S.L.; Wang, X.H.; Park, T.; Chen, C.; Lian, X.; He, Y.; Bjerke, J.W.; Chen, A.P.; Ciais, P.; Tommervik, H.; et al. Characteristics, drivers and feedbacks of global greening. Nat. Rev. Earth Environ. 2020, 1, 14–27. [Google Scholar] [CrossRef] [Green Version]
  4. Wu, L.Z.; Ma, X.F.; Dou, X.; Zhu, J.T.; Zhao, C.Y. Impacts of climate change on vegetation phenology and net primary productivity in arid Central Asia. Sci. Total Environ. 2021, 796, 149055. [Google Scholar] [CrossRef] [PubMed]
  5. Li, C.; Wang, R.H.; Xu, J.X.; Luo, Y.J.; Tan, M.L.; Jiang, Y.L. Analysis of meteorological dryness/wetness features for spring wheat production in the Ili River basin, China. Int. J. Biometeorol. 2018, 62, 2197–2204. [Google Scholar] [CrossRef]
  6. Piao, S.L.; Friedlingstein, P.; Ciais, P.; Viovy, N.; Demarty, J. Growing season extension and its impact on terrestrial carbon cycle in the Northern Hemisphere over the past 2 decades. Global Biogeochem. Cycles 2007, 21, GB3018. [Google Scholar] [CrossRef]
  7. Caparros-Santiago, J.A.; Rodriguez-Galiano, V.; Dash, J. Land surface phenology as indicator of global terrestrial ecosystem dynamics: A systematic review. Isprs J. Photogramm. 2021, 171, 330–347. [Google Scholar] [CrossRef]
  8. Li, Z.; Wang, R.; Liu, B.; Qian, Z.; Wu, Y.; Li, C. Responses of Vegetation Autumn Phenology to Climatic Factors in Northern China. Sustainability 2022, 14, 8590. [Google Scholar] [CrossRef]
  9. Javed, T.; Li, Y.; Feng, K.; Ayantobo, O.O.; Ahmad, S.; Chen, X.G.; Rashid, S.; Suon, S. Monitoring responses of vegetation phenology and productivity to extreme climatic conditions using remote sensing across different sub-regions of China. Environ. Sci. Pollut. R. 2021, 28, 3644–3659. [Google Scholar] [CrossRef]
  10. Leng, S.; Huete, A.; Cleverly, J.; Yu, Q.; Zhang, R.R.; Wang, Q.F. Spatiotemporal Variations of Dryland Vegetation Phenology Revealed by Satellite-Observed Fluorescence and Greenness across the North Australian Tropical Transect. Remote Sens. 2022, 14, 2985. [Google Scholar] [CrossRef]
  11. Hmimina, G.; Dufrêne, E.; Pontailler, J.Y.; Delpierre, N.; Aubinet, M.; Caquet, B.; de Grandcourt, A.; Burban, B.; Flechard, C.; Granier, A.; et al. Evaluation of the potential of MODIS satellite data to predict vegetation phenology in different biomes: An investigation using ground-based NDVI measurements. Remote Sens. Environ. 2013, 132, 145–158. [Google Scholar] [CrossRef]
  12. Dížková, P.; Bartošová, L.; Bláhová, M.; Balek, J.; Hájková, L.; Semerádová, D.; Bohuslav, J.; Pohanková, E.; Žalud, Z.; Trnka, M. Modeling Phenological Phases of Winter Wheat Based on Temperature and the Start of the Growing Season. Atmosphere 2022, 13, 1854. [Google Scholar] [CrossRef]
  13. Vrieling, A.; Skidmore, A.K.; Wang, T.J.; Meroni, M.; Ens, B.J.; Oosterbeek, K.; O’Connor, B.; Darvishzadeh, R.; Heurich, M.; Shepherd, A.; et al. Spatially detailed retrievals of spring phenology from single-season high-resolution image time series. Int. J. Appl. Earth Obs. 2017, 59, 19–30. [Google Scholar] [CrossRef]
  14. Fu, Y.H.; Zhao, H.; Piao, S.; Peaucelle, M.; Peng, S.; Zhou, G.; Ciais, P.; Huang, M.; Menzel, A.; Penuelas, J.; et al. Declining global warming effects on the phenology of spring leaf unfolding. Nature 2015, 526, 104–107. [Google Scholar] [CrossRef] [PubMed] [Green Version]
  15. Vitasse, Y.; Signarbieux, C.; Fu, Y.H. Global warming leads to more uniform spring phenology across elevations. Proc. Natl. Acad. Sci. USA 2018, 115, 1004–1008. [Google Scholar] [CrossRef] [PubMed] [Green Version]
  16. Meng, L.; Mao, J.; Zhou, Y.; Richardson, A.D.; Lee, X.; Thornton, P.E.; Ricciuto, D.M.; Li, X.; Dai, Y.; Shi, X.; et al. Urban warming advances spring phenology but reduces the response of phenology to temperature in the conterminous United States. Proc. Natl. Acad. Sci. USA 2020, 117, 4228–4233. [Google Scholar] [CrossRef] [PubMed]
  17. Cao, R.Y.; Feng, Y.; Liu, X.L.; Shen, M.G.; Zhou, J. Uncertainty of Vegetation Green-Up Date Estimated from Vegetation Indices Due to Snowmelt at Northern Middle and High Latitudes. Remote Sens. 2020, 12, 190. [Google Scholar] [CrossRef] [Green Version]
  18. Wang, X.; Gao, Q.; Wang, C.; Yu, M. Spatiotemporal patterns of vegetation phenology change and relationships with climate in the two transects of East China. Glob. Ecol. Conserv. 2017, 10, 206–219. [Google Scholar] [CrossRef]
  19. Su, M.S.; Huang, X.; Xu, Z.; Zhu, W.H.; Lin, Z.H. A Decrease in the Daily Maximum Temperature during Global Warming Hiatus Causes a Delay in Spring Phenology in the China-DPRK-Russia Cross-Border Area. Remote Sens. 2022, 14, 1462. [Google Scholar] [CrossRef]
  20. Yu, H.Y.; Luedeling, E.; Xu, J.C. Winter and spring warming result in delayed spring phenology on the Tibetan Plateau. Proc. Natl. Acad. Sci. USA 2010, 107, 22151–22156. [Google Scholar] [CrossRef]
  21. Li, C.; Wang, R.H.; Cui, X.F.; Wu, F.; Yan, Y.; Peng, Q.; Qian, Z.H.; Xu, Y. Responses of vegetation spring phenology to climatic factors in Xinjiang, China. Ecol. Indic. 2021, 124, 107286. [Google Scholar] [CrossRef]
  22. Lalić, B.; Fitzjarrald, D.R.; Firanj Sremac, A.; Marčić, M.; Petrić, M. Identifying Crop and Orchard Growing Stages Using Conventional Temperature and Humidity Reports. Atmosphere 2022, 13, 700. [Google Scholar] [CrossRef]
  23. Zeng, Q.; Rossi, S.; Yang, B.; Qin, C.; Li, G. Environmental Drivers for Cambial Reactivation of Qilian Junipers (Juniperus przewalskii) in a Semi-Arid Region of Northwestern China. Atmosphere 2020, 11, 232. [Google Scholar] [CrossRef] [Green Version]
  24. Wang, Y.F.; Case, B.; Rossi, S.; Dawadi, B.; Liang, E.Y.; Ellison, A.M. Frost controls spring phenology of juvenile Smith fir along elevational gradients on the southeastern Tibetan Plateau. Int. J. Biometeorol. 2019, 63, 963–972. [Google Scholar] [CrossRef]
  25. Malyshev, A.V. Warming Events Advance or Delay Spring Phenology by Affecting Bud Dormancy Depth in Trees. Front. Plant Sci. 2020, 11, 856. [Google Scholar] [CrossRef]
  26. Hou, M.T.; Venalainen, A.K.; Wang, L.P.; Pirinen, P.I.; Gao, Y.; Jin, S.F.; Zhu, Y.X.; Qin, F.Y.; Hu, Y.H. Spatio-temporal divergence in the responses of Finland’s boreal forests to climate variables. Int. J. Appl. Earth Obs. 2020, 92, 102186. [Google Scholar] [CrossRef]
  27. Fu, Y.S.H.; Liu, Y.J.; De Boeck, H.J.; Menzel, A.; Nijs, I.; Peaucelle, M.; Penuelas, J.; Piao, S.L.; Janssens, I.A. Three times greater weight of daytime than of night-time temperature on leaf unfolding phenology in temperate trees. New Phytol. 2016, 212, 590–597. [Google Scholar] [CrossRef] [Green Version]
  28. Piao, S.L.; Tan, J.G.; Chen, A.P.; Fu, Y.H.; Ciais, P.; Liu, Q.; Janssens, I.A.; Vicca, S.; Zeng, Z.Z.; Jeong, S.J.; et al. Leaf onset in the northern hemisphere triggered by daytime temperature. Nat. Commun. 2015, 6, 6911. [Google Scholar] [CrossRef] [Green Version]
  29. Shen, X.J.; Liu, B.H.; Henderson, M.; Wang, L.; Wu, Z.F.; Wu, H.T.; Jiang, M.; Lu, X.G. Asymmetric effects of daytime and nighttime warming on spring phenology in the temperate grasslands of China. Agric. Forest Meteorol. 2018, 259, 240–249. [Google Scholar] [CrossRef]
  30. Zheng, Z.; Zhu, W.; Chen, G.; Jiang, N.; Fan, D.; Zhang, D. Continuous but diverse advancement of spring-summer phenology in response to climate warming across the Qinghai-Tibetan Plateau. Agric. Forest Meteorol. 2016, 223, 194–202. [Google Scholar] [CrossRef]
  31. Wang, J.M.; Xi, Z.X.; He, X.J.; Chen, S.S.; Rossi, S.; Smith, N.G.; Liu, J.Q.; Chen, L. Contrasting temporal variations in responses of leaf unfolding to daytime and nighttime warming. Glob. Chang. Biol. 2021, 27, 5084–5093. [Google Scholar] [CrossRef] [PubMed]
  32. Shen, M.G.; Piao, S.L.; Cong, N.; Zhang, G.X.; Janssens, I.A. Precipitation impacts on vegetation spring phenology on the Tibetan Plateau. Glob. Chang. Biol. 2015, 21, 3647–3656. [Google Scholar] [CrossRef] [Green Version]
  33. Kang, W.P.; Wang, T.; Liu, S.L. The Response of Vegetation Phenology and Productivity to Drought in Semi-Arid Regions of Northern China. Remote Sens. 2018, 10, 727. [Google Scholar] [CrossRef] [Green Version]
  34. Cheng, M.; Wang, Y.; Zhu, J.X.; Pan, Y. Precipitation Dominates the Relative Contributions of Climate Factors to Grasslands Spring Phenology on the Tibetan Plateau. Remote Sens. 2022, 14, 517. [Google Scholar] [CrossRef]
  35. Deng, H.Y.; Yin, Y.H.; Wu, S.H.; Xu, X.F. Contrasting drought impacts on the start of phenological growing season in Northern China during 1982-2015. Int. J. Climatol. 2020, 40, 3330–3347. [Google Scholar] [CrossRef]
  36. Dai, J.H.; Zhu, M.Y.; Mao, W.; Liu, R.G.; Wang, H.J.; Alatalo, J.M.; Tao, Z.X.; Ge, Q.S. Divergent changes of the elevational synchronicity in vegetation spring phenology in North China from 2001 to 2017 in connection with variations in chilling. Int. J. Climatol. 2021, 41, 6109–6121. [Google Scholar] [CrossRef]
  37. Peng, Q.; Wang, R.H.; Jiang, Y.L.; Li, C. Contributions of climate change and human activities to vegetation dynamics in Qilian Mountain National Park, northwest China. Glob. Ecol. Conserv. 2021, 32, e01947. [Google Scholar] [CrossRef]
  38. Bartošová, L.; Dížkova, P.; Bauerová, J.; Hájková, L.; Fischer, M.; Balek, J.; Bláhová, M.; Možný, M.; Zahradníček, P.; Štěpánek, P.; et al. Phenological Response of Flood Plain Forest Ecosystem Species to Climate Change during 1961–2021. Atmosphere 2022, 13, 978. [Google Scholar] [CrossRef]
  39. Cai, Z.Z.; Jonsson, P.; Jin, H.X.; Eklundh, L. Performance of Smoothing Methods for Reconstructing NDVI Time-Series and Estimating Vegetation Phenology from MODIS Data. Remote Sens. 2017, 9, 1271. [Google Scholar] [CrossRef] [Green Version]
  40. Dávid, R.Á.; Barcza, Z.; Kern, A.; Kristóf, E.; Hollós, R.; Kis, A.; Lukac, M.; Fodor, N. Sensitivity of spring phenology simulations to the selection of model structure and driving meteorological data. Atmosphere 2021, 12, 963. [Google Scholar] [CrossRef]
  41. Workie, T.G.; Debella, H.J. Climate change and its effects on vegetation phenology across ecoregions of Ethiopia. Glob. Ecol. Conserv. 2018, 13, e00366. [Google Scholar] [CrossRef]
  42. Kong, D.D.; McVicar, T.R.; Xiao, M.Z.; Zhang, Y.Q.; Pena-Arancibia, J.L.; Filippa, G.; Xie, Y.X.; Gu, X.H. phenofit: An R package for extracting vegetation phenology from time series remote sensing. Methods Ecol. Evol. 2022, 13, 1508–1527. [Google Scholar] [CrossRef]
  43. Fu, Y.S.H.; Zhou, X.C.; Li, X.X.; Zhang, Y.R.; Geng, X.J.; Hao, F.H.; Zhang, X.; Hanninen, H.; Guo, Y.H.; De Boeck, H.J. Decreasing control of precipitation on grassland spring phenology in temperate China. Glob. Ecol. Biogeogr. 2021, 30, 490–499. [Google Scholar] [CrossRef]
  44. Qin, G.X.; Adu, B.; Li, C.B.; Wu, J. Diverse Responses of Phenology in Multi-Grassland to Environmental Factors on Qinghai-Tibetan Plateau in China. Theor. Appl. Climatol. 2022, 148, 931–942. [Google Scholar] [CrossRef]
  45. Yuan, M.X.; Zhao, L.; Lin, A.W.; Li, Q.J.; She, D.X.; Qu, S. How do climatic and non-climatic factors contribute to the dynamics of vegetation autumn phenology in the Yellow River Basin, China? Ecol. Indic. 2020, 112, 106112. [Google Scholar] [CrossRef]
  46. Mei, L.; Bao, G.; Tong, S.Q.; Yin, S.; Bao, Y.H.; Jiang, K.; Hong, Y.; Tuya, A.; Huang, X.J. Elevation-dependent response of spring phenology to climate and its legacy effect on vegetation growth in the mountains of northwest Mongolia. Ecol. Indic. 2021, 126, 107640. [Google Scholar] [CrossRef]
  47. Muffler, L.; Beierkuhnlein, C.; Aas, G.; Jentsch, A.; Schweiger, A.H.; Zohner, C.; Kreyling, J. Distribution ranges and spring phenology explain late frost sensitivity in 170 woody plants from the Northern Hemisphere. Glob. Ecol. Biogeogr. 2016, 25, 1061–1071. [Google Scholar] [CrossRef]
  48. Wang, X.F.; Xiao, J.F.; Li, X.; Cheng, G.D.; Ma, M.G.; Zhu, G.F.; Arain, M.A.; Black, T.A.; Jassal, R.S. No trends in spring and autumn phenology during the global warming hiatus. Nat. Commun. 2019, 10, 2389. [Google Scholar] [CrossRef] [Green Version]
  49. Park, H.; Jeong, S.J.; Ho, C.H.; Park, C.E.; Kim, J. Slowdown of spring green-up advancements in boreal forests. Remote Sens. Environ. 2018, 217, 191–202. [Google Scholar] [CrossRef]
  50. Miao, L.; Muller, D.; Cui, X.; Ma, M. Changes in vegetation phenology on the Mongolian Plateau and their climatic determinants. PLoS ONE 2017, 12, e0190313. [Google Scholar] [CrossRef]
  51. Zhang, Q.; Kong, D.; Shi, P.; Singh, V.P.; Sun, P. Vegetation phenology on the Qinghai-Tibetan Plateau and its response to climate change (1982–2013). Agric. Forest Meteorol. 2018, 248, 408–417. [Google Scholar] [CrossRef]
  52. Jin, H.; Jonsson, A.M.; Olsson, C.; Lindstrom, J.; Jonsson, P.; Eklundh, L. New satellite-based estimates show significant trends in spring phenology and complex sensitivities to temperature and precipitation at northern European latitudes. Int. J. Biometeorol. 2019, 63, 763–775. [Google Scholar] [CrossRef] [Green Version]
  53. Li, Y.; Zhang, Y.; Gu, F.; Liu, S. Discrepancies in vegetation phenology trends and shift patterns in different climatic zones in middle and eastern Eurasia between 1982 and 2015. Ecol. Evol. 2019, 9, 8664–8675. [Google Scholar] [CrossRef] [PubMed] [Green Version]
  54. Li, H.B.; Wang, C.Z.; Zhang, L.J.; Li, X.X.; Zang, S.Y. Satellite monitoring of boreal forest phenology and its climatic responses in Eurasia. Int. J. Remote Sens. 2017, 38, 5446–5463. [Google Scholar] [CrossRef]
  55. Tang, G.; Arnone, J.A.; Verburg, P.S.J.; Jasoni, R.L.; Sun, L. Trends and climatic sensitivities of vegetation phenology in semiarid and arid ecosystems in the US Great Basin during 1982-2011. Biogeosciences 2015, 12, 6985–6997. [Google Scholar] [CrossRef] [Green Version]
  56. Lin, S.Z.; Wang, H.J.; Ge, Q.S.; Hu, Z. Effects of chilling on heat requirement of spring phenology vary between years. Agric. Forest Meteorol. 2021, 312, 108718. [Google Scholar] [CrossRef]
  57. Peaucelle, M.; Janssens, I.A.; Stocker, B.D.; Ferrando, A.D.; Fu, Y.H.; Molowny-Horas, R.; Ciais, P.; Penuelas, J. Spatial variance of spring phenology in temperate deciduous forests is constrained by background climatic conditions. Nat. Commun. 2019, 10, 5388. [Google Scholar] [CrossRef] [PubMed] [Green Version]
  58. Yuan, M.X.; Wang, L.C.; Lin, A.W.; Liu, Z.J.; Qu, S. Variations in land surface phenology and their response to climate change in Yangtze River basin during 1982–2015. Theor. Appl. Climatol. 2019, 137, 1659–1674. [Google Scholar] [CrossRef]
  59. Zhang, R.R.; Qi, J.Y.; Leng, S.; Wang, Q.F. Long-Term Vegetation Phenology Changes and Responses to Preseason Temperature and Precipitation in Northern China. Remote Sens. 2022, 14, 1396. [Google Scholar] [CrossRef]
  60. Zhang, Y.R.; Zhang, J.; Xia, J.Y.; Guo, Y.H.; Fu, Y.S.H. Effects of Vegetation Phenology on Ecosystem Water Use Efficiency in a Semiarid Region of Northern China. Front. Plant Sci. 2022, 13, 945582. [Google Scholar] [CrossRef]
Figure 1. (a) Geographical location and provincial division of the study area and (b) vegetation type distribution. DNF: deciduous needleleaf forest, DBF: deciduous broadleaf forest, MEA: meadow, PG: plain grassland, SG: slope grassland, AM: alpine and sub-alpine meadow. Northwest China includes Shaanxi, Gansu, Qinghai, Ningxia, and Xinjiang. North China includes Beijing, Tianjin, Hebei, Shanxi, and Inner Mongolia. Northeast China includes Liaoning, Jilin, and Heilongjiang.
Atmosphere 14 00117 g001
Figure 2. Spatial pattern of the (a) mean value and (b) standard deviation of SOS. The top insets show the proportions of different numerical grades.
Atmosphere 14 00117 g002
Figure 3. Changes of SOS in northern China (a) and SOS trends for (b) 1982–2014, (c) 1982–1998, (d) 1998–2014, and (e) the difference between two sub-periods. The top insets show the proportions of different numerical grades. The top-left insets show the spatial patterns of significance at p < 0.05, where blue (red) represents advancing (delaying) SOS.
Atmosphere 14 00117 g003
Figure 4. Spatial pattern of the preseason length of (a) Tmn, (b) Tmx, (c) Pre, and (d) Rad. The top insets show the proportions of different numerical grades (Unit: months).
Atmosphere 14 00117 g004
Figure 5. The spatial pattern of the sensitivity of SOS to preseason (a) Tmn, (b) Tmx, (c) Pre, and (d) Rad. The top insets show the proportions of different numerical grades. The top-left insets show the spatial patterns of significance at p < 0.05, where red (blue) represents positive (negative) values.
Atmosphere 14 00117 g005
Figure 6. The sensitivity of SOS to preseason (a) Tmn, (b) Tmx, (c) Pre, and (d) Rad at the vegetation-type scale. Solid color blocks represent significant correlations.
Atmosphere 14 00117 g006aAtmosphere 14 00117 g006b
Figure 7. (a) Spatial pattern and (b) the proportion of the most critical climatic factor in SOS. NA represents non-significant regions and is not shown in (b).
Atmosphere 14 00117 g007
Table 1. The mean value and standard deviation of SOS at the vegetation-type scale.
Types 1SOS Mean (DOY)SD (Days)
DNF134.28 ± 5.687.30 ± 2.06
DBF129.95 ± 10.749.31 ± 3.05
Bush142.13 ± 17.4910.13 ± 3.05
AM153.27 ± 12.878.25 ± 1.91
SG125.56 ± 15.2011.67 ± 4.53
PG143.17 ± 15.6011.40 ± 4.01
MEA146.77 ± 10.7310.03 ± 3.61
1 DNF: deciduous needleleaf forest, DBF: deciduous broadleaf forest, MEA: meadow, PG: plain grassland, SG: slope grassland, AM: alpine and sub-alpine meadow.
Table 2. Trends of SOS during 1982–2014, 1982–1998, and 1998–2014 at the vegetation-type scale.
Types1982–20141982–19981998–2014
DNF−0.20 *−0.65 *0.01
DBF−0.15−0.46 *0.23
Bush−0.16 *−0.38 *−0.05
AM−0.11−0.52 *0.21
SG−0.30 *−0.47 *−0.18
PG−0.12−0.23−1.00
MEA0.01−0.240.04
* represents significant at p < 0.05.
Table 3. The proportion of the most critical climatic factor in SOS at the vegetation-type scale. Non-significant regions are not shown.
TypesTmnTmxPreRad
DNF12.40%28.56%6.62%16.68%
DBF27.22%13.53%8.43%14.15%
Bush21.01%11.66%12.26%10.55%
AM20.31%14.58%6.69%10.79%
SG27.43%11.71%6.67%19.62%
PG19.96%22.46%9.29%10.79%
MEA16.52%14.26%13.11%13.53%
Table 4. Trends of SOS from the results of this study and other literature in northern China or at similar latitudes.
Study AreaDataPeriodTrend (Days/Year)Reference
Xinjiang, ChinaNDVI1982–2014–0.19[21]
High-latitude regions of the Northern Hemisphere (>45° N)NDVI1981–2013–0.22[49]
Temperate grasslands of ChinaNDVI1982–2015–0.184[43]
Mongolian PlateauNDVI1982–2011–0.1[50]
Tibetan PlateauNDVI1982–20130.013[51]
China–DPRK–Russia cross-borderNDVI1982–20150.1[19]
Northern EuropeNDVI2000–2016–0.3[52]
Middle and eastern Eurasia NDVI1982–2015–0.2[53]
Boreal EurasiaNDVI1982–2011–0.083[54]
Great Basin, the USNDVI1982–2011–0.1[55]
This studyNDVI1982–2014–0.11
Disclaimer/Publisher’s Note: The statements, opinions and data contained in all publications are solely those of the individual author(s) and contributor(s) and not of MDPI and/or the editor(s). MDPI and/or the editor(s) disclaim responsibility for any injury to people or property resulting from any ideas, methods, instructions or products referred to in the content.

