Article

Impact-Based Critical Areal Rainfall for Early Flood Warning: A Case Study of Zhulong River Watershed in the Upper Reaches of the Xiong’an New Area

1
Meteorological Disaster Prevention and Environment Meteorology Center of Hebei Province, Key Laboratory of Meteorology and Ecological Environment of Hebei Province, Shijiazhuang 050021, China
2
Institute for Disaster Risk Management/School of Geographical Science, Nanjing University of Information Science & Technology, Nanjing 210044, China
*
Authors to whom correspondence should be addressed.
Atmosphere 2023, 14(1), 113; https://doi.org/10.3390/atmos14010113
Submission received: 2 October 2022 / Revised: 24 December 2022 / Accepted: 28 December 2022 / Published: 4 January 2023

Abstract

:
In this work, the largest tributary of the South Branch in the upper reaches of the Xiong’an New Area is selected as the study area. The impact-based critical areal rainfall indices for early flood warnings are proposed from the perspective of the impacts of floods on socio-economic factors. Specifically, four steps, including the determination of the damage-causing discharges, the establishment of the rainfall–discharge relationship, the computation of the critical areal rainfall and the validation of the early warning indices, were used to determine the critical areal rainfall for early flood warnings in the watershed. The results showed that the 1-day critical areal rainfall amounts were 31 mm, 63 mm, 92 mm and 160 mm for early flood warning levels 4, 3, 2 and 1, respectively, when the 1-day antecedent areal rainfall was ≤10 mm. The critical areal rainfall amounts were 20 mm, 54 mm, 87 mm and 160 mm for early flood warning levels 4, 3, 2 and 1, respectively, when the 1-day antecedent areal rainfall was >10 mm. The early warning effectiveness of the proposed critical indices was validated with historical catastrophic flood events and precipitation data during recent flood seasons. The results demonstrated that the impact-based critical indices had a high accuracy and could release warnings 1–2 days in advance, which could effectively avoid the occurrence of missed and underestimated warnings.

1. Introduction

The global natural disaster statistics from the United Nations Office for Disaster Risk Reduction (UNDRR) for 2000–2019 show that worldwide flood disasters are the predominant catastrophic event, accounting for 43% of all recorded natural disasters and affecting approximately 2.5 billion people on a global scale [1]. Meanwhile, the Intergovernmental Panel on Climate Change (IPCC) assessment report states that the warming of the climate is unquestionable. As the thermodynamic effects of warming may increase the frequency and intensity of extreme precipitation events, there is growing evidence that climate change-induced variability in extreme precipitation will enhance flood risks across the world [2]. China has experienced severe flood disasters and significant losses related to these disasters [3,4,5]. Statistics from the China Water and Drought Disaster Bulletin show that the average annual death toll due to flood disasters in China exceeded 4000 over the past 60 years, and the average annual direct economic loss due to flood disasters since 1990 is about USD 20 billion [6,7,8]. In particular, extreme meteorological and climatic events have become more frequent in recent years in response to climate change [9,10,11,12,13]. It has been demonstrated in future climate change scenarios that for every 0.5 °C of warming, the annual loss caused by flood disasters in China is expected to exceed USD 60 billion [3]. Therefore, it is imperative to develop effective early flood warning approaches, which are considered as critical non-engineering measures not only for regional flood disaster prevention and control, but also to provide critical guidance for reducing flood disaster losses and mitigating flood disaster risks to realize sustainable socioeconomic development.
Most of the early flood warnings in basins are based on weather forecasts and hydrological forecasts, which mainly focus on the degree of hazard due to meteorological or hydrological parameters, such as water level warnings or flood characteristics. These flood characteristics such as runoff processes and flood peaks in different watersheds are based on high-resolution distributed hydrological models. Flood warnings are then released according to river flood control criteria. However, such early flood warning methods are usually difficult to use in practice [14,15]. In comparison, because of the precipitation monitoring coverage and the more readily available data, the approach of releasing early flood warnings based on real-time watershed areal rainfall forecasts has been increasingly implemented, especially in early flash flood warnings [16,17,18]. For instance, Miao et al. [11] determined the critical areal rainfall for flash floods by establishing the relationship between the precipitation and water runoff levels [17]. Nevertheless, currently these studies focus little attention on the severity of the impact on the socioeconomic factors at risk in the affected areas [18], and there are even fewer studies on early flood warnings in small and medium river watersheds.
Xiong’an New Area is located in the Daqing River basin, an important drainage system for the Haihe River basin, with a relatively low-lying terrain and many tributaries forming the upstream southern branch system, including the Zhulong River, Tang River, Fu River, Cao River, Ping River, Cao River, Xiaoyi River, etc. With a complex river network, Xiong’an New Area is highly susceptible to river flooding in the upstream tributaries in response to rainstorms. Studies have shown that a total of 139 flood disasters occurred in Xiong’an New Area in the 300 years from 1715 to 2016, with an average occurrence of once every 2 to 3 years, causing serious socioeconomic losses to Xiong’an New Area [19,20,21,22,23]. To this end, this study selects the largest tributary of the South Branch water system upstream of Xiong’an New Area, the Zhulong River, as the study area, and builds an impact-based flood warning based on critical areal rainfall from daily meteorological and water flow observational data from 1961 to 2017, by considering the severity of the impact caused by floods on socioeconomics. This study also validates the warning indices with comparisons to typical historical floods, aimed at enhancing the accuracy and response time of the early flood warnings and reducing the possible impact of flood disasters on Xiong’an New Area for sustainable socio-economic development.

2. Materials and Methods

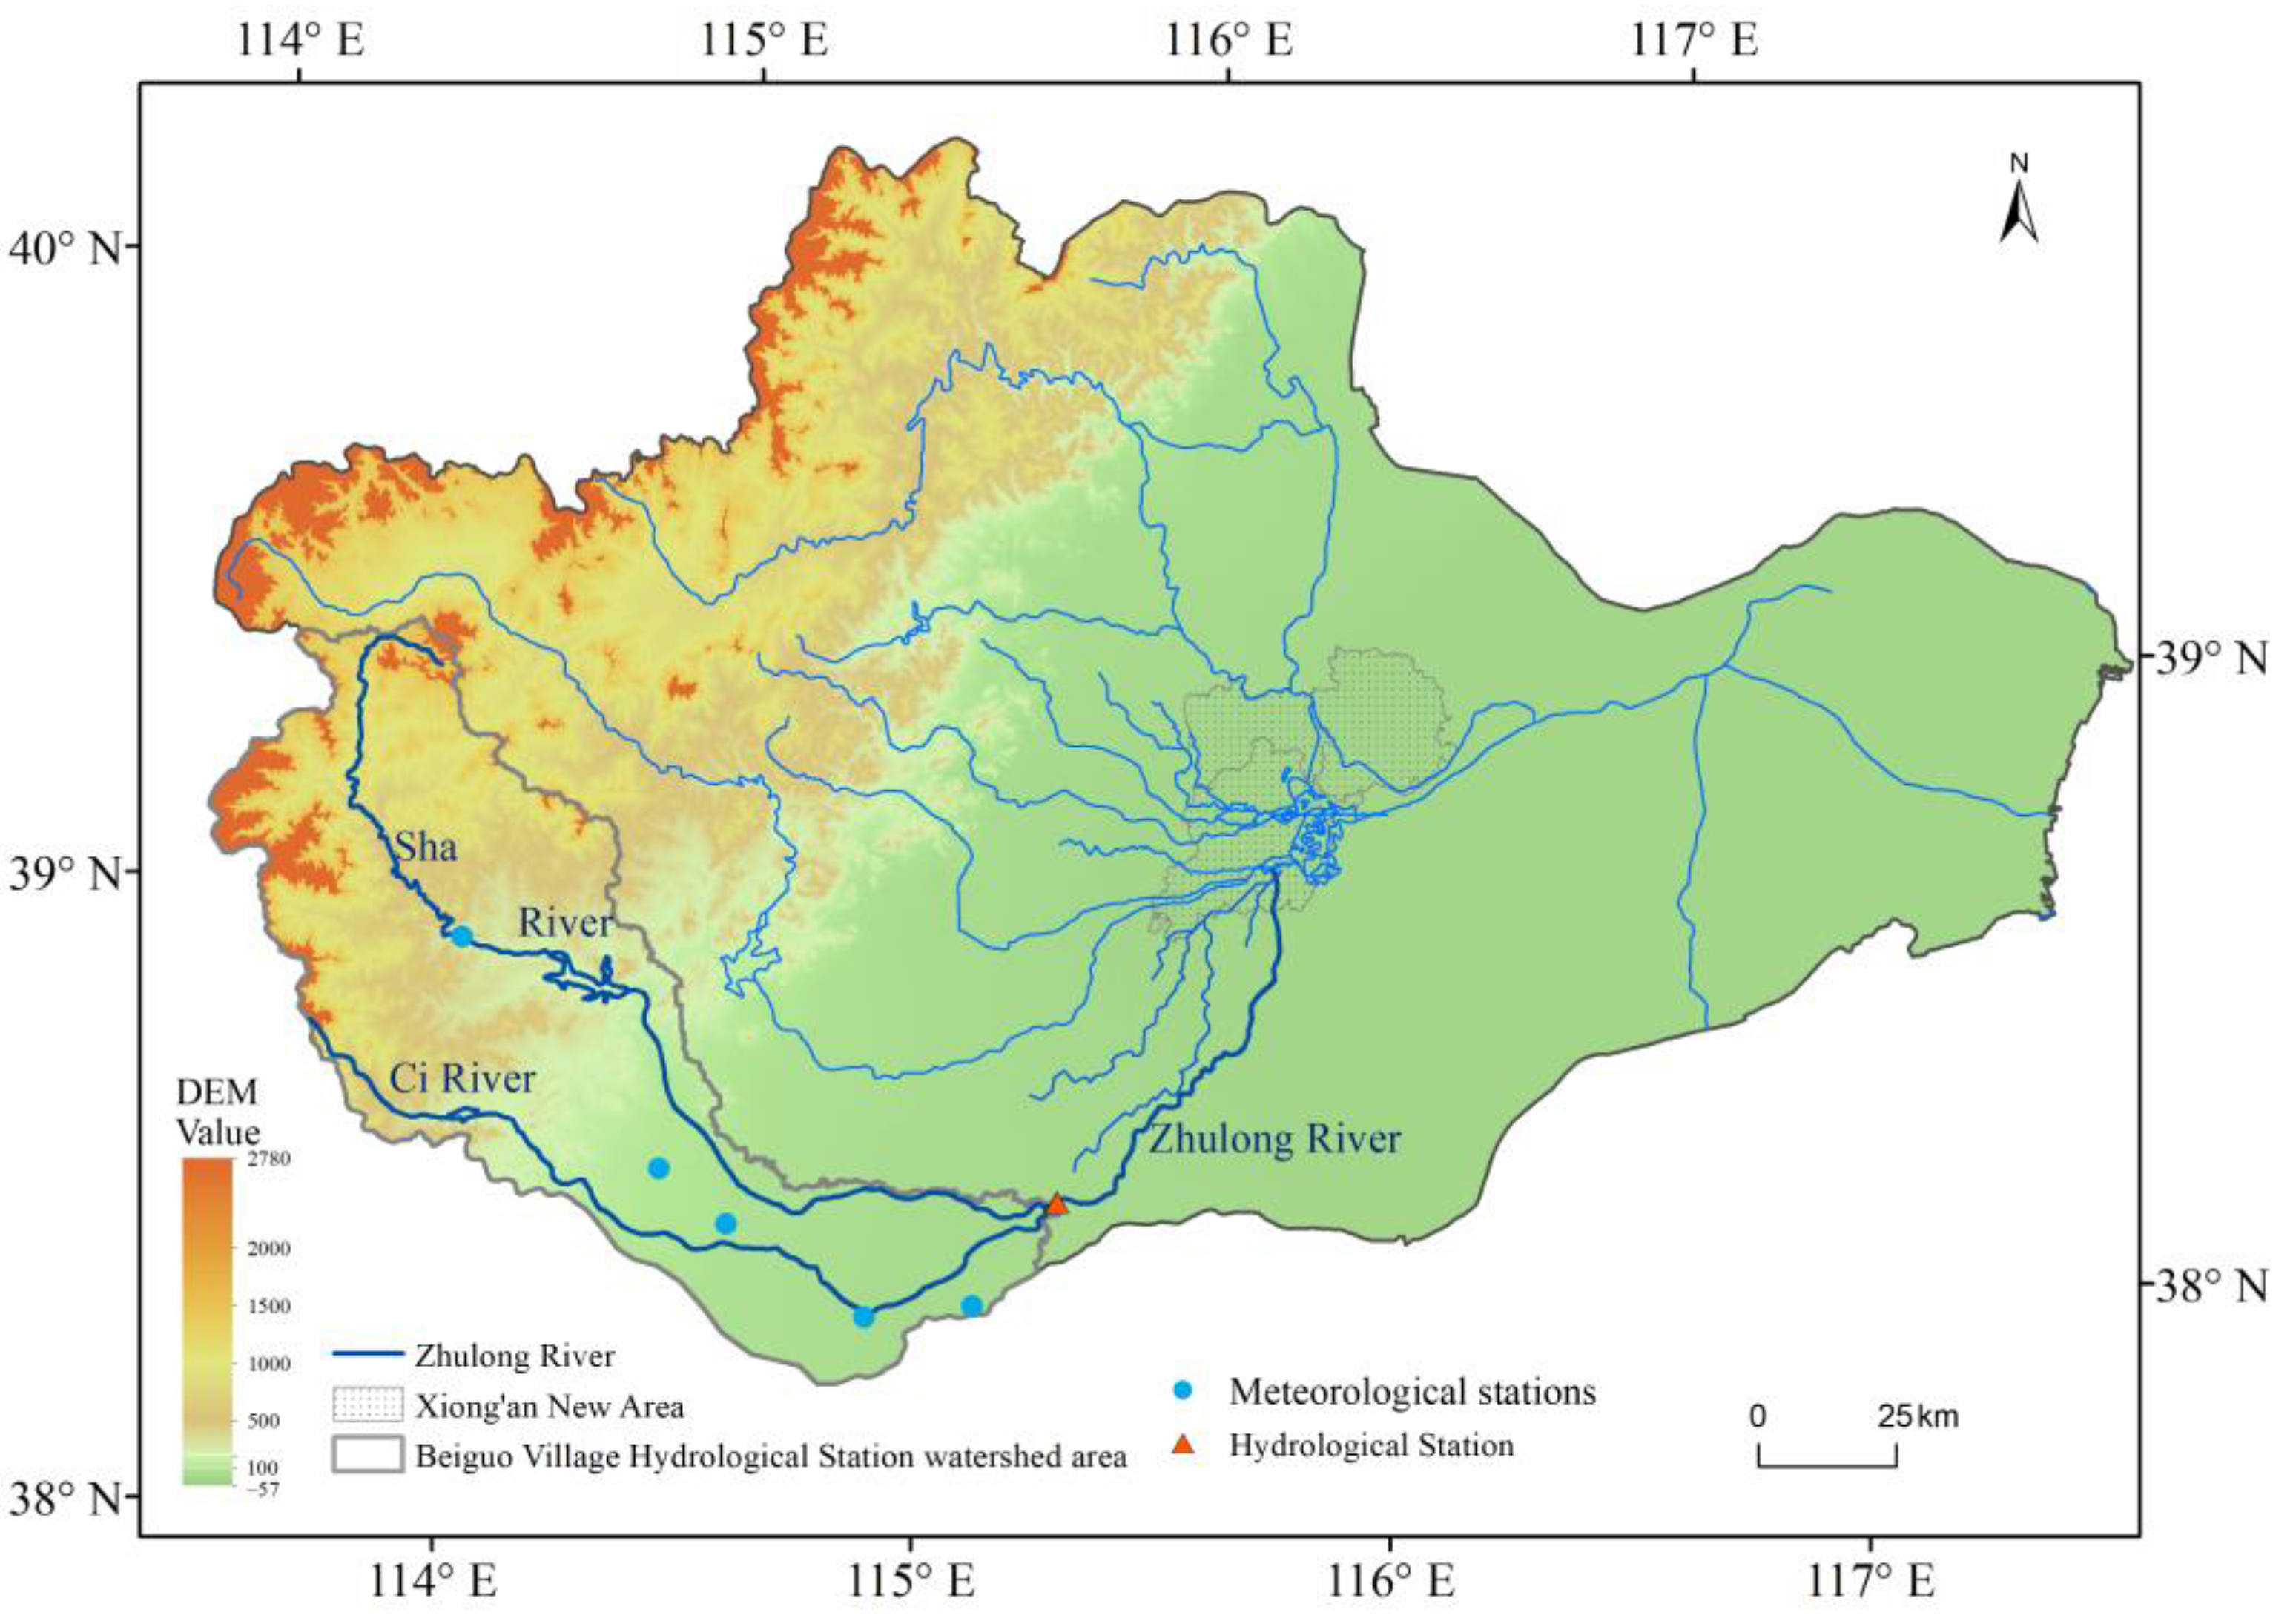
2.1. Study Area and Data

In this study, the Zhulong River, which is the largest tributary of the South Branch of small- and medium-sized rivers upstream of the Xiong’an New Area of the Daqing River, was selected as the study area. The Zhulong River watershed includes the convergence of the Sha River, the Ci River and the Mengliang River into the mainstream, and the watershed area controlled by the Beigucun hydrological station is approximately 7750 km2. The geographical location is shown in Figure 1. The watershed is located in a semi-arid continental monsoon climate zone, with an average annual temperature of 11.0–13.3 °C and an average annual precipitation of 350 mm–780 mm. The steep topography, thin soil layer, poor vegetation cover, short flow of numerous tributary rivers, short confluence time and the steep rise and fall in flood levels have resulted in the occurrence of high flood peak levels, short flood durations, and concentrated flood amounts in the region. There have been several flood disasters resulting from rainstorms since 1960, such as in those in 1963, 1988, 1996, 2012 and 2016, in which the Zhulong River watershed was the main or sub-storm epicenter, causing large economic losses in the downstream areas including in Xiong’an New Area [24].
In this work, the daily observed runoff data of the Zhulong River from 1961 to 2017 at the Beiguocun hydrological station were obtained from the Hebei Provincial Water Resources Department. The daily temperature and precipitation data of meteorological stations within the watershed from 1961 to 2017 were obtained from the National Meteorological Information Center. The distribution of meteorological stations is shown in Figure 1. The areal rainfall data is based on 114 meteorological observation stations in and around the Daqing River basin, and ANUSPLIN, a professional meteorological interpolation software was used for spatial interpolation, and then the areal rainfall time series were derived. ANUSPLIN is a software for spatial interpolation of climate data based on the thin plate spline function algorithm, which has been widely used for spatial interpolation of climate variables and has been demonstrated to improve the accuracy of interpolated climate variables for regional characterization [25,26,27]. As a result of the spatial distribution of precipitation being significantly influenced by topographic variations, to further reduce the influence of the spatial heterogeneity of the topography of Xiong’an New Area on precipitation modeling, the digital elevation model (DEM) was introduced as a covariate in the spatial interpolation process of ANUSPLIN. Areal rainfall refers to the average amount of precipitation per unit area in the study area. In this regard, the digital elevation model data required for the semi-distributed Hydrologiska Byråns Vattenbalansavdelning (HBV) hydrological model simulations were obtained from the SRTM (Shuttle Radar Topography Mission) and 30 m resolution data from the National Aeronautics and Space Administration (NASA) [28,29,30,31]. Land use data were obtained from the data collected in 2015 from the Resource and Environment Data Center of the Chinese Academy of Sciences. In the meantime, real-time 6 h intelligent grid precipitation data for July and August in the period from 2018 to 2019 were collected from the National Meteorological Information Center to further validate the warning effectiveness.

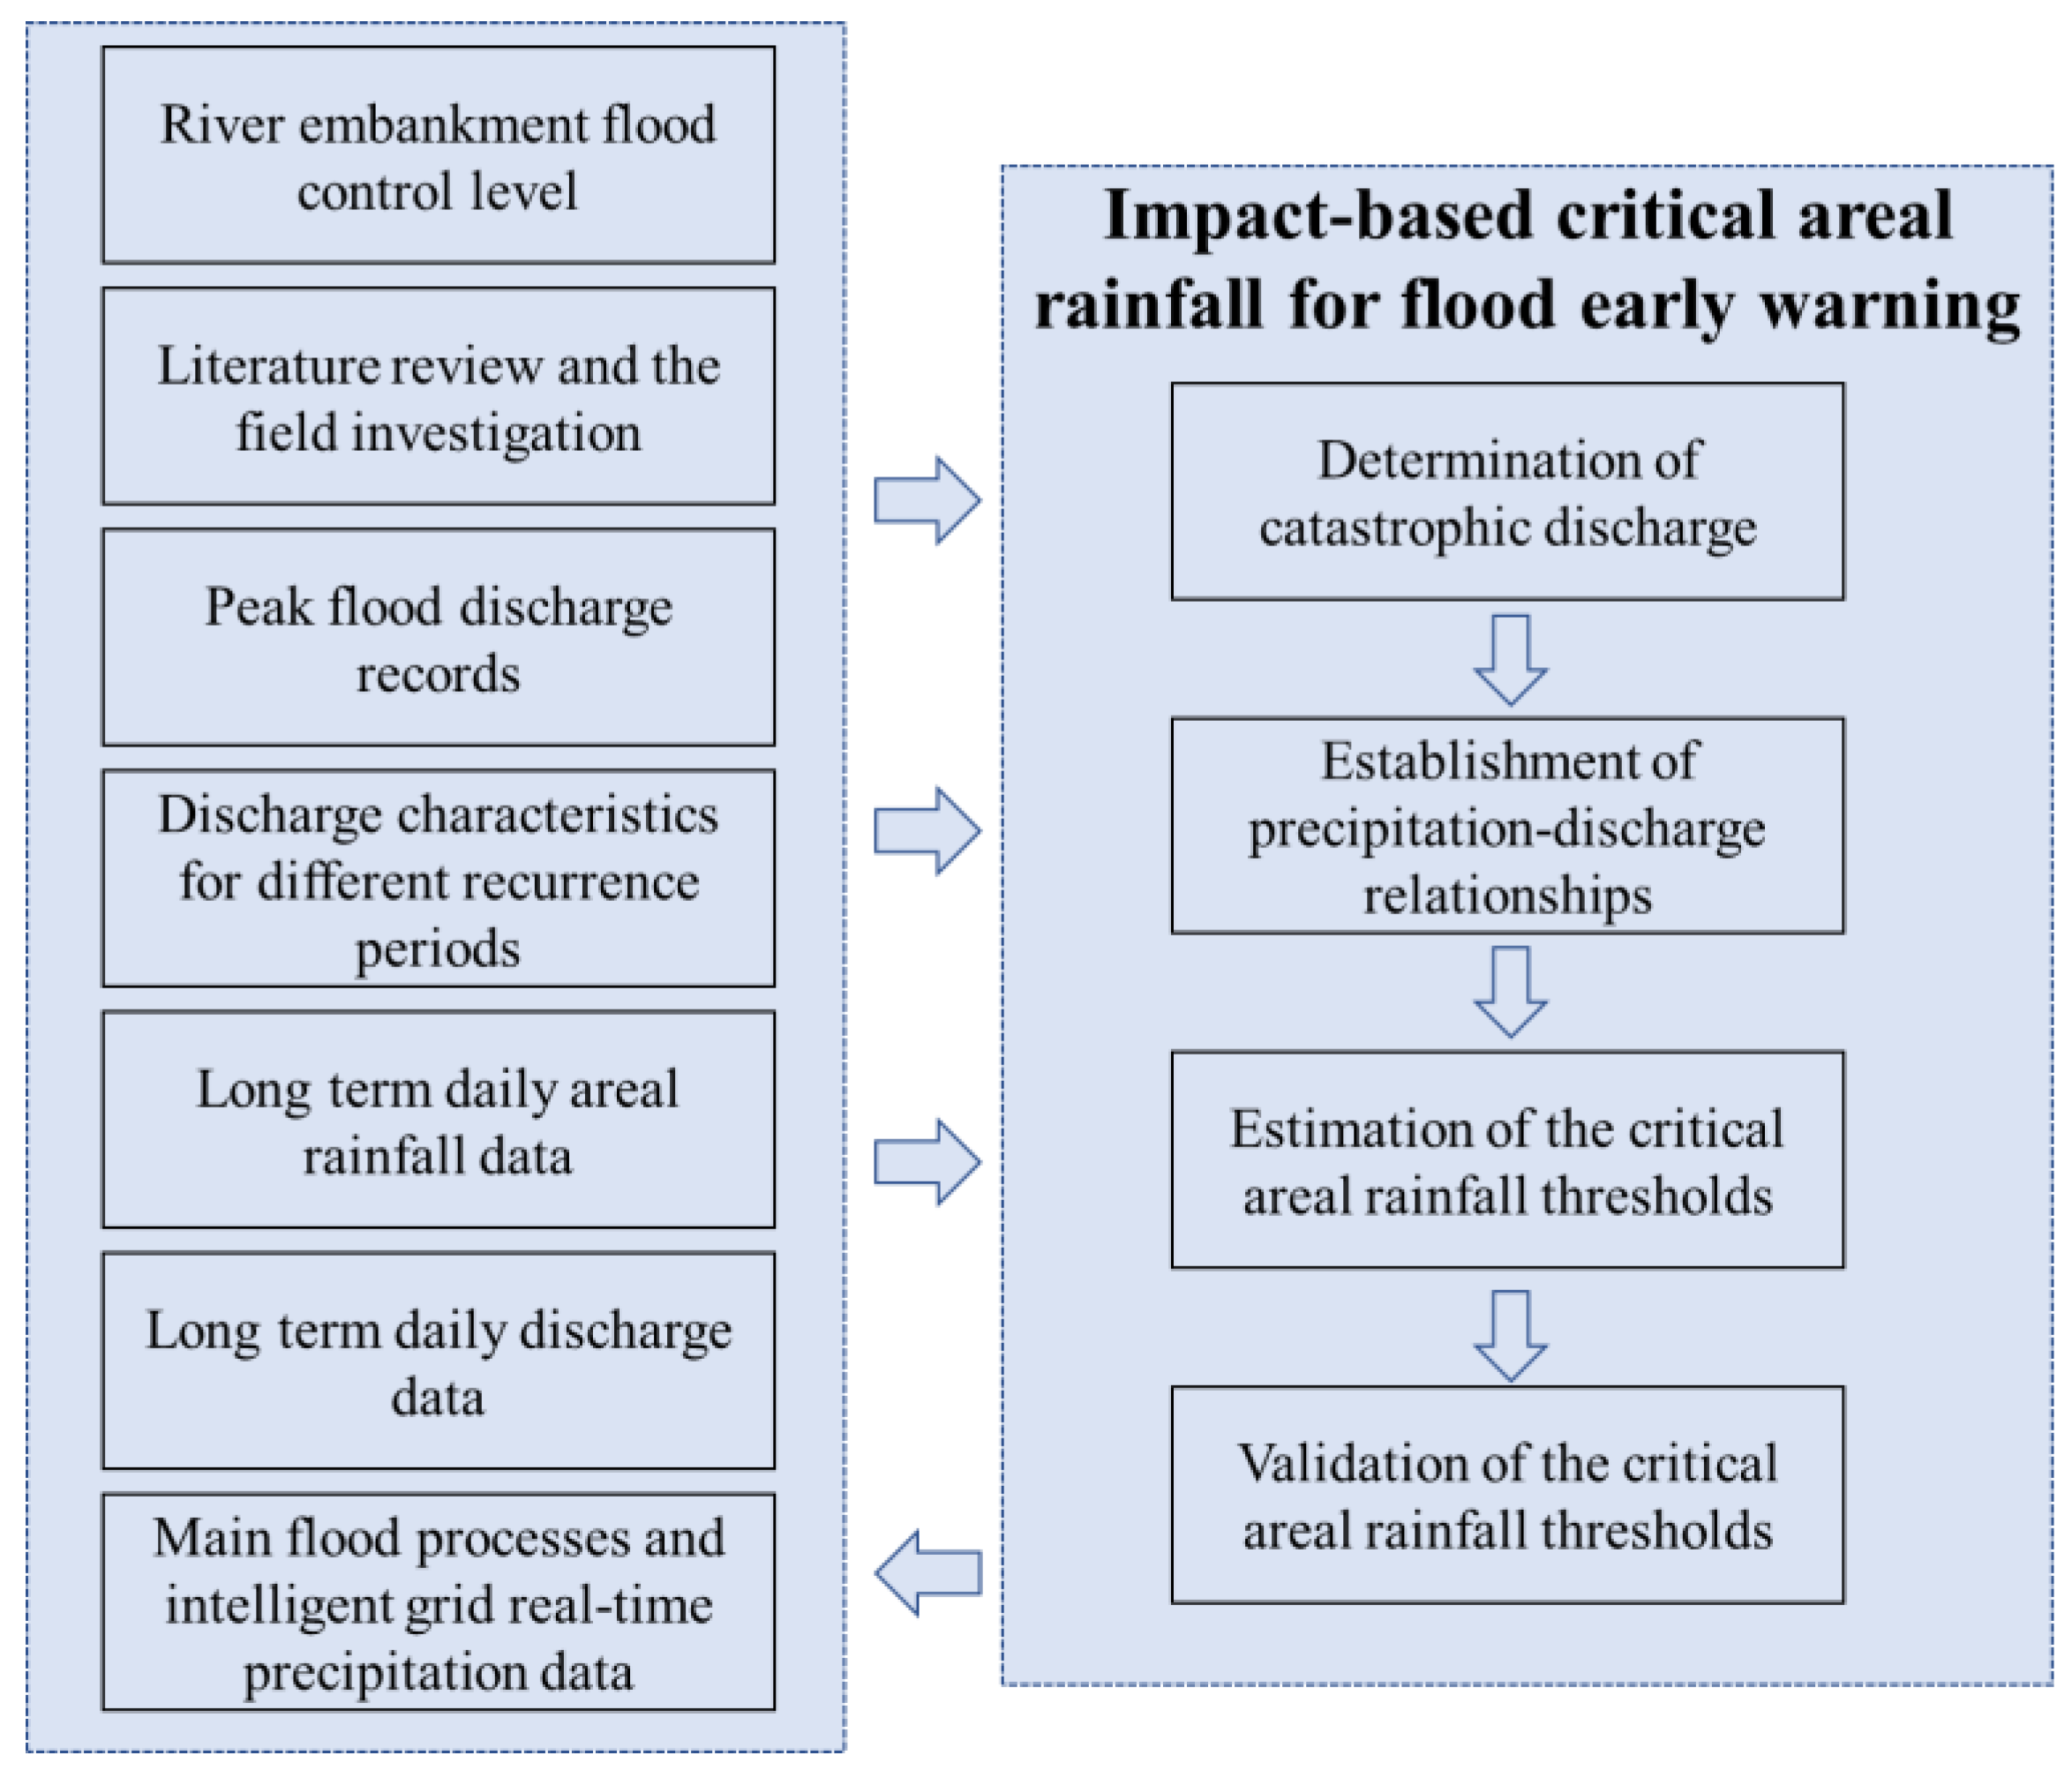
2.2. Early Flood Warning Methods

Heavy or continuous rainfall is the dominant driver of flooding in the eastern monsoon region of China. However, rainfall does not always trigger flooding, only when the amount of rainfall reaches a certain critical criterion. The critical threshold is also referred to as the catastrophic critical areal rainfall in watershed flood hazard studies. More specifically, it refers to the change in water level and discharge of a river caused by rainfall or upstream water. When the catastrophic runoff/water level for river floods is exceeded, the primary cause of the flooding is rainfall. Such rainfall indicates the critical areal rainfall in the watershed, which is a crucial diagnostic for early flood warnings and the accompanying preventative actions. On this basis, this study proposes an impact-based approach for the determination of critical areal rainfall indices for early flood warnings by considering the potential socio-economic impacts caused by floods (as shown in Figure 2), specifically including four steps, i.e., the determination of catastrophic discharge, the establishment of precipitation–discharge relationships in the watershed, the estimation of critical areal rainfall and the validation with historical flood events.

2.2.1. Determination of Catastrophic Discharges

In general, the river embankment flood control level is divided into four levels: set water level, warning water level, guaranteed water level and diffuse dam water level. When the river discharge level reaches one of the above four levels, the embankment will face different risks and may have different impacts on the social economy. Therefore, the amount of discharge when the river water level reaches the characteristic level of different stages is determined as the catastrophic discharge. In cases where the river embankment does not have a clear flood control level, the discharge corresponding to different return periods of the peak flood discharge of the river is regarded as the catastrophic discharge. Additionally, the 10-year, 20-year, 50-year and 100-year flood discharges are used as the fourth, tertiary, secondary and first level catastrophic discharges.
Through studies of the literature and field investigations in the Zhulong River watershed in September 2020, it was found that the water level-discharge relationship of the river was uncertain. Especially since the 1980s, the river has been affected by water resource development, agricultural cultivation and anthropogenic sand mining, and the water level-discharge relationship became more complex. Therefore, the daily discharges corresponding to the flood peak discharges with different return periods in the Zhulong River watershed were chosen as the catastrophic discharges in this work. However, the lack of flood peak discharges for an extended time in the Zhulong River watershed renders it difficult to directly estimate the flood peak discharges for different recurrence periods. The flood peak discharge data available for this study are only from 39 days with a total of 160 observation records, with an average of 4–5 records of varying epochs per day. Such an amount of data was far from sufficient for use in distribution function fitting and flood frequency analysis. Therefore, due to the limited number of these flood peak discharge records, they were only used to establish relationships with daily discharge. Additionally, the long-term series of observed daily discharge data over nearly 60 years were used for flood frequency analysis. In other words, the maximum daily discharge for each of the 56 years during 1961–2017 comprised the series used for distribution fitting and thus for estimating the recurrence period of the flood. Firstly, the current discharge of the Zhulong River was defined as the catastrophic discharge for the first level of early flood warning based on the river design discharge and the current discharge parameters developed by the Baoding Water Resources Flood Control and Drought Relief Service Center in 2020, which considered the future flood control planning needs of the Xiong’an New Area and the current flood control characteristics of the basin. Secondly, by establishing the quantitative relationship between the flood peak discharge and daily discharge for nine historical floods, the generalized extreme value distribution function was used to estimate the daily discharge for different return periods, and then determine the flood secondary, tertiary and fourth level catastrophic discharges. The Pearson III and Generalized Extreme Value (GEV) distribution represent the most commonly used probability distribution functions for flood frequency analysis. The reason we selected the GEV distribution is because the previous studies on flood frequency analysis have shown that the GEV distribution is more robust and flexible and provides better characterization of the extreme flood than Pearson III. Moreover, the GEV distribution has been demonstrated to significantly improve the performance of flood predictions over different spatial scales.

2.2.2. Establishment of Precipitation–Discharge Relationships

A recursive numerical filtering method proposed by Eckhardt (2005) was used in order to adequately account for the possible influence of preceding rainfall on the precipitation–discharge relationship by splitting the discharge into base flow and quick flow [32,33,34]. The method provides a more consistent baseflow series and can be applied to hydrologic series of any time step. The recursive numerical filtering method contains two filtering parameters, namely the receding water constant, α, and the maximum baseflow index, BFImax, which are calculated by the following formula:
q b t = 1   BFI m a x α q b t 1 + 1   α BFI m a x q t 1   α BFI m a x
where qb(t) is the baseflow at time t; qb(t−1) is the baseflow at time t − 1; qt is the measured river discharge at time t; t is the time (in days); α is the receding water constant, which can be obtained from the receding water analysis; and BFImax is the maximum baseflow index.
On this basis, the sequence of 1-day preceding rainfall for the discharge in the watershed was constructed, and the 90% quantile of such a sequence was determined as the critical threshold of 1-day preceding rainfall for the formation of discharge. Then, the regression models were used to construct the river precipitation–discharge relationships, according to whether the preceding 1-day rainfall of the river reached the formative requirements of discharge.

2.2.3. Estimation of Critical Areal Rainfall

Based on the established river precipitation–discharge relationships under different conditions (taking into account whether the 1-day preceding rainfall in the watershed reaches the conditions of forming discharge) combined with the criteria of catastrophic discharges for flooding, the 24 h critical areal rainfall of flood disaster early warning can be determined.

2.2.4. Validation with Historical Flood Events

To validate the reliability of 1-day critical rainfall thresholds for early flood warnings, the three flood events in the Zhulong River basin in 1963, 1996 and 2016 and the intelligent grid real-time precipitation data from July–August for the years of 2018 and 2019 were used to evaluate the early warning effectiveness. The overriding goal of early flood warning is to guarantee the safety and lives of people and to prevent significant property losses; therefore, in using early flood warnings, it is necessary to focus on avoiding significant casualties and property losses due to missed warnings (actual warnings are needed but not alerted by the model), and it is safer for flood prevention and mitigation when the model imposes a slightly higher warning level than the actual warning level, or the warning date is prior to the actual warning date needed. For this reason, this study characterizes the effectiveness of warning validation in terms of the correct warning rate [35,36,37,38], which is calculated as the ratio of the number of effective warnings (total number of warnings minus the number of underestimated and missed warnings) to the total number of warnings by the following formula:
P = (AtFnLn)/At
where P is the warning correct rate, At is the total number of warnings, Fn is the number of missed warnings and Ln is the number of underestimated warnings.

3. Results and Discussion

3.1. Graded Catastrophic Discharges in the Zhulong River Watershed

The relationship between flood peak discharge and daily discharge was established based on nine flood event sample data available in the Zhulong River watershed, as shown in Figure 3, and the linear relationship fitting results are shown in Equation (3). It should be noted that the data used to establish the relationship between daily discharge and peak flood discharge in this study are in a one-to-one correspondence for each date. For instance, on 5 August 1963, there are three instantaneous discharge records in the Hydrological Statistical Yearbook for the flood event of the Zhulong River at 5:55, 12:00 and 18:15, corresponding to instantaneous discharge records of 26.6, 72.3 and 106 m3/s, respectively. The flood peak discharge for that day is documented as 106 m3/s, and corresponds to the observed daily discharge for the same day. In addition, the flood peak discharge records were only available in the Hydrological Statistical Yearbook for the period from the beginning of the flood until the maximum flood discharge is reached. During such events there will be multiple discharge records at different times of each day. Tiny flood peak discharges (as shown in Figure 3 for the sample near the origin) are recorded mainly from the first few days of the flood event. These available instantaneous flood peak discharge data for different times of each day are all from the main flood events. The results showed that the linear relationship between flood peak discharge and daily discharge in the Zhulong River basin was excellent, with the coefficient of determination R2 equal to 0.99, with a significance of 0.01.
Dmax = 1.11 × Dave + 28.28 (Dave > 0; R2 = 0.99)
where Dmax is the flood peak discharge, Dave is the daily discharge and R2 is the model coefficient of determination.
Based on the daily discharge data in the Zhulong River watershed from 1961 to 2017, the generalized extreme value distribution was used to estimate the daily discharges for the 1-in-10-year, 1-in-20-year, 1-in-30-year, 1-in-50-year, 1-in-100-year, and 1-in-200-year return periods. More specifically, for each year, the maximum daily discharge was calculated and the annual maximum daily discharge series was used to fit the probability distribution function. Then, the corresponding flood peak discharges for different return periods of daily discharges were estimated using the established flood peak discharge–daily discharge relationship (Equation (3)), and the results are shown in Table 1. The designed flood peak discharge and the current discharge of the Zhulong River were 5700 m3/s and 2000 m3/s, respectively, according to the 2020 Baoding Water Conservancy Flood Control and Drought Relief Service Center, and the corresponding daily discharge is calculated to be 4760 m3/s and 1700 m3/s with the return periods of 150–220 years and 35–60 years, respectively. From the perspective of flood safety in Xiong’an New Area, the daily discharge corresponding to the current maximum discharge is considered as the first-level early warning flood discharge, i.e., 1700 m3/s. Meanwhile, the second-, third- and fourth-level flood discharges were determined for 30-, 20- and 10-year recurrence periods, at 1000 m3/s, 700 m3/s and 380 m3/s, respectively.

3.2. Precipitation–Discharge Relationship in the Zhulongh River Watershed

The baseflow of each flood event was extracted using the recursive digital filtering method, and the baseflow, daily discharge and precipitation of the flood event are presented in Figure 4. It can be seen in Figure 4 that the baseflow extraction results of each flood event in the Zhulong River watershed are good and very stable on the whole. The five flood events show that the peak daily discharge significantly lags behind the peak precipitation by one to three days, e.g., the peak precipitation of the August 1963 flood process occurred on 7 August, while the peak daily discharge occurred on 9 August. For the four flood events after 1976, the observed daily discharge significantly increased until after the precipitation ended for several days. This may be due to the fact that human activities such as sand mining and polder planting in the river since 1980s have changed the natural precipitation–discharge relationships of the river, and the preceding river discharge and precipitation had a significant influence on flood occurence in the watershed.
To analyze the influence of preceding rainfall in the river channel on flooding in the watershed, the recursive numerical filtering method was used to extract the daily baseflow in the Zhulong River watershed from 1961 to 2017. The results of the daily discharge, daily baseflow and baseflow characteristics in the flood and non-flood season in the Zhulong River watershed are shown in Table 2. The proportion of baseflow to the daily discharge in the Zhulong River watershed is about 49%, and the baseflow is significantly higher during the flood season (June–September) compared with the non-flood season (October–May). Given that the watershed in the study area is dominated by superinfiltration-producing flow, the series of 1-day preceding areal rainfall where river discharge exceeds the threshold to generate discharge was further constructed. The 90% quantile of the series was defined as the 1-day preceding areal rainfall of river discharge formation, which was estimated to correspond to an areal rainfall of about 10 mm. Then, the relationship between precipitation and discharge in the watershed was determined according to whether the areal rainfall in the watershed reached 10 mm the preceding day, and the results are shown in Equations (4) and (5). From the coefficients of determination of the models, it can be seen that the goodness of fit of the constructed models in both situations was high. The coefficients of determination, R2, were 0.79 and 0.83, respectively, indicating that the precipitation can explain about 80% of the variation in river discharge; therefore, the constructed precipitation–discharge relationship can be used to derive the critical areal rainfall for early flood warnings.
The preceding one-day areal rainfall ≤ 10 mm, then Dave = 9.1 × P0 + 206 (R2 = 0.79)
The preceding one-day areal rainfall > 10 mm, then Dave = 10.2 × P0 + 63.7 (R2 = 0.83)
where P0 is the daily precipitation, Dave is the daily discharge and R2 is the model coefficient of determination.

3.3. The 24 h Critical Areal Rainfall Thresholds for Early Flood Warnings

Based on Equations (4) and (5), the 1-day critical areal rainfall thresholds for early flood warnings in the Zhulong River watershed can be determined by incorporating the flood graded warning discharges defined in Table 1. The results are shown in Table 3. When the preceding one-day areal rainfall ≤10 mm, i.e., the preceding one-day areal rainfall has not yet reached the conditions for forming surface discharge, the 1-day critical areal rainfalls for early flood warning levels IV, III, II and I in the Zhulong River watershed are 31 mm, 63 mm, 92 mm and 160 mm, respectively. When the preceding one-day areal rainfall >10 mm, i.e., the preceding one-day areal rainfall has reached the conditions for forming surface discharge, then the 1-day critical areal rainfall amounts for each level of early flood warnings are 20 mm, 54 mm, 87 mm and 160 mm, respectively. As the flood hazard warning level gradually increases from level IV to level I, the difference between the 1-day critical areal rainfall amounts established under the two preceding precipitation conditions becomes smaller and smaller, and gradually decreases from a difference of 11 mm to 0 mm.

3.4. Validation of Early Flood Warning Indices in the Zhulong River Watershed

The early warning effectiveness of the critical areal rainfall of the graded early flood warnings was verified using data from the three flood events of 1963, 1996 and 2016 and the intelligent grid real-time precipitation data from July–August in 2018 and 2019 in the Zhulong River watershed. The verification results are summarized in Table 4. As can be seen from the results in Table 4, the 1-day critical areal rainfall thresholds for flood graded warnings that were constructed according to this study were capable of effectively issuing warnings for each of the flood events, and the warning correctness was very good, with no missed or underestimated warnings. In the three flood events in August 1963, August 1996 and July 2016, the timing of the first warning was issued 1 day earlier for the 1963 and 2016 flood events and 2 days earlier for the 1996 event, and the flood warnings were also issued accurately on the same day for July–August in 2018 and 2019.
Specifically looking at the early warning performance of the 24 h critical areal rainfall for the whole flood event, the results of the early warning validation are shown in Table 5, using the flood event in July 2016 as an example. The precipitation in the watershed region started on 12 July 2016 with a 24 h areal rainfall of 22 mm and a value of 0 mm for the preceding day. According to the warning system in Table 3, the areal rainfall on 12 July was <31 mm (the critical areal rainfall for flood warning level IV), and the model did not issue a warning. Based on Table 1, the flood discharge of the fourth level of warning is 380 m3/s, and the observed daily discharge of the river on 12 July was 14.1 m3/s < 380 m3/s (the fourth level of flood catastrophic discharge), so there was no need to release the warning, and the model warning result was correct. On the 19 July, the 24 h areal rainfall in the watershed reached a maximum value of 89.9 mm, and the preceding one-day rainfall was 0.3 mm. In accordance with the warning system in Table 3, 63 mm (the critical areal rainfall for Level III flood warning) < 89.9 mm < 92 mm (the critical areal rainfall for Level II flood warning); therefore, the model releases a Level III warning. The daily river discharge on the 19 July was 116.6 m3/s (<380 m3/s), which did not reach the flood warning level IV. The daily river discharge on the 20 July was 399.1 m3/s (>380 m3/s), which reached the flood warning level IV; the flood warning level IV actually needed to be issued. It can be seen that the model issued the Level 3 flood warning one day earlier on the 19 July, which is one level higher than the actual warning level (Level IV), which is more secure in terms of flood mitigation effects.
Based on the available daily discharge and daily precipitation data, the impact-based hierarchical critical areal rainfall early flood warning indices have been proposed in this study by in-depth mining and analysis of precipitation–discharge relationships of major historical flood events. In the validation of the most important historical flood events and the most recent intelligence grid forecasting data, the proposed impact-based warning indices’ accuracy seems to be satisfactory. This suggests that the impact-based daily-scale flood warning method proposed has a certain theoretical meaning and operational benefit. However, there are still a few aspects that need to be enhanced in future studies to further promote the timeliness and accuracy of the early flood warnings [39,40]. For instance, the incorporation of remotely sensed precipitation products and gauges to measure precipitation in finer spatial and temporal dimensions [41,42], coupled with the simulation of distributed hydrological models and the main process of hydrological statistical yearbooks to attempt to generate hourly or sub-daily discharge data [43,44,45]. On this basis, it is possible to further investigate the use of the methods based on the rising rate in flood events and real-time accumulated precipitation to determine flood warning indicators to improve the foreseeability and accuracy of flood warnings. Meanwhile, the spatial heterogeneity of the critical rainfall indicators could be better modelled based on more refined remote sensing precipitation products [41,42]. In addition, it has been suggested that the location of the storm center has an influence on the flooding process, which needs to be considered further in future early flood warning modeling [39,40].
There may be differences in the distribution of the mean daily discharge and the instantaneous flood peak discharges, which may result in uncertainty in the findings. However, instantaneous flood peak discharge data are not always available, this study derives flood peak discharges for different recurrence periods by establishing a relationship with the daily mean discharge, and performs an impact-based flood warning investigation. Such an approach has been used and demonstrated to be practical and feasible for estimating instantaneous flood peak discharge in the Mediterranean region of southeastern Spain [46], the Aller-Leine basin in Germany [47], and Iowa in the United States [48]. Further research requires further acquisitions of sub-daily discharges with high temporal resolution to enable more accurate flood warning modeling. Meanwhile, it has also been indicated that the spatial characteristics of rainfall could significantly affect the flooding process and further enhance the model results based on finer spatial resolution of radar precipitation data [49].

4. Conclusions

In this study, we propose an impact-based early flood warning indices approach from the perspective of the socio-economic impact caused by floods. We select the largest tributary of the southern branch of the small- and medium-sized rivers in the upper reaches of Xiong’an New Area, the Zhulong River basin, as the study area. The critical areal rainfall indices for early flood warnings are determined through four steps: the determination of catastrophic discharge, the establishment of precipitation–discharge relationships in the watershed, the estimation of critical areal rainfall and the validation from historical flood events. The main conclusions are as follows:
(1)
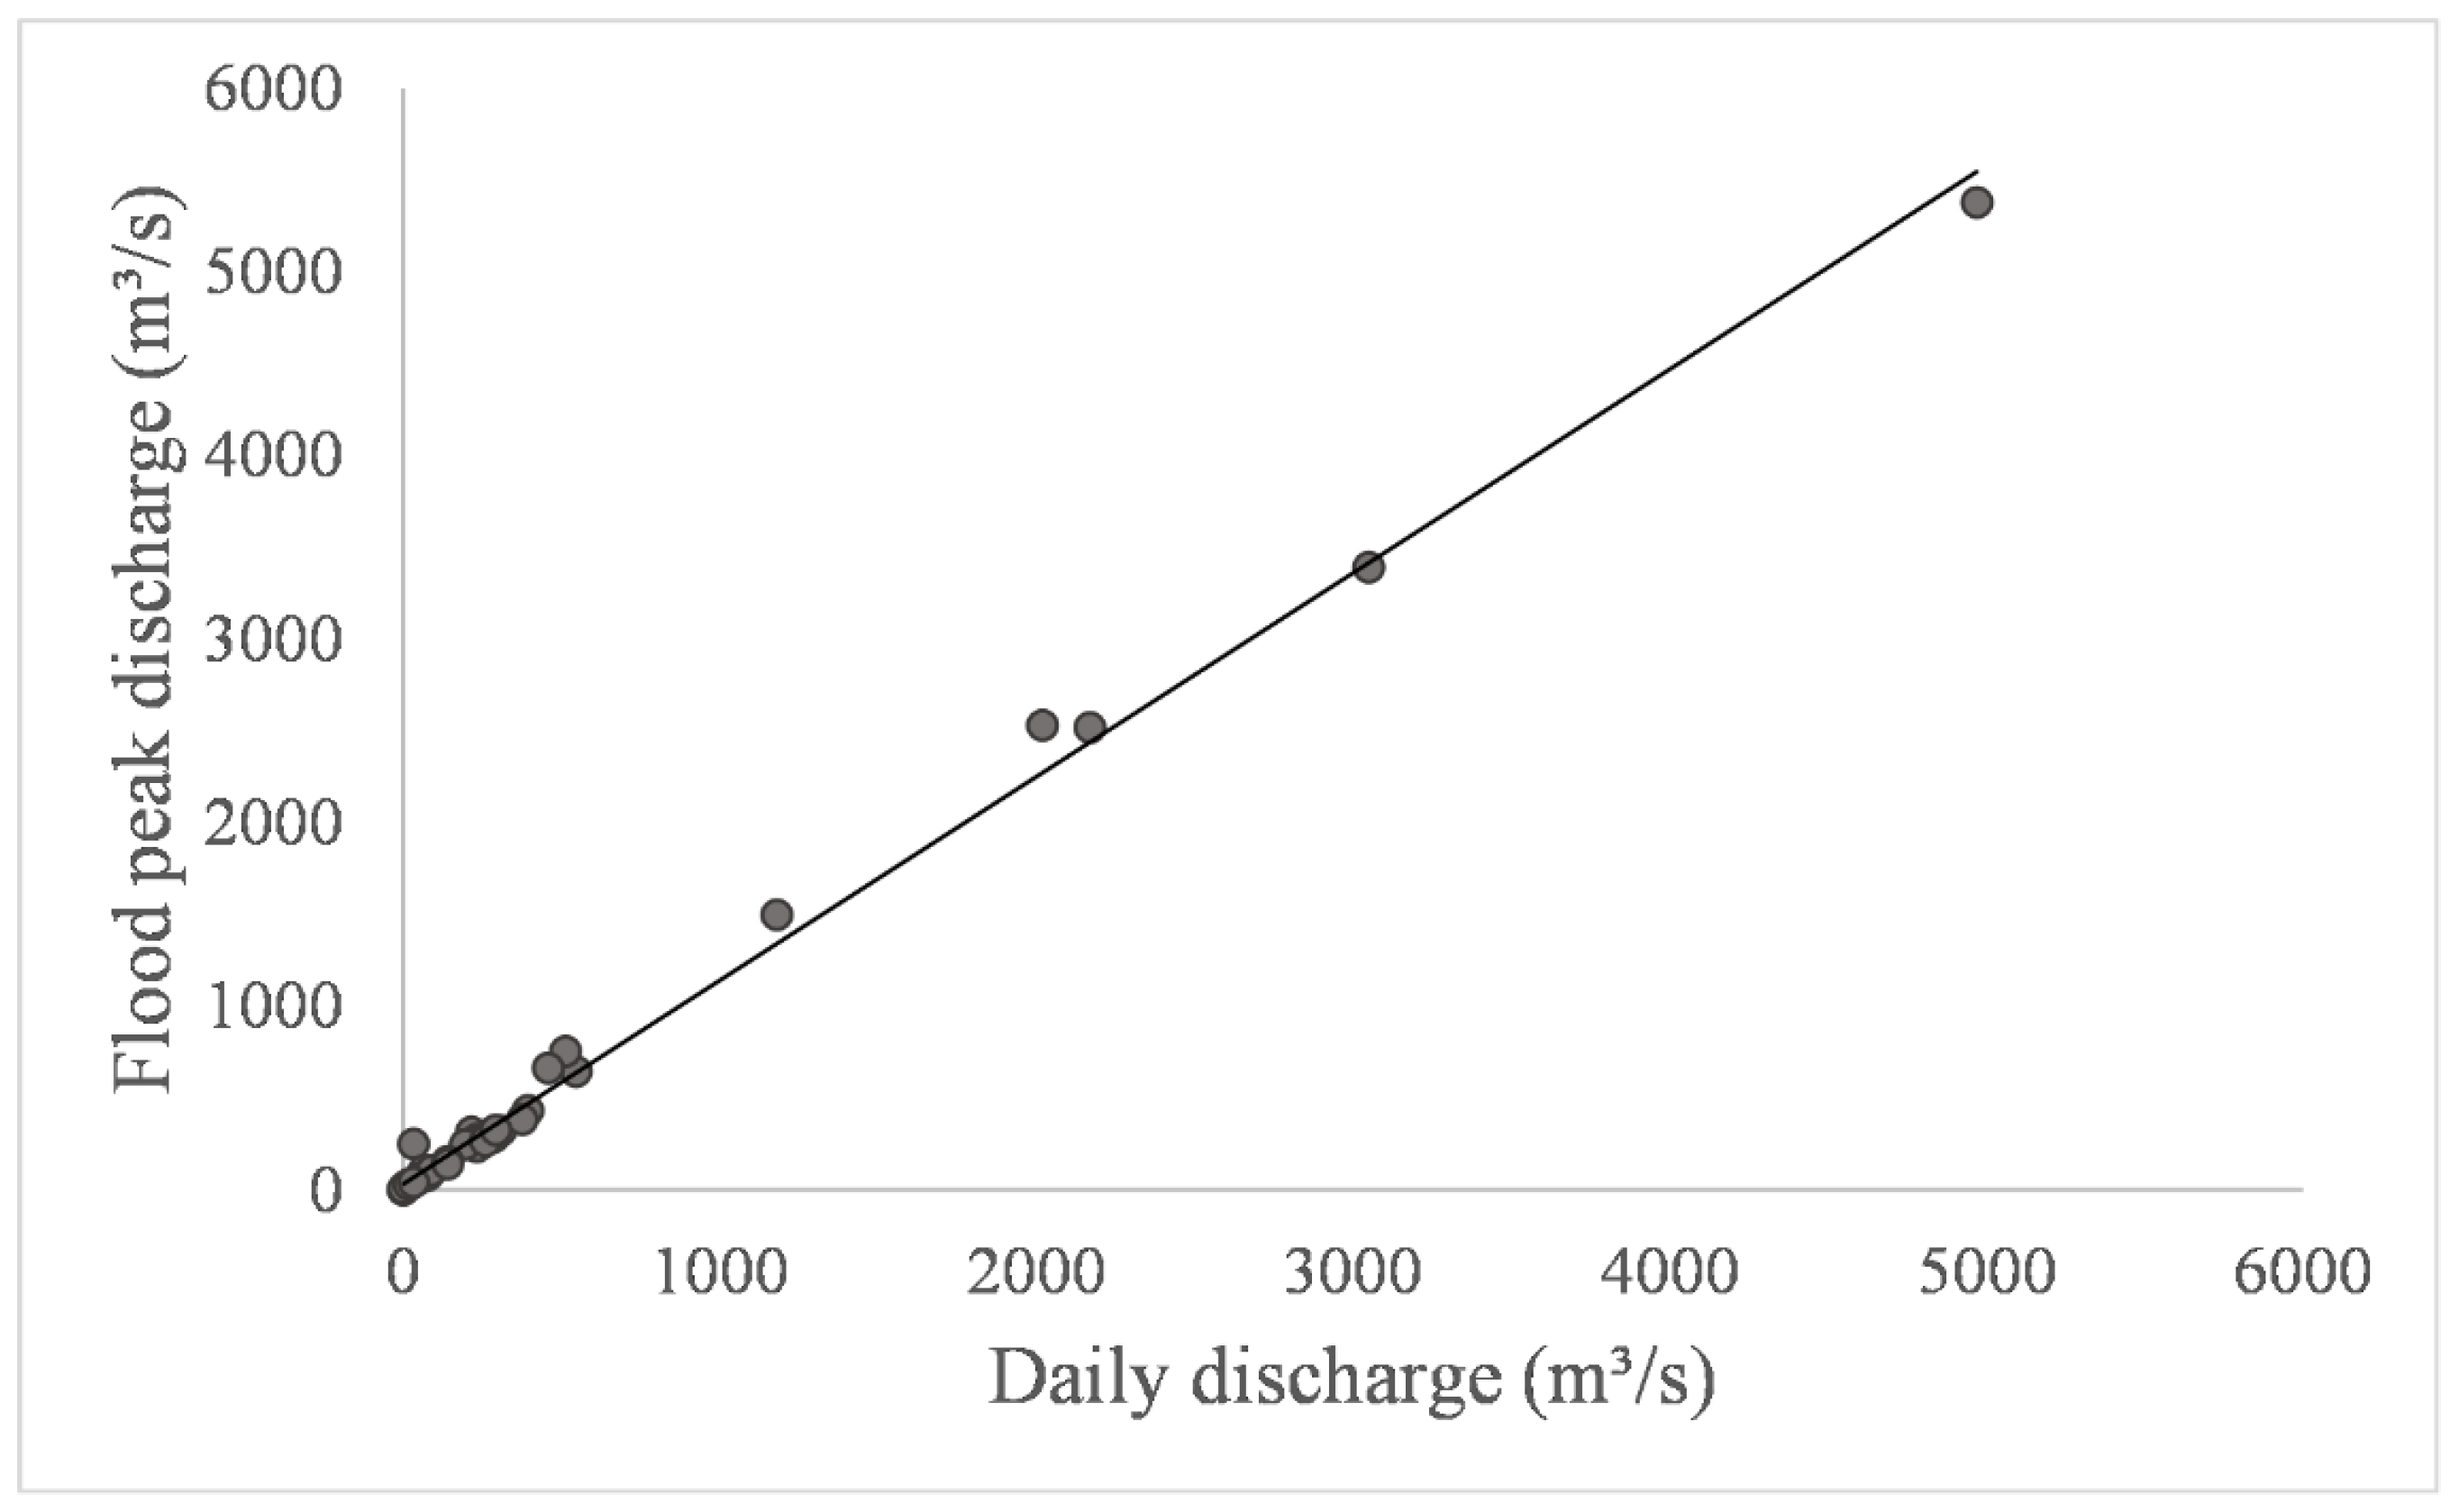
Depending on the degree of the impact of floods on socio-economic factors and the relationship between flood peak discharge and daily discharge, the current maximum discharge of the Zhulong River watershed is defined as the first level of early flood warning, which corresponds to a daily discharge with a return period of about 35 to 60 years, while the second, third and fourth level of flood warning is selected as the daily discharge with a return period of 30, 20 and 10 years, respectively;
(2)
When the preceding one-day areal rainfall in the Zhulong River watershed reaches 10 mm, then the river generates surface runoff. According to whether surface runoff is formed in the river channel, precipitation–discharge relationship models are developed and the goodness of fit of both models is high with the coefficients of determination, R2, of 0.79 and 0.83, respectively;
(3)
The 1-day critical areal rainfall amounts for early flood warnings are 31 mm, 63 mm, 92 mm and 160 mm for level IV, level III, level II and level I warnings, respectively, when the preceding one-day areal rainfall is ≤10 mm. When the preceding one-day areal rainfall is >10 mm, the 1-day critical areal rainfall amounts are 20 mm, 54 mm, 87 mm and 160 mm for each level of early flood warning, respectively. The differences between the 1-day critical areal rainfall established under the two river pre-precipitation conditions get smaller as the flood warning level increases;
(4)
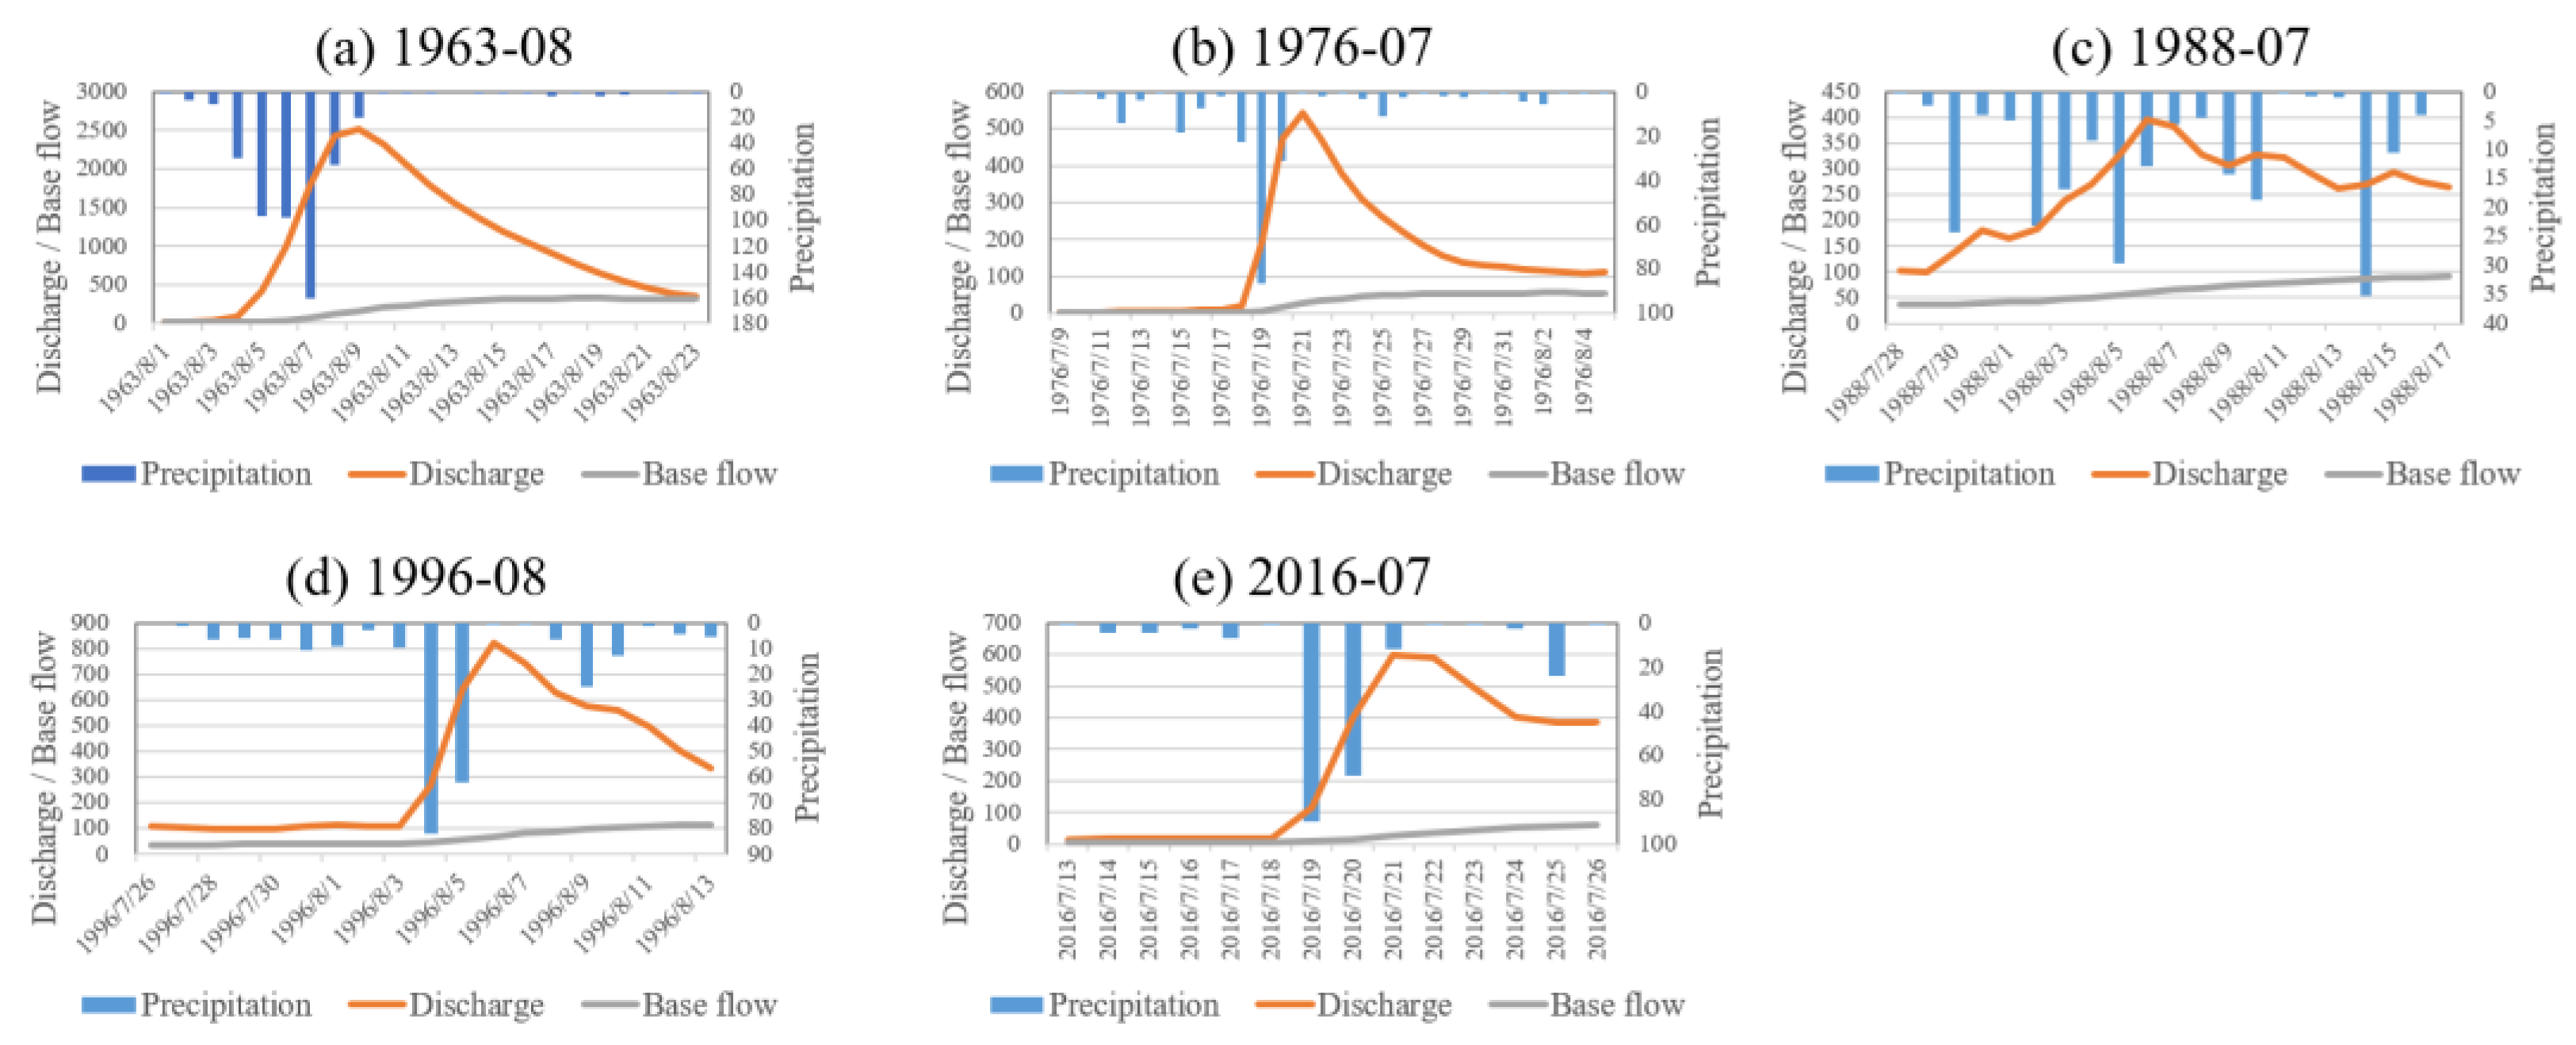
The early warning effectiveness of the established graded flood warning of critical areal rainfall was verified by using the historical flood event data in the Zhulong River watershed and the precipitation data from recent years. None of the warnings were missed or underestimated by the model, and the early warning accuracy rate is very high.
In this study, the impact-based critical areal rainfall for graded flood warnings for small and medium rivers is determined and the implementation steps are suggested using the upper reaches of the Zanlong River basin in Xiong’an New Area as a case study. The determined flood warning indexes only require precipitation information routinely monitored by the meteorological department, which is more convenient for the development and application of flood risk warnings and the assessment by the meteorological department, and can be applied to more small- and medium-sized rivers in the future. In addition, the disaster impact-oriented early warning methodology proposed in this study could be further used in future research on flash floods, landslides, heatwaves, droughts, ex-treme weather and air pollution events [50,51,52,53,54] to contribute to an integrated disaster risk management.

Author Contributions

Conceptualization, L.S., X.C. and Y.W.; methodology, T.Z.; software, Z.C.; validation, T.Z., Z.C. and B.W.; investigation, Y.W. and Z.C.; data curation, L.S. and Y.W.; writing—original draft preparation, L.S., X.C. and Y.W.; writing—review and editing, L.S., L.Z., Z.C., X.C., T.Z., W.X., B.W. and Y.W.; visualization, Z.C. and B.W.; supervision, X.C. and Y.W.; project administration, L.S., X.C. and Y.W.; funding acquisition, L.S., X.C. and Y.W. All authors have read and agreed to the published version of the manuscript.

Funding

This research was funded by the Key Project of Hebei Province’s 13th Five-Year Plan (2020032540), the Guangxi Key Research and Development Program (Grant No. Guike AB22080060) and the Startup Foundation for Introducing Talent of NUIST.

Institutional Review Board Statement

Not applicable.

Informed Consent Statement

Not applicable.

Data Availability Statement

Thanks to the Hebei Provincial Water Resources Department and the National Meteorological Information Center for providing datasets.

Conflicts of Interest

The authors declare no conflict of interest.

References

  1. UNDRR. The Human Cost of Disasters: An Overview of the Last 20 Years (2000–2019). 2020. Available online: https://www.undrr.org/publication/human-cost-disasters-overview-last-20-years-2000-2019 (accessed on 1 October 2022).
  2. Arias, P.; Bellouin, N.; Coppola, E.; Jones, R.; Krinner, G.; Marotzke, J.; Naik, V.; Palmer, M.; Plattner, G.-K.; Rogelj, J.; et al. Climate Change 2021: The Physical Science Basis. Contribution of Working Group14 I to the Sixth Assessment Report of the Intergovernmental Panel on Climate Change. Technical Summary; Masson-Delmotte, V., Zhai, P., Pirani, A., Conners, S.L., Péan, C., Berger, S., Caud, N., Chen, Y., Goldfarb, L., Gomis, M.I., et al., Eds.; Cambridge University Press: Cambridge, UK, 2021. [Google Scholar]
  3. Jiang, T.; Su, B.; Huang, J.; Zhai, J.; Xia, J.; Tao, H.; Wang, Y.; Sun, H.; Luo, Y.; Zhang, L.; et al. Each 0.5 °C of warming increases annual flood losses in China by more than US $60 billion. Bull. Am. Meteorol. Soc. 2020, 101, E1464–E1474. [Google Scholar] [CrossRef] [Green Version]
  4. Duan, W.; He, B.; Nover, D.; Fan, J.; Yang, G.; Chen, W.; Meng, H.; Liu, C. Floods and associated socioeconomic damages in China over the last century. Nat. Hazards 2016, 82, 401–413. [Google Scholar] [CrossRef]
  5. Guan, Y.; Zheng, F.; Zhang, P.; Qin, C. Spatial and temporal changes of meteorological disasters in China during 1950–2013. Nat. Hazards 2015, 75, 2607–2623. [Google Scholar] [CrossRef]
  6. Ministry of Water Resources of the People’s Republic of China. Flood and Drought Disasters in China’s Bulletin 2018; China Water & Power Press: Beijing, China, 2019. [Google Scholar]
  7. Wu, J.; Han, G.; Zhou, H.; Li, N. Economic development and declining vulnerability to climate-related disasters in China. Environ. Res. Lett. 2018, 13, 034013. [Google Scholar] [CrossRef]
  8. Fang, J.; Zhang, C.; Fang, J.; Liu, M.; Luan, Y. Increasing exposure to floods in China revealed by nighttime light data and flood susceptibility mapping. Environ. Res. Lett. 2021, 16, 104044. [Google Scholar] [CrossRef]
  9. Su, B.; Huang, J.; Fischer, T.; Wang, Y.; Kundzewicz, Z.W.; Zhai, J.; Sun, H.; Wang, A.; Zeng, X.; Wang, G.; et al. Drought losses in China might double between the 1.5 C and 2.0 C warming. Proc. Natl. Acad. Sci. USA 2018, 115, 10600–10605. [Google Scholar] [CrossRef] [Green Version]
  10. Wang, Y.; Wang, A.; Zhai, J.; Tao, H.; Jiang, T.; Su, B.; Yang, J.; Wang, G.; Liu, Q.; Gao, C.; et al. Tens of thousands additional deaths annually in cities of China between 1.5 C and 2.0 C warming. Nat. Commun. 2019, 10, 3376. [Google Scholar] [CrossRef] [Green Version]
  11. Miao, L.; Zhang, J.; Kattel, G.R.; Liu, R. Increased Exposure of China’s Cropland to Droughts under 1.5 °C and 2 °C Global Warming. Atmosphere 2022, 13, 1035. [Google Scholar] [CrossRef]
  12. Lin, Q.; Steger, S.; Pittore, M.; Zhang, J.; Wang, L.; Jiang, T.; Wang, Y. Evaluation of potential changes in landslide susceptibility and landslide occurrence frequency in China under climate change. Sci. Total Environ. 2022, 850, 158049. [Google Scholar] [CrossRef]
  13. Zhang, Y.; Wang, Y.; Chen, Y.; Xu, Y.; Zhang, G.; Lin, Q.; Luo, R. Projection of changes in flash flood occurrence under climate change at tourist attractions. J. Hydrol. 2021, 595, 126039. [Google Scholar] [CrossRef]
  14. Younis, J.; Anquetin, S.; Thielen, J. The benefit of high-resolution operational weather forecasts for flash flood warning. Hydrol. Earth Syst. Sci. 2008, 12, 1039–1051. [Google Scholar] [CrossRef] [Green Version]
  15. Blöschl, G. Flood warning-on the value of local information. Int. J. River Basin Manag. 2008, 6, 41–50. [Google Scholar] [CrossRef]
  16. Yuan, W.; Liu, M.; Wan, F. Calculation of critical rainfall for small-watershed flash floods based on the HEC-HMS hydrological model. Water Resour. Manag. 2019, 33, 2555–2575. [Google Scholar] [CrossRef]
  17. Miao, Q.; Yang, D.; Yang, H.; Li, Z. Establishing a rainfall threshold for flash flood warnings in China’s mountainous areas based on a distributed hydrological model. J. Hydrol. 2016, 541, 371–386. [Google Scholar] [CrossRef]
  18. Jiao, M.; Song, L.; Jiang, T.; Zhai, J. China’s implementation of impact and risk-based early warning. Boletín-Organ. Meteorológica Mund. 2015, 64, 11–14. [Google Scholar]
  19. Hao, Z.; Xiong, D.; Ge, Q. Reconstruction of the chronology and characteristics of flood disasters in the Xiong. Chin. Sci. Bull. 2018, 63, 2302–2310, (In Chinese with English Abstract). [Google Scholar] [CrossRef] [Green Version]
  20. Wang, Y.; Song, L.; Han, Z.; Liao, Y.; Xu, H.; Zhai, J.; Zhu, R. Climate-related risks in the construction of Xiongan New Area, China. Theor. Appl. Climatol. 2020, 141, 1301–1311. [Google Scholar] [CrossRef]
  21. Wu, F.; Guo, N.; Kumar, P.; Niu, L. Scenario-based extreme flood risk analysis of Xiong’an New Area in northern China. J. Flood Risk Manag. 2021, 14, e12707. [Google Scholar] [CrossRef]
  22. Huang, D.; Liao, Y.; Han, Z. Projection of key meteorological hazard factors in Xiongan new area of Hebei Province, China. Sci. Rep. 2021, 11, 18675. [Google Scholar] [CrossRef]
  23. Hao, Z.; Xiong, D.; Zheng, J. Flood disasters and social resilience during the decline of the Qing Dynasty: Case studies of 1823 and 1849. Hydrol. Process. 2021, 35, e14295. [Google Scholar] [CrossRef]
  24. Editorial Committee of China Meteorological Disasters Dictionary. China Meteorological Disasters Dictionary—Hebei Volume; China Meteorological Press: Beijing, China, 2007. [Google Scholar]
  25. Eum, H.I.; Gupta, A. Hybrid climate datasets from a climate data evaluation system and their impacts on hydrologic simulations for the Athabasca River basin in Canada. Hydrol. Earth Syst. Sci. 2019, 23, 5151–5173. [Google Scholar] [CrossRef]
  26. Guo, B.; Zhang, J.; Meng, X.; Xu, T.; Song, Y. Long-term spatial-temporal precipitation variations in China with precipitation surface interpolated by ANUSPLIN. Sci. Rep. 2020, 10, 81. [Google Scholar] [CrossRef] [PubMed] [Green Version]
  27. Kuo, C.C.; Gan, T.Y.; Wang, J. Climate change impact to Mackenzie river basin projected by a regional climate model. Clim. Dyn. 2020, 54, 3561–3581. [Google Scholar] [CrossRef]
  28. Li, H.; Beldring, S.; Xu, C.Y. Implementation and testing of routing algorithms in the distributed Hydrologiska Byråns Vattenbalansavdelning model for mountainous catchments. Hydrol. Res. 2014, 45, 322–333. [Google Scholar] [CrossRef] [Green Version]
  29. Worqlul, A.W.; Yen, H.; Collick, A.S.; Tilahun, S.A.; Langan, S.; Steenhuis, T.S. Evaluation of CFSR, TMPA 3B42 and ground-based rainfall data as input for hydrological models, in data-scarce regions: The upper Blue Nile Basin, Ethiopia. Catena 2017, 152, 242–251. [Google Scholar] [CrossRef]
  30. Smith, B.; Sandwell, D. Accuracy and resolution of shuttle radar topography mission data. Geophys. Res. Lett. 2003, 30. [Google Scholar] [CrossRef] [Green Version]
  31. Mukul, M.; Srivastava, V.; Jade, S.; Mukul, M. Uncertainties in the shuttle radar topography mission (SRTM) Heights: Insights from the indian Himalaya and Peninsula. Sci. Rep. 2017, 7, 41672. [Google Scholar] [CrossRef] [Green Version]
  32. Eckhardt, K. How to construct recursive digital filters for baseflow separation. Hydrol. Process. Int. J. 2005, 19, 507–515. [Google Scholar] [CrossRef]
  33. Eckhardt, K. Analytical sensitivity analysis of a two parameter recursive digital baseflow separation filter. Hydrol. Earth Syst. Sci. 2012, 16, 451–455. [Google Scholar] [CrossRef] [Green Version]
  34. Yang, W.; Xiao, C.; Zhang, Z.; Liang, X. Can the two-parameter recursive digital filter baseflow separation method really be calibrated by the conductivity mass balance method? Hydrol. Earth Syst. Sci. 2021, 25, 1747–1760. [Google Scholar] [CrossRef]
  35. Zhang, Y.; Zou, Y.; Wang, X.; Zhang, P.; Xu, W. Flash Flood Warning Assessment Considering Temporal Differences. Adv. Eng. Sci. 2021, 53, 10–18, (In Chinese with English Abstract). [Google Scholar]
  36. Ripberger, J.T.; Silva, C.L.; Jenkins-Smith, H.C.; Carlson, D.E.; James, M.; Herron, K.G. False alarms and missed events: The impact and origins of perceived inaccuracy in tornado warning systems. Risk Anal. 2015, 35, 44–56. [Google Scholar] [CrossRef] [PubMed]
  37. Barnes, L.R.; Gruntfest, E.C.; Hayden, M.H.; Schultz, D.M.; Benight, C. False alarms and close calls: A conceptual model of warning accuracy. Weather Forecast. 2007, 22, 1140–1147. [Google Scholar] [CrossRef]
  38. Trainor, J.E.; Nagele, D.; Philips, B.; Scott, B. Tornadoes, social science, and the false alarm effect. Weather Clim. Soc. 2015, 7, 333–352. [Google Scholar] [CrossRef]
  39. Yang, P.; Xu, Z.; Yan, X.; Wang, X.K. Comparative study on methods of early warning index of flash flood disaster induced by rainstorm. Adv. Eng. Sci. 2020, 52, 157–165, (In Chinese with English Abstract). [Google Scholar]
  40. Wang, X.K.; Yang, P.; Sun, T.; Xu, Z. Study on division early warning of flash flood disaster caused by rainstorm in mountainous small watersheds. Adv. Eng. Sci. 2021, 53, 29–38, (In Chinese with English Abstract). [Google Scholar]
  41. Ma, M.; Wang, H.; Jia, P.; Tang, G.; Wang, D.; Ma, Z.; Yan, H. Application of the GPM-IMERG Products in Flash Flood Warning: A Case Study in Yunnan, China. Remote Sens. 2020, 12, 1954. [Google Scholar] [CrossRef]
  42. Llauca, H.; Lavado-Casimiro, W.; León, K.; Jimenez, J.; Traverso, K.; Rau, P. Assessing near real-time satellite precipitation products for flood simulations at sub-daily scales in a sparsely gauged watershed in Peruvian andes. Remote Sens. 2021, 13, 826. [Google Scholar] [CrossRef]
  43. Yang, Q.; Liu, T.; Zhai, J.; Wang, X.K. Numerical Investigation of a Flash Flood Process that Occurred in Zhongdu River, Sichuan, China. Front. Earth Sci. 2021, 9, 686925. [Google Scholar] [CrossRef]
  44. Yang, Q.; Wang, X.K.; Sun, Y.; Duan, W.; Xie, S. Numerical investigation on a flash flood disaster in streams with confluence and bifurcation. Water 2022, 14, 1646. [Google Scholar] [CrossRef]
  45. Young, A.; Bhattacharya, B.; Zevenbergen, C. A rainfall threshold-based approach to early warnings in urban data-scarce regions: A case study of pluvial flooding in Alexandria, Egypt. J. Flood Risk Manag. 2021, 14, e12702. [Google Scholar] [CrossRef]
  46. Taguas, E.V.; Ayuso, J.L.; Pena, A.; Yuan, Y.; Sanchez, M.C.; Giraldez, J.V.; Pérez, R. Testing the relationship between instantaneous peak flow and mean daily flow in a Mediterranean Area Southeast Spain. Catena 2008, 75, 129–137. [Google Scholar] [CrossRef]
  47. Ding, J.; Wallner, M.; Müller, H.; Haberlandt, U. Estimation of instantaneous peak flows from maximum mean daily flows using the HBV hydrological model. Hydrol. Process. 2016, 30, 1431–1448. [Google Scholar] [CrossRef]
  48. Chen, B.; Krajewski, W.F.; Liu, F.; Fang, W.; Xu, Z. Estimating instantaneous peak flow from mean daily flow. Hydrol. Res. 2017, 48, 1474–1488. [Google Scholar] [CrossRef]
  49. Pan, T.Y.; Li, M.Y.; Lin, Y.J.; Chang, T.J.; Lai, J.S.; Tan, Y.C. Sensitivity analysis of the hydrological response of the Gaping River basin to radar-raingauge quantitative precipitation estimates. Hydrol. Sci. J. 2014, 59, 1335–1352. [Google Scholar] [CrossRef] [Green Version]
  50. Zhang, J.; Gong, D.-Y.; Mao, R.; Yang, J.; Zhang, Z.; Qian, Y. Anomalous holiday precipitation over southern China. Atmos. Chem. Phys. 2018, 18, 16775–16791. [Google Scholar] [CrossRef] [Green Version]
  51. Lin, Q.; Lima, P.; Steger, S.; Glade, T.; Jiang, T.; Zhang, J.; Liu, T.; Wang, Y. National-scale data-driven rainfall induced landslide susceptibility mapping for China by accounting for incomplete landslide data. Geosci. Front. 2021, 12, 101248. [Google Scholar] [CrossRef]
  52. Wang, C.; Lin, Q.; Wang, L.; Jiang, T.; Su, B.; Wang, Y.; Mondal, S.K.; Huang, J.; Wang, Y. The influences of the spatial extent selection for non-landslide samples on statistical-based landslide susceptibility modelling: A case study of Anhui Province in China. Nat. Hazards 2022, 112, 1967–1988. [Google Scholar] [CrossRef]
  53. Wang, L.; Rohli, R.V.; Lin, Q.; Jin, S.; Yan, X. Impact of Extreme Heatwaves on Population Exposure in China Due to Additional Warming. Sustainability 2022, 14, 11458. [Google Scholar] [CrossRef]
  54. Huang, J.; Mondal, S.K.; Zhai, J.; Fischer, T.; Wang, Y.; Su, B.; Wang, G.; Gao, M.; Jiang, S.; Tao, H.; et al. Intensity-area-duration-based drought analysis under 1.5 °C–4.0 °C warming using CMIP6 over a climate hotspot in South Asia. J. Clean. Prod. 2022, 345, 131106. [Google Scholar] [CrossRef]
Figure 1. Study area and hydrological and meteorological stations.
Atmosphere 14 00113 g001
Figure 2. The methodological framework performed in this study.
Atmosphere 14 00113 g002
Figure 3. The relationship between flood peak discharge and daily discharge during the flooding events.
Atmosphere 14 00113 g003
Figure 4. Relationships between daily rainfall and daily discharge during the main flood episodes in the Zhulong river watershed.
Atmosphere 14 00113 g004
Table 1. Daily discharges and the corresponding flood peak discharge in different return periods in the Zhulong river watershed (m3/s).
Return PeriodEarly Flood
Warning Level
Daily DischargeFlood Peak
Discharge
10-yearIV380450
20-yearIII700805
30-yearII10001138
50-year——15001693
100-year——26002914
200-year——45005023
Current maximum dischargeI17002000
Design flood discharge——51005700
Table 2. Characteristics of daily discharge and baseflow in the Zhulong river watershed (m3/s).
Average Daily DischargeAverage Daily BaseflowBaseflow
June to September
Baseflow
October to May
24.712.219.18.7
Table 3. The 1-day areal rainfall thresholds for early flood warnings (mm).
Warning LevelsIVIIIIII
The preceding one-day areal rainfall ≤ 10 mm316392160
The preceding one-day areal rainfall > 10 mm205487160
Table 4. Validation results of the historical flood event warnings in the Zhulong river watershed.
Flooding ProcessFirst Alerting DatePreceding One-Day Areal Rainfall24 h Critical Areal RainfallWarning LevelsWarning EffectivenessCorrectCorrect Rate
August 19634 August 19639.151.2IVOne day in advanceTrue100%
August 19964 August 19969.681.7IIITow day in advanceTrue100%
July 201619 July 20160.389.9IIIOne day in advanceTrue100%
July–August 201811 July 20181.335.8IVThe same dayTrue100%
July–August 201929 July 201921.633.9IVThe same dayTrue100%
Table 5. Validation of the 2016 July flood warning in the Zhulong river watershed.
Date1-Day Critical Areal Rainfall (mm)Daily Discharge (m3/s)Model AlertsValidation
11 July 20160.011.0NoneCorrect
12 July 201622.014.1NoneCorrect
13 July 20160.015.6NoneCorrect
14 July 20164.317.0NoneCorrect
15 July 20164.517.5NoneCorrect
16 July 20162.817.7NoneCorrect
17 July 20167.019.3NoneCorrect
18 July 20160.319.4NoneCorrect
19 July 201689.9116.6III level warningCorrect (overestimated warning, one day in advance)
20 July 201669.2399.1III level warningCorrect (overestimated warning)
21 July 201611.7599.6
Disclaimer/Publisher’s Note: The statements, opinions and data contained in all publications are solely those of the individual author(s) and contributor(s) and not of MDPI and/or the editor(s). MDPI and/or the editor(s) disclaim responsibility for any injury to people or property resulting from any ideas, methods, instructions or products referred to in the content.

