1. Introduction
The radiations in the atmosphere, created by cosmic rays, are serious threats to civil aviation [
1]. In the atmospheric radiation environment, there is a high flux of various energetic particles, including neutrons, protons, and pion [
2]. The radiations are not only harmful to the crews [
3] but could also cause damage to the electronic equipment on board civil aircraft [
4]. The impact of these high-energy particles on aircraft system electronic components is called the Single Event Effects (SEE). At the altitude of civil aviation, neutrons are of the main concern [
5]. SEE contains various fault conditions, such as hazardous misleading information and system failure in avionics equipment. The conditions might mislead signals instantaneously or alter the physical layer permanently, resulting in the loss of a component or function [
6].
With the rapid development of aircraft avionics in recent years, the scale of electronic circuits in aircraft exhibits geometric growth. Meanwhile, the electronic computing components are highly integrated in aircraft system equipment, and the operation logic is getting more and more complex. All of these lead to a higher occurrence of single events [
7], especially in the high-latitude and high-altitude civil aviation routes where many high-energy particles are present. The influence of high-energy particles in the atmosphere on the safety design of civil aircraft should receive more attention [
8].
In the development of newly designed civil aircraft, the SEE analysis is recommended to be taken into consideration in system safety design as aircraft level requirements [
9]. However, in the preliminary preparations for the first flight of newly designed aircraft, safety risks caused by SEE have emerged, which could affect the aircraft’s flight altitude. For the consideration of system safety, particular risk analysis research on SEE should be performed. A standard of the International Electrotechnical Commission (IEC) has given the profile of the neutron flux at 45° N in the form of tables [
10]. Nevertheless, in the preparation phase of the first flight, it is difficult to perform the safety assessment by calculating the failure rate of equipment caused by atmospheric radiation due to the lack of detection data of atmospheric neutron flux in the flight environment. There were limited ways to detect the radiation background at low cost [
11].
To study the radiation background, some theoretical methods based on Monte Carlo simulation were also developed [
12,
13], and dedicated detectors for radiation detection were explored [
14,
15].
In the former research on radiation dose on the aircrews, detection of the dose rate on board carried by aircraft has been studied [
16,
17]. In the framework of the CONCORD, dose rates in the radiation field at aviation altitudes were obtained with several instruments on board during joint flights [
17]. Based on the measurements performed on flights with an altitude of 40,000 and 32,000 ft in narrow target areas between 42° N and 57° N, the relationship between the dose equivalent rate and its dose components onboard aircraft has been researched [
18].
In the safety assessment of civil aircraft development such as the first flight, the requirement for radiation environment data is the profile of the neutron flux (1–10 MeV) of the place where the aircraft would take off. To get the vertical distribution of the neutron flux, there are three ways to carry the radiation detector to perform in situ detection: rocket [
19], unmanned aerial vehicle [
20], and sounding balloon [
21]. Apparently, compared with the former two means, balloons are low cost and convenient to operate [
22,
23].
In this paper, we propose a new method of detecting atmospheric neutron radiation profile covering the altitude of civil aviation, aiming to polish an important element in SEE analysis of civil aircraft with low cost and convenience. The instruments and procedure used in this method are described in
Section 2.
Section 3 introduces the two experiments implemented in Northwest China. Observational results and concluding remarks are given in
Section 4 and
Section 5, respectively.
2. Detection Method
In order to perform SEE analysis, the profile of atmospheric neutron flux needs to be detected. Since the lack of effective remote sensing means to detect the neutron flux and the limitation of the experiment cost, we proposed the new method for in situ measurements of the vertical distribution of atmospheric neutron flux at low cost. The equipment consists of the radiosonde system and one nuclear radiometer. In this method, the radiation dose could be observed by the nuclear radiation detector. The profile of the atmospheric neutron flux could be derived from the basis of the conversion equation between the radiation dose and the neutron flux.
2.1. Equipment
The atmospheric high-energy particles are generally detected in the form of field experiments using high-energy particle detection equipment carried by rockets, airplanes, airships, or other carriers in the atmosphere. Then the profile of high-energy particle parameters with height is derived through detection data analysis.
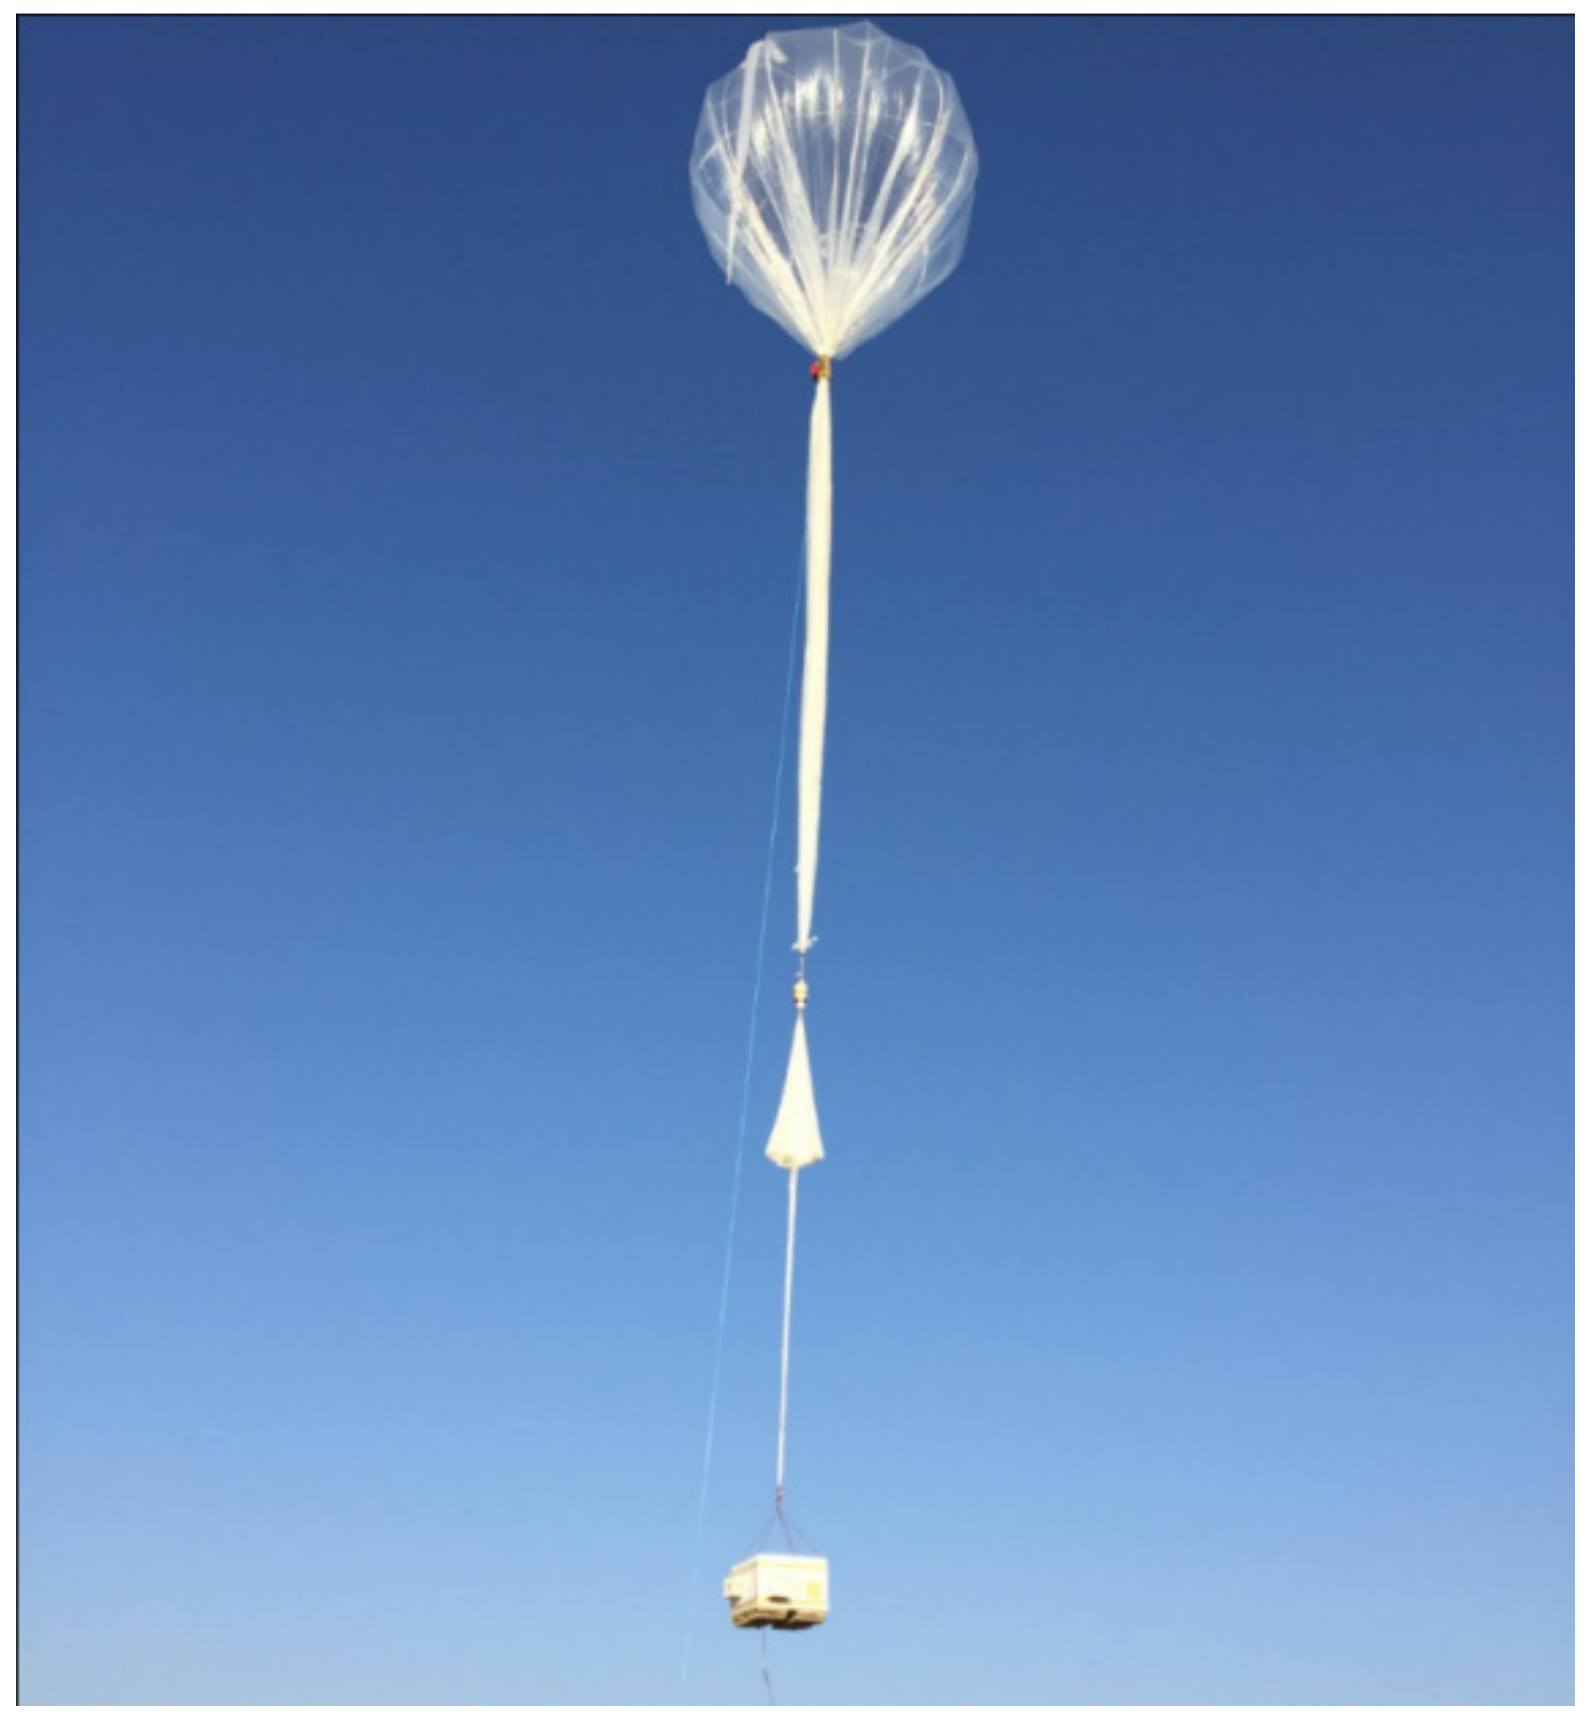
In the detection, constrained by the expense, the lowest cost-choice for the carrier can be selected as the radiosonde system. The radiosonde system is an important tool for measuring and studying the high-altitude stratospheric atmosphere. It is mainly composed of a sounding balloon and a ground receiver, as shown in
Figure 1.
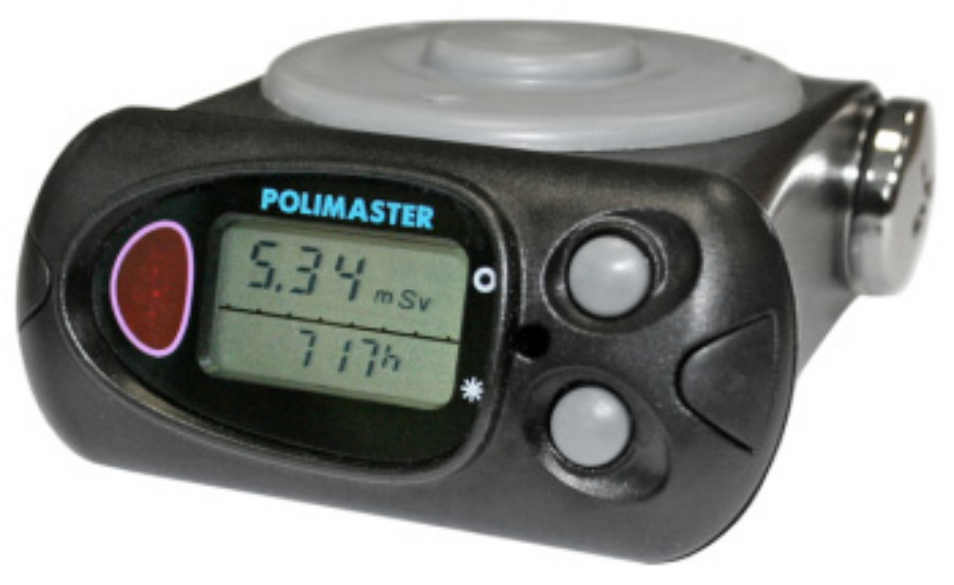
In high-energy particle detection, high-energy particle mass spectrometer is generally used, but it is difficult for high-altitude detection in practical space detection because of its huge size and high price. Instead of the mass spectrometer, the high-energy particle detector used in the method is a nuclear radiometer, as shown in
Figure 2. The specifications of the nuclear radiometer are shown in
Table 1. This nuclear radiometer could provide detection of the radiation dose situation all day. Not only environmental pollution, but also the cumulative value and change rate of radiation dose could be monitored with a wide detection range and proper detection accuracy. Since the nuclear radiometer is much smaller than a high-energy particle mass spectrometer in size, it can conveniently be carried by the radiosonde balloon.
2.2. Detection Procedure
The neutron flux detection procedure is shown below:
Step 1: The radiation detector shown in
Figure 2 is placed into an equipment cabin consisting of a well-grooved foam box with a GPS device. Then the communication equipment inside can be connected, and the reception of signals checked. Finally, the equipment cabin containing the instruments should be sealed and connected to the sounding balloon. After the balloon is filled with helium, it is ready to launch.
Step 2: The balloon is released, and the detection devices carried in the cabin detect the dose equivalent and dose-equivalent rate along the flight path.
Step 3: The atmospheric radiation dose data and altitude data are exported from the recycled detector.
Step 4: According to the conversion relationship of data process, the neutron flux at each altitude can be calculated with the radiation dose rate.
2.3. Data Process
In the safety analysis of civil aircraft design, the major requirement for radiation environment data is the neutron flux (1–10 MeV). The energy spectrum is not very important. It would be a convenient way to use the dose rate to deduce the neutron flux ranging from 1 to 10 MeV. However, it is difficult to use the dose to get flux without any assumptions of energy spectrum. Based on the assumption of analytic energy spectrum, the data-processing method is derived by modifying the flux-dose conversion relationship.
According to the research on unitied conversion function [
24], the radiation dose at monoenergetic energy can be converted into the neutron flux. The conversion function of radiation dose equivalent rate and neutron flux
ϕ is described in Equation (1),
where
x stands for the natural logarithm of electron volts in eV,
,
,
,
,
,
,
, j = 93.3, and
.
In this case, with the input of the longitude and latitude of the experiment location, typical energy spectrum at the altitude of 15 km could be obtained by the model EXPACS [
25]. Using the Equation (1) in the paper, the coefficient H*(10)/flux variation with energy could be obtained. Since the energy range of the detector is 10 keV–20 MeV, the flux varies with energy in the range 0.01–20 MeV and the coefficient H*(10)/flux varies with energy in the range 0.01–20 MeV, as shown in
Figure 3. The dash-lines in both figures are E = 1 MeV and E = 10 MeV respectively.
From
Figure 3a,b, the low energy part for which energy is lower than 1 MeV could be ignored for the low flux and little contribution to the dose rate. For the part (E > 1 MeV) in the
Figure 3a, we can see the whole energy spectrum could be approximately viewed as uniform distribution. For the part (E > 1 MeV) in the
Figure 3b, the coefficient and energy could be viewed as a linear relationship so that we can take the coefficient at 10 MeV as the average value to convert the dose rate to total flux. To get the flux in the range 1–10 MeV, the radiation weight (1–10 MeV) is employed. The flux in the range 1–10 MeV is obtained by Equation (2).
where
is the flux in the range of 1–10 MeV,
is the coefficient
H*(10)/flux at the energy E = 10 MeV,
is the radiation weight factor of 1–10 MeV in total flux (0.01–20 MeV) which could be derived from the energy spectrum in
Figure 3a.
3. Detection Experiment
On the day of releasing the radiosonde balloon, the detection device was taken to the designated location and then packed in a foam box in the equipment cabin, which was tied to the balloon with a rope. Nine bottles of 35 kg helium were thereafter pumped into the 1000-cubic-metre balloon.
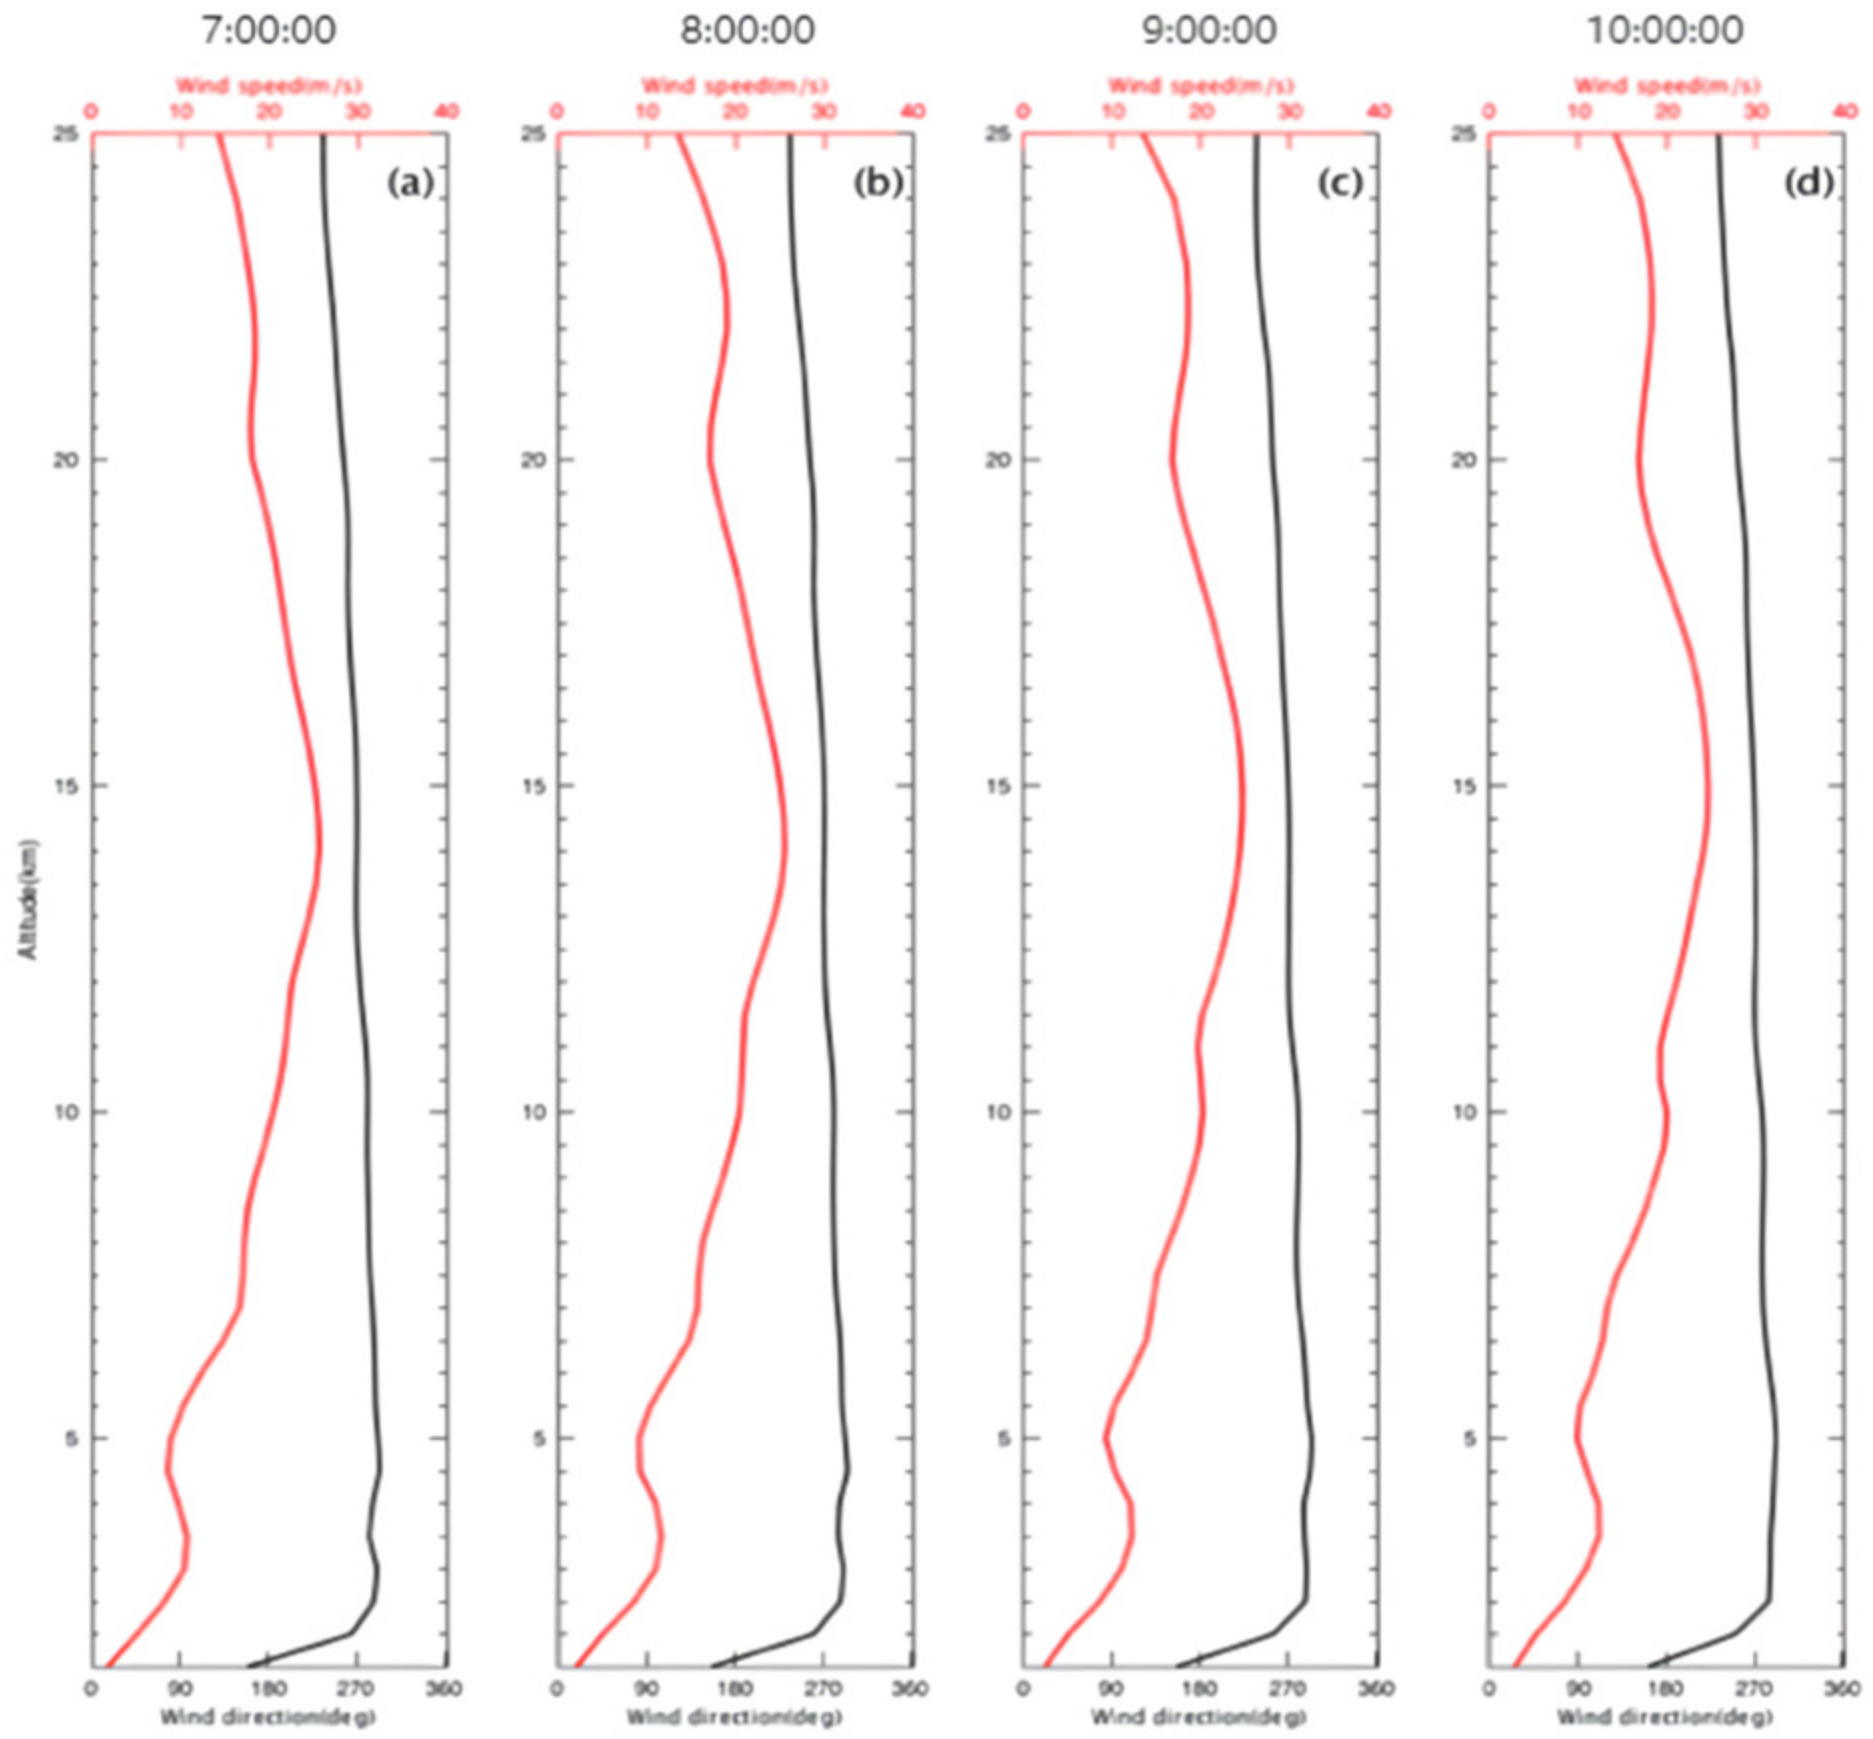
For the recycling of the experiment equipment, the location where the detection equipment would land should be determined by a sounding balloon with wind measurements. Therefore, before the launch of the sounding balloon carrying the radiation detector, one sounding balloon with GPS was released. On the basis of both the flying time of the sounding balloon and the wind profile obtained by the weather report (as shown in
Figure 4), we can ascertain the location where the detection equipment would be recycled.
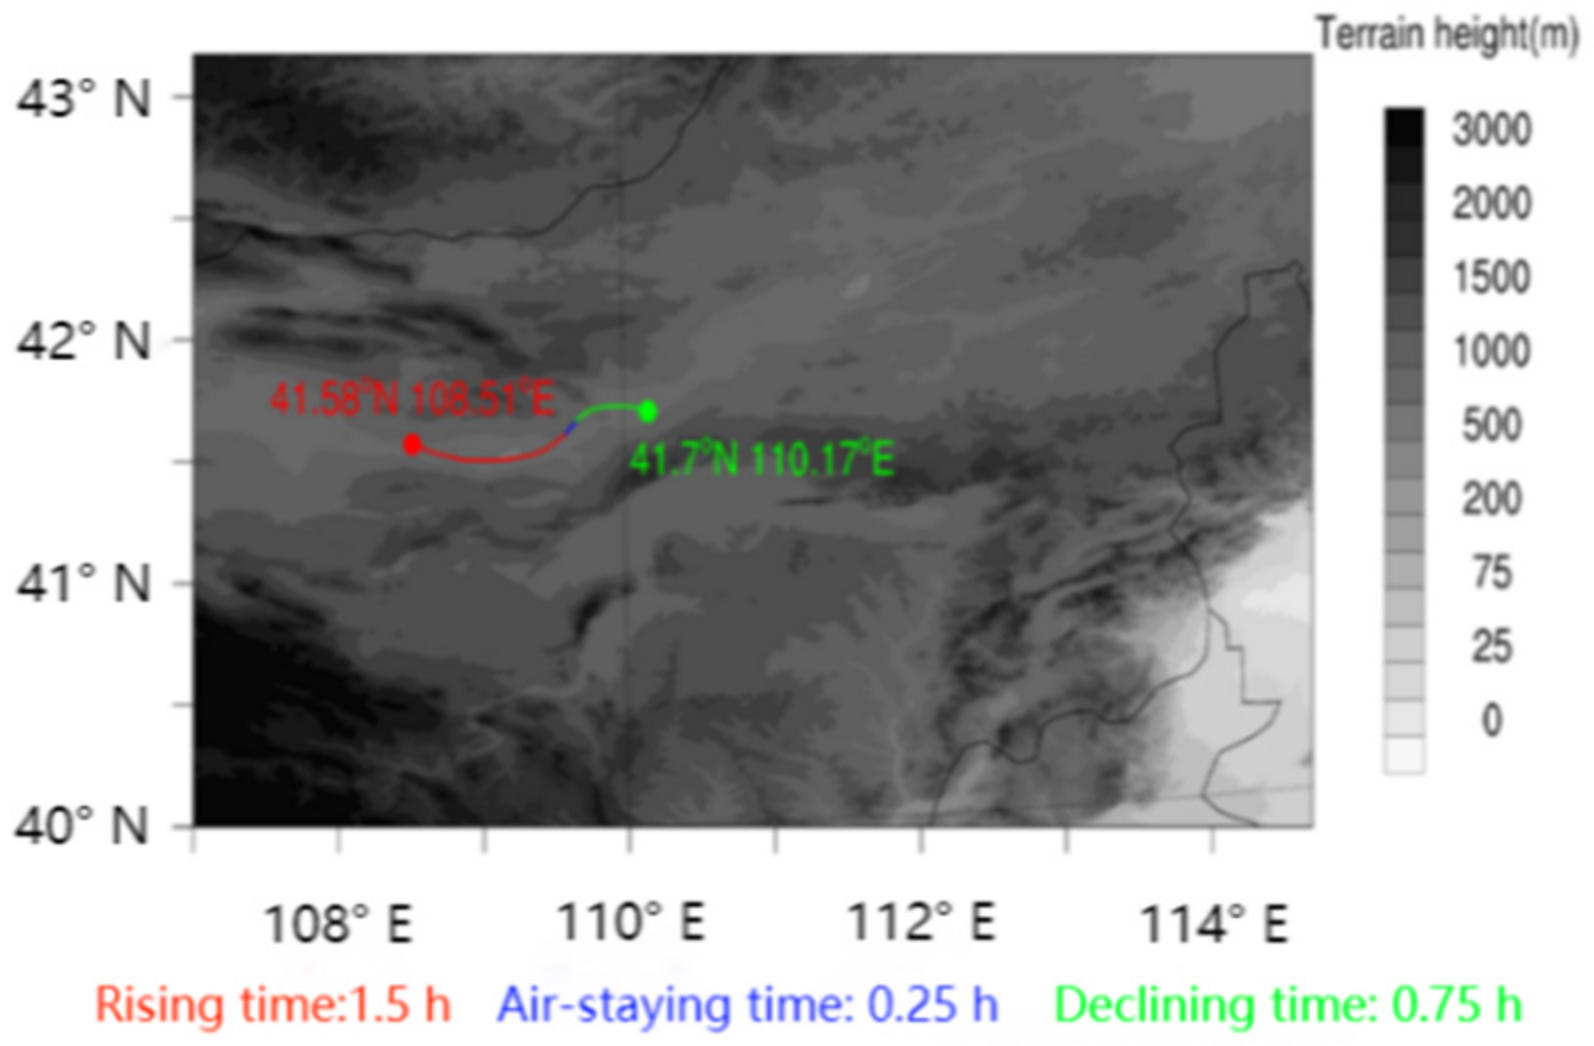
Figure 5 presents the GPS trace results of the sounding balloon and the location of the landing site.
- (1)
The first launch on Day 1
At 10:10:19 on the morning of Day 1, the radiosonde balloon was launched. The geographic coordinates of the releasing place were (41.58608° N, 108.4906° E). The initial altitude was 1295 m, temperature was 4.2 °C, air pressure was 869.88 hPa, and the rising speed gradually increased with altitude. At 11:35:12, the sounding balloon rose to its highest point (41.6428° N, 109.4726° E) with the altitude, temperature, and pressure being 24,417 m, −24.6 °C, and 25.25 hPa, respectively. Then the balloon flew horizontally at an average speed of 1 m/s for 5 min. At 10:25, the rope between the box and balloon was cut via remote control and the equipment cabin began to descend. At 12:29:12, the equipment cabin landed at (41.65476° N, 110.042° E), altitude 2206.9 m.
- (2)
The second launch on Day 2
At 8:58 on the morning of Day 2, the balloon was released. The coordinates of the flying place were (41.586° N, 108.4906° E). The initial altitude was 1300 m, temperature 1.7 °C, air pressure 863.83 hPa. At 10:20, the sounding balloon reached its highest point (41.804° N, 109.4905° E) with the altitude, temperature, and pressure being 24,686.3 m, −14.8 °C, and 25.94 hPa, respectively. After flying horizontally at an average speed of 0.2 m/s for 5 min, the rope between the balloon and the equipment cabin was cut and the equipment cabin began to descend at 10:25. At 10:53:33, the equipment cabin finally landed at (41.886° N, 109.8826° E), altitude 2655.9 m.
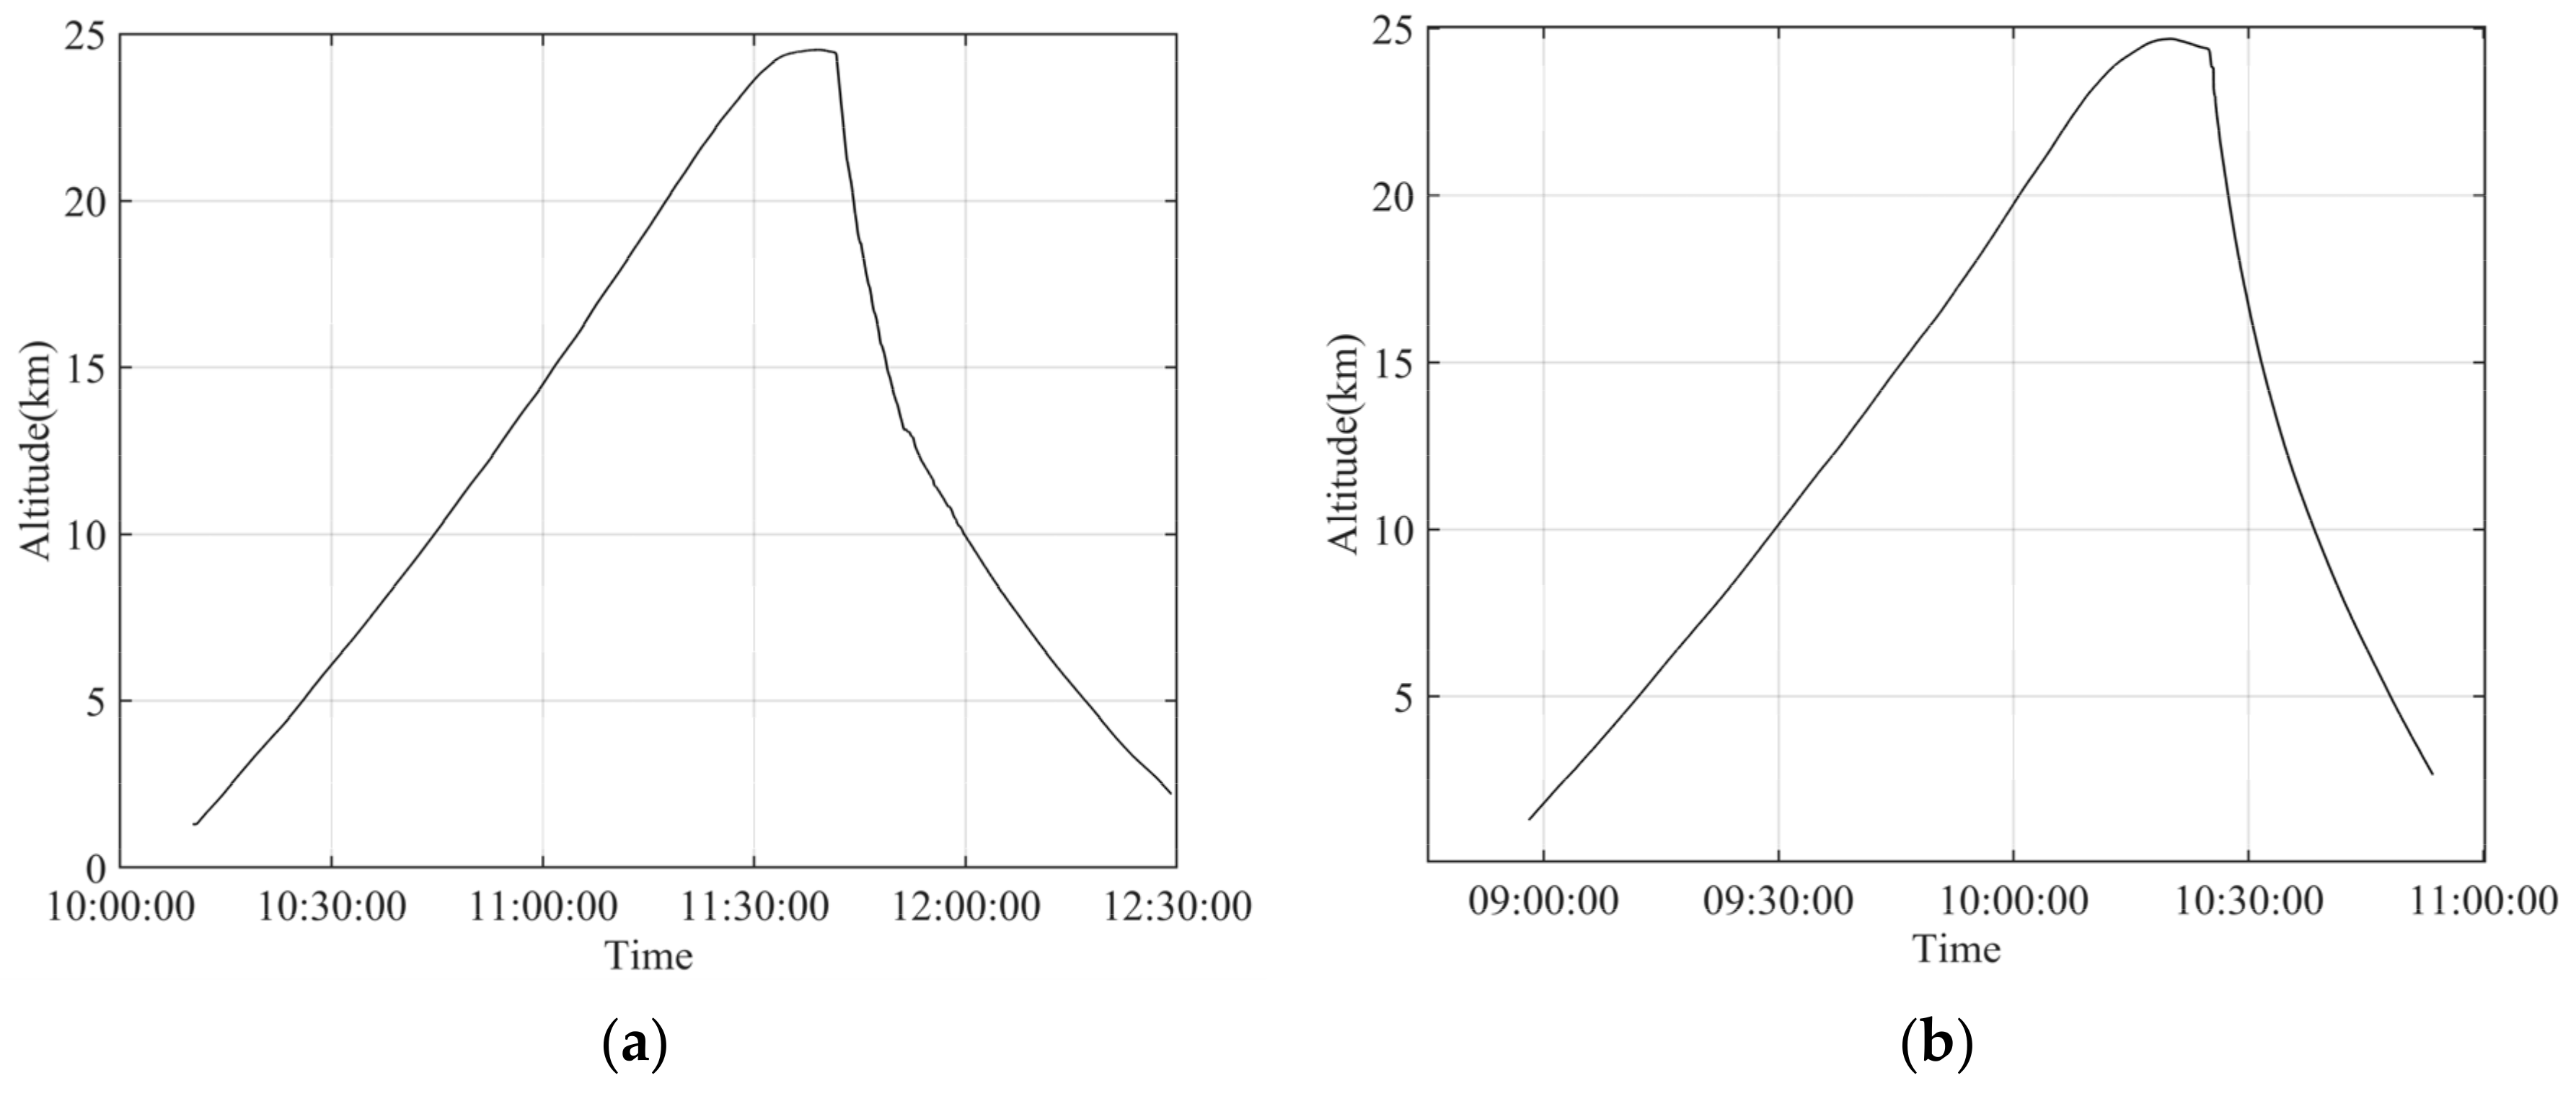
The position of the equipment cabin was archived in real-time by the GPS receiver. The altitude monitored by GPS on Day 1 and Day 2 was shown in
Figure 6. When the balloon reached the predetermined height (~25 km), the equipment cabin was separated from the sounding balloon. The longitude and latitude of the equipment cabin were obtained according to the landing position of the equipment cabin GPS feedback.
4. Results
The data from the radiation detector, accumulating through the infrared (IR) communication channel and stored in the non-volatile memory, was sent to the computer via radio. The radiation dose rate distribution recorded on Day 1 and Day 2 were shown in
Figure 7, respectively.
Comparing the results from the two sounding experiments, it was obvious that the curves of the radiation dose equivalent rate were basically of the same trend. In the beginning, it was no more than 0.2 μSv/h and barely changed with time. Over the following 15–20 min, it increased gradually to 0.8–1.2 μSv/h with the steady ascent of the sounding balloon and the detector. Subsequently, a sharp enhancement in the radiation dose equivalent rate was followed by persistance at a level of >3.0 μSv/h. Consistent observations on these two days in the same detection environment may indicate this detection method is rather stable.
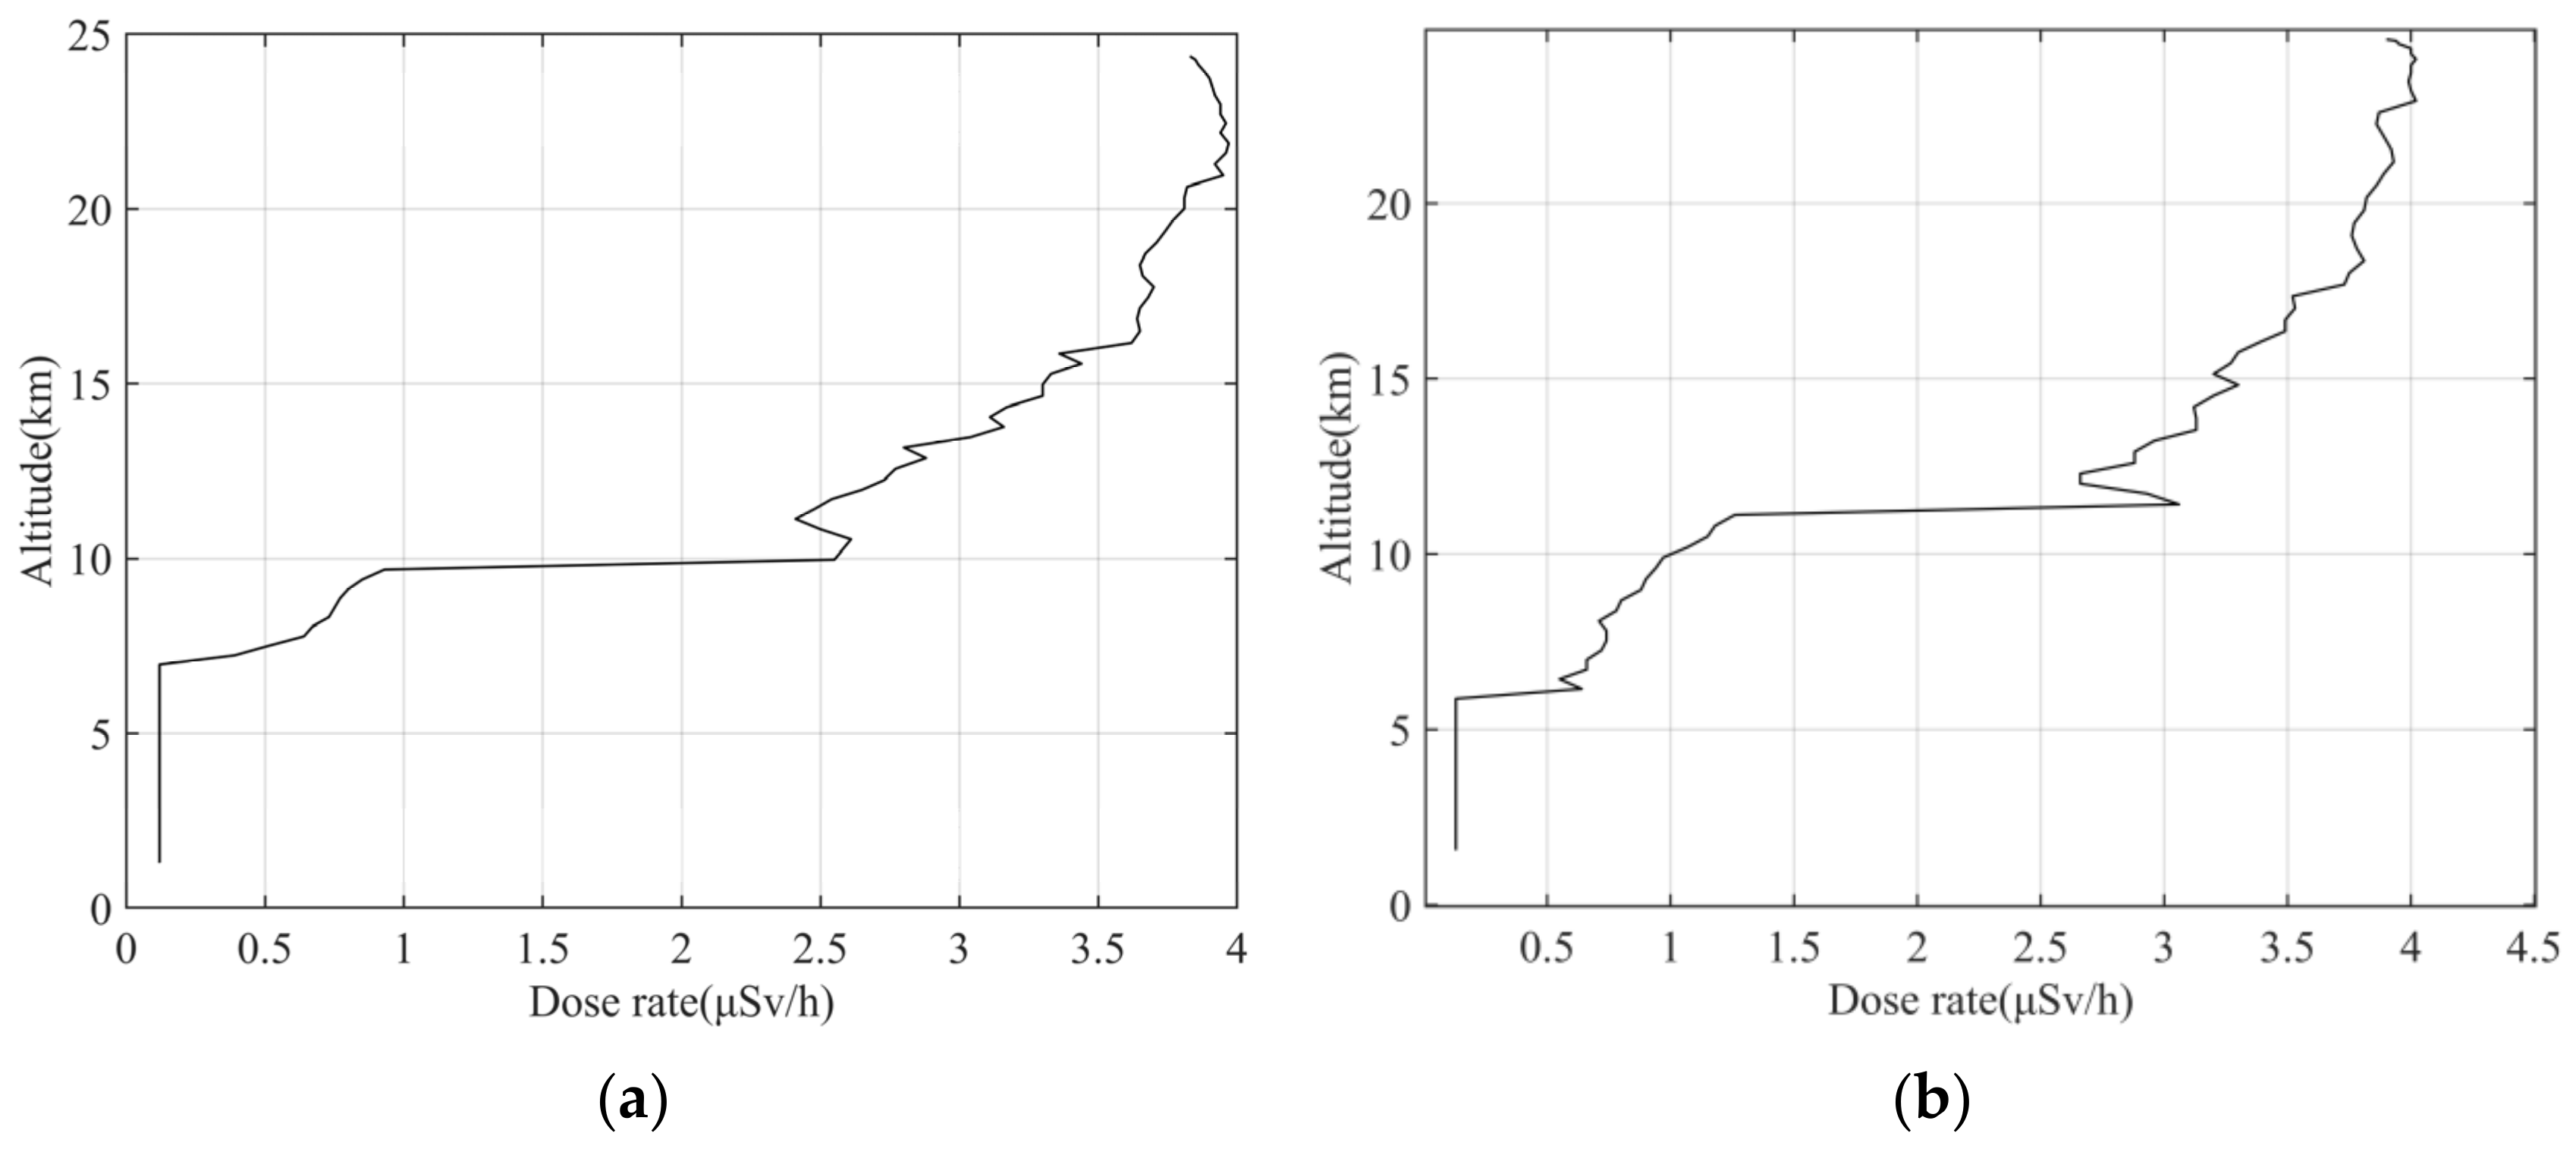
On the basis of the relevance of time line, the dose rate variance with altitude could be obtained from the GPS altitude data and the time series of the radiation dose rate, as shown in
Figure 8.
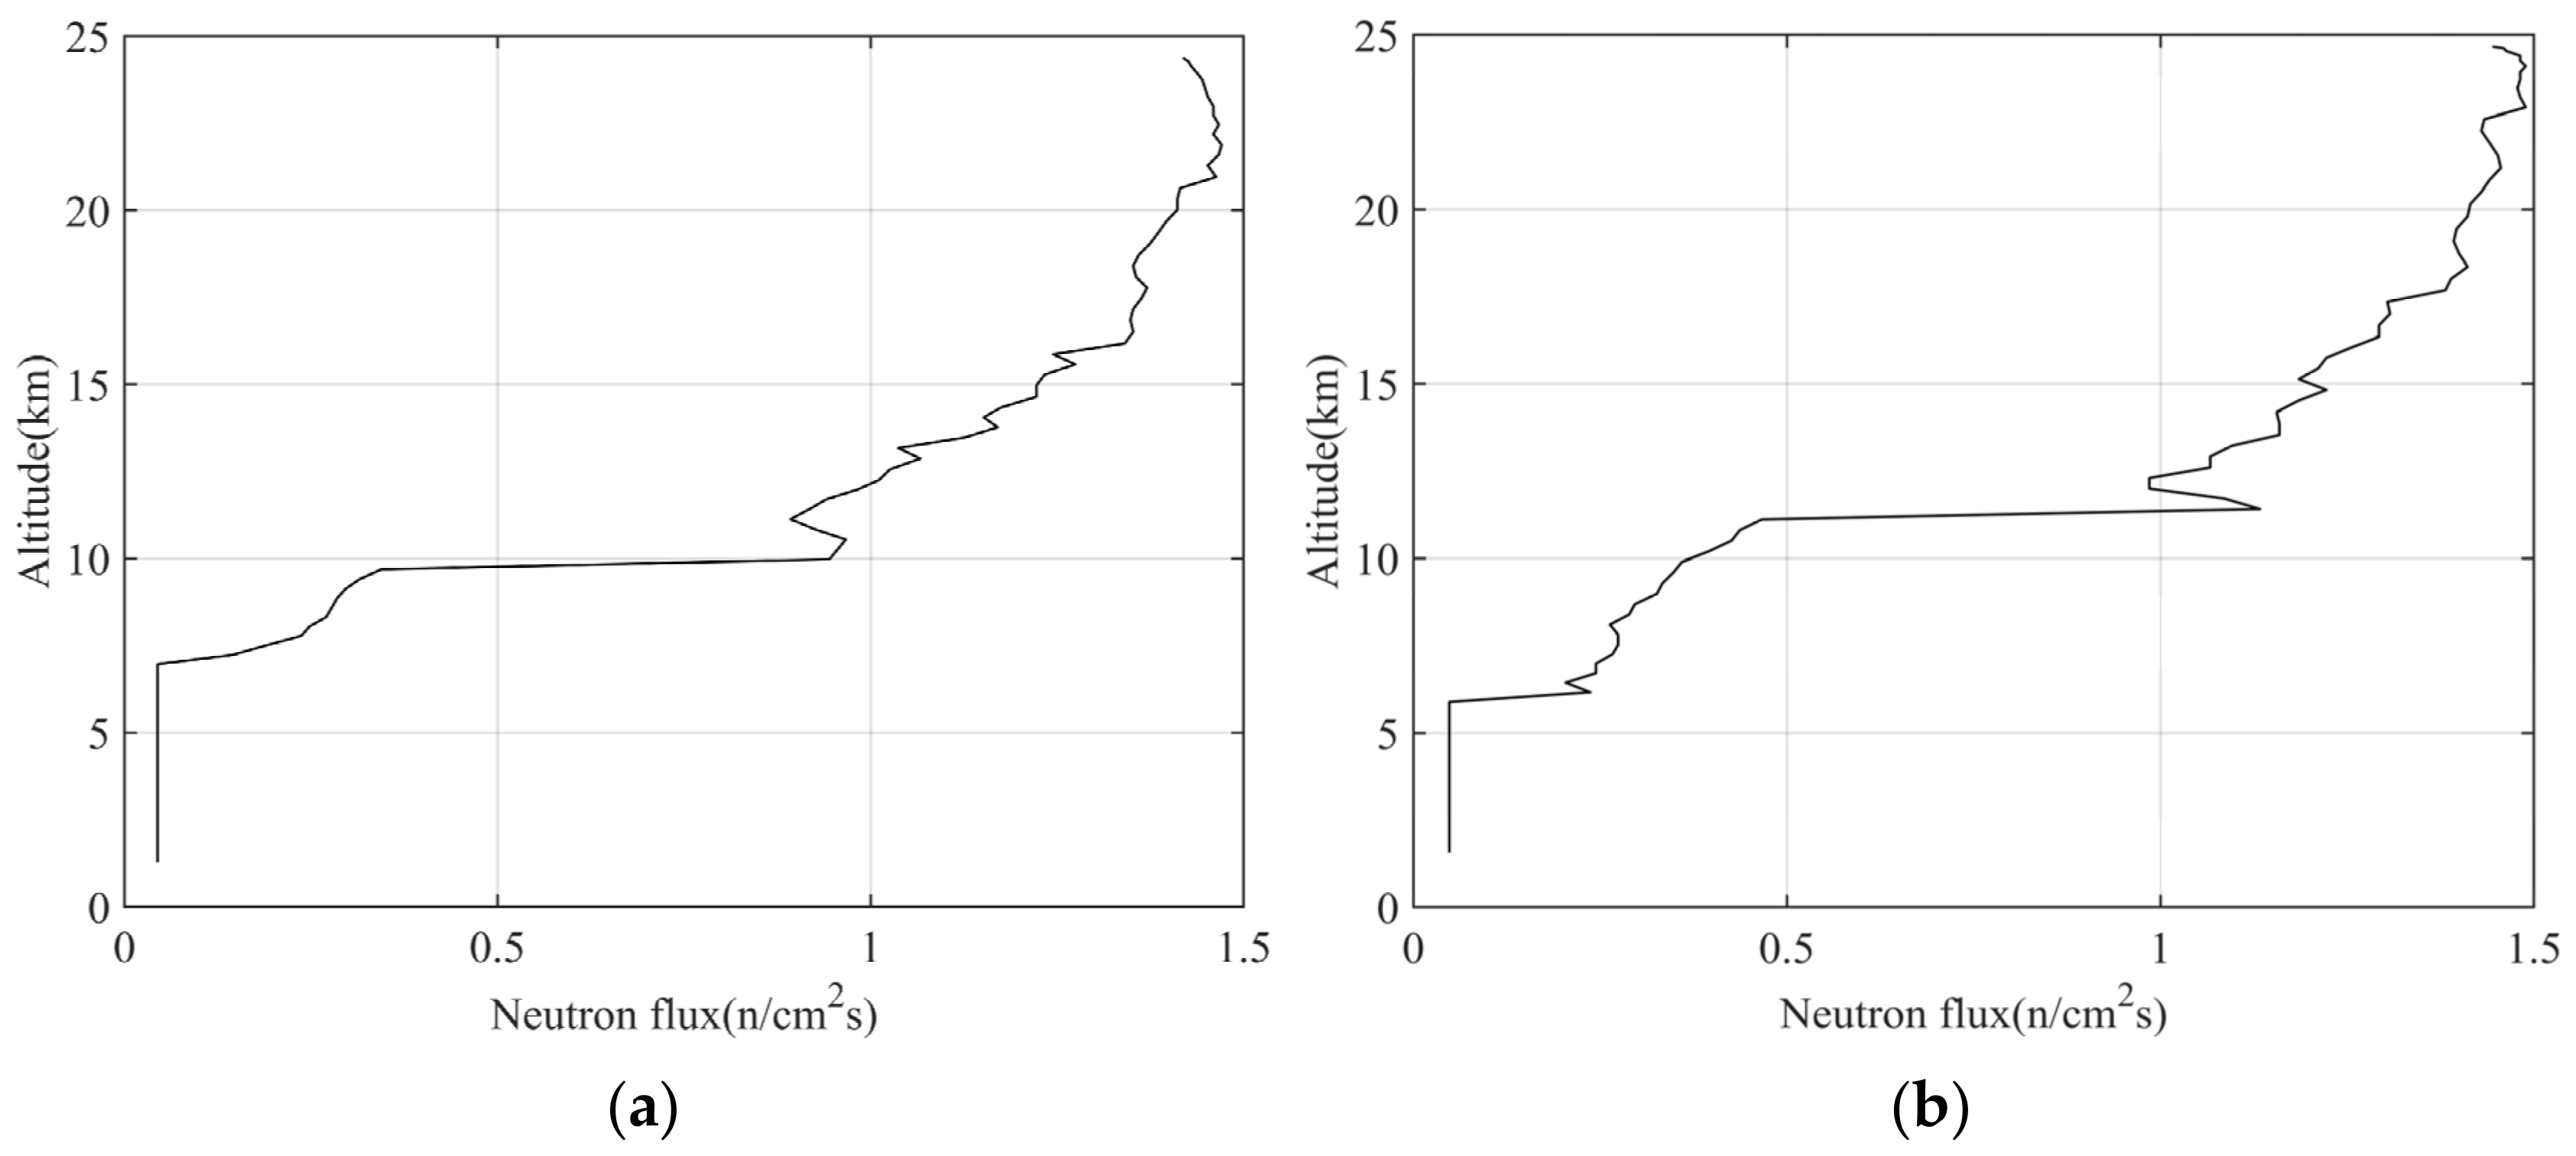
Figure 9a,b presents the profiles of the neutron flux (1–10 MeV) on Day 1 and Day 2, respectively. The neutron flux also exhibited a similar pattern in vertical distribution. The neutron flux profiles were characterized by approximately zero below 6 km but >1.0 cm
−2s
−1 at the height of civil aviation. The profiles of the neutron flux could serve as crucial inputs to the calculation of the upset rate for SEE analysis.
5. Discussion
To validate our observational results, the neutron flux data were compared with the results published by Normand and Baker [
4] which is also called the Boeing model in IEC 62396-1 [
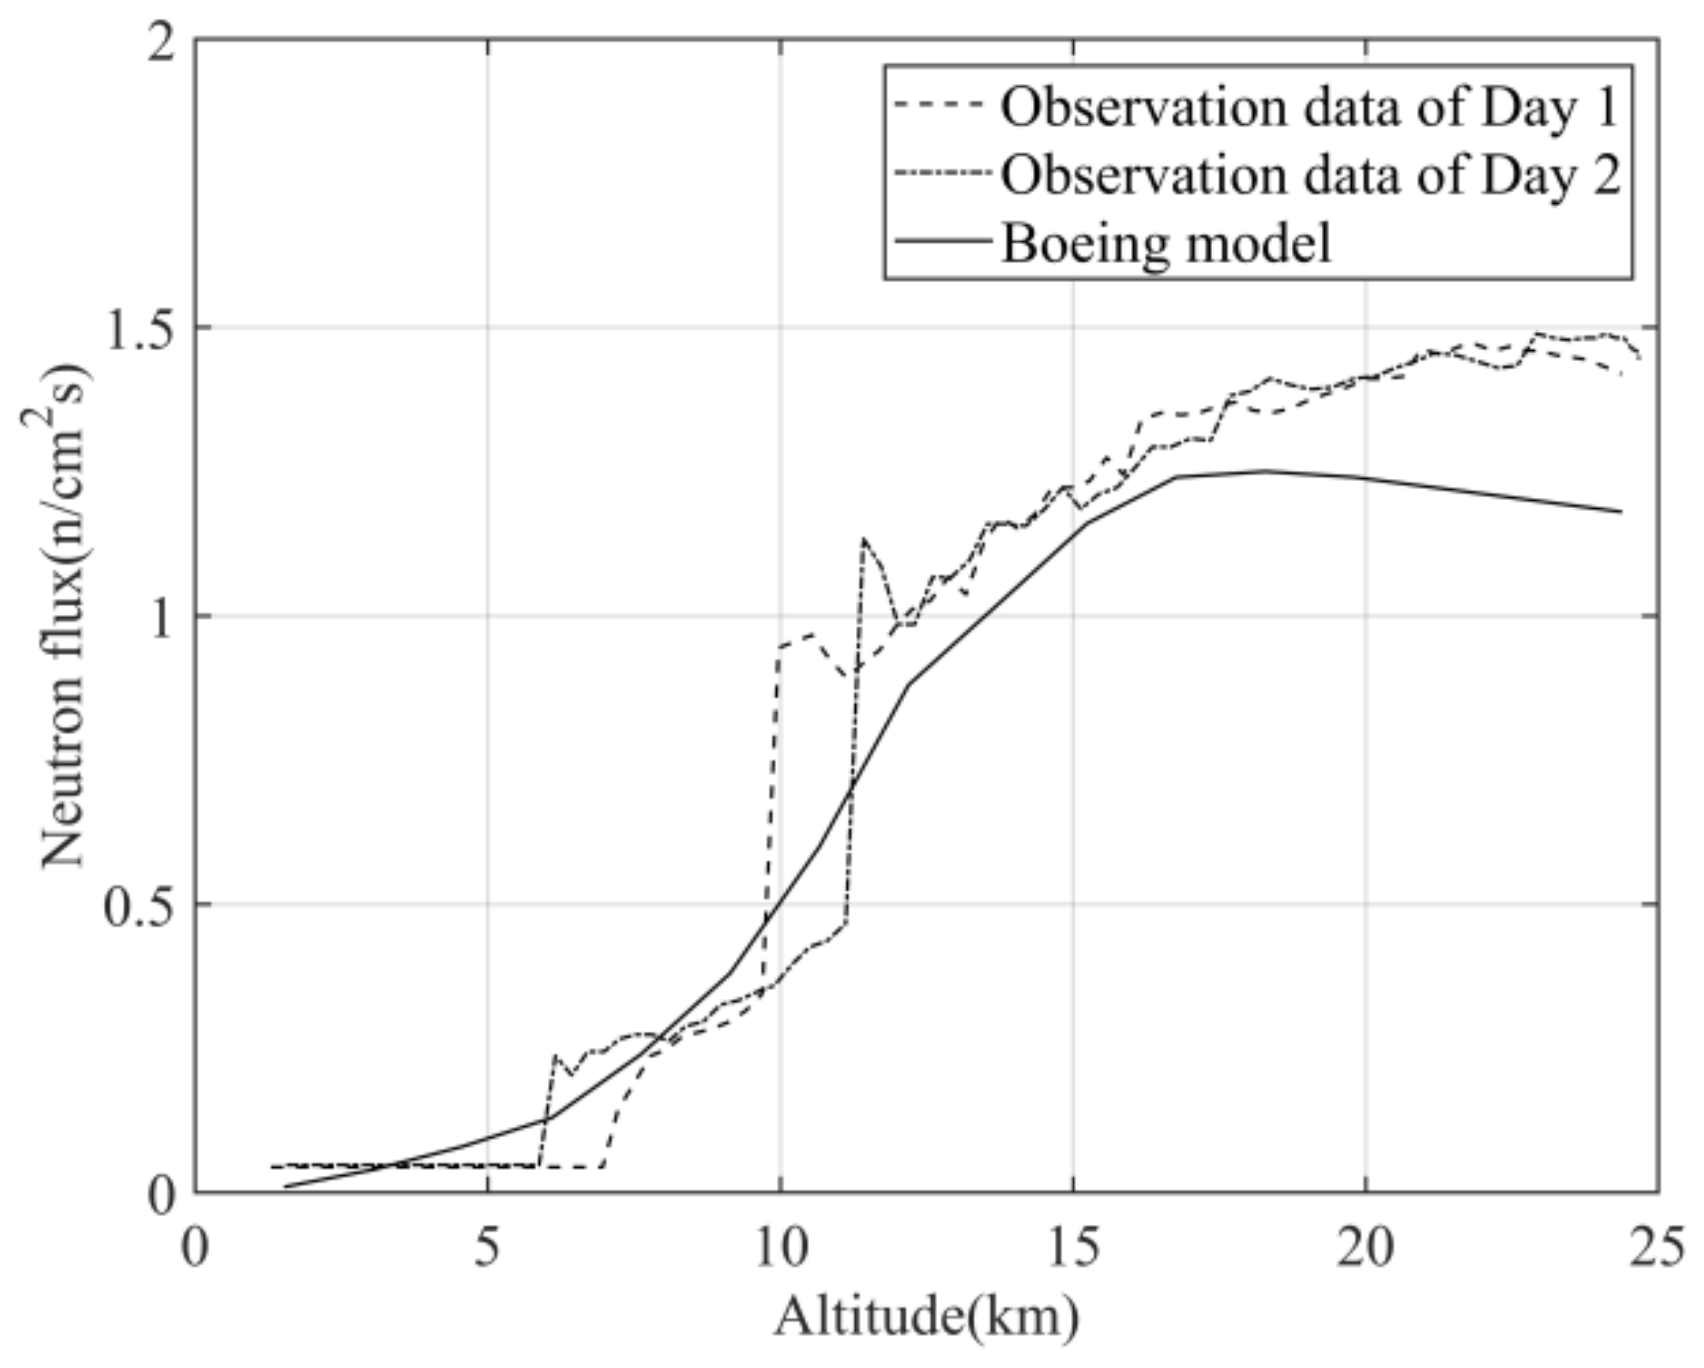
10]. The Boeing model showed the variation of 1–10 MeV neutron flux in the atmosphere with an altitude at the latitude of 45° N. The comparison between our observations and the Boeing model is shown in
Figure 10.
Comparing the profiles of the neutron flux shown in
Figure 9a,b with the results of Boeing model, the curve distribution obtained in these experiments could be considered as essentially consistent with the trend of the known profile. Both the experiments and the Boeing model show the neutron flux increases with altitude from 6 to 15 km and remains nearly consistent at the altitudes of 15–25 km.
The differences between observation data and Boeing model lie in two parts. One significant difference is the neutron flux below the altitude of 6 km. The Boeing model indicates that the neutron flux from 0 to 6 km increases with height. For the observational results of Day 1 and Day 2, the neutron flux is nearly constant. This is mainly caused by the detection threshold of the radiometer used in the experiment. Constrained by the cost, the dose rate display range of the radiometer starts at 0.01 μSv/h, so the value of the dose rate in the experiment at low altitude is nearly constant. To get more accurate result of neutron flux, the radiation detector should be more sensitive with a lower detection threshold. The other difference between the observation data and the Boeing model is the specific value at high altitude (>12 km). The trend of the curves is similar but the values corresponding to the observed data are greater than those in the model. This might be caused by solar activity or regional differences. It indicates that in order to get a complete comprehension of the background of radiation for civil aircraft design, the detection experiment should be performed at different latitudes and places. With the enrichment of the detection data, the neutron flux model could be updated.
6. Conclusions and Future Work
A new method of detecting atmospheric neutron for the altitude of civil aviation is proposed in this paper. Based on the method, the vertical distribution of atmospheric neutron flux could be well detected with convenience and low cost. The trend consistency between the observation data and the Boeing model indicates that this method is validated and reliable. Besides, the idea to use a nuclear radiometer could also be applied to other flying platforms such as aircraft.
In the test flight of civil aircraft, the nuclear radiometer could be carried by the radiosonde balloon for wind-field detection. In the wind-field detection before the flight test [
26], the detection of atmospheric neutrons profiles could be completed through applying this method by carrying the nuclear radiometer as extra equipment on the radiosonde balloon. To improve the accuracy of the detection of the neutron flux, the radiometer should be replaced with detectors with higher accuracy.
With the detection results, the safety assessment of the first flight could be performed via the SEE analysis. Multiple measurements of the neutron flux could form an atmospheric radiation background database for single event research, which could greatly benefit the verification of single event effect in the safety design of aircraft systems.


