
Emission Characteristics and the Environmental Impact of VOCs from Typical FRP Manufacture Industry

1
Beijing Key Laboratory of Urban Atmospheric Volatile Organic Compounds Pollution Control Application, Beijing 100037, China
2
National Urban Environmental Pollution Control Engineering Research Center, Beijing 100037, China
3
Beijing Municipal Research Institute of Eco-Environmental Protection, Beijing 100037, China
4
Miyun District of Beijing Municipal Ecology and Environment Bureau, Beijing 101500, China
*
Author to whom correspondence should be addressed.
Atmosphere 2022, 13(8), 1274; https://doi.org/10.3390/atmos13081274
Submission received: 25 July 2022
/
Revised: 2 August 2022
/
Accepted: 9 August 2022
/
Published: 11 August 2022
(This article belongs to the Special Issue Industrial Air Pollution: Emission, Management and Policy)
Abstract
:The VOC emission characteristics of the typical fiber-reinforced plastics (FRPs) industry were studied for an assessment of the impact on the environment. The results showed that the VOC emissions of the typical FRP industry mainly come from grille, sheet, winding, molding, and pultrusion process links, including ketones, aldehydes, alcohols, and benzene series. The benzene series’ concentration represented by styrene was much higher than that of other species. The generation potential of ozone and the SOA in the typical production process were evaluated: in terms of ozone impact, the OFP values of the winding process were the highest, accounting for 65.9% of the total contribution. For the component contribution, the OFP contribution of the benzene series represented by styrene was far more than that of other VOC species, and the styrene mainly came from the use of unsaturated resin. In terms of the SOA impact, the pultrusion process contributed the most to the generation of SOA, accounting for 63.9% of the total SOA contribution. In terms of the component contribution, the contribution of SOA mainly came from the benzene series, accounting for nearly 95% of the total contribution of VOCs. Therefore, FRP enterprises should give priority to controlling the emission of the benzene series.
1. Introduction
PM2.5 and ozone (O3) concentrations are still heavily polluting some cities in China [1,2,3,4]. In the “14th Five-Year Plan”, air-pollution prevention and control tasks, with the prevention and control of atmospheric compound pollution dominated by fine particles and O3, have become an important goal [5,6,7]. As the main precursors of PM2.5 and O3, volatile organic compounds (VOCs) are currently an important object for the control of air pollution. [8,9,10]. Fiber-reinforced plastics (FRPs) refer to the industry of structural material products that use glass fiber, carbon fiber, basalt fiber, and/or aramid fiber as reinforcing materials with various thermosetting or thermoplastic synthetic resins as adhesives. Their advantageous properties, such as chemical corrosion resistance, high strength, and energy savings in the preparation process, mean that FRPs have been widely used for many purposes. The raw materials used in the production process contain many kinds of organic solvents, including unsaturated polyester resins, vinyl resins, curing agents, and plasticizers, which are heated in the curing process to accelerate the volatilization of solvents, resulting in a large amount of VOCs [11]. With the increasing demand for FRPs in China, the production capacity of FRPs has grown rapidly in recent years, leading to an increase in the pollution from the entire FRP industry year by year.
The pollution control of VOCs in the FRP industry plays an extremely important role in improving air quality, but previous research has mainly focused on industries such as printing, auto repair, asphalt production, and industrial coating. Feng et al. [12] studied the VOC emission characteristics of typical printing companies in Guangzhou and generated the environmental and human health risks; then, they proposed that aromatic hydrocarbons should be the primary pollutants controlled in the printing industry; Wang et al. [13] analyzed the current situation of VOC emissions and control in China’s auto repair industry and provided a technical route for the overall control of VOCs in the auto repair industry; Lu et al. [14] studied the characteristics of VOC emissions in the asphalt production industry and its unorganized and organized emission characteristics. However, there is a lack of research on the VOC emission characteristics of the FRP industry and its impact on the surrounding environment. Therefore, this paper chose a typical FRP industry as the research object, systematically discussed the VOC emission characteristics, and determined the main pollutants through the analysis of the exhaust gas components by GC-MS/FID with an assessment of the impact on the surrounding environment.
2. Materials and Methods
2.1. Sampling and Analysis Methods
Typical FRP enterprises in Hengshui were selected to carry out research on the VOC emission characteristics. The sampling distribution plans are shown in Table 1. For the sampling method, using 10 L Tedlar bags, organized waste gas sampling was carried out according to the method specified in the literature [15], and the samples were collected during normal working conditions.
Once the sample was collected, the waste gas was quickly transferred from the Tedlar bag to the summa tank and sent to the analytical laboratory. A three-stage cold trap preconcentration (Entech 7100)–Gas Chromatography–Mass Spectrometry/Flame Ionization Detector (GC-MS/FID) monitoring system was used for VOC component analysis. C2-C5 compounds and the rest were quantified by FID and MSD, respectively. Details of the concentration analysis can be found in Gao’s research [16]. The standard gas was Photochemical Assessment Monitoring Stations (PAMS) and TO-15, and the four internal standard compounds were bromochloromethane, 1,4-difluorobenzene, deuterated chlorobenzene and 1-bromo-4-fluoro, which were all purchased from Spectra Gases, Bransburg, NJ, USA.
Quality Control: The summa tank was purged with high-purity nitrogen at least 5 times, and then one-fifth of the tank was randomly selected for blank experiments. The detected concentration of the target compound should be lower than the detection limit of the method. During the detection process, the blank experiment and standard curve calibration were carried out every 24 h, in which the concentration of the target compound in the blank sample was required to be lower than the detection limit of the method, and the relative deviation between the measured value of the standard sample and the actual value was required to be less than 10%.
2.2. Ozone Formation Potential Calculation
The maximum incremental reactivity (MIR) method can more objectively characterize the near-surface ozone formation potential (OFP) and VOC reactivity. In this study, the MIR coefficient method [17,18] was used to analyze the OPF of the related VOCs, and the calculation formula is shown in Equation (1).
where OFPi is the ozone formation potential of species i, MIRi is the ozone generation coefficient of species i in the maximum ozone increment reaction, and Ci is the emission concentration of species i.
OFPi = MIRi × Ci
2.3. Calculation Method of Secondary Organic Aerosol Generation Potential
In this study, the fractional aerosol coefficient (FAC) method was used to analyze the generation potential of the secondary organic aerosols (SOAs) in the related processes, in which the FAC is a characterization of the SOA generation potential. A widely used FAC proposed by Grosjean [19,20] was employed, which was based on the smoke box experiment. The calculation formula is shown in Equation (2).
SOAi = VOCi × FACi
In the equation, SOAi is the secondary organic aerosol generation potential of species i, VOCi is the initial concentration of the emission sources of species i, and FACi is the secondary organic aerosol generation coefficient of species i.
3. Results and Discussion
3.1. VOC Emission Characteristics of the FRP Industry
For the FRP industry, the production process of VOCs mainly comes from the typical process links such as grille, sheet, twining, molding, pultrusion, etc. The VOC emission components of each process link are shown in Table 2.
The VOCs produced by the FRP grille products mainly came from the process of applying the gel coat and electric heating curing; the soaking of the glass fiber yarn in resin also produced a very small amount of VOCs. The characteristic pollutants were mainly styrene, methyl ethyl ketone, 1,2-dichloroethane, and methyl chloride, among which the concentration of styrene was the highest, reaching 2377 µg·m−3. The concentrations of methyl ethyl ketone, 1,2-dichloroethane, and methyl chloride were 464, 257, and 124 µg·m−3, respectively. The production process of VOCs in the FRP sheet products mainly came from the processes of mixing the ingredients, dipping, and curing and was accompanied by a serious odor. The characteristic pollutants were mainly styrene, dichloromethane, and benzaldehyde, among which the concentration of styrene was the highest, reaching 8759 µg·m−3, and the concentrations of dichloromethane and benzaldehyde were 2630 µg·m−3 and 61.9 µg·m−3, respectively. The VOCs generated during the production of the FRP twining products mainly came from the processes of stirring, dipping, twining molding, curing, and demolding, and the release of VOCs was also accompanied by odors. The characteristic pollutants were mainly styrene, dichloromethane, ethanol, 1,2-dichloroethane, and methyl chloride, among which the concentrations of styrene and dichloromethane were as high as 260,335 µg·m−3 and 94,369 µg·m−3, respectively. The concentrations of ethanol, 1,2-dichloroethane, and methyl chloride were 1550, 901, and 479 µg·m−3, respectively. The links that generated VOCs in the FRP molded products included mixing and stirring, sheet extrusion, and molding curing. The molding curing process needed to be heated by presses, during which a large amount of VOCs were released. Therefore, the molding curing process was the most serious link in the production of VOC pollution in the molded products. Its characteristic pollutants were mainly styrene, 1,2-dichloroethane, ethanol, dichloromethane, and ethyl acetate, among which the styrene concentration was the highest, reaching 13,850 µg·m−3. The concentrations of 1,2-dichloroethane, ethanol, dichloromethane, and ethyl acetate were 2697, 2120, 953, and 518 µg·m−3, respectively. For the FRP pultruded products, the VOCs generated mainly came from the volatilization of organic coatings including fillers and curing agents in the process of stirring, dipping, and twining curing. Therefore, when the fillers and curing agents were not being used, keeping the raw material barrel closed reduced the escape of VOCs. The characteristic pollutants were mainly styrene, dichloromethane, 1,2-dichloropropane, and acetone, among which styrene had the highest concentration, reaching 86,461 µg·m−3; the concentrations of dichloromethane, 1,2-dichloropropane, and acetone were 4315, 1905, and 1367 µg·m−3, respectively.
Based on the above results, the types of VOC emissions mainly included ketones, aldehydes, alcohols, and benzene series, among which the emission concentration of styrene was much higher than that of other species, mainly because styrene was used as a diluent and cross-linking agent in the production process and volatilized quite a lot during curing and storage.
3.2. Analysis of the Ozone Formation Potential in the FRP Industry
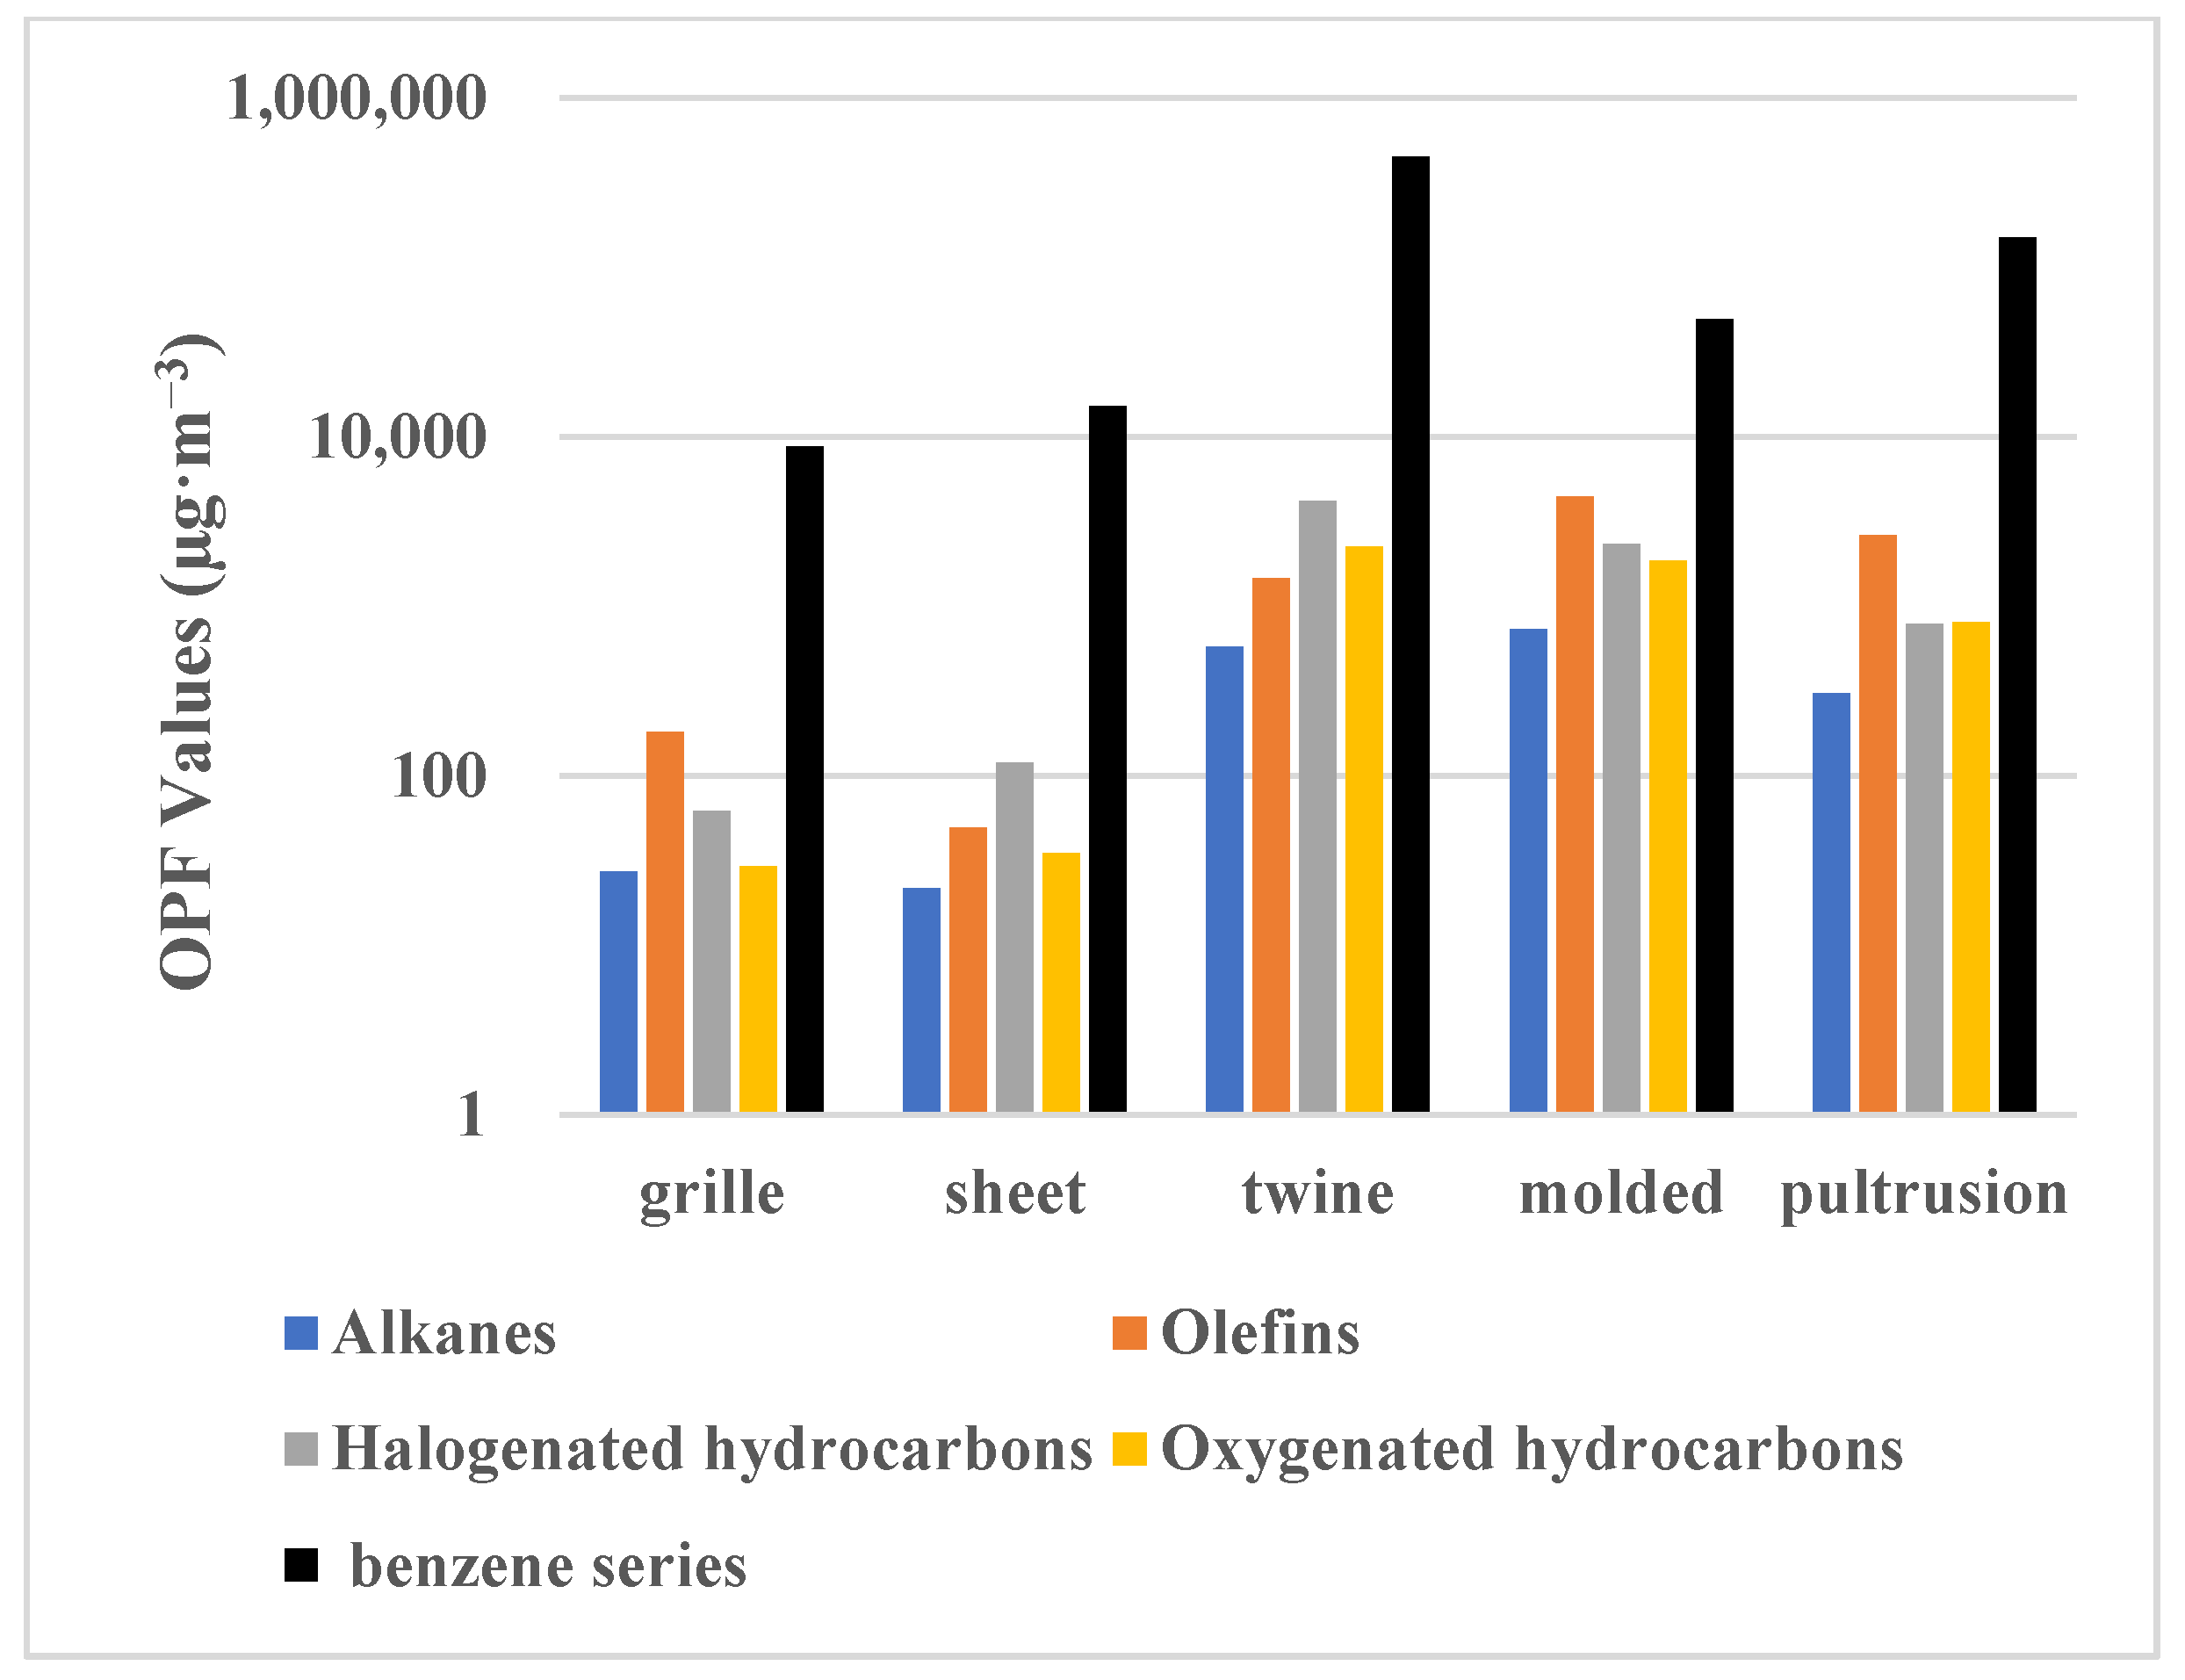
In this study, the MIR method was used to evaluate the O3 generation contribution of VOCs emitted from different processes. As shown in Figure 1, the OFP value of the grille section was 9059 µg·m−3, the OFP value of the sheet section was 15,483 µg·m−3, the OFP value of the twining section was 460,304 µg·m−3, the OFP value of the molding section was 58,724 µg·m−3, and the OFP value of the pultrusion link was 154,784 µg·m−3. Among them, the OFP in the twining process was the highest, accounting for 65.9% of the total contribution, followed by the pultrusion process, accounting for 22.2% of the total contribution. Based on the comprehensive analysis results, for typical grille, sheet, twining, molding, and pultrusion processes, the OFP of the benzene series represented by styrene contributed far more than other VOC species, among which styrene mainly came from the use of unsaturated resin.
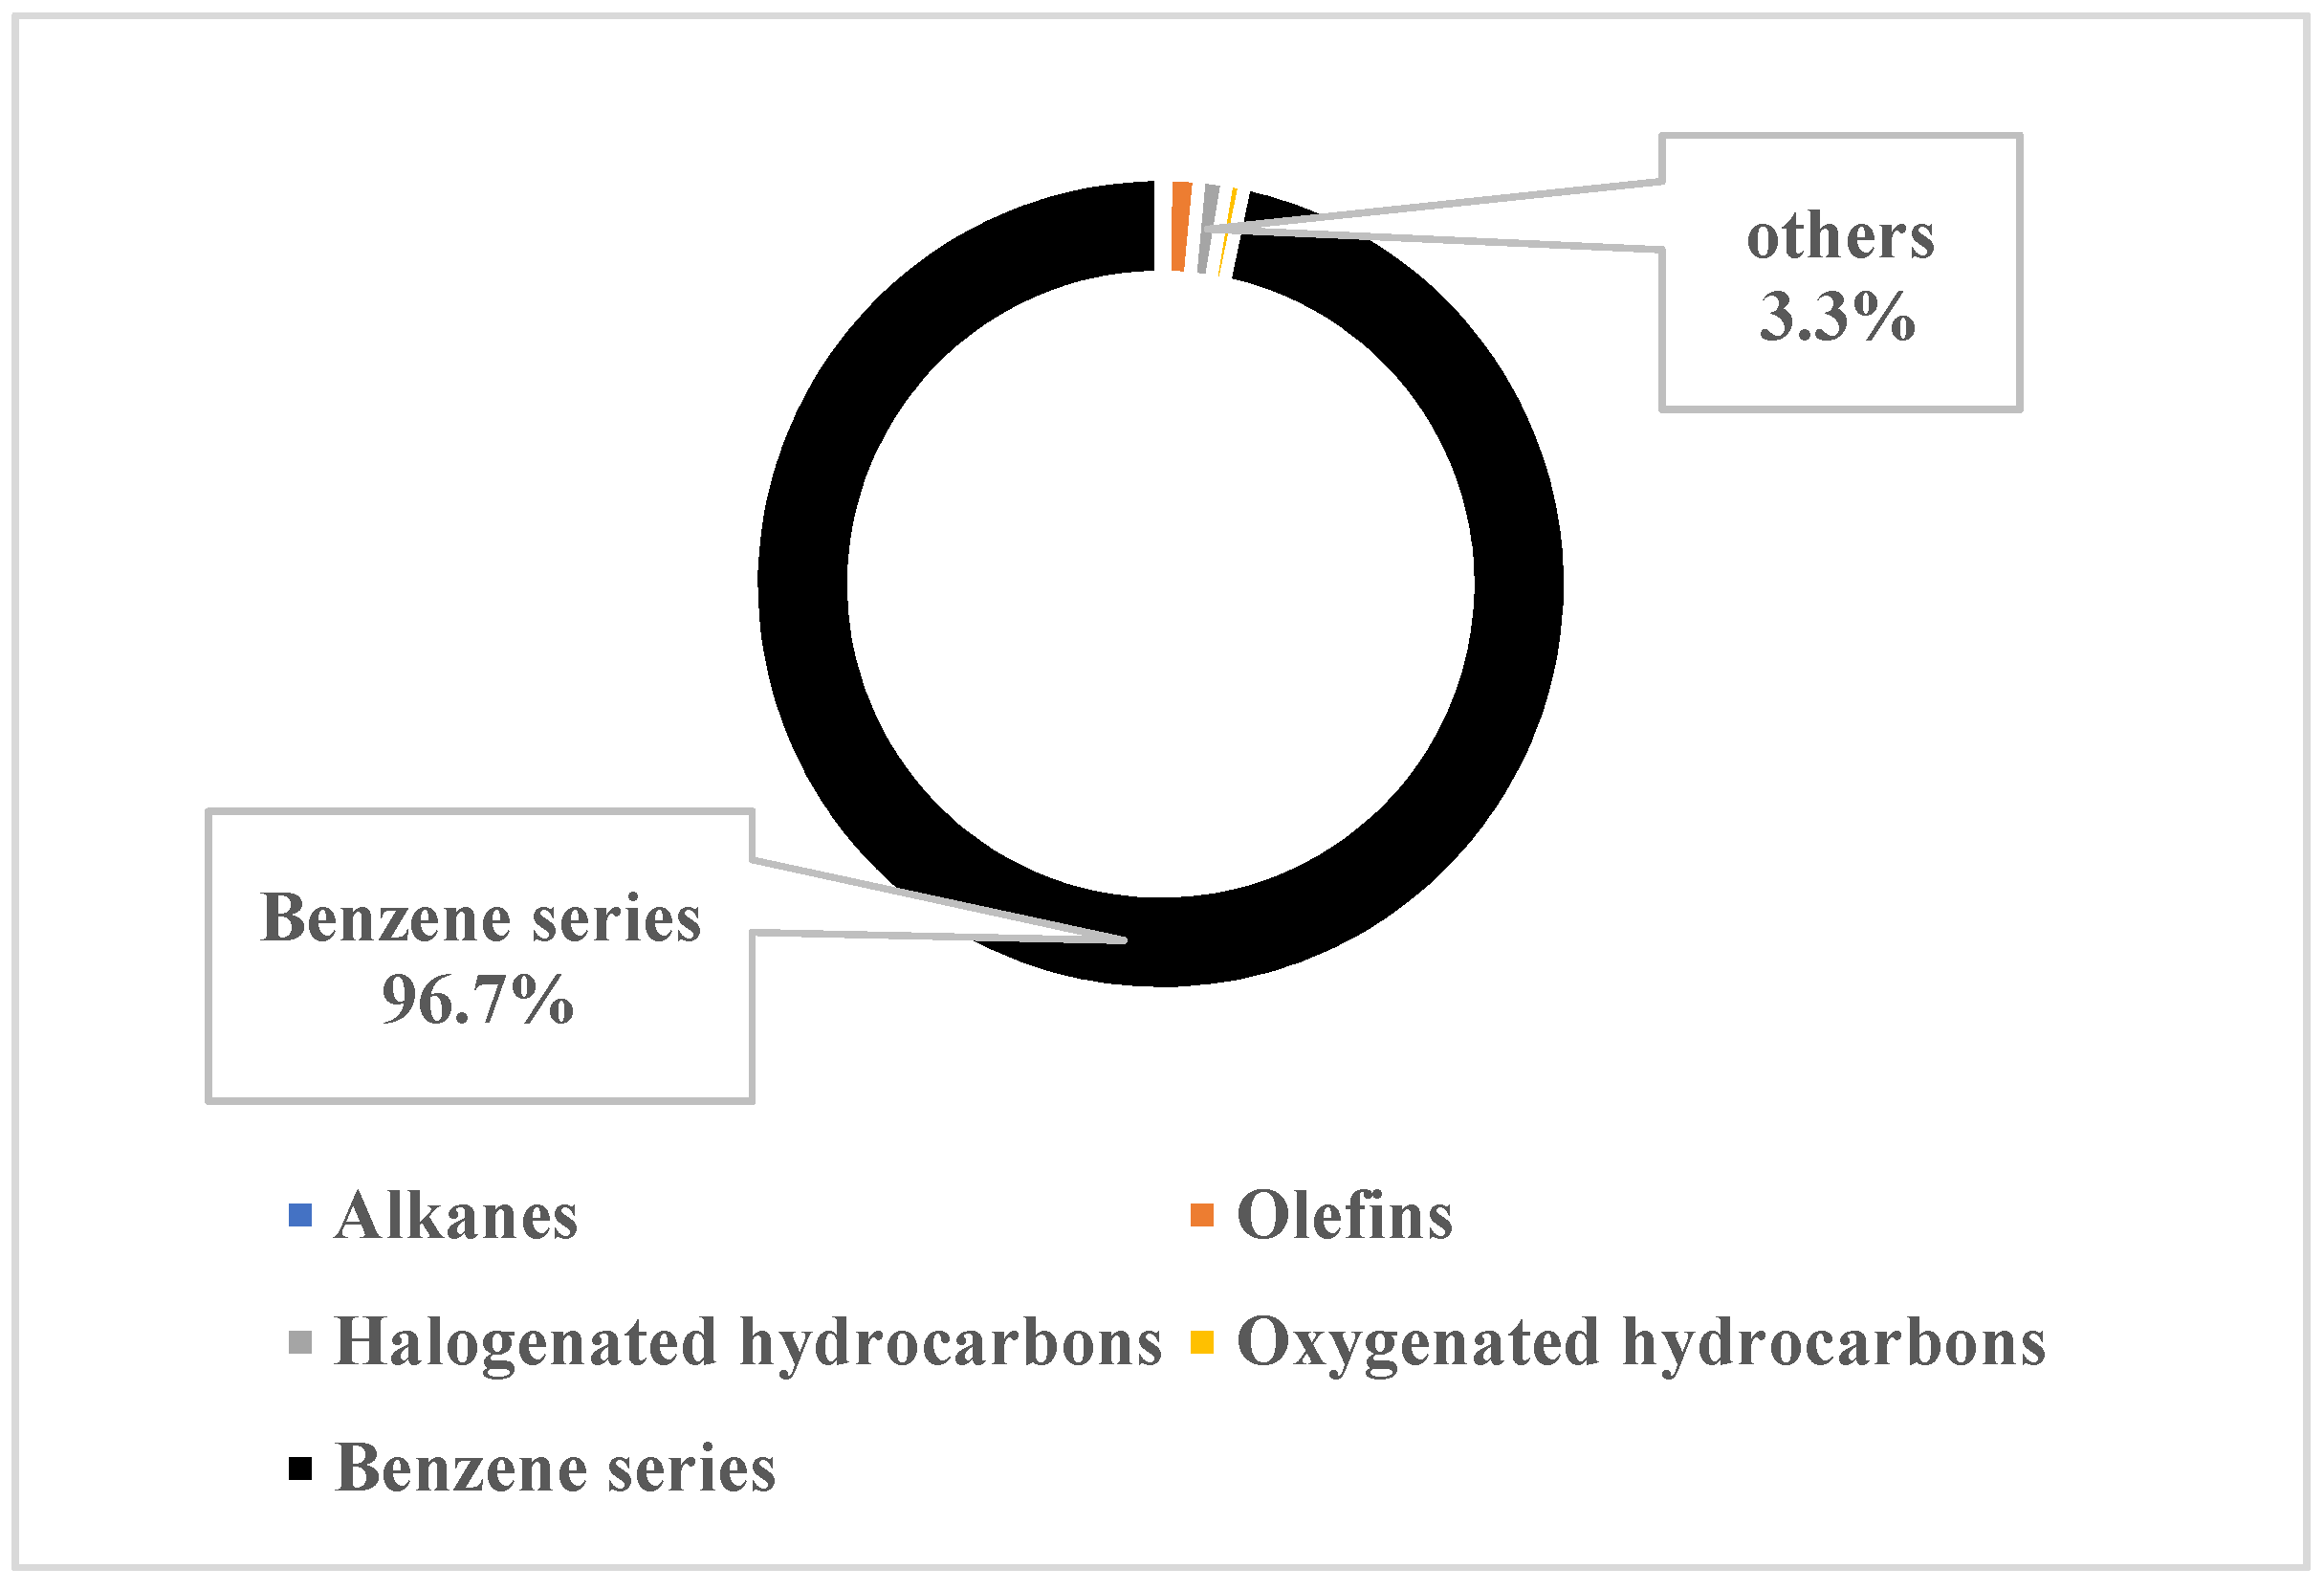
The proportion of O3 generation contributed by different VOC species is shown in Figure 2, and the contribution mainly came from the benzene series. Although the MIR coefficient of the benzene series was not the highest, due to the extensive use of adhesives including unsaturated resins, a large amount of benzene series was released during the whole production process, resulting in a far greater contribution of the benzene series to ozone generation, accounting for nearly 96.7% of the total contribution, followed by olefins and halogenated hydrocarbons, accounting for about 1.3% and 1.1%, respectively. Therefore, in terms of controlling the generation of O3, priority should be given to controlling the emission of the benzene series.
3.3. Analysis of the Secondary Organic Aerosol Generation Potential in the FRP Industry
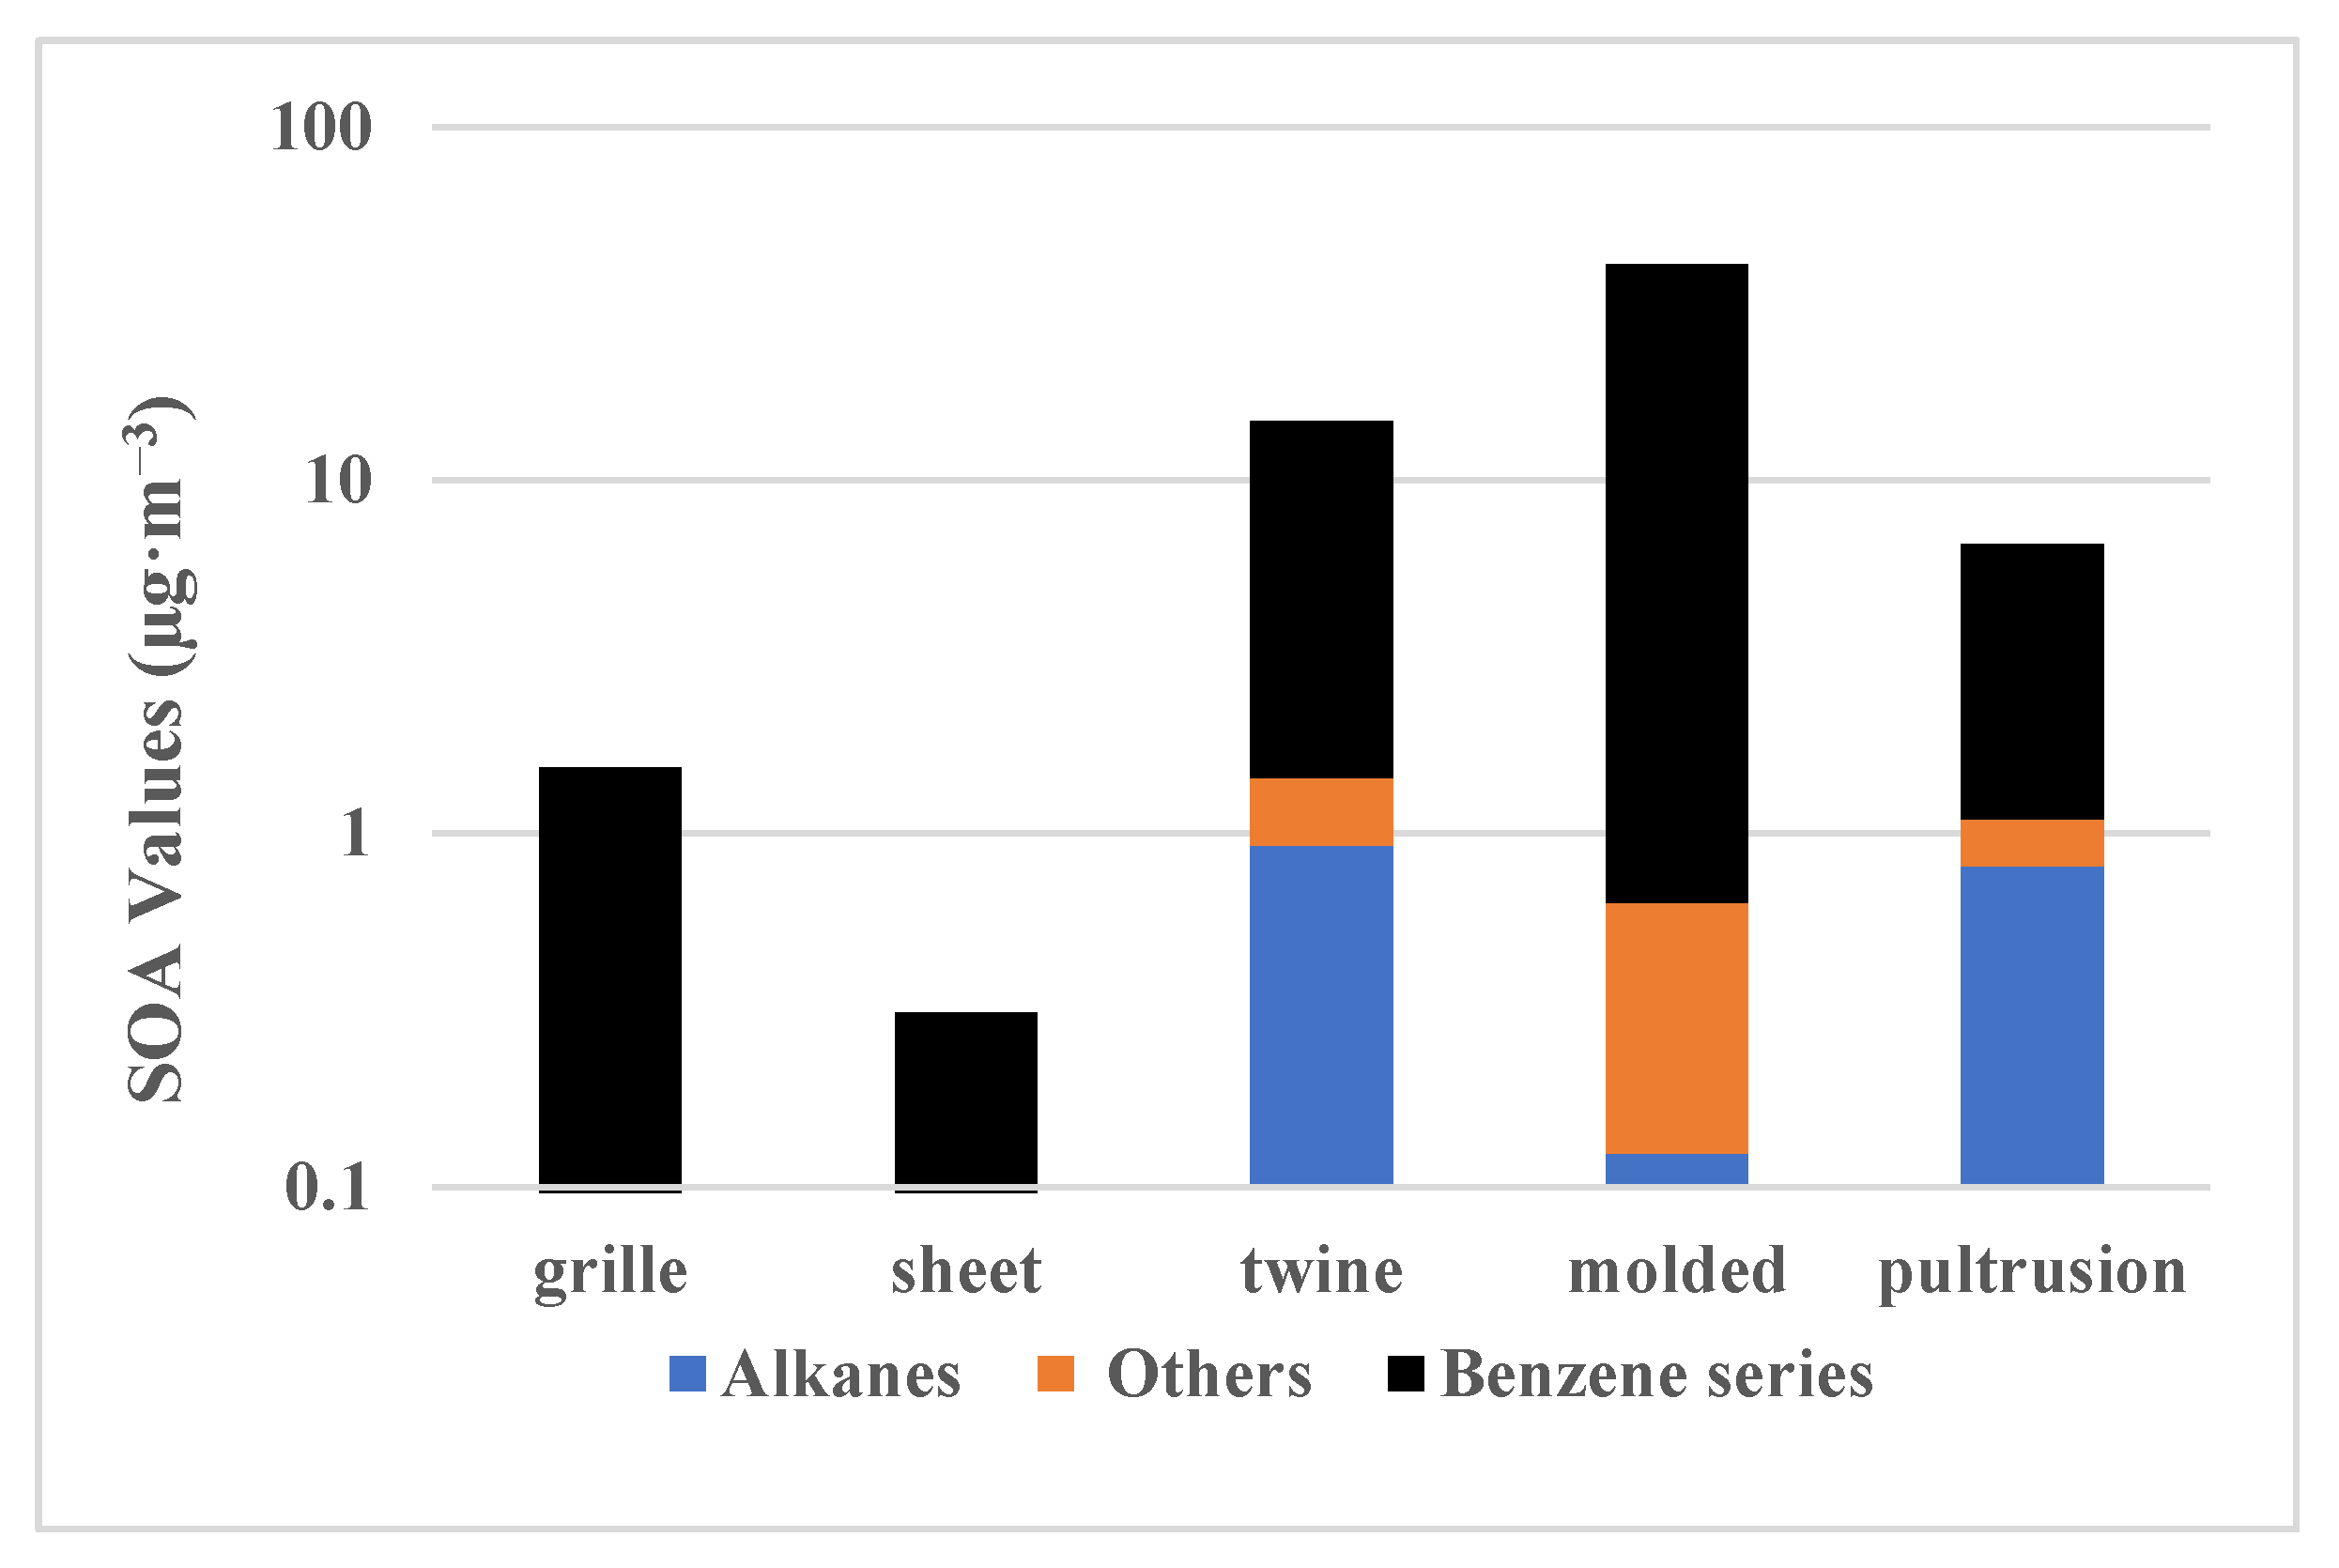
The FAC method was used to analyze the SOA generation potential of the VOCs emitted by the FRP products in different process links, as shown in Figure 3. The results showed that the SOA contribution of the grille and sheet process was all from the benzene series, the SOA contribution was small, and the SOA values were 1.53 μg·m−3 and 0.31 μg·m−3, respectively. The SOA contributions of the twining, molding, and pultrusion processes mainly came from alkanes, other VOCs, and the benzene series, and the SOA contributions were 6.57, 14.7, and 40.8 µg·m−3. The molding and pultrusion processes had a greater contribution to the generation of SOA, accounting for 23.0% and 63.9%, respectively. The benzene series contributed the most to the generation of SOA.
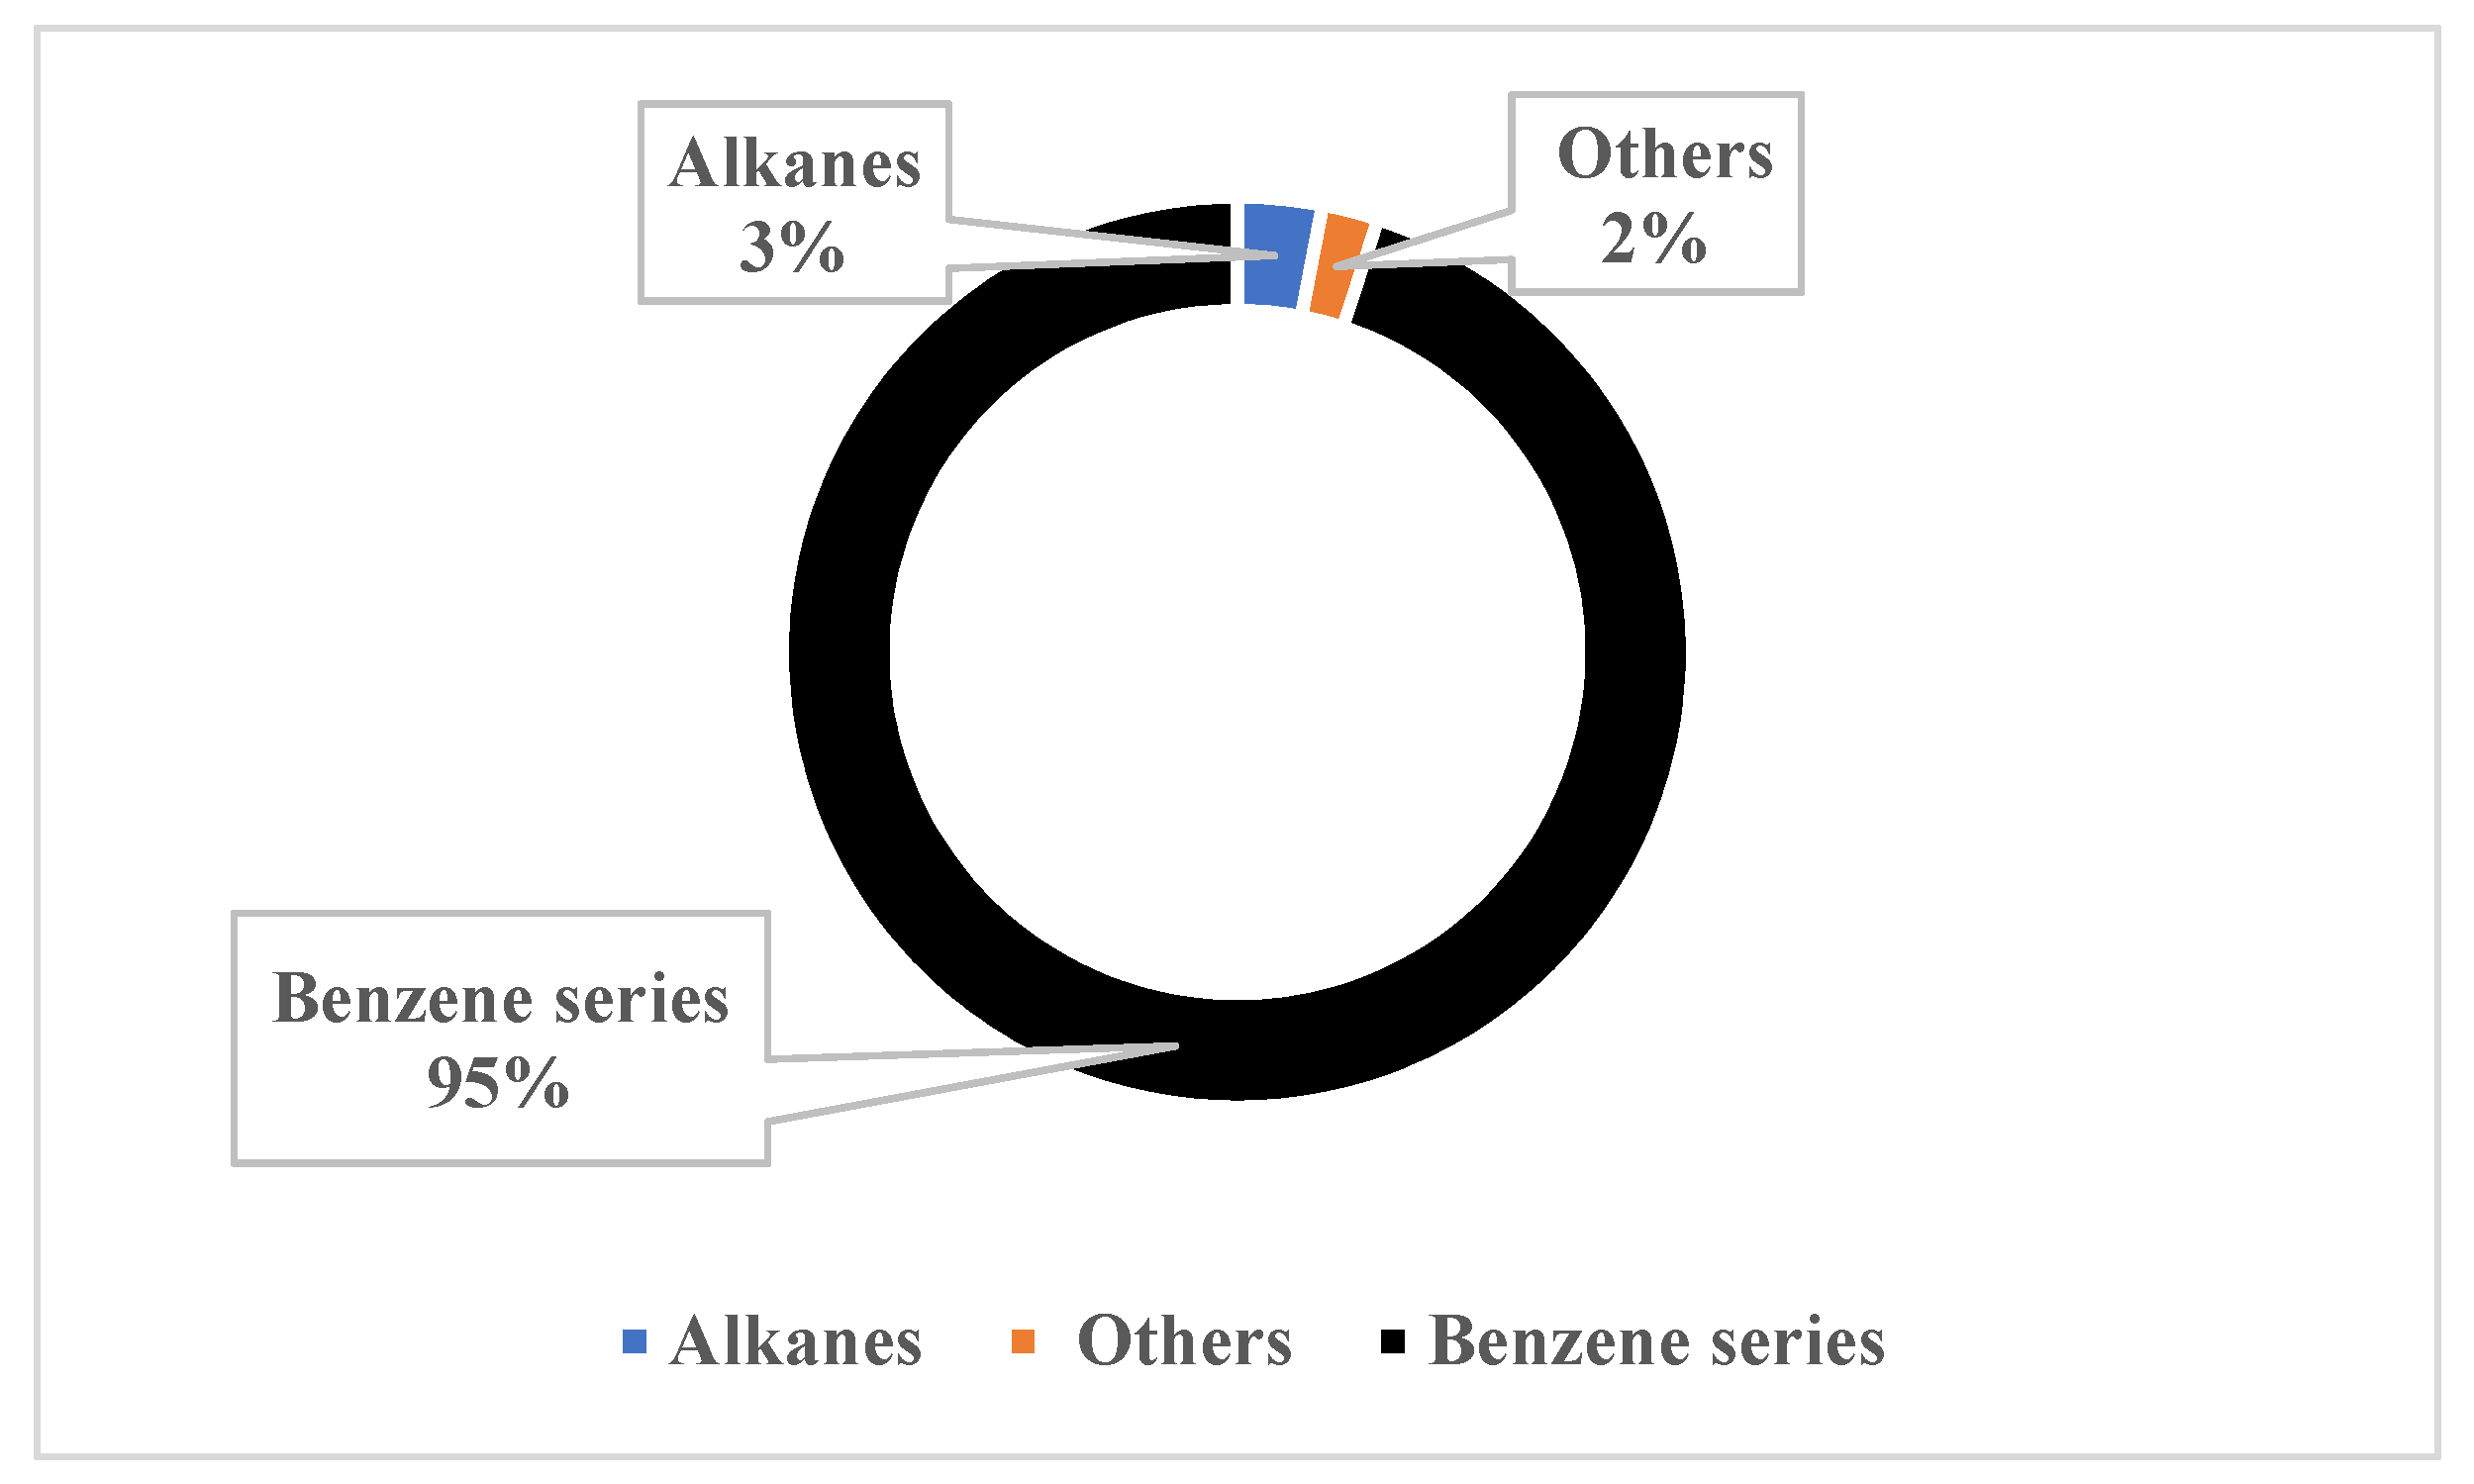
In terms of the comprehensive SOA contribution analysis, as shown in Figure 4, the SOA contribution of FRP products mainly came from the benzene series, accounting for nearly 95% of the total contribution of VOCs, followed by alkanes and other VOCs, accounting for about 3% and 2%, respectively. Therefore, as with the influence of O3 generation, in terms of controlling SOA generation, it is necessary to give priority to controlling the process links involving the benzene series’ emissions in production.
4. Conclusions
VOC component analysis was carried out on typical FRP enterprises, and the VOC emission characteristics of the FRP industry were preliminarily assessed. The VOC emissions mainly came from the grille, sheet, twining, molding, pultrusion, and other process links, mainly including ketones, aldehydes, alcohols, and benzene series, among which the emission concentration of the benzene series represented by styrene was much higher than the other species. The impact of VOCs on the environment from the FRP production processes was also evaluated. In terms of the ozone impact, the OFP in the twining link was the highest, accounting for 65.9% of the total contribution. In terms of the component contribution, the OFP contribution of the benzene series represented by styrene far exceeded that of other VOC species, in which the styrene mainly came from the use of unsaturated resins. In terms of the SOA impact, the pultrusion process had a greater contribution to SOA, accounting for 63.9% of the total SOA contribution. In terms of the component contribution, the SOA contribution mainly came from the benzene series, accounting for nearly 95% of the total contribution of VOCs. Therefore, in terms of the environmental impact, FRP enterprises should give priority to controlling the emission of the benzene series.
Author Contributions
Conceptualization, R.H. and H.W.; methodology, H.W.; formal analysis, R.H.; investigation, R.H. and H.W.; data curation, S.X. and H.S.; writing—original draft preparation, R.H.; writing—review and editing, R.H. and H.W.; visualization, S.X. and T.Y.; supervision, H.W.; project administration, H.W.; funding acquisition, R.H. and H.W. All authors have read and agreed to the published version of the manuscript.
Funding
This research was funded by the Municipal Research Institute of Environmental Protection (NO. Y2020-011, NO. Y2014-101).
Institutional Review Board Statement
Not applicable.
Informed Consent Statement
Not applicable.
Data Availability Statement
Data sharing is not applicable to this article.
Conflicts of Interest
The authors declare no conflict of interest.
References
- Niu, S.P.; Yu, J.H.; Cheng, Y.S. Air pollution and potential contributors of particulate matter in Ma’anshan, a typical mining city from Yangtze Economic Zone. Acta Sci. Circum. 2022, 42, 283–297. [Google Scholar]
- Zhou, M.W.; Kang, P.; Wang, K.K.; Zang, X.L.; Hu, K.Y. The spatio-temporal aggregation pattern of ozone concentration in China from 2016 to 2018. China Environ. Sci. 2020, 40, 963–1974. [Google Scholar]
- Wang, Y.Y.; Yang, W.; Wang, X.Y.; Wang, S.; Bai, J.F.; Cheng, Y. Characteristics of ozone pollution and influencing factors in urban and suburban areas in Zibo. Environ. Sci. 2022, 43, 170–179. [Google Scholar]
- Xiang, S.L.; Liu, J.F.; Tao, W.; Yi, K.; Xu, J.Y.; Hu, X.R.; Liu, H.Z.; Wang, Y.Q.; Zhang, Y.Z.; Yang, H.Z.; et al. Control of both PM2.5 and O3 in Beijing-Tianjin-Hebei and the surrounding areas. Atmos. Environ. 2020, 224, 117259. [Google Scholar] [CrossRef]
- Yao, W.J.; Wang, D.W.; Xie, F.Y.; Zhu, H.W.; Meng, X.Y.; Tian, Y.; Liu, H.; Liu, X.Y.; Zhang, Y.T.; Lei, D.S.; et al. Spatial distribution characteristics of VOCs and its impact on ozone formation potential in Rizhao city in summer. Environ. Sci. 2022, 43, 714–722. [Google Scholar]
- Fu, C.B.; Xu, W.S.; Dan, L.; Tong, J.H. Temporal and spatial variations in ozone and its causes over Hainan province from 2015 to 2020. Environ. Sci. 2022, 43, 675–685. [Google Scholar]
- Li, B.W.; Ho, S.S.H.; Li, X.H.; Guo, L.Y.; Chen, A.; Hu LTYang, Y.; Chen, D.; Lin, A.A.; Fang, X.K. A comprehensive review on anthropogenic volatile organic compounds (VOCs) emission estimates in China: Comparison and outlook. Environ. Int. 2021, 156, 106710. [Google Scholar] [CrossRef] [PubMed]
- Mozaffar, A.; Zhang, Y.L.; Fan, M.Y.; Cao, F.; Lin, Y.C. Characteristics of summertime ambient VOCs and their contributions to O3 and SOA formation in a suburban area of Nanjing, China. Atmos. Res. 2020, 240, 104923. [Google Scholar] [CrossRef]
- Xing, J.; Wang, S.X.; Jang, C.; Zhu, Y.; Hao, J.M. Nonlinear response of ozone to precursor emission changes in China: A modeling study using response surface methodology. Atmos. Chem. Phys. 2010, 11, 5027–5044. [Google Scholar] [CrossRef]
- Yi, X.X.; Li, J.H.; Li, G.H.; Lu, Z.Z.; Sun, Z.G.; Gao, J.; Deng, S.X. Characteristics of VOCs and Formation Potentials of O3 and SOA in Autumn and Winter in Tongchuan, China. Environ. Sci. 2022, 43, 140–149. [Google Scholar]
- Kim, K.W.; Lee, B.H.; Kim, S.; Kim, H.J.; Yun, J.H.; Yoo, S.E.; Sohn, J.R. Reduction of VOC emission from natural flours filled biodegradable biodegradable bio-composites for automobile interior. J. Hazard. Mater. 2011, 187, 37–43. [Google Scholar] [CrossRef] [PubMed]
- Feng, Y.; Liu, R.Y.; Liu, L.L.; Lu, S.W.; Huang, H.W.; Fan, L.Y.; Ye, D.Q. VOCs emission characteristics, environmental impact and health risk assessment of typical printing enterprises in Guangzhou. China Environ. Sci. 2020, 40, 3791–3800. [Google Scholar]
- Wang, H.L.; Yang, T.; Nie, L.; Fang, L.; Zhang, Z.S.; Hao, Z.P. Volatile organic compounds in the vehicle repairing industry of China: Emission, management, purification, and policy. Environ. Sci. 2021, 42, 5574–5584. [Google Scholar]
- Lu, Q.; He, Q.S.; Chen, G.L.; Li, T.T.; Huang, L.H.; Huang, D.J.; Chen, F.; Liang, X.M.; Lu, H.T.; Liu, M.; et al. Emission characteristics of VOCs during the production of asphalt using heavy-viscous crude oil. Acta Sci. Circum. 2021, 41, 2282–2290. [Google Scholar]
- Ministry of Ecology and Environment of the People’s Republic of China (MEE, PRC). Emission from Stationary Sources-Samplingof Volatile Organic Compounds-Bag Method. HJ 732-2014. Available online: http://www.mee.gov.cn/ywgz/fgbz/bz/bzwb/jcffbz/201501/t20150115_294220.shtml (accessed on 13 November 2021).
- Gao, Z.F.; Zhang, X.H.; Zhao, W.J.; Zhang, X.M.; Xue, Z.G.; Du, J.H. Characteristic analysis of VOCs emitted from a typical coking plant. Res. Environ. Sci. 2019, 32, 1540–1545. [Google Scholar]
- Carter, W.P.L. Development of ozone reactivity scales for volatile organic compounds. J. Air Waste Manag. 1994, 44, 881–889. [Google Scholar] [CrossRef]
- Carter, W.P.L. Development of the SAPRC-07 chemical mechanism. Atmos. Environ. 2010, 44, 5324–5335. [Google Scholar] [CrossRef]
- Grosjean, D. In situ organic aerosol formation during a smog episode estimated production and chemical functionality. Atmos. Environ. 1992, 26, 953–963. [Google Scholar] [CrossRef]
- Grosjean, D.; Seinfeld, J.H. Parameterization of the formation potential of secondary organic aerosols. Atmos. Environ. 1989, 23, 1733–1747. [Google Scholar] [CrossRef]
Figure 1.
Ozone formation contribution of VOC emissions from different processes.

Figure 2.
Ozone formation contribution of VOC emissions from different species.

Figure 3.
SOA formation contribution of VOC emissions from different processes.

Figure 4.
SOA formation contribution of VOC emissions from different species.


Table 1.
Sampling distribution plans.
| Process Type | Main Raw Materials and Ingredients | Terminal Treatment Facilities | Sampling Location |
| grille | unsaturated resin, vinyl resin, curing agent, plasticizer, etc. | UV Photooxidation + activated carbon | exhaust |
| sheet | UV Photooxidation + activated carbon | exhaust | |
| twine | UV Photooxidation + activated carbon | exhaust | |
| molded | UV Photooxidation + activated carbon | exhaust | |
| pultrusion | UV Photooxidation + activated carbon | exhaust |
Table 2.
Emission composition spectrum of VOCs from a typical production process/µg·m−3.
| Composition | Production Process | ||||
|---|---|---|---|---|---|
| Grille | Sheet | Twine | Molded | Pultrusion | |
| methyl chloride | 124 | N.D. | 479 | 6.41 | 18.4 |
| isobutane | N.D. | N.D. | 52.6 | 41.7 | 54.6 |
| ethylene | 17.7 | N.D. | 81.5 | 20.4 | 129 |
| acetylene | N.D. | N.D. | 35.5 | 18.4 | 14.9 |
| 1-butene | N.D. | N.D. | 23.2 | 10.9 | 106 |
| butane | N.D. | N.D. | 14.2 | 7.04 | N.D. |
| ethane | N.D. | N.D. | 33.2 | 26.0 | 22.2 |
| ethyl chloride | 14.4 | N.D. | 9.30 | N.D. | N.D. |
| ethanol | 8.71 | 19.4 | 1550 | 2120 | 22.7 |
| acrolein | N.D. | N.D. | 60.4 | 17.6 | 15.3 |
| acetone | 11.2 | 14.6 | 303 | 196 | 1367 |
| isopentane | N.D. | N.D. | 14.5 | 9.22 | 13.4 |
| isopropyl alcohol | N.D. | N.D. | 20.9 | 31.7 | 15.7 |
| pentane | N.D. | N.D. | 10.8 | N.D. | N.D. |
| 1,1-dichloroethylene | N.D. | N.D. | 25.8 | N.D. | N.D. |
| cis-2-pentene | N.D. | N.D. | 6.70 | N.D. | 16.7 |
| dichloromethane | 10.5 | 2630 | 94,369 | 953 | 4315 |
| carbon disulfide | N.D. | N.D. | 12.2 | N.D. | N.D. |
| propylene | N.D. | N.D. | 20.0 | 9.36 | 18.1 |
| propane | N.D. | N.D. | 28.5 | 16.8 | 16.0 |
| 1,1-dichloroethane | N.D. | N.D. | 5.45 | N.D. | N.D. |
| vinyl acetate | N.D. | N.D. | 28.3 | N.D. | 6.35 |
| methyl ethyl ketone | 464 | 9.50 | 69.7 | 12.7 | 87.3 |
| ethyl acetate | N.D. | N.D. | 368 | 518 | N.D. |
| n-hexane | N.D. | N.D. | 6.59 | N.D. | 14.0 |
| chloroform | 20.9 | N.D. | 126 | 35.6 | 13.7 |
| 1,2-dichloroethane | 257 | 39.8 | 901 | 2697 | 168 |
| benzene | N.D. | N.D. | 42.2 | 10.7 | 64.9 |
| carbon tetrachloride | 7.60 | N.D. | 11.7 | 18.2 | 26.0 |
| cyclohexane | N.D. | N.D. | 93.8 | 73.1 | 76.4 |
| 1,2-dichloropropane | 45.0 | N.D. | 79.4 | 425 | 1905 |
| 1,4-dioxane | N.D. | N.D. | 29.1 | N.D. | N.D. |
| methyl methacrylate | N.D. | N.D. | 26.2 | N.D. | N.D. |
| methylcyclohexane | N.D. | N.D. | 6.16 | N.D. | N.D. |
| 1,1,2-trichloroethane | 42.7 | N.D. | 38.8 | N.D. | N.D. |
| toluene | N.D. | N.D. | 13.4 | 6.22 | 8.47 |
| 2-methylheptane | N.D. | N.D. | 7.85 | N.D. | N.D. |
| 3-methylheptane | N.D. | N.D. | 6.42 | N.D. | N.D. |
| octane | N.D. | N.D. | 28.8 | N.D. | N.D. |
| chlorobenzene | N.D. | N.D. | 8.77 | N.D. | N.D. |
| ethylbenzene | 8.45 | 5.76 | 53.1 | 145 | 22.5 |
| p-m-xylene | 18.9 | N.D. | 44.5 | 368 | 15.1 |
| styrene | 2377 | 8759 | 260,335 | 13,850 | 86,461 |
| 1,1,2,2-tetrachloroethane | N.D. | N.D. | 6.81 | N.D. | N.D. |
| o-xylene | 9.64 | N.D. | 37.8 | 216 | 12.0 |
| nonane | N.D. | N.D. | 20.8 | N.D. | N.D. |
| cumene | N.D. | N.D. | 81.9 | 13.0 | 12.8 |
| benzaldehyde | 24.0 | 61.9 | 140 | 24.7 | 30.7 |
| propylbenzene | N.D. | N.D. | 59.9 | 27.8 | 11.0 |
| m-ethyltoluene | N.D. | N.D. | 13.7 | 86.9 | 11.8 |
| p-ethyltoluene | N.D. | N.D. | N.D. | 23.1 | N.D. |
| 1,3,5-trimethylbenzene | N.D. | N.D. | N.D. | 18.4 | N.D. |
| o-ethyltoluene | N.D. | N.D. | N.D. | 28.0 | N.D. |
| 1,2,4-trimethylbenzene | N.D. | N.D. | N.D. | 12.9 | N.D. |
| decane | N.D. | N.D. | 9.87 | N.D. | N.D. |
| 1,2,3-trimethylbenzene | N.D. | N.D. | 11.4 | N.D. | N.D. |
| naphthalene | N.D. | N.D. | 12.7 | 8.50 | 7.14 |
| dodecane | N.D. | N.D. | N.D. | N.D. | 22.7 |
Note: N.D. means not detected.
Publisher’s Note: MDPI stays neutral with regard to jurisdictional claims in published maps and institutional affiliations. |
© 2022 by the authors. Licensee MDPI, Basel, Switzerland. This article is an open access article distributed under the terms and conditions of the Creative Commons Attribution (CC BY) license (https://creativecommons.org/licenses/by/4.0/).
Share and Cite
MDPI and ACS Style
Hao, R.; Xue, S.; Sun, H.; Yang, T.; Wang, H. Emission Characteristics and the Environmental Impact of VOCs from Typical FRP Manufacture Industry. Atmosphere 2022, 13, 1274. https://doi.org/10.3390/atmos13081274
AMA Style
Hao R, Xue S, Sun H, Yang T, Wang H. Emission Characteristics and the Environmental Impact of VOCs from Typical FRP Manufacture Industry. Atmosphere. 2022; 13(8):1274. https://doi.org/10.3390/atmos13081274
Chicago/Turabian StyleHao, Run, Song Xue, Hao Sun, Tao Yang, and Hailin Wang. 2022. "Emission Characteristics and the Environmental Impact of VOCs from Typical FRP Manufacture Industry" Atmosphere 13, no. 8: 1274. https://doi.org/10.3390/atmos13081274
Note that from the first issue of 2016, this journal uses article numbers instead of page numbers. See further details here.