
The Impact of El-Niño and La-Niña on the Pre-Monsoon Convective Systems over Eastern India

 , , and
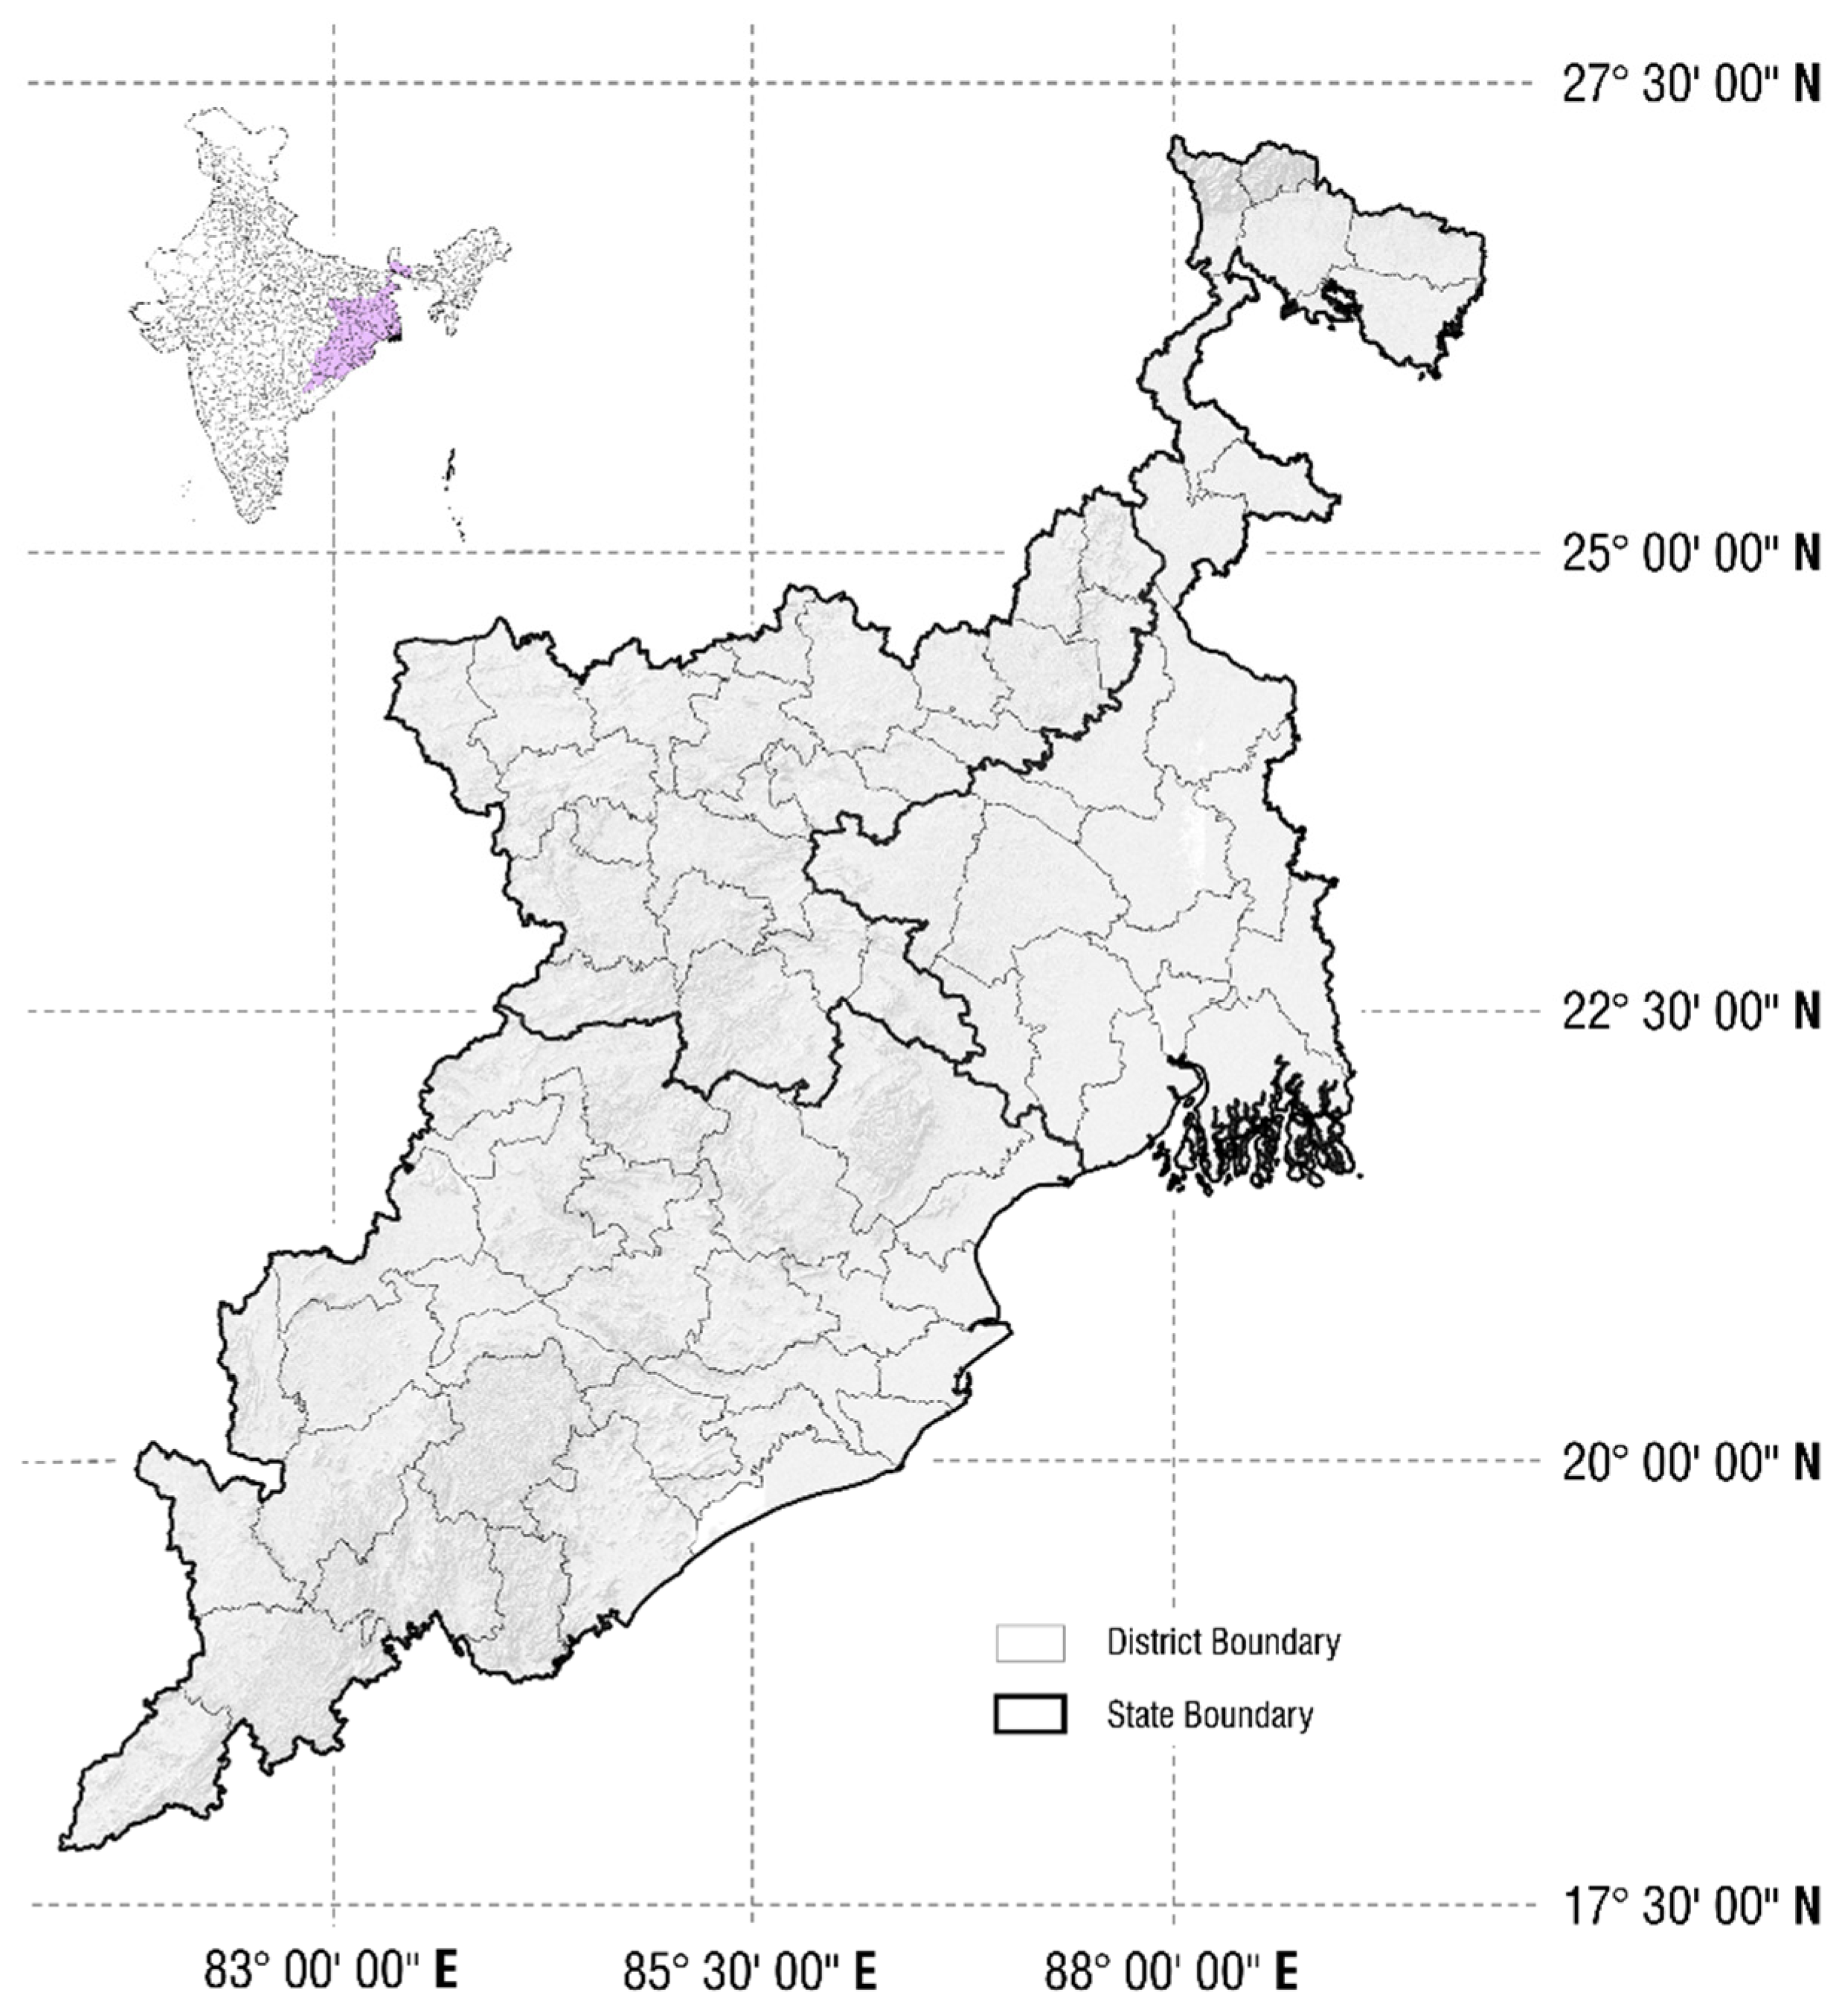
Abstract
:1. Introduction
2. Study Area, Data, and Methodology
3. Results and Discussion
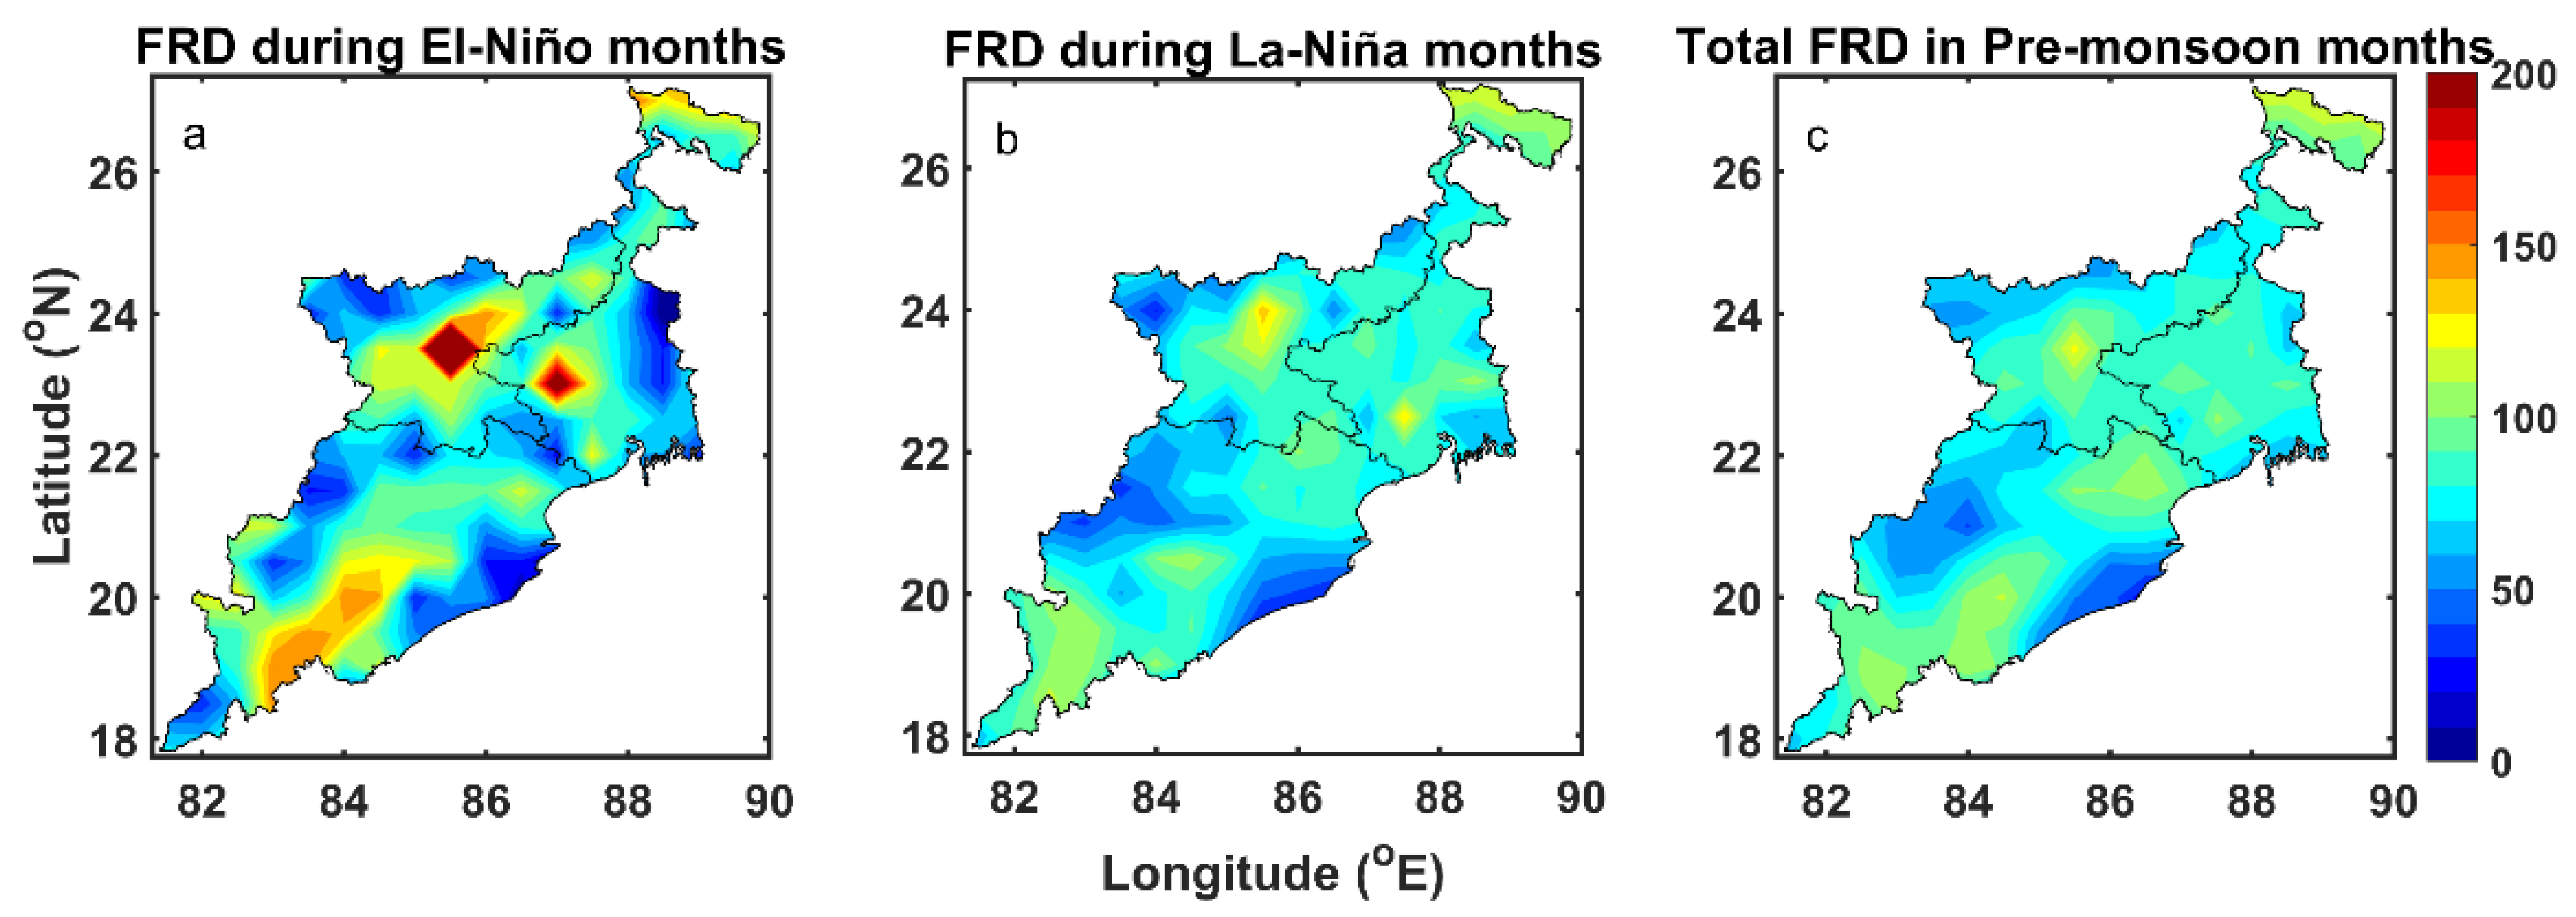
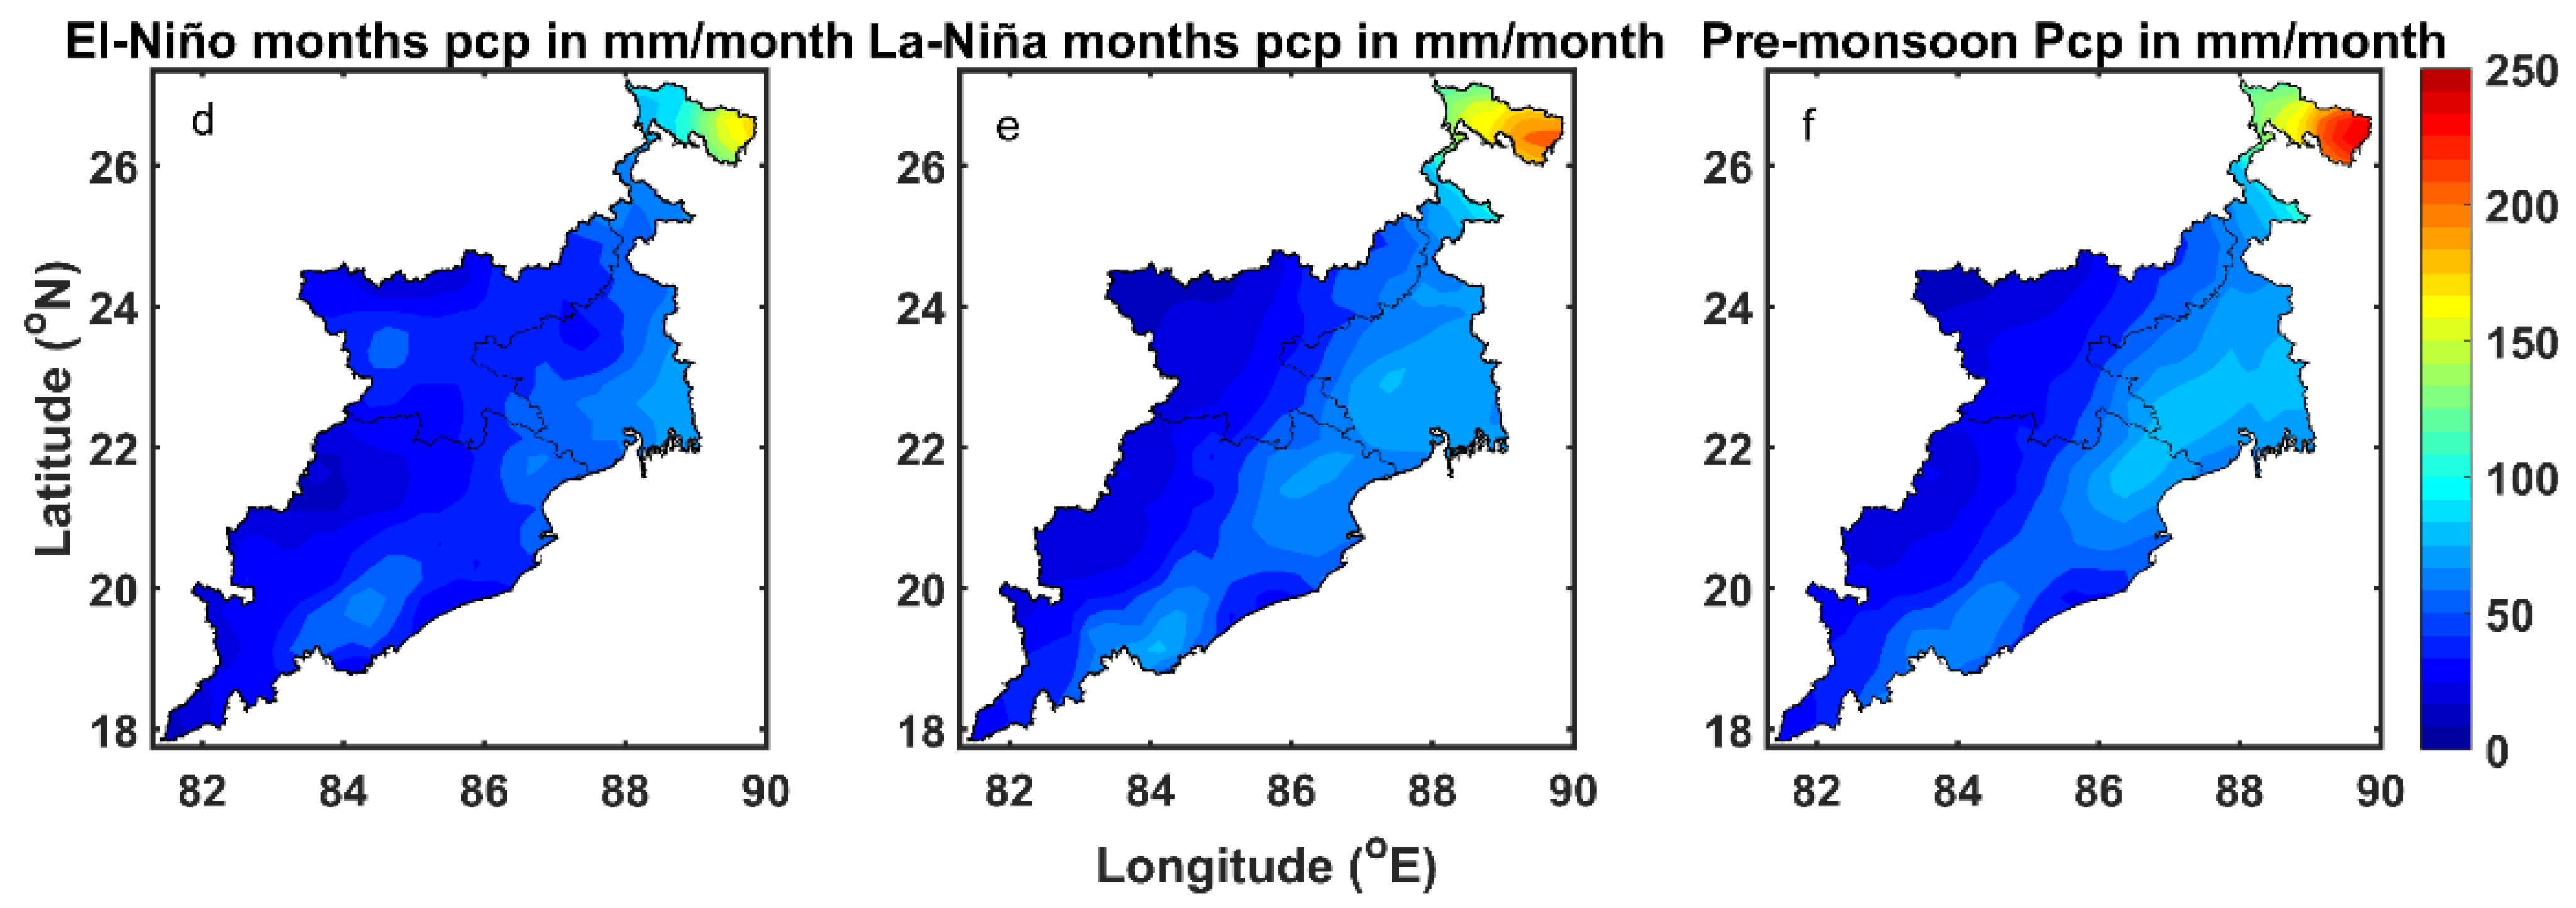
3.1. Lightning Activity Difference in El-Niño and La-Niña
3.2. Precipitation Variations during El-Niño and La-Niña Episodes and Their Anomaly
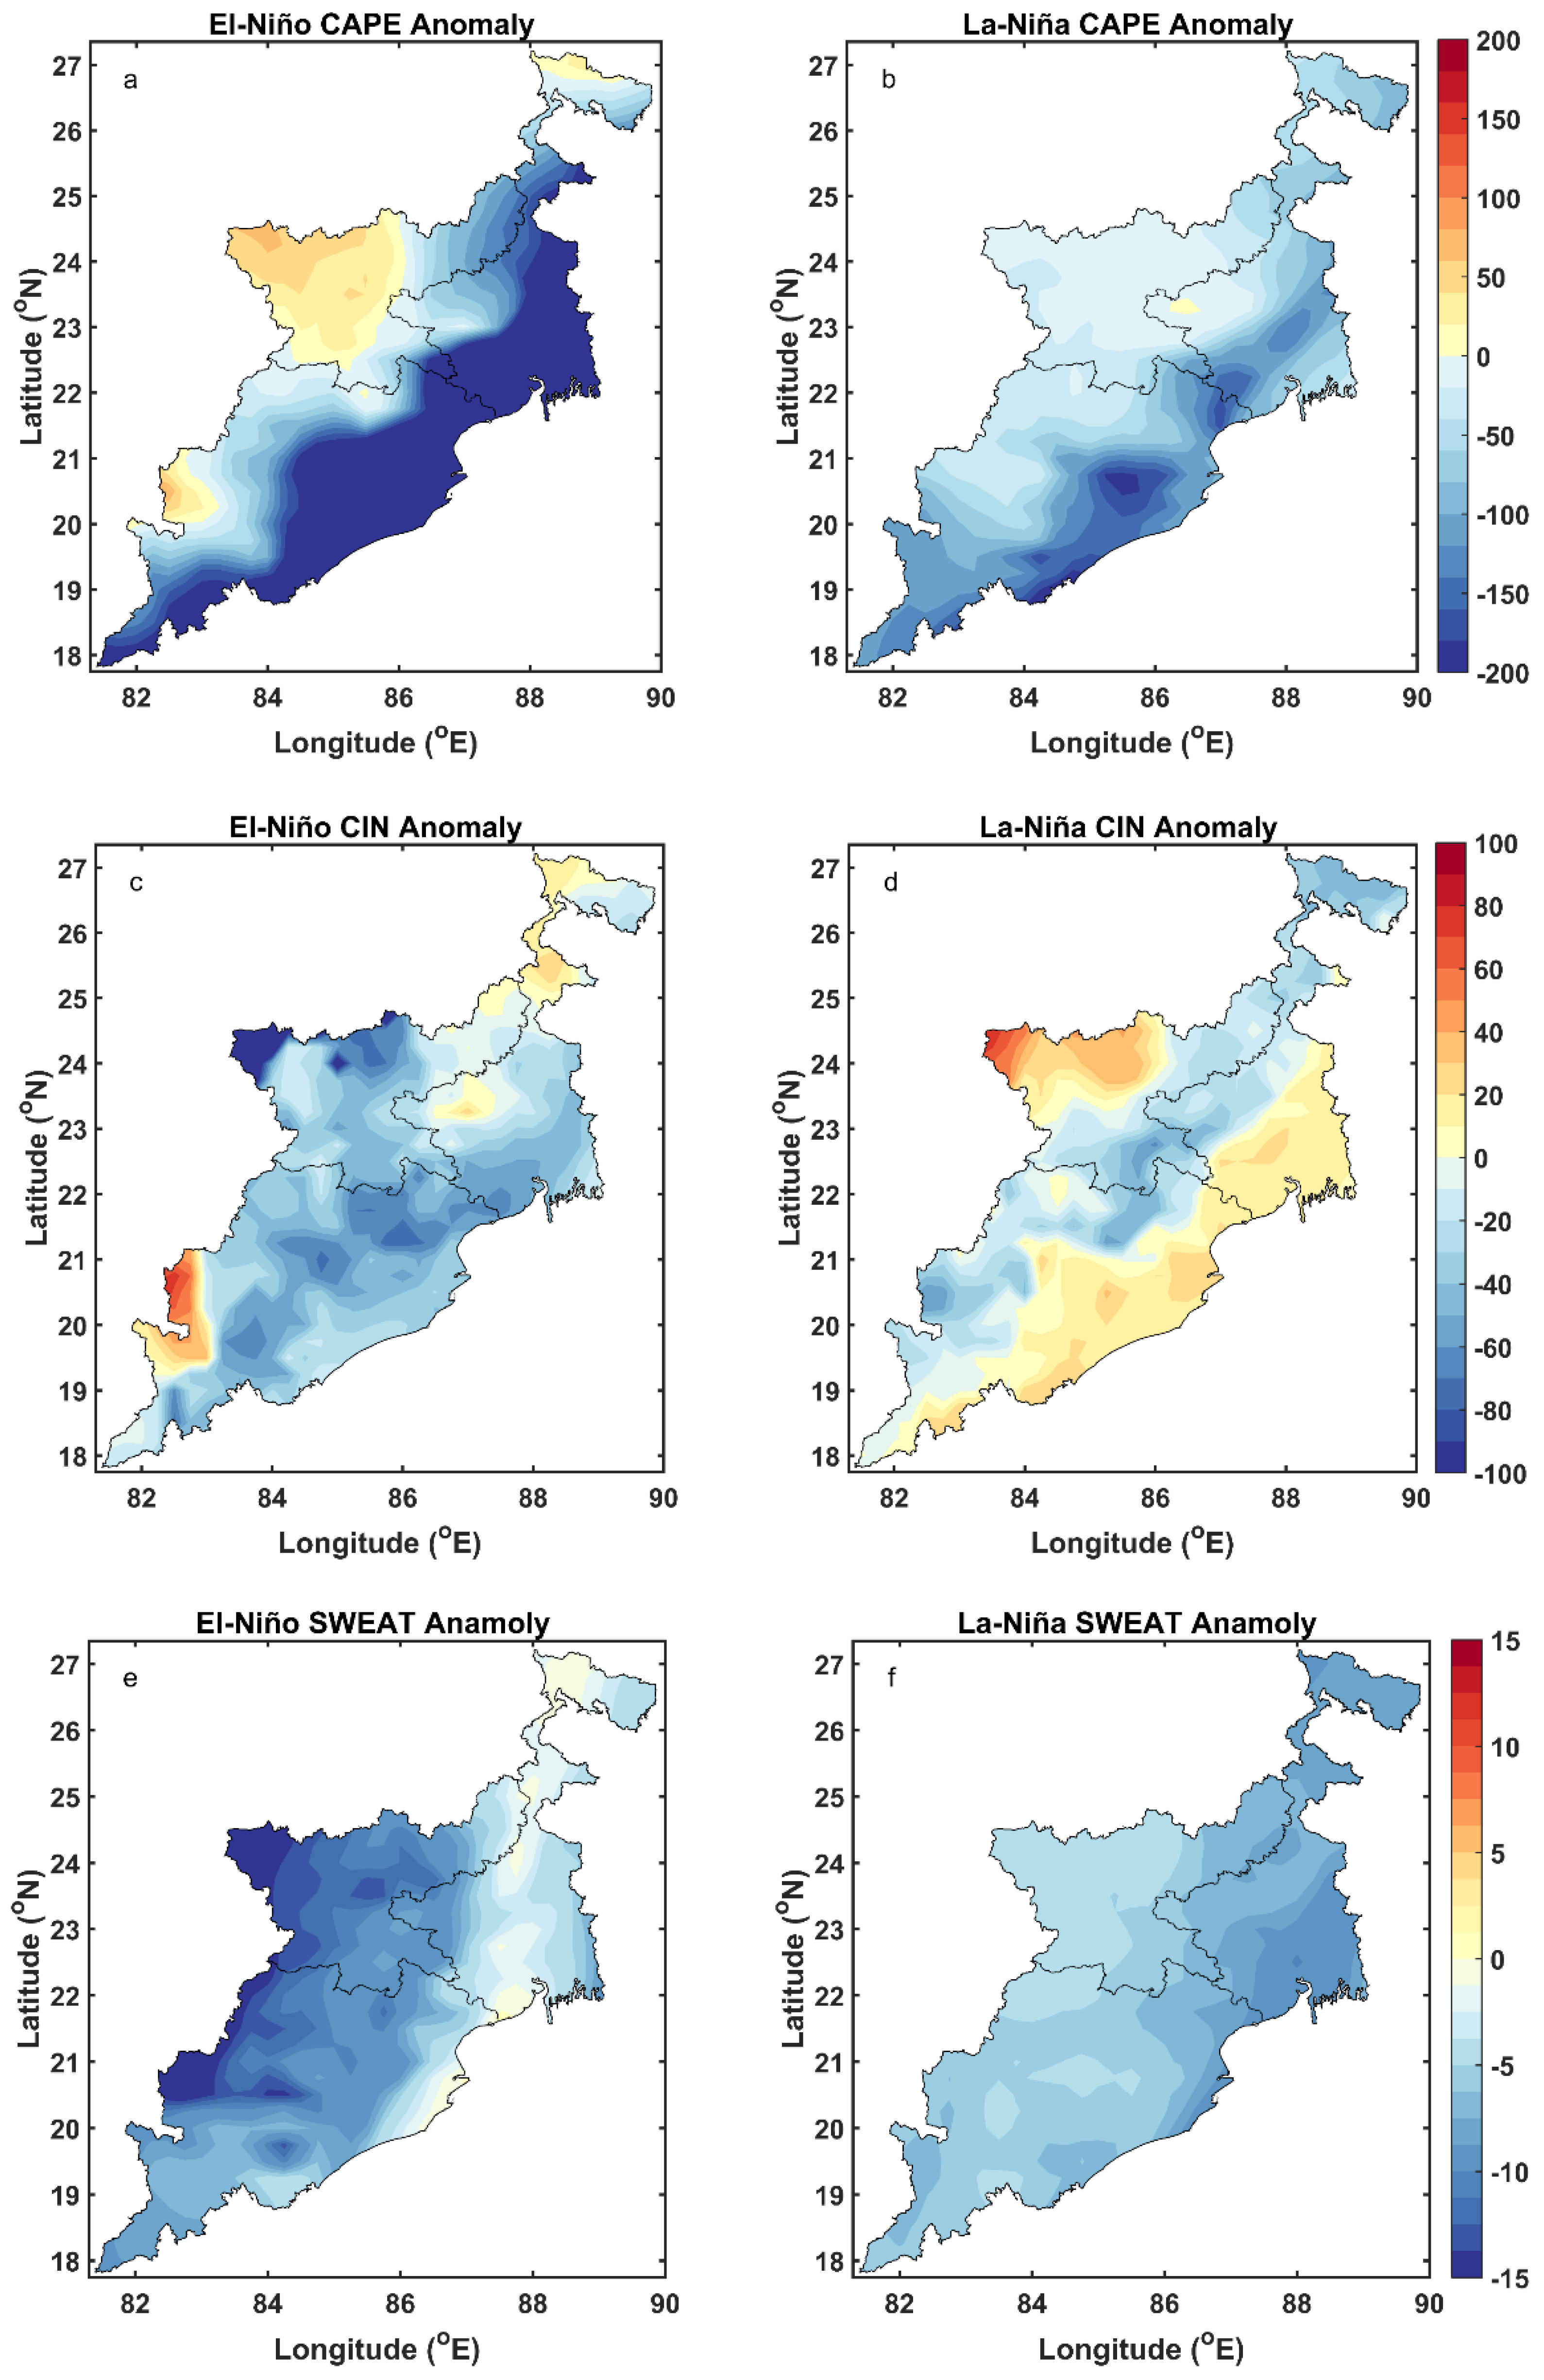
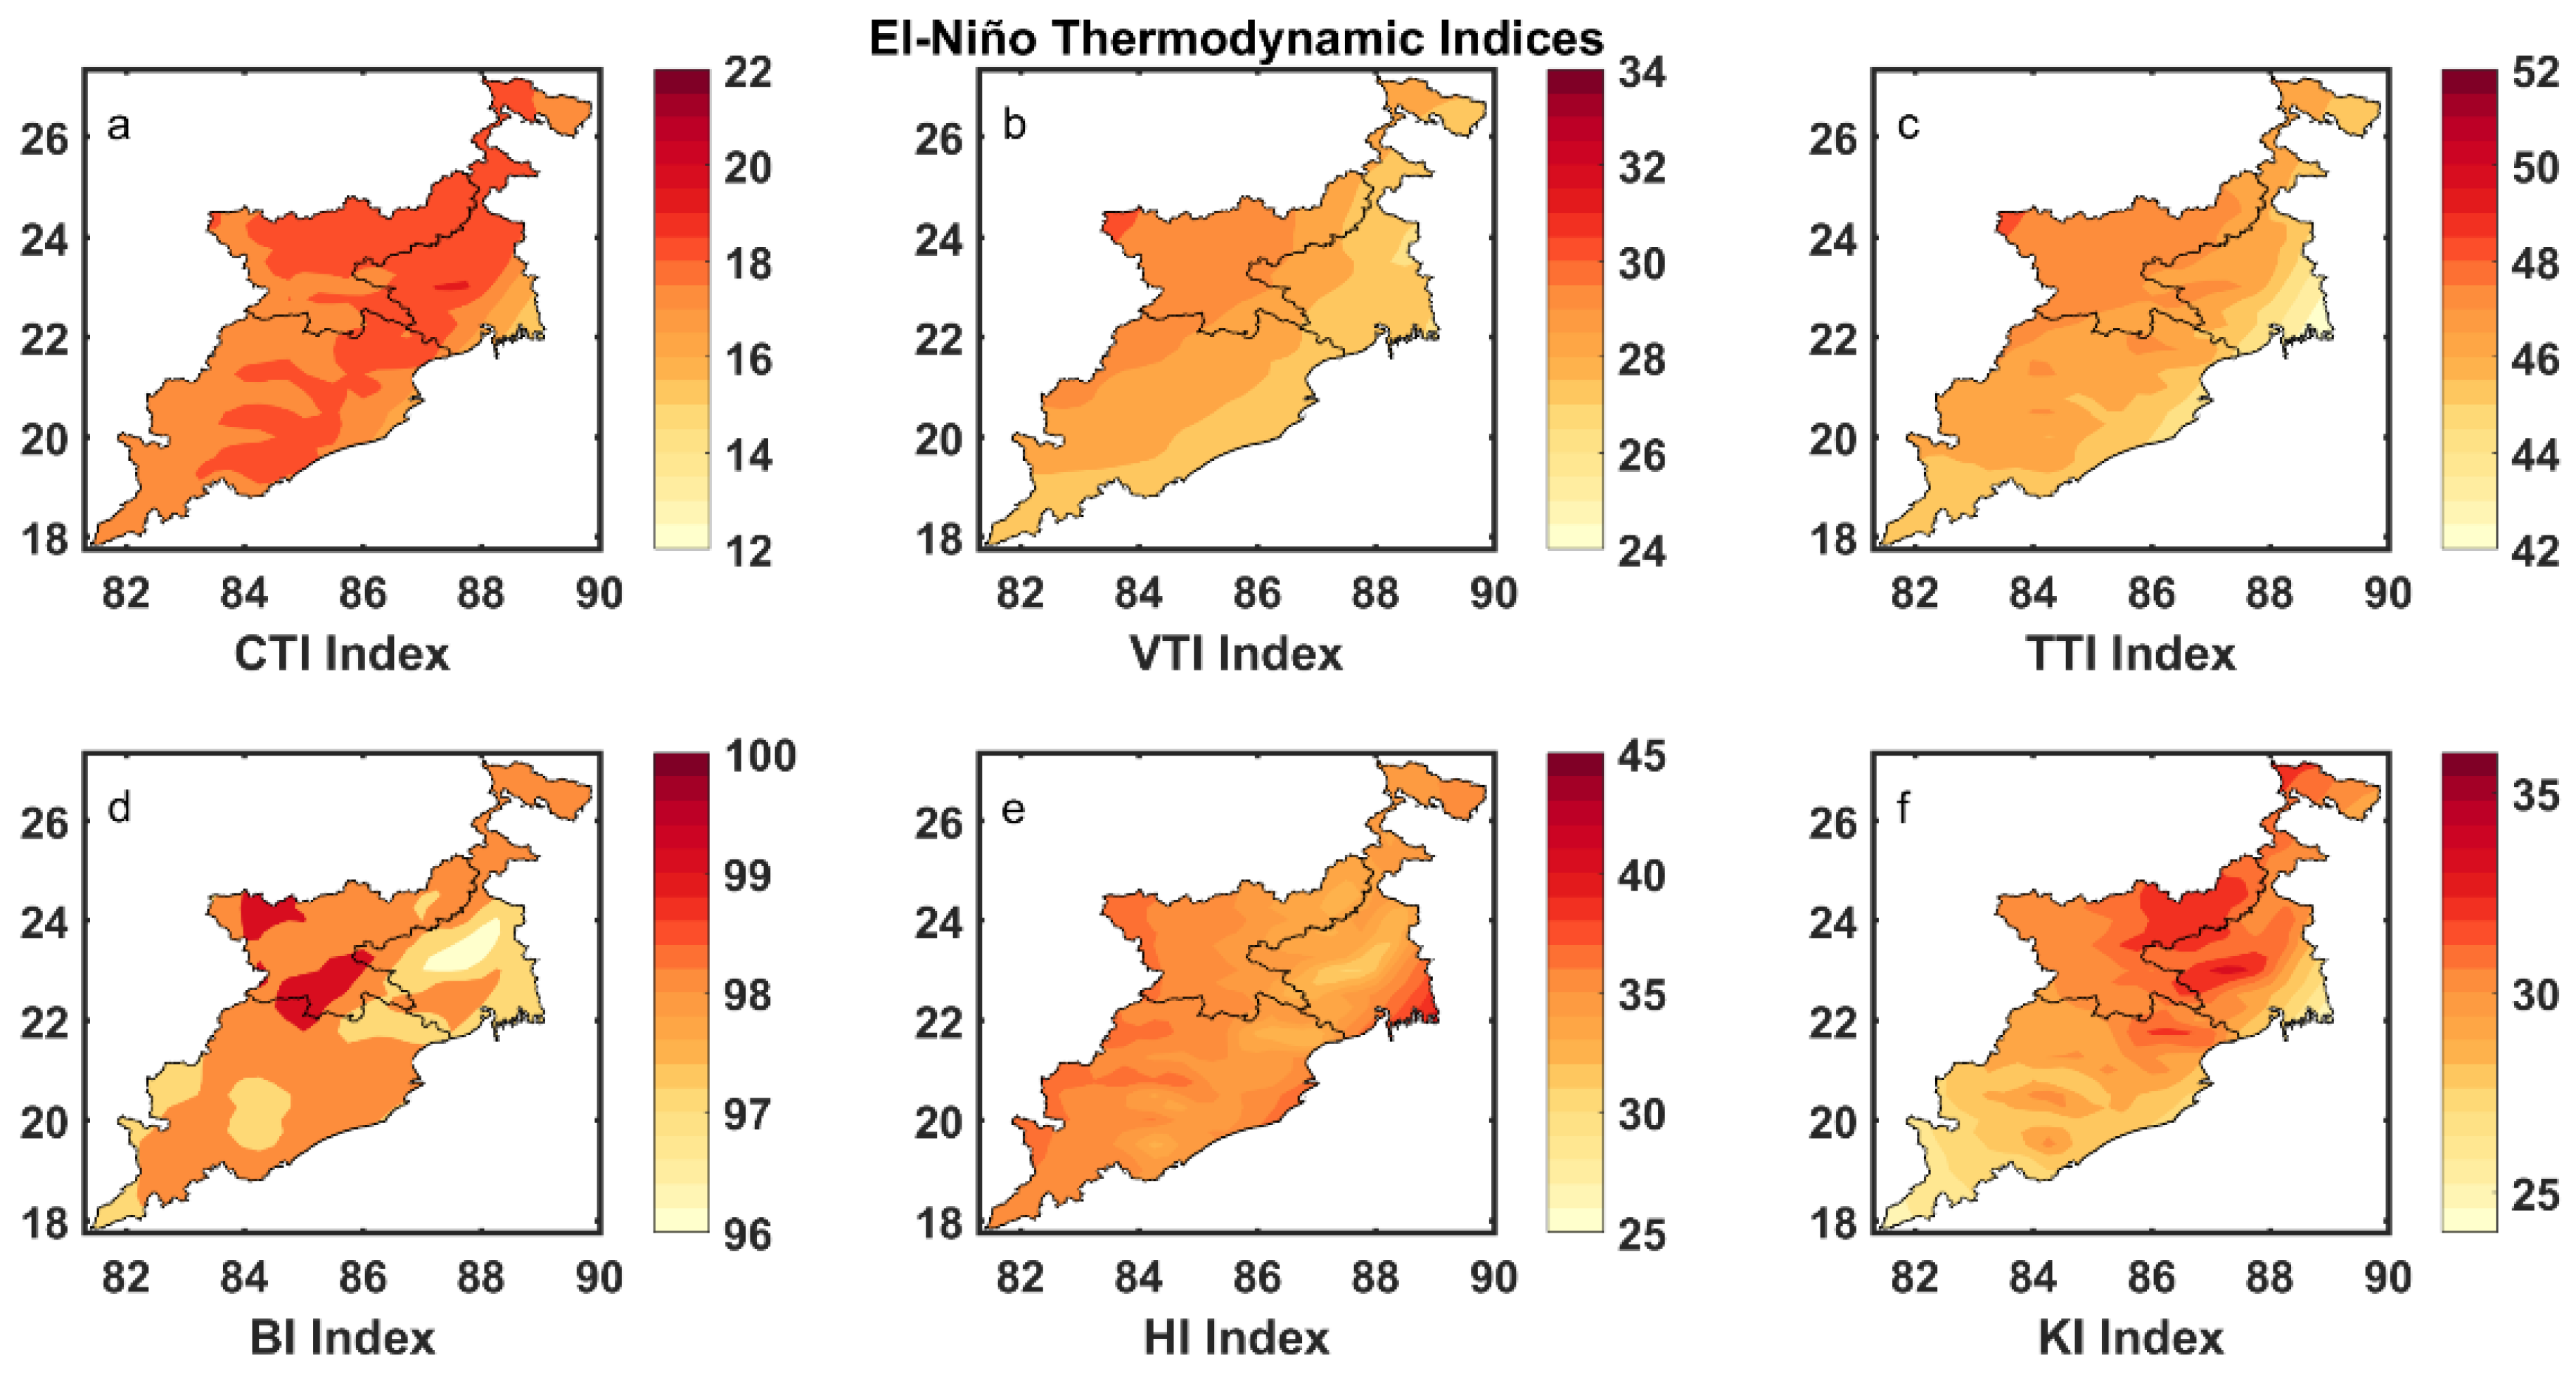
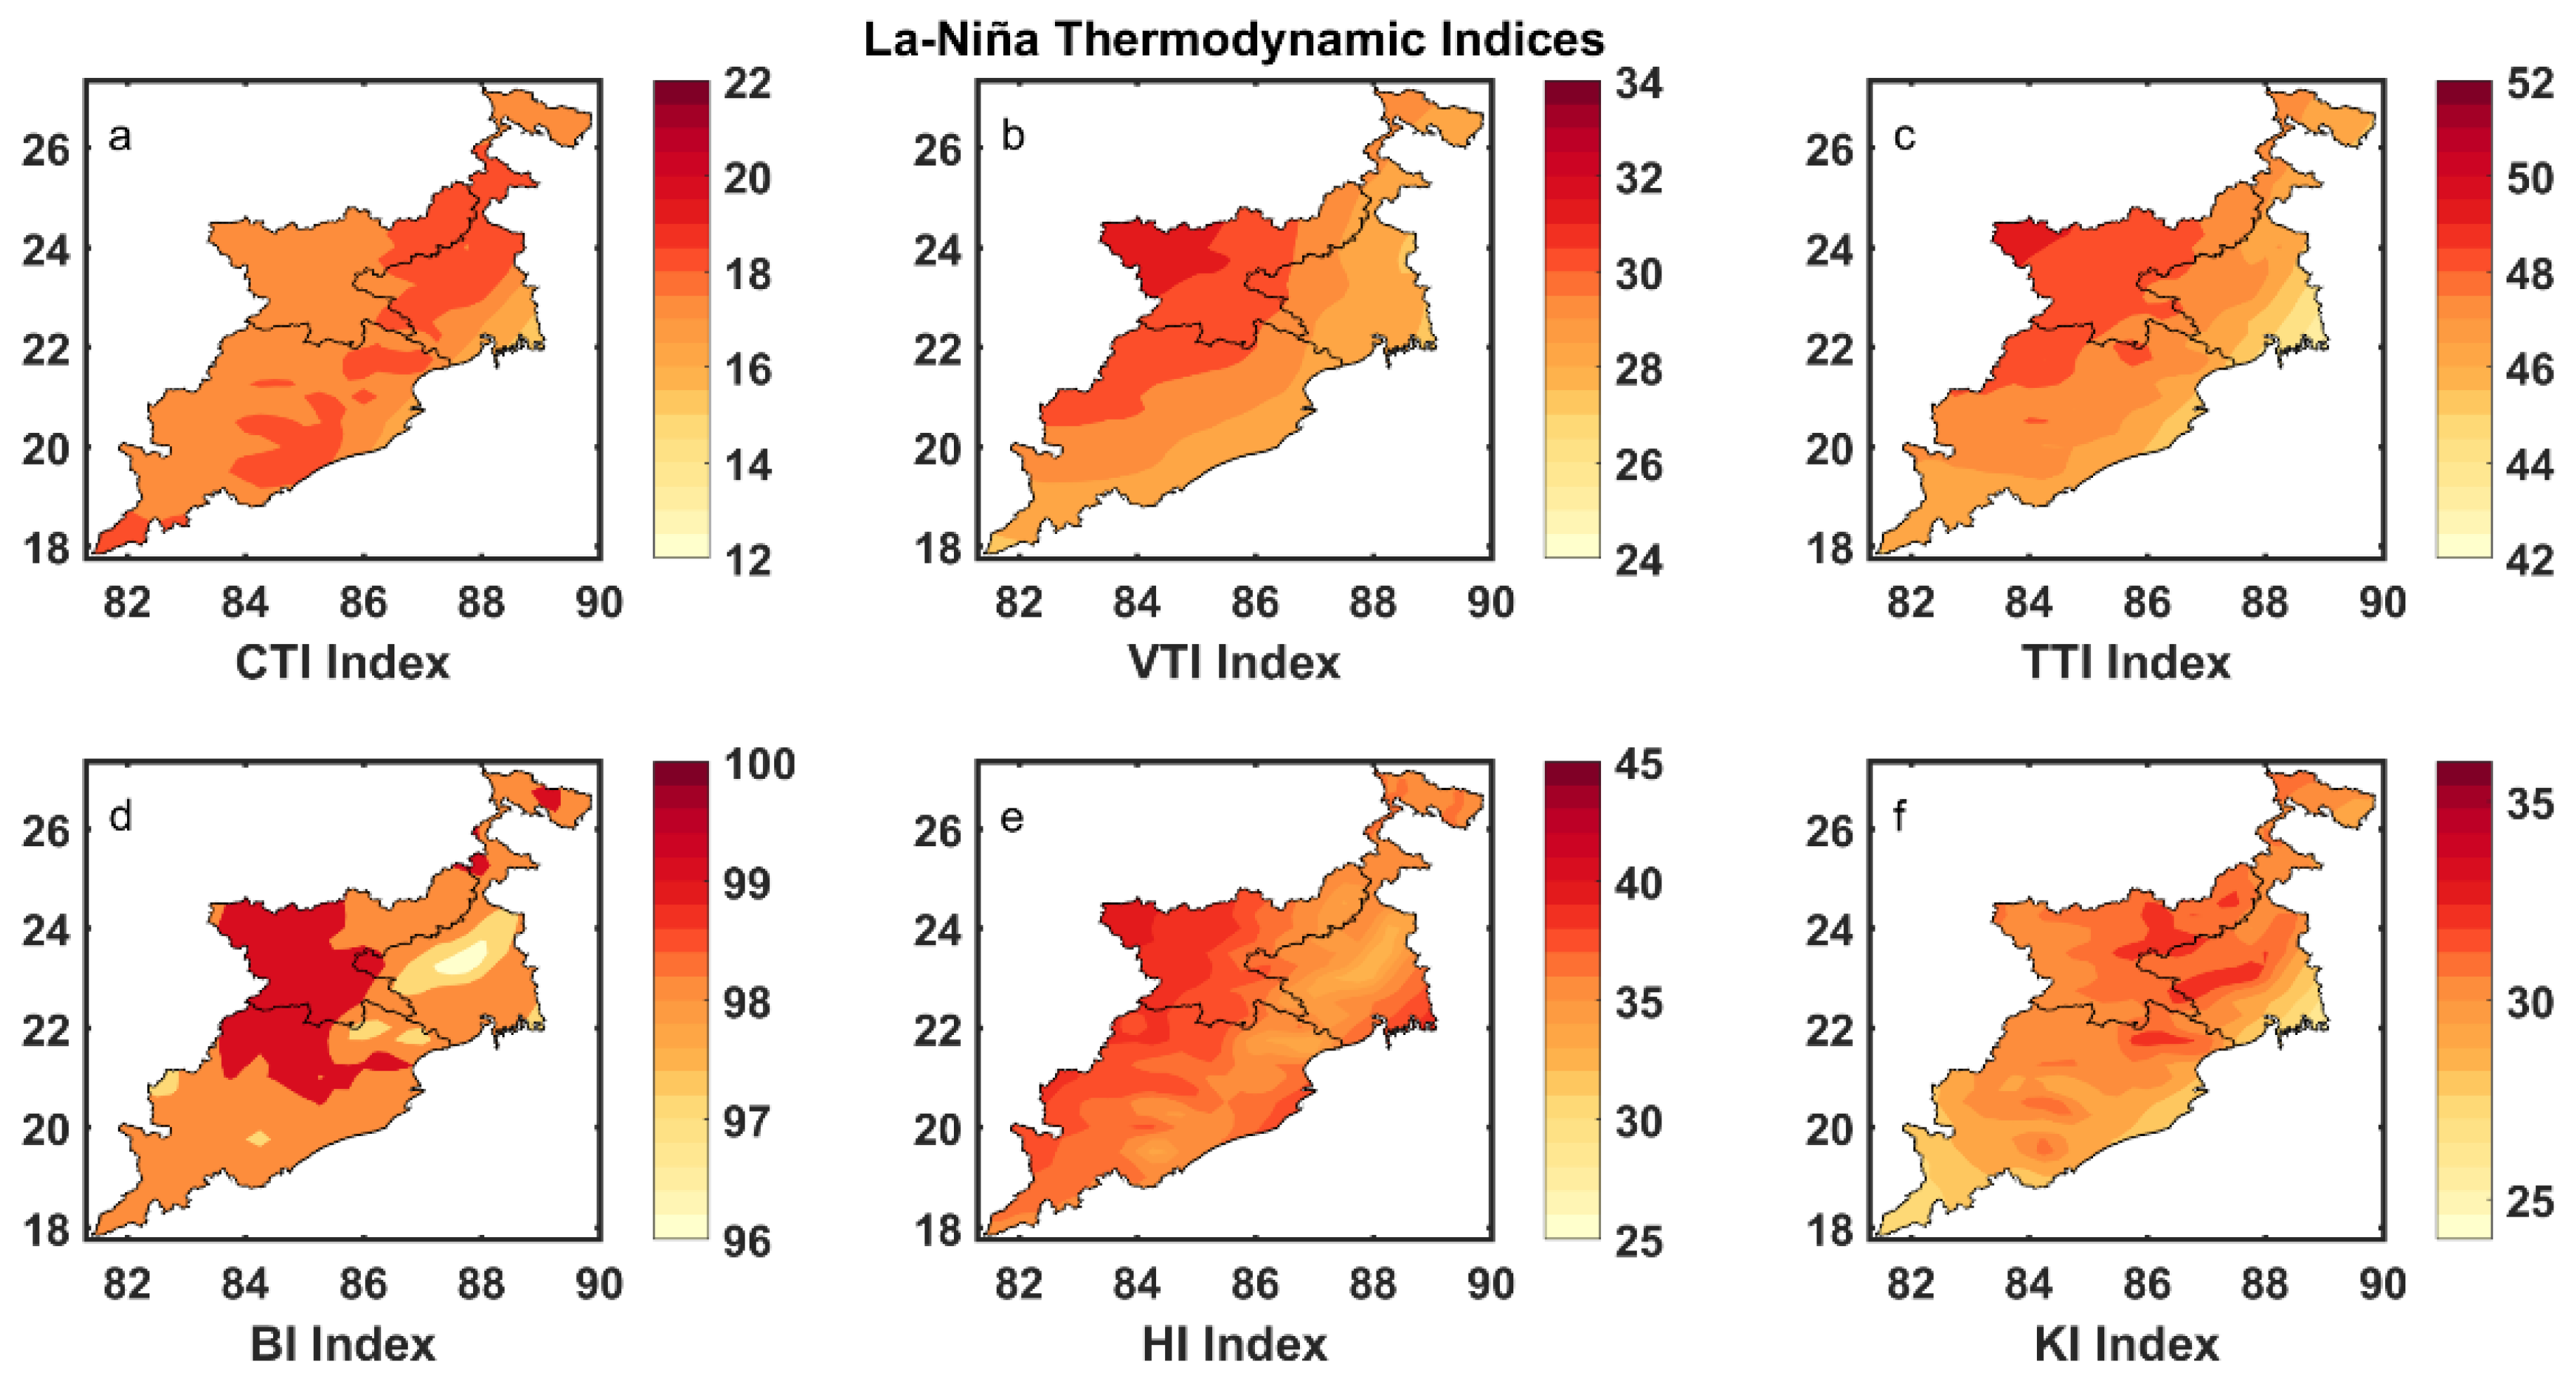
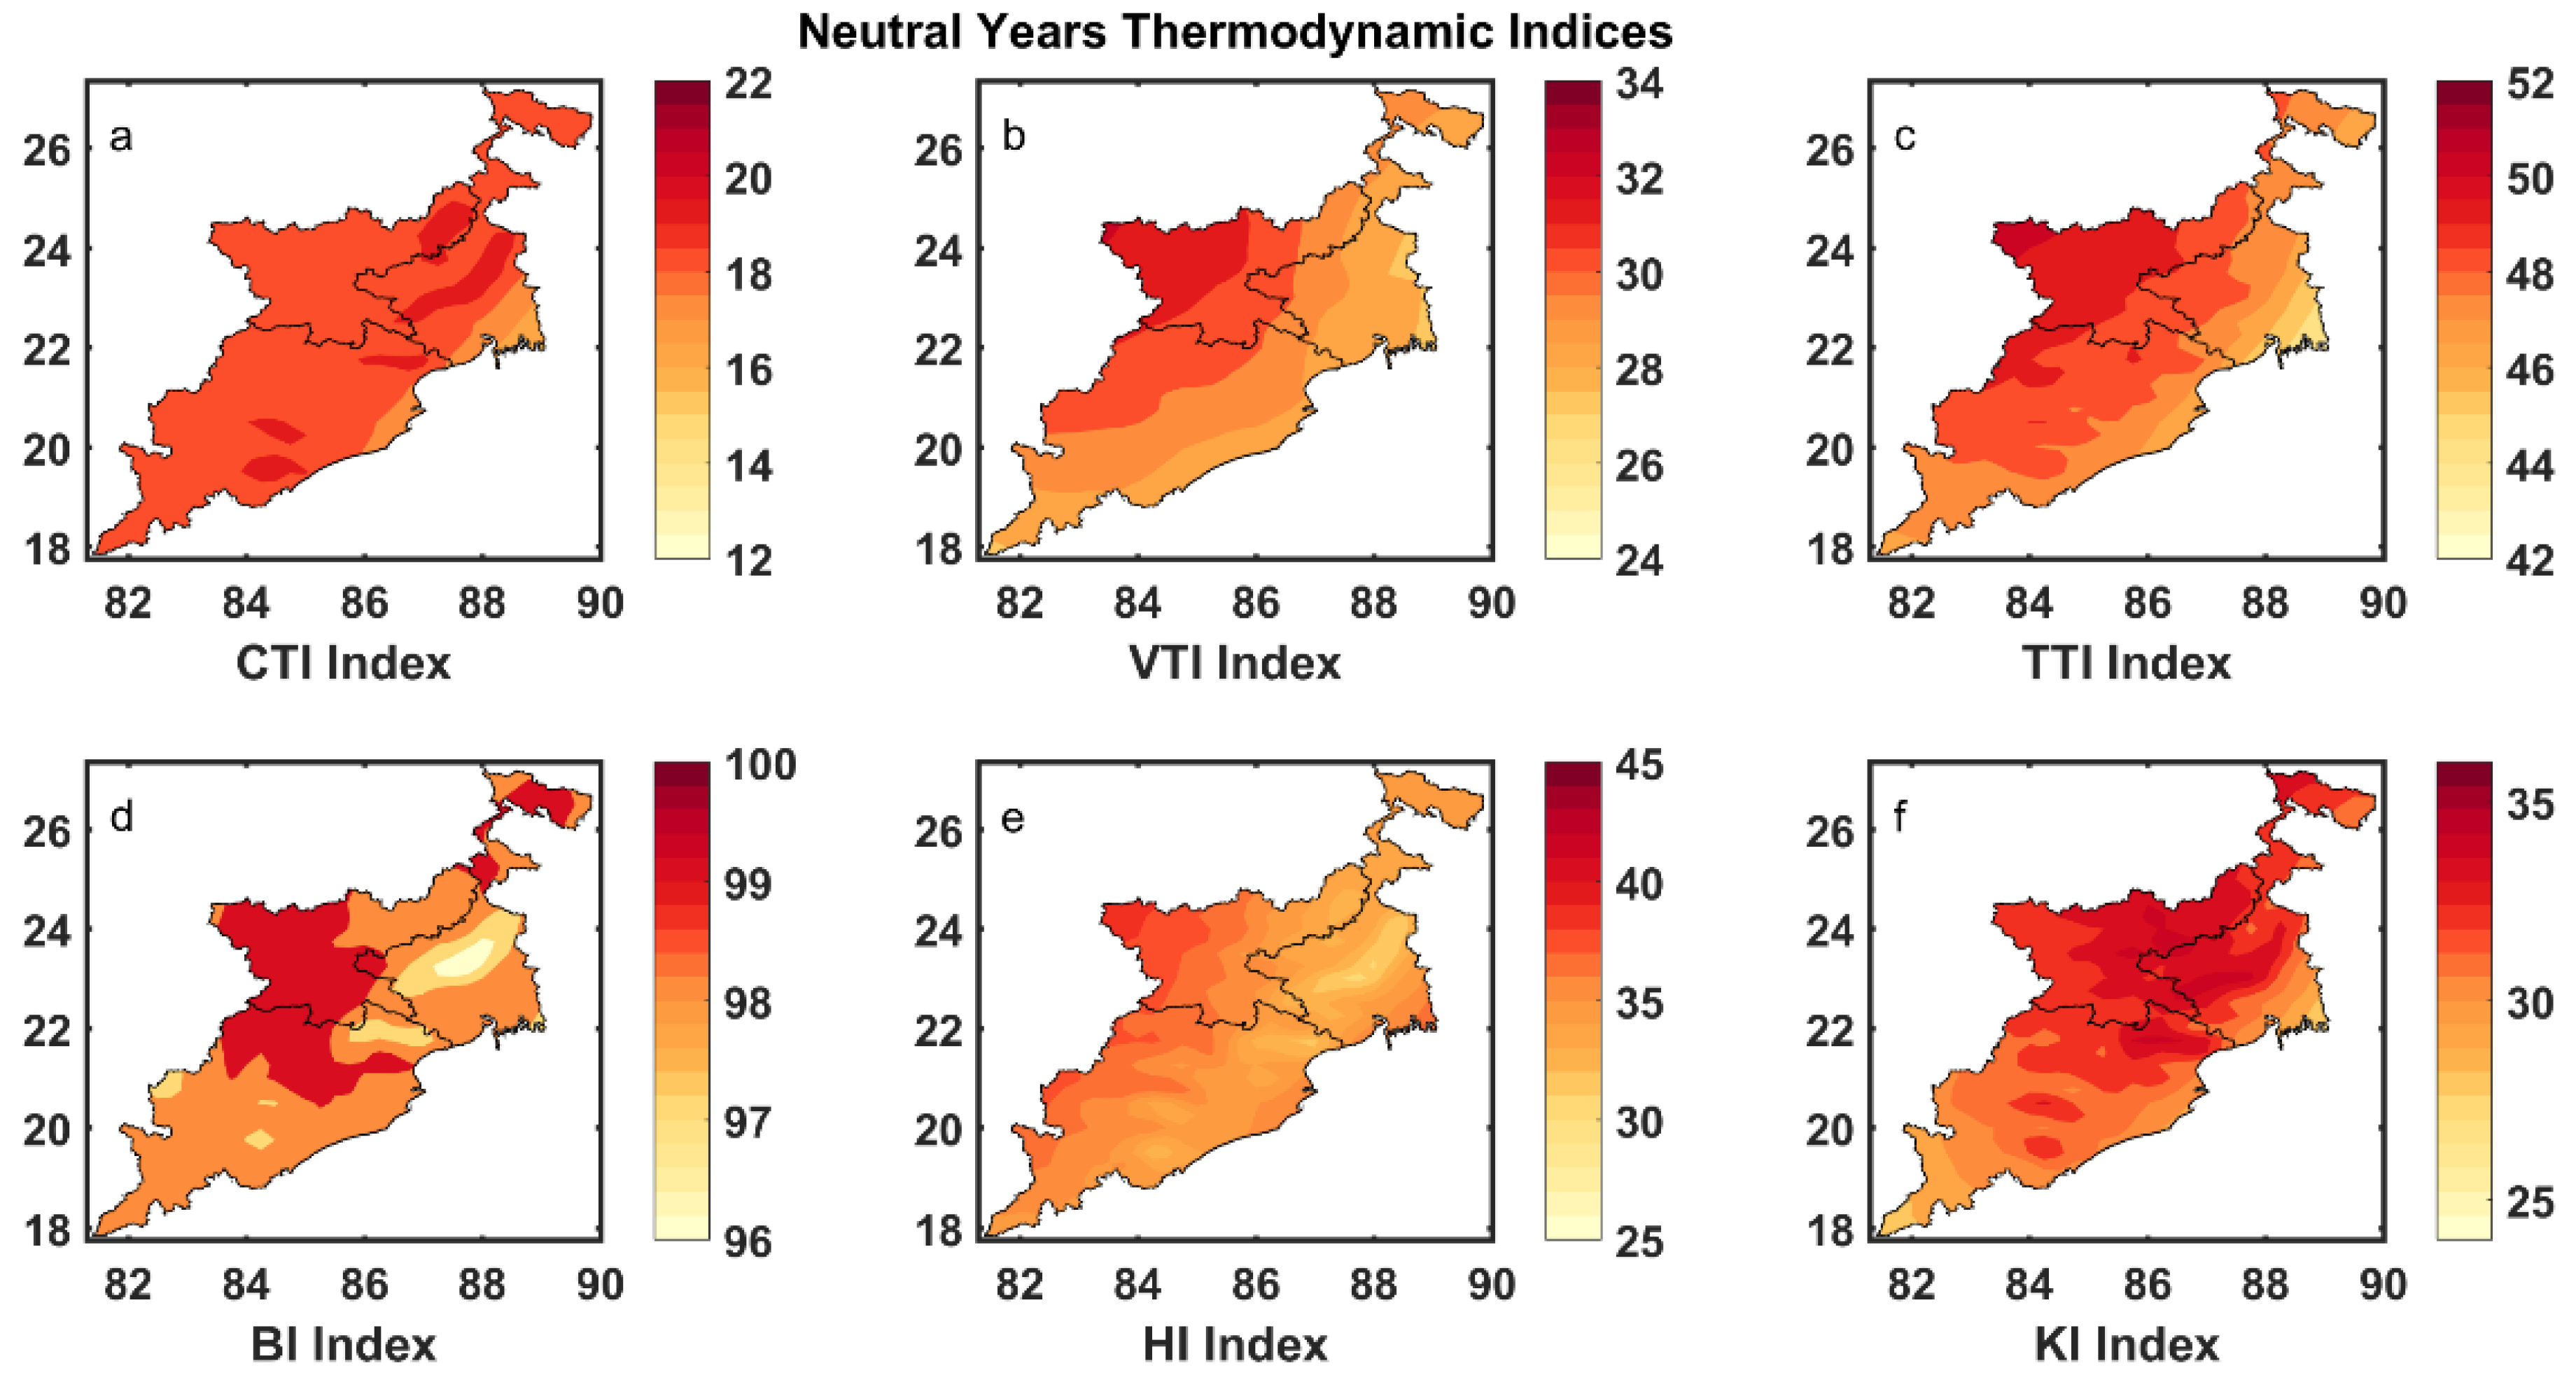
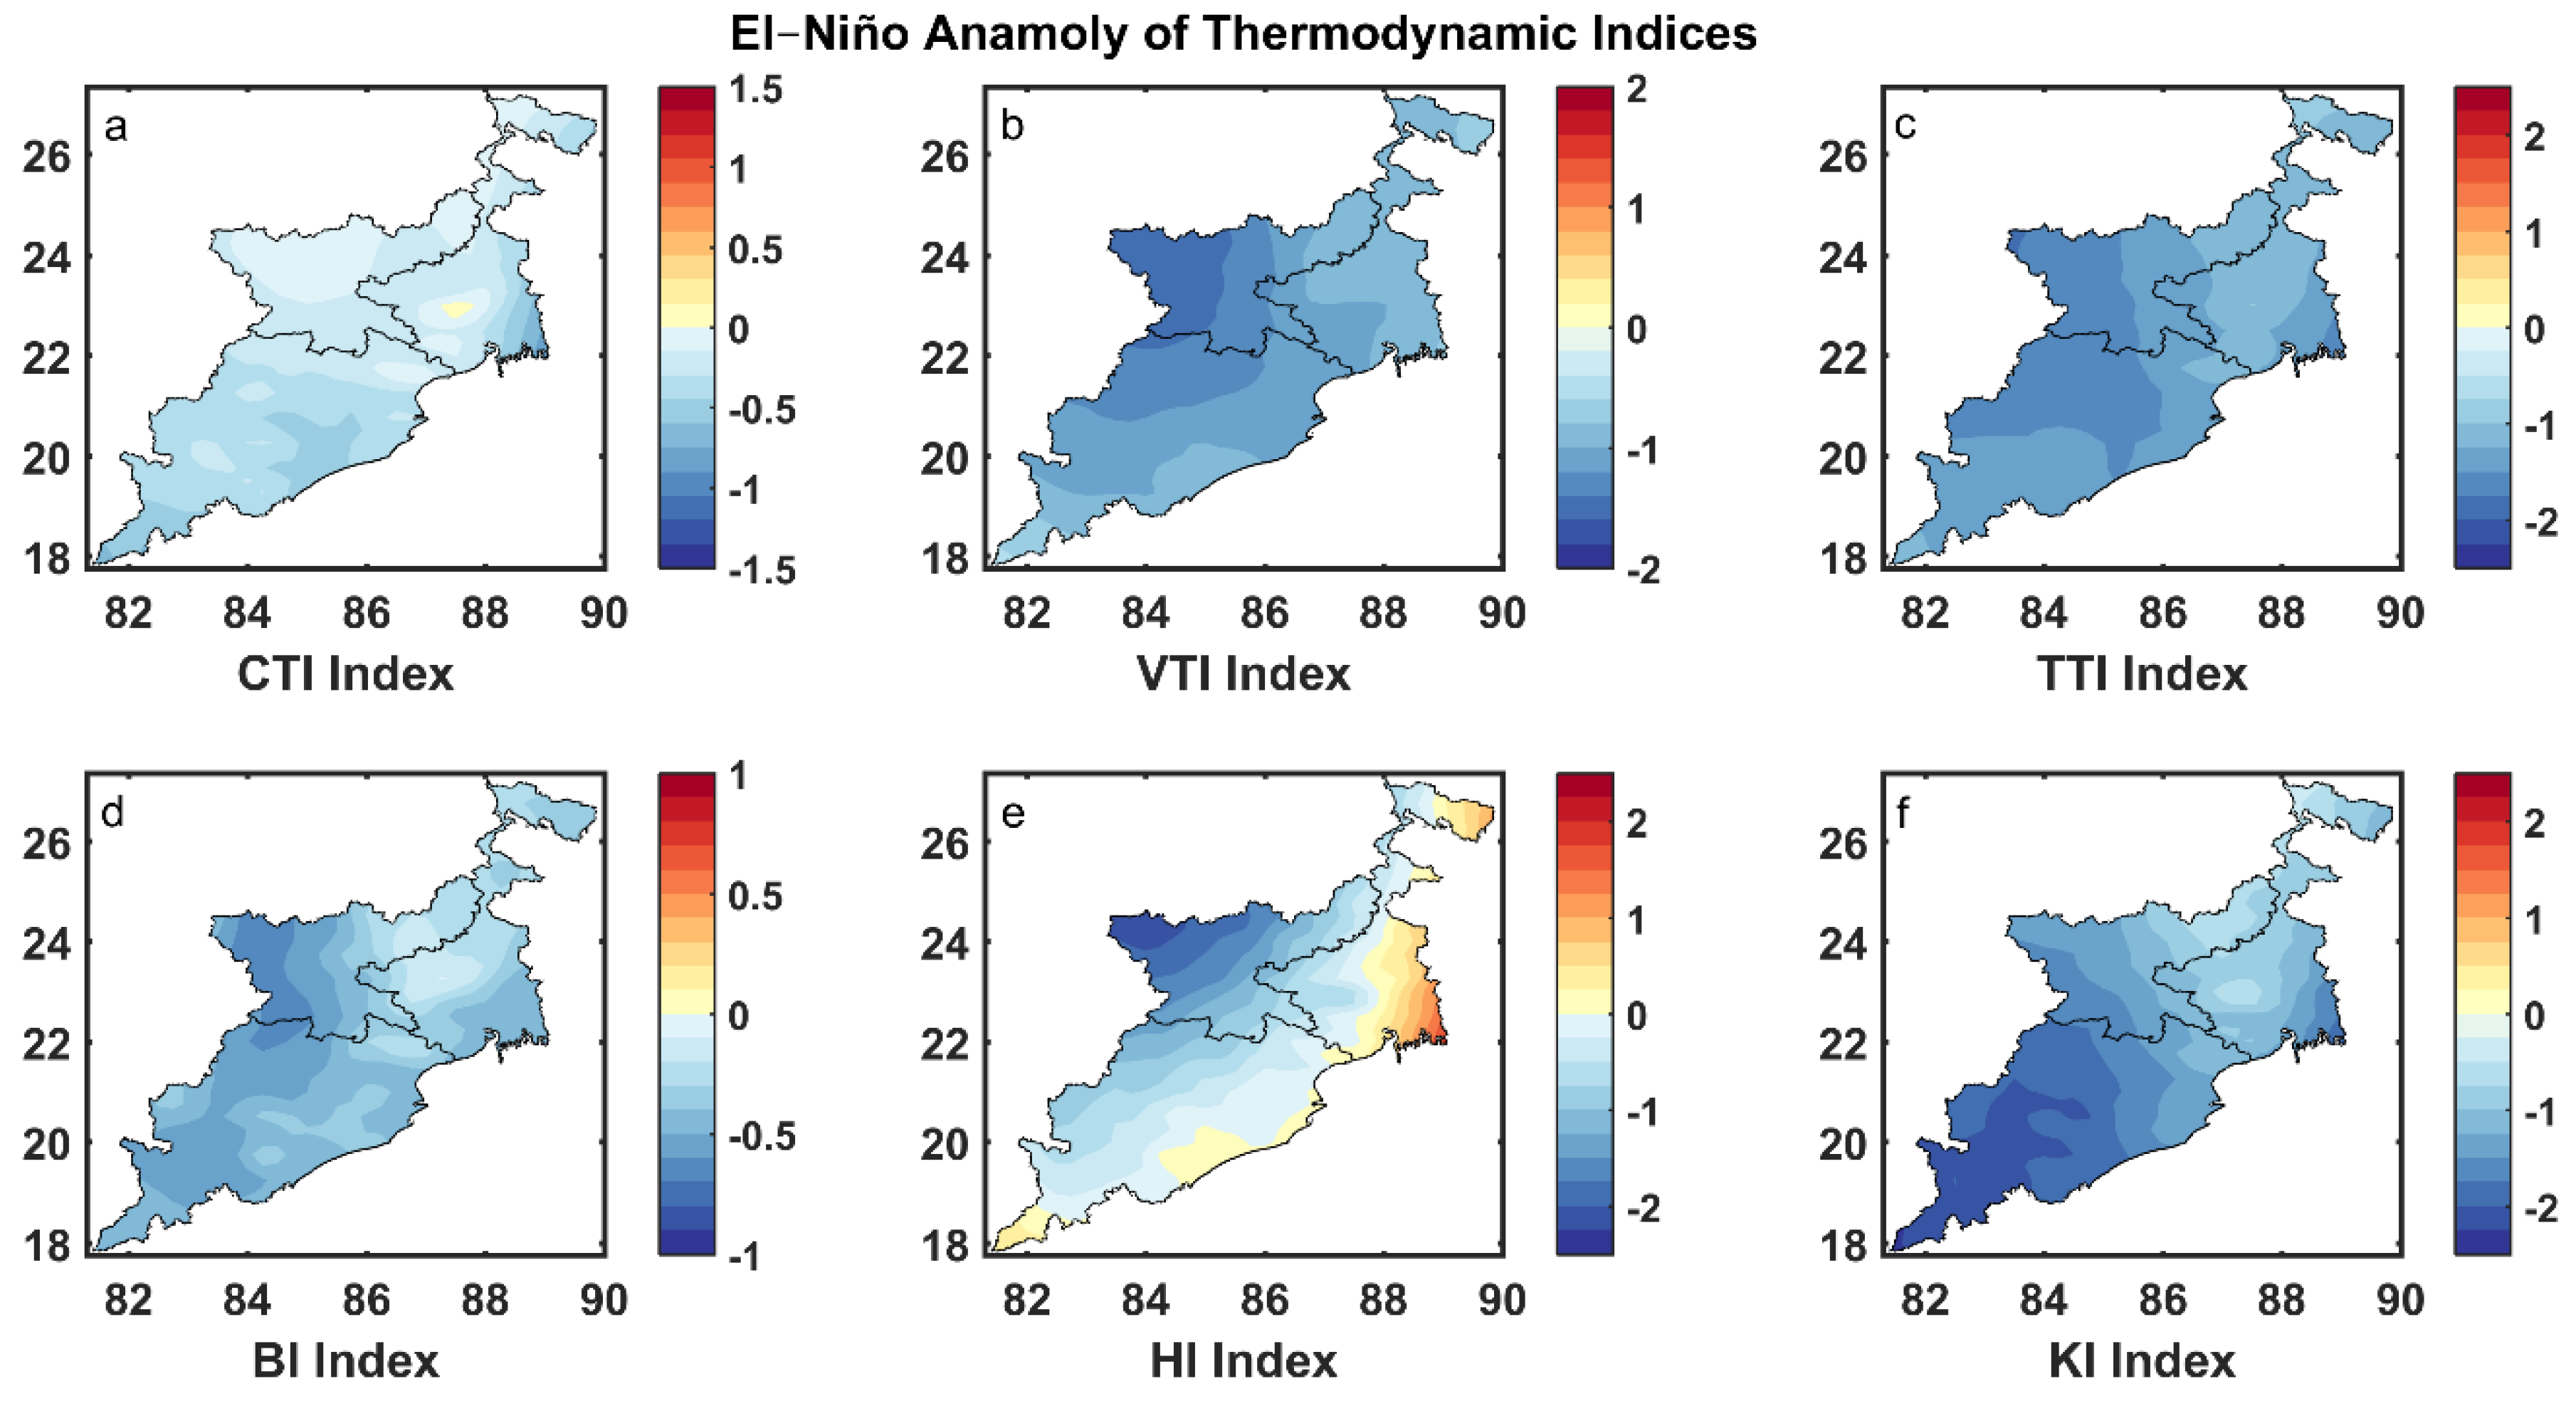
3.3. Thermodynamic Indices Variations during El-Niño and La-Niña Episodes and Their Anomalies
4. Summary
- The lightning FRD was higher during the El-Niño period over most of the study region. During El-Niño, the FRD anomalies were positive over parts of Odisha (southern, central, and northern), West Bengal (northern, some parts of western and eastern), and Jharkhand (central, southern, and some parts of north-eastern and western). Other regions of all three states showed negative anomalies during El-Niño. The La-Niña periods showed less FRD (negative anomalies) than the El-Niño ones.
- The precipitation changes were not significantly different during El-Niño and La-Niña periods. However, the magnitudes were slightly higher in the La-Niña periods, suggesting a decrease in precipitation and an increase in the lightning flash rate during the El-Niño season. In contrast, the FRD decreased, and precipitation increased during the La-Niña seasons.
- During the El-Niño and La-Niña, the thermodynamic indices varied differently. The CAPE, CIN, SWEAT, VTI, TTI, BI, HI, and KI values increased, while CTI decreased during the La-Niña period. The BI values did not show significant changes, while HI values were clearly differentiated during the El-Niño and La-Niña periods.
Author Contributions
Funding
Institutional Review Board Statement
Informed Consent Statement
Data Availability Statement
Acknowledgments
Conflicts of Interest
References
- NOAA Climate Staff. El Niño and La Niña: Frequently Asked Questions; NOAA Climate Staff: College Park, MD, USA, 2016.
- Ahrens, C.D. Meteorology Today: An Introduction to Weather, Climate, and the Environment; Cengage Learning: Boston, MA, USA, 2009; ISBN 9780495555735. [Google Scholar]
- Ju, J.; Slingo, J. The Asian summer monsoon and ENSO. Q. J. R. Meteorol. Soc. 1995, 121, 1133–1168. [Google Scholar] [CrossRef]
- Wang, C. ENSO, Atlantic Climate Variability, and the Walker and Hadley Circulations. In The Hadley Circulation: Present, Past and Future. Advances in Global Change Research; Diaz, H.F., Bradley, R.S., Eds.; Springer: Dordrecht, The Netherlands, 2004; Volume 21. [Google Scholar]
- Yuan, T.; Di, Y. Variability of lightning flash and thunderstorm over eastern China and Indonesia on ENSO time scales. In Proceedings of the International Conference on Atmospheric Electricity, ICAE 2014, Norman, OK, USA, 15–20 June 2014. [Google Scholar]
- Hamid, E.Y.; Kawasaki, Z.I.; Mardiana, R. Impact of the 1997–98 El Niño event on lightning activity over Indonesia. Geophys. Res. Lett. 2001, 28, 147–150. [Google Scholar] [CrossRef]
- Kandalgaonkar, S.S.; Kulkarni, J.R.; Tinmaker, M.I.R.; Kulkarni, M.K. Land-ocean contrasts in lightning activity over the Indian region. Int. J. Climatol. 2010, 30, 137–145. [Google Scholar] [CrossRef]
- Kumar, P.R.; Kamra, A.K. Variability of lightning activity in South/Southeast Asia during 1997–98 and 2002–03 El Nino/La Nina events. Atmos. Res. 2012, 118, 84–102. [Google Scholar] [CrossRef]
- Kulkarni, M.K.; Revadekar, J.V.; Verikoden, H.; Athale, S. Thunderstorm days and lightning activity in association with El Nino. Vayu Mandal 2015, 41, 39–43. [Google Scholar]
- Tinmaker, M.I.R.; Aslam, M.Y.; Ghude, S.D.; Chate, D.M. Lightning activity with rainfall during El Nino and La Nina events over India. Theor. Appl. Climatol. 2017, 130, 391–400. [Google Scholar] [CrossRef]
- Shinji, O.; Morimoto, T.; Kawasak, Z.-I. The Contrast of the El Niño and La Niña Events on the Convection over East Asia. 2011. Available online: https://www.eorc.jaxa.jp/TRMM/museum/event/2ndTISC/HP/Extended%20Abstract/2P.4_OITA_Shinji_Rv.pdf (accessed on 6 June 2022).
- Ahmad, A.; Ghosh, M. Variability of lightning activity over India on ENSO time scales. Adv. Space Res. 2017, 60, 2379–2388. [Google Scholar] [CrossRef]
- Kulkarni, M.K.; Revadekar, J.V.; Varikoden, H. About the variability in thunderstorm and rainfall activity over India and its association with El Niño and La Niña. Nat. Hazards 2013, 69, 2005–2019. [Google Scholar] [CrossRef]
- Roy, I.; Tedeschi, R.G.; Collins, M. ENSO teleconnections to the Indian summer monsoon under changing climate. Int. J. Climatol. 2019, 39, 3031–3042. [Google Scholar] [CrossRef] [Green Version]
- Saha, U.; Siingh, D.; Midya, S.K.; Singh, R.P.; Singh, A.K.; Kumar, S. Spatio-temporal variability of lightning and convective activity over South/South-East Asia with an emphasis during El Niño and La Niña. Atmos. Res. 2017, 197, 150–166. [Google Scholar] [CrossRef]
- de Abreu, L.P.; Gonçalves, W.A.; Mattos, E.V.; Albrecht, R.I. Assessment of the total lightning flash rate density (FRD) in northeast Brazil (NEB) based on TRMM orbital data from 1998 to 2013. Int. J. Appl. Earth Obs. Geoinf. 2020, 93, 102195. [Google Scholar] [CrossRef]
- Deierling, W.; Petersen, W.A. Total lightning activity as an indicator of updraft characteristics. J. Geophys. Res. Atmos. 2008, 113, D16210. [Google Scholar] [CrossRef] [Green Version]
- Rafati, S.; Fattahi, E. Effects of Regional Thermodynamic Parameters on Lightning Flash Density as an Indicator of Convective Activity Over Southwest Iran. Pure Appl. Geophys. 2022, 179, 2011–2025. [Google Scholar] [CrossRef]
- Mondal, U.; Panda, S.K.; Das, S.; Sharma, D. Spatio-temporal variability of lightning climatology and its association with thunderstorm indices over India. Theor. Appl. Climatol. 2022, 149, 273–289. [Google Scholar] [CrossRef]
- Tyagi, B.; Sahu, R.K.; Vissa, N.K.; Hari, M. Reviewing the Thermodynamic Changes in the Atmosphere Associated with Pre-Monsoon Thunderstorms over Eastern and North-Eastern India. In Extreme Natural Events—Sustainable Solutions for Developing Countries; Unnikrishnan, A.S., Tangang, F., Durrheim, R., Eds.; Springer Nature Publications: Berlin/Heidelberg, Germany, 2022; in press. [Google Scholar] [CrossRef]
- Tyagi, B.; Krishna, V.N.; Satyanarayana, A.N.V. Study of thermodynamic indices in forecasting pre-monsoon thunderstorms over Kolkata during STORM pilot phase 2006–2008. Nat. Hazards 2011, 56, 681–698. [Google Scholar] [CrossRef]
- Madala, S.; Satyanarayana, A.N.V.; Tyagi, B. Performance evaluation of convective parameterization schemes of WRF-ARW model in the simulation of pre-monsoon thunderstorm events over Kharagpur using STORM data sets. Int. J. Comput. Appl. 2013, 71, 43–50. [Google Scholar] [CrossRef]
- Tyagi, B.; Satyanarayana, A.N.V.; Rajvanshi, R.K.; Mandal, M. Surface energy exchanges during pre-monsoon thunderstorm activity over a tropical station Kharagpur. Pure Appl. Geophys. 2014, 171, 1445–1459. [Google Scholar] [CrossRef]
- Tyagi, B.; Satyanarayana, A.N.V. Delineation of surface energy exchanges variations during thunderstorm and non-thunderstorm days during pre-monsoon season. J. Atmos. Sol. Terr. Phys. 2015, 122, 138–144. [Google Scholar] [CrossRef]
- Bhardwaj, P.; Singh, O.; Kumar, D. Spatial and temporal variations in thunderstorm casualties over India. Singap. J. Trop. Geogr. 2017, 38, 293–312. [Google Scholar] [CrossRef]
- Yadava, P.K.; Soni, M.; Verma, S.; Kumar, H.; Sharma, A.; Payra, S. The major lightning regions and associated casualties over India. Nat. Hazards 2020, 110, 217–229. [Google Scholar] [CrossRef]
- Chaudhuri, S.; Middey, A. A composite stability index for dichotomous forecast of thunderstorms. Theor. Appl. Climatol. 2012, 110, 457–469. [Google Scholar] [CrossRef]
- Chaudhuri, S.; Pal, J.; Middey, A.; Goswami, S. Nowcasting Bordoichila with a composite stability index. Nat. Hazards 2013, 66, 591–607. [Google Scholar] [CrossRef]
- Samanta, S.; Tyagi, B.; Vissa, N.K.; Sahu, R.K. A new thermodynamic index for thunderstorm detection based on cloud base height and equivalent potential temperature. J. Atmos. Sol. Terr. Phys. 2020, 207, 105367. [Google Scholar] [CrossRef]
- Tyagi, B. Surface Energy Exchanges and Thermodynamical Structure of Atmospheric Boundary Layer during Pre-Monsoon Thunderstorm Season over Two Tropical Stations. Ph.D. Dissertation, IIT Kharagpur, Kharagpur, India, 2012. [Google Scholar]
- Haklander, A.J.; Van Delden, A. Thunderstorm predictors and their forecast skill for the Netherlands. Atmos. Res. 2003, 67–68, 273–299. [Google Scholar] [CrossRef]
- Kunz, M. The skill of convective parameters and indices to predict isolated and severe thunderstorms. Nat. Hazards Earth Syst. Sci. 2007, 7, 327–342. [Google Scholar] [CrossRef] [Green Version]
- Murugavel, P.; Pawar, S.D.; Gopalakrishnan, V. Trends of Convective Available Potential Energy over the Indian region and its effect on rainfall. Int. J. Climatol. 2012, 32, 1362–1372. [Google Scholar] [CrossRef]
- Chakraborty, R.; Venkat Ratnam, M.; Basha, S.G. Long-term trends of instability and associated parameters over the Indian region obtained using a radiosonde network. Atmos. Chem. Phys. 2019, 19, 3687–3705. [Google Scholar] [CrossRef] [Green Version]
- Sahu, R.K.; Dadich, J.; Tyagi, B.; Vissa, N.K. Trends of thermodynamic indices thresholds over two tropical stations of north-east India during pre-monsoon thunderstorms. J. Atmos. Sol. Terr. Phys. 2020, 211, 105472. [Google Scholar] [CrossRef]
- Sahu, R.K.; Dadich, J.; Tyagi, B.; Vissa, N.K.; Singh, J. Evaluating the impact of climate change in threshold values of thermodynamic indices during pre-monsoon thunderstorm season over Eastern India. Nat. Hazards 2020, 102, 1541–1569. [Google Scholar] [CrossRef]
- Hersbach, H.; Dee, D. ERA5 Reanalysis Is in Production. ECMWF Newsletter. 2016. Available online: https://www.ecmwf.int/en/newsletter/147/news/era5-reanalysis-production (accessed on 29 December 2021).
- Christian, H.J.; Blakeslee, R.J.; Goodman, S.J.; Mach, D.A.; Stewart, M.F.; Buechler, D.E.; Koshak, W.J.; Hall, J.M.; Boeck, W.L.; Driscoll, K.T.; et al. The Lightning Imaging Sensor. In Proceedings of the 11th International Conference on Atmospheric Electricity, Guntersville, AL, USA, 7–11 June 1999. [Google Scholar]
- Boccippio, D.J.; Koshak, W.J.; Blakeslee, R.J. Performance assessment of the optical transient detector and lightning imaging sensor. Part I: Predicted diurnal variability. J. Atmos. Ocean. Technol. 2002, 19, 1318–1332. [Google Scholar] [CrossRef]
- Cecil, D.J.; Buechler, D.E.; Blakeslee, R.J. Gridded lightning climatology from TRMM-LIS and OTD: Dataset description. Atmos. Res. 2014, 135–136, 404–414. [Google Scholar] [CrossRef] [Green Version]
- Williams, E.; Rothkin, K.; Stevenson, D.; Boccippio, D. Global lightning variations caused by changes in thunderstorm flash rate and by changes in the number of thunderstorms. J. Appl. Meteorol. 2000, 39, 2223–2230. [Google Scholar] [CrossRef]
- Bond, D.W.; Steiger, S.; Zhang, R.; Tie, X.; Orville, R.E. The importance of NOx production by lightning in the tropics. Atmos. Environ. 2002, 36, 1509–1519. [Google Scholar] [CrossRef]
- Anandh, P.C.; Vissa, N.K. Role of synoptic-scale circulations, mechanisms, and precursors during extreme rainfall events over the Southern Indian Peninsula. Meteorol. Atmos. Phys. 2022, 134, 27. [Google Scholar] [CrossRef]
- Sahu, R.K.; Tyagi, B. Spatial variation of thermodynamic indices over north-east India during pre-monsoon thunderstorm season. J. Atmos. Sol. Terr. Phys. 2022, 232, 105868. [Google Scholar] [CrossRef]
- Sahu, R.K.; Tyagi, B.; Vissa, N.K.; Mohapatra, M. Pre-monsoon thunderstorm season climatology of Convective Available Potential Energy (CAPE) and Convective Inhibition (CIN) over Eastern India. MAUSAM 2022, 73, 565–586. [Google Scholar] [CrossRef]


Publisher’s Note: MDPI stays neutral with regard to jurisdictional claims in published maps and institutional affiliations. |
© 2022 by the authors. Licensee MDPI, Basel, Switzerland. This article is an open access article distributed under the terms and conditions of the Creative Commons Attribution (CC BY) license (https://creativecommons.org/licenses/by/4.0/).
Share and Cite
Sahu, R.K.; Choudhury, G.; Vissa, N.K.; Tyagi, B.; Nayak, S. The Impact of El-Niño and La-Niña on the Pre-Monsoon Convective Systems over Eastern India. Atmosphere 2022, 13, 1261. https://doi.org/10.3390/atmos13081261
Sahu RK, Choudhury G, Vissa NK, Tyagi B, Nayak S. The Impact of El-Niño and La-Niña on the Pre-Monsoon Convective Systems over Eastern India. Atmosphere. 2022; 13(8):1261. https://doi.org/10.3390/atmos13081261
Chicago/Turabian StyleSahu, Rajesh Kumar, Goutam Choudhury, Naresh Krishna Vissa, Bhishma Tyagi, and Sridhara Nayak. 2022. "The Impact of El-Niño and La-Niña on the Pre-Monsoon Convective Systems over Eastern India" Atmosphere 13, no. 8: 1261. https://doi.org/10.3390/atmos13081261