Article

Influence of 30–60 Days Intraseasonal Oscillation of East Asian Summer Monsoon on Precipitation in Southwest China

1
School of Atmospheric Sciences, Chengdu University of Information Technology, Chengdu 610225, China
2
Sanshui Meteorological Bureau, Foshan 528199, China
3
Institute of Plateau Meteorology, CMA, Chengdu 610072, China
4
Yunnan Climate Center, Kunming 650034, China
*
Author to whom correspondence should be addressed.
Atmosphere 2022, 13(8), 1222; https://doi.org/10.3390/atmos13081222
Submission received: 22 May 2022 / Revised: 28 July 2022 / Accepted: 29 July 2022 / Published: 2 August 2022
(This article belongs to the Section Meteorology)

Abstract

:
The intraseasonal oscillation (ISO) of the East Asian summer monsoon (EASM) is an important factor affecting summer precipitation in China, but the relationship between the ISO of the EASM and summer precipitation in southwest China is currently still unclear. The relationship between the two is discussed, and the following conclusions are drawn: (1) there is a significant positive correlation between East Asian monsoon surge intensity and summer precipitation in southwest China. When the monsoon surge is stronger (weaker), the precipitation in southwest China is more (less). However, the areas where the monsoon surge has a more obvious effect on the summer precipitation in southwest China are mainly located east of 105° E, and the monsoon surge has no obvious effect on the area west of 105° E. This may be more (less) the case in monsoon surge years, when a low-frequency oscillation of 30–60 days (10–20 days) plays a dominant role. The East Asian region has a longitudinal wave train of “+ − +” (“− + −“), the western Pacific subtropical high is westerly (easterly), the South China Sea and western Pacific is affected by anticyclone (cyclone), the EASM is active (suppressive), eastern southwest China has water vapor convergence (divergence) and upward (downward) airflow. (2) We found that 1998 was a typical year for the 30–60 days ISO of the EASM. There are two obvious 30–60 days oscillation cycles. In this year, when the intensity of the ISO of the EASM increases (decreases), the range of positive precipitation anomaly region in southwest China extends (decreases). The atmospheric circulation characteristics show that, when the western Pacific subtropical high is west (east) and south (north), and there is obvious anticyclonic (cyclonic) circulation in China–western Pacific, and the EASM is stronger (weaker), which leads to more (less) precipitation in southwest China.

1. Introduction

Atmospheric intraseasonal oscillation (ISO) refers to the periodic variation of atmospheric elements with a time scale shorter than one season, and its activity has an important impact on weather and climate, especially in tropical and subtropical regions [1,2]. The East Asian summer monsoon (EASM) is a typical tropical and subtropical atmospheric circulation system with significant ISO characteristics [3,4,5,6,7]. The ISO exhibits two main types of low-frequency characteristics, i.e., 10–20 days and 30–60 days, and exerts an important impact on the summer precipitation anomaly in China [4,8,9,10,11,12].
Some studies show that the shift of three phases (the pre-flood season in south China, the plum rain season in the Yangtze River Basin and the rainy season in north China and northeast China) undergone by the summer precipitation belt in eastern China is related to the lock phase of ISO activity of the EASM in the cycles of 30–60 days and 10–20 days [13,14]. For example, in [15], the authors pointed out that the EASM propagated northward from the southern South China Sea in 2003, the maximum centers of propagation process corresponded to the heavy precipitation processes of the South China Sea region, the pre-flood season in south China and the Yangtze and Huaihe River Basin, respectively, and the peaks and troughs of ISO intensity also corresponded to concentrated and intermittent phases of precipitation [15]. Additionally, the 30–60 days ISO of the EASM spreading northward and collapsing around 20° N was an important reason for severe drought happening in north China in that year. In January 1999, the cold air from middle latitudes continued to tilt southward, and the 30–60 days circulation and water vapor transfer in low latitudes could not move out of the Yangtze River basin in China, which made the 30–60 days ISO only effective in south China and the South China Sea. The southwest water vapor flux and associated water vapor convergence on the northwest side of the northwest cyclone water vapor system could only reach around 30° N, and the west wind belt and rain belt could not reach north China, ultimately leading to severe drought in north China. By analyzing the circulation anomalies and precursor signals associated with the long-term (over 14 days) summer precipitation events in south China [16], Liang believed that the ISO played a key role in the onset and northward spread of the EASM, which could regulate the plum rains in East Asia. In addition to this, the author pointed out that the precipitation in the East Asian plum rains region had a three-peak-type distribution, which was mainly influenced by 10–20 days and 30–60 days low-frequency oscillations of the EASM [17].
Additionally, Li pointed out that significant differences exist in the precipitation of south China between MJO phases and vary with the length of lagging time. MJO phase 23 and phase 67 correspond to the wet phase and dry phase of the precipitation, respectively. The precipitation anomaly is a result of a Rossby wave associated with the enhanced (suppressed) convection of the MJO. When an enhanced (suppressed) convection of the MJO is located over the Indian Ocean, the Rossby wave excited by the adiabatic heating reaches south China and increases (decreases) water vapor transportation. Such a mechanism contributes to the enhancement (reduction) of the precipitation in south China [18]. Liu also concluded that the 30–60 days ISO spreading northward from the western equatorial Pacific made an important contribution to the summer precipitation event of over 14 days in south China [19]. Hong found out the synergistic effect of the 10–20 days and 30–60 days ISO wet phases was found to exert a tremendous influence on persistent heavy precipitation in July 2019, when the amount of precipitation reached its maximum in southern China since 1981 [12].
Among the two types of ISO of the EASM, the 30–60 days oscillation has a larger contribution, which may be closely related to the jumping and stagnation of the Chinese rain belt. The EASM produces a north–south swing during the stagnant phase [17,20]. It is believed that the 30–60 days low-frequency oscillation of the EASM has a wave train form in the East Asian coastal region and manifests itself as a monsoon surge spreading northward over time [11]. When the monsoon surges northward, it transports the warm and humid tropic air over the Yangtze River basin in China, where it meets the cold air moving southward from the middle and high latitudes to produce precipitation [21]. The amount of precipitation is related to the oscillation intensity. In strong monsoon surge years, the 30–60 days oscillation increases, which readily causes rain in the middle and lower reaches of the Yangtze River in China. In weak monsoon surge years, the 30–60-day oscillation decreases, which readily causes drought in the middle and lower reaches of the Yangtze River in China. In addition, when the fluctuations of the East Asian monsoon surge are at peaks and troughs, respectively, there are concentrated and intermittent phases of precipitation in the middle and lower reaches of the Yangtze River in China, which indicates that the East Asian monsoon surge has a certain regulatory effect on the summer precipitation in eastern China [11].
Southwest China is located on the southeastern side of the Qinghai–Tibet plateau, with rich geomorphic types and significant topographic differences, which is one of the regions significantly influenced by the EASM [22,23]. However, the correlation between summer precipitation in southwest China and the ISO of the EASM is still unclear. Current studies have shown that the ISO of the EASM has an important influence on summer precipitation in eastern China and has an important guiding significance, especially for long-range and middle-range forecasts of precipitation in the middle and lower reaches of the Yangtze River in China. However, there are relatively few studies involving southwest China. Wang researched the internal and external forcing effects of the two monsoon systems and defined the Indian monsoon over the section of 40–105° E and the East Asian monsoon over the section of 105–160° E by comparing the annual cycle and interannual variation of the East Asian monsoon and South Asian monsoon [24]. This means that the vicinity of 105° E may not only be the interface between the East Asian monsoon and Indian monsoon, but also may be the western edge zone where Asia is affected by the East Asian monsoon. Moreover, the 105° E longitude just passes through western China. Southwest China is located on the edge affected by the East Asian monsoon, and the change in characteristics of its summer precipitation under the influence of the East Asian monsoon is a problem worthy of investigation.
In order to further study the relationship between the EASM and summer precipitation in China, and to supplement the lack of research content that the ISO of the EASM affects summer precipitation in southwest China, we take the effect of the EASM on summer precipitation in southwest China as our research objective. We will start from the perspective of the relationship between the ISO of the EASM and the anomalous summer precipitation in southwest China, and try to analyze the physical mechanism of the ISO of the EASM affecting summer precipitation in southwest China. This research will mainly include the following two questions: (1) What kind of ISO characteristics does the EASM have, and how does this oscillation characteristic affect summer precipitation in southwest China? (2) What is the correlation between the intensity of the East Asian monsoon surge and the summer precipitation in southwest China, and how does it affect summer precipitation in southwest China? Through the above research and analysis, we may have a new understanding of the connection between the EASM and summer precipitation in southwest China.
Given that ISO may play an important role in the summer precipitation anomaly in southwest China, this study will be carried out in the following sections: Section 1 has already described the link between the ISO of the EASM and summer precipitation in China. Section 2 describes the data and methods used in this study. Section 3 discusses the link between the ISO of the EASM and summer precipitation in southwest China. Section 4 discusses the atmospheric circulation characteristics of the ISO of the EASM affecting the summer precipitation anomalies in southwest China. The final section presents conclusions and discussions.

2. Materials and Methods

The selected area in this study is southwest China at 20–35° N, 90–110° E (Figure 1), and the data sets used include daily precipitation observation data of China Station 839 from 1979 to 2019 (unit: m) provided by the National Climate Center of China Meteorological in Beijing, China, and the reanalysis data released by NCEP/NCAR I, such as global height field, wind field, water vapor, vertical velocity, etc., from 1979 to 2019. We processed the precipitation observation station data intercepted in southwest China, eliminated some stations with serious missing data, and finally obtained 121 valid station data.
The research methods used in the study mainly included monsoon and precipitation index calculation, wavelet analysis, band-pass filtering, t-test, synthesis, diagnostic analysis, etc. Wavelet analysis was applied to the EASM index series to determine the ISO period of the EASM. Lanczos bandpass filters were used to extract the 10–20 days and 30–60 days oscillation periods of the ISO of the EASM. We used t-test, synthesis and diagnostic analysis to analyze the influence of the ISO of the EASM contemporaneous atmospheric circulation background on the summer precipitation anomaly in southwest China.
I M = ν SW v SW σ ν R R σ R
where ν SW is the southwest projection of summer full monsoon speed in the East Asian monsoon region, R is the outgoing long-wave radiation, v SW ¯ and R ¯ are the long-time average annual values of summer R ¯ and OLR, respectively, and σ ν and σ R are standard deviations of summer ν SW and OLR, respectively.
Besides the described monsoon index, we selected a standardized precipitation index (SPI) as a diagnostic quantity to make a statistical analysis for spatiotemporal variation characteristics of summer precipitation in southwest China in 1979–2019 [24]. The SPI was calculated using the Γ distribution probability of precipitation in a certain period of time then a normal standardization processing for it was chosen and, finally, classification of drought and flood grades with accumulative frequency distribution of standardized precipitation was calculated. Its expression is as follows:
R = R i R ¯ 1 n i = 1 n R i R ¯ 2
where R is standardized precipitation; Ri is the original value of precipitation, i = 1, 2, …, n; and R ¯ is the average value of precipitation.

3. Relationship between ISO of EASM and Precipitation in Southwest China

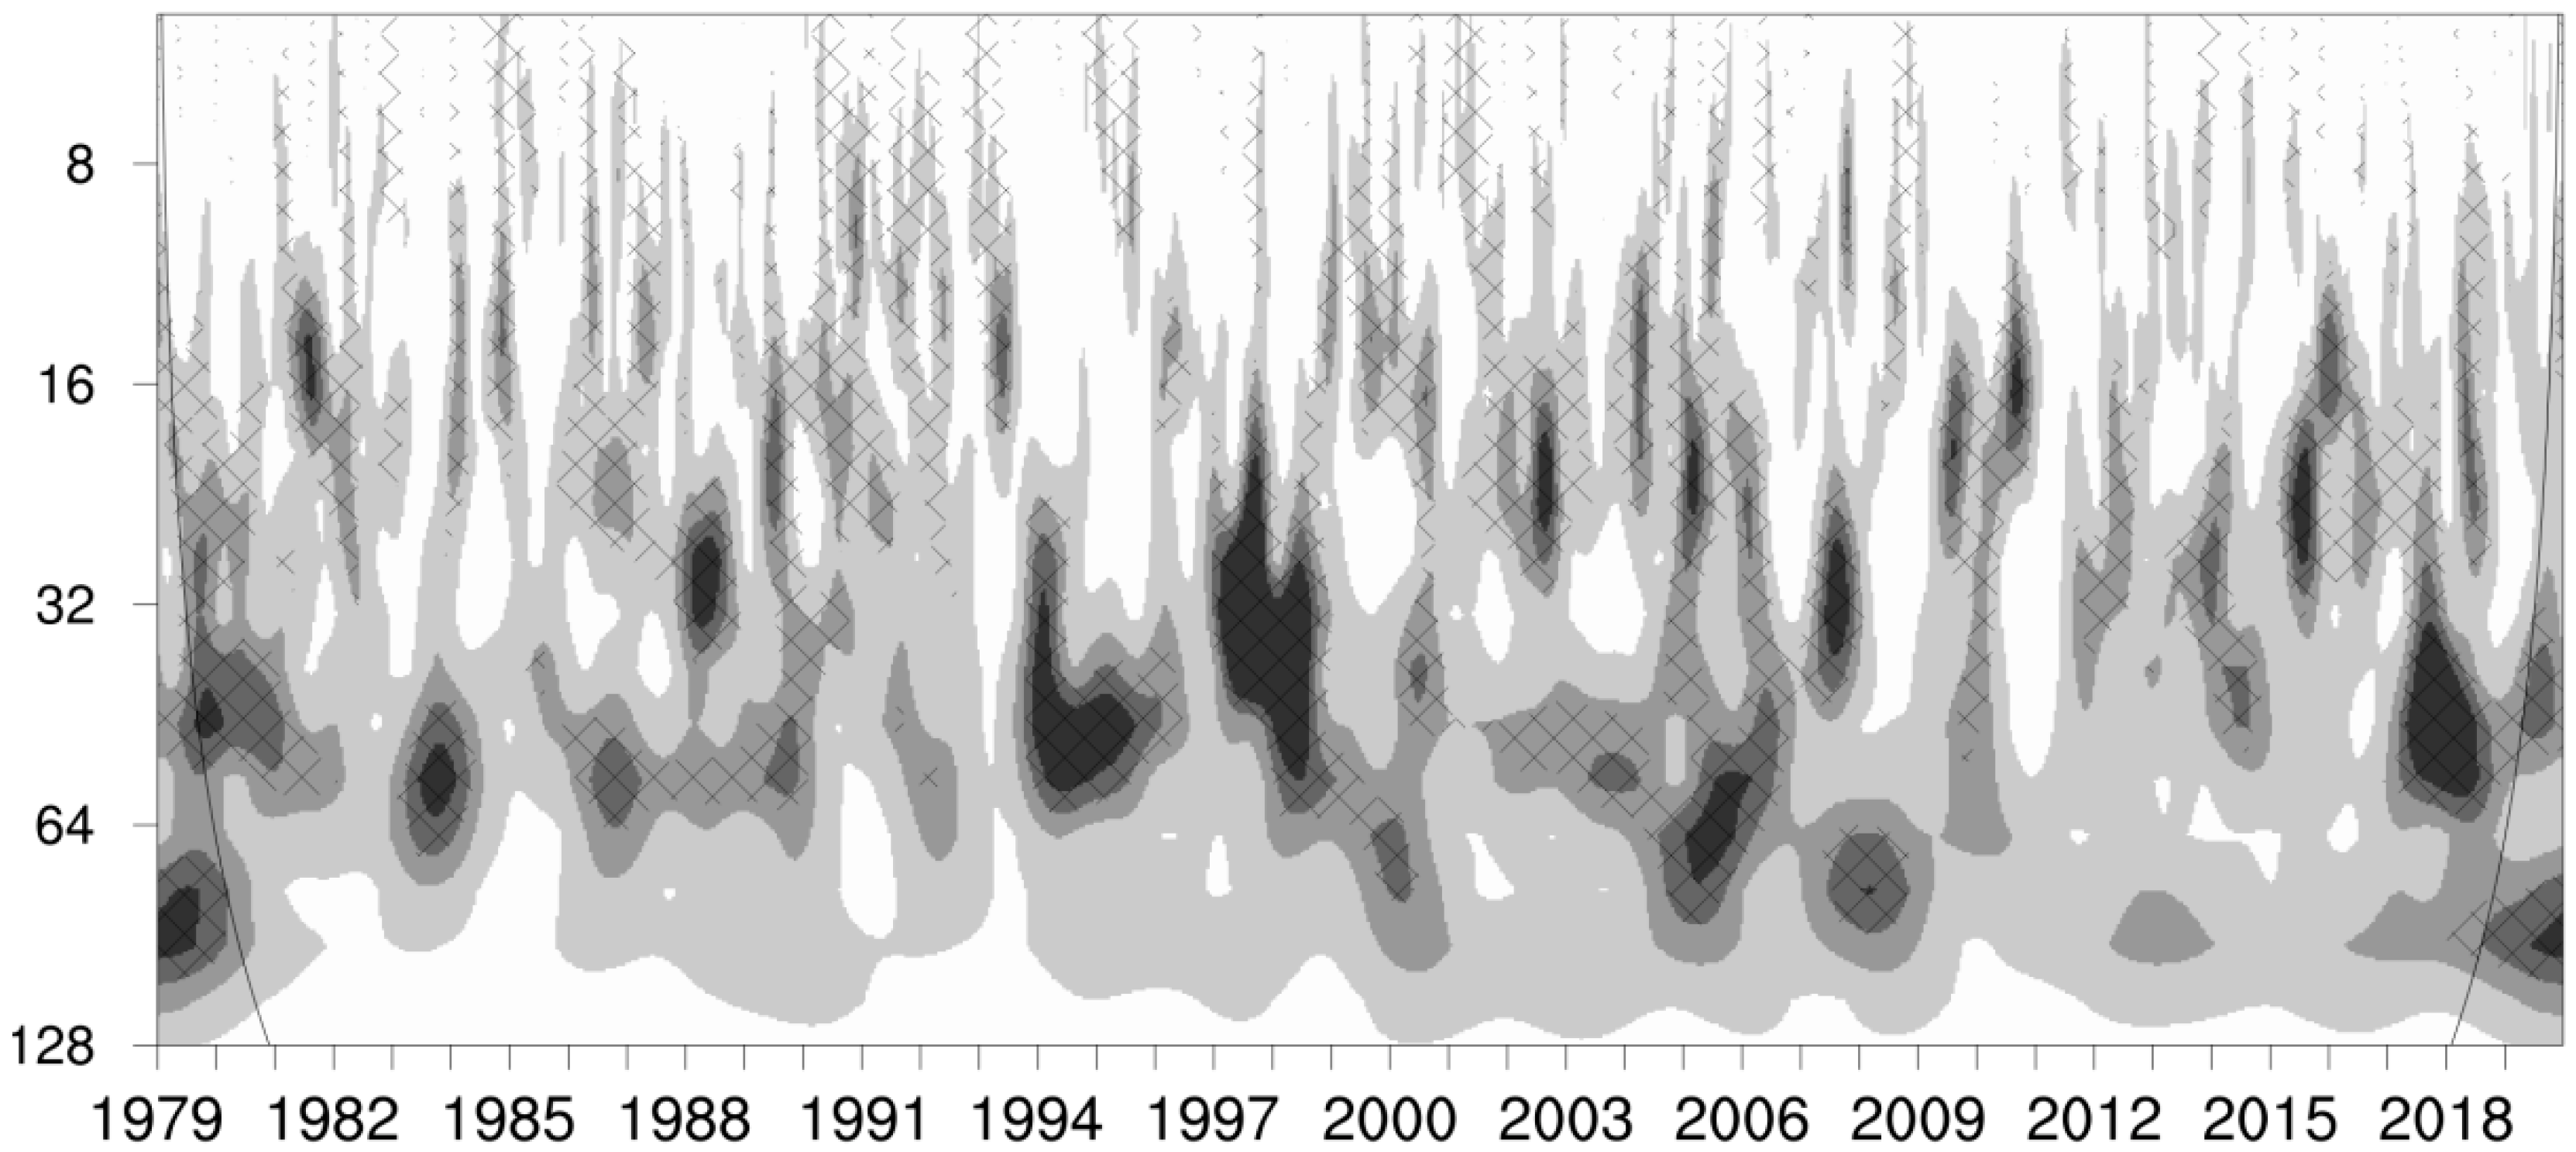
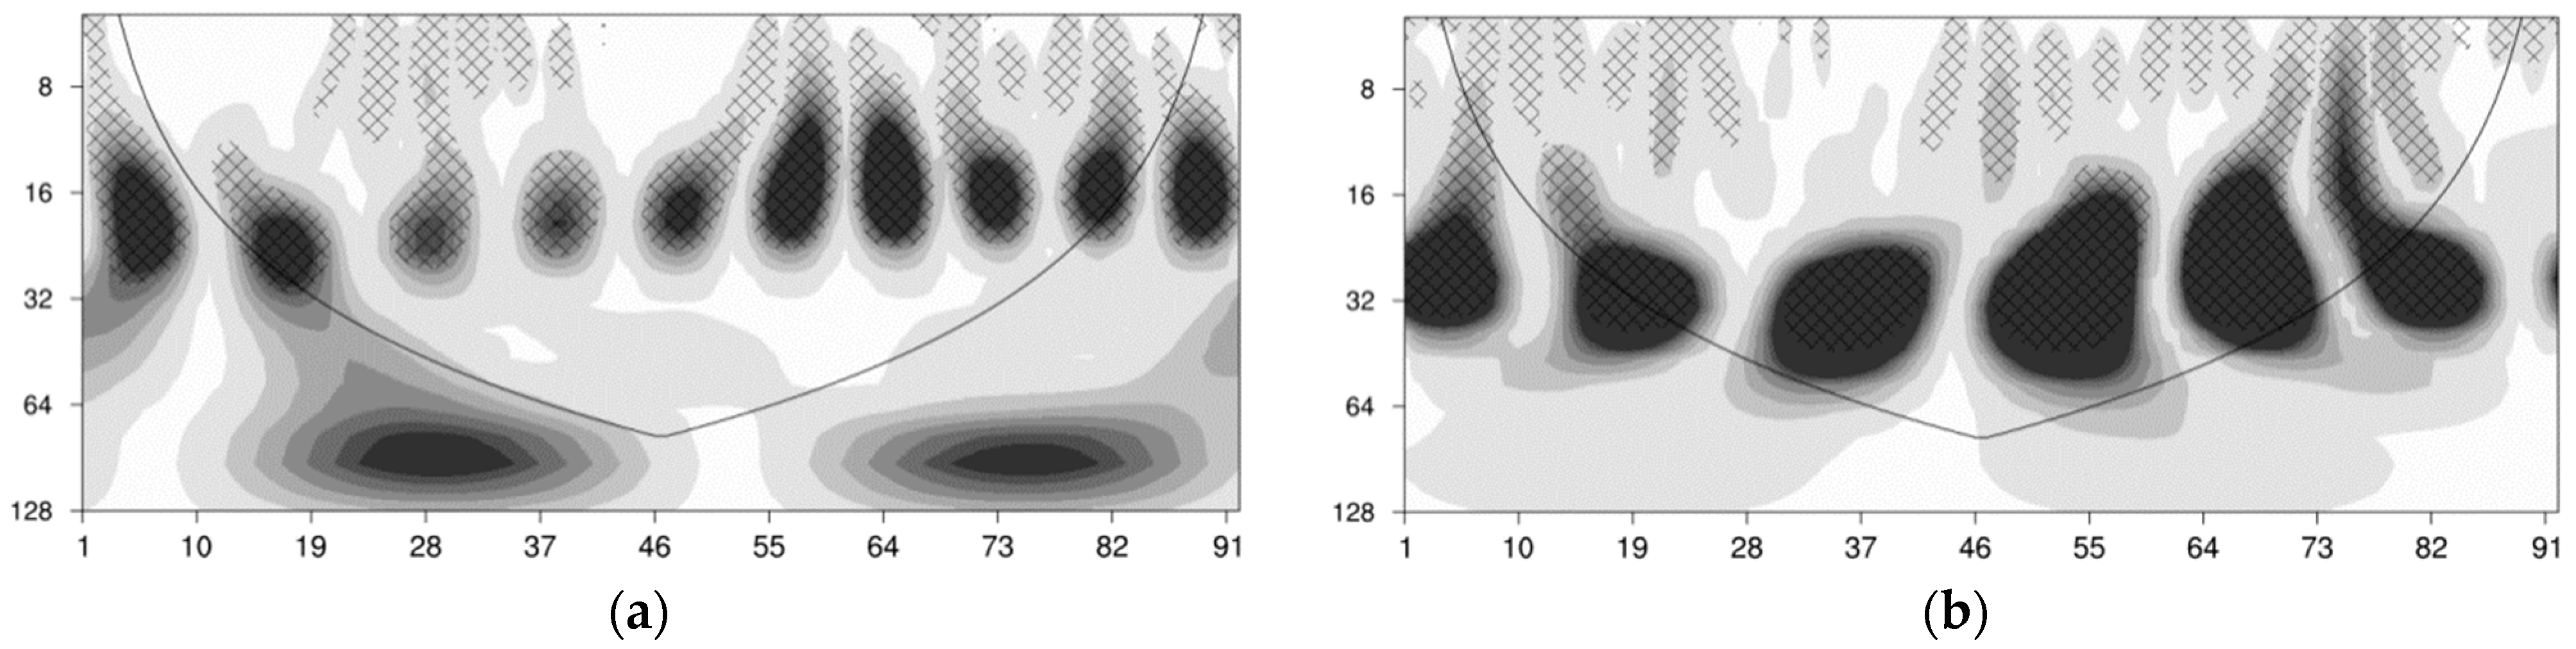
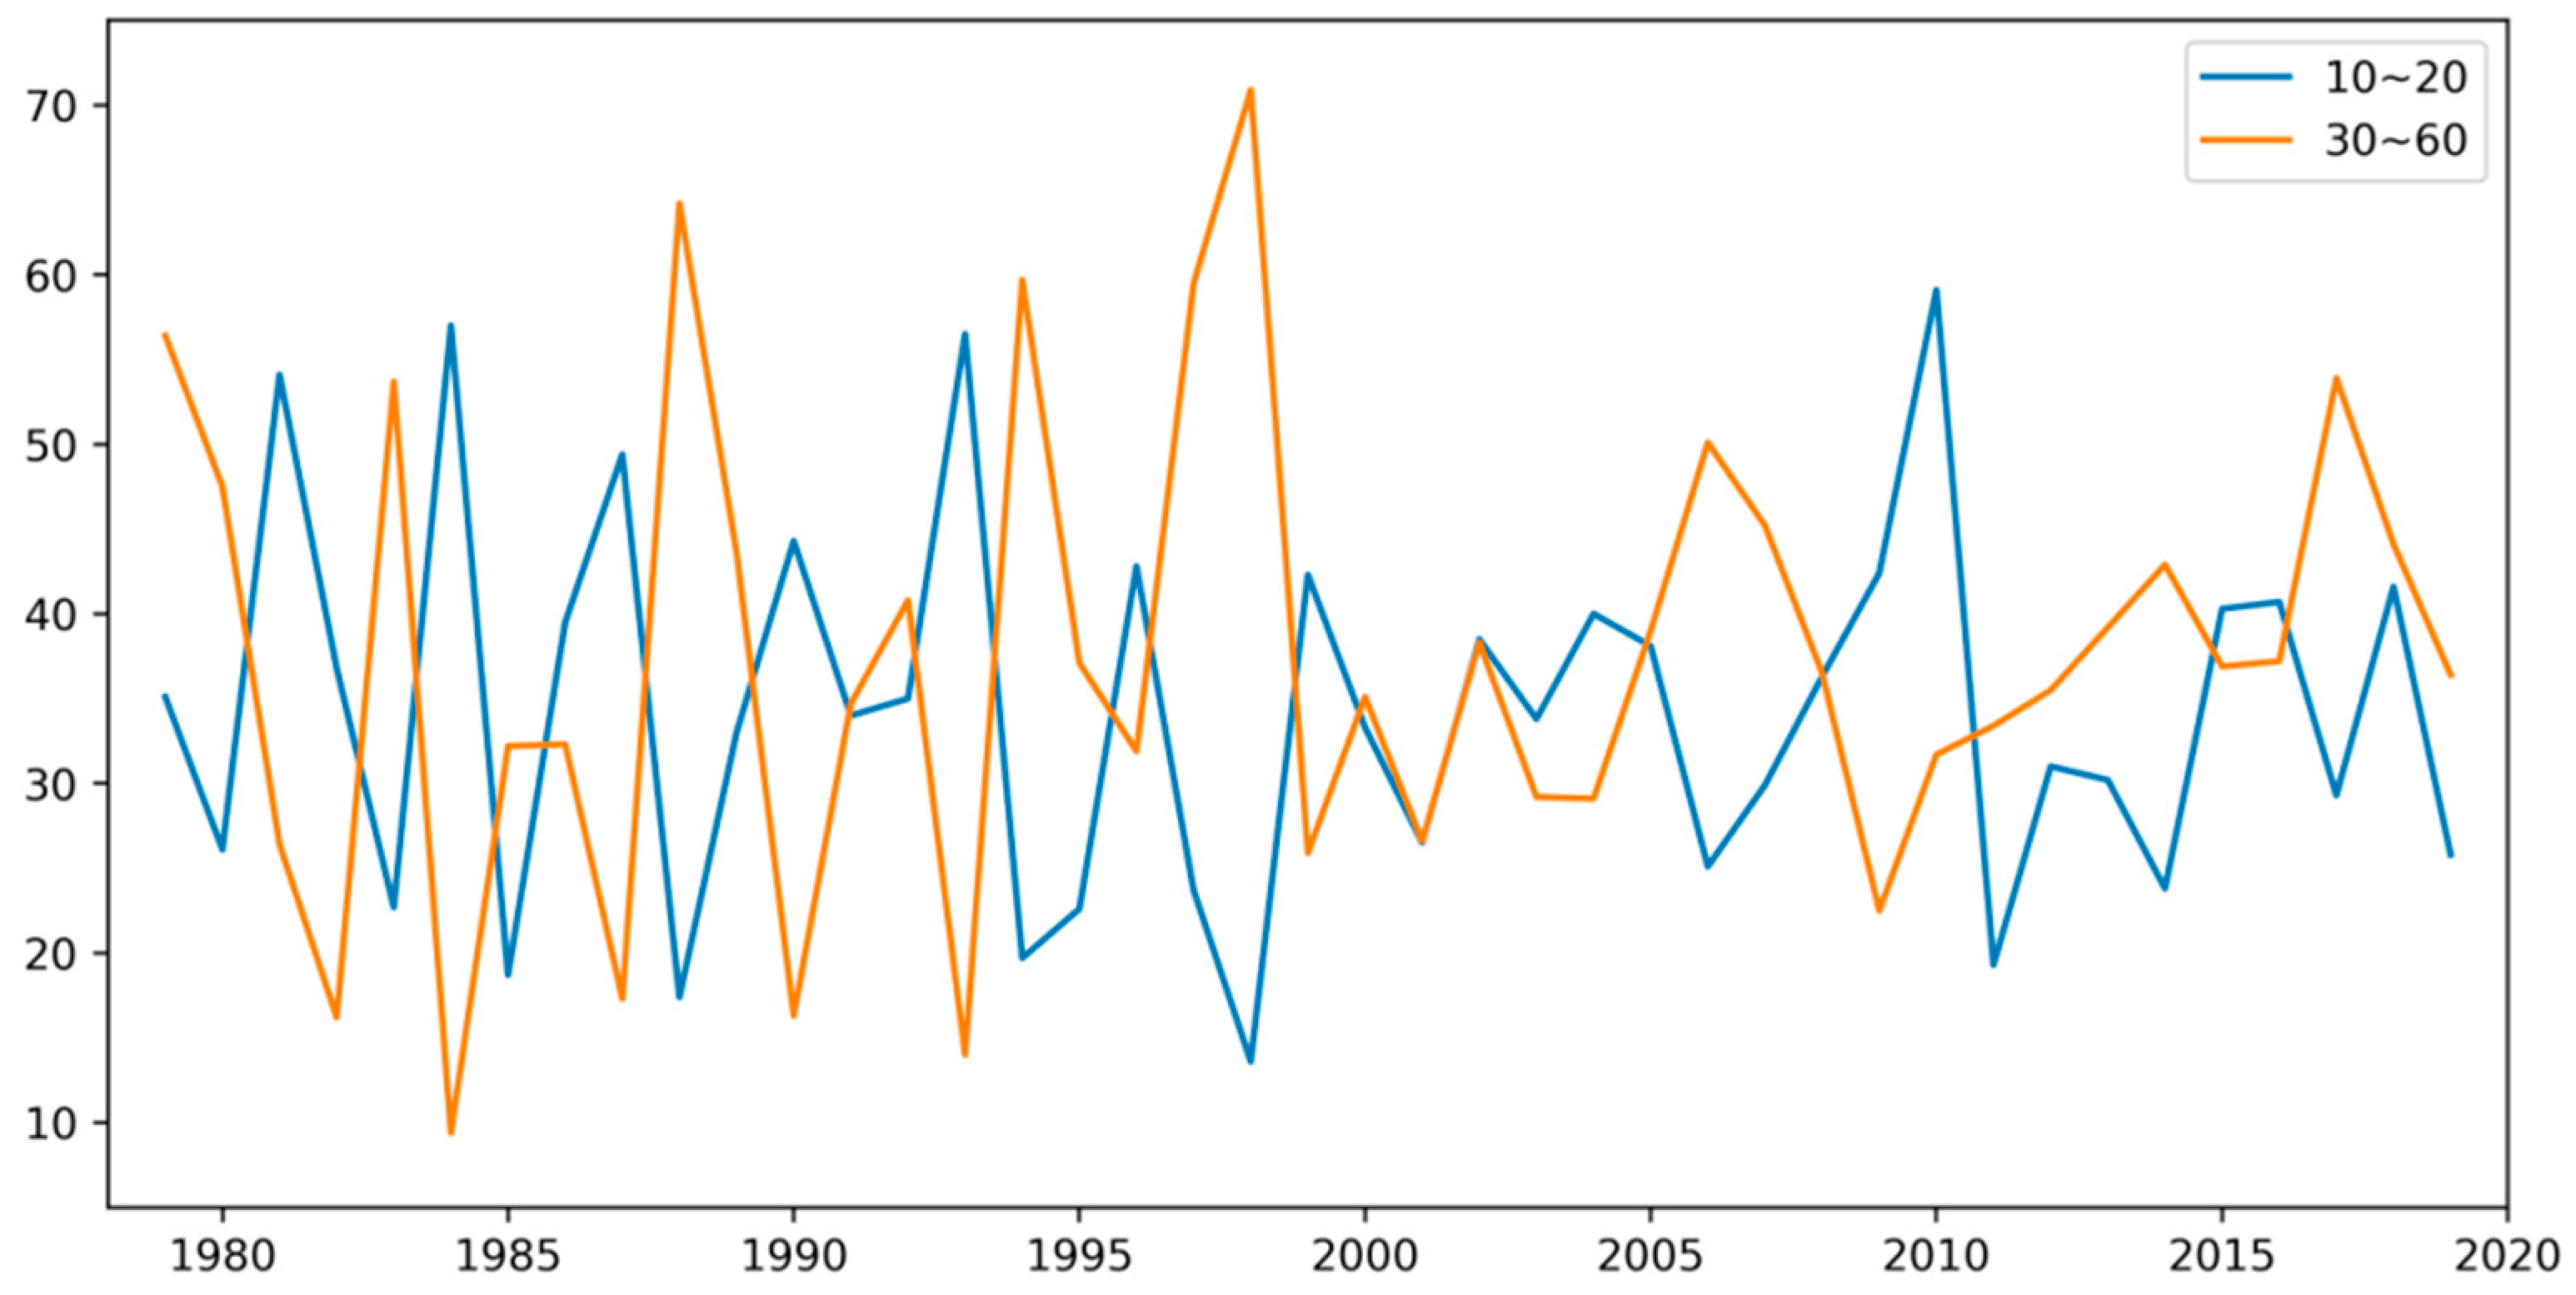
3.1. Characteristics of ISO of EASM

3.1.1. ISO of EASM

We conducted wavelet analysis on the calculation results of the EASM index and obtained annual wavelet analysis graphics of the EASM in 1979–2019 (figure omitted). It can be seen from the figure that the ISO of the EASM not only has an obvious interannual variation characteristics (Figure 2), but also has two main types of ISO periods of 10–20 days and 30–60 days (Figure 3). Among them, the typical years dominated by 10–20 days oscillation cycles are 1981, 1984, 1986, 1987, 1990, 1991, 1993, 2004, 2009, 2010, 2015 and 2016. Typical years dominated by 30–60 days oscillations are 1980, 1983, 1985, 1988, 1994, 1995, 1997, 1998, 2006, 2007, 2014, 2017 and 2019 (Table 1).
In order to highlight the intraseasonal variation of the EASM, we first filtered the high-frequency disturbances, seasonal anomalies and interannual scale signals in the reanalysis data and then these data were bandpass filtered with a Lanczos filter [25,26,27,28]. Finally, the ISO signals in the data were extracted to obtain the filtered IM sequences of the 10–20 days and 30–60 days ISO.
Figure 4 shows the explained variances filtered IM sequences of the 10–20 days and 30–60 days ISO of the EASM in original IM sequences. It can be seen that the explained variances of filtered IM sequences of the two types of oscillations in the original sequences are relatively high, where the explained variance of 30–60 days ISO after filtering has a relatively large fluctuation as a whole, and there are, in total, 14 years (1998, 1988, 1994, 1997, 2017, 1983, 2006, 1980, 2007, 2018, 1989, 2014 and 1992) with an explained variance of ISO for more than 40%, of which 1998 has the largest explained variance. There are, in total, 13 years (2010, 1984, 1993, 1981, 1987, 1990, 1996, 2009, 2018, 2016, 2015 and 2004) with an explained variance of 10–20 days ISO after filtering for more than 40%. The above analysis results are basically consistent with the typical years of the two types of ISO in Table 1, indicating that the index sequences after filtering out the high-frequency fluctuations and interannual scale signals can reflect the characteristics of ISO of the EASM well.

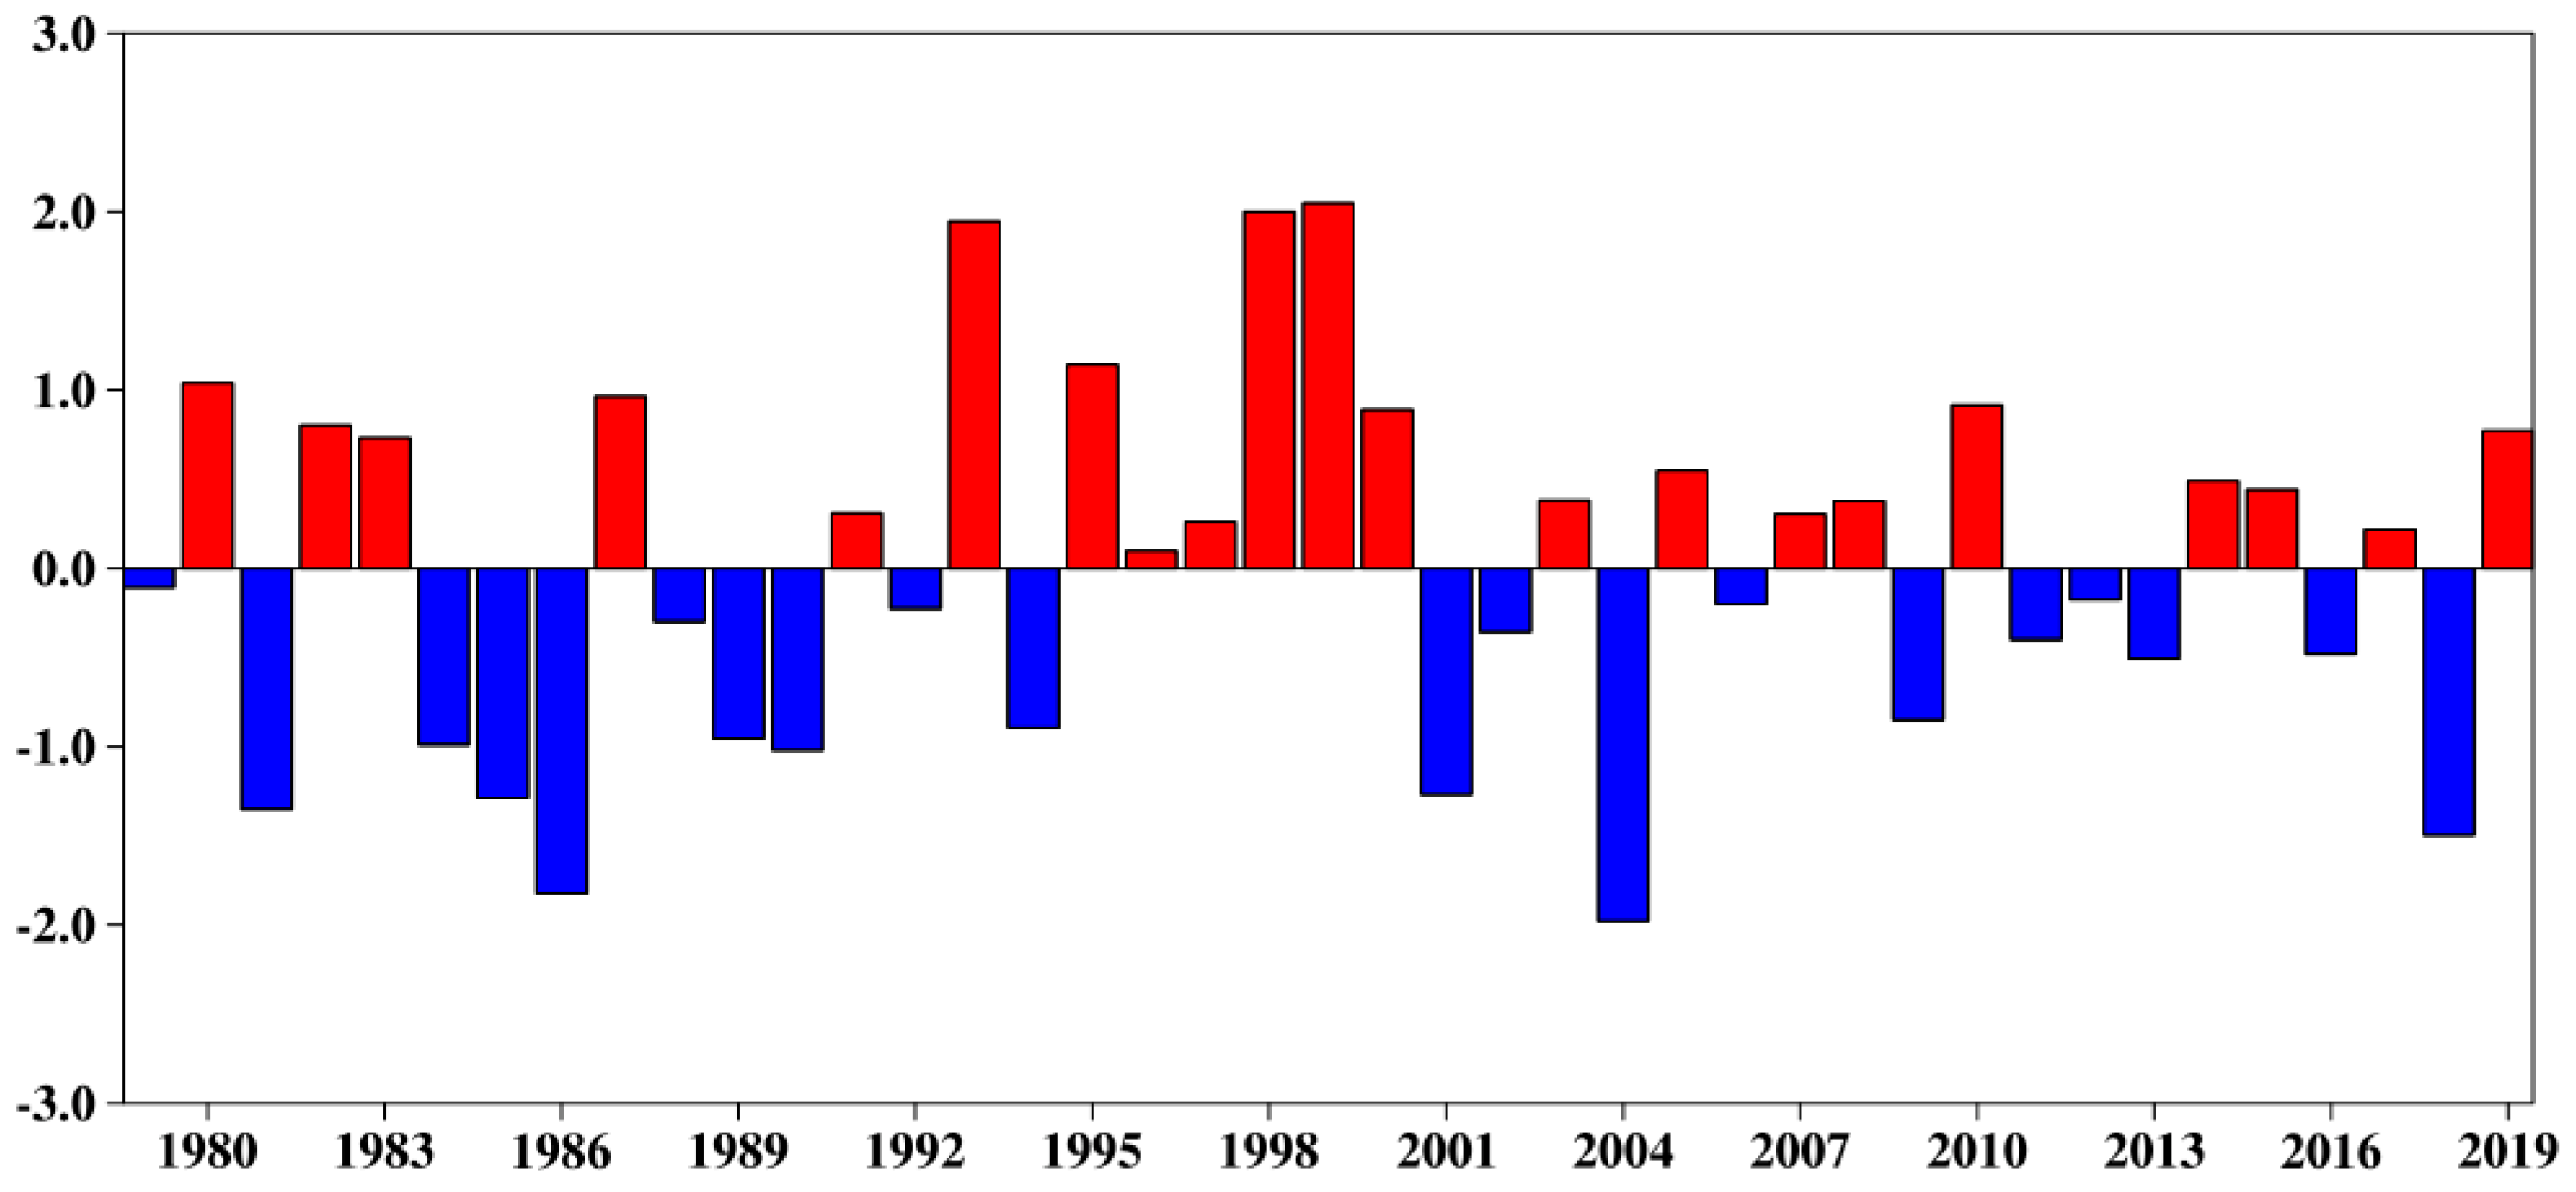
3.1.2. East Asian Summer Monsoon Surge

Ju [4,11] pointed out that the ISO of the EASM in the form of a wave train in the East Asian coastal region and is manifested as and exhibits a monsoon surge spreading northward over time; and defined the East Asian monsoon index IM in the East Asian monsoon region (22.5–32.5° N, 112.5–135° E) as the East Asian subtropical monsoon surge index IEASM. By referring to Equation (1) for calculation, the intensity change of the East Asian subtropical monsoon surge (hereinafter referred to as monsoon surge) from June to August in 1979–2019 is obtained (Figure 5). The summer monsoon surge in 1979–2019 not only had obvious interannual variation characteristics, but also had relatively obvious interdecadal variation characteristics: The 1980s had relatively more weak monsoon surge years, which was a relatively obvious inactive stage, and its typical weak monsoon surge years include 1981, 1986, etc.; on the contrary, the 1990s had relatively more strong monsoon surge years, with relatively active monsoon surges, and its typical strong monsoon surge years include 1993, 1998 and 1999; after the 2000s, strong and weak monsoon surges alternated frequently, but the overall variation amplitude was relatively small, and the monsoon surge was also obviously weak in individual years such as 2004 and 2018.

3.2. Correlation between Intraseasonal Oscillation of East Asian Summer Monsoon and Precipitation in Southwest China

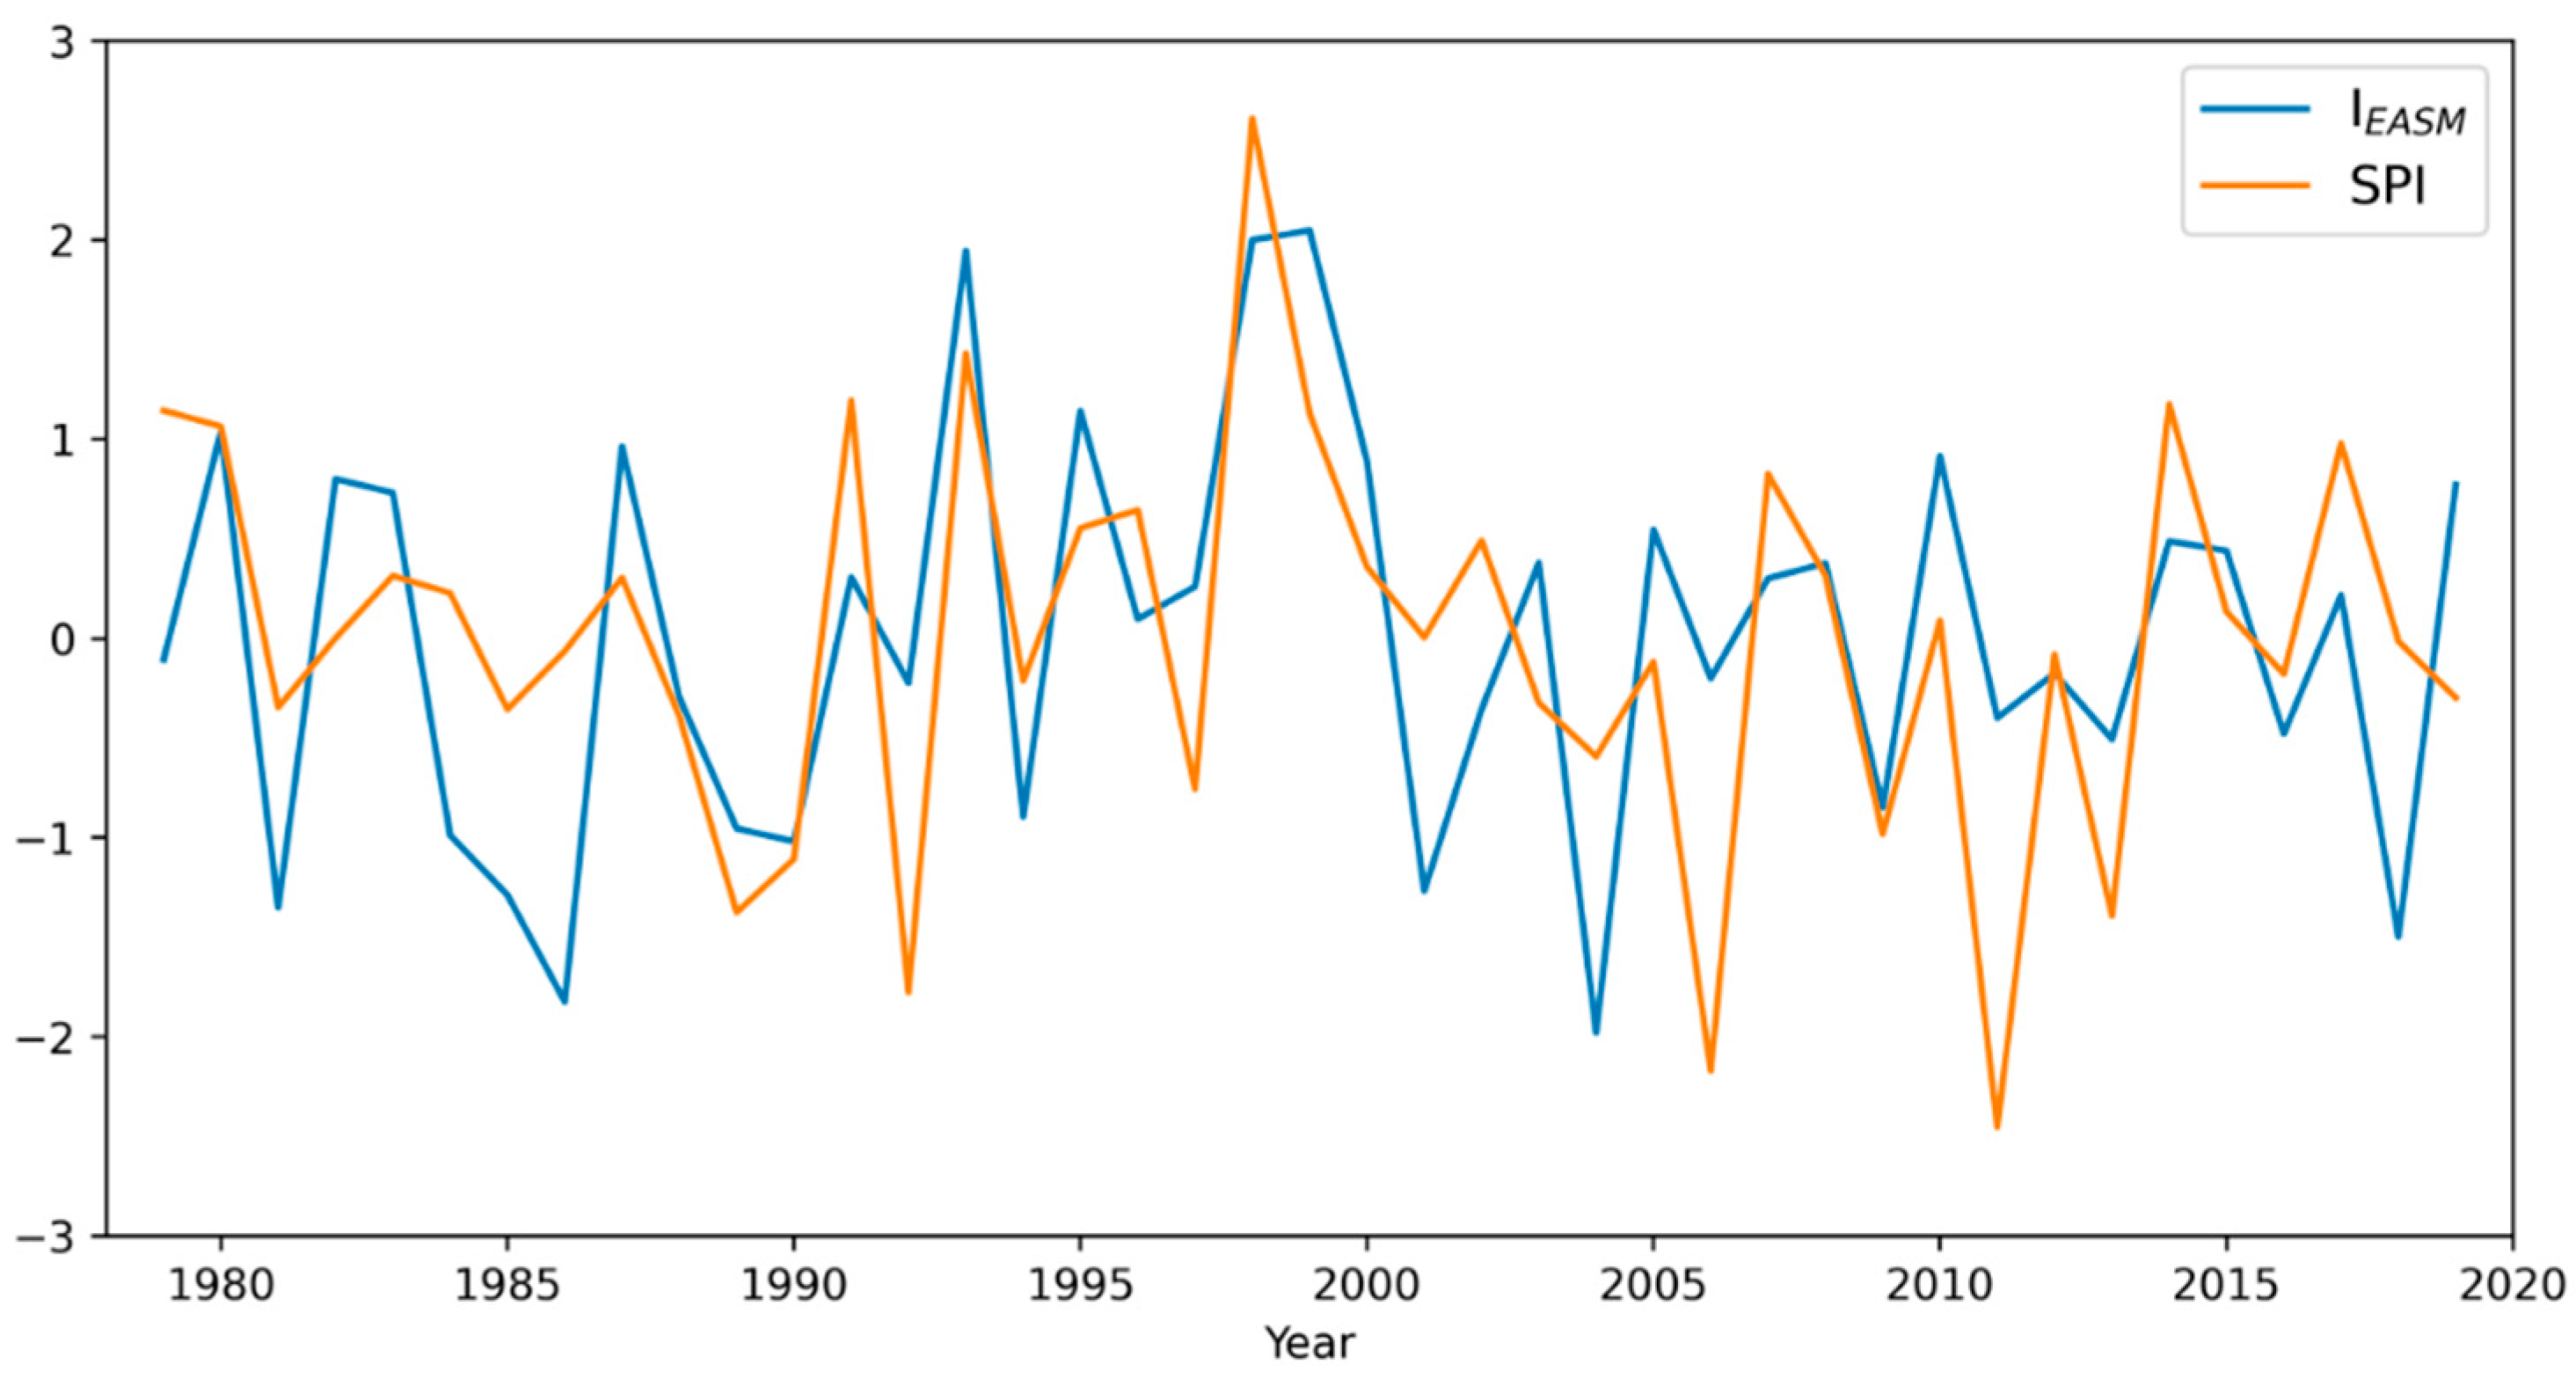
3.2.1. Correlation between East Asian Summer Monsoon and Precipitation in Southwest China

Figure 6 shows the East Asian subtropical monsoon surge intensity and the normalized index sequence of summer precipitation in southwest China from 1979 to 2019. It can be seen from the figure that the summer precipitation in southwest China is similar to the monsoon surge intensity, with obvious interannual variation characteristics. In terms of interannual variation characteristics, there is also an obvious positive correlation between the monsoon surge and summer precipitation in southwest China, a correlation coefficient of up to 0.548. It may be also observed that in the 1980s, the monsoon surge intensity was relatively weak and summer precipitation in southwest China was mainly in the normal and slight drought state; in the 1990s, the monsoon surge intensity was strong and summer precipitation in southwest China was also obviously high, especially in 1998, when the monsoon surge intensity and precipitation reached maximum; after the 2000s, the monsoon surge intensity decreased, and summer precipitation in southwest China also decreased with it. The above analysis shows that, as a general rule, summer precipitation in southwest China is higher when the monsoon surge is strong; and summer precipitation in southwest China tends to be normal or less when the monsoon surge is weak.
In order to discuss in detail the influence of the monsoon surge on summer precipitation in southwest China, we selected the five years with the strongest and weakest monsoon surges, respectively. The strong surges were observed in 1999, 1998, 1993, 1995 and 1980, respectively, and the weak surges occurred in 1985, 1981, 2018, 1986 and 2004, respectively (Table 2). Combined with the standardized index sequences of summer precipitation in southwest China in Table 1 and Figure 6, in the first five strong monsoon years from 1979–2019, their ISO cycles were dominated by 30–60 days of low-frequency oscillation, and the five years were flood years with high precipitation; on the contrary, in the first five weak monsoon surge years, their ISO cycles were dominated by 10–20 days of low-frequency oscillation, and precipitation in the five years was mainly normal and only 2004 was slightly a drought year.
In Figure 7, we can find that in the strong monsoon surge years, summer precipitation in the whole region of southwest China was obviously higher, and the maximum areas of precipitation were mainly distributed in Chongqing–western Guangxi east of 105° E, and there were also obvious maximum areas of precipitation in southwestern Sichuan. In the weak monsoon surge years, east of 105° E in southwest China turned into obvious negative anomaly regions, and the central and western regions are still relatively obvious areas with positive precipitation anomalies (Figure 7). This indicates that the East Asian subtropical monsoon surge mainly affects southwest China to the east of 105° E, without obvious effects on southwest China to the west of 105° E, which corresponds to the conclusion that the influence boundary of the East Asian monsoon is located at 105° E [29]. In addition, in the strong monsoon surge years, the 30–60 days ISO of the EASM played a leading role and the precipitation in eastern southwest China was higher; in the weak monsoon surge years, the 10–20 days ISO of the EASM played a leading role, and the precipitation in eastern southwest China was lower. The above analysis is consistent with the study of the reference [11].
In the strong monsoon year, the OLR showed obvious characteristics of northward propagation and reached 40° N and its north (Figure 8). One of them began to spread northward from the second pentad in June and ended in the second pentad in August. This transmission period lasted for approximately 60 days, corresponding to the 30–60 days ISO of the EASM. Therefore, the periodic activity of OLR may be an important reason for the high summer precipitation in the eastern part of southwest China in the year of a strong East Asian summer monsoon. In the weak years of the monsoon surge, although the OLR exhibits oscillation characteristics of 10–20 days, the characteristics of its northward transmission are not obvious. This may also be one of the important reasons for the lack of summer precipitation in the eastern part of southwest China.

3.2.2. Correlation between Intraseasonal Oscillation of East Asian Summer Monsoon and Precipitation in Southwest China

In terms of influence of ISO on summer precipitation in southwest China, since the ISO of the EASM in different years has its own cycles and phase characteristics, if the individual years are simply averaged and synthesized, the ISO signal of monsoon will be weakened. It is difficult to reflect the true low-frequency oscillation characteristics of monsoon. Moreover, in the above analysis, the strong monsoon surge dominated by the 30–60 days low-frequency oscillation is an important factor influencing high summer precipitation in southwest China. Combined with the standardized sequences of summer precipitation in southwest China in Figure 6, 1998 was the year with the highest standardized index of summer precipitation in southwest China, which was a typical flood year and also a typical year of 30–60 days ISO of the EASM. The summer precipitation anomaly in the whole region of southwest China was obviously high in that year (Figure 9). The 30–60 days ISO of the EASM might be one of the important reasons for high summer precipitation in southwest China in that year. Therefore, 1998 can be selected to discuss the correlation between the ISO of the EASM and summer precipitation in southwest China and its influence.
There were two significant 30–60-days ISO cycles of the EASM in 1998 (Figure 10). The amplitude of the first cycle was stronger than that of the second cycle, and there were three significant maximum periods and minimum periods of summer precipitation in southwest China that year, respectively. In terms of the correlation between 30–60 days low-frequency oscillations and precipitation in southwest China, in the earlier stage of the first cycle, the ISO of the EASM weakened and the first minimum period of precipitation appeared in southwest China. Later, the ISO of the EASM gradually strengthened, precipitation increased in southwest China, and two maximum periods of precipitation appeared with a relatively significant positive correlation. In the later stage of the first cycle, the ISO of the EASM weakened, precipitation in southwest China decreased, and the second low-value period of precipitation appeared. In the second cycle, the ISO of the EASM weakened, the correlation between characteristics of precipitation evolution in southwest China and EASM was not obvious, especially in the troughs of the second cycle, the third maximum period of precipitation appeared in southwest China, but in the later stage, the ISO of the EASM weakened, and the third minimum cycle of precipitation appeared in southwest China. The above analysis also corresponds well to the time–longitude profile of the OLR during the same period (Figure 11). It can be seen that the activity of the OLR plays a very important role in the influence of the ISO of the EASM on the summer precipitation in southwest China.
Thus, it can be seen that the influence of the 30–60 days ISO of the EASM on precipitation in southwest China in 1998 was mainly manifested as follows: the amplitude of the ISO was relatively large in the first 30–60 days oscillation cycle. When the intensity of the ISO of the EASM increases, precipitation is high in southwest China; when the intensity of the ISO of the EASM decreases, precipitation is accordingly low; and in the second 30–60 days oscillation cycle, the amplitude of oscillation was relatively small, the intensity of ISO of the EASM was weak, and there was a relatively weak correlation between the ISO of the EASM and precipitation in southwest China.
In order to explore the relationship between the ISO of the EASM and precipitation evolution in southwest China, the two 30–60 days ISO cycles of the EASM in 1998 were divided into 6 phases, respectively (Figure 12). In phase 1 of the first cycle, as a whole, southwest China was a negative anomaly region, with low precipitation (Figure 13). In phase 2, the central and western regions of Guangxi and its surroundings turned into positive anomaly regions, with an increase in precipitation, and the rest of the regions were negative precipitation anomaly regions. In phase 3, the positive precipitation anomaly region extended westward to Yunnan and the eastern region of Tibet, and a small range of positive precipitation anomaly regions also appeared in eastern Sichuan. In phase 4, the precipitation in the central and western regions of Guangxi weakened, the high precipitation area in Yunnan shifted to the westward, eastern Sichuan to Chongqing showed a clear high precipitation area and precipitation in eastern Tibet also increased significantly. In phase 5, the precipitation in the southwest of China was generally higher, there were still maximum centers of precipitation in southern Yunnan and southwestern Guangxi, maximum centers of precipitation in the Sichuan and Chongqing area developed westward to the central and western regions of Sichuan, with an obvious increase in precipitation. In phase 6, the precipitation in southwest China weakened, there were relatively weak positive precipitation anomaly regions in Sichuan–Yunnan–Guizhou’s border, southern Yunnan and northeastern Sichuan, and the rest of the region had less precipitation.
In phase 1 of the second cycle, precipitation in southwest China was relatively less, and maximum areas of precipitation were mainly located in Chongqing and Guizhou, and there were obvious negative precipitation anomaly regions in southern Guangxi, central Sichuan, southern Yunnan, etc. In phase 2, maximum areas of precipitation in Chongqing and Guizhou extended southwestward to western Guangxi and southeastern Yunnan, and precipitation in western Sichuan also increased. In phase 3, precipitation in the western Chongqing and Guizhou area decreased, there were relatively obvious positive anomaly regions in western Sichuan–Tibet, precipitation in Yunnan–Guangxi also decreased, and there were obvious minimum areas of precipitation distributed in southwestern Guangxi. In phase 4, there were relatively obvious maximum areas of precipitation in Chongqing–northwestern Guizhou, southern Sichuan, eastern Tibet, etc., and precipitation in western Sichuan and its west, Yunnan and the central and western regions of Guangxi also relatively increased. In phase 5, as a whole, southwest China was a positive precipitation anomaly region, and its maximum centers were located in northern Chongqing and its north. In phase 6, as a whole, precipitation in southwest China decreased, and positive precipitation anomaly regions were mainly located in northeastern Sichuan, Guizhou and central Tibet, and the rest of the regions were basically negative anomaly regions. Thus, it can be seen that there was a relatively good correlation between spatial distribution characteristics of precipitation in southwest China and the ISO of the EASM in 1998. When the ISO of EASM intensity increases, the range of positive precipitation anomaly region extends with it. When the ISO of the EASM decreases, the positive precipitation anomaly region also decreases with it.

4. Physical Process of ISO of EASM Influencing Precipitation in Southwest China

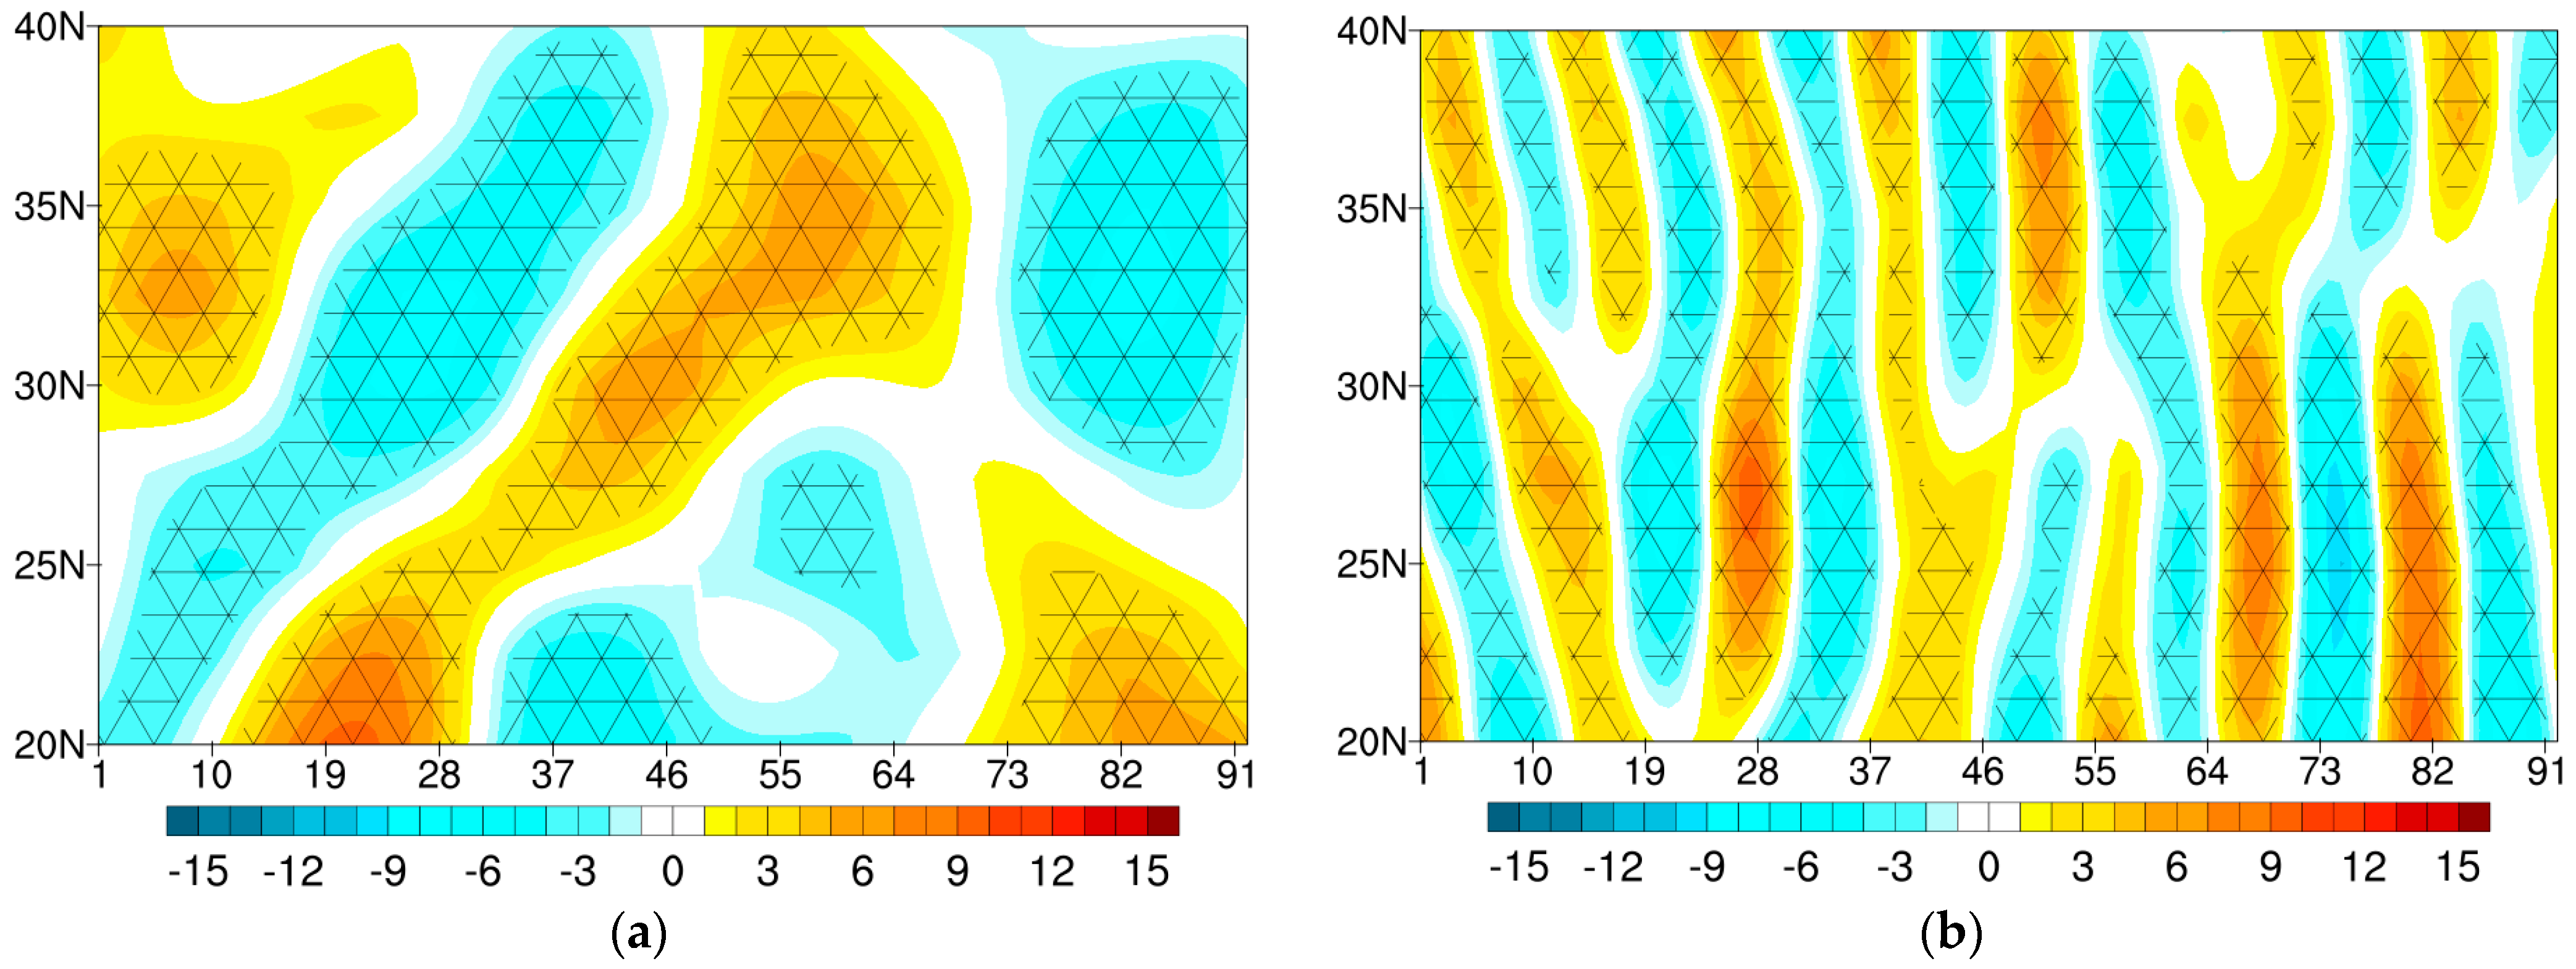
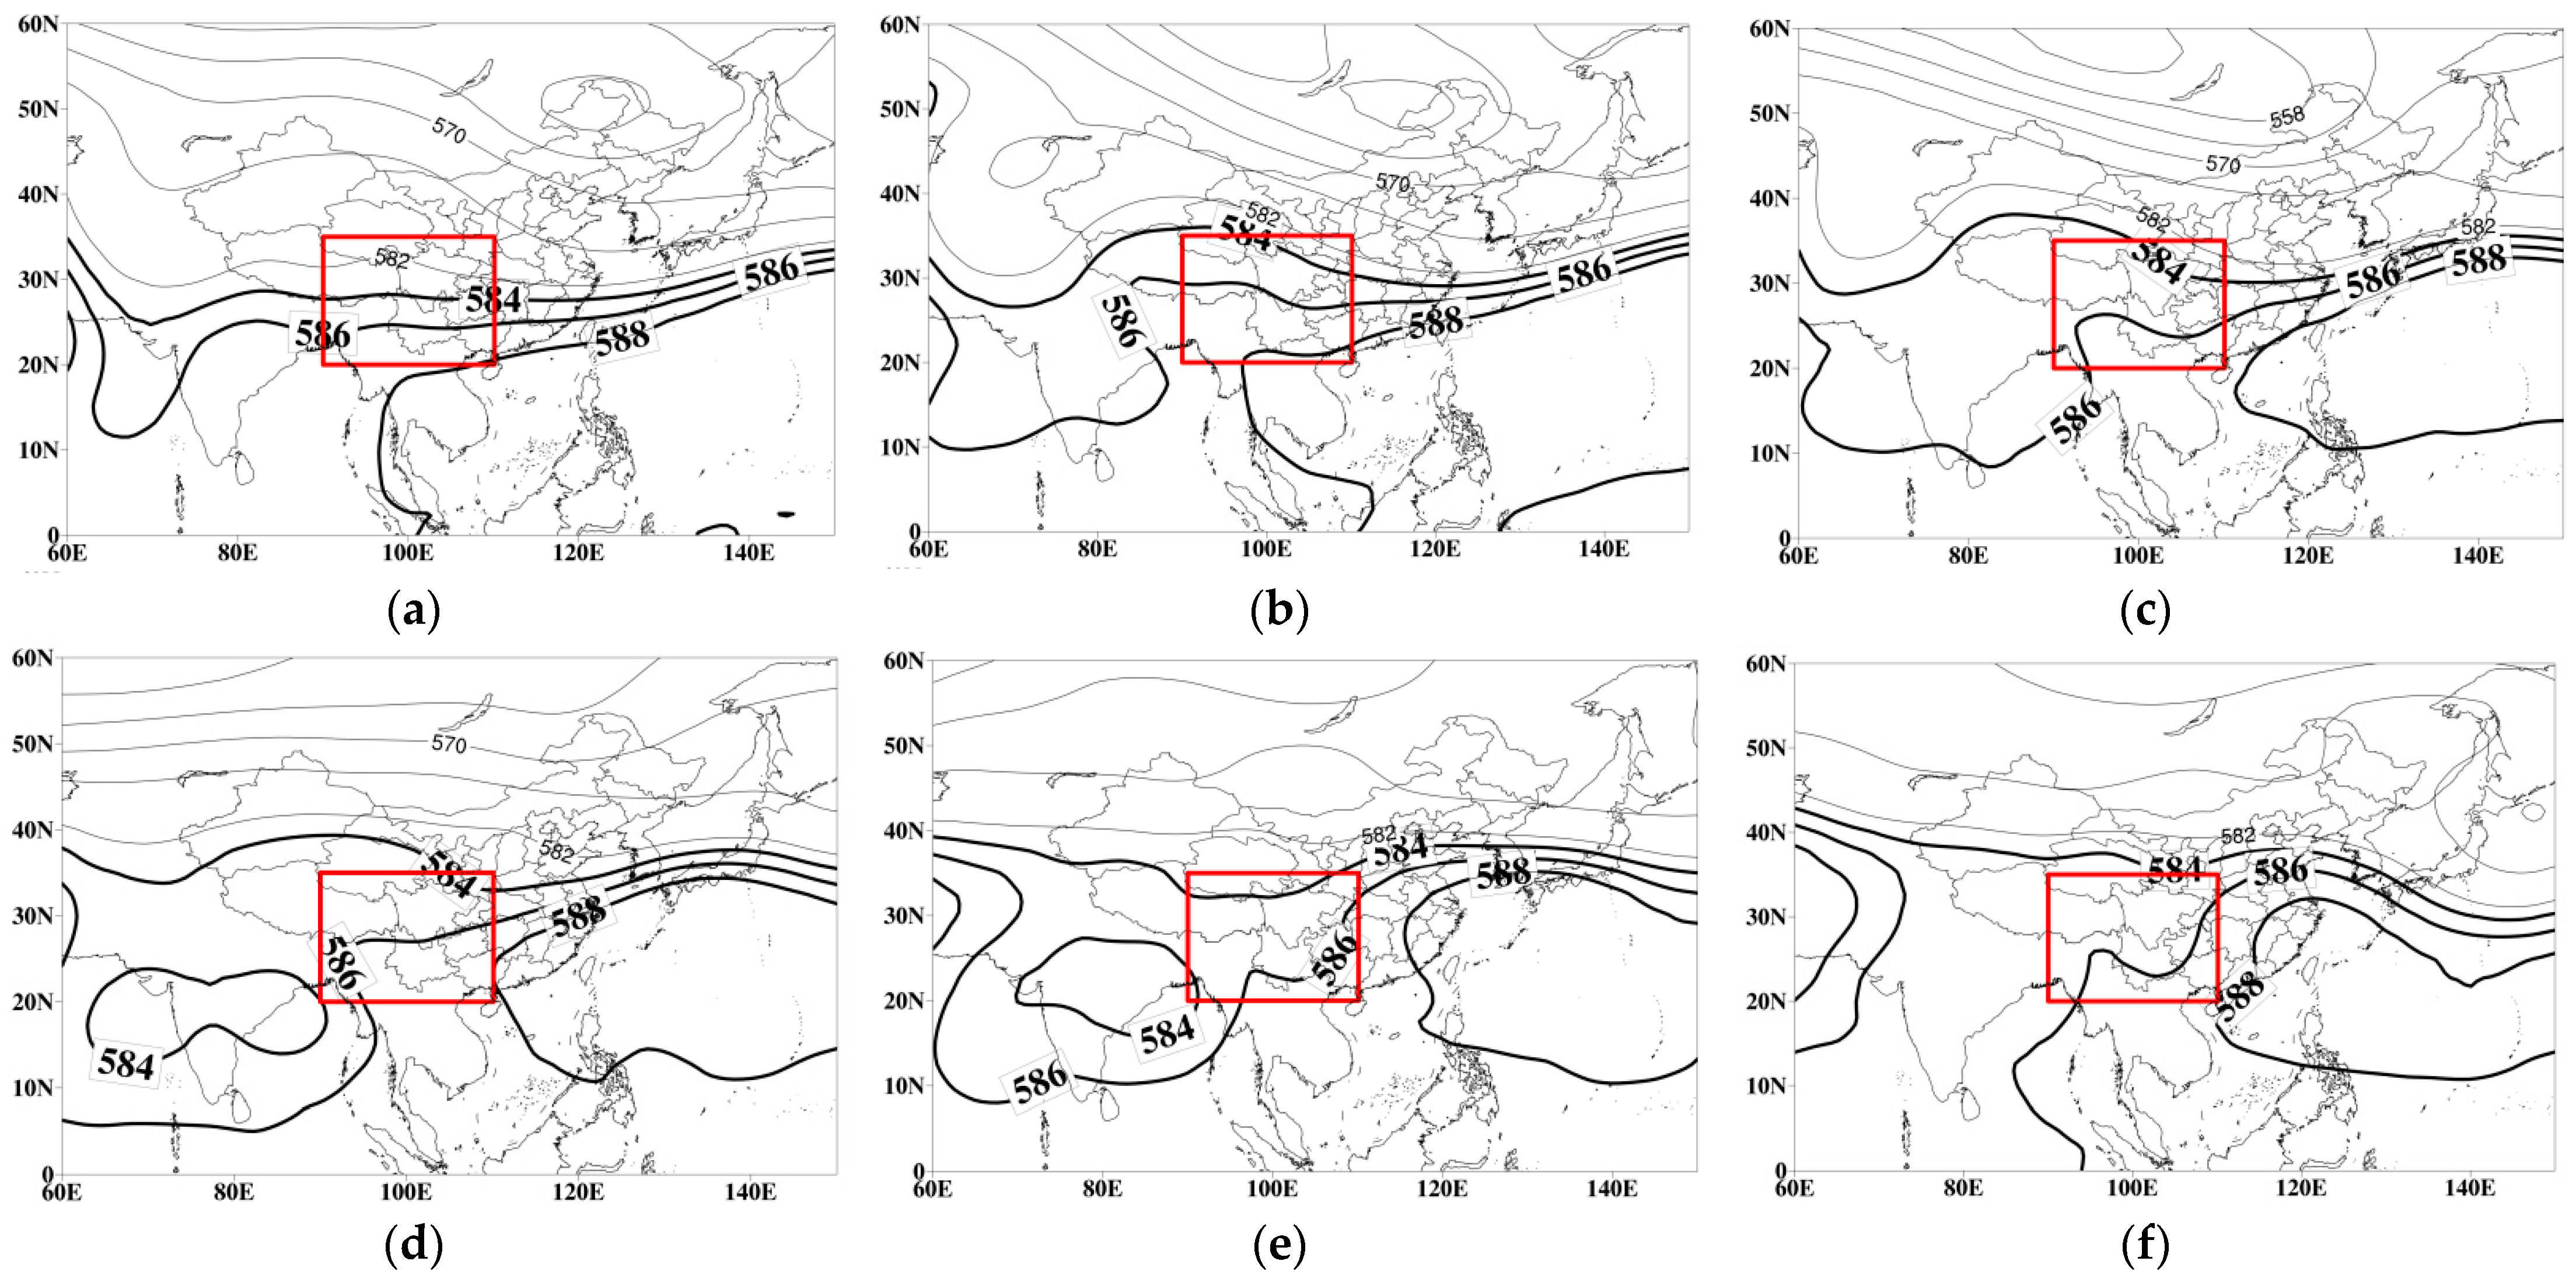
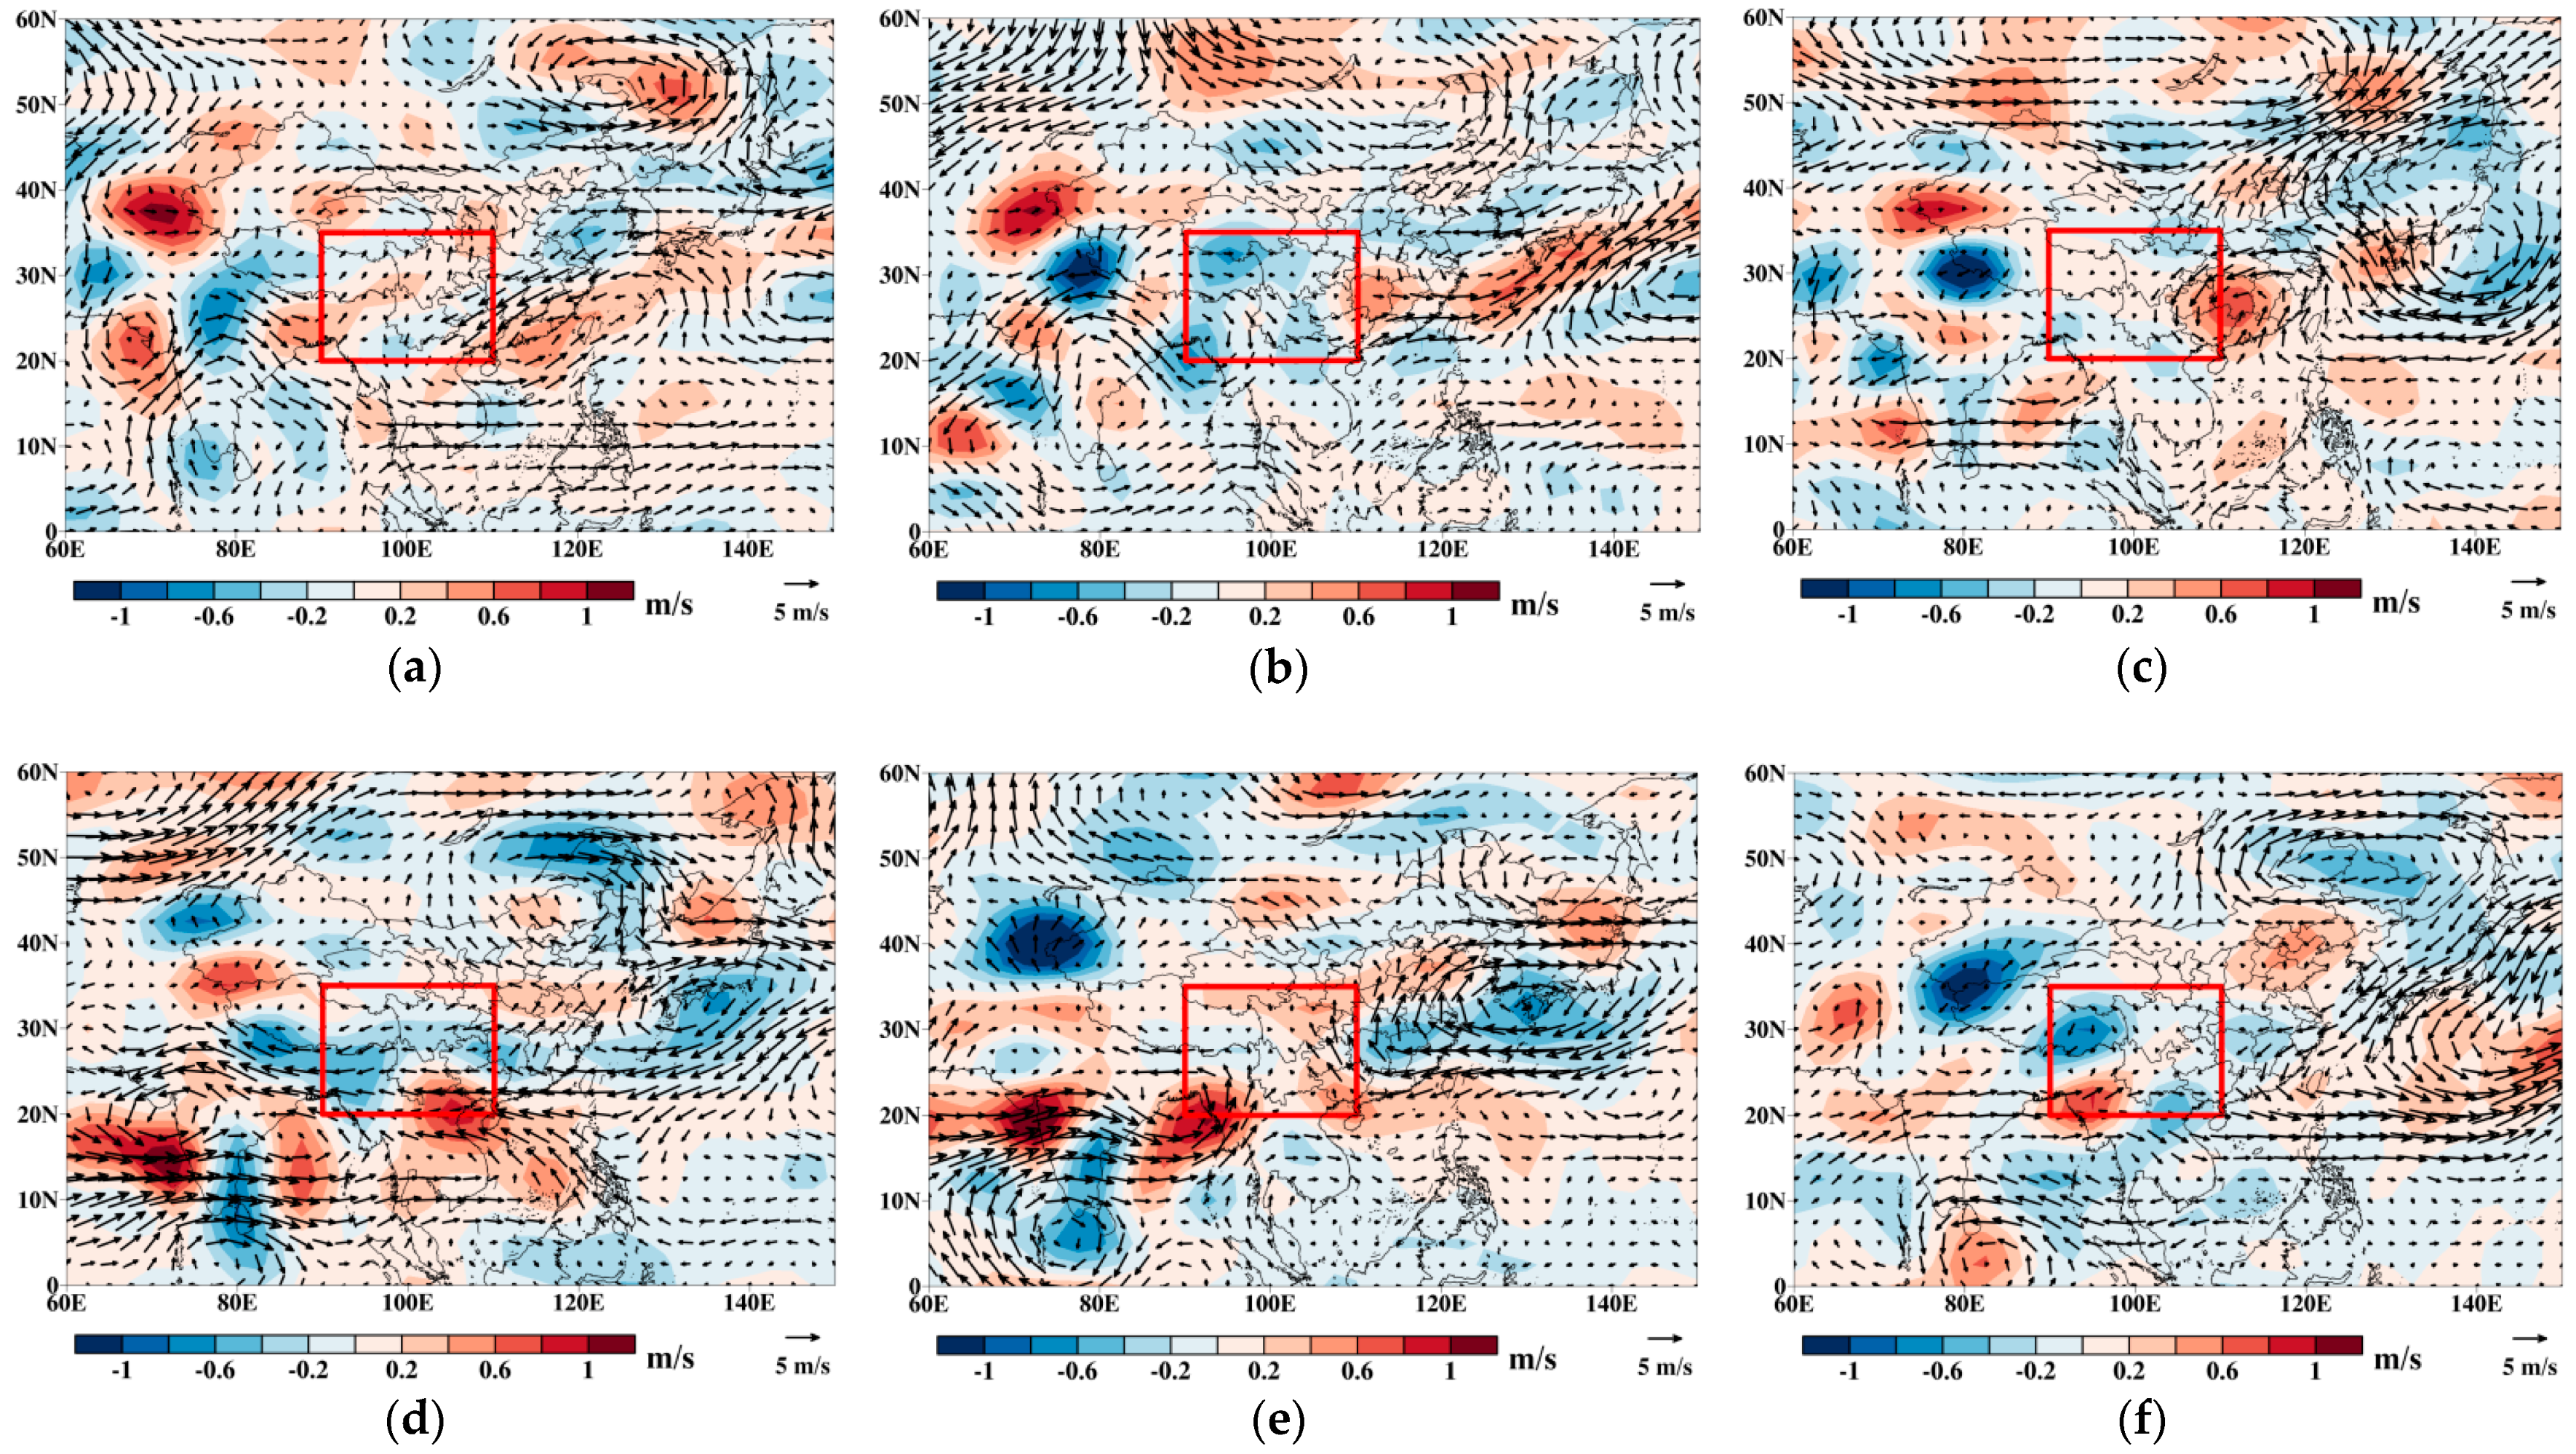
4.1. Physical Processes of East Asian Summer Monsoon Surge Influencing Precipitation in Southwest China in Strong and Weak East Asian Summer Years

Precipitation is a phase transition process of water in the atmosphere, and the cooperation of different scale weather systems, sufficient water vapor transfer and strong upward motion are important conditions for the formation of precipitation. The cooperation of different scale weather systems can provide a relatively stable circulation background field for precipitation occurrence, sufficient water vapor transfer can supply an abundant water vapor source for precipitation occurrence, and strong upward motion can cause the water vapor to converge and rise and expand adiabatically during the rise. The cooling condenses into clouds, and the growth of cloud droplets turns into raindrops falling, which eventually produces precipitation.
We can see that in the strong monsoon surge years, the high latitudes of central and western Asia in the high anomaly field were negative anomaly regions, and the low latitudes were positive anomaly regions. East Asia had a longitudinal wave train characteristic of “+ − +” from north to south. The western Pacific subtropical high was westward, affecting southern China (Figure 14a). There was relatively obvious cold air moving southward in central China, and the South China Sea–western Pacific–southern China were under the control of a wide range of anticyclonic circulation, which was conductive to the East Asian monsoon surge advancing toward southwest China (Figure 15a), so that north and south warm and humid airflows converged and there were obvious water vapor convergence centers in southwest China (Figure 16a), with obvious upward motion of water vapor, which was conductive to high precipitation. Especially in Chongqing–western Guangxi in the eastern part and west of western Sichuan, upward airflow was obvious (Figure 17a), which were maximum areas of precipitation. Circulation configuration in the weak monsoon surge years and precipitation in the strong monsoon surge years were basically contrary to this. The mid and high latitudes of central and western Asia were obvious positive anomaly regions, and the mid and low latitudes were negative anomaly regions, East Asia had a longitudinal wave train of “+ − +” from north to south and the western Pacific subtropical high was easterly (Figure 14b), the mid and high latitudes had no obvious cold air moving southward, and the South China Sea–western Pacific–southern China turned into cyclonic circulation control. The northerly airflow prevailing in eastern southwest China restrained the East Asian monsoon surge from moving northward (Figure 15b), and water vapor in the central and western region was mainly sourced from the easterly airflow in the north of the South China Sea–western Pacific cyclone (Figure 16b), but upward motion of water vapor was relatively obvious in the central and western region, which was conductive to more precipitation, and precipitation in the east was less due to influence of downward airflow (Figure 17b). The above analysis results are consistent with the studies of Zhang and Ju [11,21]. Thus, it can be seen that the west–east variation of the western Pacific subtropical high and the change of circulation feature in the South China Sea–western Pacific are important influencing factors for a strong and weak East Asian monsoon surge and high and low summer precipitation in southwest China. However, as southwest China is by west in geographical location, the region where circulation configuration of the East Asian monsoon surge had relatively obvious influence was mainly eastern southwest China, which is consistent with the conclusion in Section 3.2.

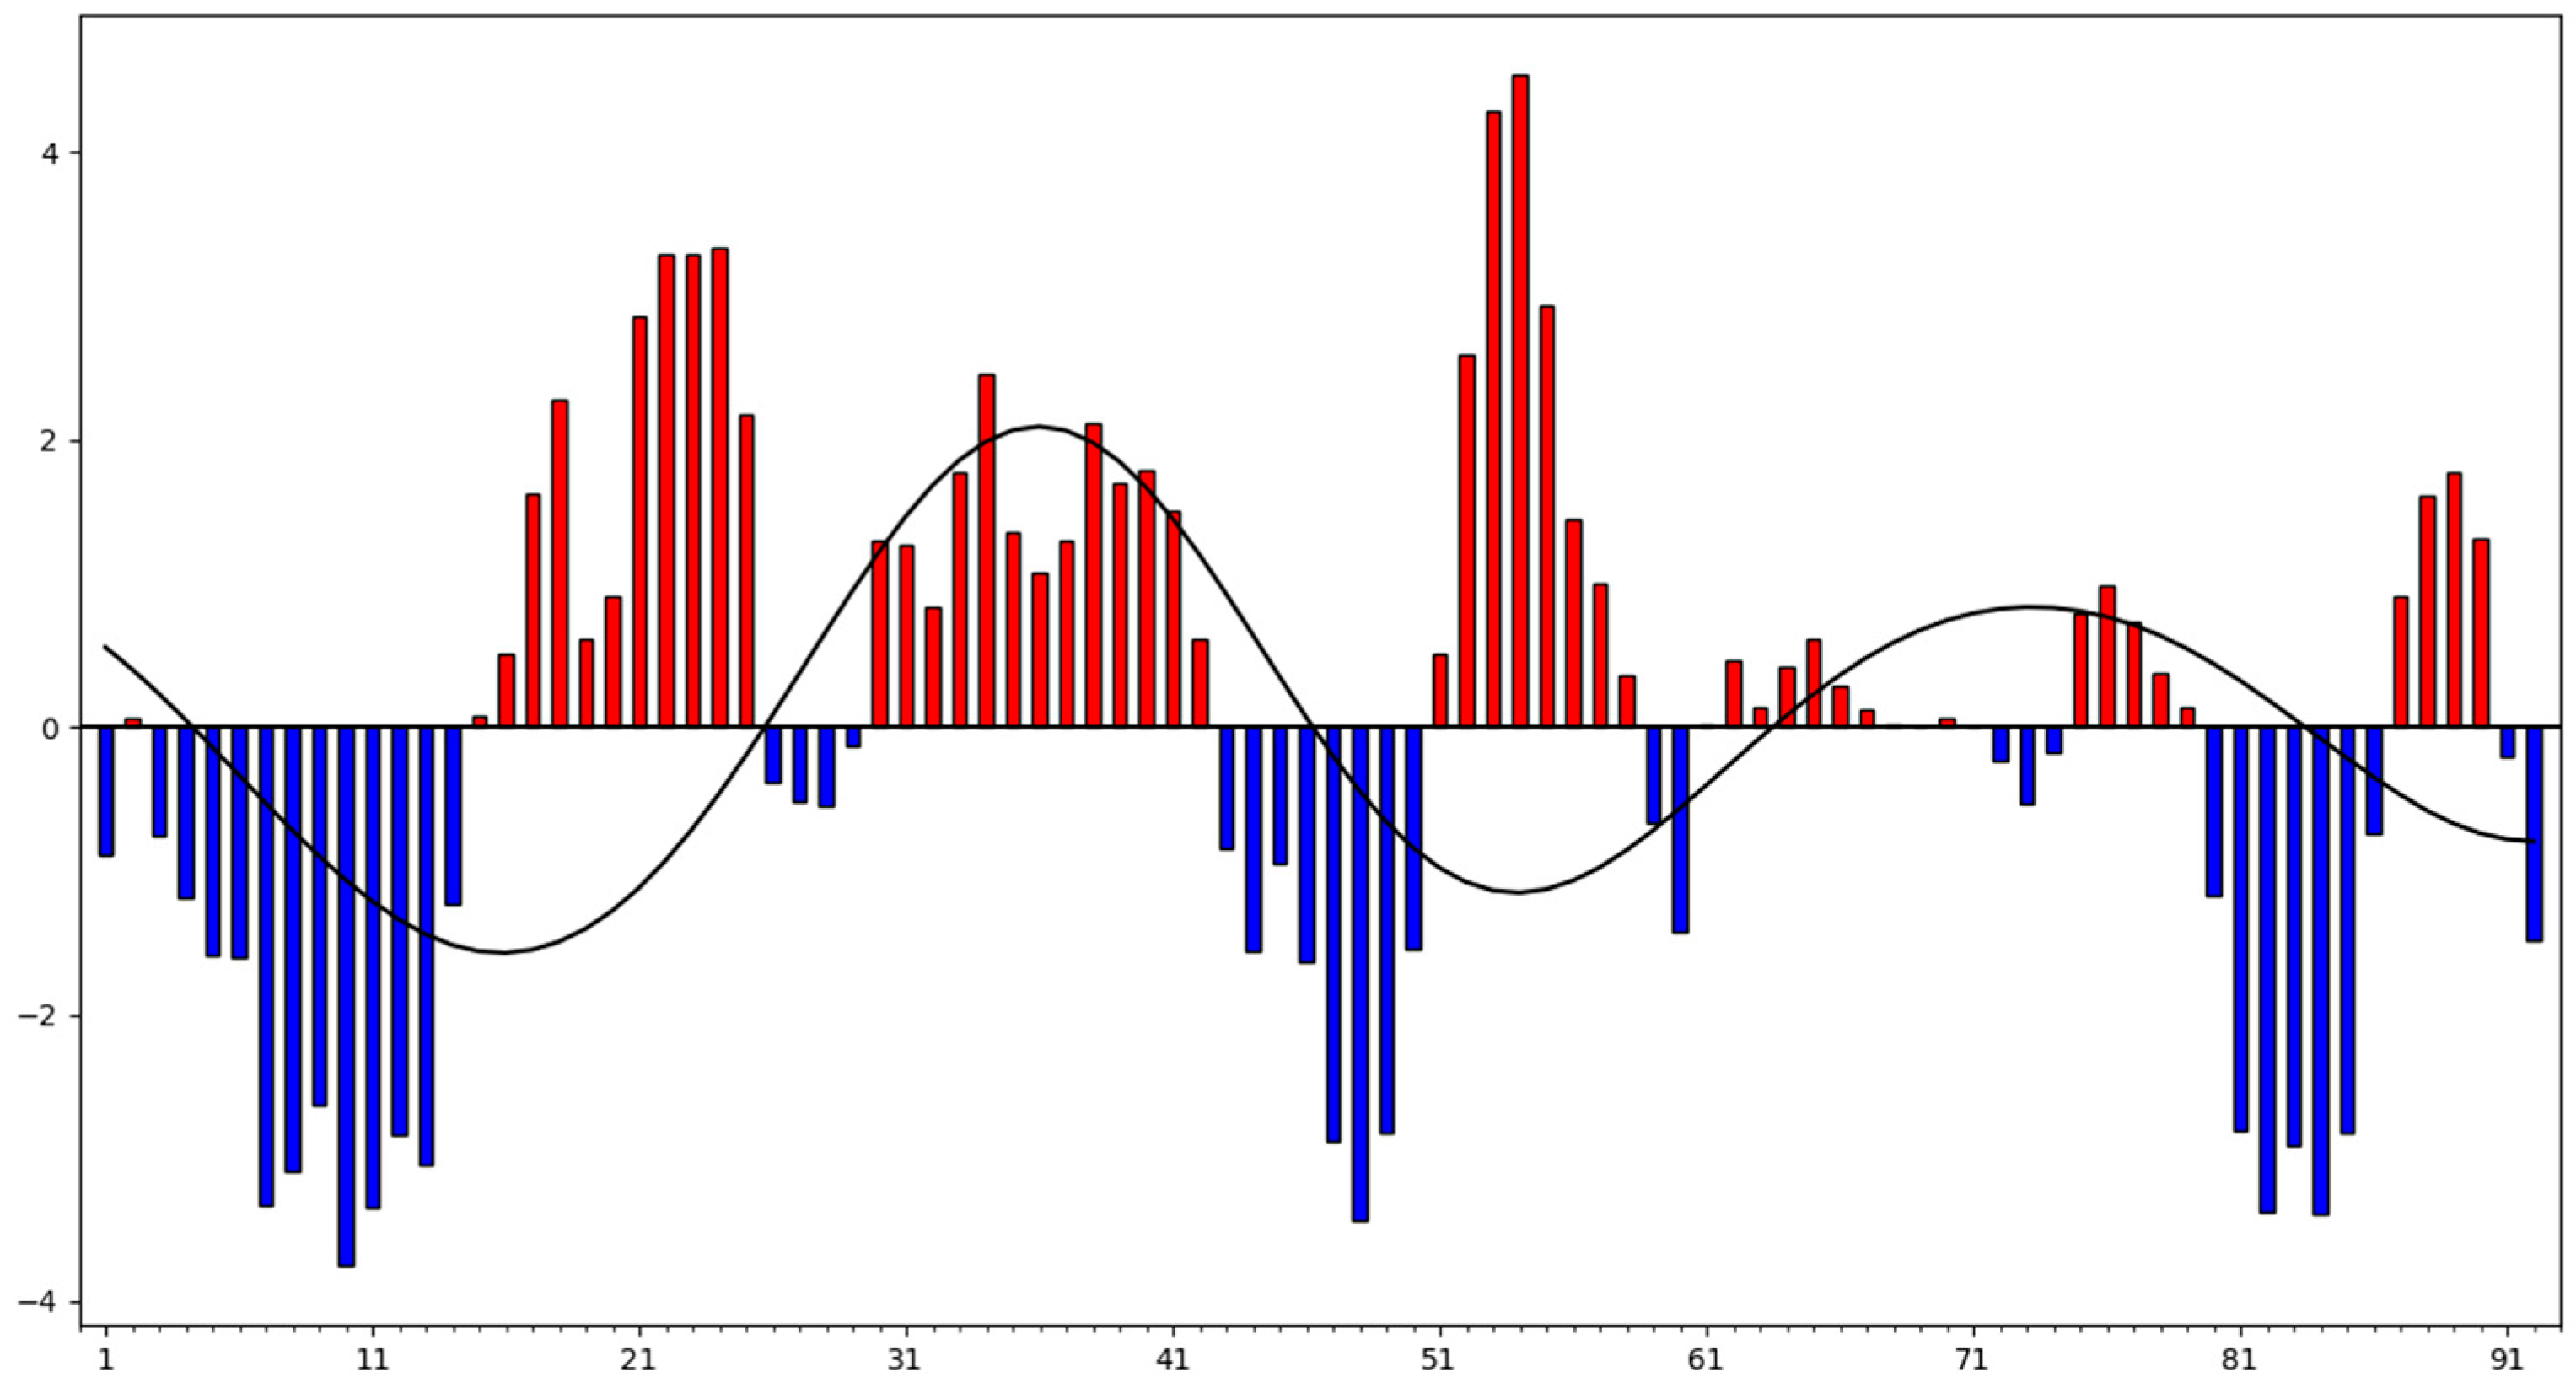
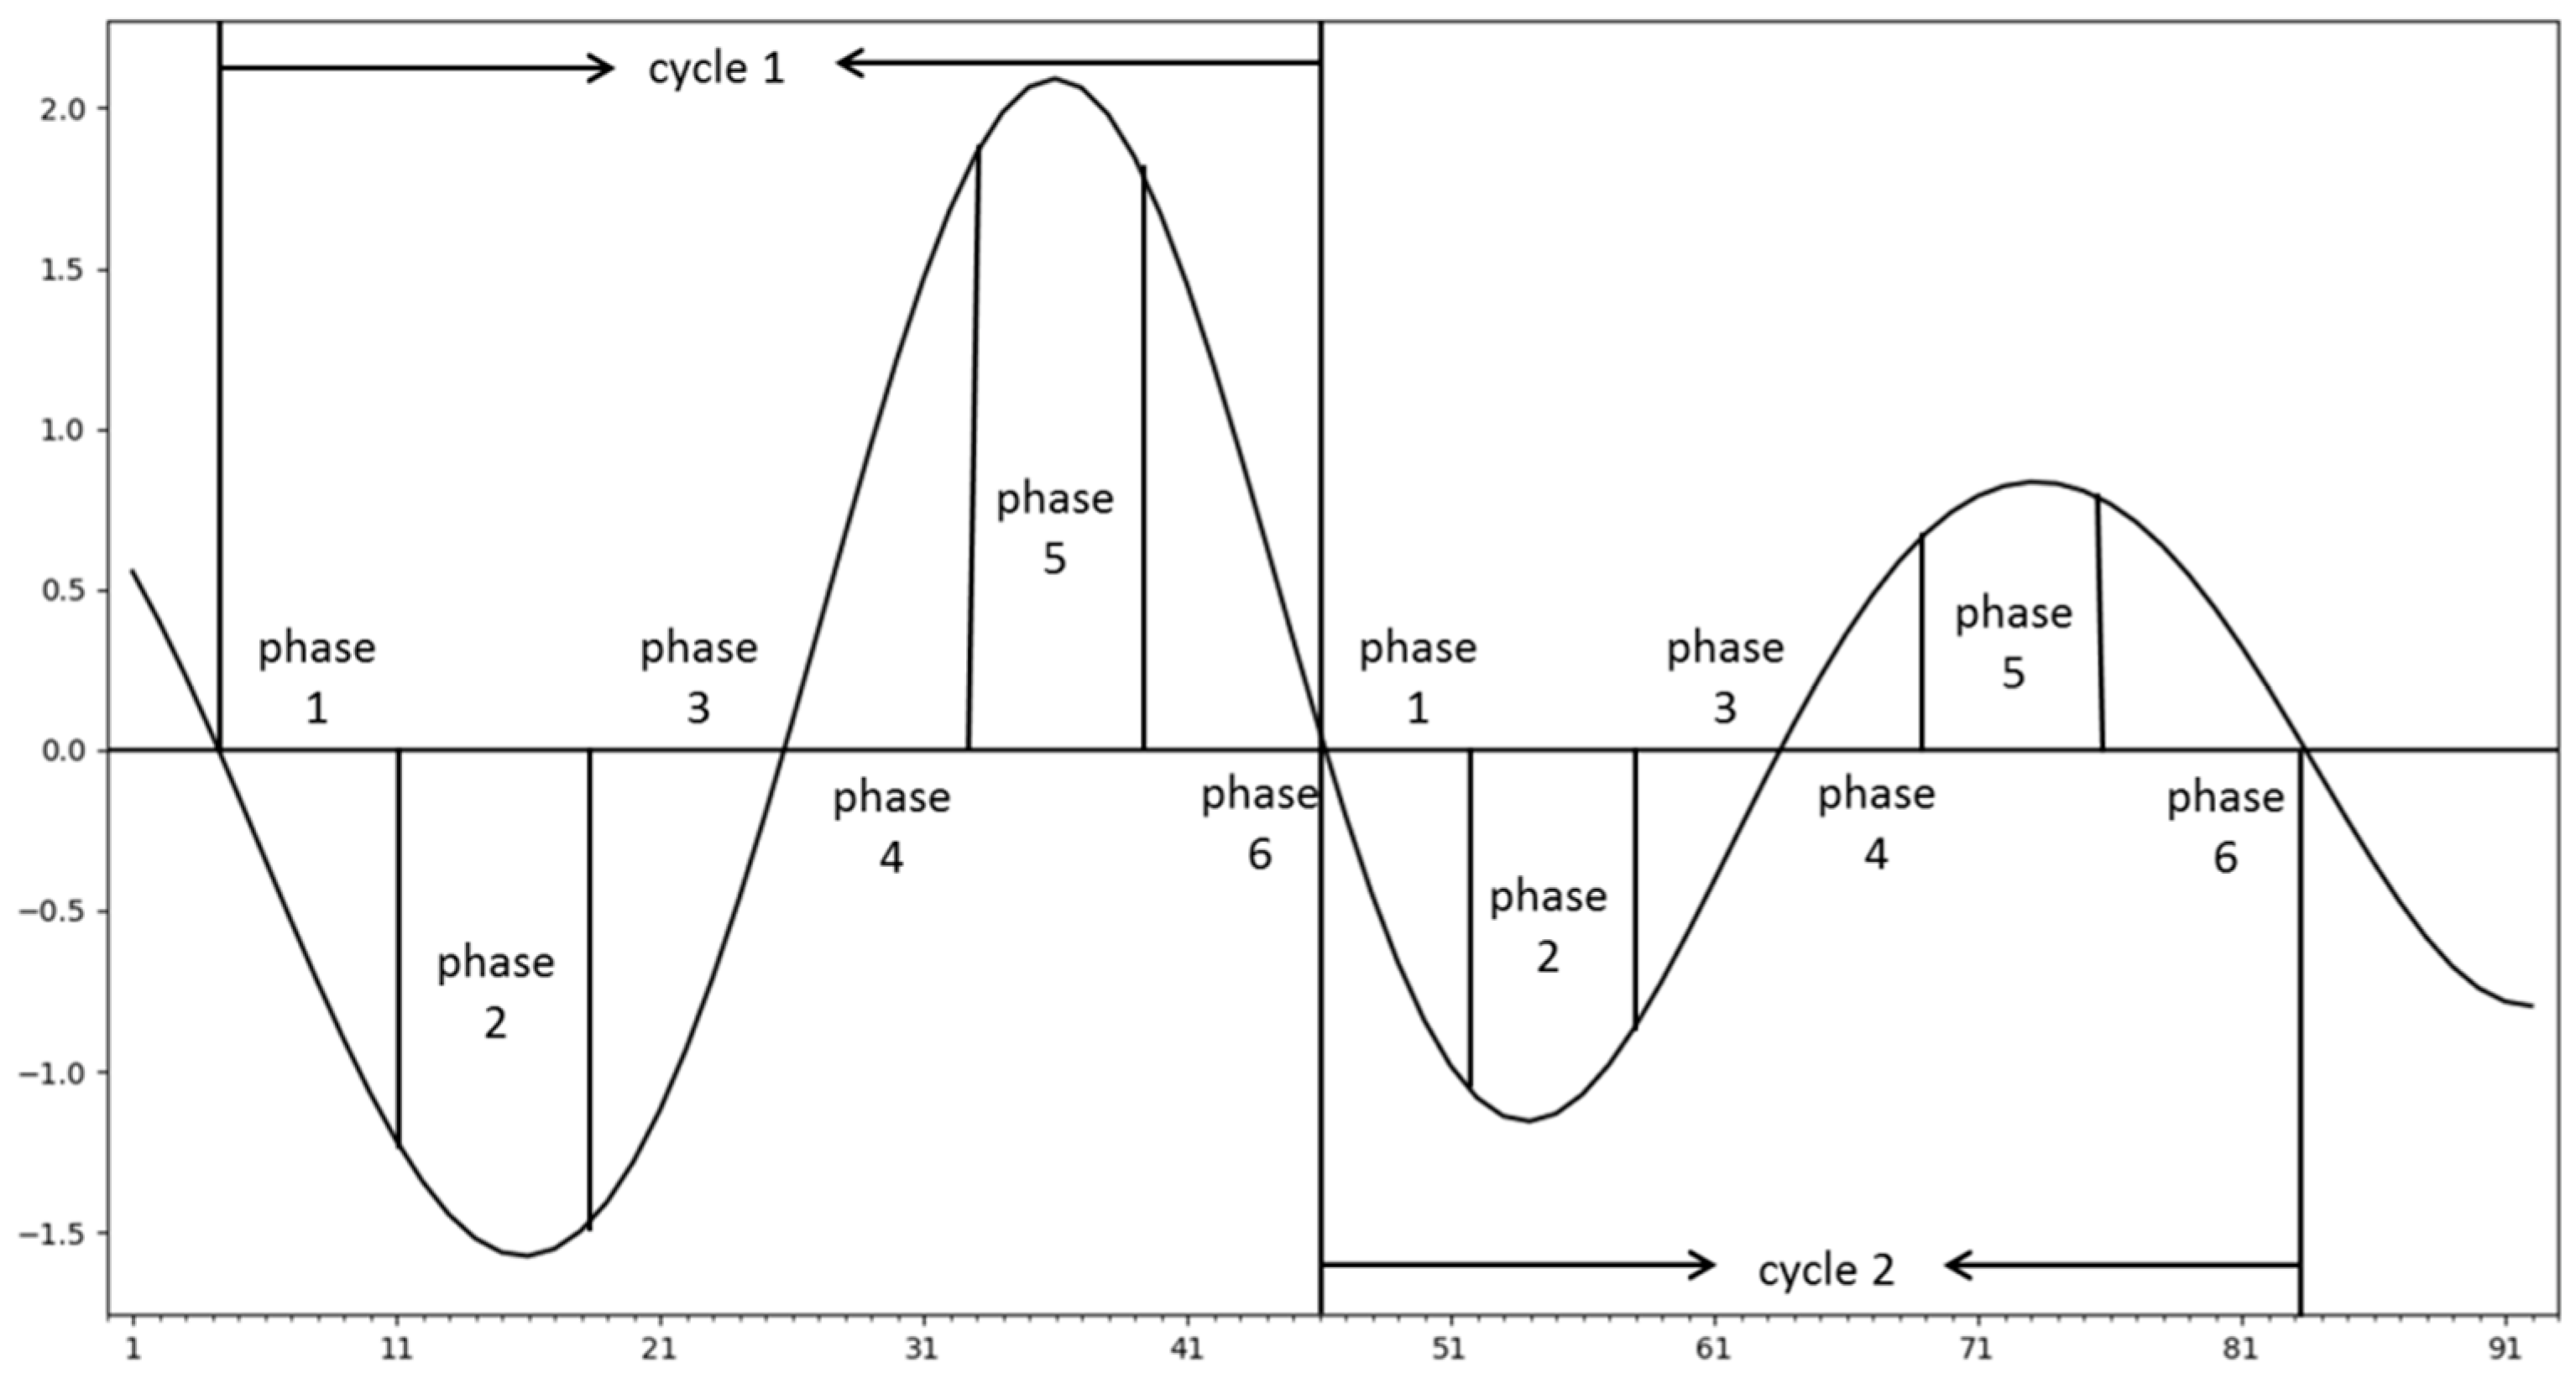
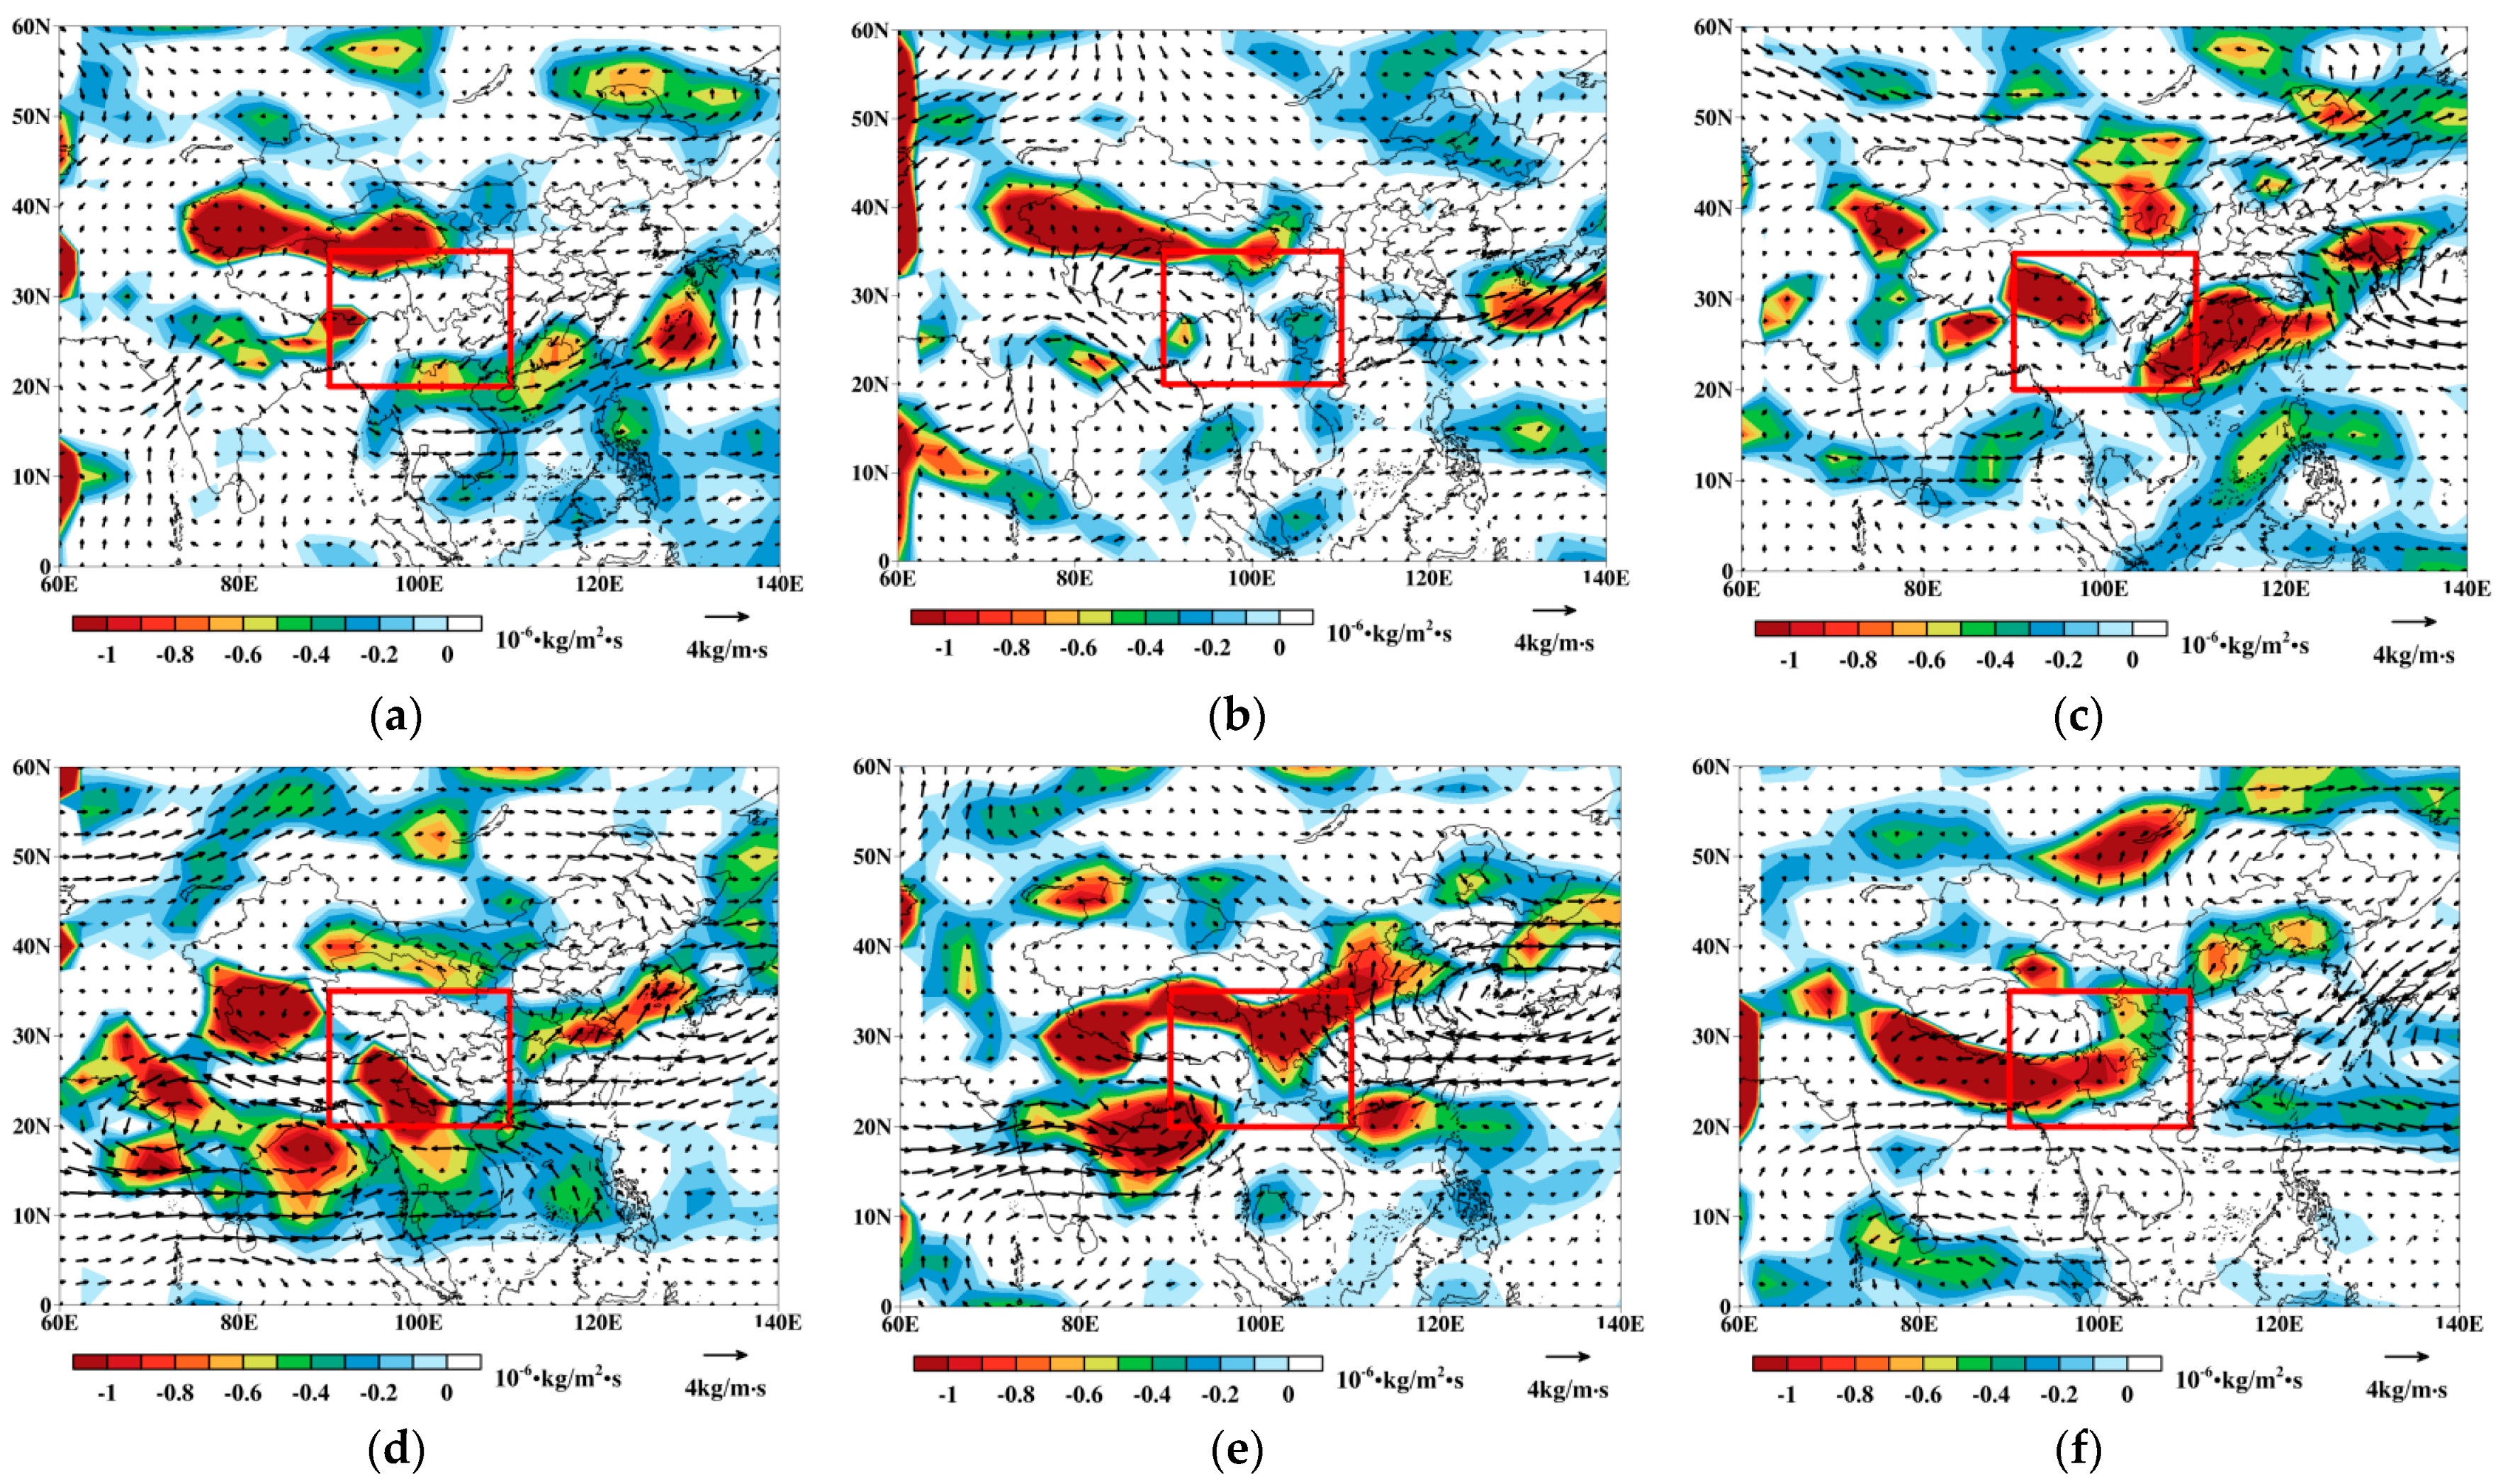
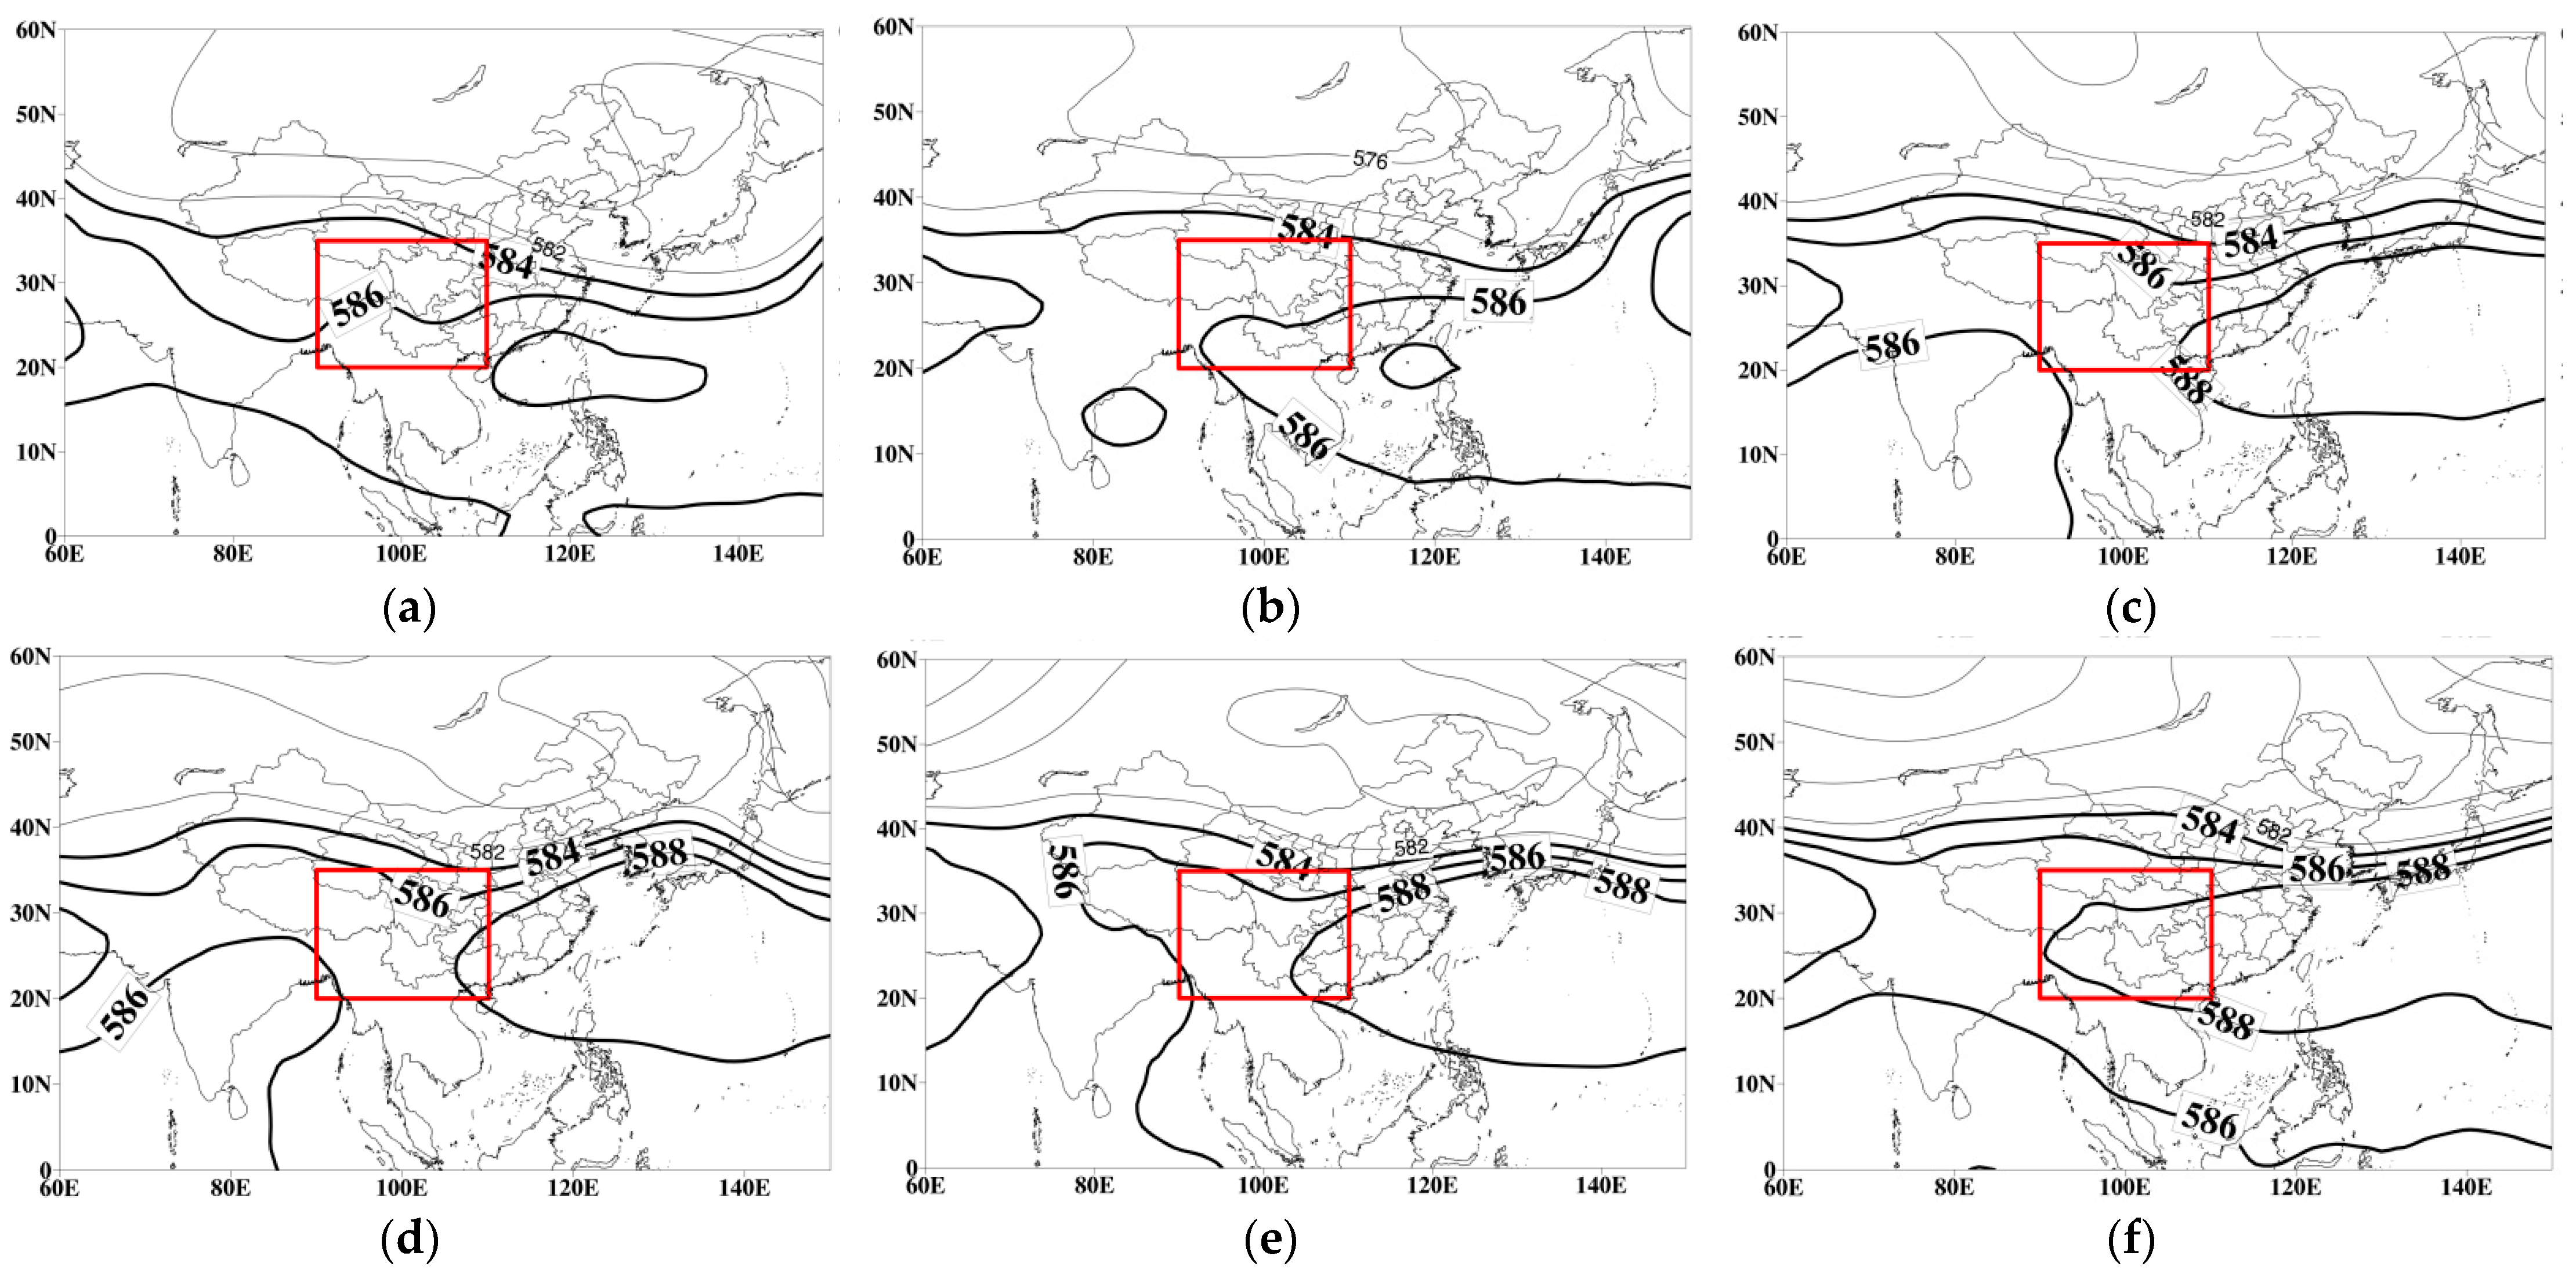
4.2. Physical Processes of East Asian Summer Intraseasonal Oscillation Influencing Precipitation in Southwest China in 1998

Influenced by the circulation evolution of the 30–60-day ISO of the EASM, precipitation in southwest China in 1998 showed relatively obvious oscillation characteristics, especially in the first oscillation period.
At first, in phase 1, the western Pacific subtropical high was abnormally westerly, with the western ridge extending east of the Bay of Bengal. Cyclonic circulation in the coastal region of south China and westerly airflow in the Indo-China Peninsula–western Pacific was not conductive to the EASM advancing toward China. The ISO of the EASM was relatively weak. Cyclonic circulation in northern northeast China and Qinghai converged the cold airflow from the north into it, so that the cold air was not easy to move southward. Although there was a relatively obvious upward motion of water vapor in southwest China, overall precipitation was low due to water vapor divergence in the region (Figure 18a, Figure 19a and Figure 20a).
After that, northward development of cyclonic circulation in the coastal region of south China influenced the middle and lower reaches of the Yangtze River. The ISO of the EASM was still relatively weak, the central and western regions of southwest China were influenced by the anticyclone of the northern Bay of Bengal, where northwest wind prevailed, airflow moved downward, and water vapor diverged, which was not conductive to precipitation. However, the Guizhou and Guangxi areas were influenced by southwestward wind, with obvious water vapor convergence and upward motion and high precipitation (Figure 18b, Figure 19b and Figure 20b).
Until phase 3, the western Pacific subtropical high retreated eastward to the South China Sea. Cyclonic circulation in mid and high latitudes restrained northern cold air from moving southward. The ISO of the EASM began to strengthen, warm and humid airflow from the South China Sea and western Pacific provided a sufficient water vapor source for cyclonic circulation of south China. In southwest China, the upward motion of water vapor enhanced, there were obvious water vapor convergence centers in Yunnan and southern Guangxi in the south, precipitation was obviously increased in southern southwest China; in particular, the Guangxi area in the east was a maximum value area of precipitation under the influence of the southern cyclone (Figure 18c, Figure 19c and Figure 20c).
Next in phase 4, the western Pacific subtropical high advanced northward to control south China, corresponding to anticyclonic circulation of the western Pacific. Its easterly airflow in its south and southeastward airflow near the Philippines converged, carrying the warm and humid airflow of the South China Sea and western Pacific to transfer toward southern China, and formed a maximum area of water vapor convergence in the Indo-China Peninsula–southern Tibet, with obvious upward motion. Therefore, Tibet and Yunnan, Guangxi, etc., in southern southwest China had more precipitation. In addition, under the influence of warm and humid airflow on the northwest side of the subtropical high, Sichuan, Chongqing, etc., in northeastern southwest China also had obvious precipitation occurring (Figure 18d, Figure 19d and Figure 20d).
In phase 5, the northwest Pacific subtropical high lifted northward again to control the middle and lower reaches of the Yangtze River. The westerly airflow of the Indian Peninsula turned in the Bay of Bengal, partial airflow carried the warm and humid airflow of the Bay of Bengal to enter southwest China. The ISO of the EASM enhanced to reach wave peak, easterly airflow at the south side of the anticyclone of the western Pacific carried the warm and humid airflow of the South China Sea and western Pacific to transfer westward and influenced southwest China, where upward motion of water vapor prevailed under the combined action of the warm and humid airflow of the Bay of Bengal and South China Sea–western Pacific, there was an obvious water vapor convergence area in the north with more precipitation as a whole, especially, there were obvious maximum areas of precipitation in eastern Sichuan (Figure 18e, Figure 19e and Figure 20e).
In phase 6, the western Pacific subtropical high had a decrease in area, but still settled in the middle and lower reaches of the Yangtze River. There was a relatively obvious southwesterly wind entering southwest China. In eastern China–western Pacific, under the control of cyclonic circulation, the ISO of the EASM intensity decreased, which was not conductive to advancing toward southwest China. The water vapor convergence of southwest China mainly concentrated in its middle, the upward motion of water vapor was relatively obvious in southwestern and northwestern Yunnan, with more precipitation; Chongqing, Guizhou and Guangxi in the east had less precipitation (Figure 18f, Figure 19f and Figure 20f).
In the second cycle, due to a decrease in the 30–60 days ISO intensity of the EASM, its correlation with precipitation in southwest China also decreased and its specific atmospheric circulation process is as follows:
In phase 1, the western Pacific subtropical high retreated southward, with a decrease in area. The ISO of the EASM intensity continued to weaken, and there was cold air moving southward in mid and high latitudes. Westerly airflow at the northeast side of the anticyclone circulation of the Indian Peninsula turned into a northwesterly after entering southwest China, and the northerly airflow at the west side of the cyclonic circulation of the northwest Pacific reached eastern southwest China. Precipitation in southwest China was less under the influence of downward airflow. However, the northwest, central and western regions had an obvious water vapor convergence with upward airflow, precipitation mainly happened in the Chongqing–Guizhou area in eastern China, while western Sichuan and its northwest region also had relatively obvious precipitation (Figure 21a, Figure 22a and Figure 23a).
Then, the subject of the western Pacific subtropical high continued to be southerly. The influence of the anticyclonic circulation of the India Peninsula on southwest China weakened, the cyclonic circulation of the northwest Pacific developed eastward and further influenced China, the ISO of the EASM intensity reached the wave trough. However, there was a relatively significant water vapor convergence in eastern southwest China under the influence of the cyclonic circulation and there were also obvious water vapor convergence areas in the northwest. Except in Yunnan, the upward motion of airflow prevailed throughout the region, so precipitation mainly occurred in Guizhou Province, western Guangxi Province, and eastern Yunnan Province (Figure 21b, Figure 22b and Figure 23b).
In phase 3, the subject of the western Pacific subtropical high enhanced and its area increased to control south China again. Under the influence of the anticyclonic circulation of the South China Sea, the ISO of the EASM intensity enhanced. There was an obvious southwesterly wind in southeastern southwest China, but the water vapor convergence condition was weak, with downward airflow, which was not conductive to the occurrence of precipitation. There were obvious water vapor convergence areas in eastern Chongqing–eastern Guizhou in the northeast of the southwest region and eastern Tibet–western Sichuan in the west of the southwest region, with upward airflow, therefore, precipitation was more (Figure 21c, Figure 22c and Figure 23c).
Later, the western Pacific subtropical high enhanced again and lifted northward to control southern China–the middle and lower reaches of the Yangtze River. The northern Bay of Bengal had a relatively southerly wind entering southwest China. The ISO of the EASM continued to enhance. There was an anticyclonic circulation with a relatively small range over south China, the easterly wind at its south side carried the warm and humid airflow of the western Pacific and South China Sea to influence southwest China, which was conductive to the occurrence of precipitation. In addition, the large value areas of water vapor convergence in southwest China were mainly located in Sichuan and its northwest, and the upward motion of water vapor prevailed in the central and western regions. Therefore, precipitation was higher (Figure 21d, Figure 22d and Figure 23d).
The overall atmospheric circulation characteristics in phase 5 were similar to those in phase 4. Two airflows from the South China Sea–western Pacific and the northern Bay of Bengal carried warm and humid airflows to converge in southwest China, providing abundant sources of water vapor, and there were obvious water vapor convergence centers in southwest China. Except in western Guangxi and southeastern Guizhou in the southeast, the whole region had obvious upward motion, with more precipitation (Figure 21e, Figure 22e and Figure 23e).
Finally, the western Pacific subtropical high enhanced westward extension again, which almost controlled the whole south of China. There were flat easterly airflows over the western Pacific–Arabian Sea in the south of 20° N, which had difficulty advancing toward China due to the decrease in the ISO of the EASM intensity. Southwest China was influenced by anticyclonic circulation in the middle and lower reaches of the Yangtze River, and there were obvious southerly winds in the east. However, downward airflow prevailed in southwest China, and water vapor convergence conditions were relatively poor with low precipitation. There were relatively obvious water vapor convergence centers and upward motion in the northwest; therefore, precipitation was higher (Figure 21f, Figure 22f and Figure 23f).
The above analysis shows that when the western Pacific subtropical high was westerly and southerly, and there was obvious cyclonic circulation from China to the western Pacific, the ISO of the EASM intensity was stronger and precipitation was higher in southwest China; when there was an obvious cyclonic circulation from China to the western Pacific, the ISO of the EASM intensity was relatively weak and the precipitation in southwest China was relatively low.

5. Conclusions and Discussion

In previous studies, the ISO of the EASM has two types of oscillation periods, 10–20 days and 30–60 days, which are mostly related to summer precipitation in the middle and lower reaches of the Yangtze River in China. The peaks and troughs of ISO correspond to the high and low summer precipitation periods in the middle and lower reaches of the Yangtze River, showing a good positive correlation. In order to deeply explore the influence of the ISO of the EASM on the summer precipitation in south China, we selected southwest China as the study area.
In our study, the East Asian summer monsoon surge and summer precipitation in southwest China also showed a clear positive correlation. That is to say, when the East Asian summer monsoon surge is strong, the summer precipitation in southwest China is more abundant, and when the monsoon surge is weak, the summer precipitation in southwest China tends to be normal or less. However, the areas where the monsoon surge has a significant impact on the summer precipitation in southwest China are mainly located east of 105° E, and have little effect on the areas west of 105° E. This is not only spatially distinct from the positive correlation of precipitation in the middle and lower reaches of the Yangtze River, but also corresponds to the theory that the interface between the East Asian summer monsoon and the South Asian summer monsoon is located near 105° E. In addition, in strong (weak) monsoon surge years, 30–60 days (10–20 days) periodic oscillations play a dominant role. East Asia has a meridional wave train of “+ − +” (“− + −”), and the position of the western Pacific subtropical high is westward (eastward). When affected by the South China Sea–West Pacific anticyclone (cyclone), the EASM is active (suppressed). The water vapor in the eastern part of southwest China converges (diversifies), and the airflow rises (sinks), resulting in more (less) precipitation. In terms of the relationship between the internal oscillation of the East Asian summer monsoon season and the summer precipitation in southwest China, we chose 1998 as a typical case for discussion and concluded that the 30–60 days ISO of the EASM may be an important reason for the high summer precipitation in southwest China that year. In this year, the EASM had two obvious 30–60 days ISO cycles. In the first cycle, the amplitude of the ISO of the EASM was relatively large. When the intensity of the monsoon increases (weakens), the precipitation in southwest China increases (decreases). However, the amplitude of the second cycle was small, the intensity of the ISO of the EASM was weak, and the correlation between the EASM and the precipitation in southwest China was weakened. The atmospheric circulation characteristics of the same period showed that, as the position of the western Pacific subtropical high was west to south, China and the western Pacific were affected by the anticyclonic circulation, and the intensity of the ISO of the EASM was stronger, which led to a significant increase in precipitation in southwest China. In this study, we have some new insights into the link between East Asian summer monsoon activity and summer precipitation in southwest China. However, we only discuss the influence of the ISO of the EASM on precipitation from the perspective of atmospheric circulation background. The dynamic and thermodynamic effects of ISO should be further studied to gain a deeper understanding of the variation characteristics and the physical mechanisms involved in the ISO of the EASM in affecting precipitation. In addition, the study period was relatively short due to the small number of precipitation observations.

Author Contributions

Conceptualization, Y.W. and T.X.; methodology, X.D.; software, Y.W. and X.D.; validation, X.D. and Y.L.; formal analysis, T.X.; investigation, W.H.; resources, T.X.; data curation, X.D.; writing—original draft preparation, Y.W.; writing—review and editing, Y.W., T.X. and J.T.; visualization, X.D.; supervision, T.X.; project administration, T.X. and W.H.; funding acquisition, T.X. All authors have read and agreed to the published version of the manuscript.

Funding

This research was funded by the Second Tibetan Plateau Comprehensive Scientific Research Project OF FUNDER, grant number 2019QZKK010408; Key R & D projects in Sichuan Province (in China), grant number: 22ZDYF0826; Key R & D Program for Social Development in Yunnan Provincial (in China), grant number: 202203AC100005-3.

Data Availability Statement

Publicly available datasets were analyzed in this study. The NCEP/NCAR I data is available at https://psl.noaa.gov/data/gridded/data.ncep.reanalysis.html.

Conflicts of Interest

The authors declare no conflict of interest.

References

  1. Madden, R.A.; Julian, P.R. Detection of a 40–50 day oscillation in the zonal wind in the tropica1 Pacific. J. Atmos. Sci. 1971, 28, 702–708. [Google Scholar] [CrossRef]
  2. Madden, R.A.; Julian, P.R. Description of globe-scale circulation cells in the tropics with a 40–50 day period. J. Atmos. Sci. 1972, 29, 1109–1123. [Google Scholar] [CrossRef]
  3. Li, C.Y.; Long, Z.X.; Mu, M.Q. Atmospheric intraseasonal oscillation and its important effect. Chin. J. Atmos. Sci. 2003, 27, 518–535. (In Chinese) [Google Scholar]
  4. Ju, J.H.; Qian, C.; Cao, J. The intraseasonal oscillation of East Asian summer monsoon. Chin. J. Atmos. Sci. 2005, 29, 187–194. (In Chinese) [Google Scholar]
  5. Lee, J.Y.; Wang, B.; Wheeler, M.C.; Fu, X.; Waliser, D.E.; Kang, I.-S. Real-time multivariate indices for the boreal summer intraseasonal oscillation over the Asian summer monsoon region. Clim. Dyn. 2012, 40, 493–509. [Google Scholar] [CrossRef]
  6. Krishnamurthy, V. Intraseasonal oscillations in East Asian and South Asian monsoons. Clim. Dyn. 2018, 51, 4185–4205. [Google Scholar] [CrossRef]
  7. Li, J.Y.; Mao, J.Y. Impact of the boreal summer 30–60-day intraseasonal oscillation over the Asian summer monsoon region on persistent extreme rainfall over eastern China. Chin. J. Atmos. Sci. 2019, 43, 796–812. (In Chinese) [Google Scholar] [CrossRef]
  8. Lawrence, D.M.; Webster, P.J. The boreal summer intraseasonal oscillation: Relationship between northward and eastward movement of convection. J. Atmos. Sci. 2002, 59, 1593–1606. [Google Scholar] [CrossRef]
  9. Zhu, C.W.; Nakazawa, T.; Li, J.P.; Chen, L. The 30–60-day intraseasonal oscillation over the western North Pacific Ocean and its impacts on summer flooding in China during 1998. Geophys. Res. Lett. 2003, 30, 1952. [Google Scholar] [CrossRef]
  10. Zhou, W.; Johnny, C.; Chan, L. Intraseasonal oscillations and the South China Sea summer monsoon onset. Int. J. Climatol. 2005, 25, 1585–1609. [Google Scholar] [CrossRef]
  11. Ju, J.H.; Zhao, E.X. Impacts of the low frequency oscillation on East Asian summer monsoon on the drought and flooding in the middle and lower valley of the Yangtza River. J. Trop. Meteorol. 2005, 21, 163–171. (In Chinese) [Google Scholar]
  12. Hong, J.L.; Ke, Z.J.; Yuan, Y.; Shao, X. Boreal Summer Intraseasonal Oscillation and Its Possible Impact on Precipitation over Southern China in 2019. J. Meteorol. Res. 2021, 35, 571–582. [Google Scholar] [CrossRef]
  13. Lau, K.M.; Yang, G.J.; Shen, S.H. Seasonal and intraseasonal climatology of summer monsoon rainfall over East Asia. Mon. Weather. Rev. 1988, 116, 18–37. [Google Scholar] [CrossRef]
  14. Miao, J.H.; Lau, K.M. Low frequency oscillation (30–60 day) of summer monsoon rainfall over East Asia. Sci. Atmos. Sin. 1991, 15, 65–71. (In Chinese) [Google Scholar]
  15. Sun, D.; Ju, J.H.; Lv, J.M. The influence of the intraseasonal oscillation of the East Asian monsoon on the precipitation in East China in 2003. J. Trop. Meteorol. 2008, 24, 641–648. (In Chinese) [Google Scholar]
  16. Sun, Y.; Ding, Y.H. Effects of Intraseasonal Oscillation on the Anomalous East Asian Summer Monsoon during 1999. Adv. Atmos. Sci. 2008, 25, 279–296. [Google Scholar]
  17. Liang, P.; Ding, Y.H. Climatologic characteristics of the intraseasonal oscillation of East Asian meiyu. Acta Meteorol. Sin. 2012, 70, 418–435. (In Chinese) [Google Scholar]
  18. Li, W.K.; He, J.H.; Qi, L.; Chen, B.M. The influence of the Madden-Julian Oscillation on annually first rain season precipitation in south China and its possible mechanism. J. Trop. Meteorol. 2014, 20, 983–989. [Google Scholar]
  19. Liu, G.; Wu, R.G.; Wang, H.M. Contribution of intraseasonal oscillation to long-duration summer precipitation events over southern China. Atmos. Ocean. Sci. Lett. 2016, 10, 82–88. [Google Scholar] [CrossRef]
  20. Zhu, Q.G.; Yang, S. The northward advance and oscillation of the East-Asian summer monsoon. J. Nanjing Inst. Meteorol. 1989, 12, 249–258. (In Chinese) [Google Scholar]
  21. Zhang, Q.Y.; Tao, S.Y.; Zhang, S.L. The Persistent heavy rainfall over the Yangtze River valley and its associations with the circulations over East Asian during summer. Chin. J. Atmos. Sci. 2003, 27, 1018–1030. (In Chinese) [Google Scholar]
  22. Li, B.Y.; Pan, B.T.; Han, J.F. Basic terrestrial geomorphological types in China and their circum scriptions. Quathernary Sci. 2008, 9, 535–543. (In Chinese) [Google Scholar]
  23. Cao, J.; Hu, J.; Tao, Y. An index for the interface between the Indian summer monsoon and the East Asian summer monsoon. J. Geophys. Res. 2012, 117, D18108. [Google Scholar] [CrossRef]
  24. Mckee, T.B.; Doesken, N.J.; Kleist, J. The relationship of drought frequency and duration totime scales. In Proceedings of the 8th Conference on Applied Climatology, Anaheim, CA, USA, 17–22 January 1993; American Meteorological Society: Boston, MA, USA, 1993; pp. 179–184. [Google Scholar]
  25. Singo, J.M. Intraseasonal oscillation in 15 atmospheric general circulation models: Results from an AMIP diagnostic subproject. Clim. Dyn. 1996, 12, 325–357. [Google Scholar] [CrossRef]
  26. Krishnamurthy, V.; Shukla, J. Intraseasonal and interannual variability of rainfall over India. J. Clim. 2000, 13, 4366–4377. [Google Scholar] [CrossRef]
  27. Ren, X.J.; Yang, D.J.; Yang, X.Q. Characteristics and mechanisms of the subseasonal eastward extension of the South Asian high. J. Clim. 2015, 28, 6799–6822. [Google Scholar] [CrossRef]
  28. Yao, J.X.; Wang, P.X.; Li, L.P. Performance contrast between two filters in Madden Julian oscillations analysis. J. Nanjing Inst. Meteorol. 2005, 28, 248–253. (In Chinese) [Google Scholar]
  29. Wang, B.; Steven, C.C.; Liu, P. Contrasting the Indian and East Asian monsoons: Implications on geologic timescales. Mar. Geol. 2003, 201, 5–21. [Google Scholar] [CrossRef]
Figure 1. Location of the precipitation gauges in southwestern China, the data of which were used for the analysis. We select a monsoon index named the East Asian monsoon index (IM), which defines the day-by-day East Asian summer monsoon intensity [4]. Combined with kinetic and thermodynamic factors, this index links the different activity characteristics of the EASM in East Asian subtropical and tropical regions well, which can well reflect the physical nature of the EASM, and its expression is as follows:
Atmosphere 13 01222 g001
Figure 2. Wavelet spectrum of EASM index sequences from 1979–2019 (the abscissa is time and the ordinate is period (day), grid area passes 95% significance test).
Atmosphere 13 01222 g002
Figure 3. Wavelet spectra of EASM index sequences (the abscissa is June-August and the ordinate is period (day), grid area passes 95% significance test). (a): 2010; (b): 1997.
Atmosphere 13 01222 g003
Figure 4. Explained variances of 10–20 days and 30–60 days ISO of EASM in 1979–2019 (the ordinate is explained variance (%) and the abscissa is year).
Atmosphere 13 01222 g004
Figure 5. Histogram of East Asian subtropical monsoon surge index in 1979–2019 ((the ordinate is the normalized value of the East Asian subtropical monsoon surge index).
Atmosphere 13 01222 g005
Figure 6. Sequences of both the East Asian subtropical monsoon surge intensity and the standardized index of summer precipitation in southwest China, for the period 1979–2019.
Atmosphere 13 01222 g006
Figure 7. Spatial distribution of precipitation anomalies over southeast China under strong (a) and weak (b) monsoon surges. (Unit: millimeters, mm; dotted area passes 95% significance test).
Atmosphere 13 01222 g007
Figure 8. Time-longitude profile of OLR along 105° to 130° E (a) strong monsoon surge years (b) weak monsoon surge years.
Atmosphere 13 01222 g008
Figure 9. Spatial distribution of precipitation anomalies over southeast China during 1998. (Unit: millimeters, mm).
Atmosphere 13 01222 g009
Figure 10. Evolution of precipitation anomalies (colored bars: red-positive, blue-negative) over southwestern China during 1998, and filtering curve (line).
Atmosphere 13 01222 g010
Figure 11. Time-longitude profile of OLR along 105° to 130° E in 1998.
Atmosphere 13 01222 g011
Figure 12. The 30–60 days ISO of the EASM cycles and phases in 1998. (Abscissa represents June August, ordinate represents the ISO oscillation intensity of 30–60 days.).
Atmosphere 13 01222 g012
Figure 13. Abnormal precipitation in southwest China for 30–60 days ISO of the EASM in 1998. (Unit: mm·d−1; (af) means the phases 1–6 of the first cycle; (gl) means the phases 1–6 of the second cycle).
Atmosphere 13 01222 g013
Figure 14. Anomalies of 500 hPa resultant height field in summer of strong and weak East Asian subtropical monsoon surge years. (Unit: dagpm; shadow area passes 95% significance test; area in red box is southwest China.) (a): Strong years; (b): weak years.
Atmosphere 13 01222 g014
Figure 15. Anomalies of 850 hPa resultant wind field in summer of strong and weak East Asian subtropical monsoon surge years. (Unit: m·s−1; shadow area passes 95% significance test; area in red box is southwest China.) (a): Strong years; (b): weak years.
Atmosphere 13 01222 g015
Figure 16. Whole-layer water vapor flux integral and its divergence anomaly in summer of strong and weak East Asian subtropical monsoon surge years. (Unit of water vapor flux integral: kg·m−1·s−1; divergence unit: 10−6·Kg·m−2·s−1; area in red box is southwest China.) (a): Strong years; (b): weak years.
Atmosphere 13 01222 g016
Figure 17. Anomalies of 700 hPa resultant vertical speed in summer of strong and weak East Asian subtropical monsoon surge years. (Unit: m·s−1; grid area passes 95% significance test; area in red box is southwest China.) (a): Strong years; (b): weak years.
Atmosphere 13 01222 g017
Figure 18. Homochronous 500 hPa height field in the first cycle of the 30–60 days ISO in 1998. (Unit: dagpm; (af) means phases 1–6; area in red box is southwest China).
Atmosphere 13 01222 g018
Figure 19. Homochronous 850 hPa wind field in the first cycle of the 30–60 days ISO in 1998. (Unit: m·s−1; (af) means phases 1–6; area in red box is southwest China).
Atmosphere 13 01222 g019
Figure 20. Homochronous whole-layer water vapor flux integral and water vapor divergence in the first cycle of 30–60 days ISO in 1998. (Unit of water vapor flux integral: kg·m−1·s−1; unit of divergence: 10−6·Kg·m−2·s; (af) means phases 1–6; area in red box is southwest China).
Atmosphere 13 01222 g020
Figure 21. Homochromous 500 hPa height field in the second cycle of 30–60 days ISO in 1998. (Unit: dagpm; (af) means phases 1–6; area in red box is southwest China).
Atmosphere 13 01222 g021
Figure 22. Homochronous 850 hPa wind field and 700 hpa vertical speed field in the second cycle of 30–60 days ISO in 1998. (Unit: m·s−1; (af) means phases 1–6; area in red box is southwest China).
Atmosphere 13 01222 g022aAtmosphere 13 01222 g022b
Figure 23. Homochromous whole-layer water vapor flux integral and water vapor divergence in the second cycle of 30–60 days ISO in 1998. (Unit of water vapor flux integral: kg·m−1·s−1; unit of divergence: 10−6·Kg·m−2·s; (af) means phases 1–6; area in red box is southwest China).
Atmosphere 13 01222 g023
Table 1. Typical years of two types of ISO of EASM in 1979–2019.
CycleTypical Years
10–20 d1981, 1984, 1986, 1987, 1990, 1991, 1993, 2004, 2009, 2010, 2015, 2016
30–60 d1980, 1983, 1985, 1988, 1994, 1995, 1997, 1998, 2006, 2007, 2014, 2017, 2019
Table 2. Years with strong and weak East Asian subtropical monsoon surges.
Intensity of the SurgesYears
Strong1999, 1998, 1993, 1995, 1980
Weak1985, 1981, 2018, 1986, 2004
Publisher’s Note: MDPI stays neutral with regard to jurisdictional claims in published maps and institutional affiliations.

