Article

Has COVID-19 Altered the Air Quality Conduction Relationship in Beijing and Neighboring Cities?—A Test Based on Dynamic Periodic Conformance

1
Business School, Lishui University, Lishui 323000, China
2
Lishui Ecological Economic Institute, Lishui 323000, China
3
School of Economics and Management, Shihezi University, Shihezi 832000, China
*
Authors to whom correspondence should be addressed.
Atmosphere 2022, 13(8), 1188; https://doi.org/10.3390/atmos13081188
Submission received: 30 June 2022 / Revised: 21 July 2022 / Accepted: 25 July 2022 / Published: 27 July 2022
(This article belongs to the Special Issue Air Pollution in China (2nd Edition))

Abstract

:
The Beijing–Tianjin–Hebei region is the most dynamic region and largest economy in northern China; however, the air quality is the worst in the country. The study of the air quality in the cities around Beijing is of great significance for air pollution control. Therefore, this study analyzed whether the COVID-19 pandemic altered the periodic pattern of the air quality in Beijing and its neighboring cities. The study employed continuous wavelet transform to examine the impact of the COVID-19 pandemic on the air quality of Beijing and its neighboring cities. This method reveals the changes in the air quality from a periodic pattern perspective. The results showed that COVID-19 weakened the periodic changes in air quality in Beijing and five neighboring cities, and this effect was most pronounced during the outbreak of the pandemic in early 2020. The cycle synchronization analysis showed that the pandemic weakened the cycle synchronization of air quality of the cities in the north of Beijing, while less impact was found on the cities to the south of Beijing. Moreover, the periodic patterns in 2020 and 2021 were compared with that in 2019 (before the outbreak of the pandemic), and it was found that the periodic patterns during the outbreak of the pandemic in 2020 and 2021 were significantly different from that in the same period in 2019. Therefore, COVID-19 weakened the periodic pattern of air quality in the cities around Beijing and altered the connection to air quality among them. The changes reveal the connections of inter-city air pollutants caused by human economic and social activities in cities around Beijing.

1. Introduction

The Beijing–Tianjin–Hebei urban agglomeration is one of the most economically developed regions in China, but it suffers from frequent extreme air pollution events, making it one of the most air-polluted regions in China [1,2,3]. In recent years, air pollution has become a key factor limiting economic development and threatening public health in this region. Before the 2008 Summer Olympic Games and 2022 Winter Olympic Games, the Chinese government implemented a series of air-pollution control measures, such as the transfer of polluting industries and the joint prevention and control of air pollution, to reduce the emission and diffusion of contaminants. In 2019, the COVID-19 outbreak quickly swept the world [4]. This is the third pandemic due to the emergence of a novel virus in the past twenty years, after the 2003 SARS and 2012 MERS pandemics [5]. In the face of the sudden attack of COVID-19, the Chinese government imposed strict public health containment measures, including lockdowns, social distancing, school and business closures, home confinement, and travel bans [6]. These measures greatly affected human activities and economic production, which inevitably led to changes in the anthropogenic air pollutant emissions and, accordingly, to the air quality of the cities in the Beijing–Tianjin–Hebei urban agglomeration. In this sense, the outbreak of COVID-19 provides a quasi-experimental condition for the test of whether a reduction in economic activities can change the connections of air pollution in different cities [7]. Considering this, many studies have analyzed the impact of COVID-19 on the air quality relationship between the cities in the Beijing–Tianjin–Hebei urban agglomeration, but no agreement has been reached [8]. To address the issue, this study aimed to determine whether the COVID-19 pandemic altered the periodic pattern of the air quality between Beijing and its neighboring cities from a dynamic periodic change perspective.
Many countries have implemented traffic and production controls to inhibit the spread of COVID-19, meanwhile scholars have conducted in-depth research on the influences of this extreme external event on human activities and the environment. Some argued that the control measures improved the urban air quality to a large extent. For example, Rudke et al. (2022) compared air pollutant concentrations during the period of movement restrictions (2020) with those before the restrictions (2015–2019) and found that air pollutant concentrations decreased significantly during the first 30 days of the restrictions, with large urban centers (with a large number of vehicles) having the most significant NO2 reductions [9]. Lian et al. (2020) found that the air quality index (AQI) of Wuhan in China was 59.7 during the city lockdown, 33.9% lower than that before the lockdown [10]. Based on the analysis of the satellite and ground-based remote sensing data, Le et al. (2020) found that China’s epidemic control measures led to a 90% drop in pollutant concentration [11]. Tobías et al. (2020) investigated the changes in air quality during the lockdown in Barcelona one month into the COVID-19 pandemic, and found that after a two-week lockdown, the urban air pollution markedly decreased but with substantial differences among pollutants [12]. Shrestha et al. (2020) investigated changes in concentrations of six air pollutants in 40 cities between February and March in 2019 and 2020, and found that in most cities, the monthly average concentrations of PM2.5 and PM10 in February and March in 2020 were consistently lower than that in 2019. After the lockdown, 19, 9, 8, and 7 cities witnessed a reduction in the concentration of NO2, CO, PM2.5, and PM10, respectively [13]. Using satellite data and a network of >10,000 air quality stations in 34 countries, Venter et al. (2020) analyzed the impact of COVID-19 lockdown on the tropospheric and ground-level air pollutant concentrations and found that the concentration of NO2 and PM2.5 decreased by 60% and 31%, respectively, while the concentration of O3 increased by 4% [14]. Othman et al. (2021) investigated the changes in concentrations of air pollutants in nine major cities of Malaysia before and during the implementation of pandemic control measures, and an average reduction of 40% was observed in NO2 [15].
On the other hand, some studies suggest that although the epidemic control measures contribute to the improvement of air quality, their effects are limited. Almond et al. (2020) employed differences in differences (DID) and difference in difference in difference (DDD) to investigate the changes in the air quality of Hubei and its neighboring provinces before and during the pandemic. Their results showed that air quality improved during the pandemic, but the improvement was smaller than expected, where the reduction in SO2 concentration was unobvious and the concentration of O3 increased [16]. Zhao et al. (2021) analyzed the AQI and six major contaminants of the Beijing–Tianjin–Hebei region with mathematical statistics and spatial analysis method, and found that the concentrations of all pollutants except O3 dropped in the initial period of the lockdown but rebounded with the resumption of work and production in later periods [17]. Moreover, the epidemic prevention and control measures brought about a spillover effect in air quality. Zaręba et al. (2022) reported that during the COVID-19 pandemic, air pollutants from solid fuels may migrate from neighboring cities to Krakow [18]. He et al. (2021) evaluated the short-term impacts of COVID-19 lockdown on urban air pollution in China and found that due to the spatial spillover effect in air quality, the air quality in cities without a formal lockdown also improved. Moreover, the lockdown effects were larger in colder, richer, and more industrialized cities [19].
It can be inferred from existing studies that the traffic and production control measures not only suppressed the spread of the COVID-19 epidemic but also generated environmental benefits to residents in the lockdown cities [16,19]. As environmental improvement from lockdown generates a significant spillover effect, it can inferred that the environmental improvement due to COVID-19 lockdown policies is a global-scale improvement. However, previous studies only considered the spillover effect in the short term but did not provide explanations for the impacts of the pandemic on the air quality of neighboring cities. Since the outbreak of COVID-19, Beijing and neighboring cities have experienced epidemic several times, and business closures, production shutdowns, and cutoffs in inter-city connections occurred as a result of the strict control measures, which provides a quasi-experimental condition for the judgement of the connections among the air quality of these cities. Therefore, based on the daily air quality and meteorological data of Beijing and neighboring cities from 1 January 2019 to 31 December 2021, this study examined whether the pandemic altered the connections among the air quality of Beijing and neighboring cities so as to provide reference for scientific prevention and control of air pollution in this region.

2. Methodology and Data
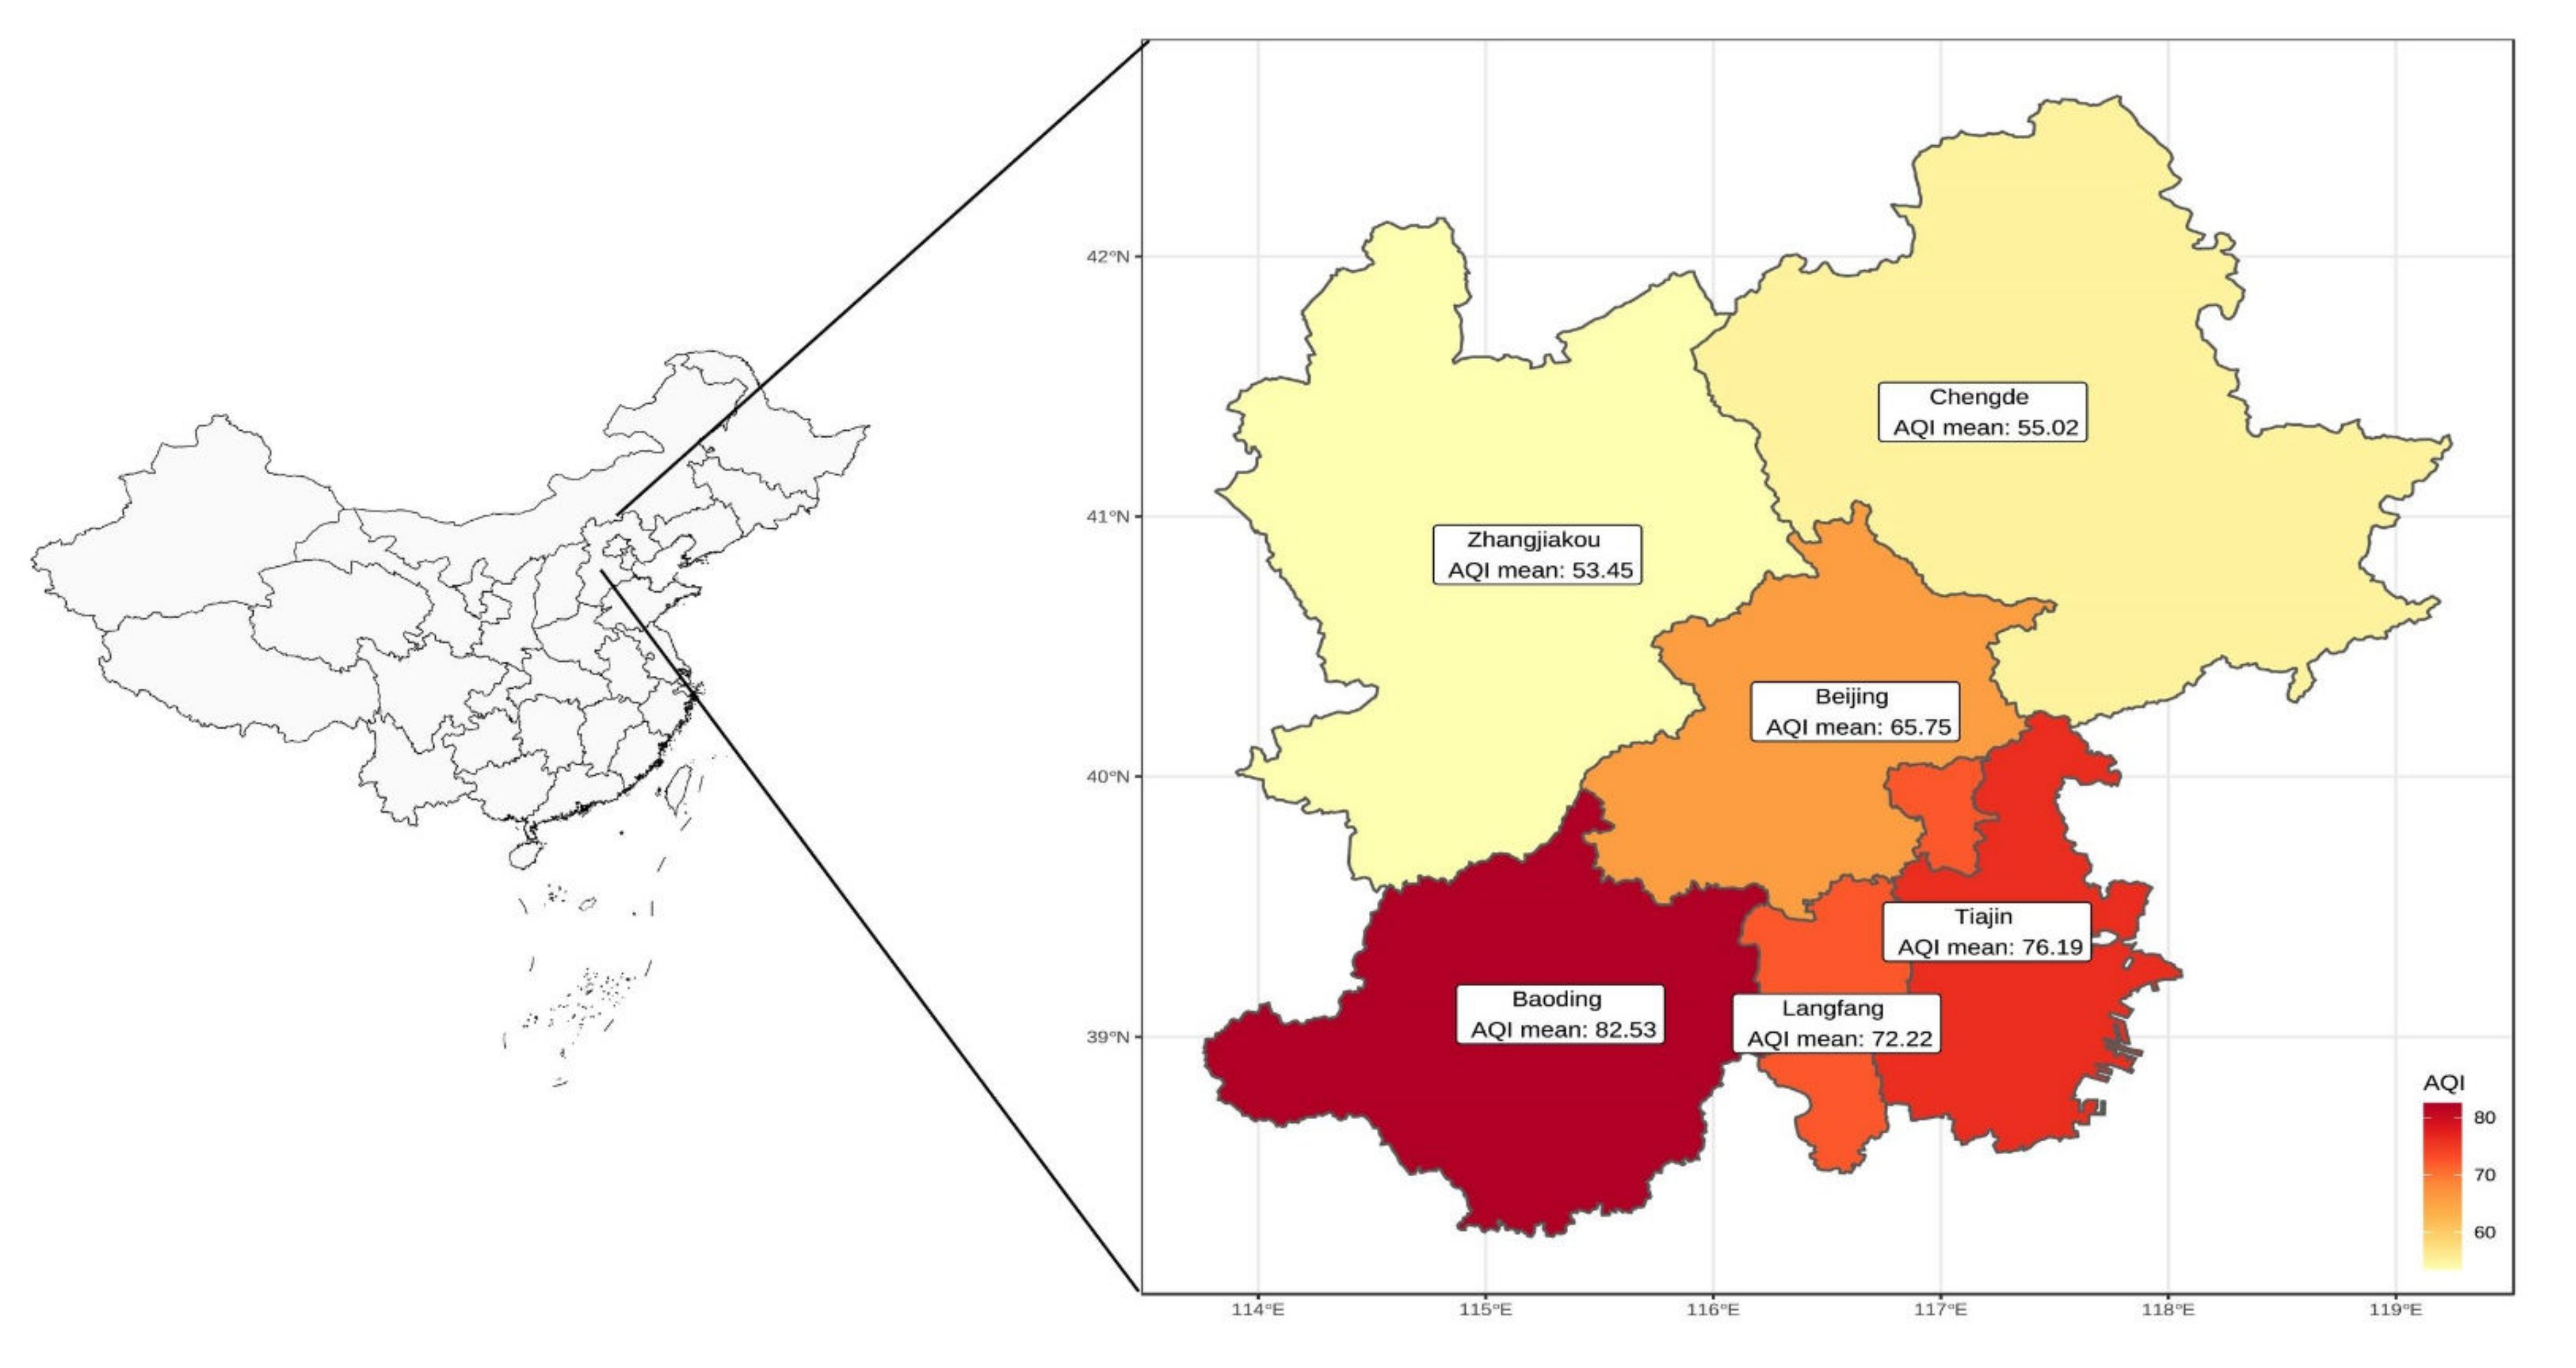
2.1. Data

The Air Quality Index (AQI) has been widely applied to measure air quality and is used as a major index in the studies on the connections among the air quality of different cities [20]. The calculation method of AQI is shown in Appendix A. According to the Chinese Ambient Air Quality Standard (GB3095-2012), AQI is calculated as a dimensionless index based on six air pollutants—SO2, PM10, PM2.5, CO, NO2, and O3 [10,21,22]. Air quality can be divided into six levels according to the AQI value: Grade I: excellent (0~50), grade II: good (51~100), grade III: mild pollution (101~150), grade IV: moderate pollution (151~200), grade V: severe pollution (201~300), and grade VI: severe pollution (>300) [23]. In this study, daily AQI data (1 January 2019~31 December 2020) of Beijing, Tianjin, Baoding, Chengde, Langfang, and Zhangjiakou were obtained from the Integrated Data Acquisition and Sharing Platform for Atmospheric Environment Science (http://106.38.83.12:9002/ahpcp/login/index.html, accessed on 5 February,2022) (see Figure 1). As the year of 2020 was a leap year, the data for 29 February 2020 were removed from the dataset for the conduction of dynamic time warping analysis. Figure 1 describes the AQI of Beijing and its neighboring cities from 1 January 2019 to 31 December 2020 (http://www.cnemc.cn/, accessed on 20 January 2022). The average AQI of Beijing during the study period was 65.75. The average AQI values of upwind cities including Zhangjiakou (53.45) and Chengde (55.02) were lower than that of Beijing, while the average AQI values of the downwind cities including Tianjin (76.19), Baoding (82.53), and Langfang (72.22) were higher than that of Beijing (See Appendix B Table A1).
The AQI variation before and after the outbreak of COVID-19 epidemic was determined in this study (see Figure 2). The AQI values of all cities were higher in 2019 than in 2020 and 2021, where the average AQI of the cities in 2019 was 69.37 and those in 2020 and 2021 were 66.88 and 65.36, respectively (see Appendix B Table A1). Moreover, the AQI values decreased the most in 2020 when COVID-19 broke out, but increased in 2021. In 2020, the AQI of all the six cities decreased and the average decrease was 6.56, where the largest decrease presented in Baoding (11.81). Moreover, it can be seen from Figure 2 that the AQIs of the six cities present obvious relevance, where an apparent synchronization pattern is observed in the AQI increasing periods but not in the AQI decreasing periods. The AQI of all the six cities presented a similar increasing trend in the beginning of 2020 and 2021 with a generally consistent increase extent (shown as blue in Figure 2). Although AQI decreases (shown as orange in Figure 2) occurred in a relatively consistent time period for all the cities, the decrease pattern and extent varied significantly among the cities, where the largest decreases were shown in Langfang and the smallest decreases were shown in Zhangjiakou. The possible explanation may be that the Chinese government took various control measures to fight the COVID-19 epidemic, which then reduced the urban activities and pollutant emissions, thus forcing the AQI to drop. From the perspective of the relationship of the AQI of the six cities, Beijing and its neighboring cities had a strong positive correlation (Figure 2). It manifests that there is a certain law in the pollutant diffusion, and the change in economic activities may lead to a change in the diffusion pattern of air pollutants among the cities.
Figure 3 depicts the variation in the reported infectious cases in Beijing during 1 January 2019~31 December 2020 (https://news.qq.com/zt2020/page/feiyan.htm#/, accessed on 20 January 2022). The worst-hit period by COVID-19 epidemic appeared in 23 January 2020~16 April 2020 and 11 June 2020~5 July 2020. Thereafter, the epidemic reoccurred in 25 December 2020~6 February 2021 and in July 2021. Since the Beijing–Tianjin–Hebei region implemented the collective epidemic prevention and control policy, strict control measures including business closures, production shutdown, and a city lockdown were enforced in cities around Beijing when the epidemic grew in Beijing. Therefore, the connections among the air quality of Beijing and its neighboring cities may change during severe epidemic periods. This study thereby focuses on the investigation of the connections among the air quality of the cities during such periods (Appendix C, Figure A1).

2.2. Methodology

The outbreak of COVID-19 and the epidemic prevention and control policies adopted by the Chinese government may change the connections among the air quality of Beijing and its neighboring cities. The Beijing–Tianjin–Hebei region is the most air-polluted region in China [24], and severe air pollution affects the health of the region’s residents [25]. However, urban air quality is not only determined by the city’s own pollution level but also influenced by that of neighboring cities [3,26], so the connections among the air quality of Beijing and its neighboring cities has become a major concern. The outbreak of COVID-19 creates an opportunity for such study. If COVID-19 changes the connections among the air quality of Beijing and its neighboring cities, it suggests that the diffusion of urban air pollutants can be reduced through reasonable air pollution prevention and control policies. The epidemic prevention and control policies adopted by the Chinese government has triggered a reduction in the inter-city association of economic and social activities [27] and weakened the connections among the air quality of Beijing and its neighboring cities [8]. The impact of COVID-19 on the connections among the air quality of different cities has been analyzed before. However, these studies focus more on the short-term effects of COVID-19 but ignore the long-term effects. In addition, urban air quality is affected by meteorological conditions and economic activities, showing periodic changes, and the periodic change characteristics can better reflect the law of urban air quality change. Therefore, in this study, whether COVID-19 changed the connections among the air quality of Beijing and neighboring cities was first examined from a dynamic perspective, and then whether COVID-19 changed the law of the air quality periodicities of cities was examined from the perspective of periodic conformance.
In this study, the continuous wavelet transform method and dynamic time warping (DTW) method were used to analyze the connections among the air quality of Beijing and its neighboring cities. Continuous wavelet transform analysis can identify the dynamic change and the dynamic conformance of the periodicities. Therefore, this method can accurately identify whether the periodic change is triggered during the COVID-19 outbreak. Based on the wavelet transform analysis, the DTW method was used to determine whether the change in phase difference at a specific frequency was consistent with that before the outbreak.

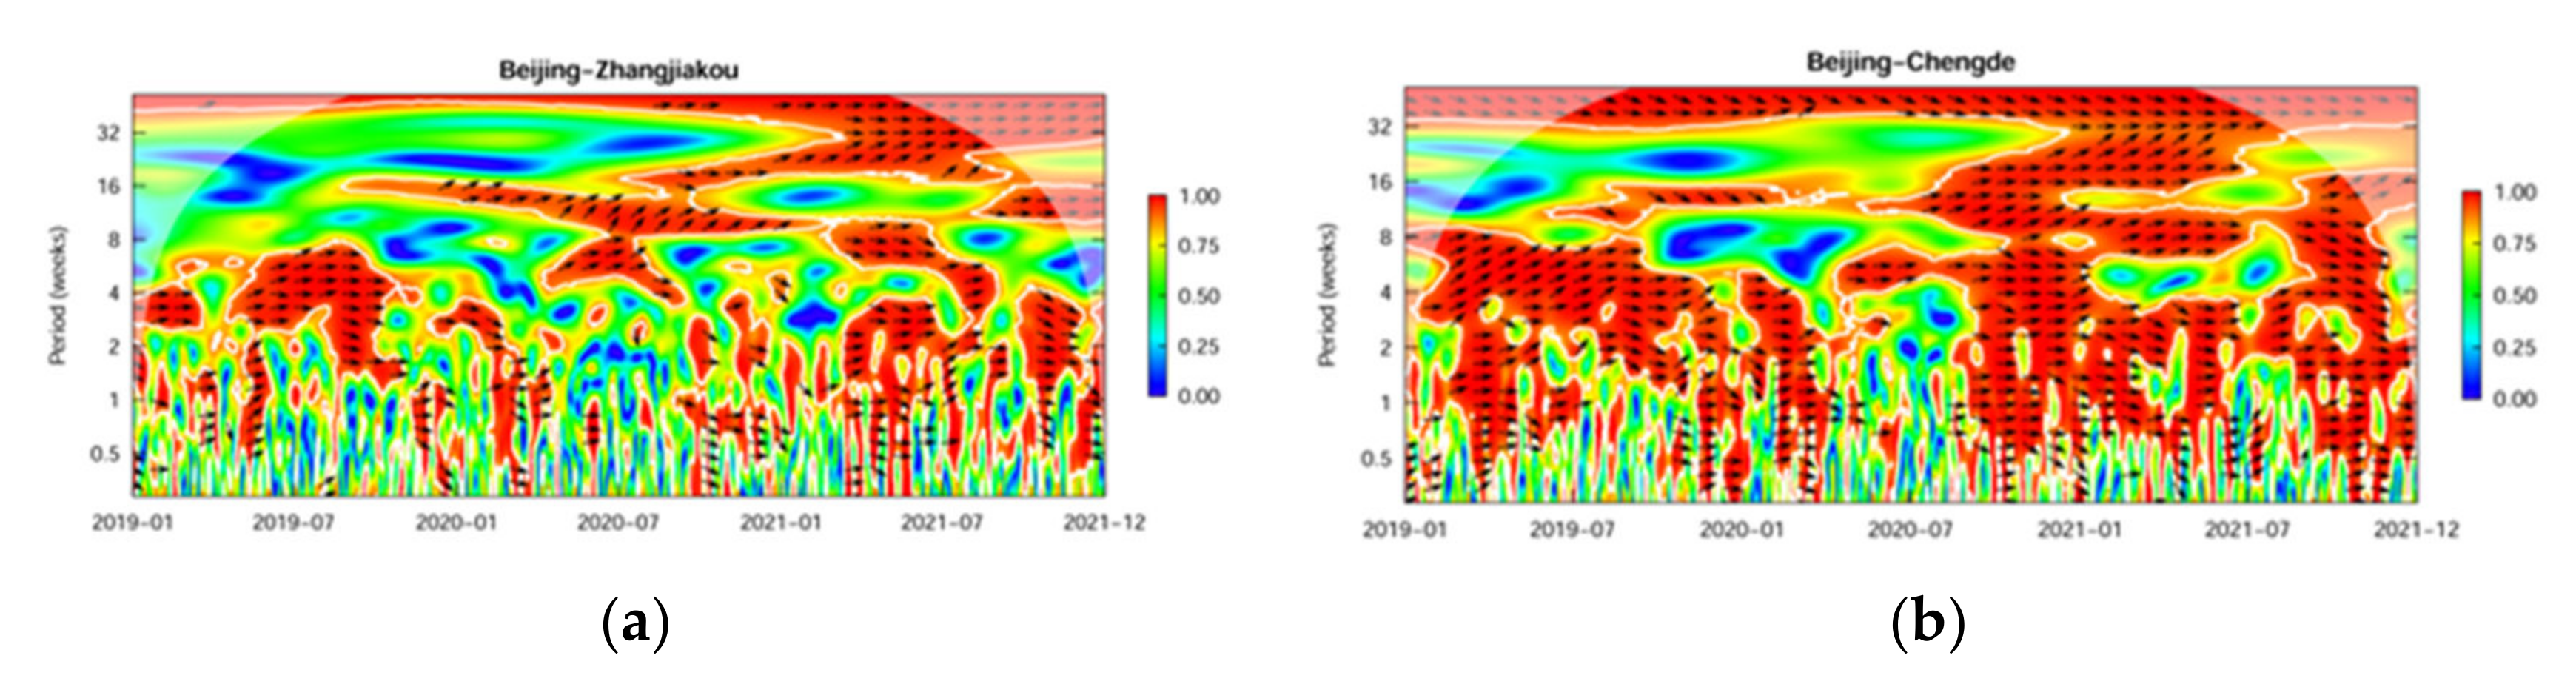
2.2.1. Wavelet Analysis

In previous studies, it was common to utilize Fourier analysis and autoregressive moving average (ARMA) models to investigate periodicity. However, both approaches assume periodicity as time invariant, and the time information is completely lost in Fourier analysis. Thus, these approaches fail to detect transient and irregular periodicities and structural changes. Unfortunately, the time series are often strongly non-stationary and sensitive to external shocks. Wavelet analysis, a time-frequency approach, estimates the spectral characteristics of a time series as a function of time, revealing how the different periodic components of a particular time series evolve over time [28]. As a result, wavelet analysis can be used to address the limitations shared by Fourier analysis and ARMA models in the detection of changes in the periodicity, while meeting rigorous standards of statistical inference. Therefore, wavelet analysis, proposed by Aguiar-Conraria and Soares [28], was employed in this study to explore the impacts of COVID-19 on AQI. Different from Fourier transform, which breaks down a time series into constituent sinusoids of different frequencies and infinite duration in time, the wavelet transform expands time series into shifted and scaled versions of a function that has a limited spectral band and limited duration in time. A wavelet function has a zero mean and satisfies a decaying property, which means that the function oscillates and drops to zero. It is this property that enables an effective localization in both time and frequency.
Given a time series xt, its continuous wavelet transform, with respect to the wavelet φ, is a function of two variables:
W x ( τ , s ) = x t 1 s φ ¯ t τ s   d t
where bar denotes complex conjugation, τ is a location parameter that controls the position of the wavelet, and s is a scaling factor that controls the length of the wavelet. An inverse relation exists between wavelet scales and frequencies (f), namely f ≈ 1/s. The wavelet function φ employed in this study is Gabor wavelet.
The development of the wavelet tools is based on the methods proposed by Aguiar-Conraria and Soares [28]. The wavelet power spectrum, which provides a measure of the relative importance of frequencies over time, is defined as:
W P S x ( τ , s ) = W x ( τ , s ) 2
Wavelet coherency and wavelet phase-difference are used to investigate time-frequency dependencies between two time series, and both of their computations are based on cross-wavelet power, which depicts the local covariance between two time series at each time and frequency. The cross-wavelet transform of two series, xt and yt, is defined as:
W x y ( τ , s ) = W x ( τ , s ) W y ¯ ( τ , s )
where Wx and Wy are the wavelet transforms of xt and yt, respectively. The cross-wavelet power is the absolute value of Wxy.
The wavelet coherency measures the correlation between two time series in time-frequency domain and is defined as:
R x y ( τ , s ) = S W x y ( τ , s ) S W x ( τ , s ) 2 S W y ( τ , s ) 2
where S denotes a smoothing operator in both time and scale.
Wavelet coherency has the advantage of being normalized by the power spectrum of the two time-series, which typically ranges from 0 to 1, indicating a weaker to higher co-movement. To make statistical inferences, Monte Carlo simulations were performed to obtain the critical values of Rxy.
The wavelet phase-difference provides information about the possible decays in the oscillations of two times series and the lead/lag relationship between the two series. The phase difference was computed from the cross-wavelet transform:
δ x y ( τ , s ) = arctan W x y ( τ , s ) W x y ( τ , s )
The phase difference varies within −π and π. A phase difference of zero indicates that the series move together at the specified frequency; if δxy∈[0, π/2], then the series move in phase with y leading x; if δxy∈[−π/2, 0], then the series move in phase with x leading y; a phase difference of π/π indicates an anti-phase relation; if δxy∈[π/2, π], then x is leading; if δxy∈[−π, −π/2], then y is leading.

2.2.2. Dynamic Time Warping

DTW is a nonlinear regularization technique combining time regularization and spacing measurement calculation. This method can compare the degree of similarity between two time series [29]. Therefore, it is suitable for comparing the consistency of the difference before and after the COVID-19 outbreak, to verify whether COVID-19 changed the connections among the air quality of Beijing and its neighboring cities.
The essence of DTW is to apply the idea of dynamic programming to automatically find a path (i.e., time bending function) by local optimization [30,31]. If the distance between two feature vectors along this path is the smallest, then the similarity is the largest. Assuming that the given continuous time series X = (x1, x2,,xn) and Y = (y1,y2,,ym), the function d(i, j) = f(xi, yi) ≥ 0 is the point-to-point distance function in the time series. The distance matrix D of X and Y is generally constructed using the Euclidean distance formula. Based on the constructed distance matrix D, a path from the upper left corner to the lower right corner is determined by solving the distorted curve φ(t) = (φx(t), φy(t)), φx(t)[1:n], φy(t)[1:m], and t[1:k], so as to minimize the sum of the element values on the path. That is, k correspondences between points in the X and points in the Y are determined. If φx(t) = (1, 1), the first point of the X can be said to be in correspondence with the first point of the Y. Given φ(t), the cumulative distance Dφ of the two time series (Equation (6)) can be determined to obtain a most suitable distorted curve φ(t) that minimizes the cumulative distance (Equation (7)).
D X , Y = t = 1 k d φ x t , φ y t
D T W X , Y = min D φ X , Y

2.2.3. Cointegration Test on the COVID-19 Epidemic and the Distance between Phase Difference of Air Quality Periodicity in the Cities

The impacts of COVID-19 on air quality are short-term, so the relationship between the air quality of the cities will gradually return to the pre-epidemic status. Therefore, based on the autoregressive distributed lag (ARDL) framework by Pesaran et al. [32] (2001) and Romilly et al. [33] (2001), this study tested whether there existed a cointegration relationship between the number of COVID-19 confirmed cases and the distance between the phase differences of periodicities (see Equation (8)).
Δ d t w t = c + ρ 0 d t w t 1 + ρ 1 C O V I D t 1 c i t y 1 + ρ 2 C O V I D t 1 c i t y 2 + i = 1 p 1 α i Δ d t w t i + i = 0 p 2 β i Δ C O V I D t i c i t y 1 + i = 0 p 3 γ i Δ C O V I D t i c i t y 2 + ϕ X + ε t
where dtw is the distance between the phase differences in 2020 and 2021 and that in 2019 at the same frequency. These data are obtained from the calculation results of dynamic time wrapping. COVID denotes the cumulative number of confirmed cases in the city, and city denotes the two paired cities for periodic conformance test. X represents other control variables, where the study introduced month dummy variables in the model. ε is the random error term, which obeys N(0, σ2) distribution. ρ, α, β, γ, and φ are the coefficients of variables in the model. Pesaran et al. [32] (2001) and Romilly et al. [33] (2001) stated that the cointegration test based on Equation (8) needs to be performed in two parts: (1) H0: ρ1 = ρ2 = ρ3 = 0, H1: ρ1 ≠ 0 and ρ2 ≠ 0 and ρ3 ≠ 0, (2) H0: ρ1 = 0, H1: ρ1 ≠ 0. If a co-integration relationship exists between the changes in the confirmed cases and the distance between the phase differences before and after the outbreak of COVID-19, it means that the changes in the epidemic has aroused the changes in the periodic conformance between the air quality of the two cities. Therefore, based on the comparison of the changes in the distance between the phase differences before and after the outbreak of COVID-19, this study used the cointegration relationship between the changes in cumulative number of confirmed cases and changes in the distance between the phase differences to further test whether the epidemic has altered the periodic relationship of air quality in the cities.

3. Results

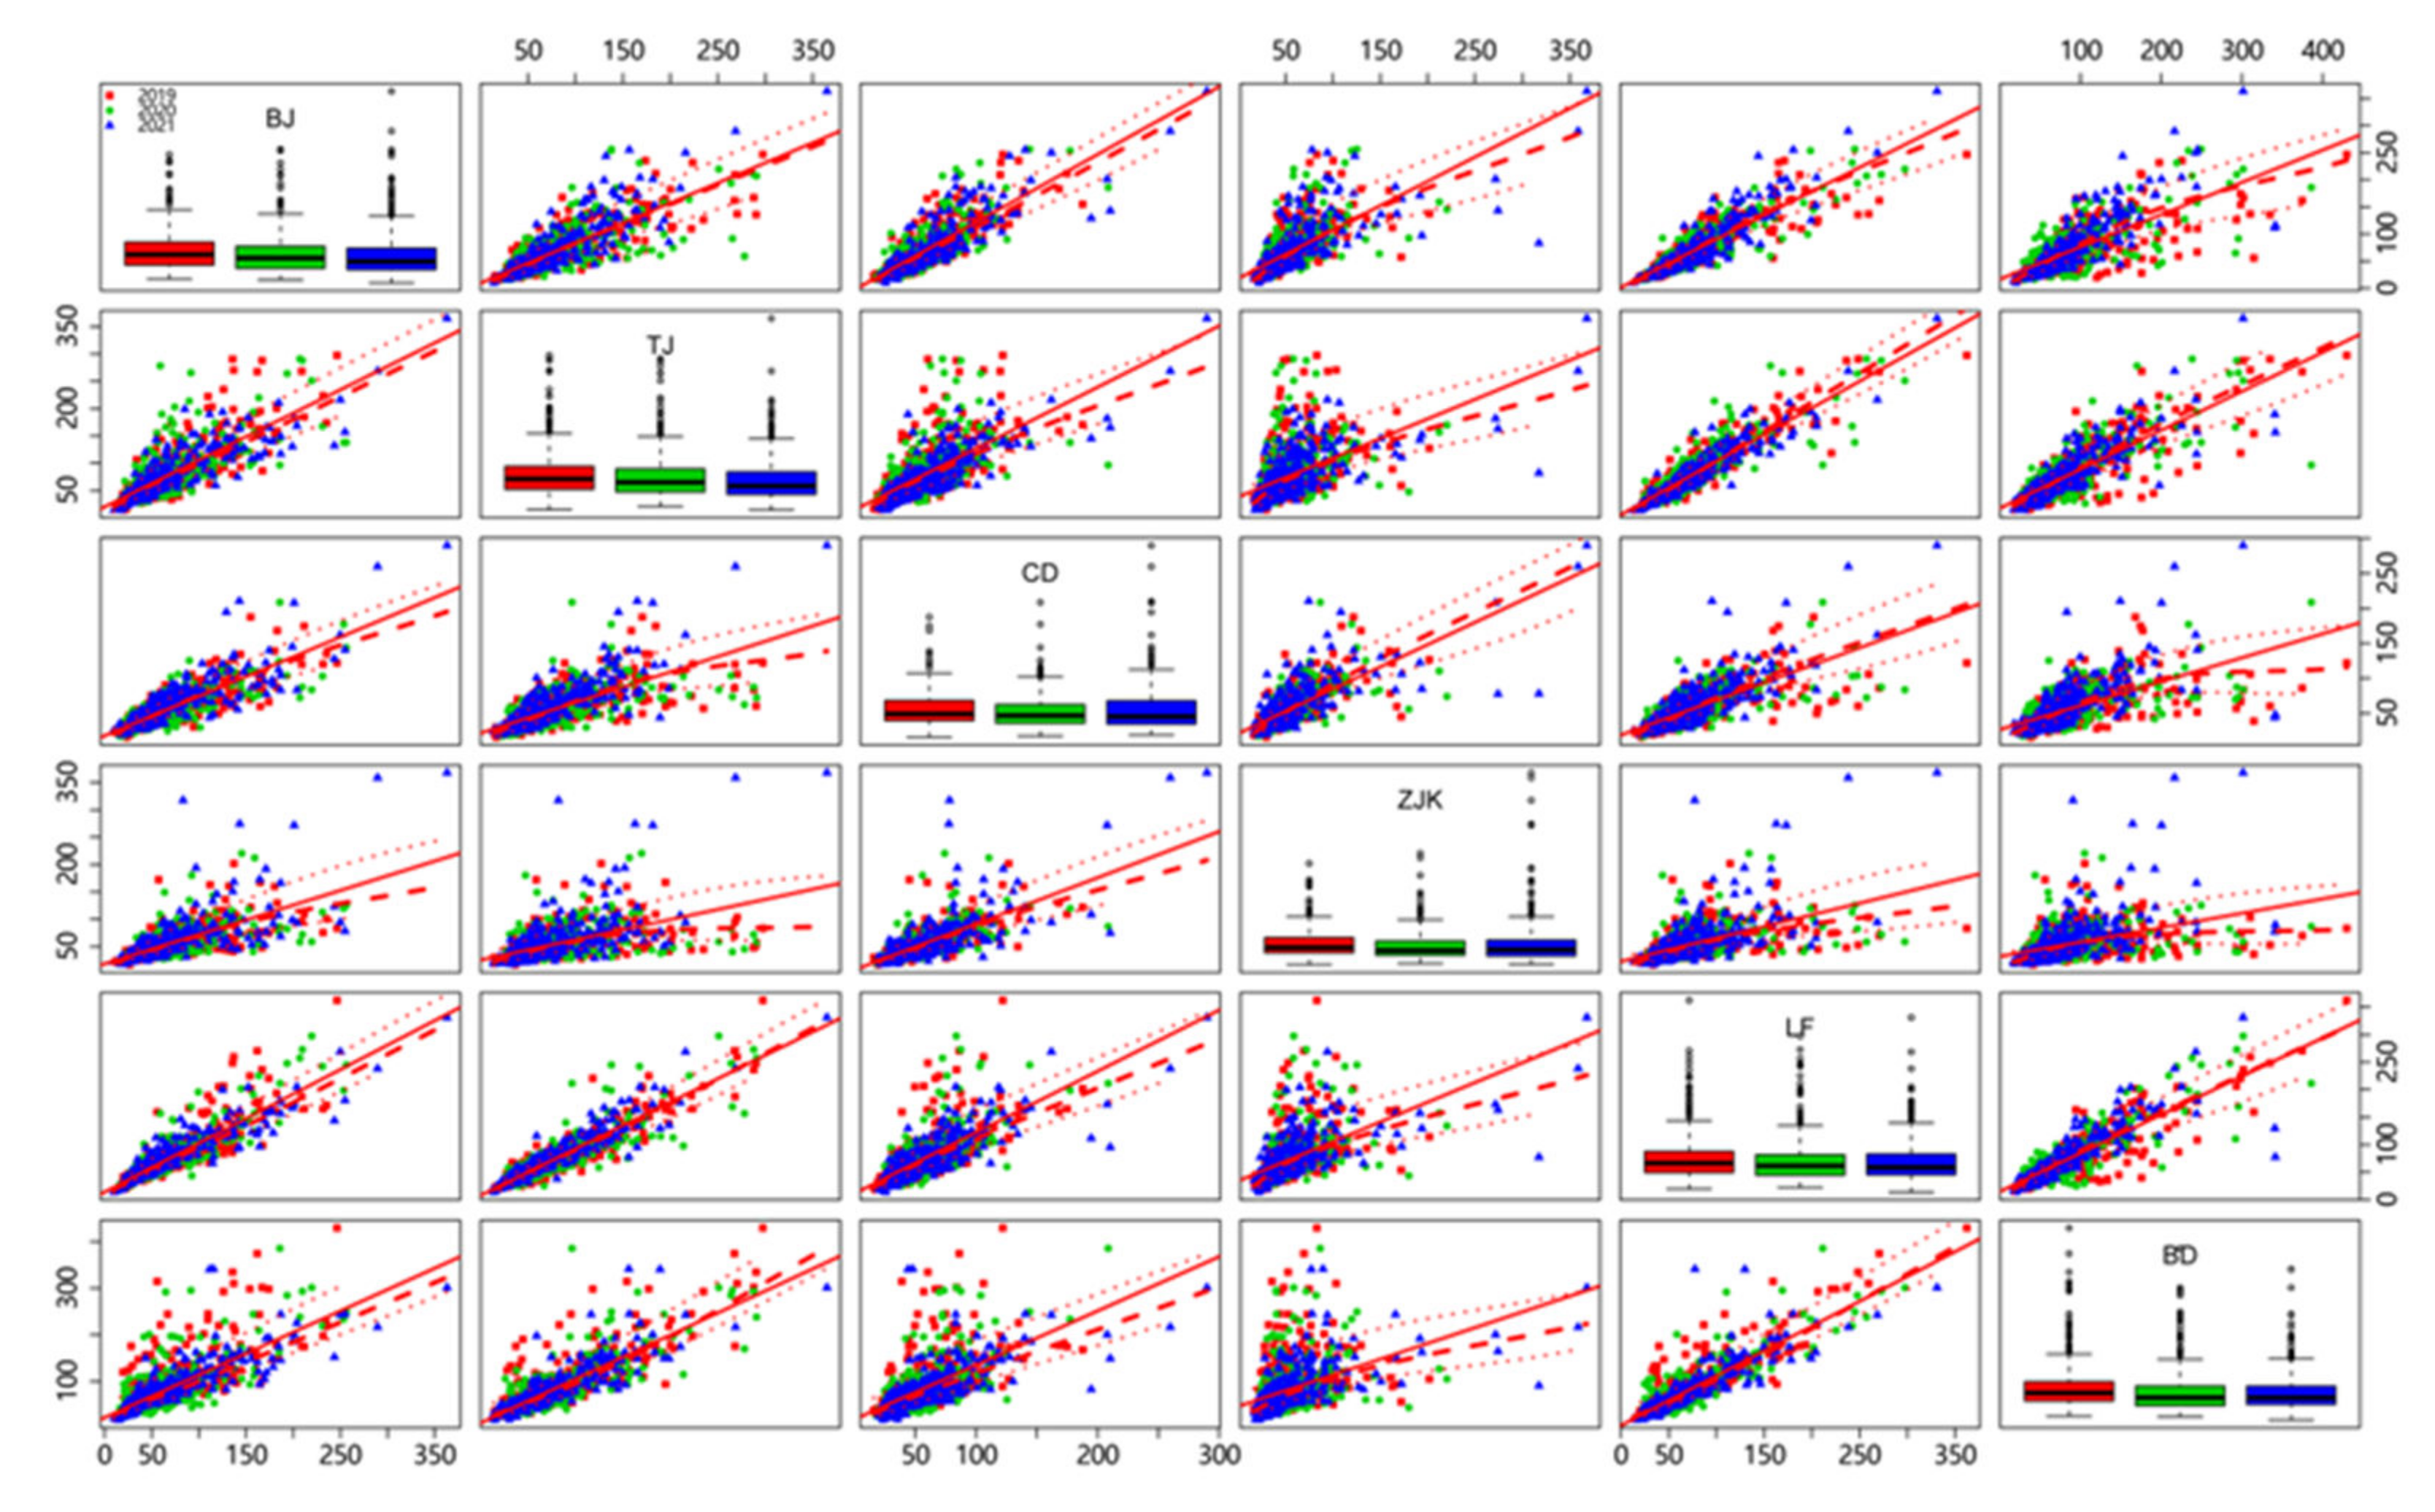
3.1. Periodic Variation Characteristics of AQI

The study identified the dynamic patterns of AQI in six cities using the continuous wavelet transform (Figure 4). According to Figure 4, the time when AQI shows obvious periodic characteristics was mainly concentrated at the end and beginning of each year, and the length was generally 3–6 months (the time ranges in the horizontal axis covered by the black lines in Figure 4). The AQI periodicity length in most cities was below 56 days, mainly within 1–4 weeks (the periodicity ranges in the vertical axis with occurrence of black lines in Figure 4). The AQI periodicities in Beijing were mainly concentrated in the first half of the year, and the periodicities were not coherent over the whole studied period. Moreover, periodicities with a time length of 1–4 weeks were detected in the short term. The AQI periodicity length in Beijing did not show significant changes before and after the outbreak of the pandemic. The periodicities that occurred in 2019 were mainly 1, 2, and 8 weeks in time length, while the periodicity lengths were mainly 1–2 weeks and 2–4 weeks in 2020 and 2021, respectively, with no periodicity lasting more than 4 weeks. The AQI periodicity length of Chengde was mainly 1–2 weeks and 2–4 weeks. Only at the beginning of 2021 was there a 6-week periodicity, which lasted for about 5 months. The AQI periodicity length in Tianjin was 1, 3, and 8 weeks in 2019, 1, 2, and 3 weeks in 2020, and 1 and 2 weeks in 2021. The AQI periodicity length in Langfang was mainly 1, 3, and 6 weeks in 2019, 1 and 3 weeks in 2020, and near 2 weeks in 2021, and the periodic characteristic presented weakening trend. The AQI periodicity length in Baoding was mainly 1, 3, and 7 weeks in 2019, 1 and 2 weeks in 2020, and 1–2 weeks in 2021, and the periodicity length became gradually shorter. The AQI change in Zhangjiakou did not present significant and long-lasting periodicities in 2019 and 2020, but periodicities with a length of 1–2 weeks and 8 weeks appeared in 2021.
The periodic change in AQI in the upwind cities including Chengde and Zhangjiakou were similar, both showing a 56-day periodicity in 2021. The AQI periodic change in the downwind cities including Tianjin, Langfang, and Baoding were similar, showing periodicities of 20–25 days and 40–50 days in 2019. Beijing was influenced more by the downwind cities, and the periodic change in 2019 was more similar to that of the downwind cities, with a periodicity length of 56 days. The upwind cities did not have periodicities of that length. In 2020 and 2021, Beijing’s AQI was gradually influenced by the upwind cities. Especially in 2021, there was a 56-day periodicity in Beijing, which was similar to that in Chengde and Zhangjiakou. However, the significance level of this periodicity was low.
The variability of short-length periodicities was small before and after the outbreak. Although periodicities with a length of less than 4 weeks changed in significance and duration, the overall variation in duration was relatively stable. This indicates that the epidemic had a smaller impact on short-length periodicities. However, periodicities with a length greater than 4 weeks changed significantly before and after the epidemic. For example, upwind cities had periodicities with a length of 8 weeks in 2021, but such periodicities did not appear before the outbreak of the epidemic and in 2020 when the epidemic was severe. Downwind cities had periodicities of about 7 weeks in 2019, which disappeared after the outbreak of the epidemic.

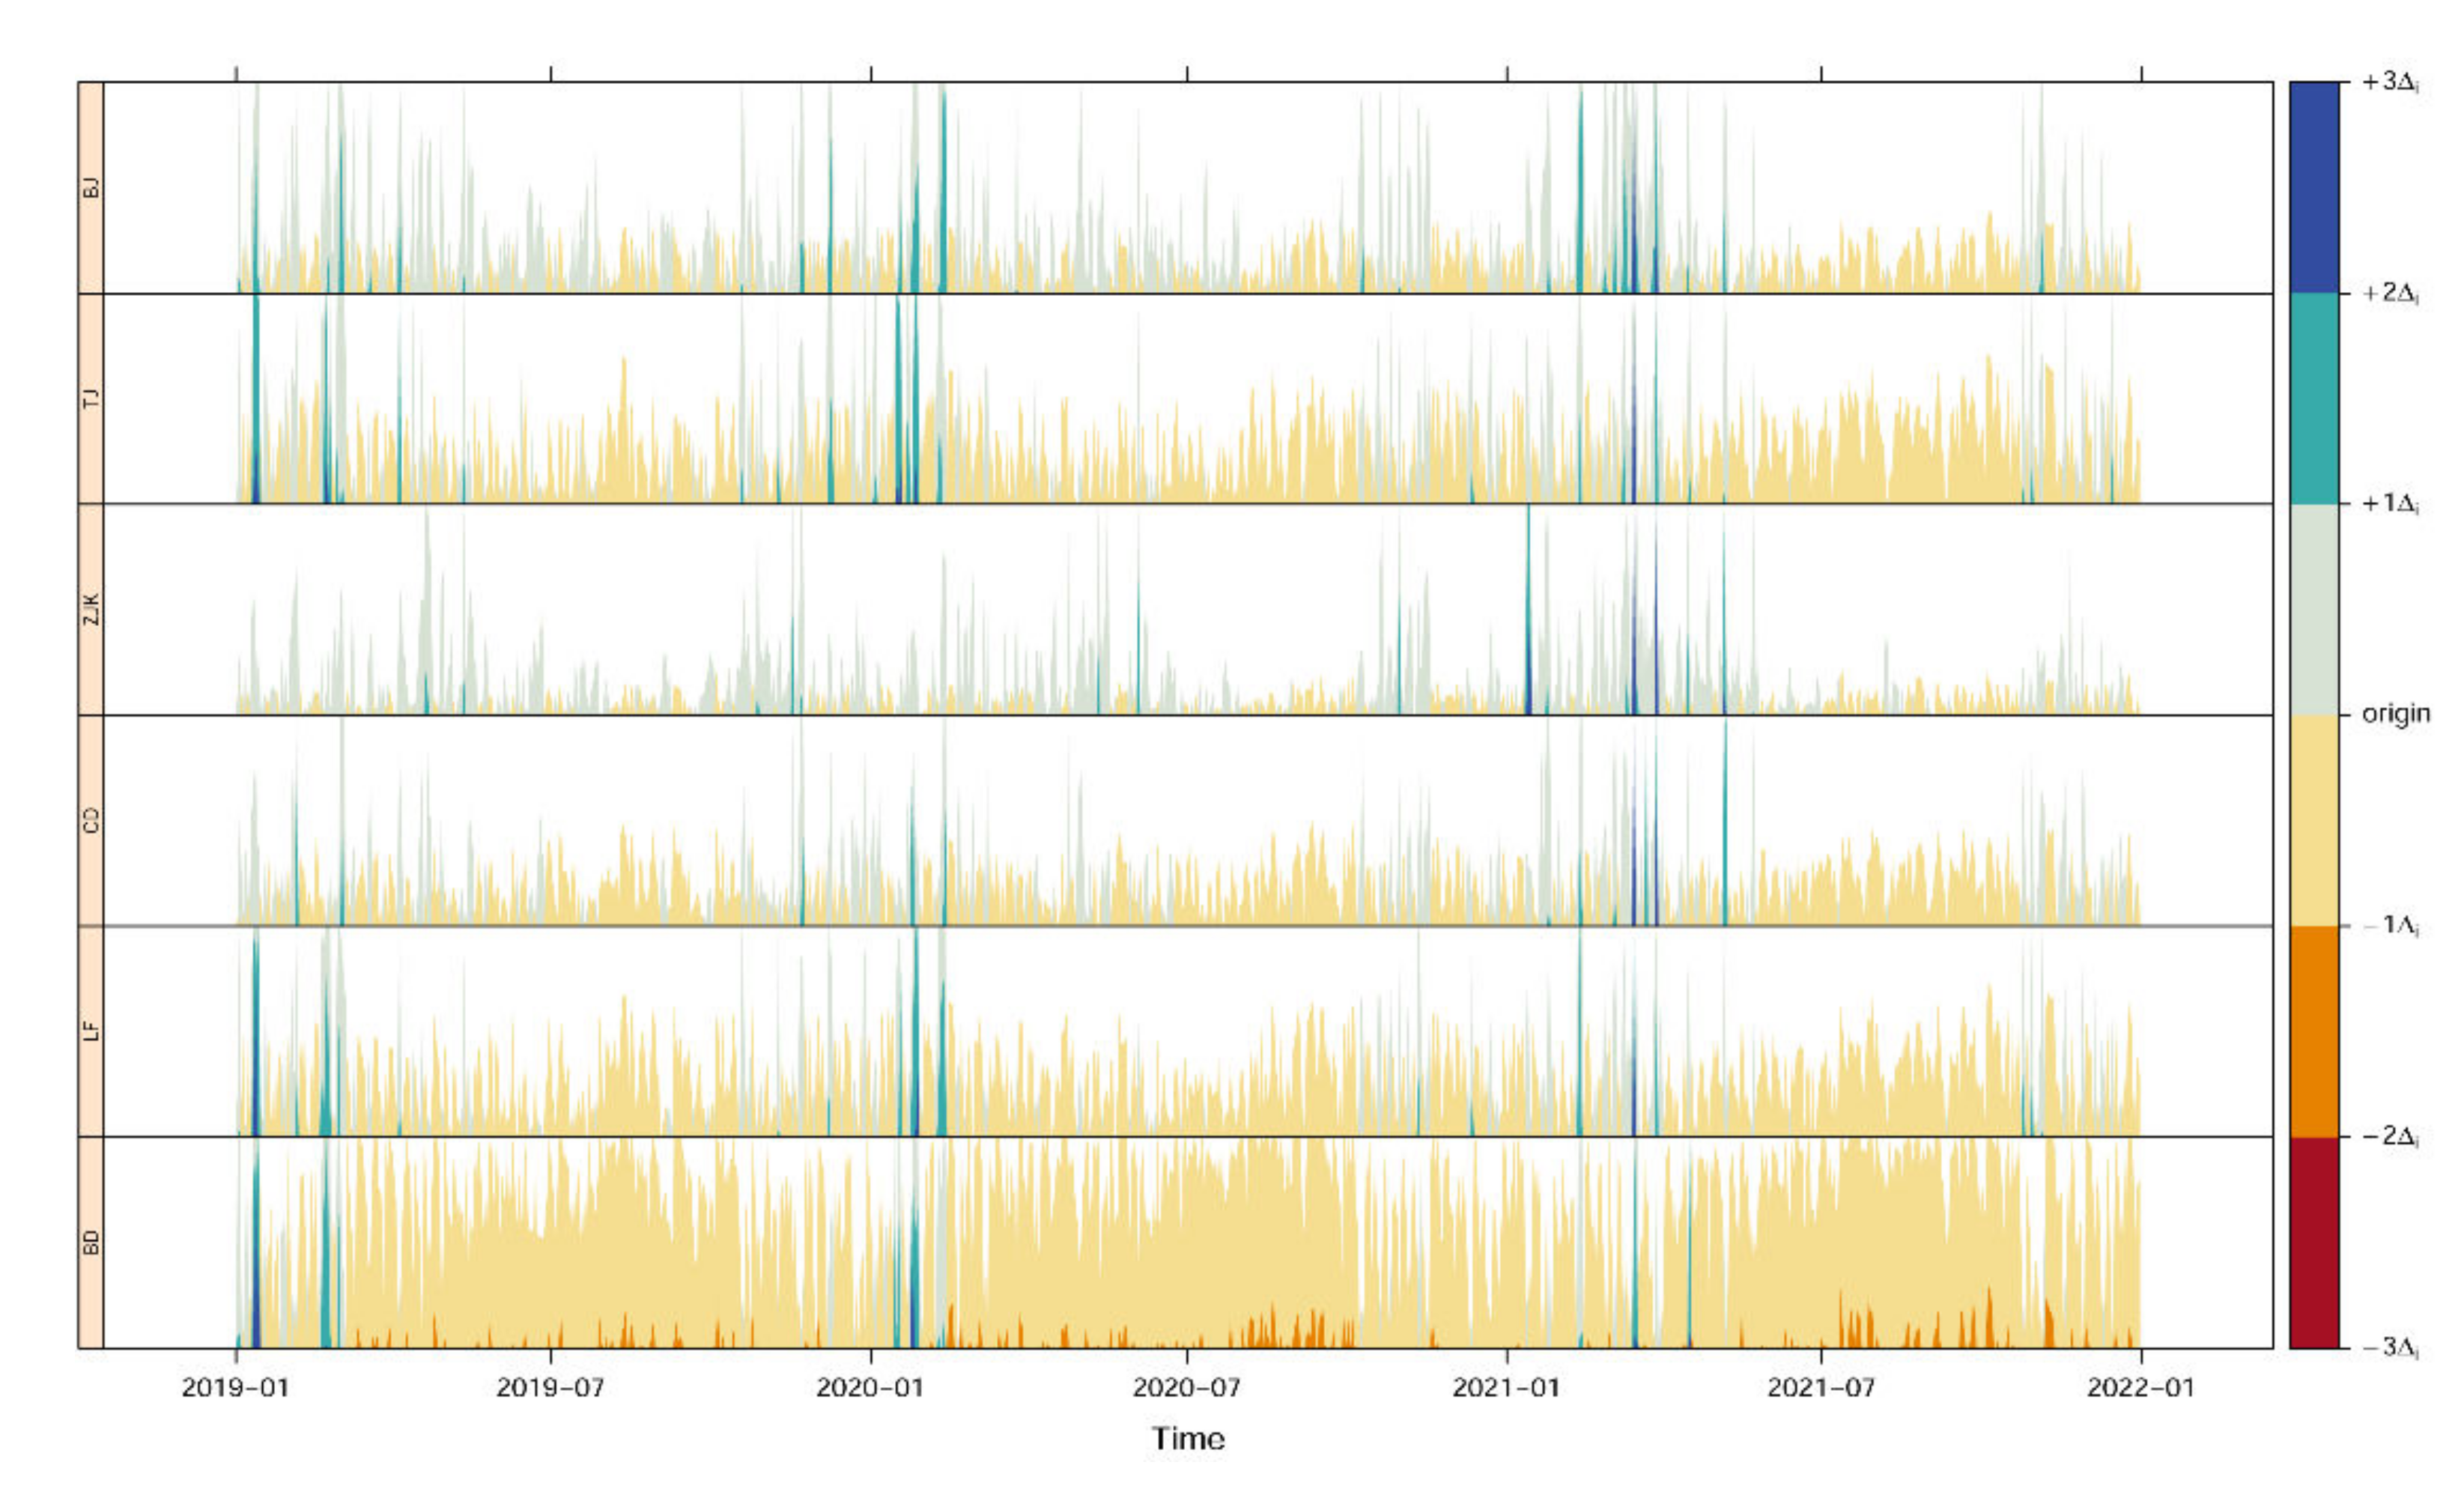
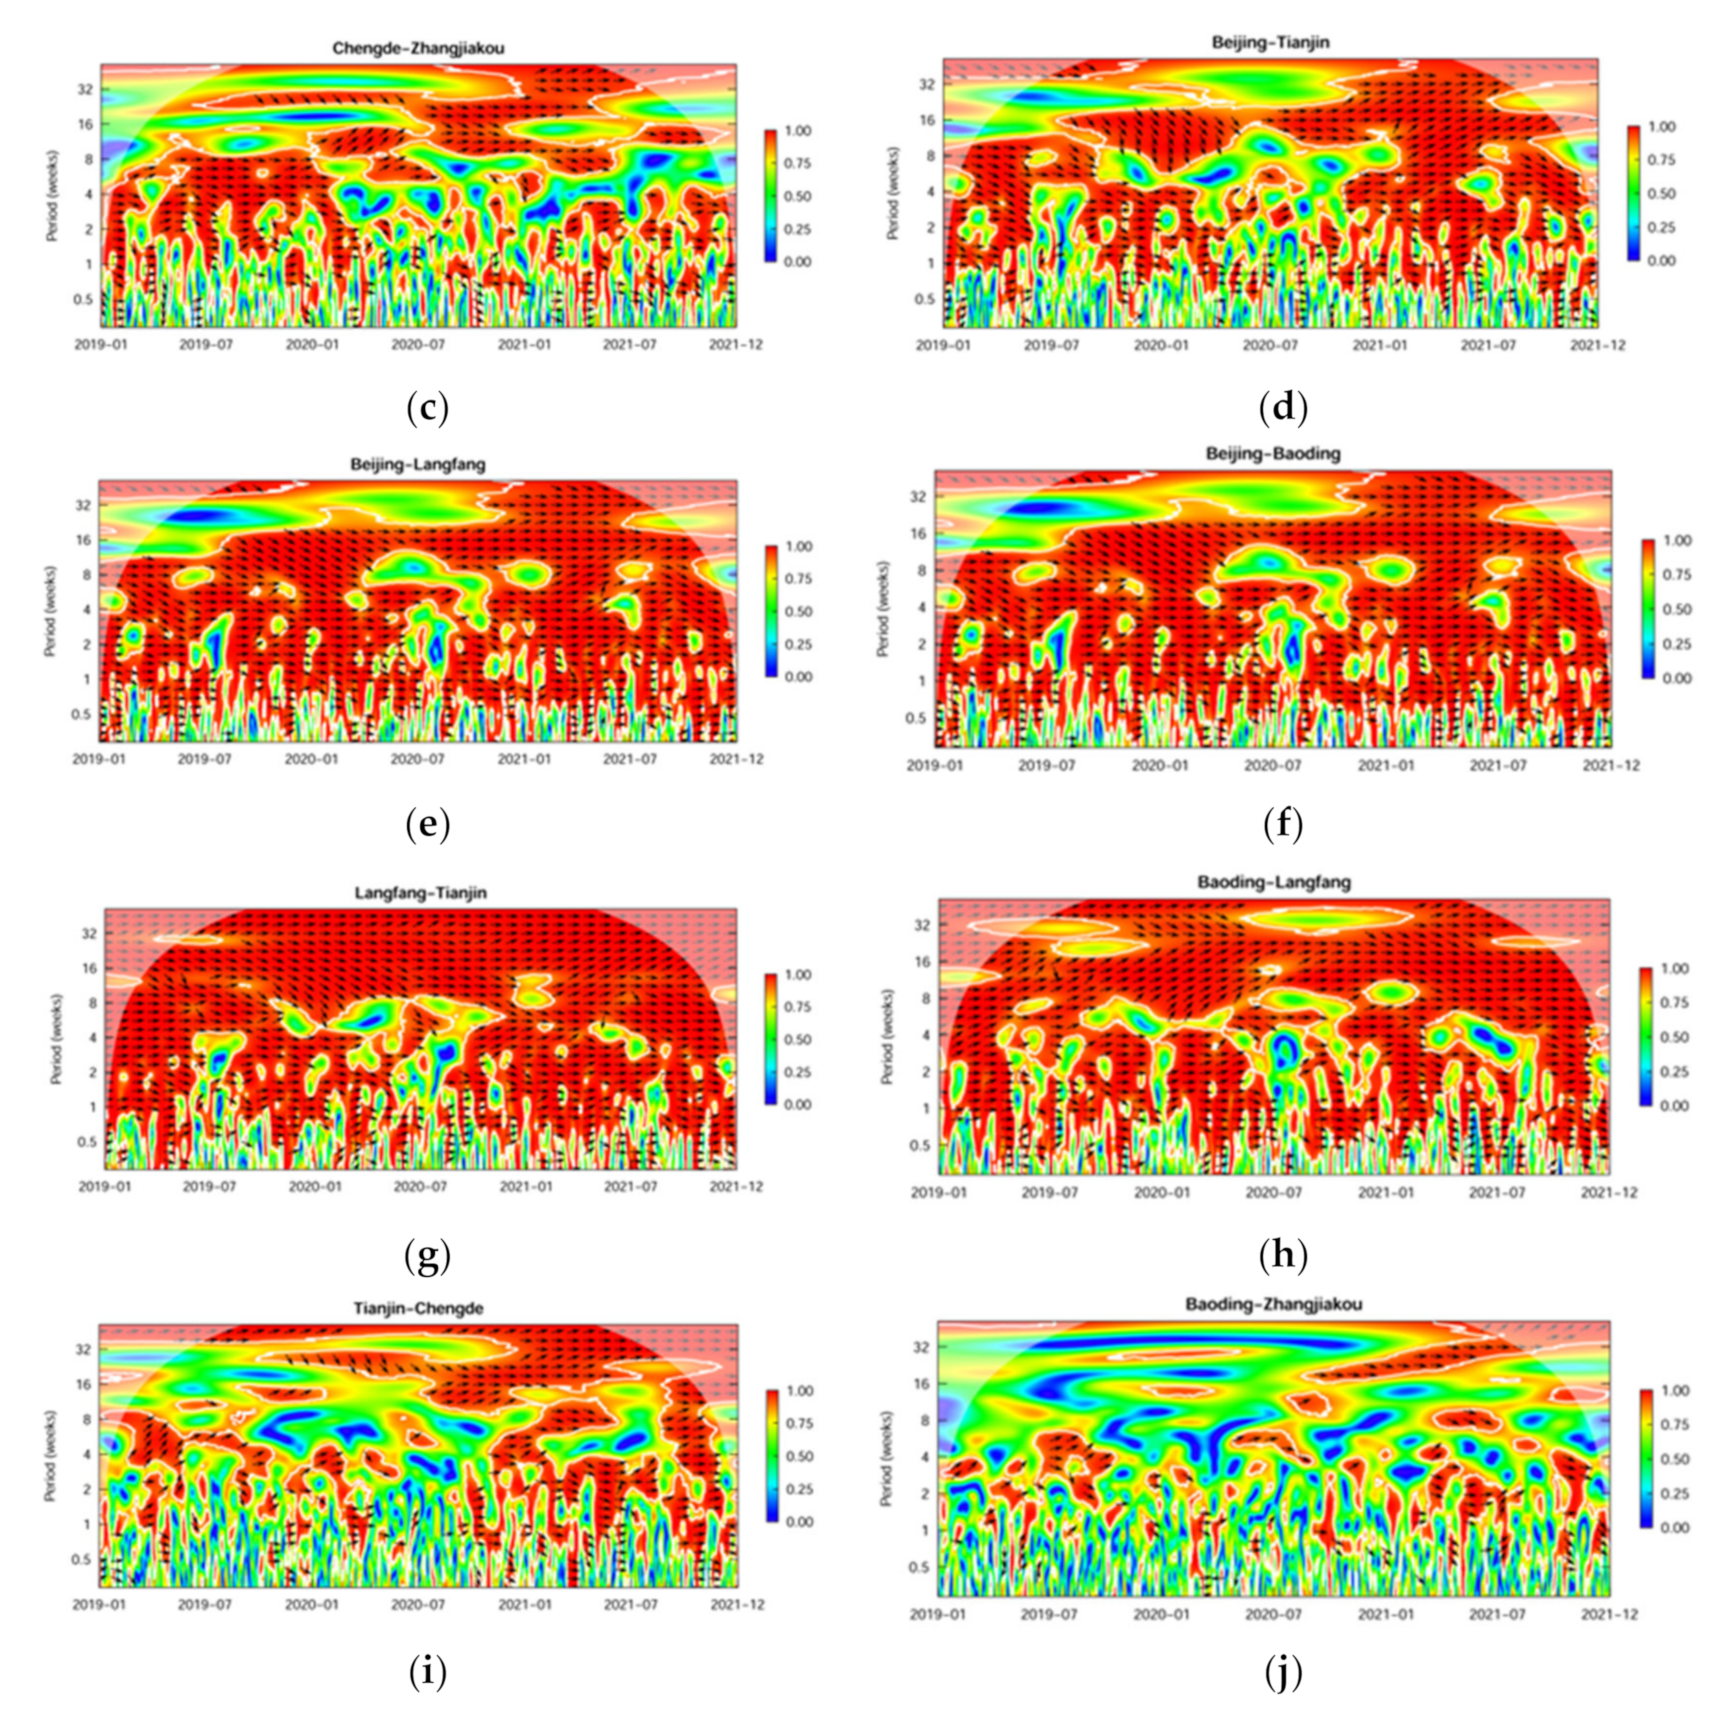
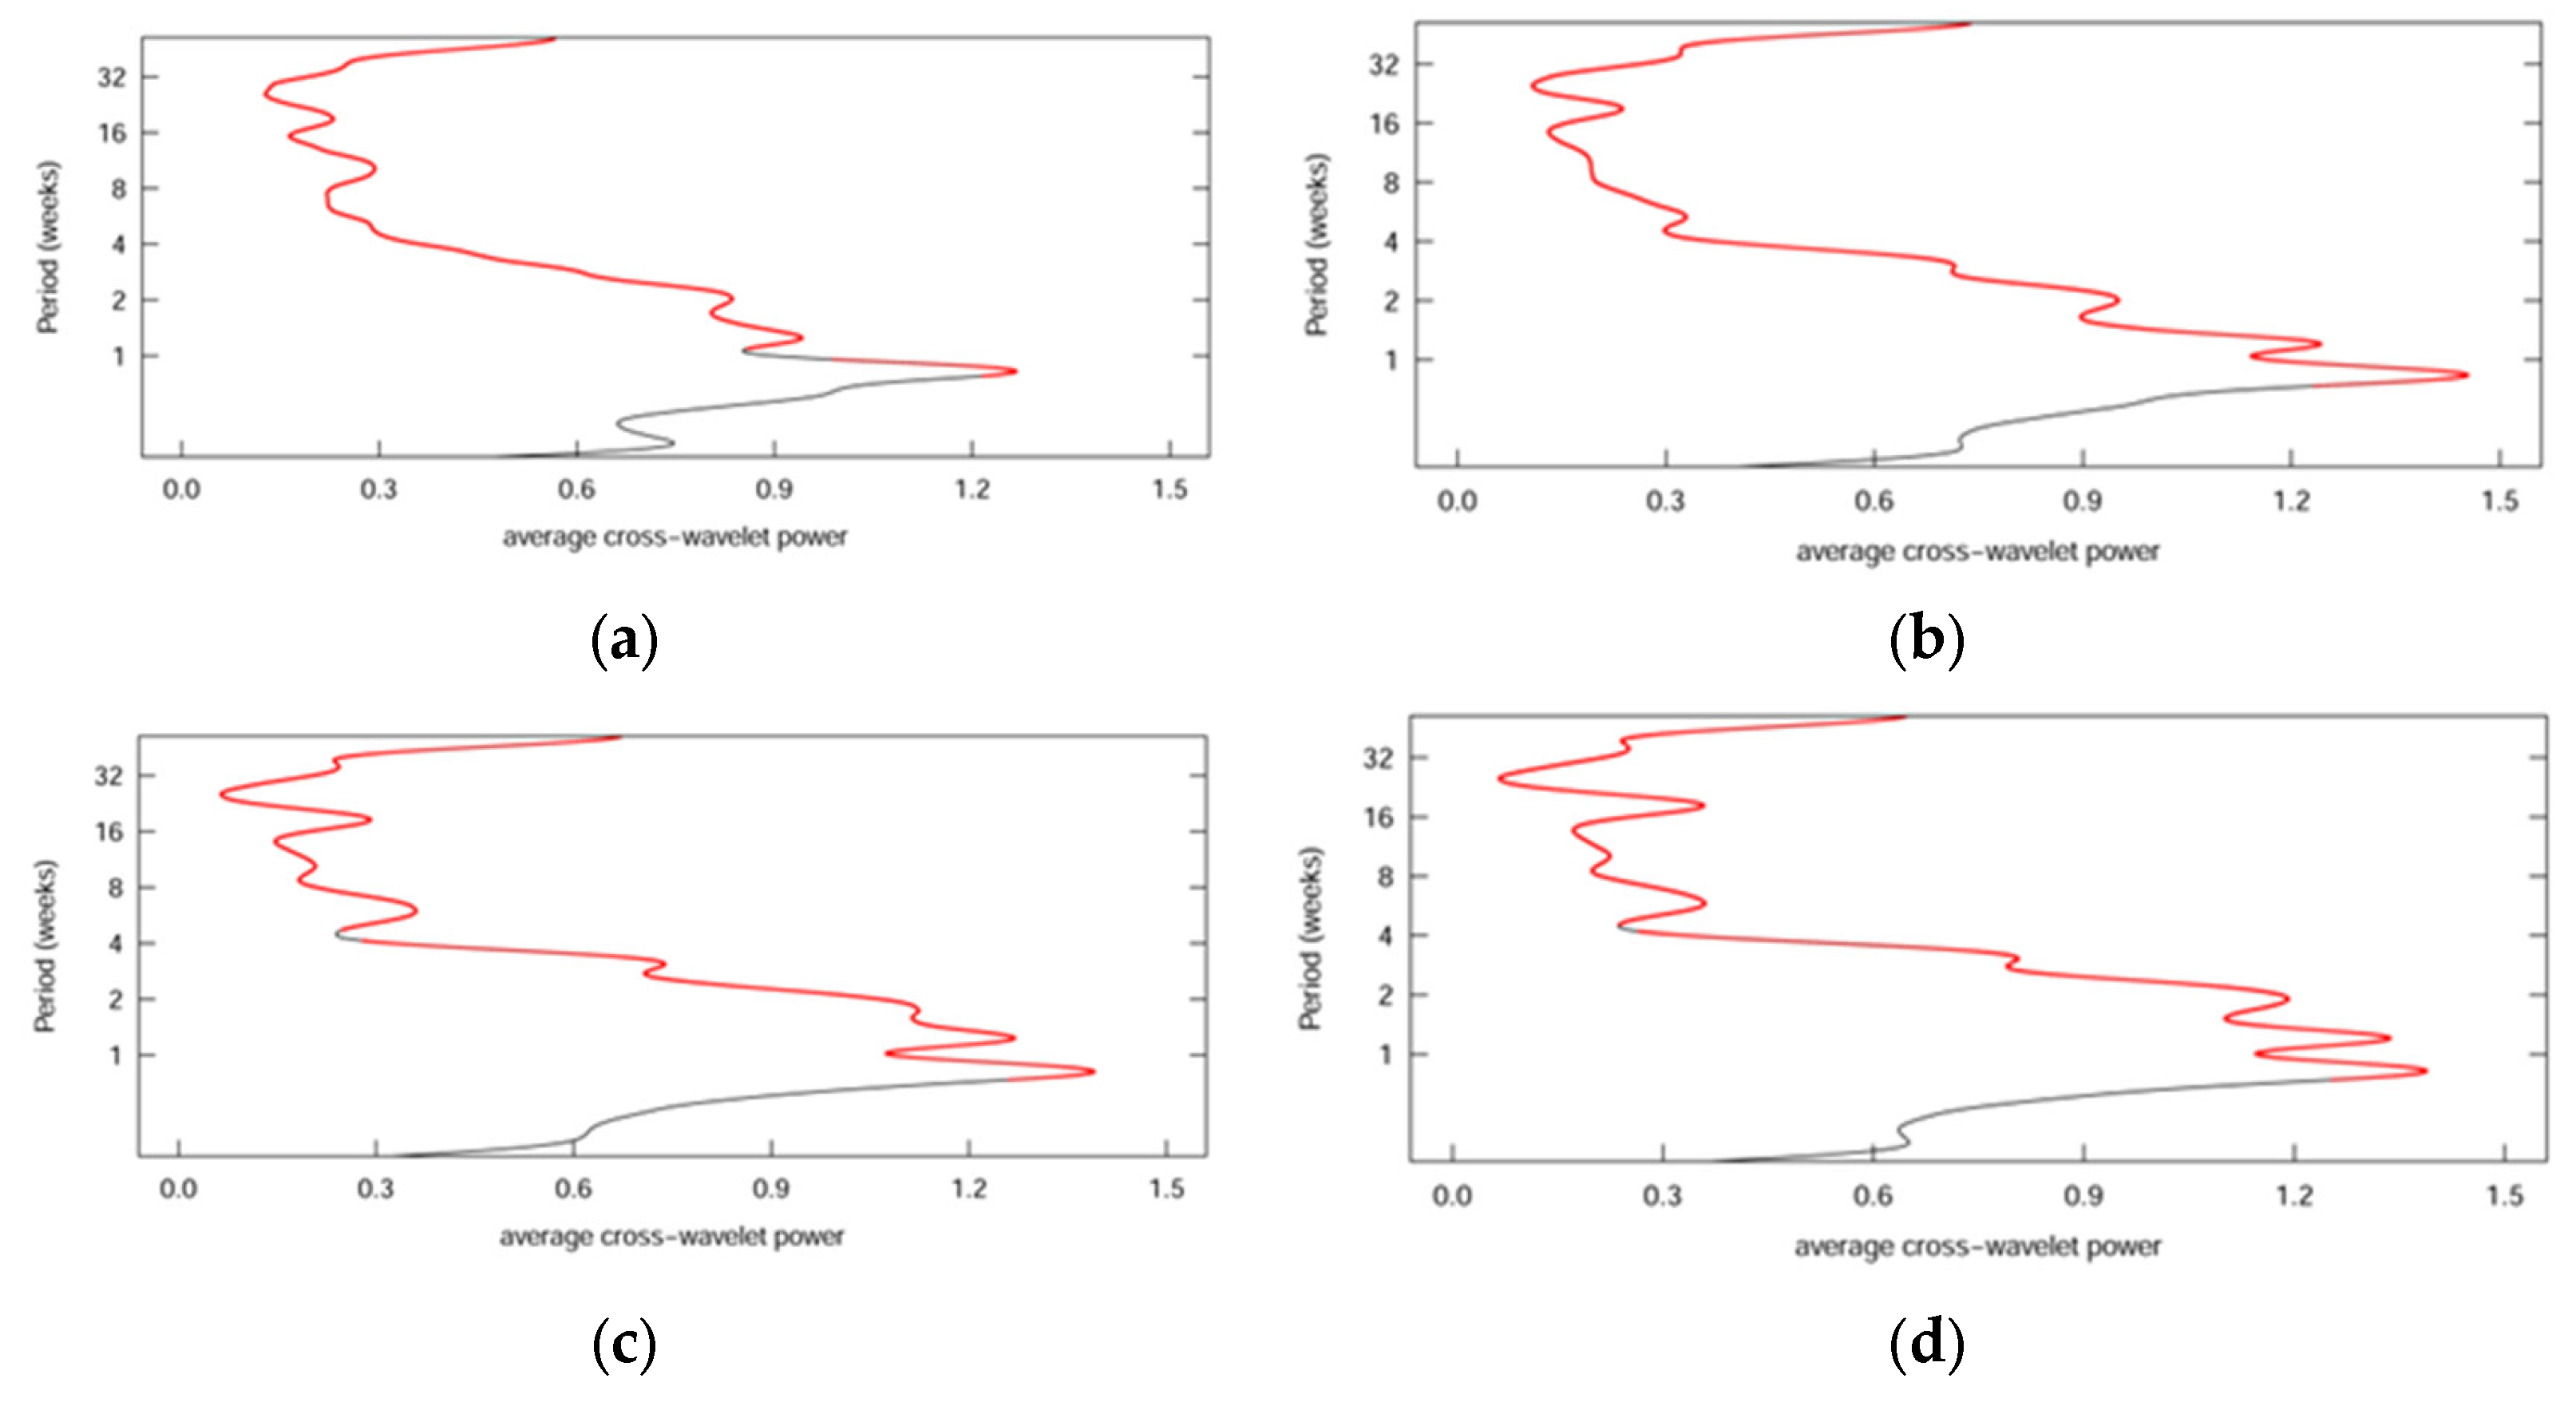
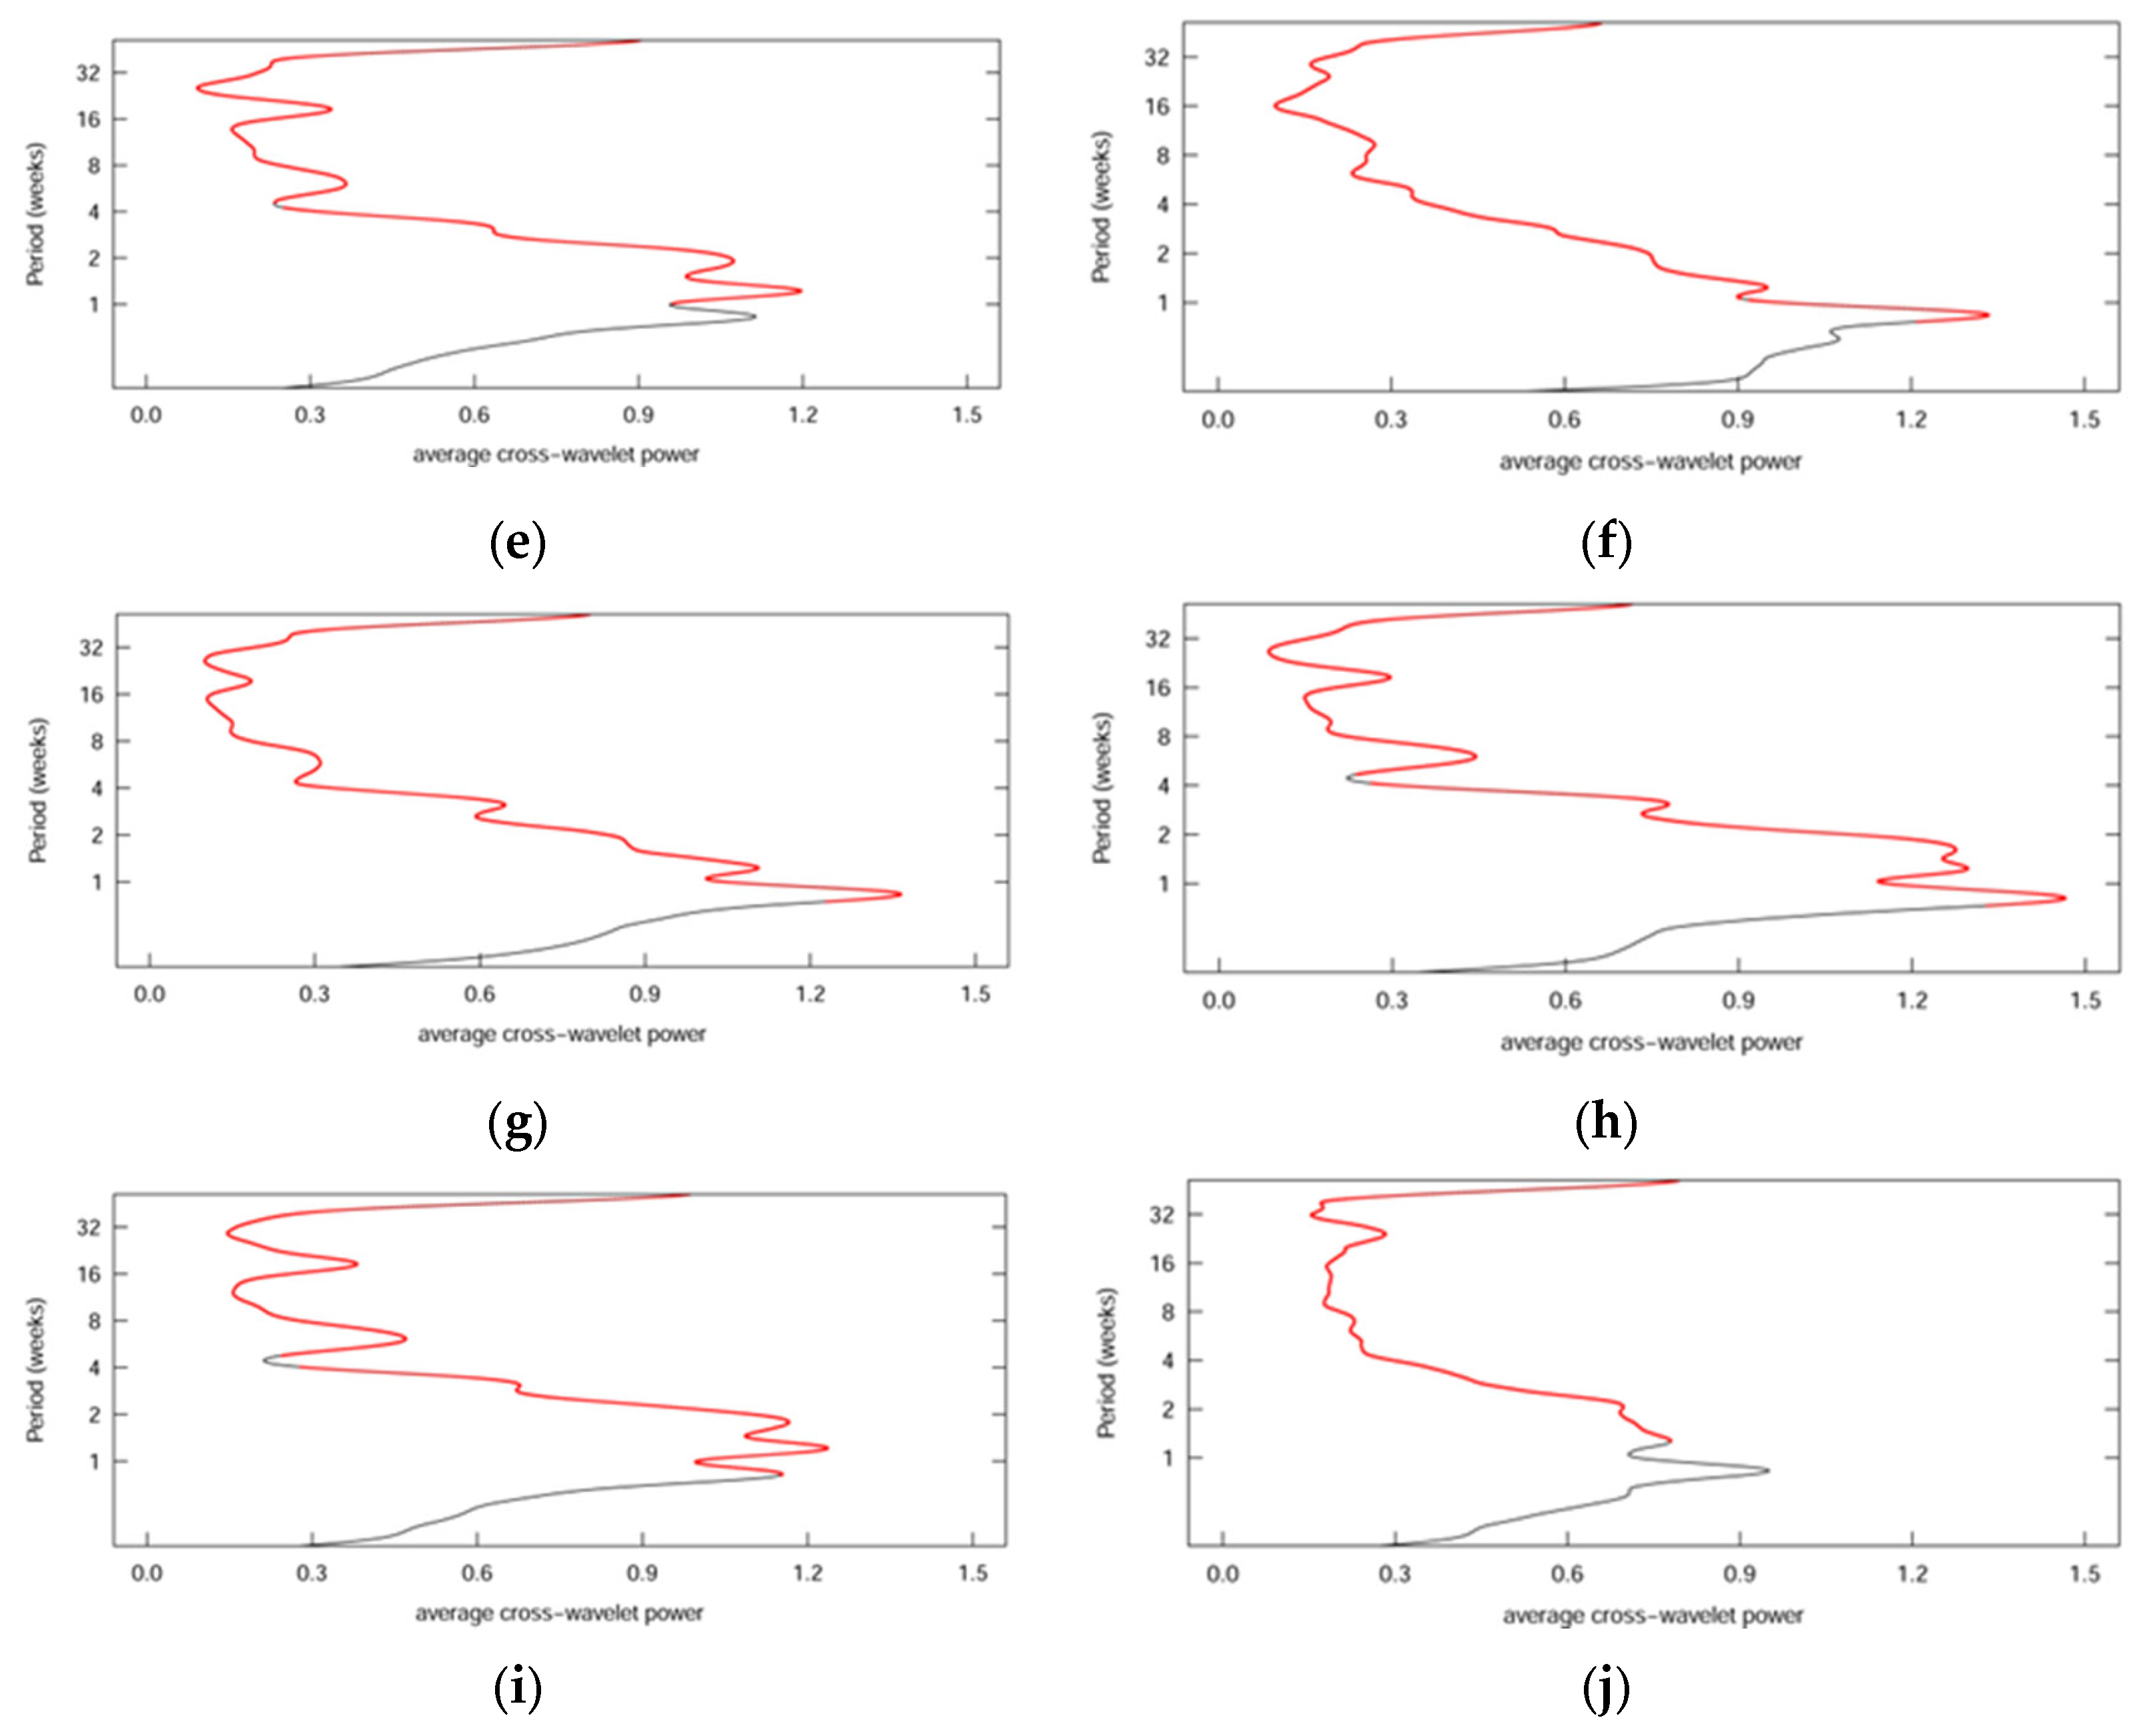
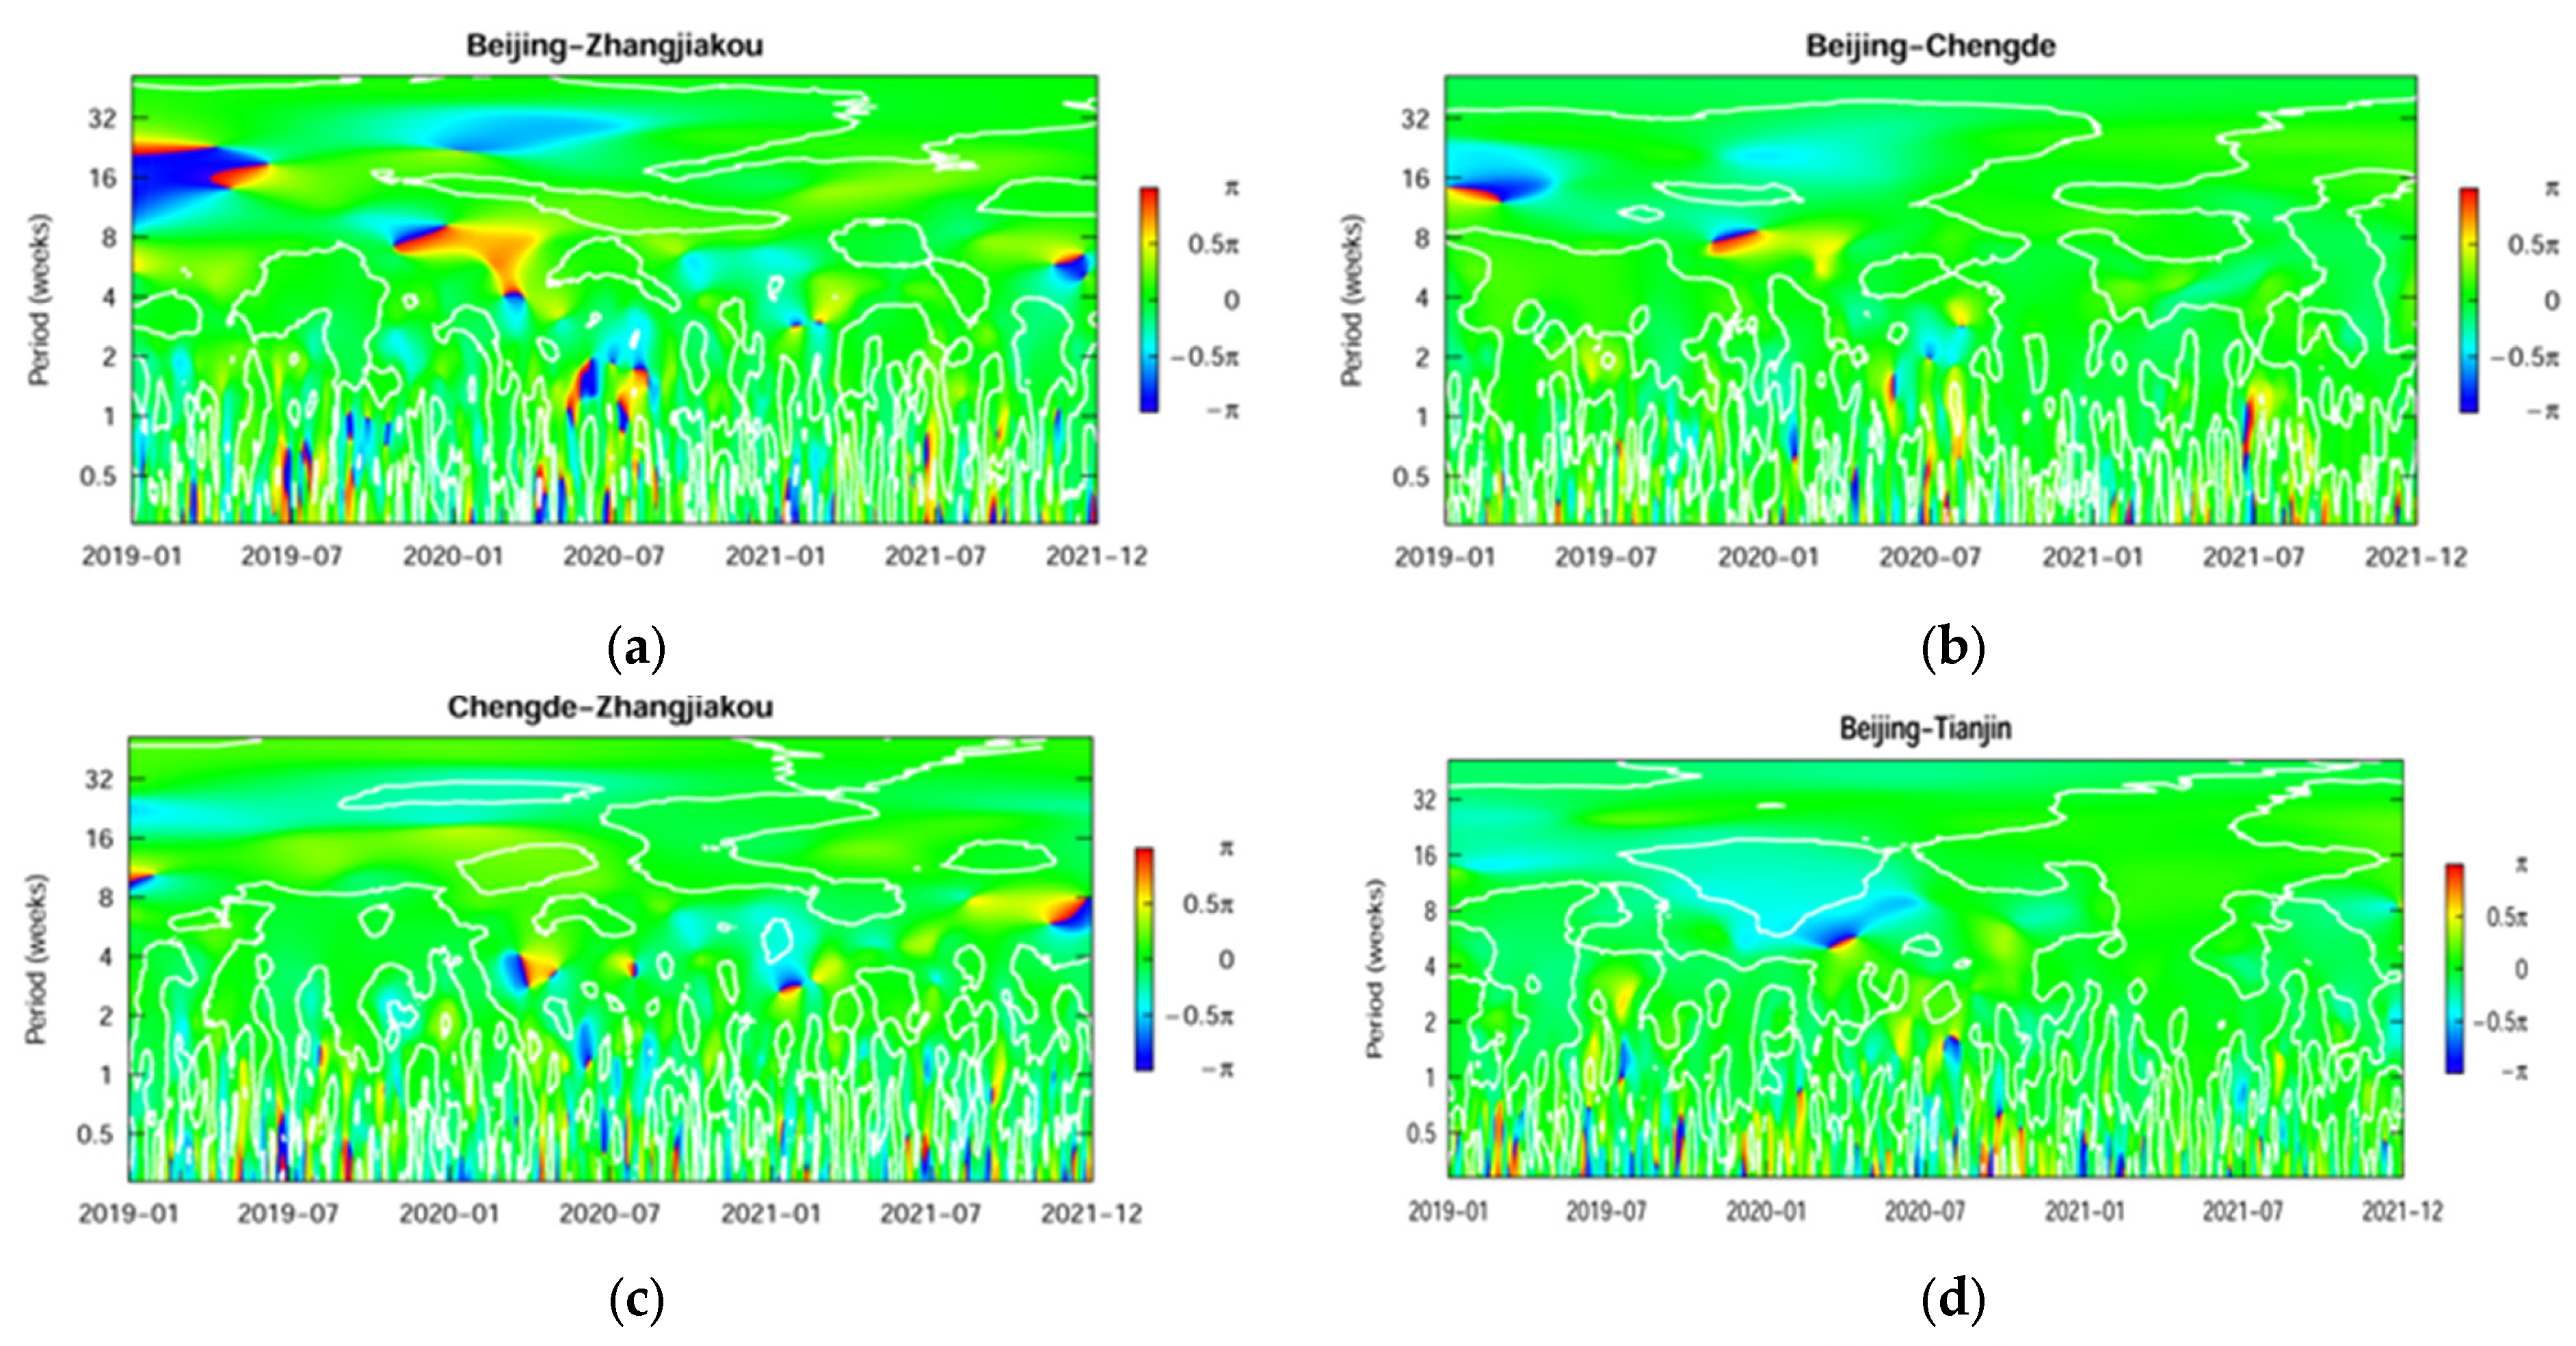
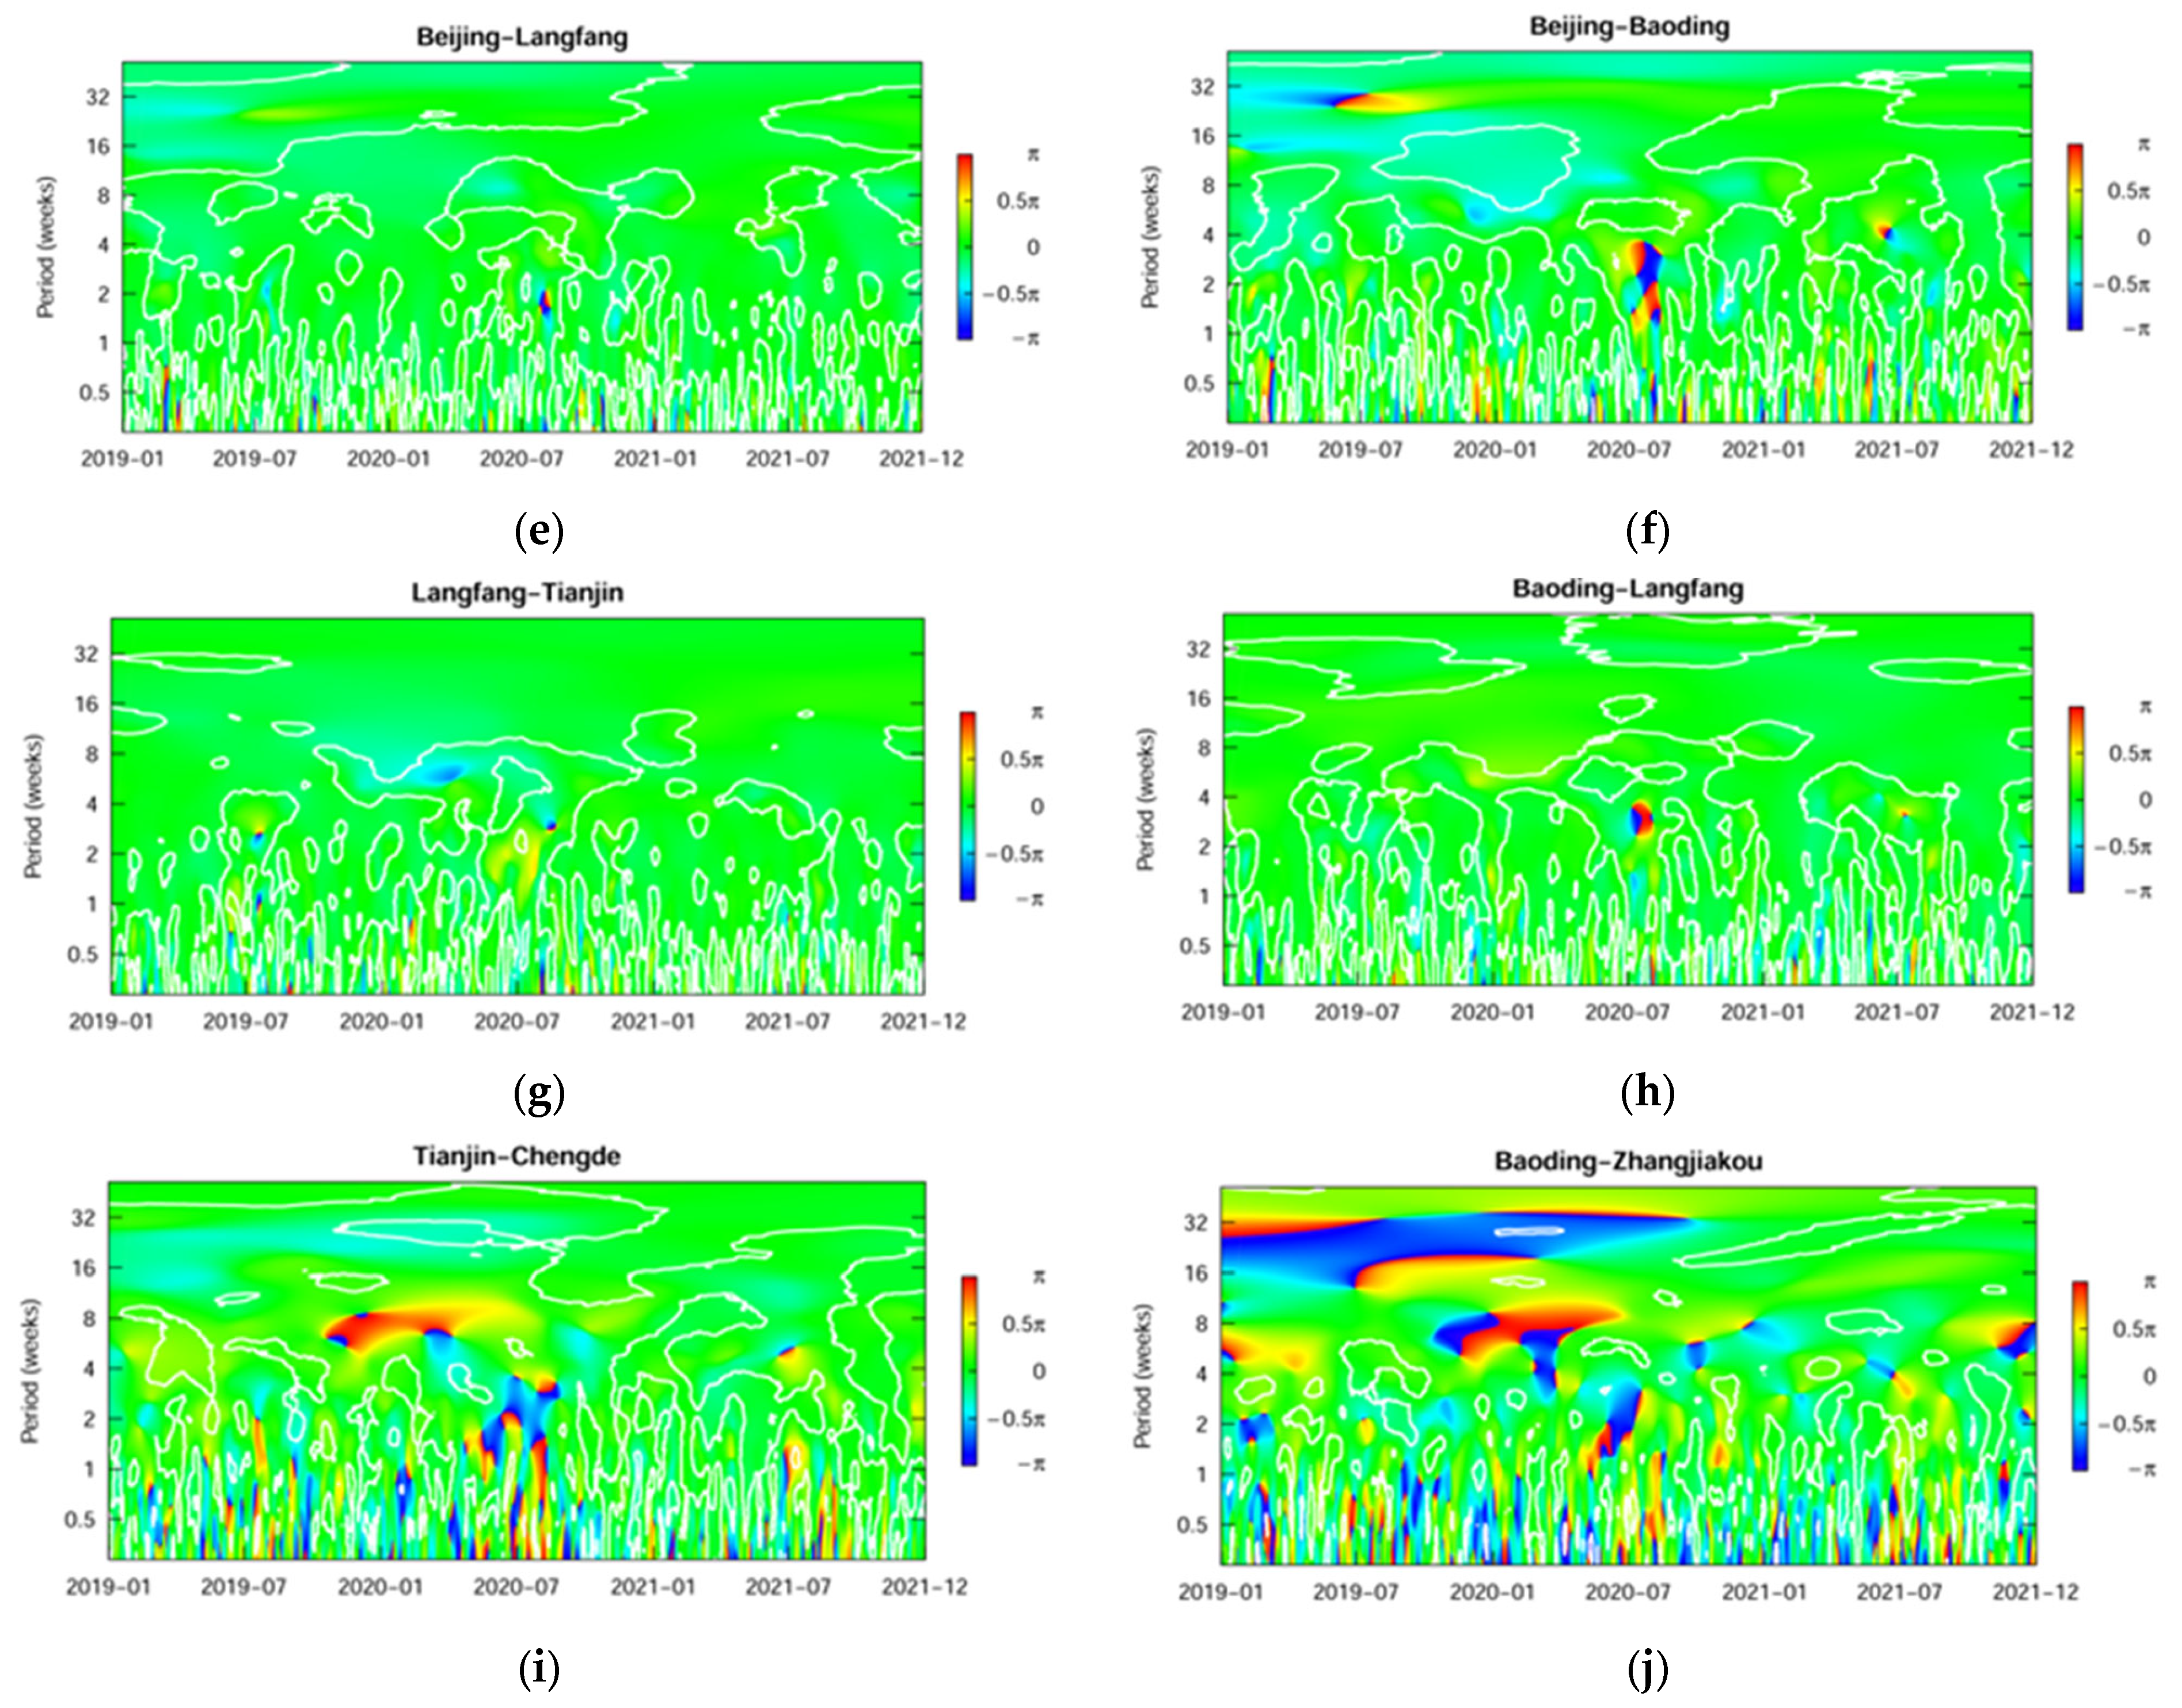
3.2. Periodic Conformance Test Results of Air Quality Changes in Beijing and Its Neighboring Cities

This study examined the periodic conformance of AQI changes in Beijing and its neighboring cities to analyze the effect of COVID-19 on the connections among the air quality of different cities (Appendix D, Figure A2). The results of the periodic conformance test for Beijing–Zhangjiakou, Beijing–Chengde, Beijing–Tianjin, Beijing–Langfang, Beijing–Baoding, Chengde–Zhangjiakou, Tianjin–Chengde, Langfang–Tianjin, Baoding–Langfang, and Baoding–Zhangjiakou are shown in Figure 5. The color from blue to red indicates the intensity from weak to strong, the red line indicates the range where the conformance test is valid, and the black arrow shows the range of conformance. According to the results of the dynamic periodic analysis, the lengths of AQI periodicities of Beijing and neighboring cities were mainly in the range of 1–4 weeks, so this study focused on the changes in the periodic conformance based on the periodicities with a length of 1–4 weeks to determine the influence of COVID-19.
The results of the periodic conformance test for the upwind cities of Beijing showed that the periodic conformance of Beijing, Chengde, and Zhangjiakou was low, and it changed significantly before and after the epidemic. The results of the periodic conformance test of Beijing and Zhangjiakou (Figure 5a) showed that the changes in the conformance of periodicities were complicated and mainly occurred near the middle and end of the year. Meanwhile, the level of periodic conformance was higher in 2019 than that in 2020, especially in the beginning and July of 2020 when the epidemic was severe. However, the level of periodic conformance increased significantly in 2021 as the epidemic was under control. This indicates that the epidemic affects the AQI periodic conformance for Beijing and Zhangjiakou. The results of the periodic conformance test for Beijing and Chengde (Figure 5b) showed that the AQI in these two cities had a high level of periodic conformance, especially for the periodicities with length of 2–4 weeks, but the level of periodic conformance decreased in the beginning and July of 2020 when the epidemic was severe. The periodic conformance almost disappeared after the outbreak of the epidemic in Xinfadi, Beijing, in July. Therefore, the epidemic affected the AQI periodic conformance for Beijing and Chengde. The results of the periodic conformance test for Chengde and Zhangjiakou (Figure 5c) showed that the conformance of the periodicities with a length of 1–4 weeks was obvious for the two cities. The periodic conformance was the highest in 2019, disappeared in 2020, and reappeared in 2021. Moreover, the level of periodic conformance for Chengde–Zhangjiakou was much higher than that for Beijing–Zhangjiakou and Beijing–Chengde. In conclusion, there was a high level of conformance of AQI periodicities of 1–4 weeks between Beijing and its upwind cities, and the level of periodic conformance decreased significantly in the beginning and July of 2020 when the COVID-19 epidemic was severe.
The results of the periodic conformance test for the downwind cities of Beijing showed that the conformance of AQI periodicities for Beijing, Tianjin, Baoding, and Langfang differed significantly. The AQI periodic conformance for Beijing–Langfang and Beijing–Baoding were similar, and the epidemic had no obvious influence on the periodic conformance. The results of AQI periodic conformance test for Beijing and Tianjin (Figure 5d) showed that the 4-week periodicities had a high level of conformance, and the periodic conformance did not change significantly in the beginning and July of 2020 when the epidemic was severe. Therefore, the epidemic did not significantly affect the AQI periodic conformance for Beijing and Tianjin. The results of AQI periodic conformance tests of Beijing–Langfang and Beijing–Baoding (Figure 5e,f) showed that there were similar and high-level conformance of AQI periodicities for Beijing–Langfang and Beijing–Baoding, but the epidemic had no significant influence on it.
There was a conformance of AQI periodicities for Langfang–Tianjin and Tianjin–Baoding, and the conformances were highly similar. Meanwhile, compared with 2019, the significance level of periodic conformance did not present obvious changes in the beginning and July of 2020 when the epidemic was severe (Figure 5g,h). The results of the periodic conformance test for the downwind and upwind cities of Beijing (Figure 5i,j) showed that the periodic conformance for Tianjin–Chengde was obvious while that for Baoding–Zhangjiakou was unobvious. From the perspective of the influence of COVID-19 on the periodic conformance, the periodic conformance for Beijing–downwind cities and Beijing–upwind cities did not change significantly before and after the epidemic. From the perspective of the level of periodic conformance, the influences of the epidemic on the AQI periodic conformance for upwind cities as well as upwind cities–downwind cities were not obvious. Therefore, the epidemic did not significantly change the connections among the air quality of these cities.

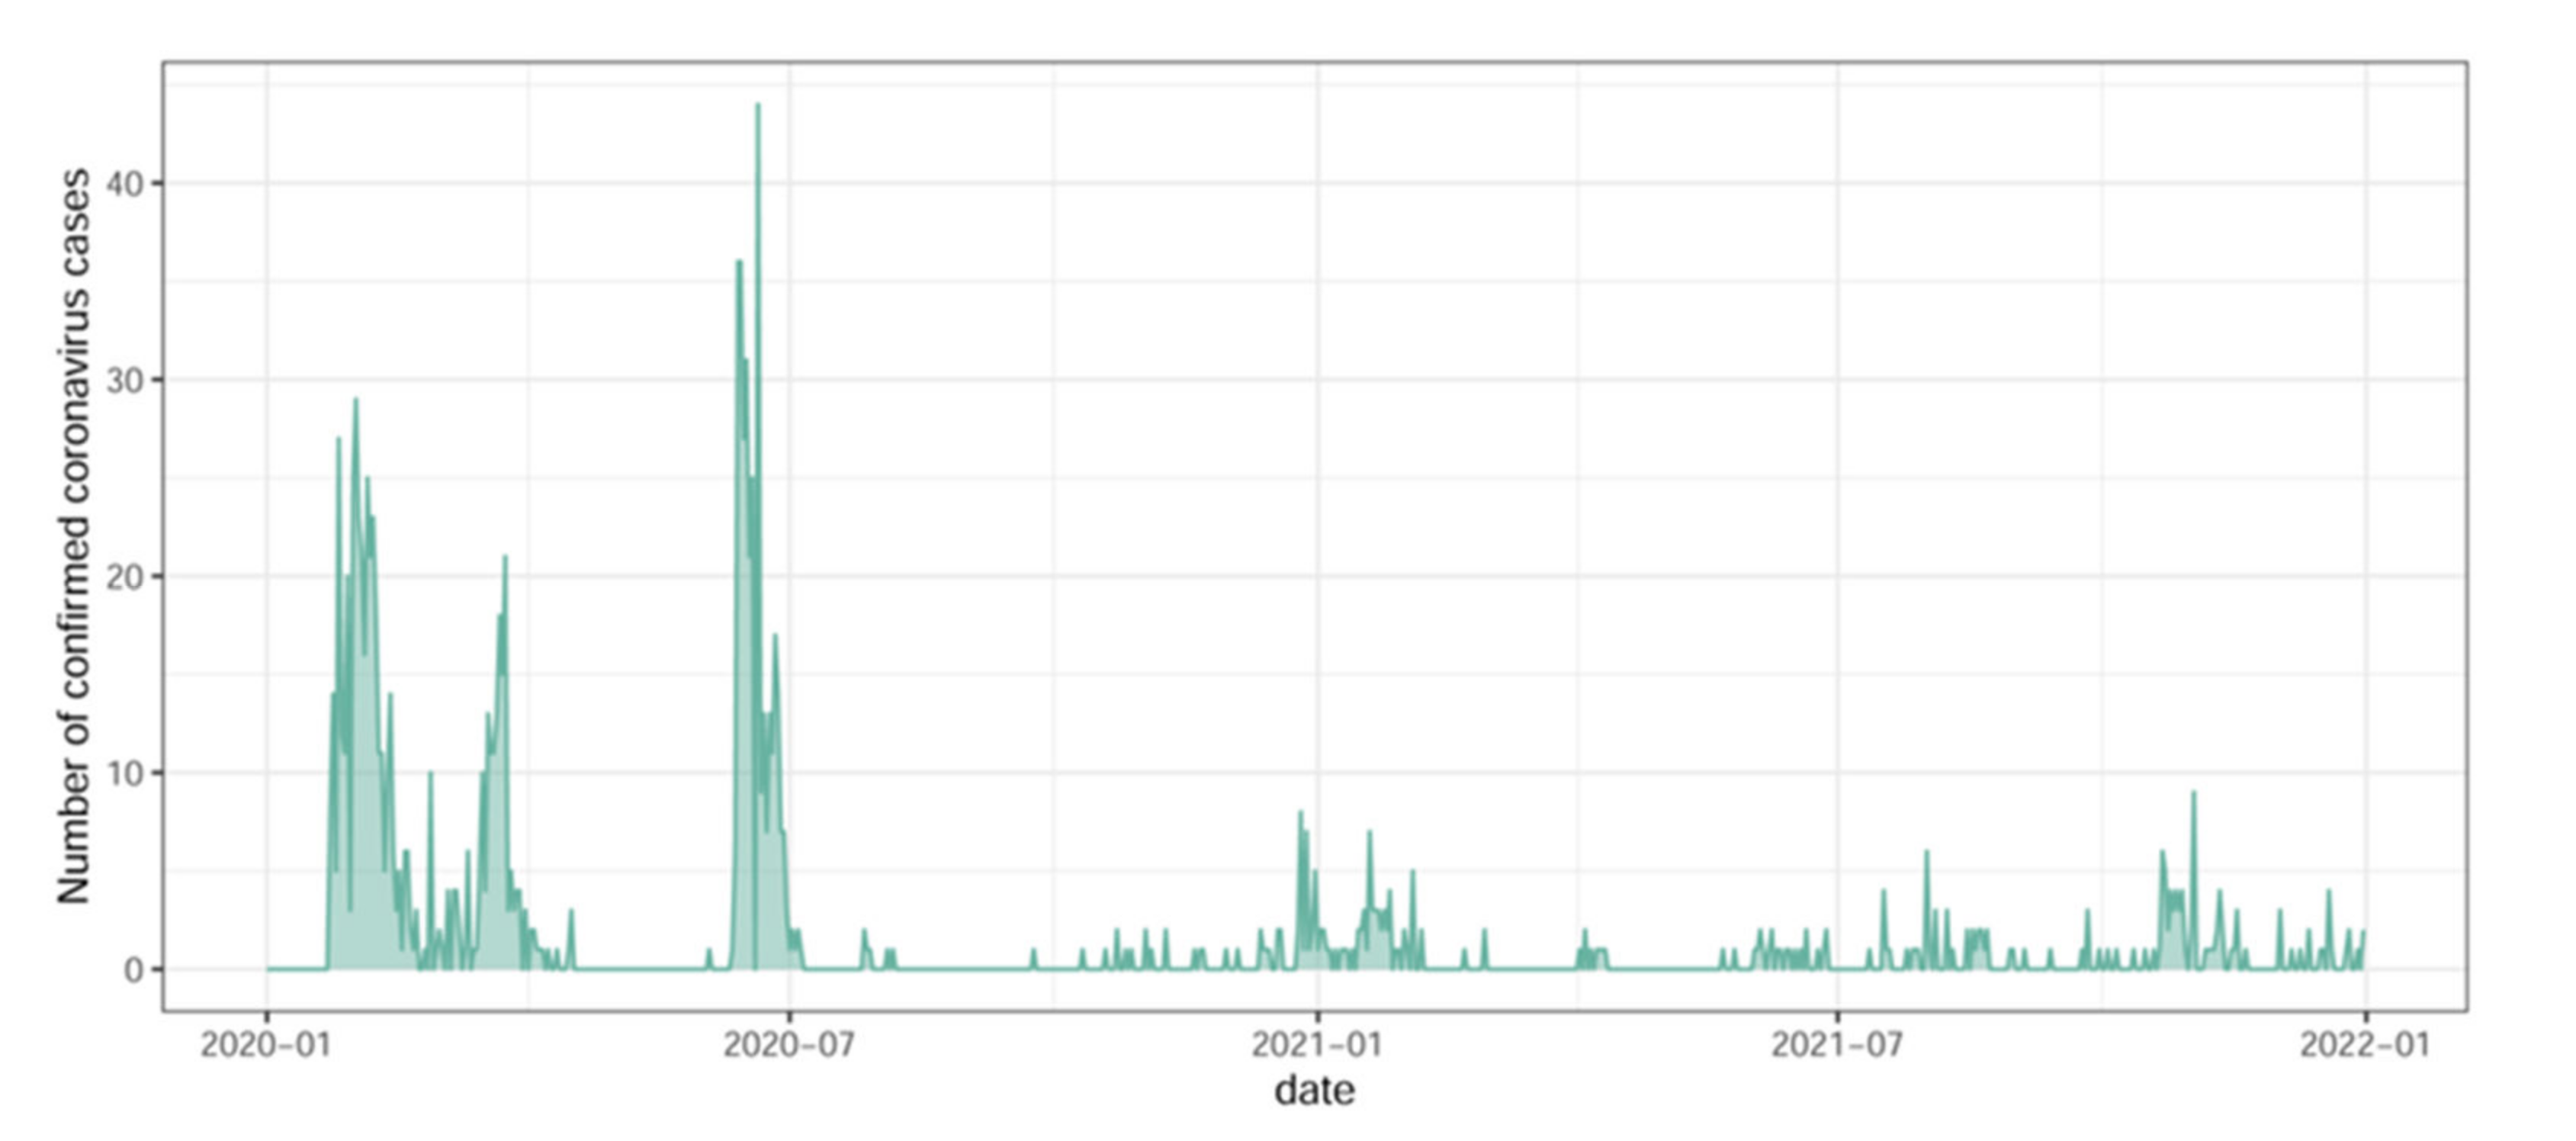
3.3. Analysis of the Influence of COVID-19 on AQI Periodic Conformance Based on DTW

In this study, the phase difference in the periodicities was calculated on the basis of the results of periodic conformance (Appendix E, Figure A3). The DTW method was used to compare the phase difference between 2020 and 2021 with that between 2020 and 2019 to determine whether COVID-19 changed the AQI periodic conformance between cities. DTW was used to determine the distance between the phase differences before and after the epidemic from a dynamic perspective. The influence of the epidemic on the periodic conformance between cities was estimated based on the change in the shortest distance between two phase differences. Since the Chinese government adopted the dynamic zero-COVID policy and the outbreak of the epidemic was discontinuous, this study, according to the outbreak of the epidemic in Figure 3, mainly focused on the changes of periodic conformance in the three periods including 23 January 2020~16 April 2020 (Day: 23~107), 11 June 2020~5 July 2020 (Day: 163~187), and 12 December 2020~28 February 2021 (Day: 1~59). To determine the changes in phase difference distance before and after the epidemic, the phase difference distance in the period of more severe epidemic (1 January 2021–28 February 2021 (Day: 1–59)) was selected as the analysis object.
Figure 6 shows the comparison results of the phase differences between cities. The closer the phase difference curves of the two cities, the smaller the impact of the epidemic. Therefore, it was used to verify whether COVID-19 changed the connections among the air quality of cities by figuring out whether there were sudden changes in the phase difference curves during the period when the epidemic was severe. The study compared the distance of phase differences of the above three periods. The results showed that the distances of phase differences between cities increased significantly during or near the periods of 23 January 2020~16 April 2020 and 11 June 2020–5 July 2020, and those also increased significantly from 12 December 2020 to 28 February 2021 except for the distance of phase differences between Chengde and Zhangjiakou. Therefore, the results of DTW analysis indicated that the epidemic led to a sudden change in the distances of phase differences in 2019, 2020, and 2021. The increase in the distances indicated that COVID-19 changed the connections among the air quality of Beijing and its neighboring cities.

3.4. Results of the Cointegration Test

In order to further test whether COVID-19 altered the periodic conformance be-tween the air quality in Beijing and neighboring cities, this study examined whether the epidemic changed the distance between the phase differences based on a linear cointegration model. This study tested whether the number of confirmed cases in the city was cointegrated with the distance between the phase differences of 2020 and 2019 and with that between the phase differences of 2021 and 2019, respectively. The month dummy variables are introduced into Equation (8), the coefficients of the variables in Equation (8) are calculated with the least square method, and the two hypotheses of the cointegration test are examined with the Wald test, respectively. Since Chengde and Zhangjiakou have no confirmed cases in 2021, collinearity appeared in the model. Thus, the variables of confirmed cases in these two cities are removed from the model. This study employed the Bayesian information criterion (BIC) to select the lag order of the model. The results of cointegration test showed that a cointegration relationship existed between the confirmed cases and distance between the phase differences in all the paired cities in 2020 and 2021 except for Beijing and Chengde in 2020 (Table 1). The cointegration relationship for Beijing and Chengde in 2020 is not significant since no confirmed cases were reported in Chengde and Zhangjiakou in 2020. The results suggest that there existed a stable relationship between the changes in confirmed cases and the changes in the distance between the phase differences of the cities, which means that the distance between the phase differences and the epidemic presented a common trend.

4. Discussion

The results of continuous wavelet transform analysis showed that COVID-19 changed the connections among the air quality of Beijing and its neighboring cities. This indicates that extreme pollution events in the region can be prevented by adopting joint prevention and control policies. The periodic variation characteristics of air quality reflect the variation characteristics of air pollutions, so an understanding of the periodic variation characteristics of air quality could assist the government in formulating effective joint pollution prevention and control policies. The analysis results of the periodicities showed that evident periodic variations in air quality in Beijing and its neighboring cities generally occurred in January~June and November~December each year, and most periodicities had a length of one to four weeks. This indicates that seasonal periodicity presents in the air quality variations in Beijing and its neighboring cities. This is mainly caused by the emissions increase for heating in winter and low precipitation in winter and spring in the region. Moreover, the meteorological conditions in the region are not conducive to pollutant diffusion [8,34,35]. The outbreak of COVID-19 and the following strict epidemic prevention and control measures made the periodicities with a length of more than 4 weeks in all the six cities insignificant while these periodicities became significant in 2021. This indicates that the epidemic changed the periodic pattern of the air-quality variations in Beijing and its neighboring cities. This is mainly due to the sharp reduction in pollutant emissions from human economic and social activities as a result of the strict epidemic prevention and control policies adopted during the outbreak of COVID-19. In other words, the control of human economic and social activities can reduce the periodic changes in air pollutants.
The analysis results of periodic conformance showed that the level of conformance of AQI periodicities between Beijing and its upwind cities including Zhangjiakou and Chengde was low, while that between Beijing and its downwind cities including Tianjin, Langfang, and Baoding was high. The 4-week periodicities for upwind cities showed high-level conformance. The periodic variations in air quality of downwind cities (Langfang–Tianjin and Baoding–Langfang) present high-level conformance. However, the periodic conformance between downwind and upwind cities (Baoding–Zhangjiakou) was low. This indicates that the connections of air quality periodicities mainly exist between Beijing and its downwind cities and between downwind cities (Tianjin, Langfang, and Baoding). From the perspective of economic development, the GDPs of Tianjin, Baoding, and Langfang were CNY 1570, 335.33, and 333.01 billion in 2020, respectively, much higher than that of Zhangjiakou (CNY 160.01 billion) and Chengde (CNY 155.03 billion). Similarly, the industrial value-added of the secondary industry in upwind cities including Tianjin, Baoding, and Langfang was CNY 480.41, 132.22, and 102.22 billion, respectively, while that in the downwind cities including Zhangjiakou and Chengde was only CNY 49.75 and 43.09 billion, respectively. Thus, the upwind cities of Beijing, Tianjin, Baoding, and Langfang with dense populations and vast industrial systems constitute the core area of the Beijing–Tianjin–Hebei metropolitan agglomeration and form a close connection in air quality. This result is consistent with that of Zaręba and Danek (2022) [18]. The periodic conformance of air quality between upwind cities is mainly caused by meteorological factors [18], while that between Beijing and downwind cities is more affected by human economic activities and industrial structure.
The analysis results of the impact of the COVID-19 epidemic on the periodic conformance showed that the epidemic weakened the connections among the air quality periodicities between Beijing and its neighboring cities. The empirical analysis showed that there existed a cointegration relationship between the number of confirmed cases and the distance between the phase differences, which means that the epidemic altered the periodic relationship between the air quality of the cities. This is mainly manifested in the significant change in the level of periodic conformance between Beijing and its upwind cities caused by the epidemic. At the same time, the epidemic led to a significant increase in the distance of phase differences between the cities. This further suggests that the occurrence of extreme pollution events can be reduced by effective control of pollutant diffusion with joint prevention and control policies considering the connections among the air quality of Beijing and its neighboring cities. Therefore, those in charge of environmental protection should comprehensively consider the periodic patterns of air quality and diffusion characteristics of pollutants in formulating joint air pollution prevention and control policies and should take appropriate measures to minimize their impacts on economic growth and human life. The outbreak of COVID-19 and corresponding epidemic prevention and control policies did reduce the diffusion of air pollutants between cities [9]. However, different from Rudke et al. (2022), this study showed that the decrease in pollutants was more obvious in upwind cities, while the impact was low on the downwind cities [9]. This is mainly caused by the significant decline in pollutant emissions as a result of a sharp reduction in human economic and social activities in the upwind cities since the outbreak of COVID-19. Furthermore, the connections between the air quality of Beijing and its upwind cities are weakened. Since the epidemic became severe in the early outbreak and July of 2020, when the meteorological conditions were not conducive for pollutant diffusion, the impact of the epidemic on the periodic conformance between the downwind cities was relatively low.

5. Conclusions

This study employed continuous wavelet transform and DTW methods to examine whether the COVID-19 epidemic altered the connections between the periodicities of the air quality of Beijing and its neighboring cities from a dynamic periodic variation perspective. The patterns of periodic variations in the air quality of Beijing and its neighboring cities, the periodic conformance in their air quality periodicities, and the distance variation characteristics of the phase differences of the periodic conformance before and after the epidemic were analyzed. The results showed that the air quality of Beijing was mainly affected by its downwind cities, while the impacts from upwind cities were relatively small. Beijing and its downwind cities had close connections in air quality. This adds to the fast diffusion of air pollutants among the cities. Furthermore, the results of the periodic variation analysis suggested that the COVID-19 epidemic weakened the periodic changes in the air quality of Beijing and its upwind cities and generated less influence on the periodic changes in air quality in the downwind cities. The results of the periodic conformance test revealed that the epidemic affected the periodic conformance of air quality between Beijing and its upwind cities but imposed limited impacts on that between Beijing and its downwind cities. On the other hand, the analysis of the phase difference of periodic conformance showed that the epidemic increased the distance between the phase difference of air quality periodicities between cities before and after the outbreak of the epidemic, and the distance of phase difference presented sudden increases during periods with severe epidemic situations. Therefore, the COVID-19 epidemic altered the connections among the air quality of Beijing and its neighboring cities.

Author Contributions

Conceptualization, M.Z. and G.D.; methodology, J.D.; software, G.D.; formal analysis, J.D.; data curation, M.Z. and J.D.; writing—original draft preparation, M.Z. and G.D.; writing—review and editing, Q.L. and G.D.; supervision, Q.L. All authors have read and agreed to the published version of the manuscript.

Funding

This research was funded by Zhejiang Soft Science Research Program, grant number 2022C35011.

Data Availability Statement

Publicly available datasets were analyzed in this study. The AQI data can be found here: http://www.cnemc.cn/, accessed on 29 June 2022.

Conflicts of Interest

The authors declare no conflict of interest.

Appendix A

The calculation of the Chinese air quality index was based on the Chinese Ambient Air Quality Standard (GB3095-2012) and Technical Regulations on Ambient Air Quality Index (on trial) (HJ 633-2012). The index covers six major air pollutants including SO2, PM10, PM2.5, CO, NO2, and O3. The sub-index of AQI was calculated based on the concentration of each category of pollutant (Equation (A1)), and the maxima of the six sub-indices was used as the final value of AQI.
I A Q I P = I A Q I H i I A Q I L 0 B P H i B P L 0 ( C P B P L 0 ) + I A Q I L 0

Appendix B

Table A1. Statistical results of AQI of Beijing and its neighboring cities.
CityYearMedianMeanStandard Deviation
BD201975.12590.77557.010
BD202065.10478.96850.657
BD202164.91777.85145.998
BJ201962.29270.52239.243
BJ202055.56563.68538.663
BJ202149.41763.02846.466
CD201949.12556.65725.565
CD202046.75052.64324.464
CD202145.33355.74533.206
LF201966.20876.46544.165
LF202061.41770.41741.212
LF202158.54269.77839.897
TJ201971.00082.57947.030
TJ202064.74575.66144.212
TJ202158.04270.34442.588
ZJK201948.20854.77126.038
ZJK202042.75051.00826.687
ZJK202143.83354.57941.647
Note: R calculation results. BD, BJ, CD, LF, TJ and ZJK are abbreviations for Baoding, Beijing, Chengde, Langfang, Tianjin and Zhangjiakou, respectively.

Appendix C

Figure A1. Relationship between AQI of Beijing and that of cities around Beijing. Note: red lines: linear regression fitted lines; dash lines: 95% confidence intervals for linear regression; thick dash lines: smooth fitted lines.
Atmosphere 13 01188 g0a1

Appendix D

Figure A2. Average cross-wavelet power. Note: the red dots are at the 5% significance level. (a) Beijing–Zhangjiakou. (b) Beijing–Chengde. (c) Beijing–Tianjin. (d) Beijing–Langfang. (e) Beijing–Baoding. (f) Chengde–Zhangjiakou. (g) Tiannjin–Chengde. (h) Langfang–Tiannjin. (i) Baoding–Langfang. (j) Baoding–Zhangjiakou.
Atmosphere 13 01188 g0a2aAtmosphere 13 01188 g0a2b

Appendix E

Figure A3. The phase difference. Note: The horizontal axis is time and the vertical axis is the periodicity length in weeks. The phase difference ranges from blue (-π) to red (π), which represents the characteristics of phase difference (see Equation (5)). The white contour marks the 5% significance level estimated from Monte Carlo simulations. (a) Beijing–Zhangjiakou. (b) Beijing–Chengde. (c) Chengde–Zhnagjiakou. (d) Beijing–Tianjin. (e) Beijing–Langfang. (f) Beijing–Baoding. (g) Langfang–Tianjin. (h) Baoding–Langfang. (i) Tianjin–Chengde. (j) Baoding–Zhangjiakou.
Atmosphere 13 01188 g0a3aAtmosphere 13 01188 g0a3b

References

  1. Zhao, B.; Xu, J.; Hao, J. Impact of energy structure adjustment on air quality: A ase study in Beijing, China. Front. Environ. Sci. Eng. China 2011, 5, 378–390. [Google Scholar] [CrossRef]
  2. Yan, D.; Lei, Y.; Shi, Y.; Zhu, Q.; Li, L.; Zhang, Z. Evolution of the spatiotemporal pattern of PM2.5 concentrations in China–A case study from the Beijing-Tianjin-Hebei region. Atmos. Environ. 2018, 183, 225–233. [Google Scholar] [CrossRef] [Green Version]
  3. Wang, Y.; Li, Y.; Qiao, Z.; Lu, Y. Inter-city air pollutant transport in the Beijing-Tianjin-Hebei urban agglomeration: Comparison between the winters of 2012 and 2016. J. Environ. Manag. 2019, 250, 109520. [Google Scholar] [CrossRef] [PubMed]
  4. Lokhandwala, S.; Gautam, P. Indirect impact of COVID-19 on environment: A brief study in indian context. Environ. Res. 2020, 9, 109807. [Google Scholar] [CrossRef] [PubMed]
  5. Ayesha, B.; Kumthekar, A.; Jain, R.; Patel, S.; Ramesh, M.; Ferastraoaru, D.E.; Hudes, G.; Karagic, M.; Zafar, S.; Bartash, R.; et al. Rapid Implementation of a Multidisciplinary COVID-19 Cytokine Stomm Syndrome Task Force. ACR Open Rheumatol. 2021, 3, 133–137. [Google Scholar] [CrossRef] [PubMed]
  6. Shen, L.; Zhao, T.; Wang, H.; Liu, J.; Bai, Y.; Kong, S.; Zheng, H.; Zhu, Y.; Shu, Z. Importance of meteorology in air pollution events during the city lockdown for COVID-19 in Hubei Province, Central China. Sci. Total Environ. 2021, 1, 142227. [Google Scholar] [CrossRef]
  7. Wang, C.; Horby, P.W.; Hayden, F.G.; Gao, G.F. A novel coronavirus outbreak of global health concern. Lancet 2020, 395, 470–473. [Google Scholar] [CrossRef] [Green Version]
  8. Tao, C.L.; Wheiler, K.; Yu, C.; Cheng, B.D.; Diao, G. Does the joint prevention and control regulation improve the air quality? A quasi-experiment in the Beijing economic belt during the COVID-19 pandemic. Sustain. Cities Soc. 2021, 75, 103365. [Google Scholar] [CrossRef]
  9. Rudke, A.P.; de Almeida, D.S.; Alves, R.A.; Beal, A.; Martins, L.D.; Martins, J.A.; Hallak, R.; de Almeida Albuquerque, T.T. Impacts of Strategic Mobility Restrictions Policies during 2020 COVID-19 Outbreak on Brazil’s Regional Air Quality. Aerosol Air Qual. Res. 2022, 22, 210351. [Google Scholar] [CrossRef]
  10. Lian, X.B.; Huang, J.P.; Huang, R.J.; Liu, C.W.; Wang, L.; Zhang, T.H. Impact of city lockdown on the air quality ofCOVID-19-hit of Wuhan city. Sci. Total Environ. 2020, 11, 140556. [Google Scholar] [CrossRef]
  11. Le, T.; Wang, Y.; Liu, L.; Yang, J.; Yung, J.; Li, G.; Seinfeld, J. Unexpected air pollution with marked emission reductions during the COVID-19 outbreak in China. Science 2020, 6504, 702–708. [Google Scholar] [CrossRef]
  12. Tobías, A.; Carnerero, C.; Reche, C.; Massagué, J.; Via, M.; Minguillón, M.C.; Alastuey, A.; Querol, X. Changes in air quality during the lockdown in Barcelona (Spain) one month into the SARS-CoV-2 epidemic. Sci. Total Environ. 2020, 7, 138540. [Google Scholar] [CrossRef]
  13. Shrestha, A.M.; Shrestha, U.B.; Sharma, R.; Bhattarai, S.; Tranet, H.N.T.; Rupakheti, M. Lockdown caused by COVID-19 pandemic reduces air pollution in cities worldwide. EarthArXiv 2020. [Google Scholar] [CrossRef]
  14. Venter, Z.S.; Aunan, K.; Chowdhury, S.; Lelieveld, J. COVID-19 lockdown cause global air pollution declines with implications for public health risk. Proc. Natl. Acad. Sci. USA 2020, 32, 18984–18990. [Google Scholar] [CrossRef]
  15. Othman, M.; Latif, M.T. Air pollution impacts from COVID-19 pandemic control strategies in Malaysia. J. Clean. Prod. 2021, 291, 125992. [Google Scholar] [CrossRef]
  16. Almond, D.; Du, X.M.; Zhang, S. Did COVID-19 Improve Air Quality Near HuBei? (No. W27086); National Bureau of Economic Research: Cambridge, MA, USA, 2020. [Google Scholar]
  17. Zhao, X.; Shen, N.C.; Li, L.J.; Wu, J.F.; Tao, J.; Zhao, W.J. Analysis on changes and influencing factors of air pollutants in Beijing-Tianjin-Hebei region during COVID-19 epidemic. Environ. Sci. 2021, 42, 1–15. (In Chinese) [Google Scholar]
  18. Zaręba, M.; Danek, T. Analysis of Air Pollution Migration during COVID-19 Lockdown in Krakow, Poland. Aerosol Air Qual. Res. 2022, 22, 210275. [Google Scholar] [CrossRef]
  19. He, G.J.; Pan, Y.H.; Tanaka, T. The short-term impacts of COVID-19 lockdown on urban air pollution in China. Nat. Sustain. 2020, 3, 1005–1011. [Google Scholar] [CrossRef]
  20. Kermani, M.; Dowlati, M.; Ahmad Jaffari, A.J.; Kalantari, R.R. A Study on the Comparative Investigation of Air Quality in Tehran Metropolis Over a Five-year Period Using Air Quality Index (AQI). J. Commun. Health 2016, 2, 28–36. [Google Scholar]
  21. Tong, Z.; Chen, Y.; Malkawi, A.; Liu, Z.; Freeman, R.B. Energy saving potential of natural ventilation in China: The impact ofambient air pollution. Appl. Energy 2016, 179, 660–668. [Google Scholar] [CrossRef] [Green Version]
  22. Kyrkilis, G.; Chaloulakou, A.; Kassomenos, P.A. Development of an aggregate Air Quality Index for an urban Mediterranean agglomeration: Relation to potential health effects. Environ. Int. 2007, 33, 670–676. [Google Scholar] [CrossRef]
  23. Li, J.; Jin, Z.F.; Yuan, Q.M. Kuznets curve and influencing factors of air quality environment in Beijing-Tianjin-Hebei region: Analysis based on panel data from 2006 to 2017. Ecol. Econ. 2019, 35, 197–201. (In Chinese) [Google Scholar]
  24. Li, X.; Qiao, Y.; Zhu, J.; Shi, L.; Wang, Y. The “APEC blue” endeavor: Causal effects of air pollution regulation on air quality in China. J. Clean. Prod. 2017, 168, 1381–1388. [Google Scholar] [CrossRef]
  25. Halim, N.D.A.; Latif, M.T.; Mohamed, A.F. Spatial assessment of land use impact on air quality in mega urban regions. Malaysia. Sustain. Cities Soc. 2020, 63, 102436. [Google Scholar] [CrossRef]
  26. Zheng, G.J.; Duan, F.K.; Su, H.; Ma, Y.L.; Cheng, Y.; Zheng, B.; He, K.B. Exploring the severe winter haze in Beijing: The impact of synoptic weather, regional transport and heterogeneous reactions. Atmos. Chem. Phys. 2015, 15, 2969–2983. [Google Scholar] [CrossRef] [Green Version]
  27. Sathe, Y.; Gupta, P.; Bawase, M.; Lamsal, L.; Patadia, F.; Thipse, S. Surface and satellite observations of air pollution in India during COVID-19 lockdown: Implication to air quality. Sustain. Cities Soc. 2021, 66, 102688. [Google Scholar] [CrossRef]
  28. Aguiar-Conraria, L.; Soares, M.J. Business cycle synchronization and the Euro: A wavelet analysis. J. Macroecon. 2011, 33, 477–489. [Google Scholar] [CrossRef]
  29. Anh, D.T.; Thanh, L.H. An efficient implementation of k-means clustering for time series data with DTW distance. Int. J. Bus. Intell. Data Min. 2015, 10, 213–232. [Google Scholar] [CrossRef]
  30. Keogh, E.; Ratanamahatana, C.A. Exact indexing of dynamic time warping. Knowl. Inf. Syst. 2005, 7, 358–386. [Google Scholar] [CrossRef]
  31. Giorgino, T. Computing and Visualizing Dynamic Time Warping Alignments in R: The dtw Package. J. Stat. Softw. 2009, 31, 1–25. [Google Scholar] [CrossRef] [Green Version]
  32. Pesaran, M.H.; Shin, Y.; Smith, R.J. Bounds testing approaches to the analysis of level relationships. J. Appl. Econ. 2001, 16, 289–326. [Google Scholar] [CrossRef]
  33. Romilly, P.; Song, H.; Liu, X. Car ownership and use in Britain: A comparison of the empirical results of alternative cointegration estimation methods and forecasts. Appl. Econ. 2001, 33, 1803–1818. [Google Scholar] [CrossRef]
  34. Tao, C.L.; Li, L.C.; Hu, M.X.; Cheng, B.D.; Diao, G. Can Industrial Restructuring Improve Urban Air Quality?—A Quasi-Experiment in Beijing during the COVID-19 Pandemic. Atmosphere 2022, 13, 119. [Google Scholar] [CrossRef]
  35. Wu, B.; Liu, C.; Zhang, J.; Du, J.; Shi, K. The multifractal evaluation of PM2.5-O3 coordinated control capability in China. Ecol. Indic. 2021, 129, 107877. [Google Scholar] [CrossRef]
Figure 1. Beijing and its neighboring cities.
Atmosphere 13 01188 g001
Figure 2. Variation of air quality index (AQI) in Beijing and its neighboring cities. Note: cool color denotes the extent to which AQI increases and warm color denotes the extent to which AQI decreases.
Atmosphere 13 01188 g002
Figure 3. Number of confirmed COVID-19 cases.
Atmosphere 13 01188 g003
Figure 4. Results of periodic variation characteristics of AQI of Beijing and its neighboring cities. Note: the horizontal axis is time and the vertical axis is the periodicity length in weeks. The wavelet power spectrum is represented by the change from blue (low power) to red (high power). The black lines show the maxima of the undulations of the wavelet power spectrum. The white shade contour designates the cone of influence, which indicates the region affected by edge effects. The white contour inside the white shade contour marks the 5% significance level estimated from Monte Carlo simulations. (a) Beijing. (b) Tianjin. (c) Zhangjiakou. (d) Chengde. (e) Baoding. (f) Langfang.
Atmosphere 13 01188 g004
Figure 5. Periodic conformance test results of AQI variations in Beijing and its neighboring cities. Note: Wavelet coherency ranges from blue (low coherency) to red (high coherency). The white shade contour designates the cone of influence, which indicates the region affected by edge effects. The white contour inside the white shade contour marks the 5% significance level estimated from Monte Carlo simulations. (a) Beijing–Zhangjiakou. (b) Beijing–Chengde. (c) Chengde–Zhangjiakou. (d) Beijing–Tianjin. (e) Beijing–Langfang. (f) Beijing–Baoding. (g) Langfang–Tiannjin. (h) Baoding–Langfang. (i) Tianjin–Chengde. (j) Baoding–Zhangjiakou.
Atmosphere 13 01188 g005aAtmosphere 13 01188 g005b
Figure 6. Cost density plot: average per-step cost density of the sine–cosine global alignment. Note: the color filling represents the position of the match of DTW, and the blue line represents the shortest distance. The study took 2019 (before the epidemic) as the reference for comparison and compared 2020 with 2021 and 2019, respectively. The horizontal and vertical axes represent the day of the year (1–365).
Atmosphere 13 01188 g006
Table 1. Cointegration test on the COVID-19 epidemic and the distance between phase differences.
Relation 20202021
Beijing–ZhangjiakouTest1: F = 8.351 ***
Test2: t = −4.662 ***
Test1: F = 23.827 ***
Test2: t = −6.836 ***
Beijing–ChengdeTest1: F = 6.602 ***
Test2: t = −1.579 *
Test1: F = 22.813 ***
Test2: t = −6.418 ***
Chengde–ZhangjiakouTest1: F = 17.959 ***
Test2: t = −7.035 ***
Beijing–TianjinTest1: F = 6.363 ***
Test2: t = −3.945 ***
Test1: F = 5.657 ***
Test2: t = −2.232 **
Beijing–LangfangTest1: F = 18.124 ***
Test2: t = −6.449 ***
Test1: F = 22.595 ***
Test2: t = −6.4982 ***
Beijing–BaodingTest1: F = 12.727 ***
Test2: t = −5.909 ***
Test1: F = 7.263 ***
Test2: t = −4.6333 ***
Langfang–TiannjinTest1: F = 6.363 ***
Test2: t = −3.945 ***
Test1: F = 13.91872 ***
Test2: t = −6.439 ***
Tianjin–ChengdeTest1: F = 23.623 ***
Test2: t = −7.467 ***
Test1: F = 21.828 ***
Test2: t = −6.539 ***
Baoding–ZhangjiakouTest1: F = 15.362 ***
Test2: t = −6.726 ***
Test1: F = 13.365 ***
Test2: t = −5.148 ***
Note: *: Significant at the 10% level; **: Significant at the 5% level; ***: Significant at the 1% level.
Publisher’s Note: MDPI stays neutral with regard to jurisdictional claims in published maps and institutional affiliations.

