
Spatiotemporal Variations and Climatological Trends in Precipitation Indices in Shaanxi Province, China


Abstract
:1. Introduction
2. Materials and Methods
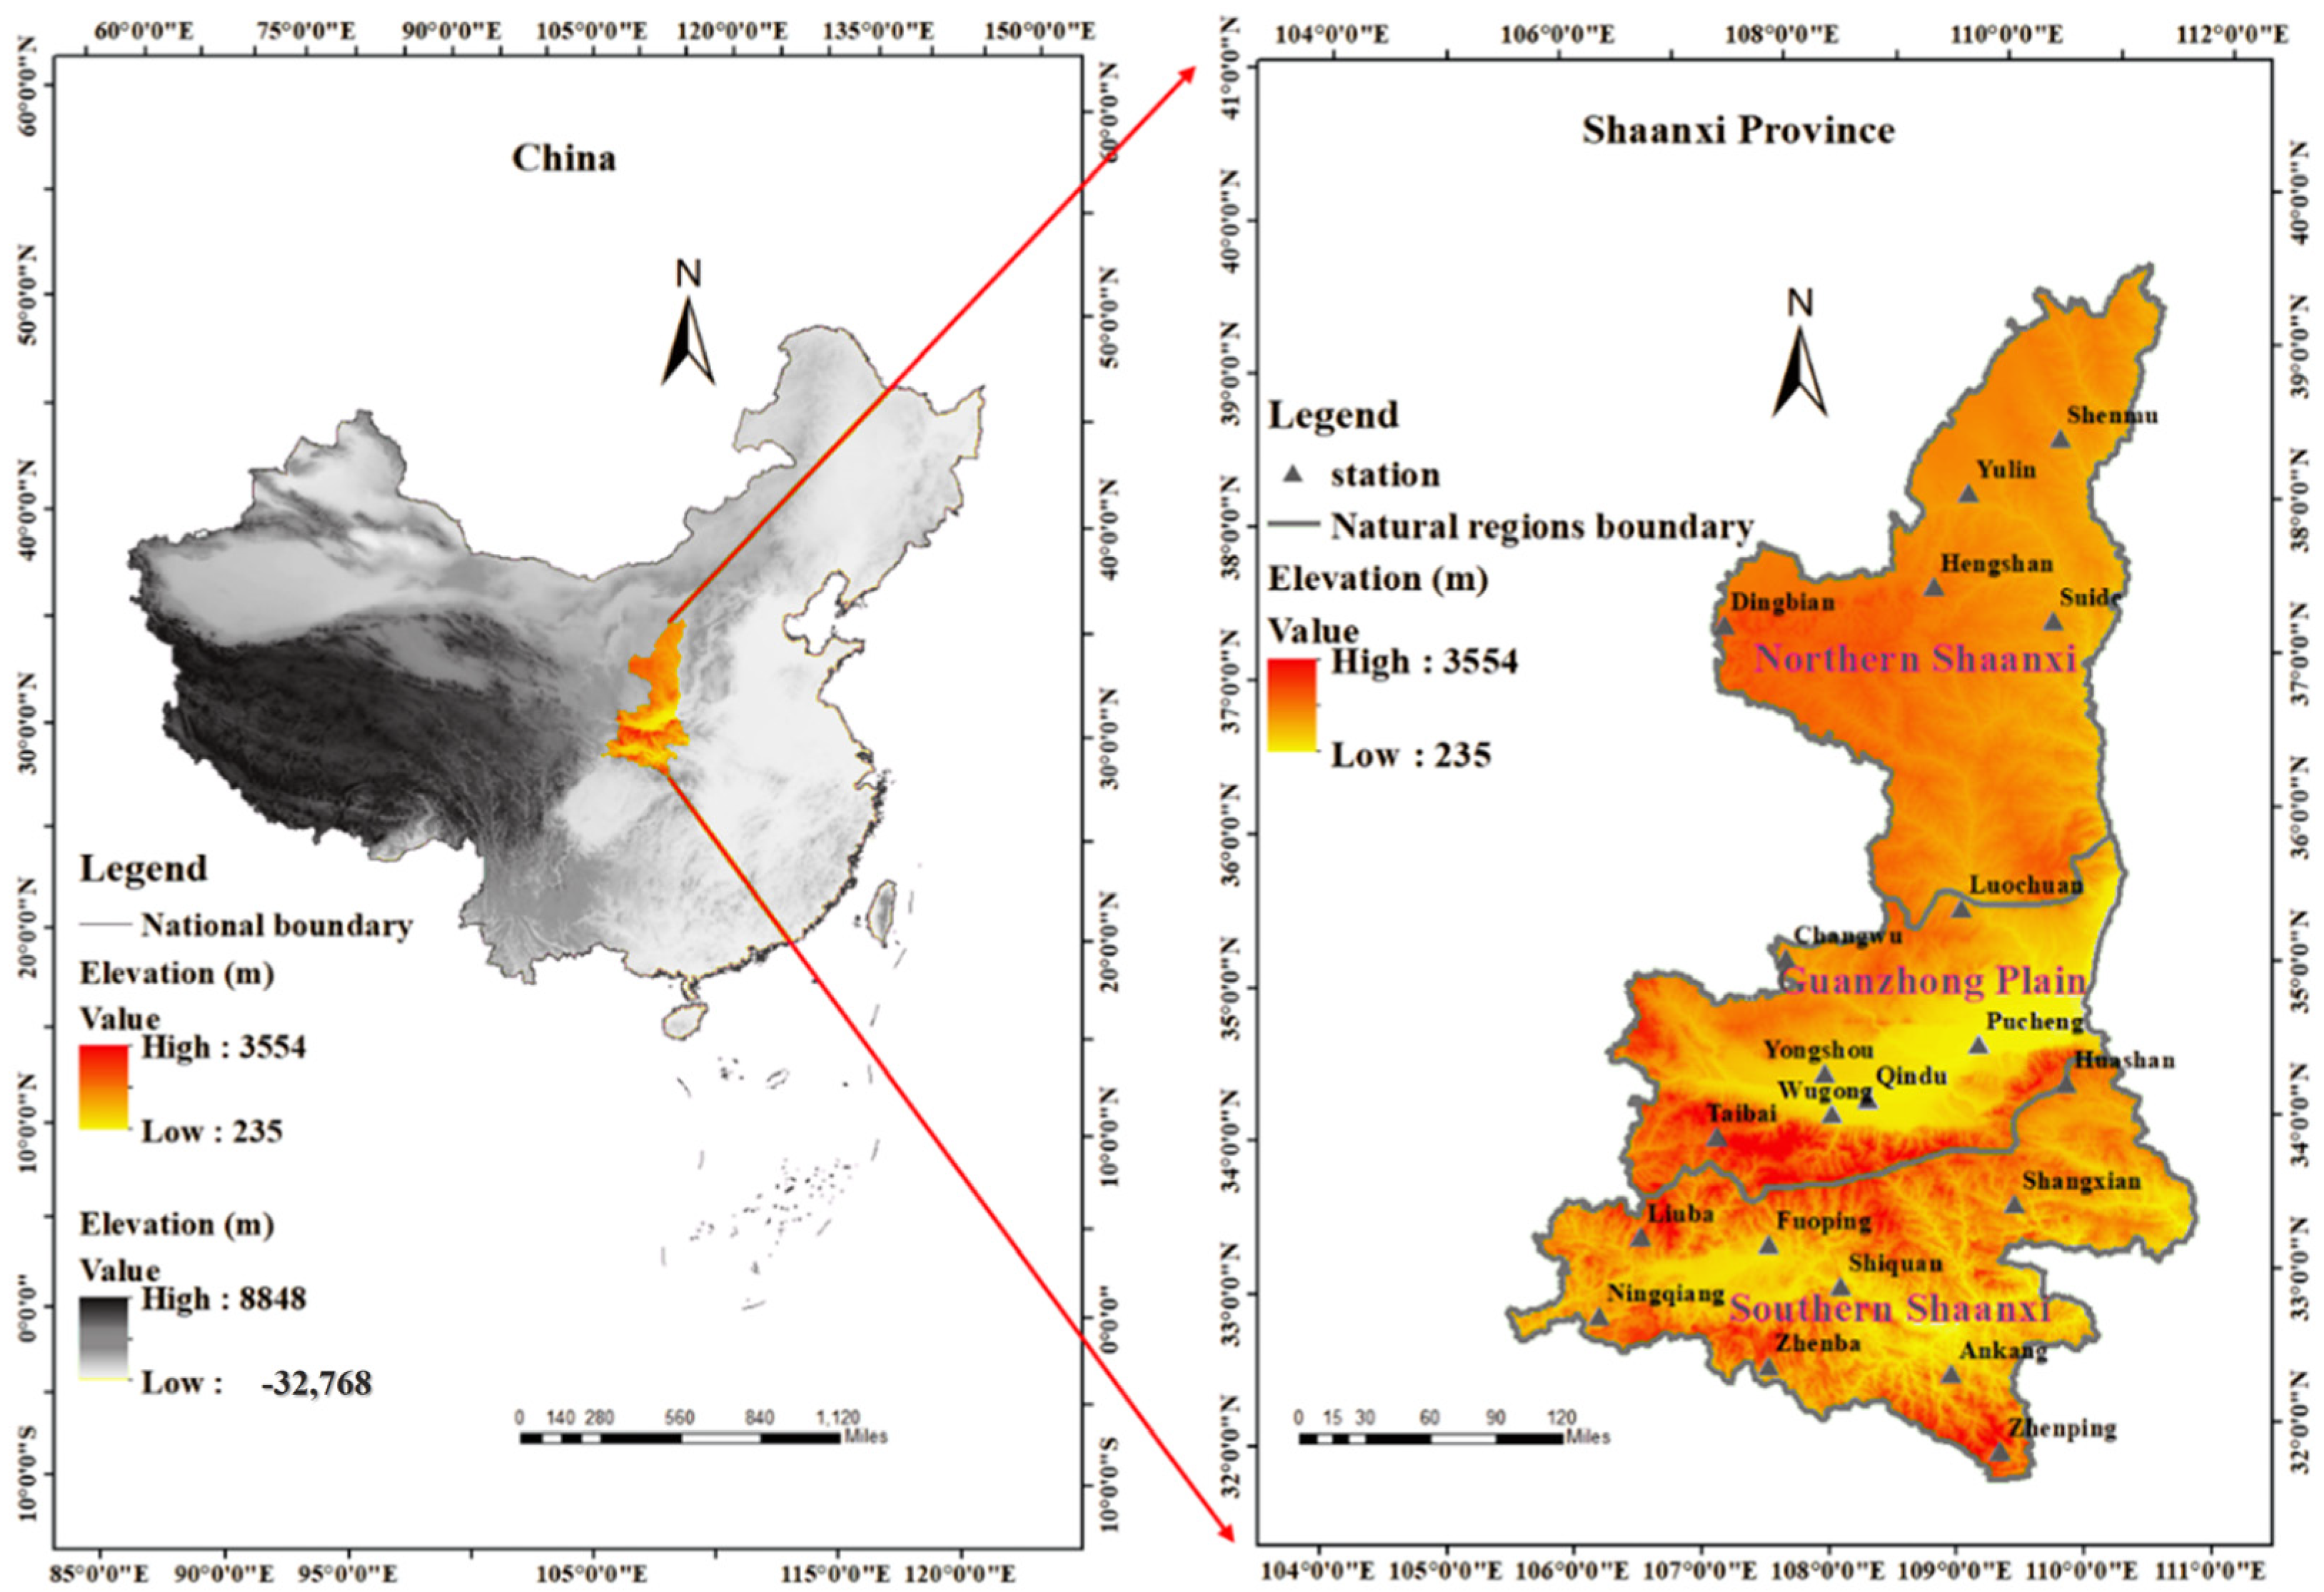
2.1. Study Area
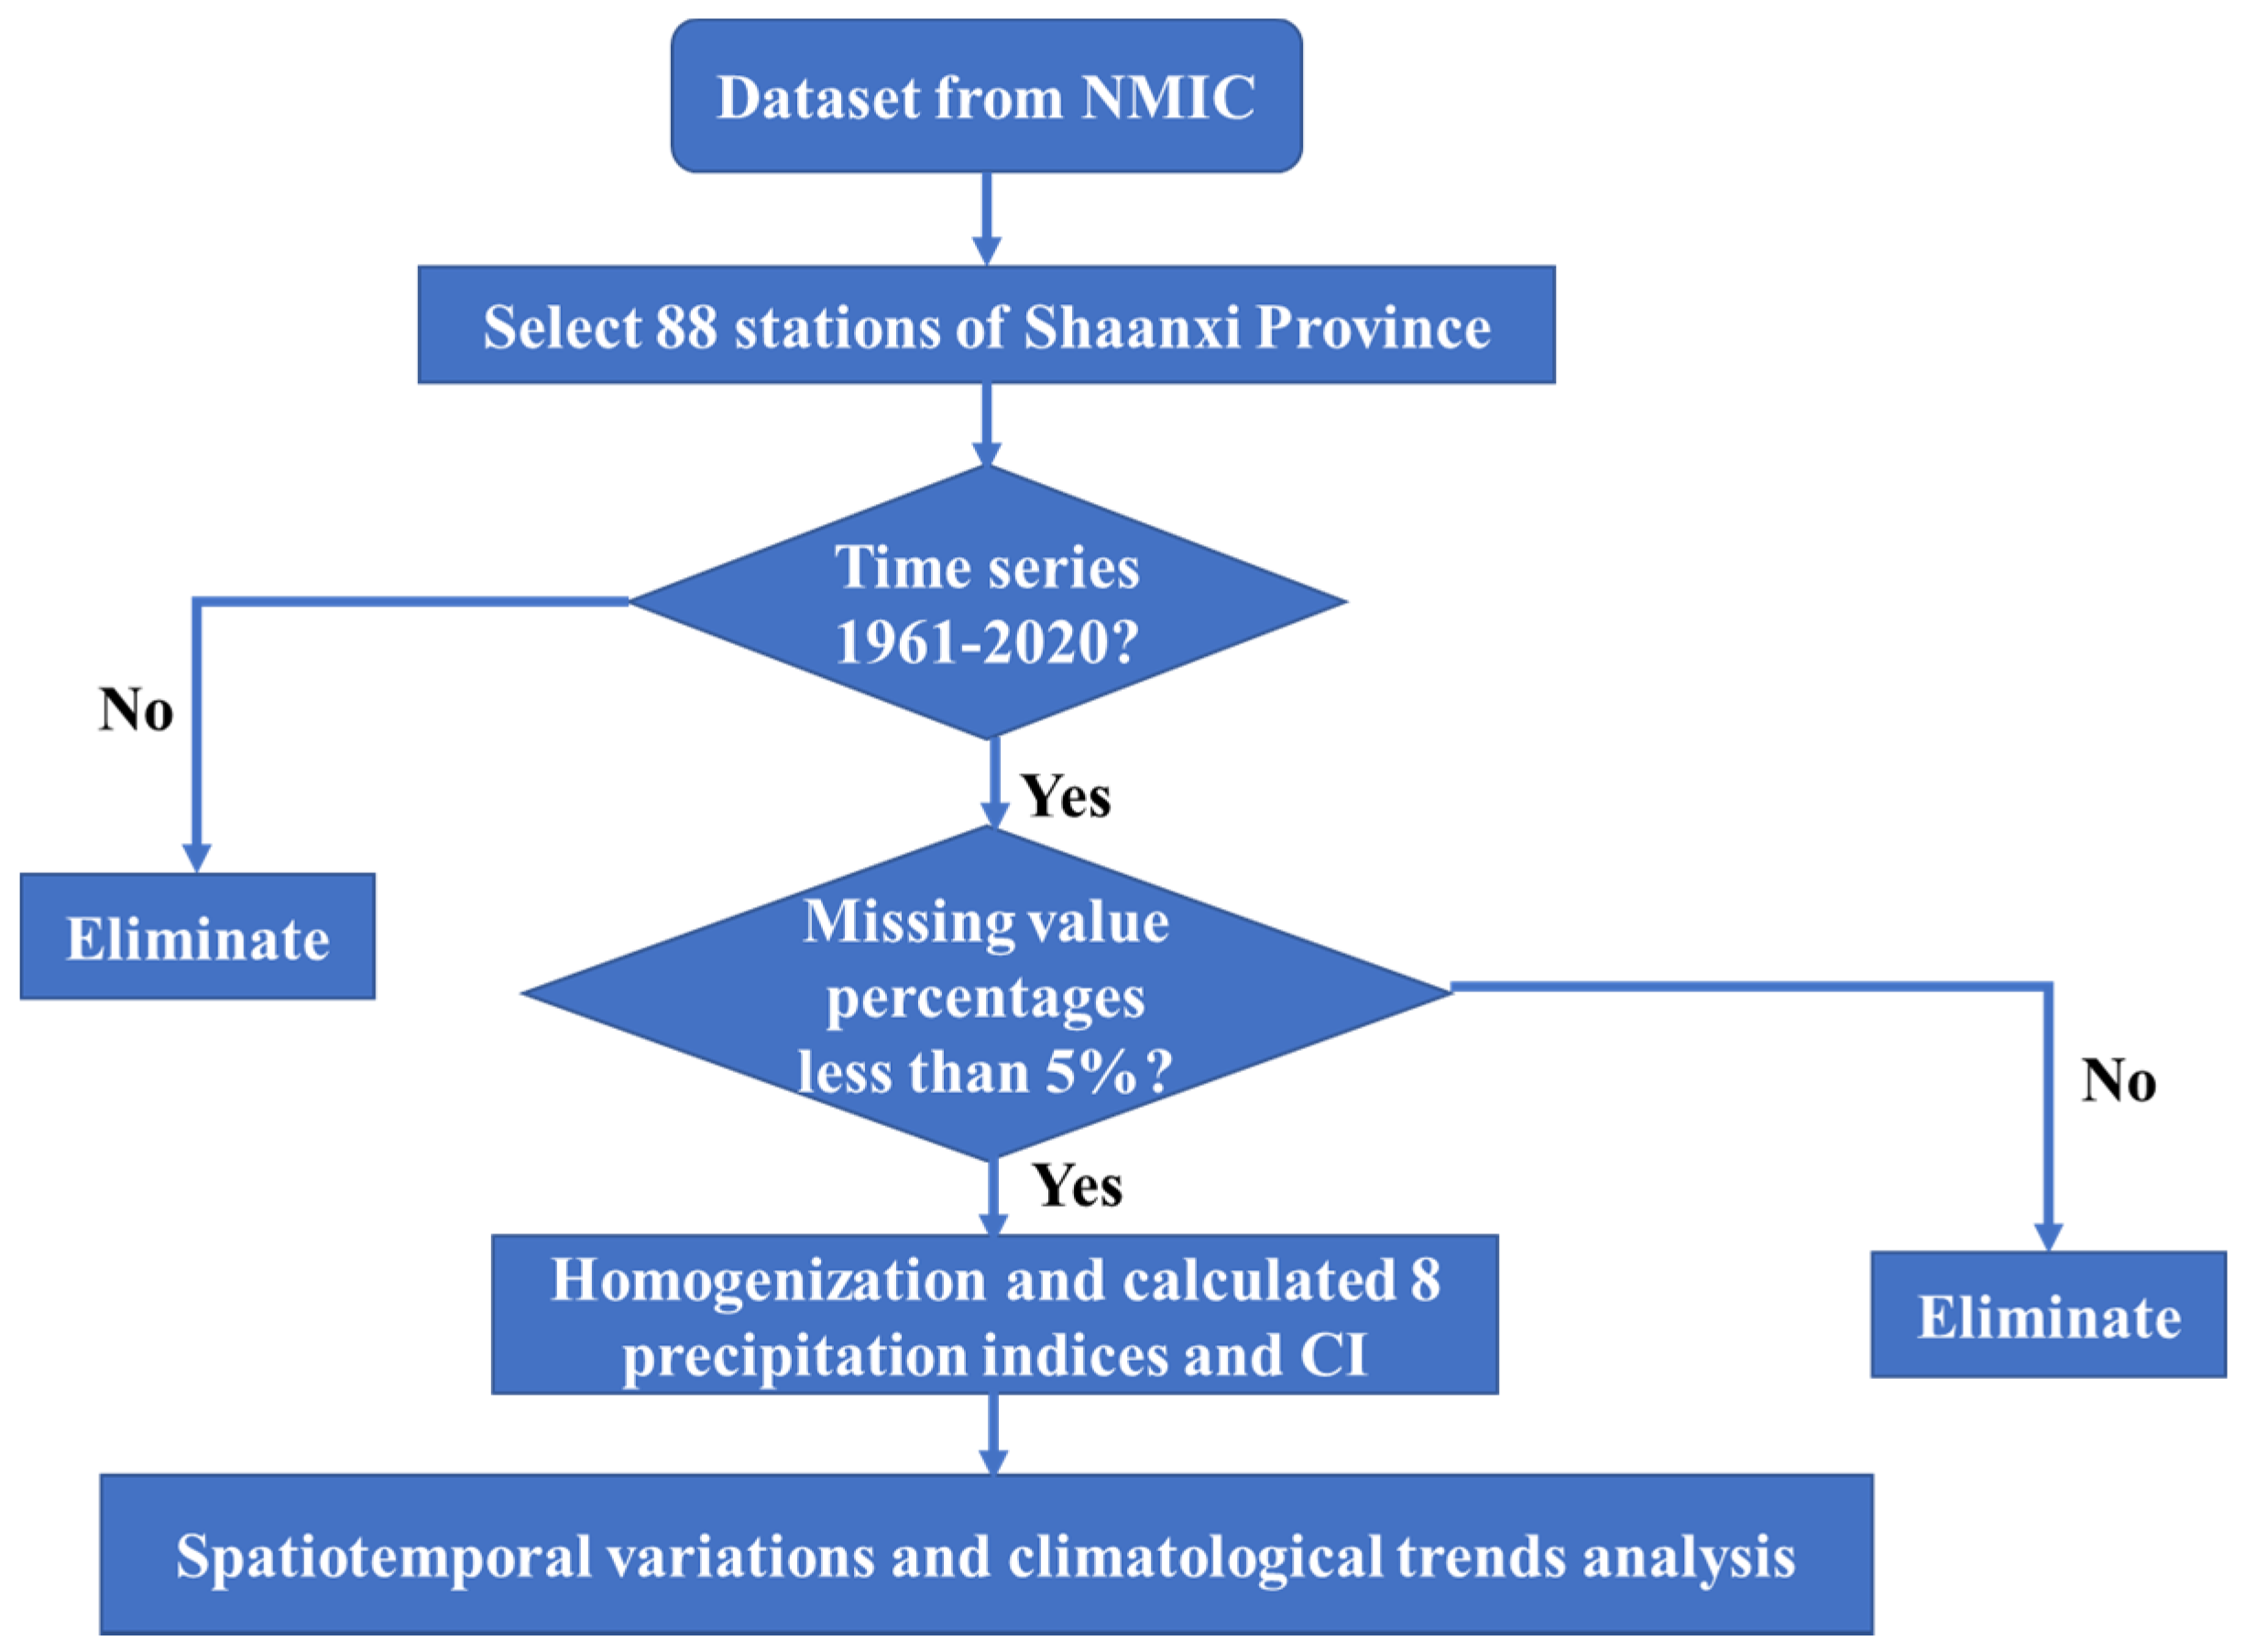
2.2. Data
2.3. Homogenization of Data
2.4. Methods
2.4.1. Extreme Precipitation Indices
2.4.2. Concentration Index (CI)
2.4.3. Trend Test Methods
2.4.4. Spatial Interpolation
3. Result
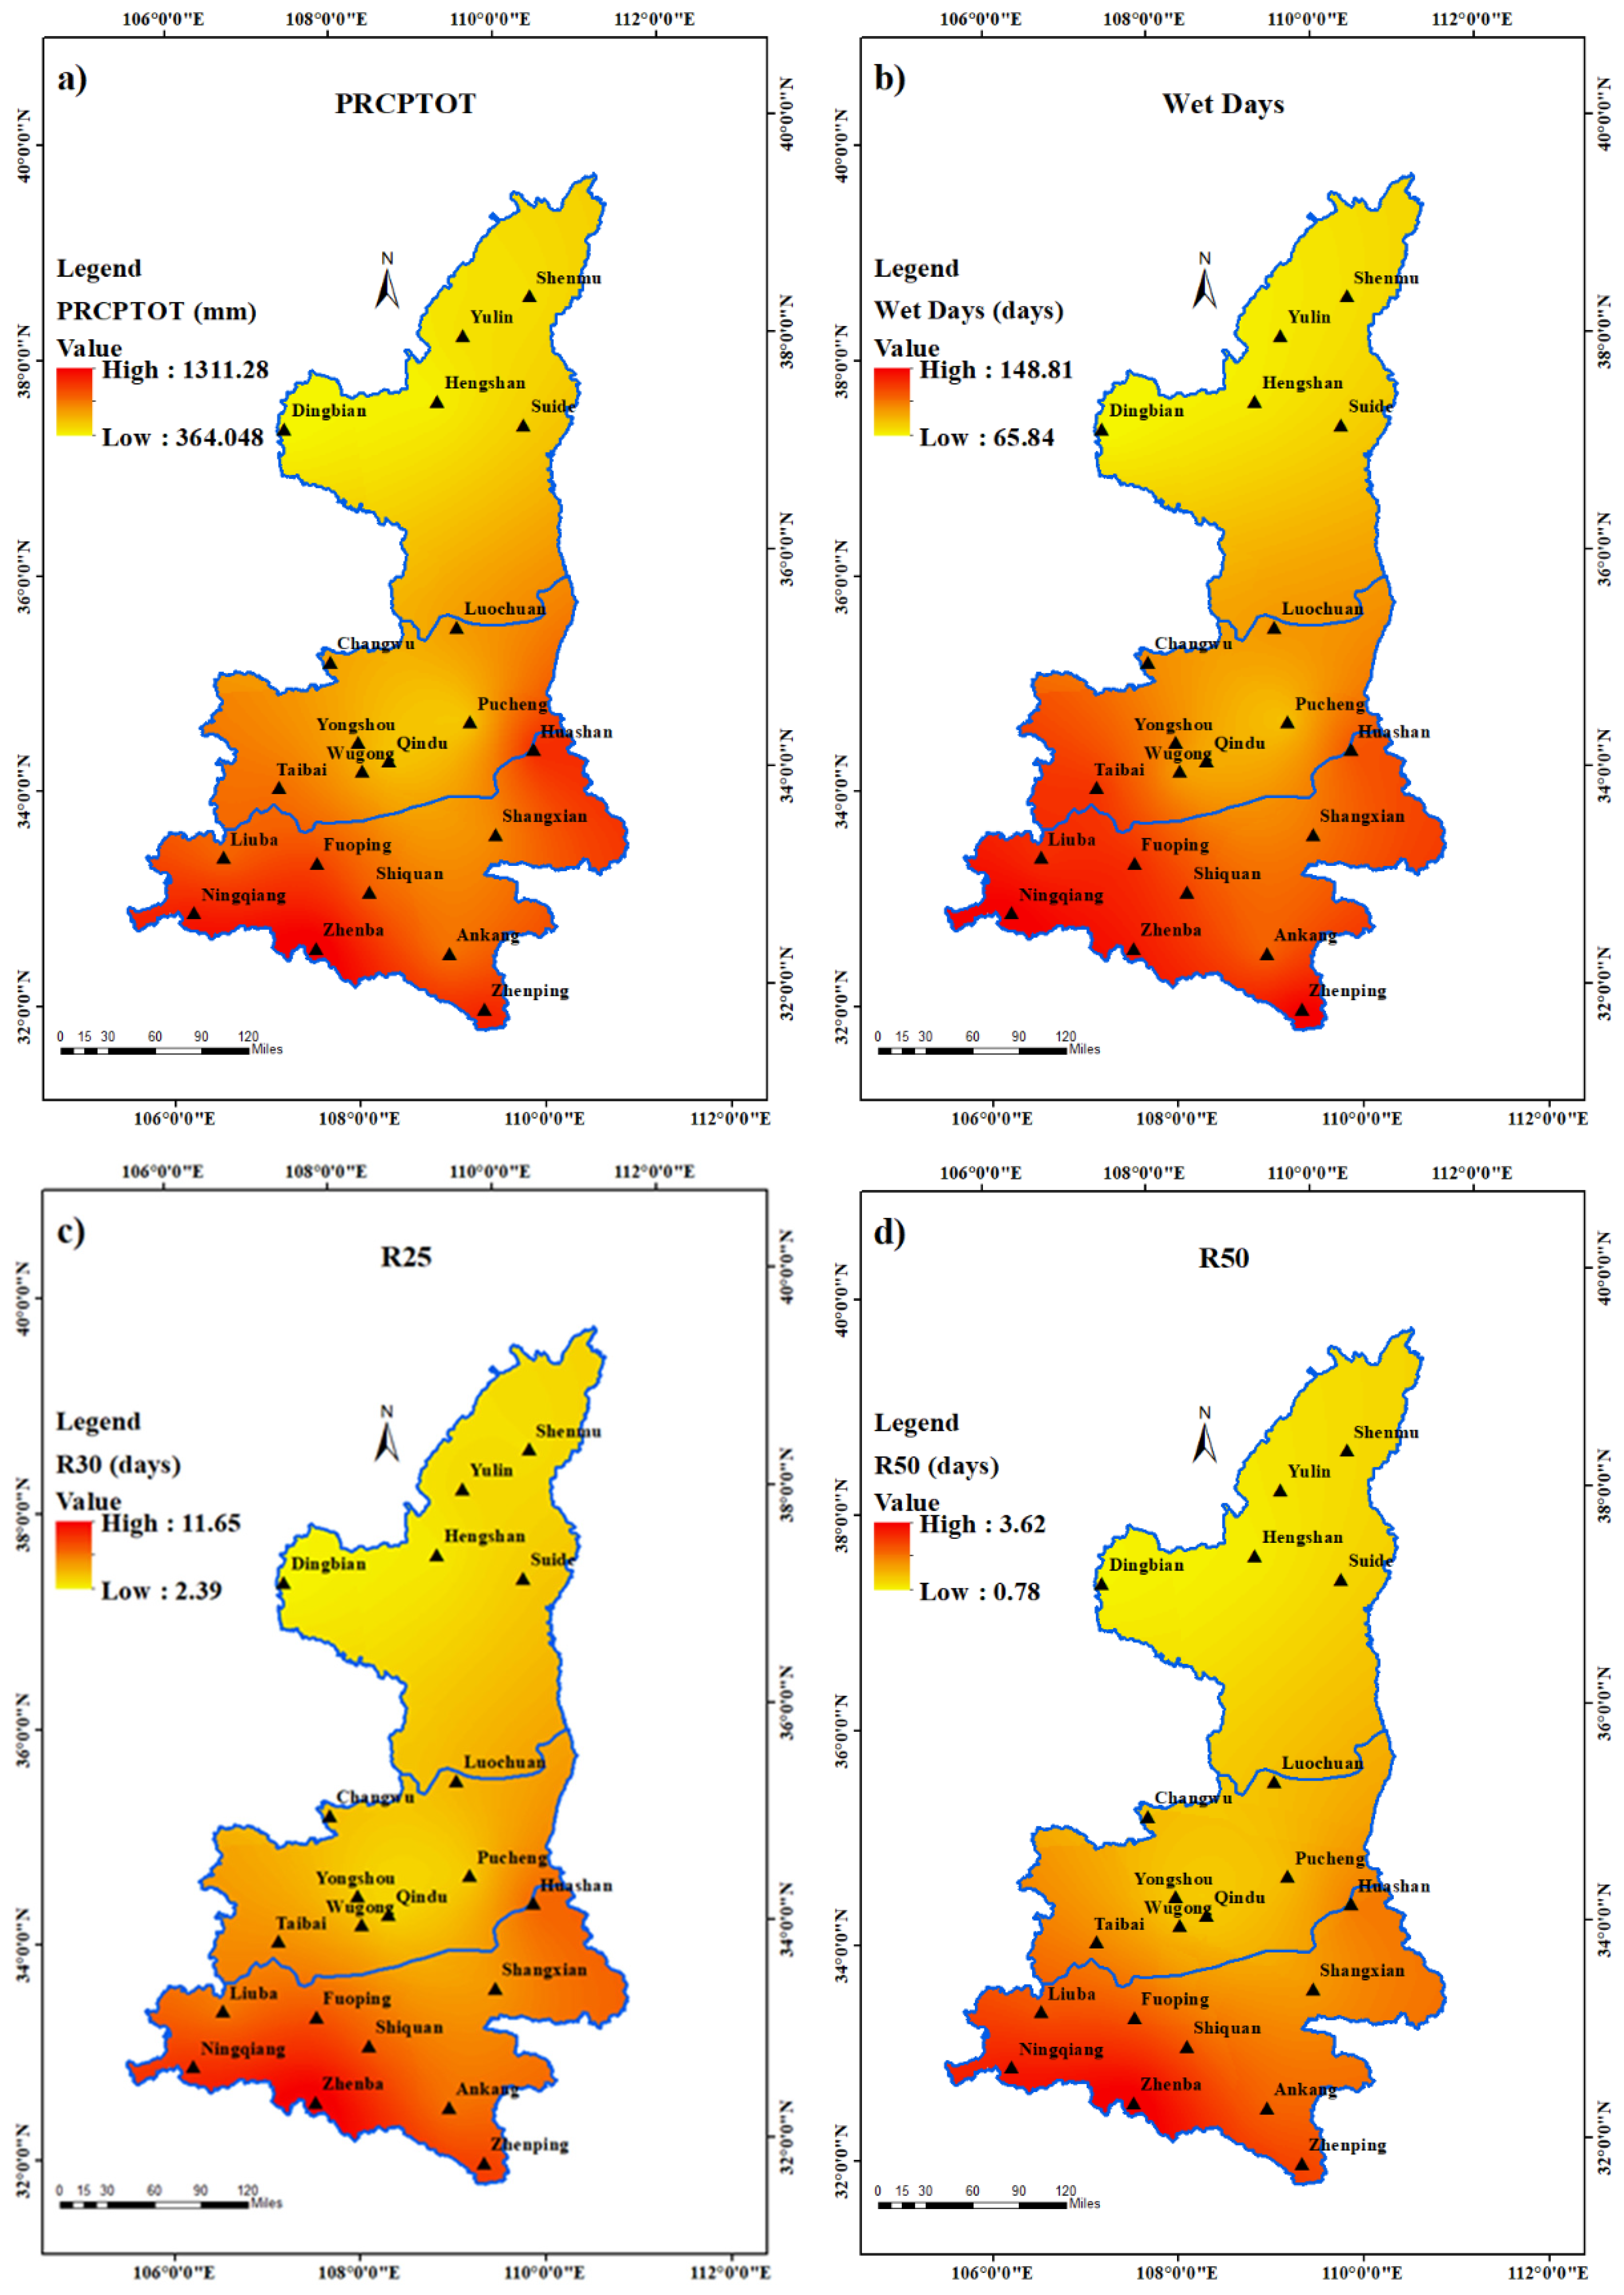
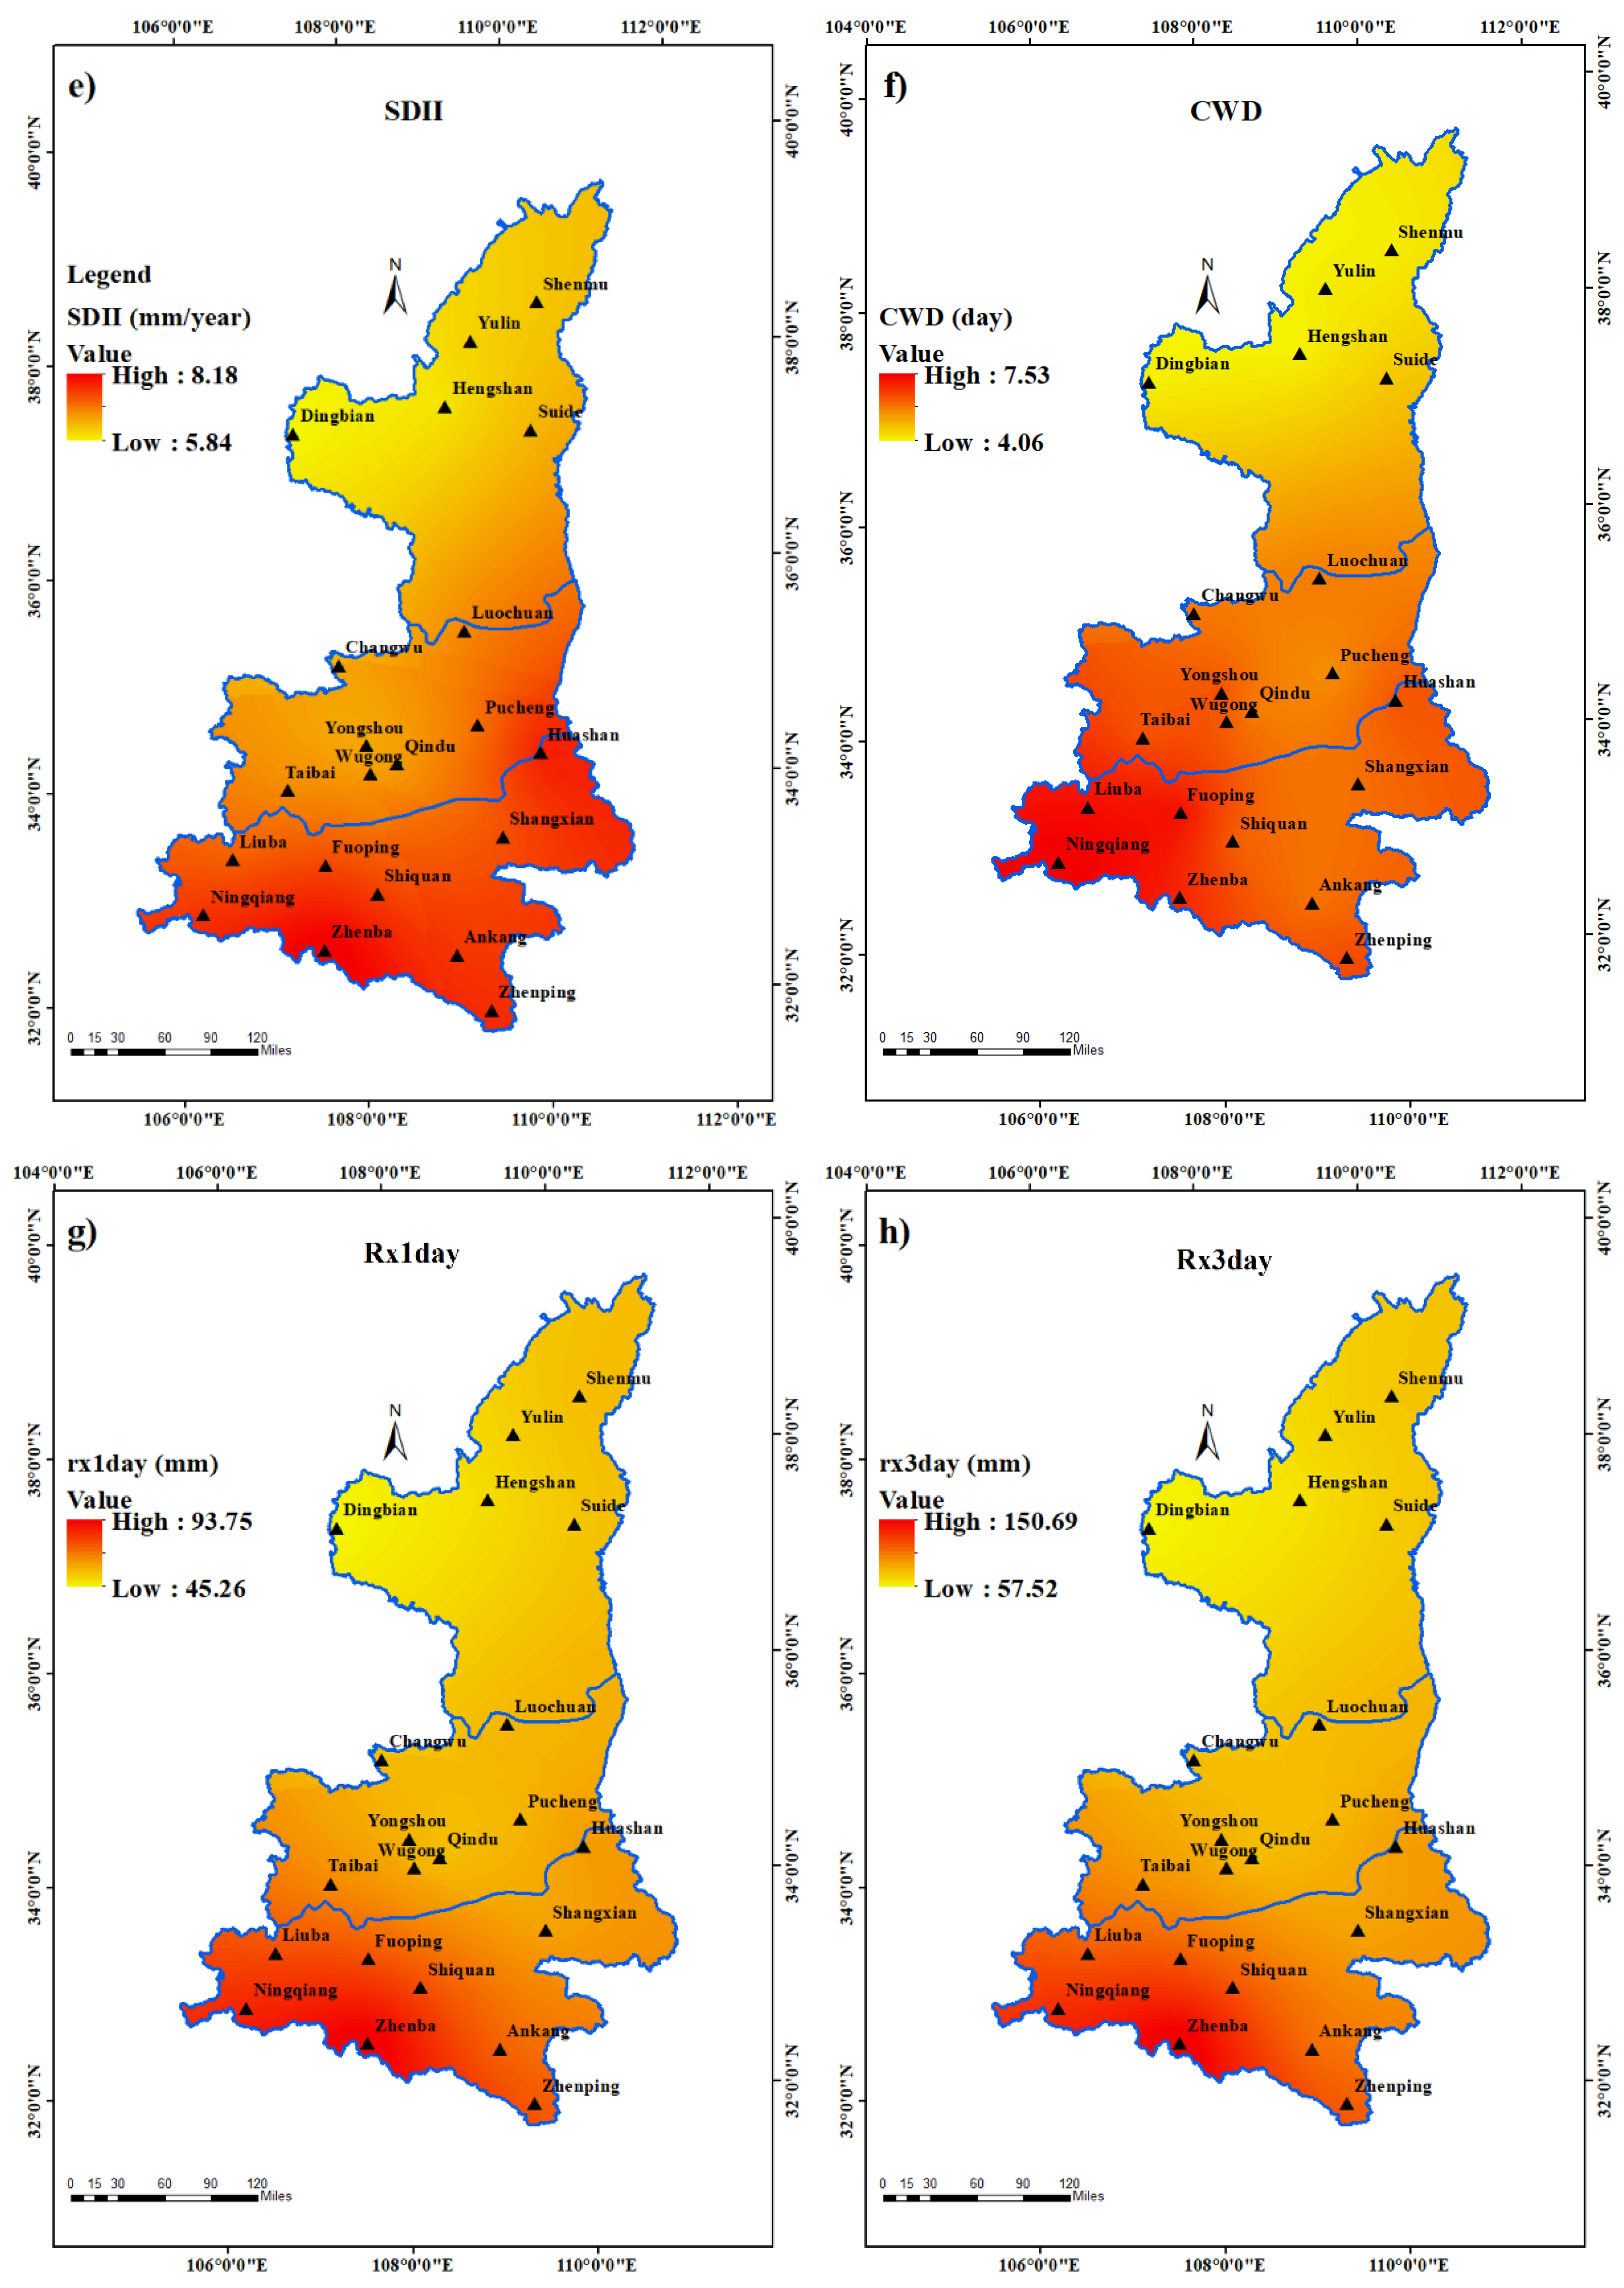
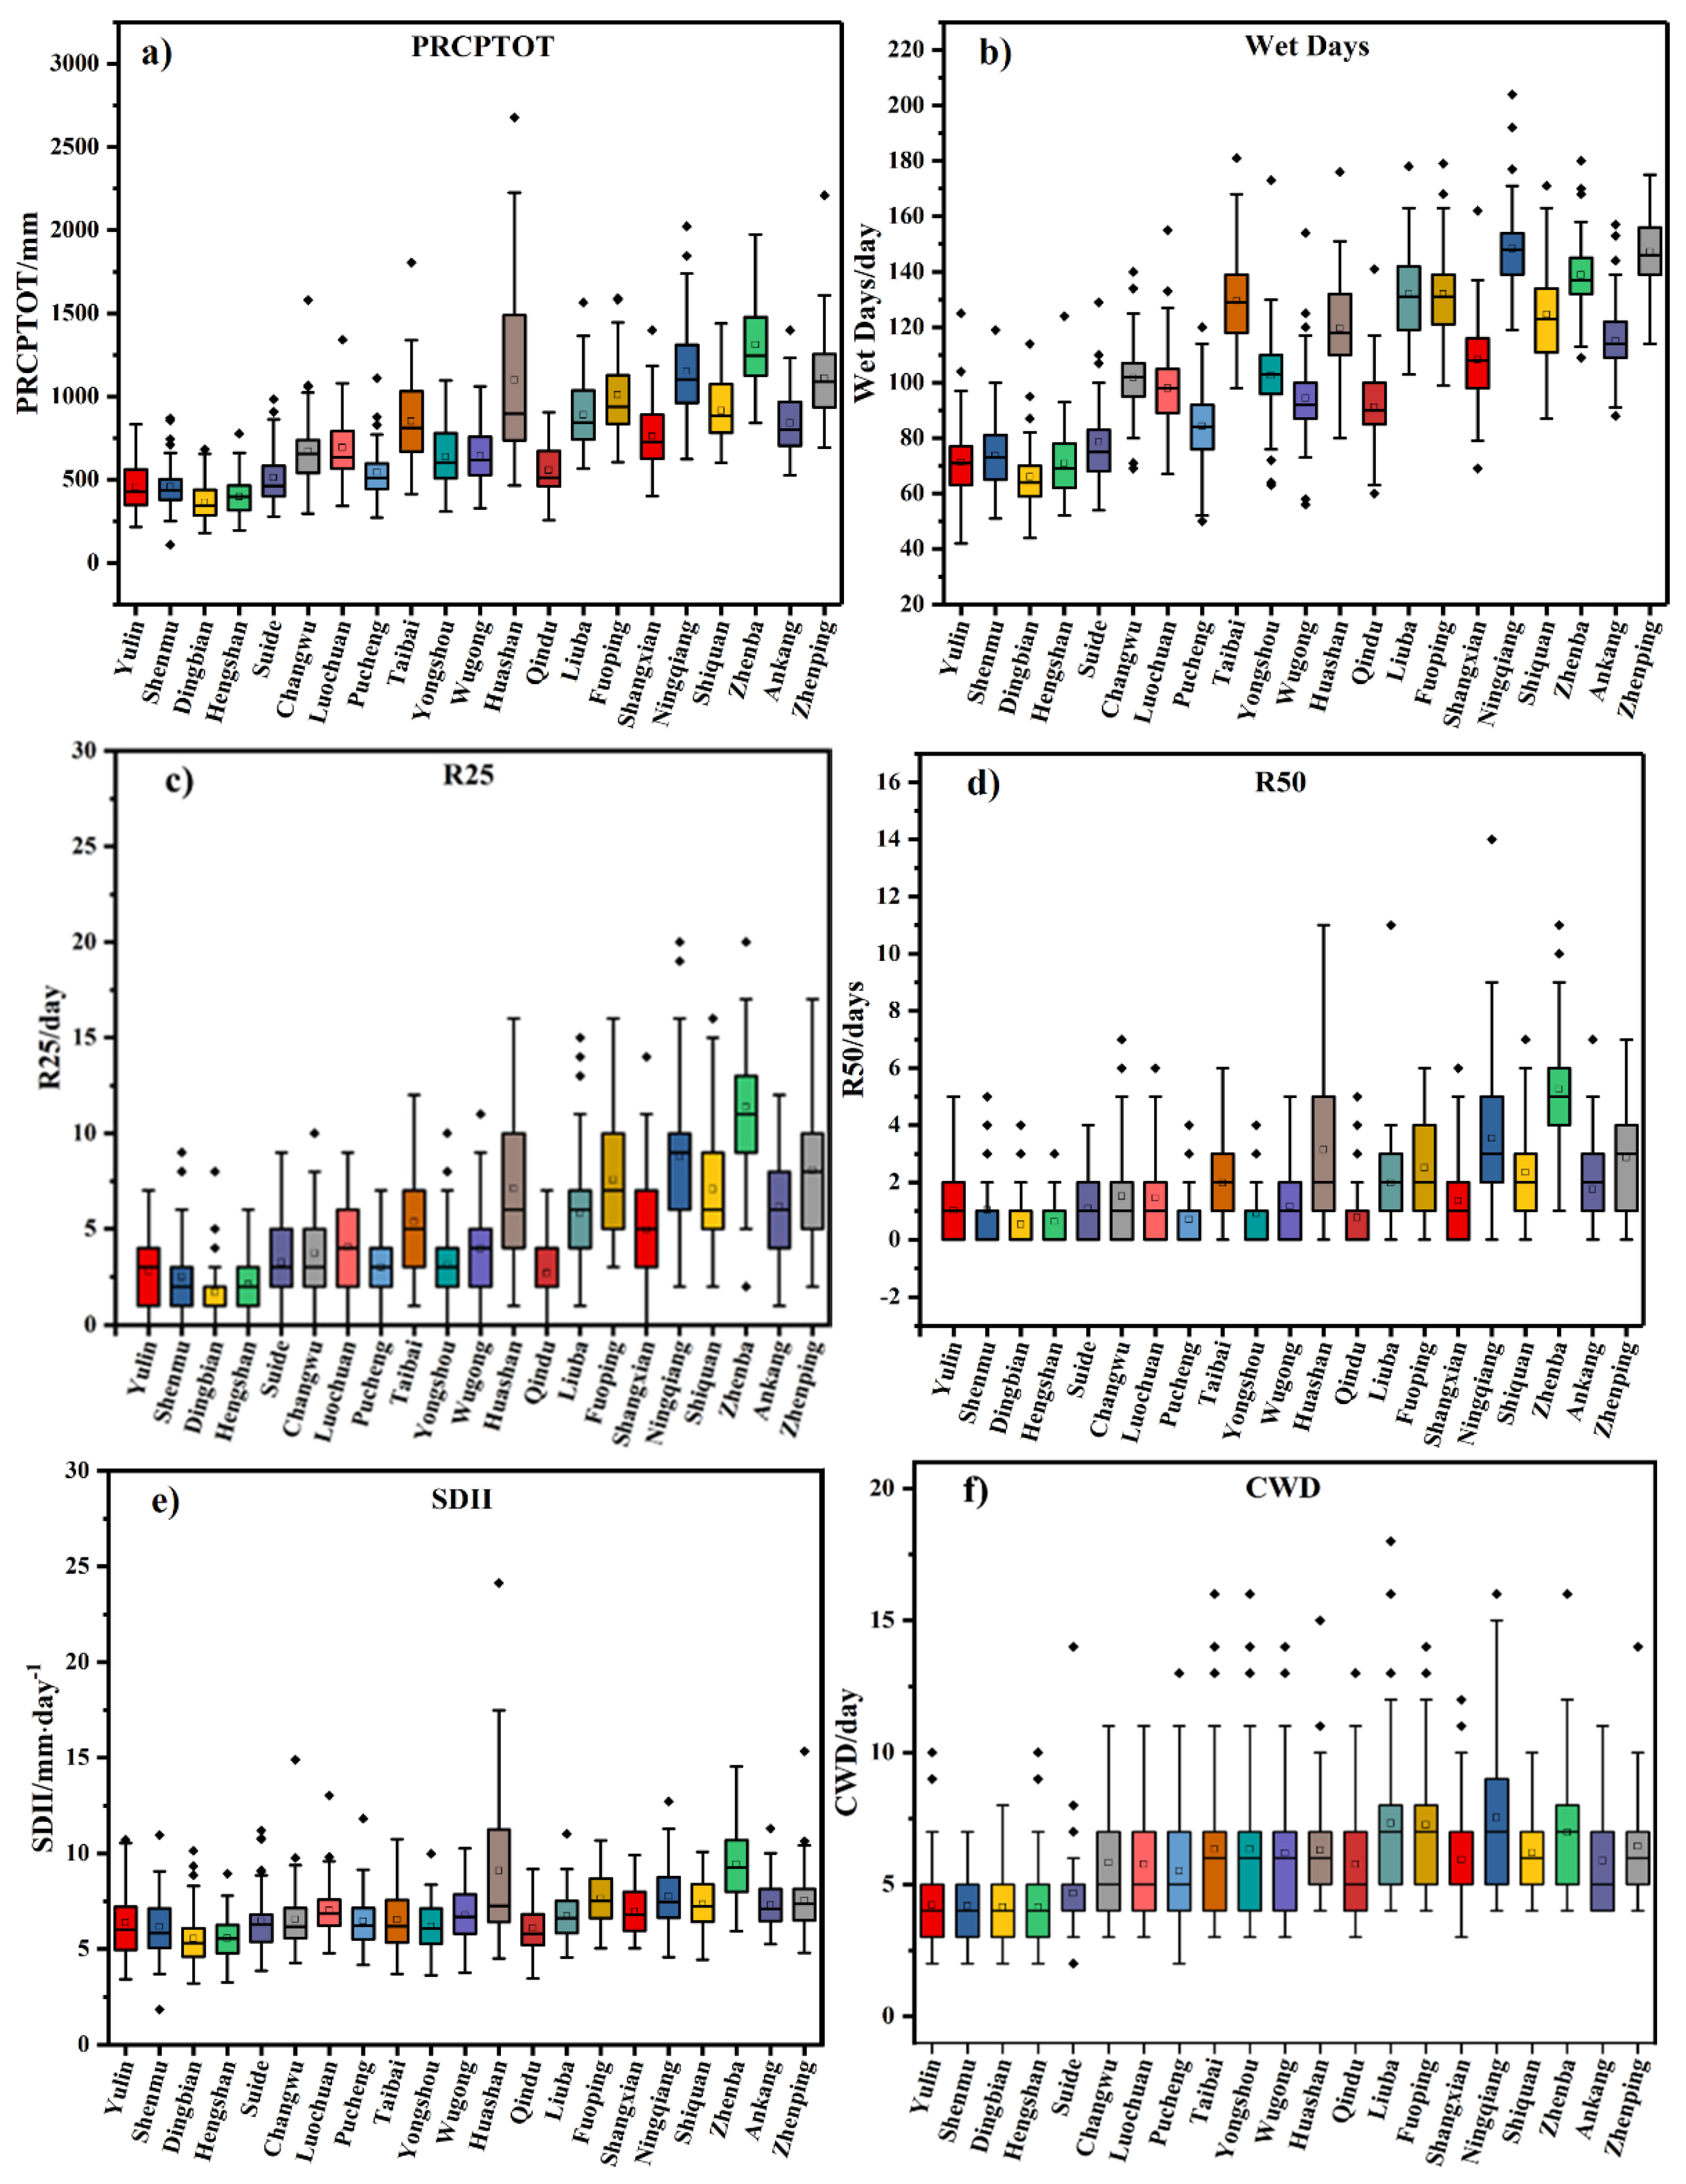
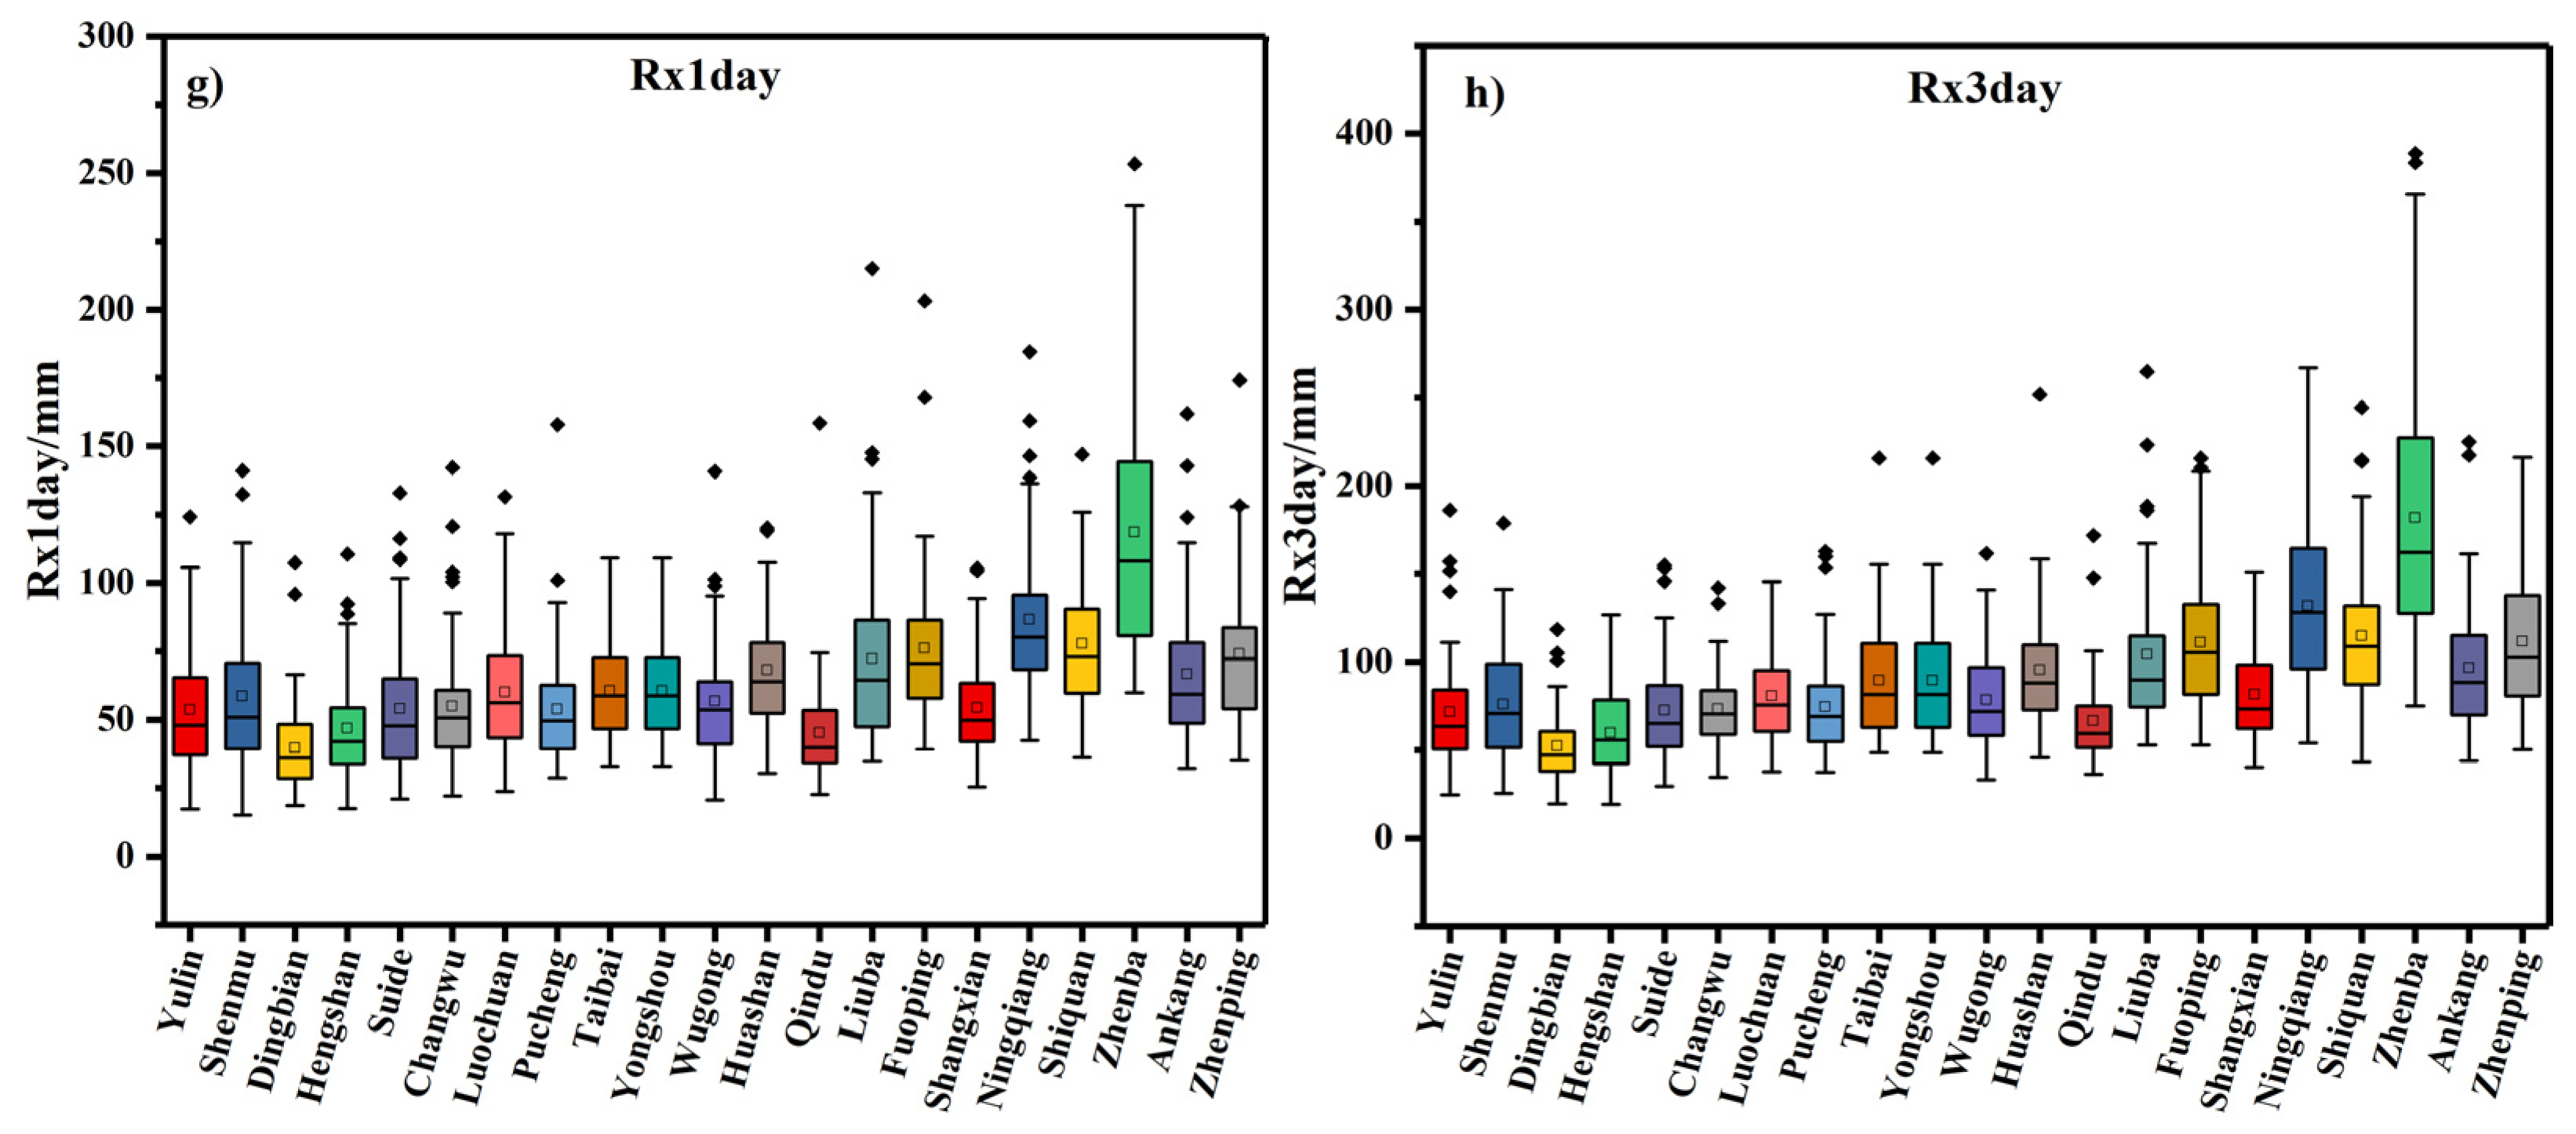
3.1. Spatial Analysis of Precipitation Indices
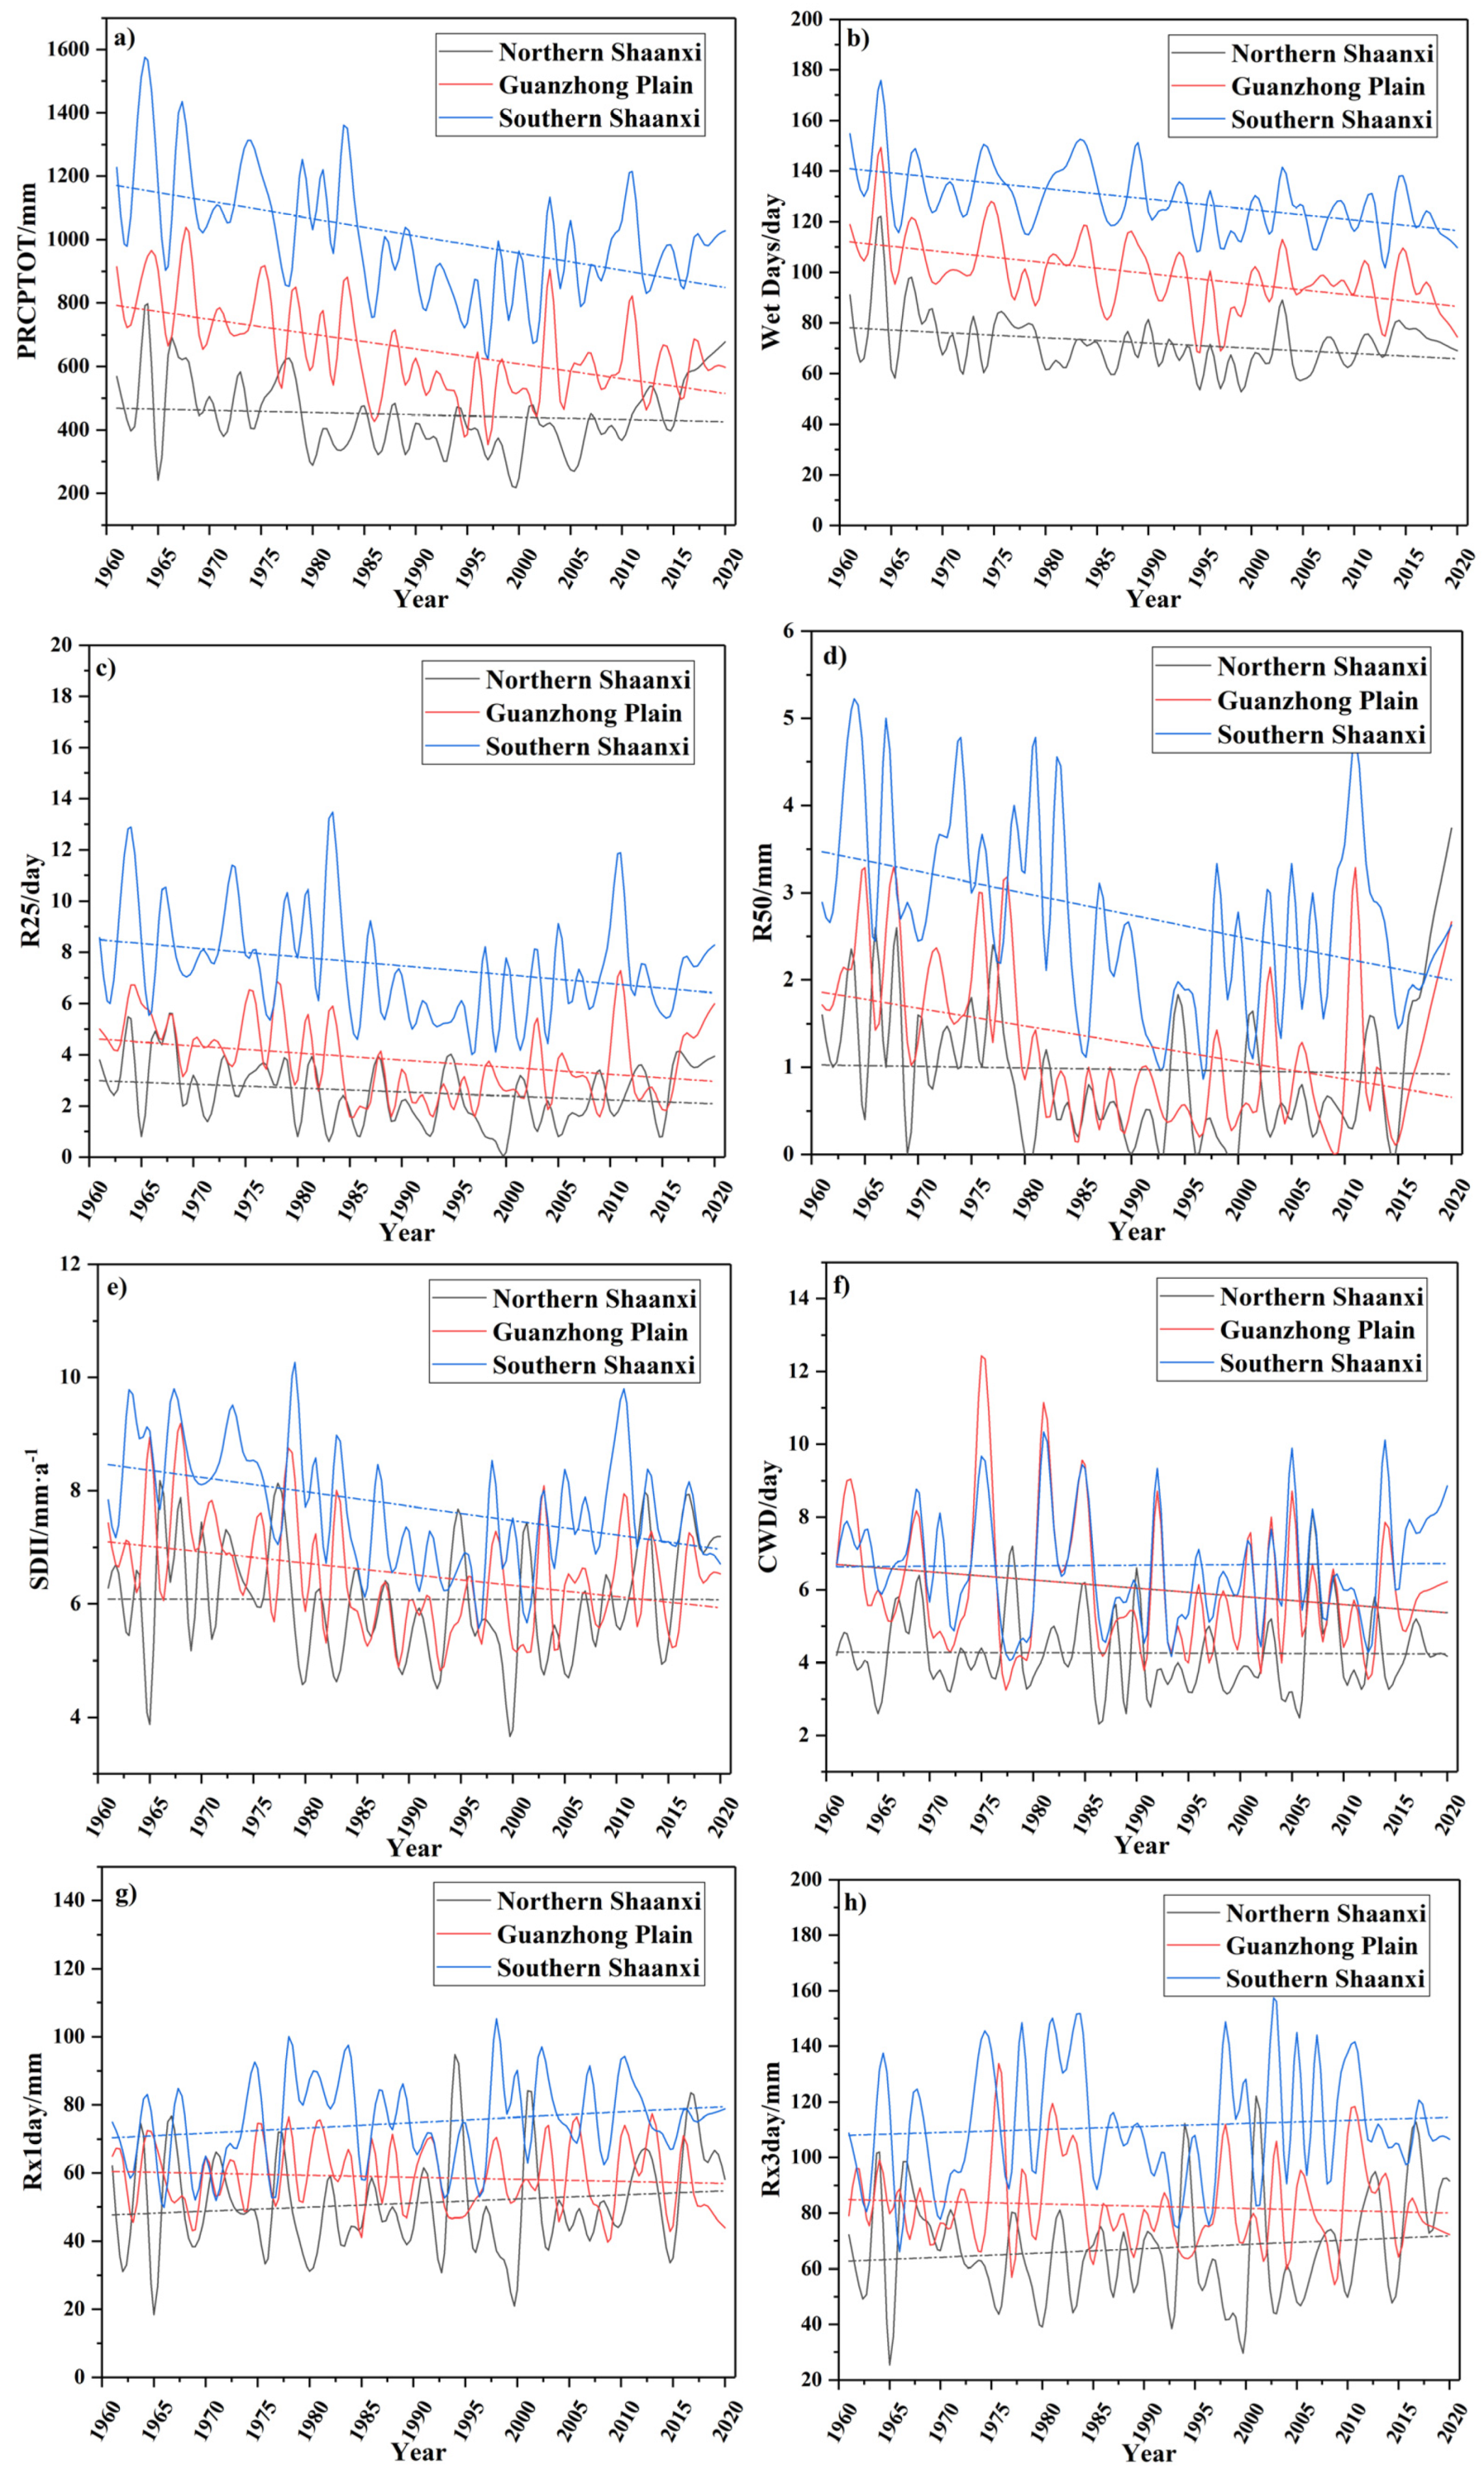
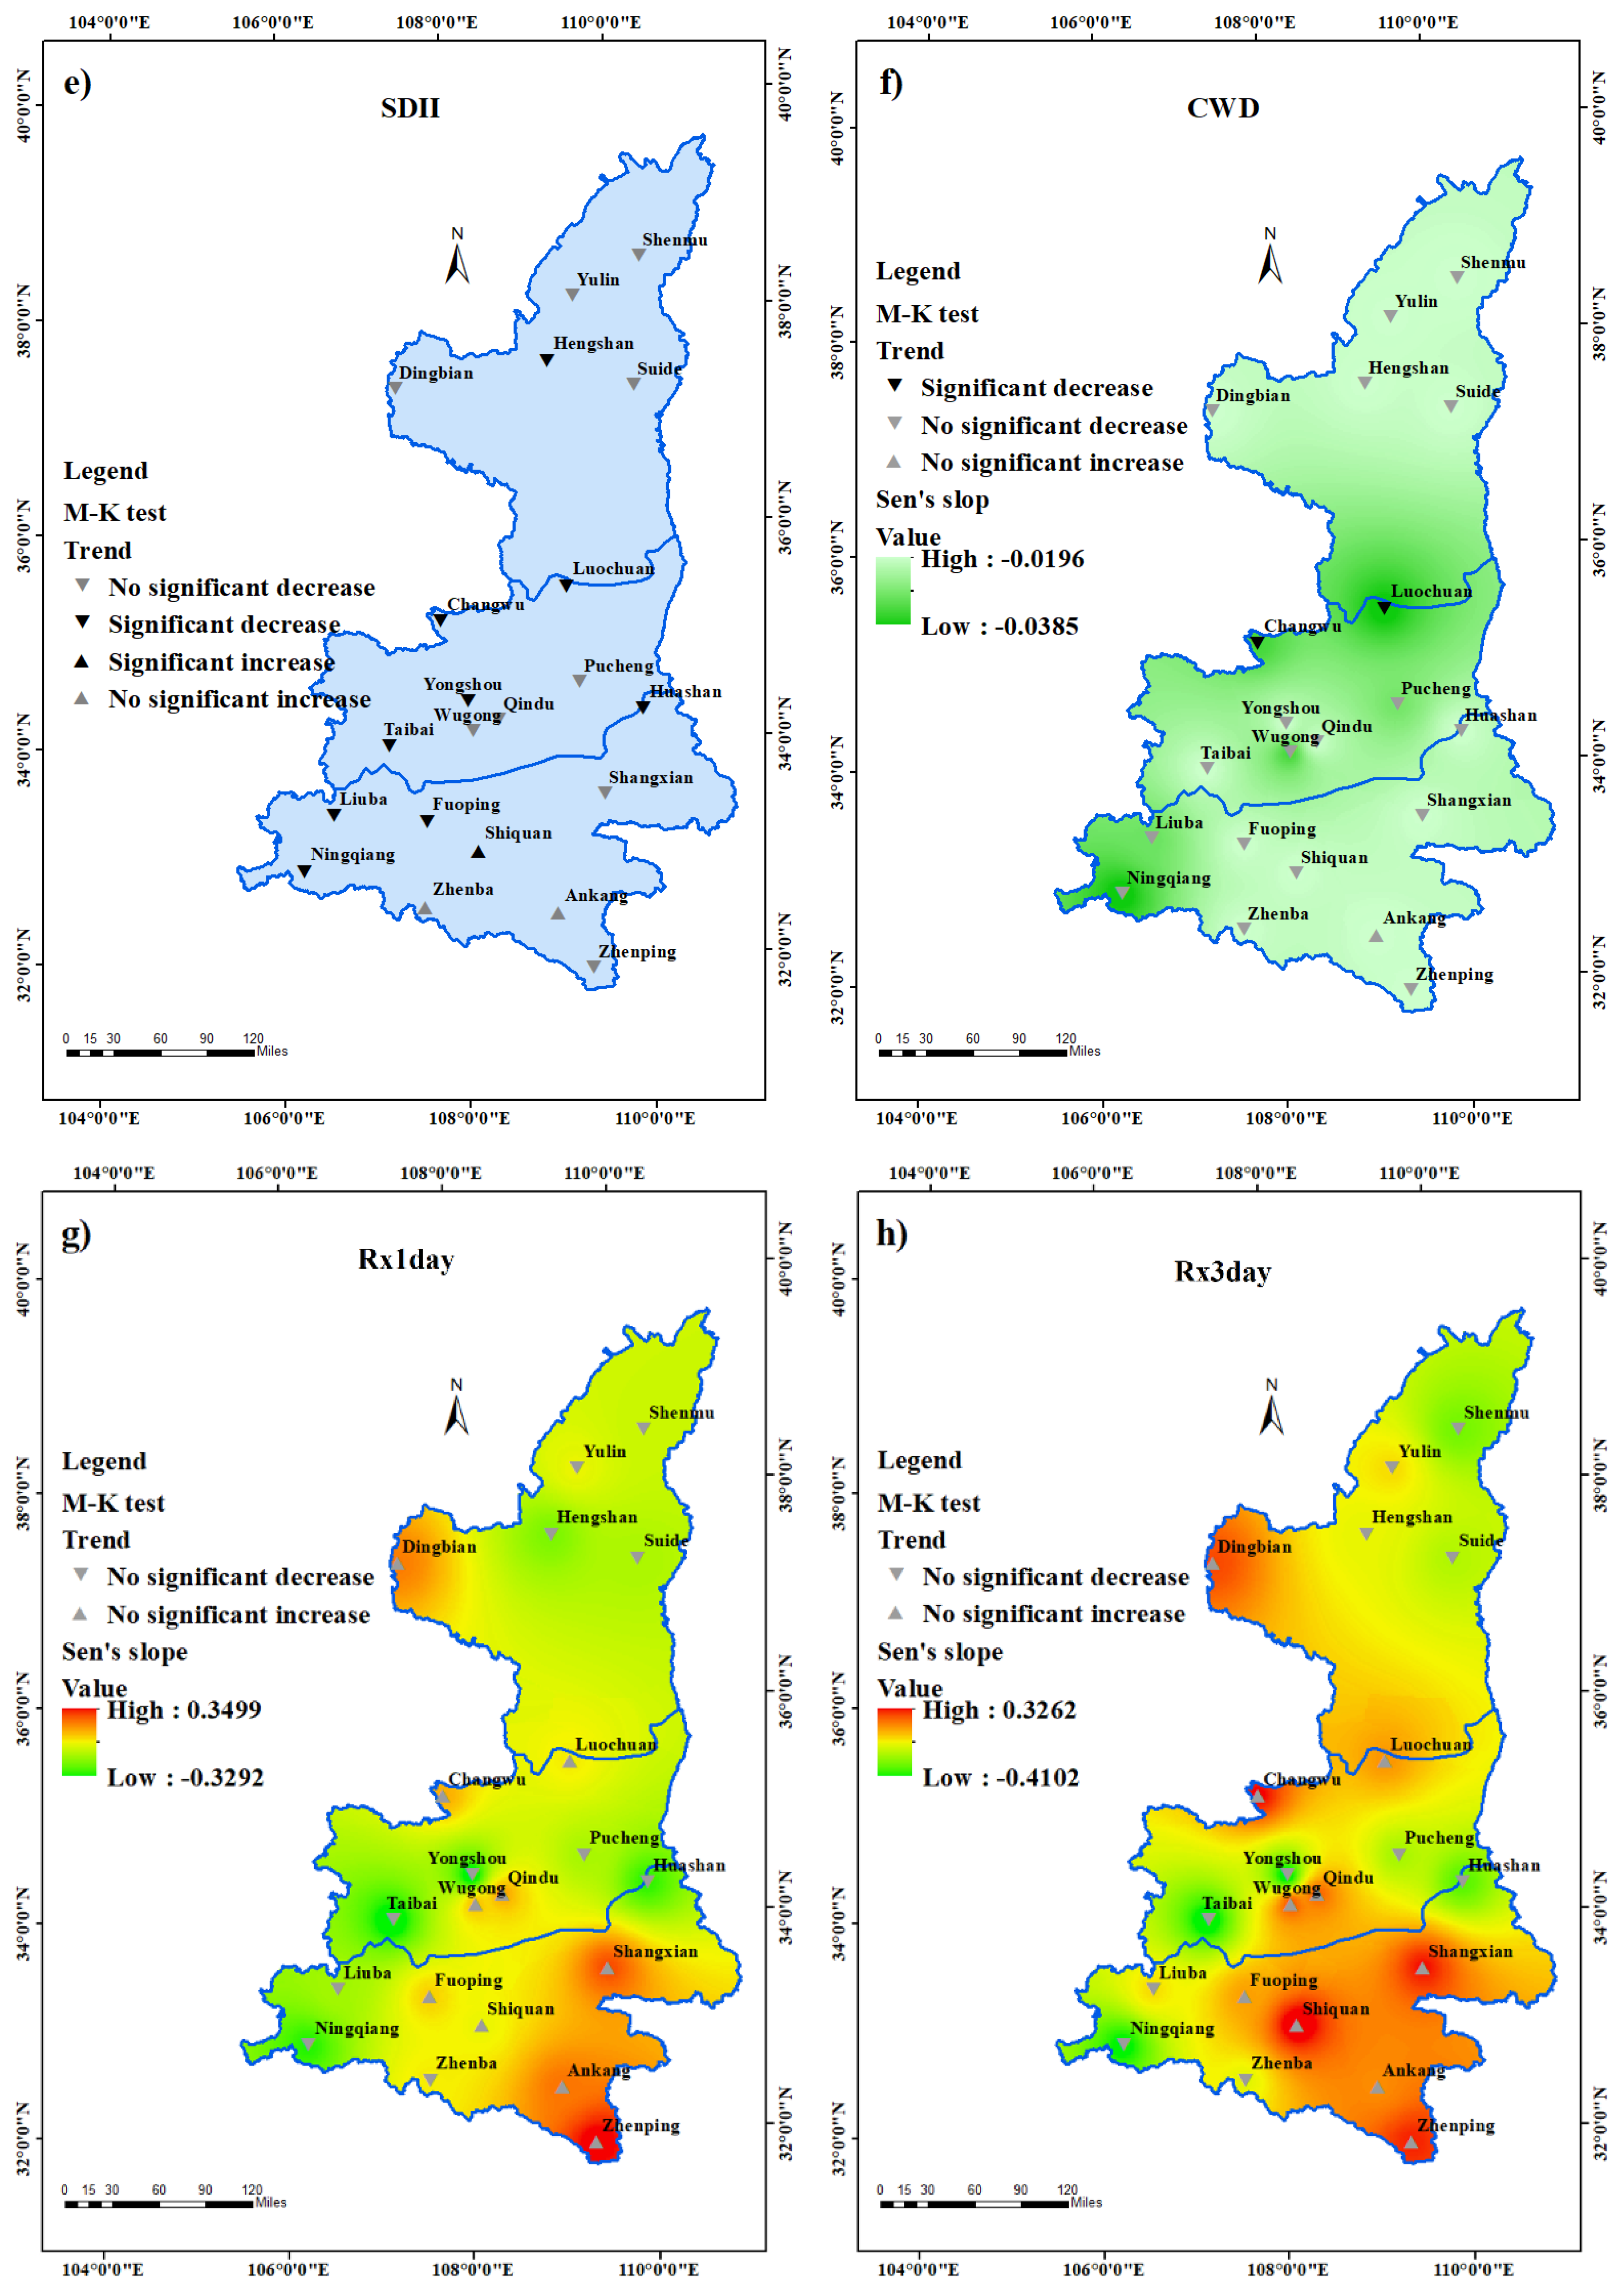
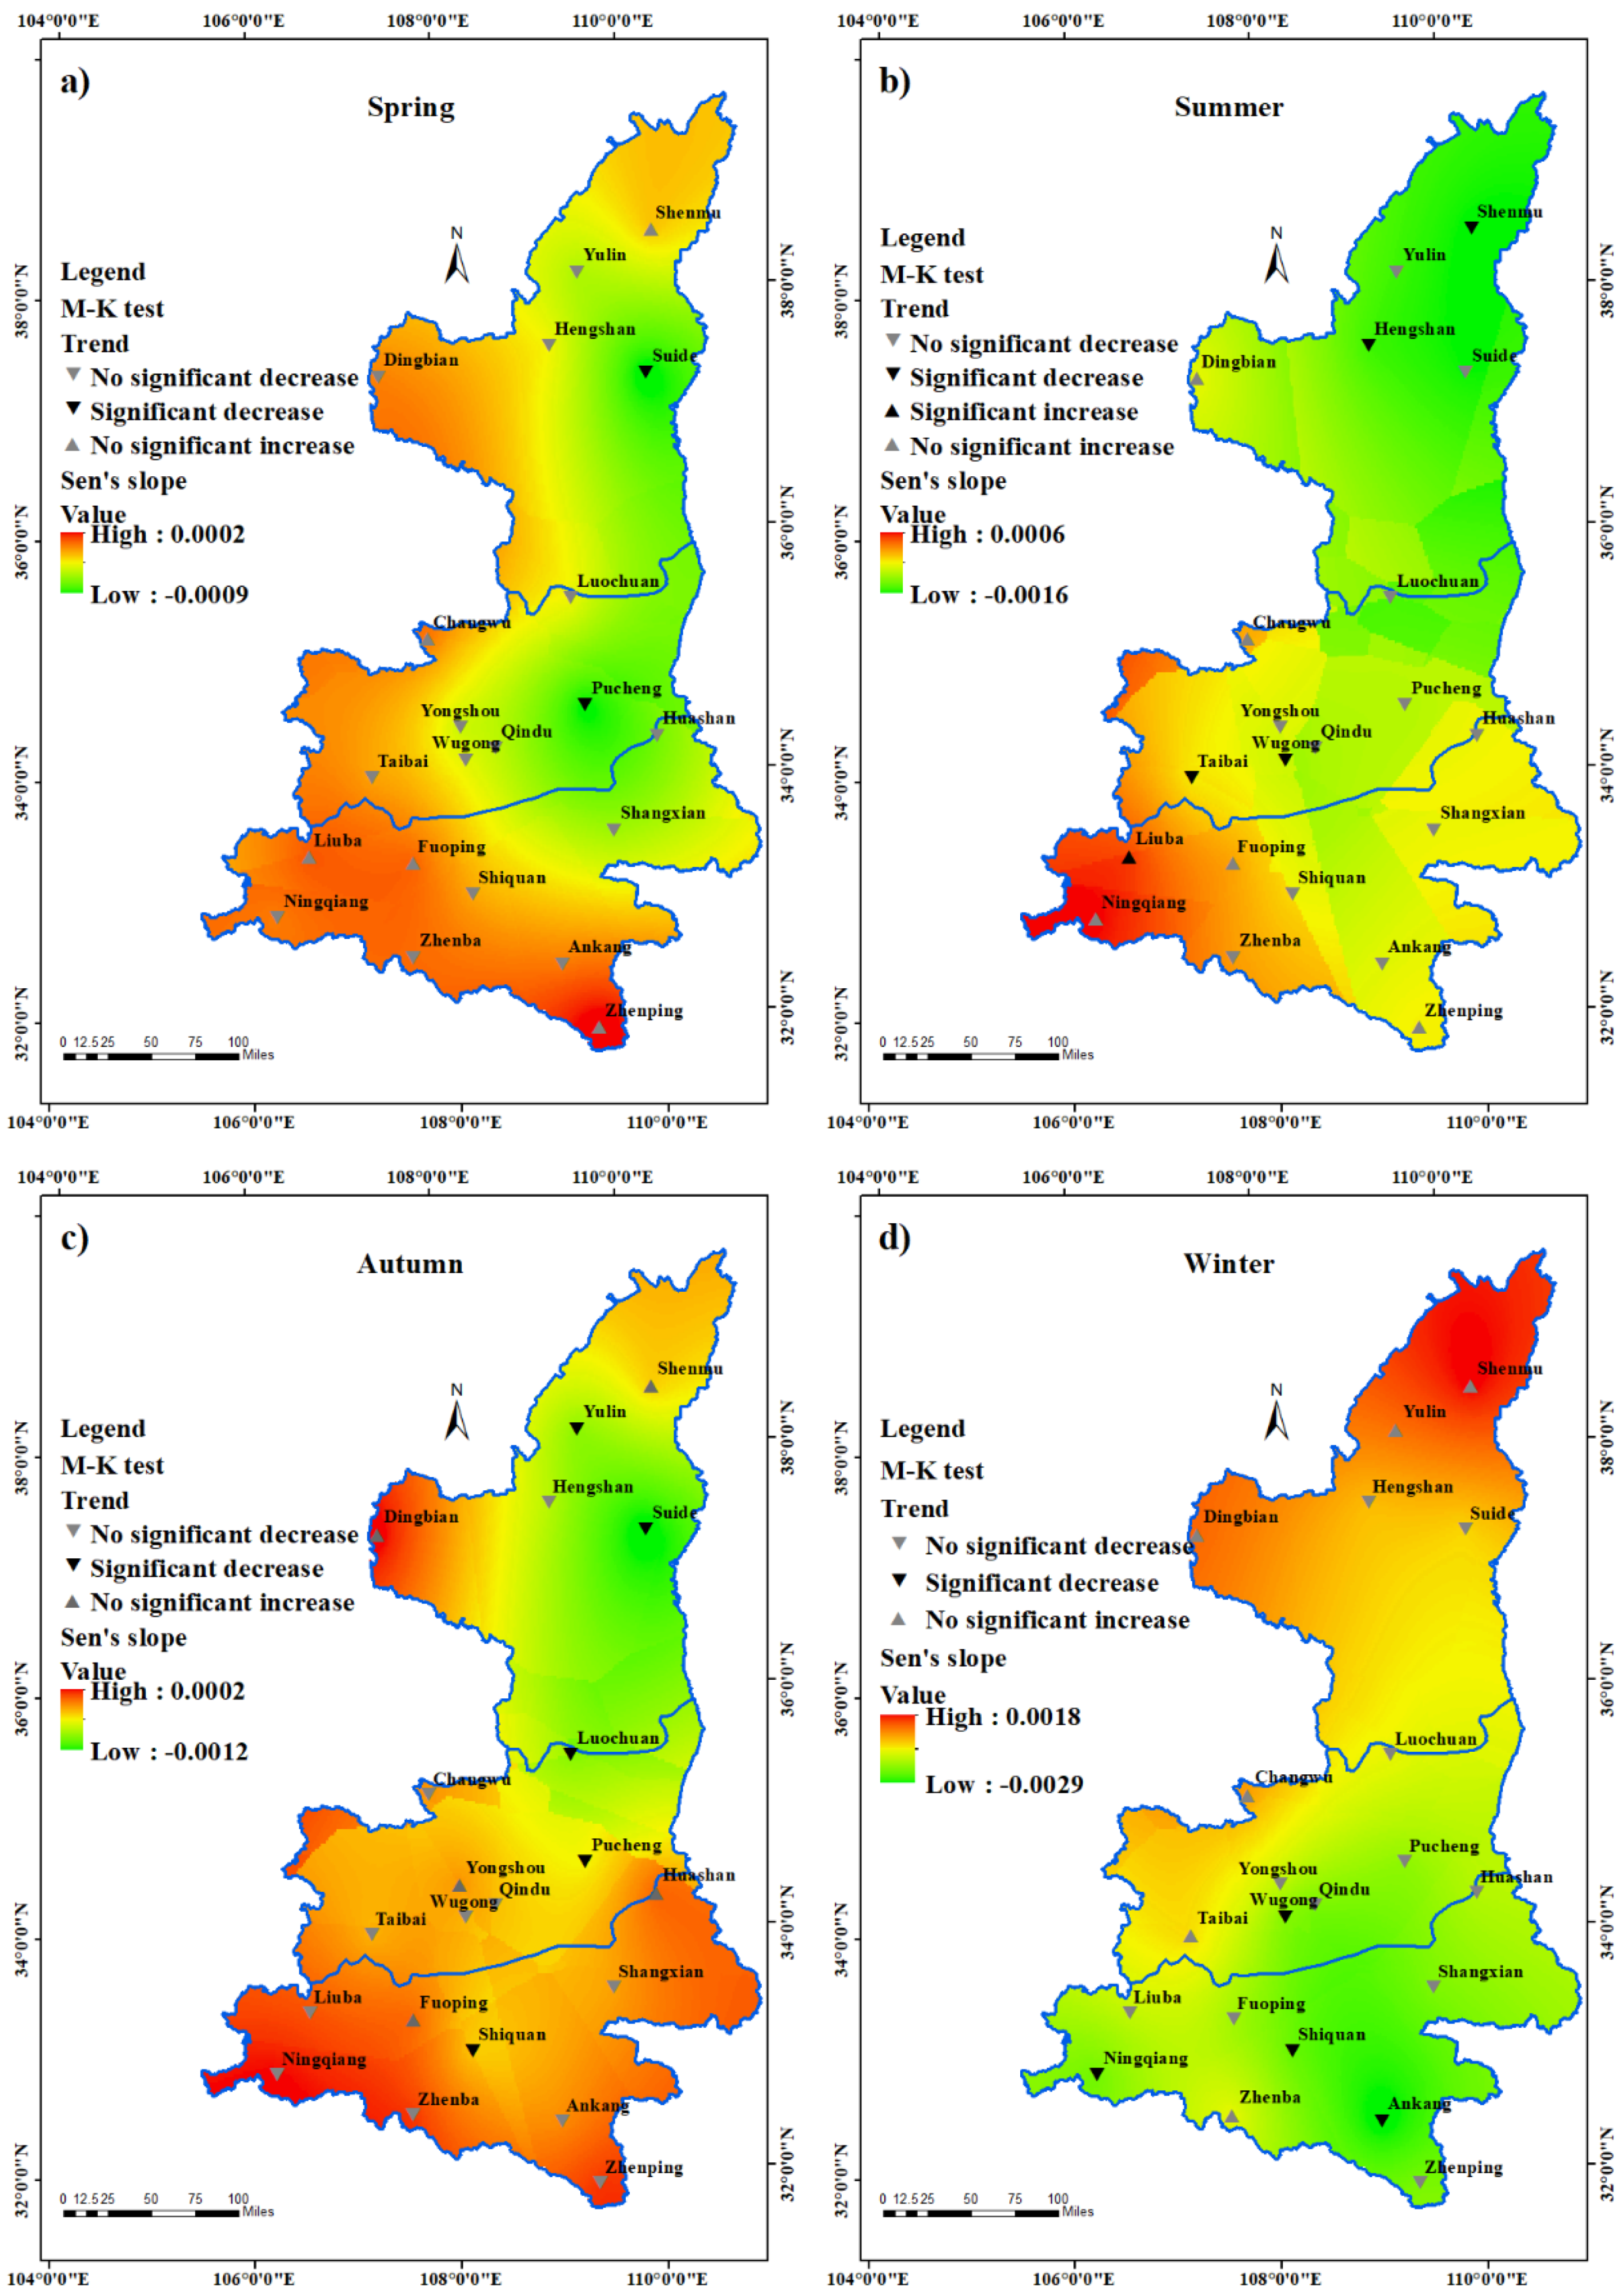
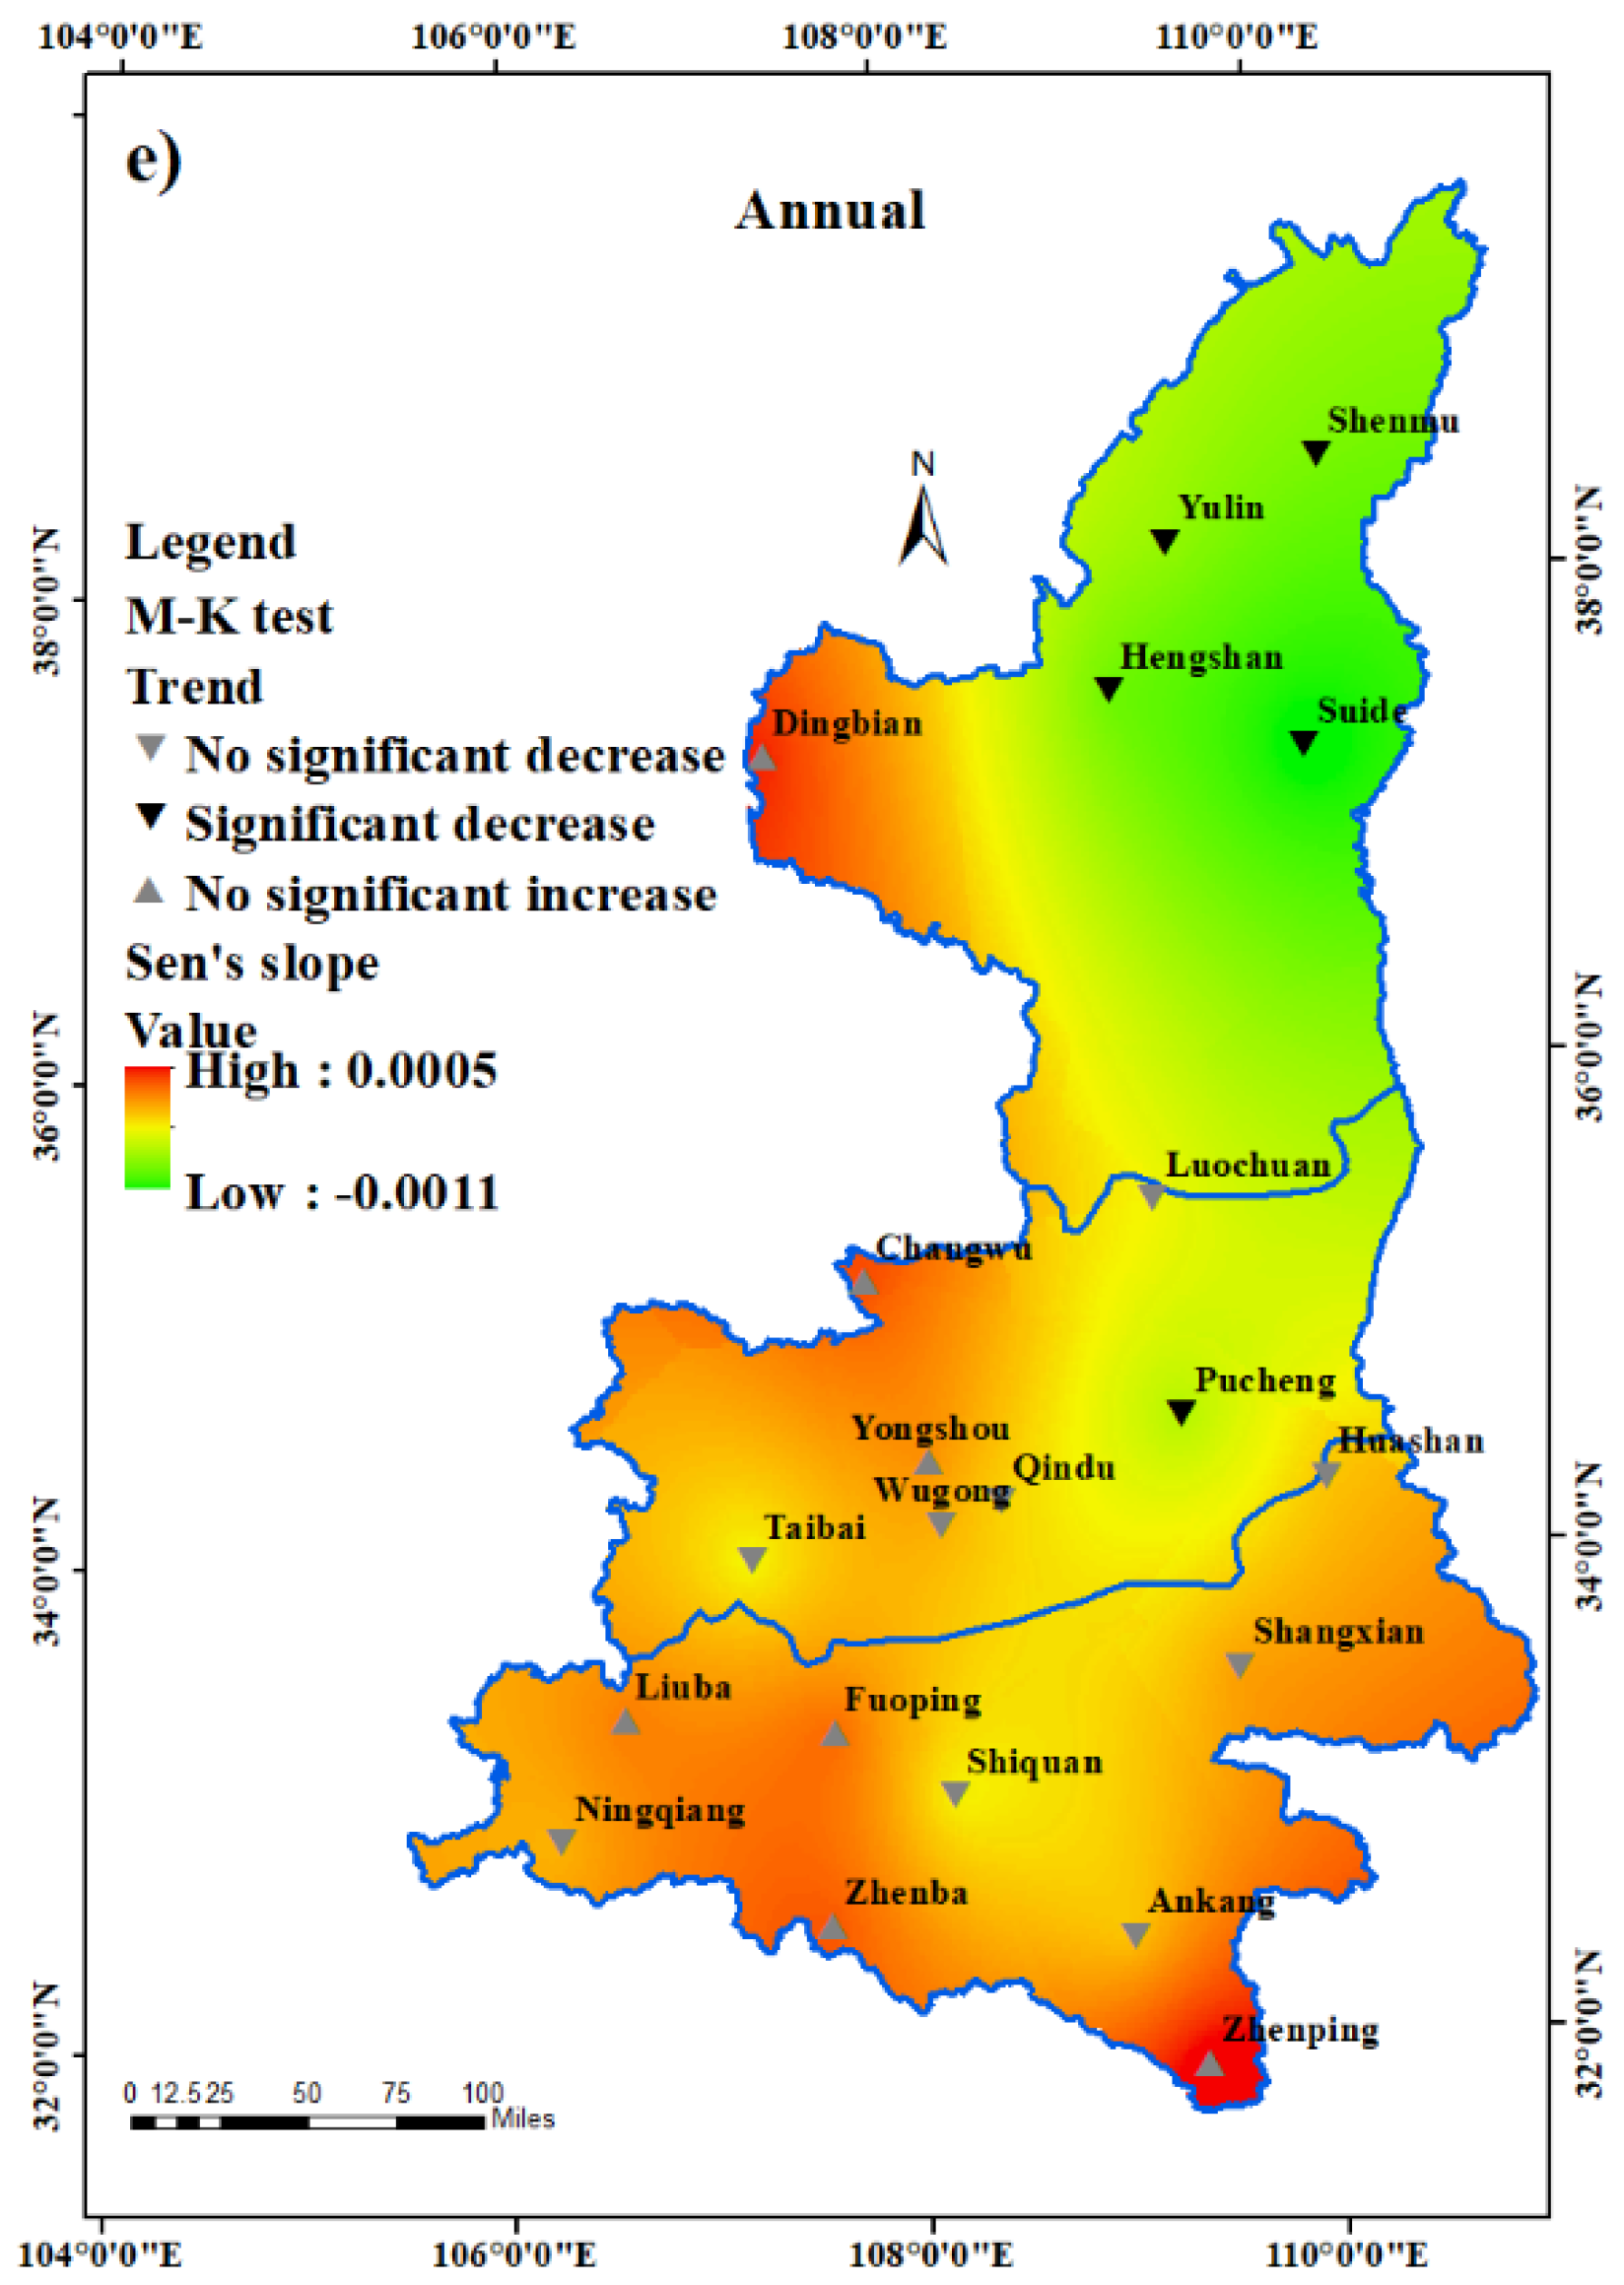
3.2. Trend Analysis of Extreme Rainfall Indices
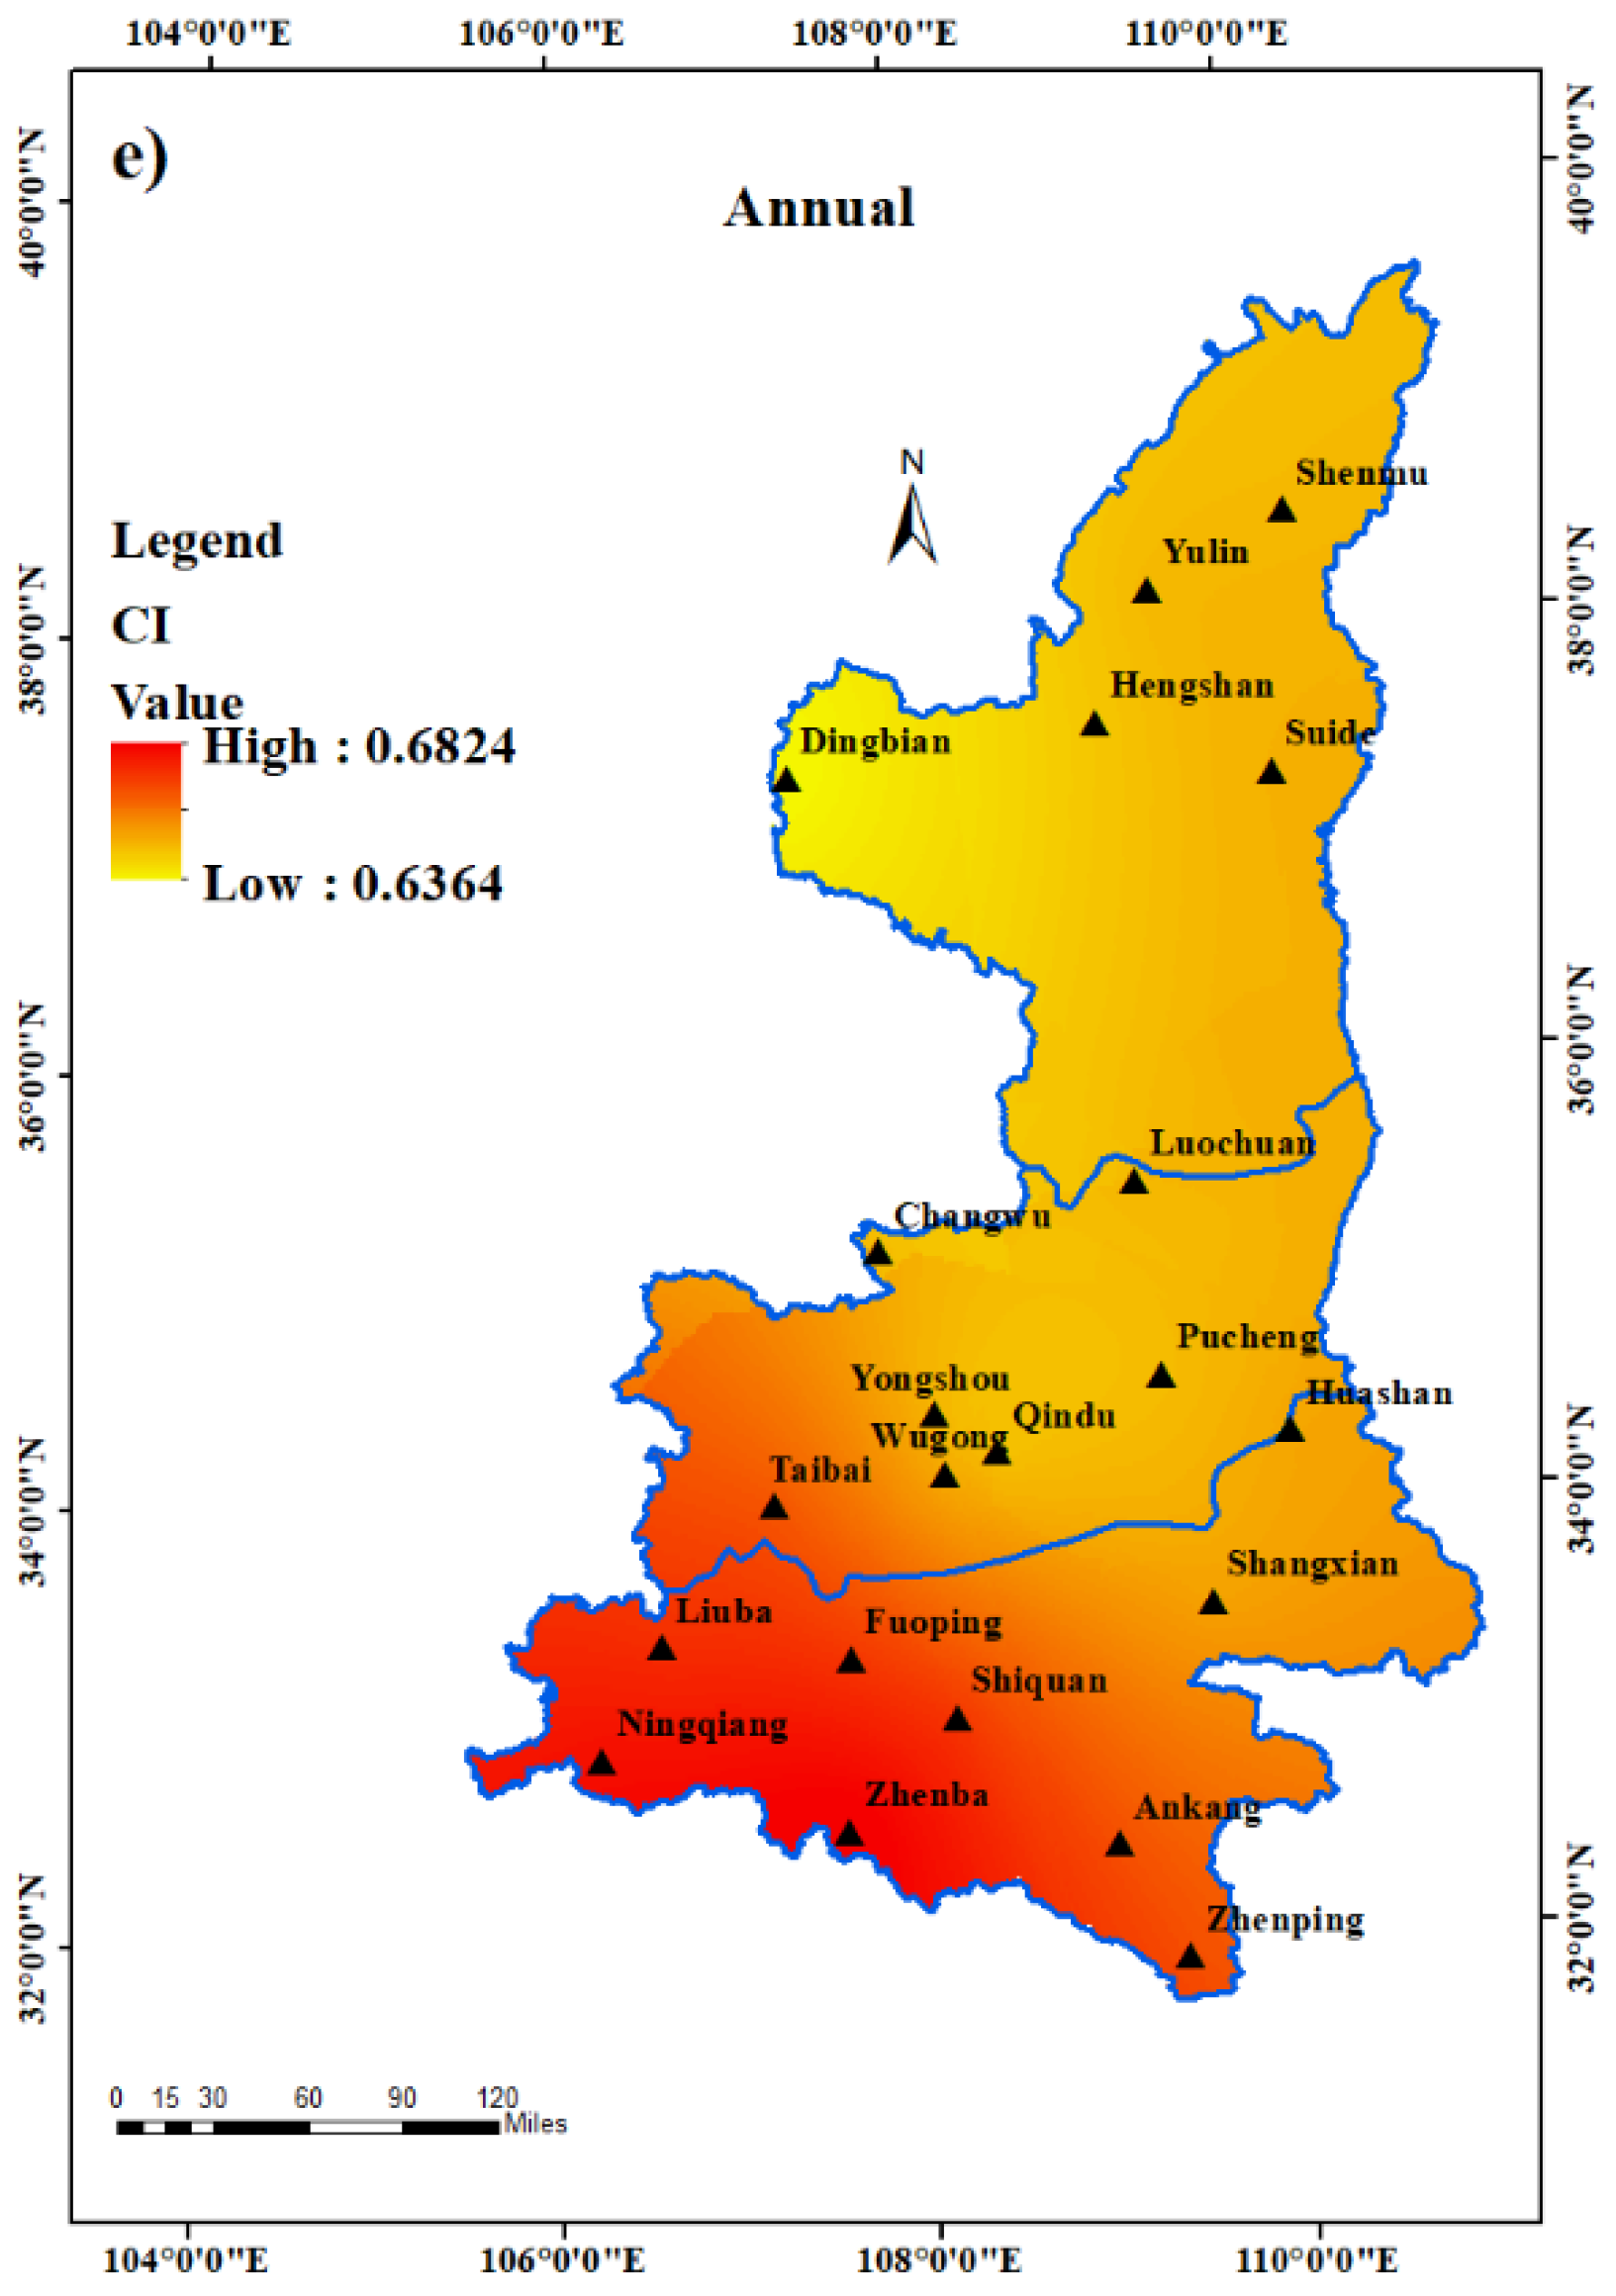
3.3. Temporal and Spatial Distribution of Precipitation Concentration Index
4. Discussion
5. Conclusions
Author Contributions
Funding
Institutional Review Board Statement
Informed Consent Statement
Data Availability Statement
Acknowledgments
Conflicts of Interest
References
- Grill, G.; Lehner, B.; Lumsdon, A.E.; MacDonald, G.K.; Zarfl, C.; Liermann, C.R. An index-based framework for assessing patterns and trends in river fragmentation and flow regulation by global dams at multiple scales. Environ. Res. Lett. 2015, 10, 015001. [Google Scholar] [CrossRef]
- Haddeland, I.; Heinke, J.; Biemans, H.; Eisner, S.; Flörke, M.; Hanasaki, N.; Konzmann, M.; Ludwig, F.; Masaki, Y.; Schewe, J.; et al. Global water resources affected by human interventions and climate change. Proc. Natl. Acad. Sci. USA 2013, 111, 3251–3256. [Google Scholar] [CrossRef] [PubMed] [Green Version]
- Zha, X.; Luo, P.; Zhu, W.; Wang, S.; Lyu, J.; Zhou, M.; Huo, A.; Wang, Z. A bibliometric analysis of the research on Sponge City: Current situation and future development direction. Ecohydrology 2021, 14, e2328. [Google Scholar] [CrossRef]
- Tank, A.M.G.K.; Peterson, T.C.; Quadir, D.A.; Dorji, S.; Zou, X.; Tang, H.; Santhosh, K.; Joshi, U.R.; Jaswal, A.K.; Kolli, R.K.; et al. Changes in daily temperature and precipitation extremes in central and south Asia. J. Geophys. Res. Earth Surf. 2006, 111, D16105. [Google Scholar] [CrossRef]
- Zhao, Y.; Wu, J.; He, C.; Ding, G. Linking wind erosion to ecosystem services in drylands: A landscape ecological approach. Landsc. Ecol. 2017, 32, 2399–2417. [Google Scholar] [CrossRef]
- Zhang, K.; Kimball, J.S.; Mu, Q.; Jones, L.A.; Goetz, S.; Running, S.W. Satellite based analysis of northern ET trends and associated changes in the regional water balance from 1983 to 2005. J. Hydrol. 2009, 379, 92–110. [Google Scholar] [CrossRef]
- Huang, J.; Yu, H.; Guan, X.; Wang, G.; Guo, R. Accelerated dryland expansion under climate change. Nat. Clim. Chang. 2015, 6, 166–171. [Google Scholar] [CrossRef]
- Piras, M.; Mascaro, G.; Deidda, R.; Vivoni, E.R. Quantification of hydrologic impacts of climate change in a Mediterranean basin in Sardinia, Italy, through high-resolution simulations. Hydrol. Earth Syst. Sci. 2014, 18, 5201–5217. [Google Scholar] [CrossRef] [Green Version]
- Chen, H.-P.; Sun, J.-Q.; Li, H.-X. Future changes in precipitation extremes over China using the NEX-GDDP high-resolution daily downscaled data-set. Atmos. Ocean. Sci. Lett. 2017, 10, 403–410. [Google Scholar] [CrossRef] [Green Version]
- Li, J.; Wang, B. Predictability of summer extreme precipitation days over eastern China. Clim. Dyn. 2017, 51, 4543–4554. [Google Scholar] [CrossRef]
- Zhai, P.; Zhang, X.; Wan, H.; Pan, X. Trends in Total Precipitation and Frequency of Daily Precipitation Extremes over China. J. Clim. 2005, 18, 1096–1108. [Google Scholar] [CrossRef]
- Guo, E.; Wang, Y.; Jirigala, B.; Jin, E. Spatiotemporal variations of precipitation concentration and their potential links to drought in mainland China. J. Clean. Prod. 2020, 267, 122004. [Google Scholar] [CrossRef]
- Mastrangelo, D.; Horvath, K.; Riccio, A.; Miglietta, M. Mechanisms for convection development in a long-lasting heavy precipitation event over southeastern Italy. Atmos. Res. 2011, 100, 586–602. [Google Scholar] [CrossRef]
- Miglietta, M.M.; Regano, A. An observational and numerical study of a flash-flood event over south-eastern Italy. Nat. Hazards Earth Syst. Sci. 2008, 8, 1417–1430. [Google Scholar] [CrossRef]
- van Oldenborgh, G.J.; Otto, F.E.; Haustein, K.; Cullen, H. Climate change increases the probability of heavy rains like those of storm Desmond in the UK–an event attribution study in near-real time. Hydrol. Earth Syst. Sci. Discuss. 2015, 12, 13197–13216. [Google Scholar] [CrossRef]
- Frei, C.; Schöll, R.; Fukutome, S.; Schmidli, J.; Vidale, P.L. Future change of precipitation extremes in Europe: Intercomparison of scenarios from regional climate models. J. Geophys. Res. Earth Surf. 2006, 111, 986–991. [Google Scholar] [CrossRef] [Green Version]
- Alexander, L.V.; Zhang, X.; Peterson, T.C.; Caesar, J.; Gleason, B.; Tank, A.M.G.K.; Haylock, M.; Collins, D.; Trewin, B.; Rahimzadeh, F.; et al. Global observed changes in daily climate extremes of temperature and precipitation. J. Geophys. Res. Atmos. 2006, 111, 1042–1063. [Google Scholar] [CrossRef] [Green Version]
- Min, S.-K.; Zhang, X.; Zwiers, F.W.; Hegerl, G. Erratum: Corrigendum: Human contribution to more-intense precipitation extremes. Nature 2013, 498, 526. [Google Scholar] [CrossRef] [Green Version]
- Schneider, T.; O’Gorman, P.A.; Levine, X.J. Water Vapor and the Dynamics of Climate Changes. Rev. Geophys. 2010, 48. [Google Scholar] [CrossRef] [Green Version]
- Demaria, E.M.C.; Hazenberg, P.; Scott, R.L.; Meles, M.B.; Nichols, M.; Goodrich, D. Intensification of the North American Monsoon Rainfall as Observed from a Long-Term High-Density Gauge Network. Geophys. Res. Lett. 2019, 46, 6839–6847. [Google Scholar] [CrossRef] [Green Version]
- Fischer, E.; Knutti, R. Observed heavy precipitation increase confirms theory and early models. Nat. Clim. Chang. 2016, 6, 986–991. [Google Scholar] [CrossRef]
- Loriaux, J.M.; Lenderink, G.; De Roode, S.R.; Siebesma, A.P. Understanding Convective Extreme Precipitation Scaling Using Observations and an Entraining Plume Model. J. Atmos. Sci. 2013, 70, 3641–3655. [Google Scholar] [CrossRef]
- Molnar, P.; Fatichi, S.; Gaál, L.; Szolgay, J.; Burlando, P. Storm type effects on super Clausius–Clapeyron scaling of intense rainstorm properties with air temperature. Hydrol. Earth Syst. Sci. 2015, 19, 1753–1766. [Google Scholar] [CrossRef]
- Dore, M.H. Climate change and changes in global precipitation patterns: What do we know? Environ. Int. 2005, 31, 1167–1181. [Google Scholar] [CrossRef] [PubMed]
- Xu, Z.; Takeuchi, K.; Ishidaira, H. Monotonic trend and step changes in Japanese precipitation. J. Hydrol. 2003, 279, 144–150. [Google Scholar] [CrossRef]
- Ding, Y. Monsoons over China; Springer Science & Business Media: Berlin/Heidelberg, Germany, 1993; Volume 16. [Google Scholar]
- Chen, A.; He, X.; Guan, H.; Zhang, X. Variability of seasonal precipitation extremes over China and their associations with large-scale ocean-atmosphere oscillations. Int. J. Clim. 2018, 39, 613–628. [Google Scholar] [CrossRef]
- Gu, X.; Zhang, Q.; Singh, V.P.; Shi, P. Changes in magnitude and frequency of heavy precipitation across China and its potential links to summer temperature. J. Hydrol. 2017, 547, 718–731. [Google Scholar] [CrossRef] [Green Version]
- Xiao, M.; Zhang, Q.; Singh, V.P. Spatiotemporal variations of extreme precipitation regimes during 1961-2010 and possible teleconnections with climate indices across China. Int. J. Clim. 2016, 37, 468–479. [Google Scholar] [CrossRef]
- Li, W.; Jiang, Z.; Zhang, X.; Li, L. On the Emergence of Anthropogenic Signal in Extreme Precipitation Change over China. Geophys. Res. Lett. 2018, 45, 9179–9185. [Google Scholar] [CrossRef] [Green Version]
- Robledo, F.; Vera, C.; Penalba, O. Multi-scale features of the co-variability between global sea surface temperature anomalies and daily extreme rainfall in Argentina. Int. J. Clim. 2019, 40, 4289–4299. [Google Scholar] [CrossRef]
- Zhao, N.; Jiao, Y.; Ma, T.; Zhao, M.; Fan, Z.; Yin, X.; Liu, Y.; Yue, T. Estimating the effect of urbanization on extreme climate events in the Beijing-Tianjin-Hebei region, China. Sci. Total Environ. 2019, 688, 1005–1015. [Google Scholar] [CrossRef] [PubMed]
- Gu, X.; Zhang, Q.; Li, J.; Singh, V.P.; Sun, P. Impact of urbanization on nonstationarity of annual and seasonal precipitation extremes in China. J. Hydrol. 2019, 575, 638–655. [Google Scholar] [CrossRef]
- Shi, W.; Yu, X.; Liao, W.; Wang, Y.; Jia, B. Spatial and temporal variability of daily precipitation concentration in the Lancang River basin, China. J. Hydrol. 2013, 495, 197–207. [Google Scholar] [CrossRef]
- Hsu, P.-C.; Lee, J.-Y.; Ha, K.-J. Influenfce of boreal summer intraseasonal oscillation on rainfall extremes in southern China. Int. J. Clim. 2015, 36, 1403–1412. [Google Scholar] [CrossRef] [Green Version]
- Song, X.; Zou, X.; Mo, Y.; Zhang, J.; Zhang, C.; Tian, Y. Nonstationary bayesian modeling of precipitation extremes in the Beijing-Tianjin-Hebei Region, China. Atmos. Res. 2020, 242, 105006. [Google Scholar] [CrossRef]
- Onyutha, C.; Willems, P. Space-time variability of extreme rainfall in the River Nile basin. Int. J. Clim. 2017, 37, 4915–4924. [Google Scholar] [CrossRef]
- Martin-Vide, J. Spatial distribution of a daily precipitation concentration index in peninsular Spain. Int. J. Clim. 2004, 24, 959–971. [Google Scholar] [CrossRef]
- Stefanidis, S.; Stathis, D. Spatial and Temporal Rainfall Variability over the Mountainous Central Pindus (Greece). Climate 2018, 6, 75. [Google Scholar] [CrossRef] [Green Version]
- Wang, Y.; Xu, Y.; Tabari, H.; Wang, J.; Wang, Q.; Song, S.; Hu, Z. Innovative trend analysis of annual and seasonal rainfall in the Yangtze River Delta, eastern China. Atmos. Res. 2019, 231, 104673. [Google Scholar] [CrossRef]
- Longobardi, A.; Buttafuoco, G.; Caloiero, T.; Coscarelli, R. Spatial and temporal distribution of precipitation in a Mediterranean area (southern Italy). Environ. Earth Sci. 2016, 75, 189. [Google Scholar] [CrossRef]
- Vishwakarma, A.; Choudhary, M.K.; Chauhan, M.S. Applicability of SPI and RDI for forthcoming drought events: A non-parametric trend and one way ANOVA approach. J. Water Clim. Chang. 2020, 11, 18–28. [Google Scholar] [CrossRef]
- Huang, W.; Liu, C.; Cao, J.; Chen, J.; Feng, S. Changes of hydroclimatic patterns in China in the present day and future. Sci. Bull. 2020, 65, 1061–1063. [Google Scholar] [CrossRef]
- Zheng, F.; Wang, H.; Luo, H.; Yi, S. Decadal change in ENSO related seasonal precipitation over southern China under influences of ENSO and its combination mode. Clim. Dyn. 2020, 54, 1973–1986. [Google Scholar] [CrossRef]
- Li, Z.; Cao, L.; Zhu, Y.; Yan, Z. Comparison of Two Homogenized Datasets of Daily Maximum/Mean/Minimum Temperature in China during 1960–2013. J. Meteorol. Res. 2016, 30, 55–68. [Google Scholar] [CrossRef]
- Li, Z.; Yan, Z.; Tu, K.; Wu, H. Changes of precipitation and extremes and the possible effect of urbanization in the Beijing metropolitan region during 1960–2012 based on homogenized observations. Adv. Atmos. Sci. 2015, 32, 1173–1185. [Google Scholar] [CrossRef]
- Cao, L.; Zhao, P.; Yan, Z.; Jones, P.; Zhu, Y.; Yu, Y.; Tang, G. Instrumental temperature series in eastern and central China back to the nineteenth century. J. Geophys. Res. Atmos. 2013, 118, 8197–8207. [Google Scholar] [CrossRef]
- Wang, X.L.; Feng, Y. RHtests_dlyPrcp User Manual. 2014. Available online: http://etccdi.pacificclimate.org/software.shtml (accessed on 15 April 2022).
- Wang, X.L.; Chen, H.; Wu, Y.; Feng, Y.; Pu, Q. New Techniques for the Detection and Adjustment of Shifts in Daily Precipitation Data Series. J. Appl. Meteorol. Clim. 2010, 49, 2416–2436. [Google Scholar] [CrossRef]
- Wang, X.L. Accounting for autocorrelation in detecting mean shifts in climate data series using the penalized maxi-mal t or F test. J. Appl. Meteorol. Climatol. 2008, 47, 2423–2444. [Google Scholar] [CrossRef]
- Wang, X.L. Penalized Maximal F Test for Detecting Undocumented Mean Shift without Trend Change. J. Atmos. Ocean. Technol. 2008, 25, 368–384. [Google Scholar] [CrossRef]
- Cao, L.; Yan, Z.; Zhao, P.; Zhu, Y.; Yu, Y.; Tang, G.; Jones, P. Climatic warming in China during 1901–2015 based on an extended dataset of instrumental temperature records. Environ. Res. Lett. 2017, 12, 064005. [Google Scholar] [CrossRef] [Green Version]
- Zhang, X.; Alexander, L.; Hegerl, G.C.; Jones, P.; Tank, A.K.; Peterson, T.C.; Trewin, B.; Zwiers, F.W. Indices for monitoring changes in extremes based on daily temperature and precipitation data. Wires Clim. Chang. 2011, 2, 851–870. [Google Scholar] [CrossRef]
- Zhang, Y.; You, Q.; Chen, C.; Li, X. Flash droughts in a typical humid and subtropical basin: A case study in the Gan River Basin, China. J. Hydrol. 2017, 551, 162–176. [Google Scholar] [CrossRef]
- Kendall, M.G. Rank correlation methods. Br. J. Psychol. 1990, 25, 86–91. [Google Scholar] [CrossRef]
- Mann, H.B. Nonparametric tests against trend. Econometrica 1945, 13, 245–259. [Google Scholar] [CrossRef]
- Catalini, C.G.; Guillen, N.F.; Bazzano, F.M.; García, C.M.; Baraquet, M.M. Web Mapping of Extreme Daily Rainfall Data in Central and Northern Argentina. J. Hydrol. Eng. 2021, 26, 05021013. [Google Scholar] [CrossRef]
- Goovaerts, P. Geostatistical approaches for incorporating elevation into the spatial interpolation of rainfall. J. Hydrol. 2000, 228, 113–129. [Google Scholar] [CrossRef]
- Vicente-Serrano, S.M.; Saz-Sánchez, M.A.; Cuadrat, J.M. Comparative analysis of interpolation methods in the middle Ebro Valley (Spain): Application to annual precipitation and temperature. Clim. Res. 2003, 24, 161–180. [Google Scholar] [CrossRef] [Green Version]
- Jiang, R.; Xie, J.; He, H.; Luo, J.; Zhu, J. Use of four drought indices for evaluating drought characteristics under climate change in Shaanxi, China: 1951–2012. Nat. Hazards 2015, 75, 2885–2903. [Google Scholar] [CrossRef]
- Zhu, W.; Wang, S.; Luo, P.; Zha, X.; Cao, Z.; Lyu, J.; Zhou, M.; He, B.; Nover, D. A Quantitative Analysis of the Influence of Temperature Change on the Extreme Precipitation. Atmosphere 2022, 13, 612. [Google Scholar] [CrossRef]
- Wei, X.D.; Yang, J.; Luo, P.P.; Lin, L.G.; Lin, K.L.; Guan, J.M. Assessment of the variation and influencing factors of vegetation NPP and carbon sink capacity under different natural conditions. Ecol. Indic. 2022, 112, 108834. [Google Scholar] [CrossRef]
- Luo, P.; Mu, Y.; Wang, S.; Zhu, W.; Mishra, B.K.; Huo, A.; Zhou, M.; Lyu, J.; Hu, M.; Duan, W.; et al. Exploring sustainable solutions for the water environment in Chinese and Southeast Asian cities. AMBIO 2021, 1–20. [Google Scholar] [CrossRef] [PubMed]
- Luo, P.; Xu, C.; Kang, S.; Huo, A.; Lyu, J.; Zhou, M.; Nover, D. Heavy metals in water and surface sediments of the Fenghe River Basin, China: Assessment and source analysis. Water Sci. Technol. 2021, 84, 3072–3090. [Google Scholar] [CrossRef] [PubMed]
- Wei, X.; Wang, N.; Luo, P.; Yang, J.; Zhang, J.; Lin, K. Spatiotemporal Assessment of Land Marketization and Its Driving Forces for Sustainable Urban–Rural Development in Shaanxi Province in China. Sustainability 2021, 13, 7755. [Google Scholar] [CrossRef]
- Zhang, H.F.; Li, J.K.; Pan, L.J.; Lu, S. Diurnal variation characteristics and north-south differences of precipitation in warm season in Shaanxi Province. Arid Land Geogr. 2020, 43, 889–898. [Google Scholar]
- Liu, W.; Zhang, M.; Wang, S.; Wang, B.; Li, F.; Che, Y. Changes in precipitation extremes over Shaanxi Province, northwestern China, during 1960–2011. Quat. Int. 2013, 313, 118–129. [Google Scholar] [CrossRef]
- Huang, Y.; Wang, H.; Xiao, W.; Chen, L.-H.; Yan, D.-H.; Zhou, Y.-Y.; Jiang, D.-C.; Yang, M.-Z. Spatial and Temporal Variability in the Precipitation Concentration in the Upper Reaches of the Hongshui River Basin, Southwestern China. Adv. Meteorol. 2018, 2018, 4329757. [Google Scholar] [CrossRef] [Green Version]
- Easterling, D.R.; Meehl, G.A.; Parmesan, C.; Changnon, S.A.; Karl, T.R.; Mearns, L.O. Climate Extremes: Observations, Modeling, and Impacts. Science 2000, 289, 2068–2074. [Google Scholar] [CrossRef] [Green Version]
- Tao, S.-Y. A review of recent research on the East Asian summer monsoon in China. Monsoon Meteorol. 1987, 60–92. [Google Scholar]
- Juneng, L.; Tangang, F.T. Evolution of ENSO-related rainfall anomalies in Southeast Asia region and its relationship with atmosphere–ocean variations in Indo-Pacific sector. Clim. Dyn. 2005, 25, 337–350. [Google Scholar] [CrossRef]
- Jiang, R.; Xie, J.; Zhao, Y.; He, H.; He, G. Spatiotemporal variability of extreme precipitation in Shaanxi province under climate change. Arch. Meteorol. Geophys. Bioclimatol. Ser. B 2016, 130, 831–845. [Google Scholar] [CrossRef]
- Feng, S.; Hu, Q. Variations in the teleconnection of ENSO and summer rainfall in northern China: A role of the Indian summer monsoon. J. Clim. 2004, 17, 4871–4881. [Google Scholar] [CrossRef]
- Wang, X.; Zhuo, L.; Li, C.; Engel, B.A.; Sun, S.; Wang, Y. Temporal and spatial evolution trends of drought in northern Shaanxi of China: 1960–2100. Theor. Appl. Climatol. 2020, 139, 965–979. [Google Scholar] [CrossRef]
- Wasko, C.; Sharma, A.; Westra, S. Reduced spatial extent of extreme storms at higher temperatures. Geophys. Res. Lett. 2016, 43, 4026–4032. [Google Scholar] [CrossRef] [Green Version]


| Station Name | Latitude | Longitude | Station Name | Latitude | Longitude |
|---|---|---|---|---|---|
| Yulin | 38.16 N | 109.47 E | Huashan | 34.29 N | 110.05 E |
| Shenmu | 38.49 N | 110.28 E | Qindu | 34.24 N | 108.43 E |
| Dingbian | 37.35 N | 107.35 E | Liuba | 33.38 N | 106.56 E |
| Hengshan | 37.56 N | 109.14 E | Fuoping | 33.31 N | 107.59 E |
| Suide | 37.30 N | 110.13 E | Shangxian | 33.52 N | 109.58 E |
| Changwu | 35.12 N | 107.48 E | Ningqiang | 32.5 N | 106.15 E |
| Luochuan | 35.46 N | 109.25 E | Shiquan | 33.03 N | 108.16 E |
| Pucheng | 34.57 N | 109.35 E | Zhenba | 32.32 N | 107.54 E |
| Taibai | 34.02 N | 107.19 E | Ankang | 32.43 N | 109.02 E |
| Yongshou | 34.42 N | 108.09 E | Zhenping | 31.54 N | 109.32 E |
| Wugong | 34.15 N | 108.13 E |
| Indices | Description | Units |
|---|---|---|
| PRCPTOT | Annual total precipitation in wet days | mm |
| Wet Days | Annual count of days when RR ≥ 1 mm | day |
| R25 | Annual count of days when RR ≥ 25 mm | day |
| R50 | Annual count of days when RR ≥ 50 mm | day |
| SDII | Annual total precipitation divided by the number of wet days in the year | mm/day |
| CWD | Continuous wet days | day |
| Rx1day | Maximum daily precipitation | mm |
| Rx3day | Maximum precipitation for three consecutive days | mm |
| Station Name | Changepoint | Station Name | Changepoint |
|---|---|---|---|
| Yulin | 1963/1965 | Huashan | 1980 |
| Shenmu | 1963/1970 | Qindu | 1975/1979 |
| Dingbian | 1969/1971 | Liuba | 1971 |
| Hengshan | 1962/1969 | Fuoping | 1975 |
| Suide | 1980 | Shangxian | 1976 |
| Changwu | 1974/1976 | Ningqiang | 1971 |
| Luochuan | 1979 | Shiquan | 1962/1977 |
| Pucheng | 1973/1977 | Zhenba | 1972/1985 |
| Taibai | 1978 | Ankang | 1962/1987 |
| Yongshou | 1979 | Zhenping | 1982 |
| Wugong | 1977 |
| Station Name | Z Value | |||||||
|---|---|---|---|---|---|---|---|---|
| PRCPTOT | Wet Days | R30 | R50 | SDII | CWD | Rx1day | Rx3day | |
| Yulin | −1.5005 | −1.9872 * | −1.5469 | −0.8633 | −0.2260 | 0.68421 | 0.026832 | 0.03354 |
| Shenmu | −1.2508 | −0.5725 | −2.3274 * | −1.9664 * | −1.0392 | −0.2482 | −0.19453 | 0.85862 |
| Dingbian | −1.7486 | −0.1494 | −1.8731 | −2.6074 * | −1.6553 | 0.18782 | 1.9386 | 1.5361 |
| Hengshan | −2.0857 * | −2.9374 * | −2.2885 * | −2.1668 * | −3.4994 * | 0.80496 | −0.98607 | 0.26832 |
| Suide | −3.0764 * | −4.8898 * | −2.7056 * | −1.8076 | −0.8517 | −1.5831 | −0.4159 | 0.70434 |
| Changwu | −4.0636 * | −1.5246 | −3.6653 * | −3.9516 * | −4.2378 * | 2.0661 * | 0.83179 | 1.5361 |
| Luochuan | −4.3653 * | −4.2585 * | −4.0747 * | −2.8529 * | −2.2953 * | 2.8308 * | 0.18782 | 0.31528 |
| Pucheng | −2.1973 * | −3.2959 * | −1.5302 | −1.0463 | 0.2420 | −1.724 | −0.62384 | 0.95924 |
| Taibai | −5.4326 * | −4.2689 * | −4.7232 * | −4.8290 * | −6.4033 * | −1.3483 | −2.0459 * | −1.8984 |
| Yongshou | −3.4659 * | −2.4588 * | −1.6610 | −3.3024 * | −2.8381 * | −1.3483 | −2.0459 * | −1.8984 |
| Wugong | −2.7597 * | −3.1717 * | −1.9749 * | −2.7466 * | −1.0332 | −1.8648 | 0.99949 | 0.71105 |
| Huashan | −6.5270 * | −3.9064 * | −5.8878 * | −5.8029 * | −5.4689 * | −0.5903 | −1.2879 | −1.241 |
| Qindu | −2.3210 * | −2.9851 * | −1.1269 | −1.3886 | −0.3824 | −1.4221 | 1.4623 | 1.1739 |
| Liuba | −2.5703 * | −2.4427 * | −2.0282 * | −1.8050 | −2.0473 * | −1.3751 | −0.57689 | 0.06037 |
| Fuoping | −3.6964 * | −3.8644 * | −1.9602 * | −3.0057 * | −2.0411 * | −1.355 | 0.53664 | 0.28174 |
| Shangxian | −3.5051 * | −4.0787 * | −2.2827 * | −2.4275 * | −1.6802 | 0.34211 | 2.113 * | 1.2209 |
| Ningqiang | −3.6653 * | −4.1320 * | −2.8688 * | −1.6055 | −2.3585 * | −1.9453 | −1.08 | −1.0397 |
| Shiquan | −0.4750 | −4.67418 | 0.7572 | 0.6953 | 2.3061 * | 0.13416 | 0.060372 | 1.033 |
| Zhenba | −0.5755 | −2.5504 * | −0.1177 | 0.8044 | 0.5428 | 0.10062 | 0.14758 | 0.06708 |
| Ankang | −0.2661 | −3.4365 * | 0.7473 | 0.5492 | 1.1606 | 0.10062 | 1.1404 | 0.40919 |
| Zhenping | −1.5626 | −0.4888 | −0.7848 | −1.1840 | −1.2047 | 0.59701 | 1.8112 | 0.71105 |
| Station Name | Z Value | ||||
|---|---|---|---|---|---|
| Annual | Spring | Summer | Autumn | Winter | |
| Yulin | −2.0858 * | −0.8398 | −1.3010 | −2.3061 * | 0.4268 |
| Shenmu | −2.3474 * | 0.1170 | −2.0101 * | 0.2272 | 1.0670 |
| Dingbian | 0.9087 | −0.0551 | 1.0257 | 0.5301 | 0.5782 |
| Hengshan | −2.3887 * | −0.2478 | −2.5057 * | −1.1496 | −0.1377 |
| Suide | −2.7329 * | −2.0170 | −1.6728 | −2.8224 * | −0.5576 |
| Changwu | 0.5438 | 0.2341 | 0.0069 | −1.3699 | 0.7572 |
| Luochuan | −1.1427 | −0.1308 | −0.9087 | −2.3130 * | −0.1790 |
| Pucheng | −3.1528 * | −2.5333 | −1.6108 | −1.9550 | −1.1427 |
| Taibai | −1.7003 | −0.7503 | −3.4626 * | −1.8793 | 0.6884 |
| Yongshou | 0.0138 | −1.2735 | −0.7572 | 0.4130 | −0.5851 |
| Wugong | −0.6264 | −0.7503 | −2.2304 * | −1.2804 | −1.9412 |
| Huashan | −0.6884 | −1.5282 | −0.9224 | 0.7435 | −0.8949 |
| Qindu | −0.9018 | −0.7435 | −0.8949 | −1.1496 | −1.8999 |
| Liuba | 0.2341 | 0.1996 | 2.2786 * | −1.0257 | −0.5232 |
| Fuoping | 1.0050 | 0.4406 | 0.1928 | 0.0826 | −1.5420 |
| Shangxian | −0.2341 | −1.3424 | −0.5094 | −1.5007 | −1.3217 |
| Ningqiang | −1.2873 | −0.4819 | 0.9362 | −0.3235 | −3.2905 * |
| Shiquan | −1.7347 | −0.5369 | −1.7967 | −2.3956 * | −2.3543 * |
| Zhenba | 0.5163 | −0.1101 | −1.0463 | −0.1377 | 0.6953 |
| Ankang | −1.2529 | −0.4130 | −0.9293 | −1.7416 | −3.2629 * |
| Zhenping | 1.4731 | 0.9500 | 0.0207 | −0.0895 | −1.0395 |
Publisher’s Note: MDPI stays neutral with regard to jurisdictional claims in published maps and institutional affiliations. |
© 2022 by the authors. Licensee MDPI, Basel, Switzerland. This article is an open access article distributed under the terms and conditions of the Creative Commons Attribution (CC BY) license (https://creativecommons.org/licenses/by/4.0/).
Share and Cite
Wang, S.; Cao, Z.; Luo, P.; Zhu, W. Spatiotemporal Variations and Climatological Trends in Precipitation Indices in Shaanxi Province, China. Atmosphere 2022, 13, 744. https://doi.org/10.3390/atmos13050744
Wang S, Cao Z, Luo P, Zhu W. Spatiotemporal Variations and Climatological Trends in Precipitation Indices in Shaanxi Province, China. Atmosphere. 2022; 13(5):744. https://doi.org/10.3390/atmos13050744
Chicago/Turabian StyleWang, Shuangtao, Zhe Cao, Pingping Luo, and Wei Zhu. 2022. "Spatiotemporal Variations and Climatological Trends in Precipitation Indices in Shaanxi Province, China" Atmosphere 13, no. 5: 744. https://doi.org/10.3390/atmos13050744