
The Effect of Anthropogenic Heat and Moisture on Local Weather at Industrial Heat Islands: A Numerical Experiment


1
School of Mechanical Sciences, IIT Bhubaneswar, Bhubaneswar 752050, Odisha, India
2
Cooperative Institute for Research in the Atmosphere (CIRA), Colorado State University, Fort Collins, CO 80523, USA
*
Author to whom correspondence should be addressed.
Atmosphere 2022, 13(2), 357; https://doi.org/10.3390/atmos13020357
Submission received: 27 January 2022
/
Revised: 14 February 2022
/
Accepted: 17 February 2022
/
Published: 20 February 2022
(This article belongs to the Special Issue Climate Change and Climate Variability, and Their Impact on Extreme Events)
Abstract
:The current study addresses the role of heat and moisture emitted from anthropogenic sources on the local weather with the aid of numerical weather prediction (NWP). The heat and moisture emitted by industries to the atmosphere are considered main sources in this study. In order to understand the effect of heat and moisture on local weather, the study is conducted to capture the impact of heat with no moisture change. The results are compared against a control run case without perturbation and also against the case where both heat and moisture are perturbed with temperature as a single parameter. The Angul district in Odisha that houses over 4000 industries is considered our study region. The numerical simulations are performed using the mesoscale Weather Research and Forecasting (WRF) model for two rain events, namely a light rain case and a heavy rain case, with different physics options available in the WRF model. The WRF simulated maximum rainfall rate using various microphysics schemes are compared with the Tropical rainfall measuring mission (TRMM) observations for validation purposes. Our study shows that the WDM6 double moment microphysics scheme is better in capturing rain events. The TRMM-validated WRF simulation is considered a reference state of the atmosphere against which comparisons for the perturbed case are made. The surface temperature is perturbed by increasing it by 10 K near the industrial site and exponentially decreasing it with height up to the atmospheric boundary layer. A numerical experiment represents heating without addition of moisture by recalculating the relative humidity (RH) corresponding to the perturbed temperature. The perturbed temperature affects sensible heat (SH) and latent heat (LH) parameters in the numerical experiment. From the results of the numerical investigation, it is found that the near-surface rainfall rate increases locally in a reasonable manner with the addition of sensible heat to the atmosphere. A comparison against the case where moisture is added shows that enhanced rainfall is more sensitive to sensible and latent heat than sensible heat alone.
1. Introduction
Climate variability due to increased anthropogenic emissions is receiving considerable attention worldwide nowadays. Anthropogenic emission mainly includes heat, moisture, pollutants and gases, affecting the precipitation rate by modifying cloud microphysics. The extent of anthropogenic emission synchronously increases anthropogenic heating (AH) due to increased industrial and commercial activity, the burning of fossilised fuel, an increase in electric energy consumption, waste heat from vehicles and human metabolism [1,2]. Apart from AH, rapid changes in a region’s land use/land cover (LULC) results in a temperature rise. Some of the anthropogenic sources emit moisture/water vapour along with heat. Anthropogenic emission (with AH and moisture) under certain meteorological conditions can affect the weather locally.
Industrial activities are one of the significant sources of AH and the main concern to the population nearby. Industries of any kind mainly release heat in the form of SH or LH as the waste heat to the atmosphere. The waste heat and water vapour thus rejected by the plant during its operation can enhance the convection mechanism by increasing buoyancy, leading to strong winds and changes in rain patterns.
The previous study shows that excess heat and moisture discharged from cooling towers near the industrial zone resulted in cumulus clouds [3]. Several studies [4,5] also point out that the vapour plume rise, buoyancy and moisture fluxes released from industries result in fog and cloud formation up to the industries’ boundaries. The waste heat and the water vapour emitted from large cooling towers augment the natural precipitation [6,7]. Fifteen percent more rainfall was observed on the downwind side of the industrial complex than non-urban areas nearby [8]. However, local weather records near a 2000 MW power station with eight natural-draught cooling towers [9] showed that the emissions from the station had not altered the values of total precipitation. Rainfall data of the Neyveli thermal power station within the range of 100 km [10] were examined, and more rainfall was observed in the close vicinity of the station.
The model-based calculation, Hindman et al. [11] found that the sensible heat, water vapour and the pollution from the paper mill tend to increase local rainfall. Further, another case study [12,13] showed the waste heat in the form of sensible heat, and latent heat was responsible for cumulus cloud development. Moreover, Guan and Reuter [14] carried out a numerical simulation to quantify the relative contribution of heat, vapour and cloud condensation nuclei (CCN) on cloud development and rain formation. The simulation result showed that precipitation is influenced mainly by the mutual interactions of waste heat and industrial CCN.
Population density and human activities continued to increase in the recent past. Large scale urbanisation has a significant influence on climate change in major cities. Most of the previous studies mainly focus on the urbanisation effect due to LULC on the regional/local climate [15,16,17,18]. The influence of urbanisation on the local environment is complex and largely dependent on the intensity of AH, geographical location and inclusion of moisture.
Urban Heat Island (UHI) is mainly applicable for an urban area wherein air temperatures are higher than surrounding rural or less-developed areas. This temperature difference, termed Urban Heat Island intensity, is generated mainly due to an increase in AH. The impact of AH on UHI formation was investigated [19,20] by balancing energy utilisation in the city area. Large AH changes the thermodynamic structure of the urban regions by affecting the near-surface temperature. A maximum UHI intensity of 10 °C was observed in one of the major cities of the USA [21]. This intensity of UHI may cause uplifting the local heat flux and spreading to the atmospheric planetary boundary layer (PBL)/higher troposphere, which lead to instability in the thermodynamic and dynamic structure of the urban environment. Further inclusion of AH may enhance the convergence of water vapour over the metropolitan area. Together with ground surface heating, atmosphere instability and the inclusion of water vapour indirectly influence the intensity of rainfall rate in urbanised areas.
The earlier case study in London Atkinson [22] found that large urban areas intensify rainfall. The Metropolitan Meteorological Experiment (METROMEX) was carried out [23] to study the rainfall medication in major cities. Based on METROMEX, Ackerman et al. [24] observed an increase in precipitation in the downwind of St. Louis relative to other areas. Further analysis of METROMEX indicates that urbanisation increased precipitation between 5% and 25% during the summer months, and effects were confined within 50–75 km downwind of the city [25,26,27]. Apart from METROMEX findings, many studies indicated an increase in rainfall in the leeward of major cities [28,29,30].
Studies performed by Feng et al. [31] show that anthropogenic heat reduces the precipitation in the Yangtze River Delta region. However, a study conducted by Chen et al. [32] in the same area shows that the combined impact of urbanisation and AH increased summer and winter precipitation. Nie et al. [33] incorporated anthropogenic heat data from the Building Effects Parameterization and Building Energy Model (BEP-BEM) and found increased rainfall over the urban area due to anthropogenic heat.
In coastal urban areas, extreme rainfall is due to extensive heat flux, atmospheric instability, strong vertical convection and water vapour from the sea [34,35]. Studies focused on the coastal Pearl River Delta (PRD) megacity region in China [36] showed an increase in the total rainfall by 6.3% and 7.4% due to AH and urban land-use change (ULUC). Hu et al. [37] conducted a numerical experiment in the same region and found an increase in intensity and frequency of rainfall over the PRD area. This enhancement is mainly due to the amount of water vapour flux from the South China Ocean and the wind direction.
Most UHI-based studies on densely populated cities have urban infrastructures such as buildings, offices and commercial complexes [38,39]. However, core industrial zones are the potential sites for the heat island effect despite the lower population than urban areas. The heat island effect applied to an industrial zone is the Industrial Heat Island (IHI). IHI causes the near-surface and atmospheric temperatures to rise above their expected value [10,40]. It has been established that plant operations can impact local weather under certain conditions. With this background, the prime objective of the work is to study the effect of heat and moisture confined to the industrial zone.
Our literature survey shows that the interaction between anthropogenic emissions and the state of the atmosphere is complex. There is a huge gap in the studies considering the effect of anthropogenic heat from different sources on local weather, with no significant conclusion quantifying the effect of rain rate. A case study over the Hangzhou urban city produces a contradictory result [31,32]. Many authors have also produced conflicting reports about the influence of industrial effluents on rainfall [7,9,10]. Although some of the industry emits water vapour and heat, none of the existing literature shows the relative contribution of water vapour and heat on local weather. Either researchers ignored the effect of anthropogenic moisture or considered the combined effect of all anthropogenic effluents on climate. Understanding the effect based on observation alone is highly challenging. It is often difficult to quantify the contribution of anthropogenic heat and anthropogenic moisture’s contribution to local weather out of all anthropogenic effluents. However, this can be addressed using a numerical experiment.
Hence by considering such anthropogenic emissions from different sources in the atmosphere and gaps in the literature, a dedicated study is needed to understand the relative contribution of anthropogenic effluents on local weather to predict the environmental condition. Therefore, a numerical analysis is carried out using mesoscale Weather Research and Forecasting (WRF) model in the present study. The WRF is a widely used model for regional weather [41,42], air quality [43] and climate simulations [44]. The WRF model-simulated atmospheric profiles are used as first guess for various satellite-based rainfall estimation algorithms [45,46,47]. Attada et al. [48] investigated the spatial distribution of rainfall pattern by assimilating satellite-retrieved temperature and moisture profiles in the WRF model.
2. Study Area
The Angul district is located in the central part of Odisha and 120 km away from the capital city of the state. Keonjhar surrounds it in the North, Cuttack in the East, Boadh in the South and Sambalpur in the West direction. The total geographical area of the district is 6375 km2, and it has a maximum elevation of 1186 m.
2.1. Topographical Features
Topographically, the study region is divided into three natural tracks. The first and second track consist of a chain of hills along the north-east, south-west direction of the region. The third division is a valley of the river Brahmani running around the boundary of the Talcher district.
2.2. Climatological Features
The study region has a tropical monsoon climate and is one of the hottest districts in India. The summer season lies from March to May, while the monsoon season extends from June to September and the dry winter season from November to February. In this study, the regional temperature lies within 44–46 °C in the summer season, and the maximum temperature of 50 °C was recorded in May 2005 [49].
2.3. Industrial Features
The Angul region is one of the mineral-rich zones of the country. This region contains various industrial units such as coal mining, aluminium smelting, steel manufacturing, thermal power generation units, etc. The district has over 4000 industries ranging from small to large scales.
3. Model System Setup
3.1. Model Domain
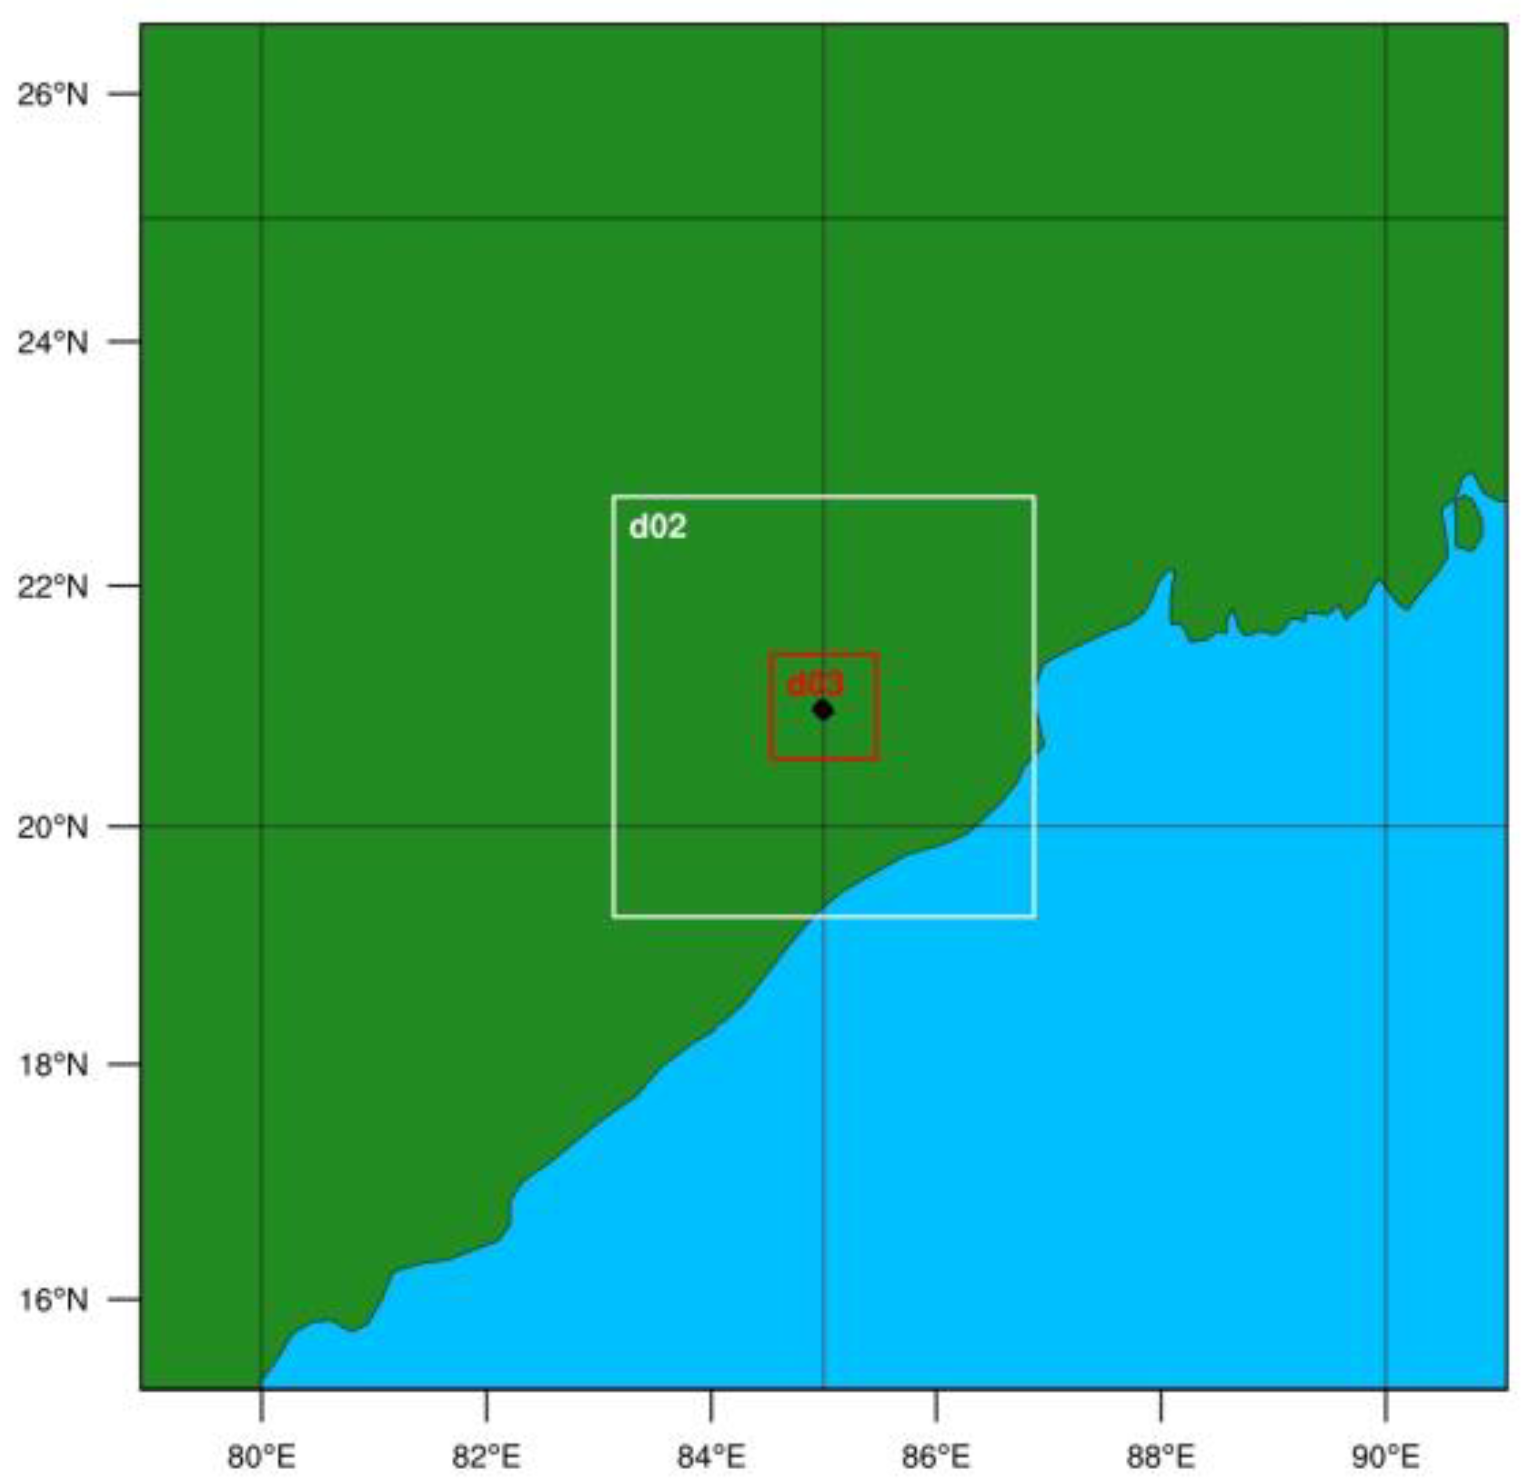
The present study considers the Angul region (85° E, 21° N) at the centre with a resolution of 5 km bounded within 90 × 90 km as the study region, identified as domain d03 in Figure 1. To have a smooth interpolation from a coarse input domain (~100 km resolution), two domains (the outer domain (d02) and outermost domain (d01)) are considered. The domain d01 extends up to 1170 × 1170 km, while the domain d02 has a coverage of 360 × 360 km. The resolution scale for the core domain and other domains follows a 3:1 ratio. The total numbers of grid points in different domains from the outermost to the innermost are 676, 576 and 324. WRF-generated output from the core domain alone is taken for further processing, which includes the perturbation location where numerical experiments are carried out. ‘Mercator’ map projection is used to convert Geodesic coordinates to Cartesian coordinates.
3.2. Initial and Boundary Conditions
The model simulations require initial and boundary conditions for realistic simulations of the state of the atmosphere. Data from the National Centre for Environmental Prediction (NCEP) are considered initial and boundary conditions. The NCEP final analysis (FNL) data are available at 1° × 1° resolution and are updated in six-hour intervals. The simulation is initialised from 12:00 Coordinated Universal Time (UTC) of the previous day, and the simulation time is marched up to 00:00 UTC of the next day. In the total 36 h of model simulation, the first 12 h is used to allow the model to spin up. The spin-up cycle is added to balance instability issues within the simulation. The model output is captured with a temporal resolution of 15 min and has been used for analysis.
3.3. Physics Options
The WRFV3.7 model has several options for parameterisation. The main physics parameterisation schemes available in the WRF solver are Cumulus Parameterization (CP), Planetary Boundary Layer (PBL) and Microphysics Schemes (MS), as listed in Table 1. The accuracy of the model simulation mainly depends on the selection of physics schemes [50,51]. Therefore, the present study focuses on finding out the best physics options that are suitable for the numerical experiment.
The KF scheme [52] based on a simple cloud model considered for this study. The KF scheme can capture convection at small grid spacing (less than 5 km). The lowest layer of the atmosphere is the planetary boundary layer (PBL). This layer plays a vital role in energy transportation, including momentum, heat and moisture. The Yonsei University scheme (YSM) and Mellor–Yamada–Nakanishi–Niino 3 level TKE (MYNN3) used for air pollution dispersion studies [53], capable of producing better performance in simulating surface metrological variables and hence are considered in this study.
Three bulk MS are considered, i.e., Kessler, WRF Single Moment 6-class scheme (WSM6) and WRF Double moment, 6-class scheme (WDM6). Kessler microphysics scheme is a warm rain scheme consisting of three hydrometers, namely water vapour, cloud water and rainwater. In this scheme, raindrop sizes are modelled using Marshall Palmer distribution [54]. The WSM6 (single moment 6 class scheme) is the advanced version of the Kessler microphysics scheme and consists of snow, graupel, ice and the three hydrometers mentioned in the Kessler Scheme. WDM6 (double moment 6 class scheme) is developed based on WSM6 scheme and predicts number concentrations for cloud and rainwater along with the prediction of the six hydrometers as in the WSM6. The cloud and raindrop DSDs are assumed to follow a generalised gamma distribution [55].
4. Methodology
4.1. Description of Numerical Experiment
The objective of the numerical experiment is to include anthropogenic heat and moisture in model simulation at the industrial site. Again, the accurate estimation of anthropogenic heat and moisture is quite challenging. Therefore, numerical experimentation is carried out such that heat and moisture are added to the atmosphere by increasing the temperature by 10 K at the surface [10,21,56], with an exponential decrease up to the atmospheric boundary layer (~1 km). However, an increase in air temperature for the same amount of moisture results in reducing relative humidity. To account for this, relative humidity is recalculated based on the perturbed temperature such that the amount of moisture in the atmosphere remains the same. The changes to the temperature and relative humidity are completed through initial and boundary conditions to the core domain that is fed as input to the WRF model. The objectives of the present study are highlighted as follows:
- ❖
- To validate the WRF simulation as a control run against the TRMM PR’s observation. Based on this validation exercise, the best set of microphysics and parameterisation options are found.
- ❖
- To perform a numerical experiment (Exp 1) to study the effect of heat released to the atmosphere by increasing temperature by 10 K at the industrial site and exponentially decreasing with height up to the atmospheric boundary layer. The relative humidity is recalculated, corresponding to the perturbed temperature.
- ❖
- Finally, to compare the numerical experiment result against the case in which only the temperature alone is perturbed (Exp 2) based on an earlier study [56]. Since relative humidity is unchanged in this case, the water vapour content in the atmosphere would significantly increase.
4.2. Design of Numerical Experiment
Design of Experiment is completed using modified a Clausius Clapeyron equation [57] given by
- T0 = Initial Temperature
- T1 = Temperature after perturbation by increasing 10 K
- ∅0, ∅1 = RH before and after perturbation
By putting T1 and T0, the Equation (1) can be written as
Using Equation (2) in Equation (4), Pv can be found. Later, by substituting for Pv in Equation (5), ∅1 correspond to T1 can be obtained. The values of temperature T0 and relative humidity ∅0 are replaced with the perturbed temperature T1 and the recalculated relative humidity ∅1 in the input file to WRF. Parameters of interest are rain rate (R) and median diameter (Do), which are calculated from the extracted value of rainwater mixing ratio (qr) and water vapour mixing ratio (qv) from the model simulation [56].
5. Results and Discussion
Results and Discussion comprises of four sections. In Section 5.1, simulated maximum rainfall compared with TRMM observation for two different rain events. In the recent work of Mishra and Kannan [58], a numerical study was conducted for a single rain event. For the robust conclusion, the work is further extended for two different rain events and the microphysics of rain formation. The analysis of two rain events is conducted in Section 5.2 and Section 5.3, respectively. The discussion is carried out in two parts for both rain events. In the first part, perturbed atmospheric parameters such as water vapour mixing ratio, rain rate and flow pattern are compared with a TRMM-validated control run case. The second part study is performed on the microphysics of rain by comparing different parameters such as the median diameter of raindrops, cloud number concentration and rain number concentration with perturbed cases. In Section 5.4, a detailed discussion is made on the inconsistent effect on urban precipitation found in the literature along with major findings.
5.1. Validation
Two rain events were selected for this study during the monsoon and summer season that occurred during 16 August 2008 and 22 March 2008, respectively. These dates were identified based on the earlier work by Mishra and Kannan [56]. Mishra and Kannan [56] compared the histogram of rainfall data observed by TRMM PR with simulated rainfall by WRF using different microphysics schemes, i.e., Kessler, WSM6 and WDM6. From the qualitative comparison it was observed that the rainfall distribution simulated using WDM6 matches closely with TRMM PR observations for both the rain events.
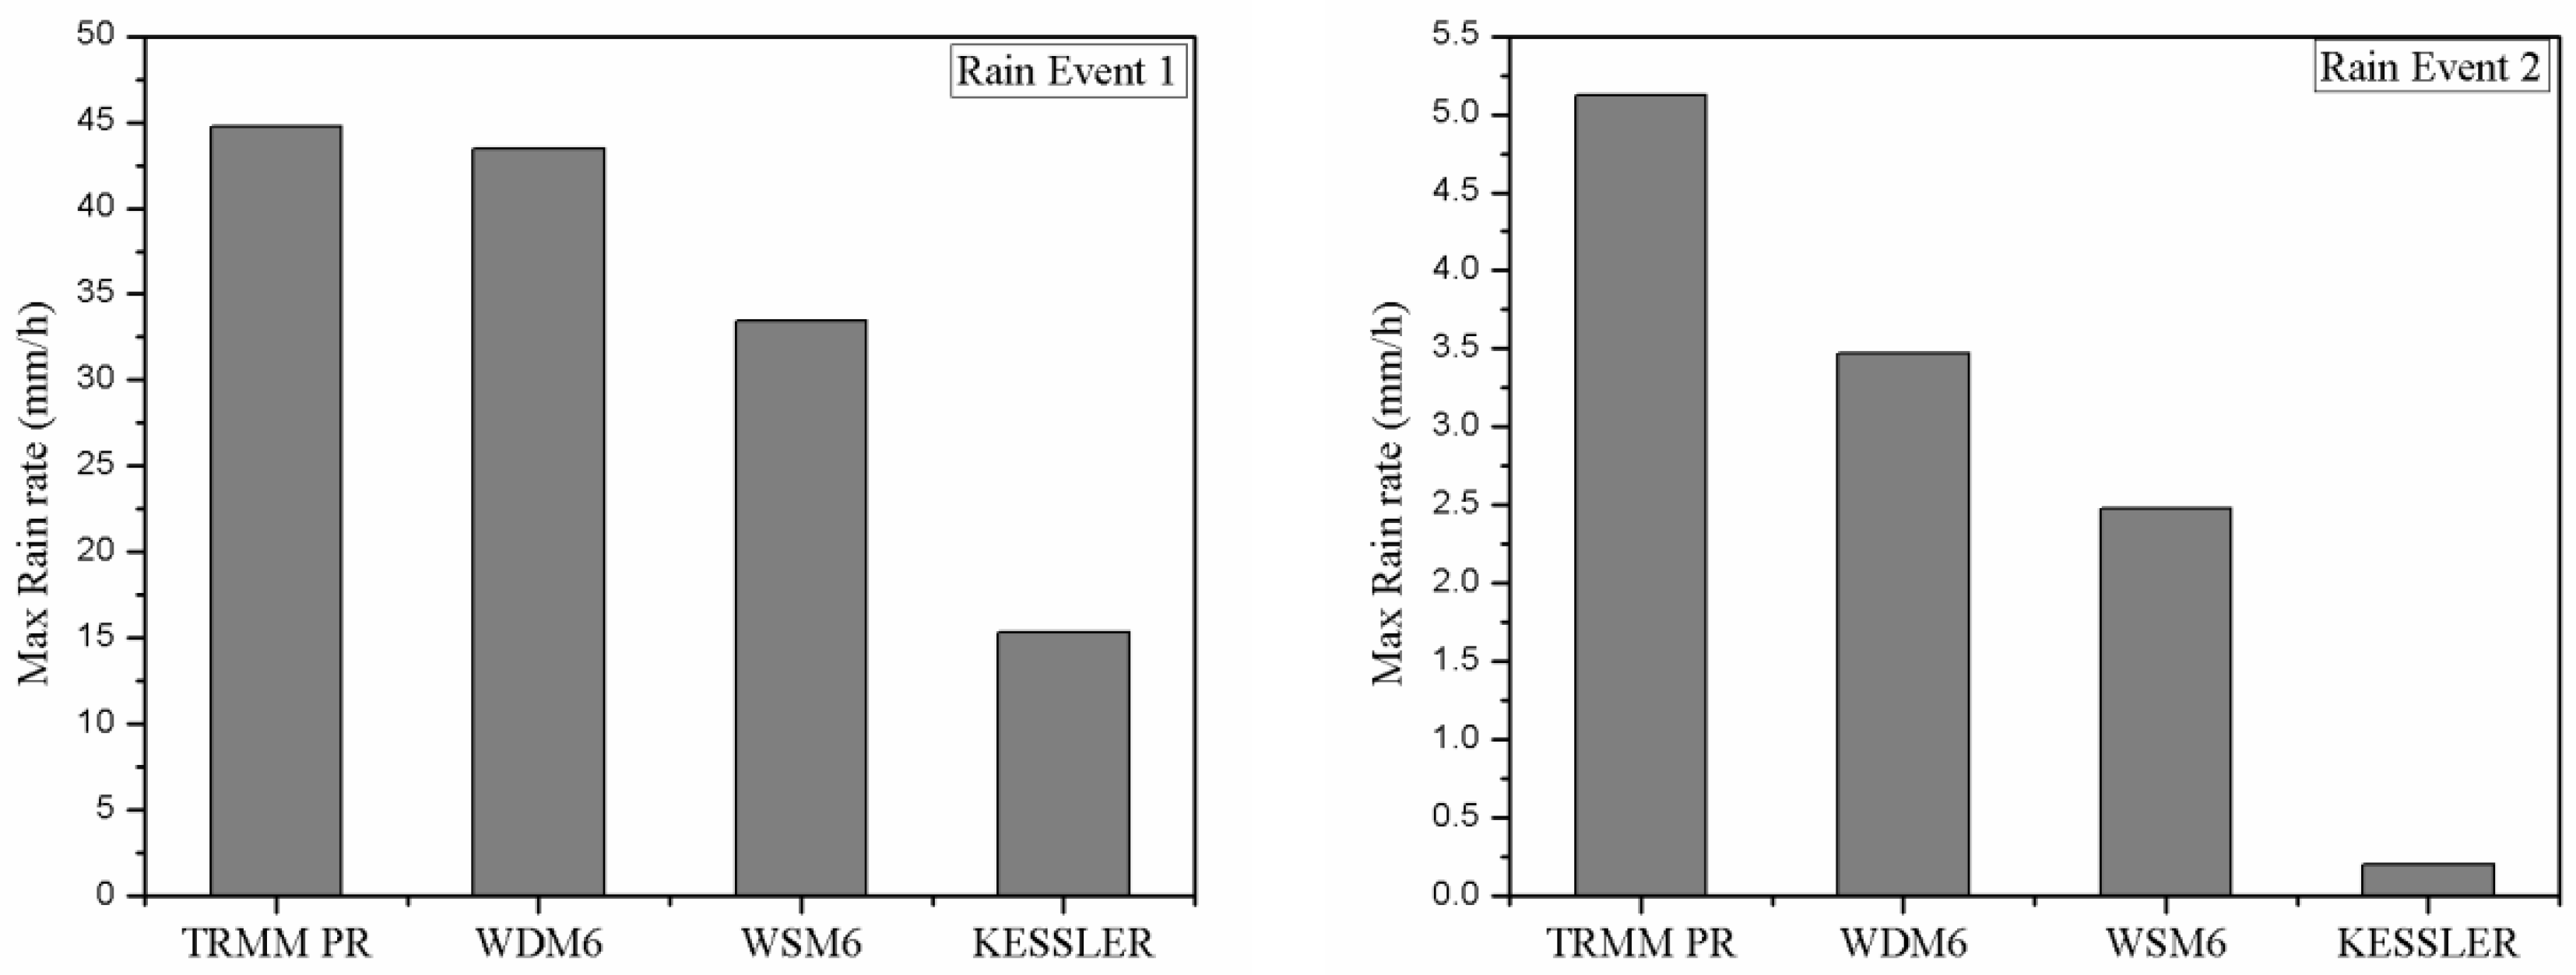
In the present work, validation by Mishra and Kannan [56] was reproduced for the sake of completeness. The maximum rainfall recorded by TRMM PR was compared with the simulated rain for the same region. For rain event 1 (16 August 2008), the maximum rain rate simulated by the WDM6 scheme was 43.46 mm/h, comparable to TRMM PR observation, i.e., 44.78 mm/h. From Figure 2, the maximum rain rates corresponding to WSM6 and Kessler are 33.46 mm/h and 15.34 mm/h, respectively, deviating from the TRMM PR observation. Similar findings were obtained for the second rain event (22 March 2008) (see Figure 2). The Kessler microphysics scheme predicted no rain for this event, whereas observation shows a maximum rain of 5.12 mm/h.
Again, WSM6 and WDM6 show a maximum rainfall of 2.48 mm/h and 3.47 mm/h. This comparison indicates that the WDM6 shows relatively good agreement with the TRMM PR observation. So, by considering all the comparisons, WDM6 microphysics based simulation is used as the control run case against which numerical experimentation will be carried out.
5.2. Rain Event 1
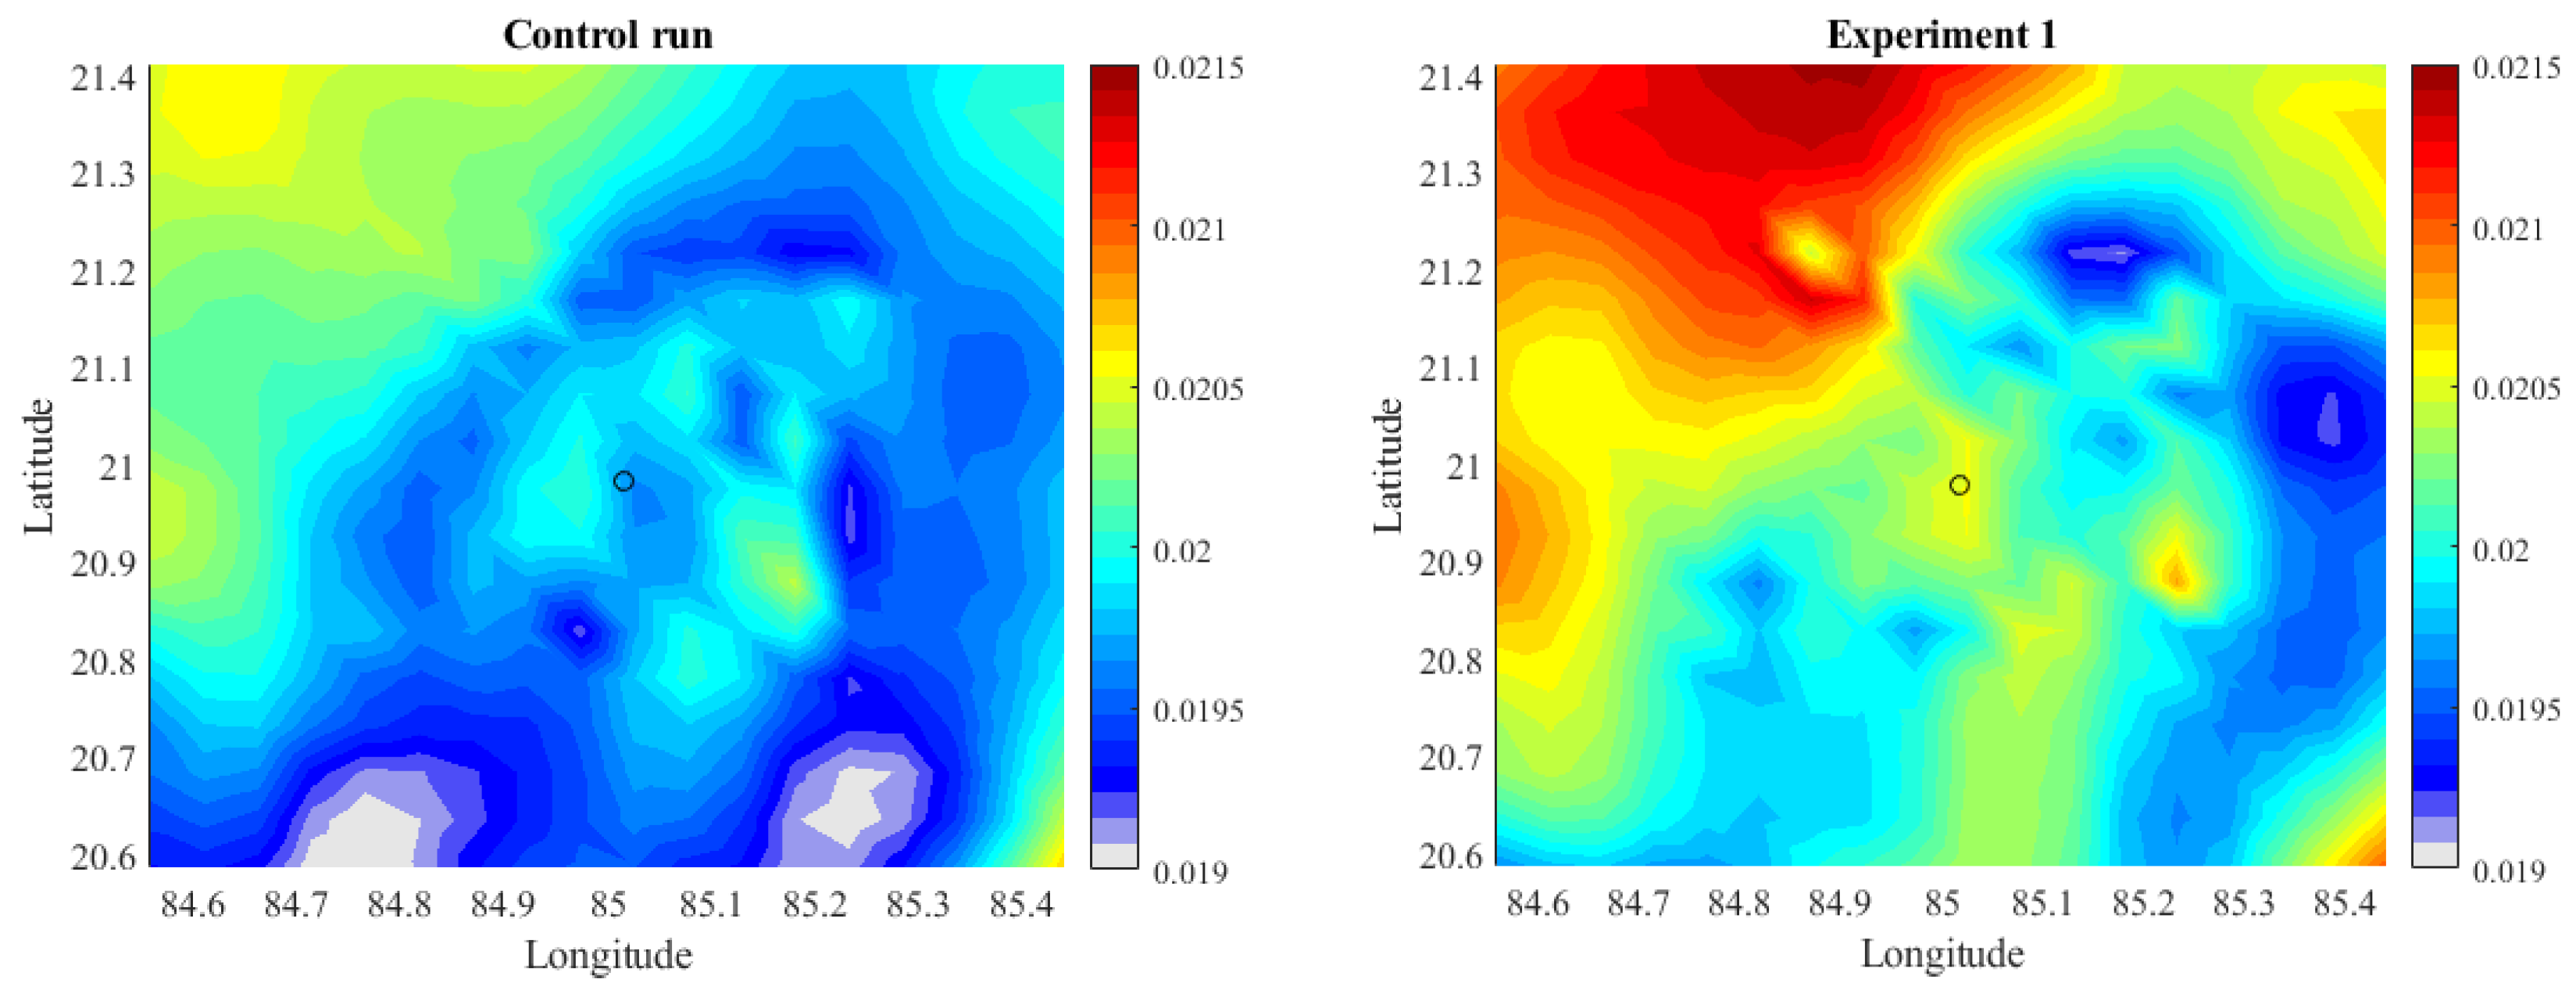
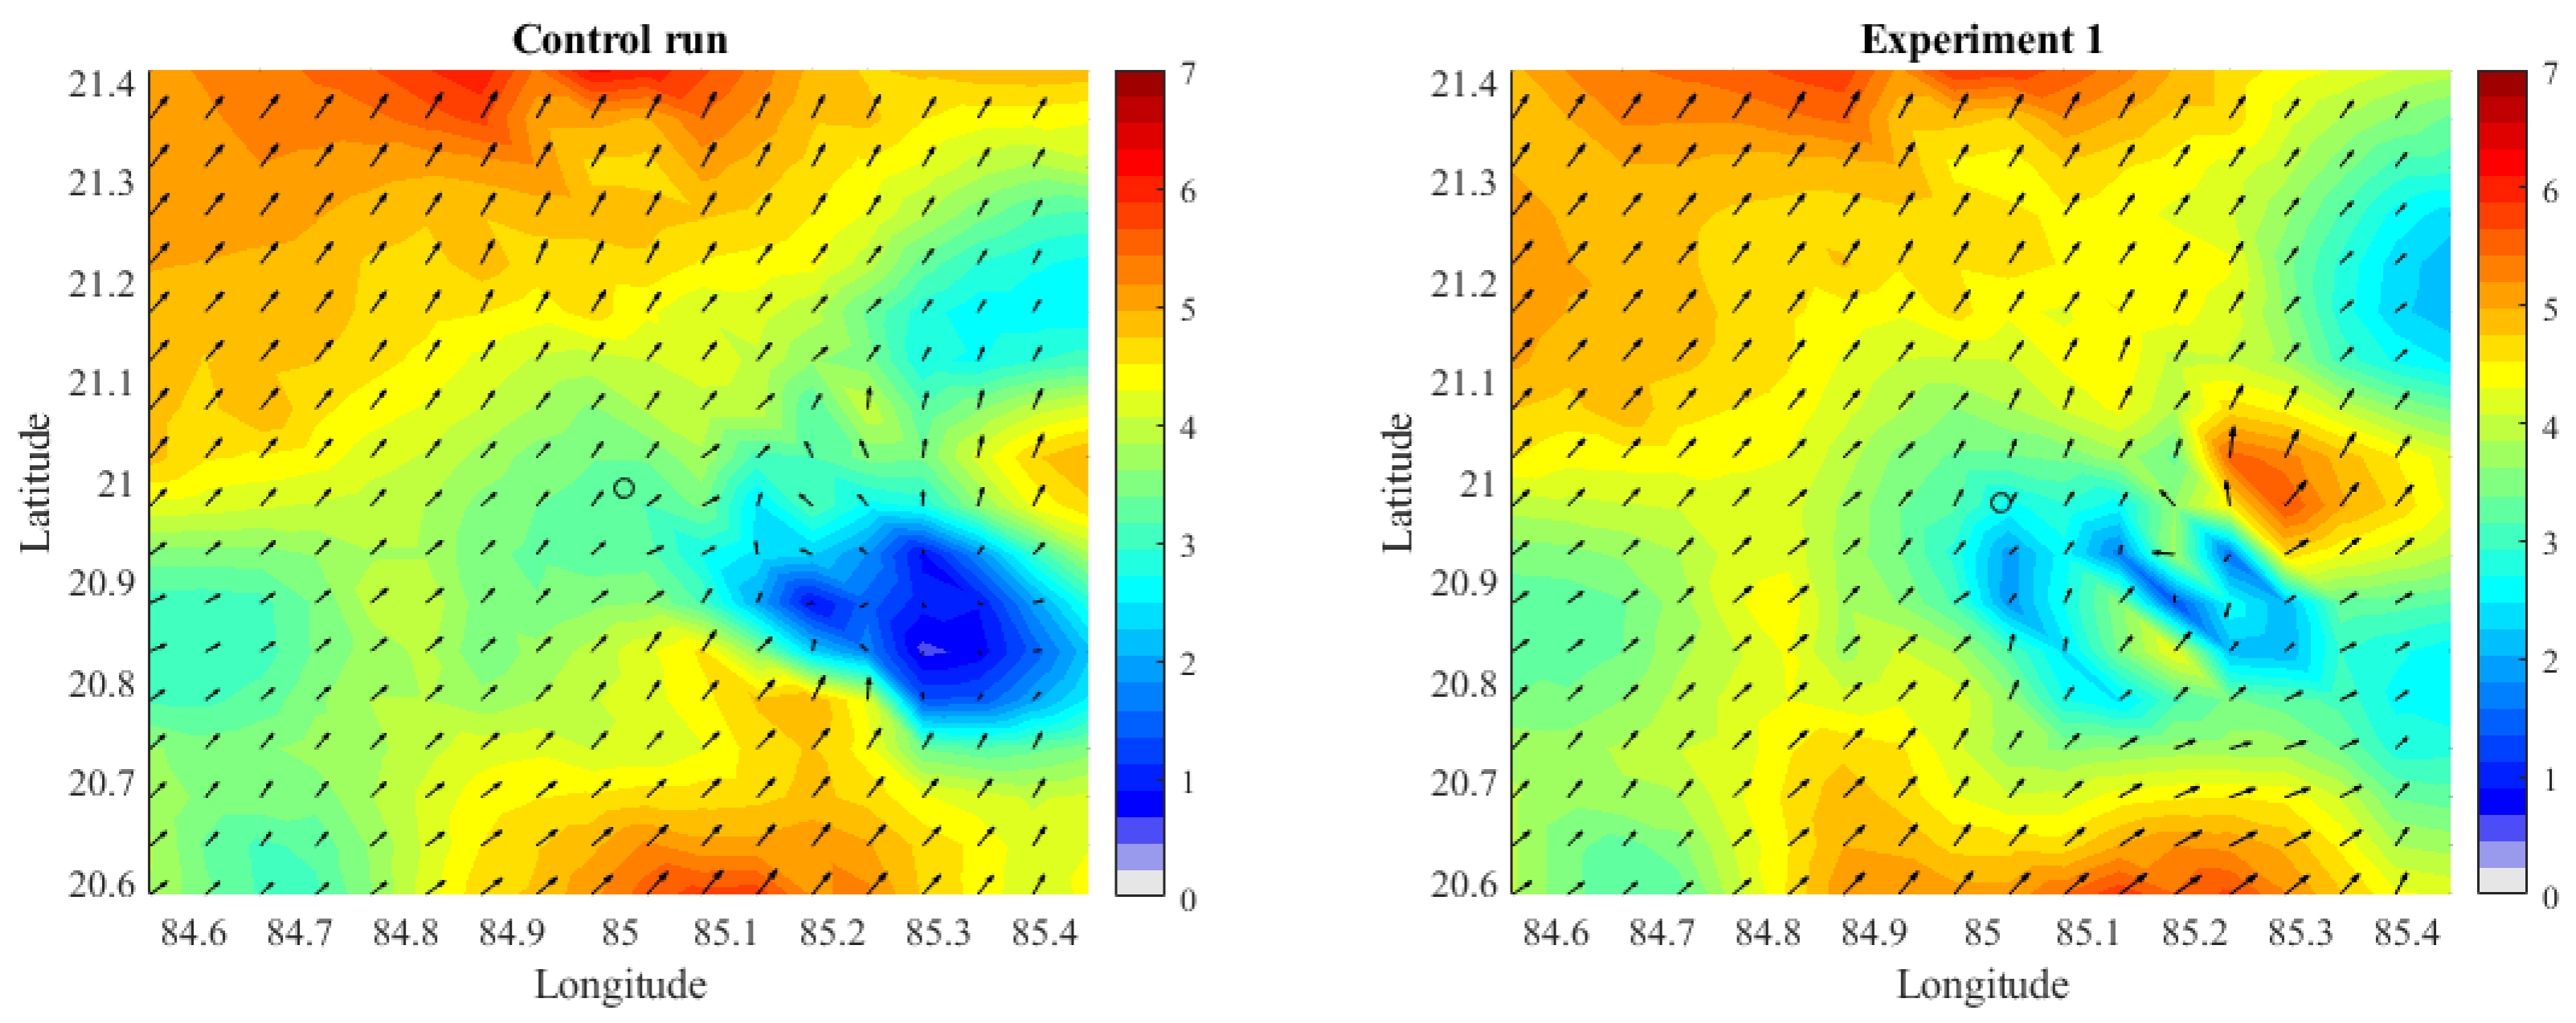
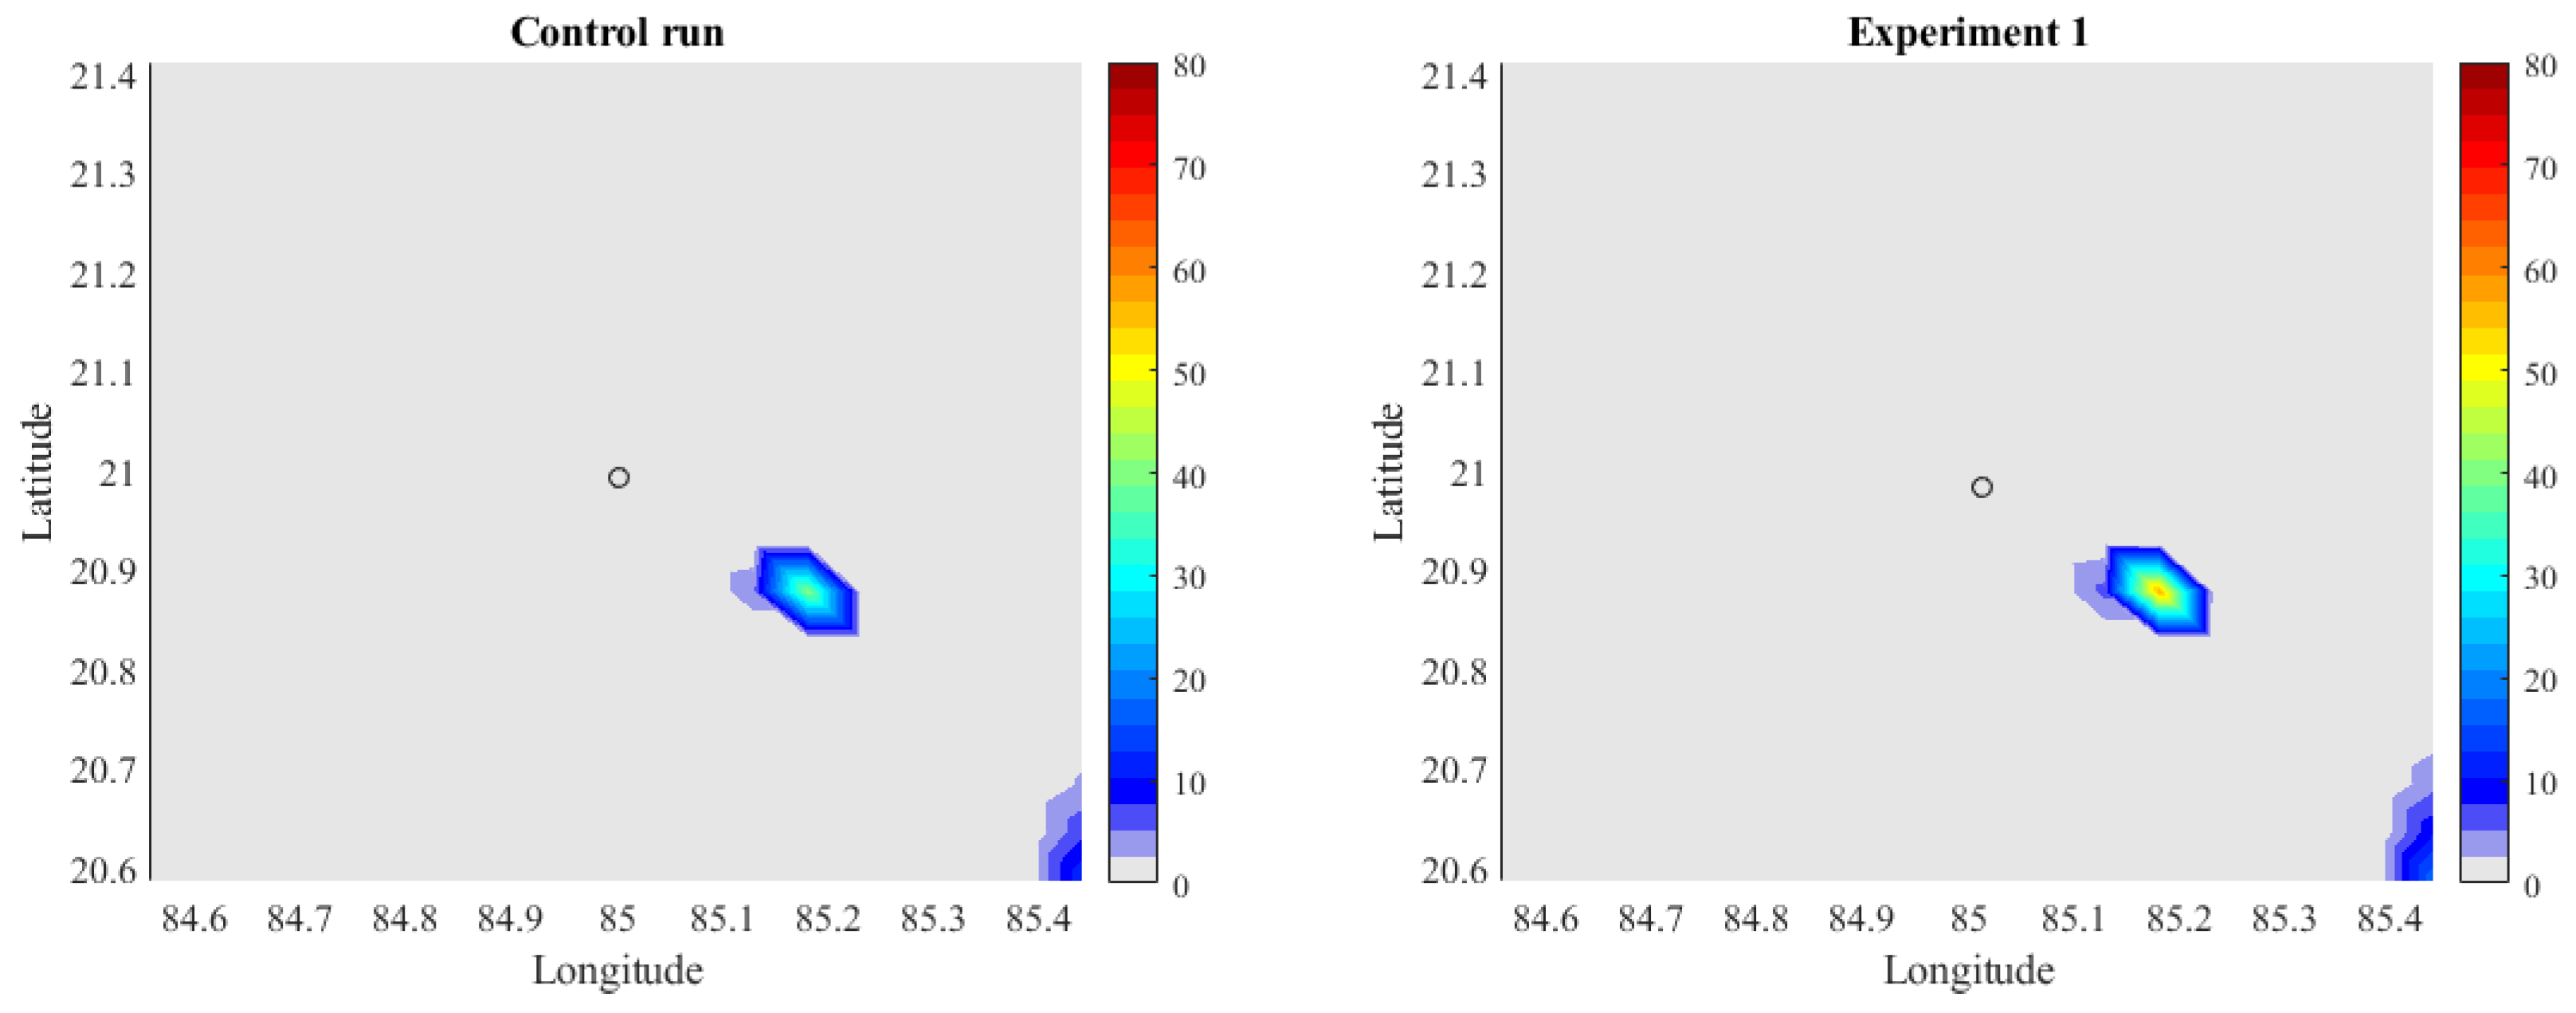
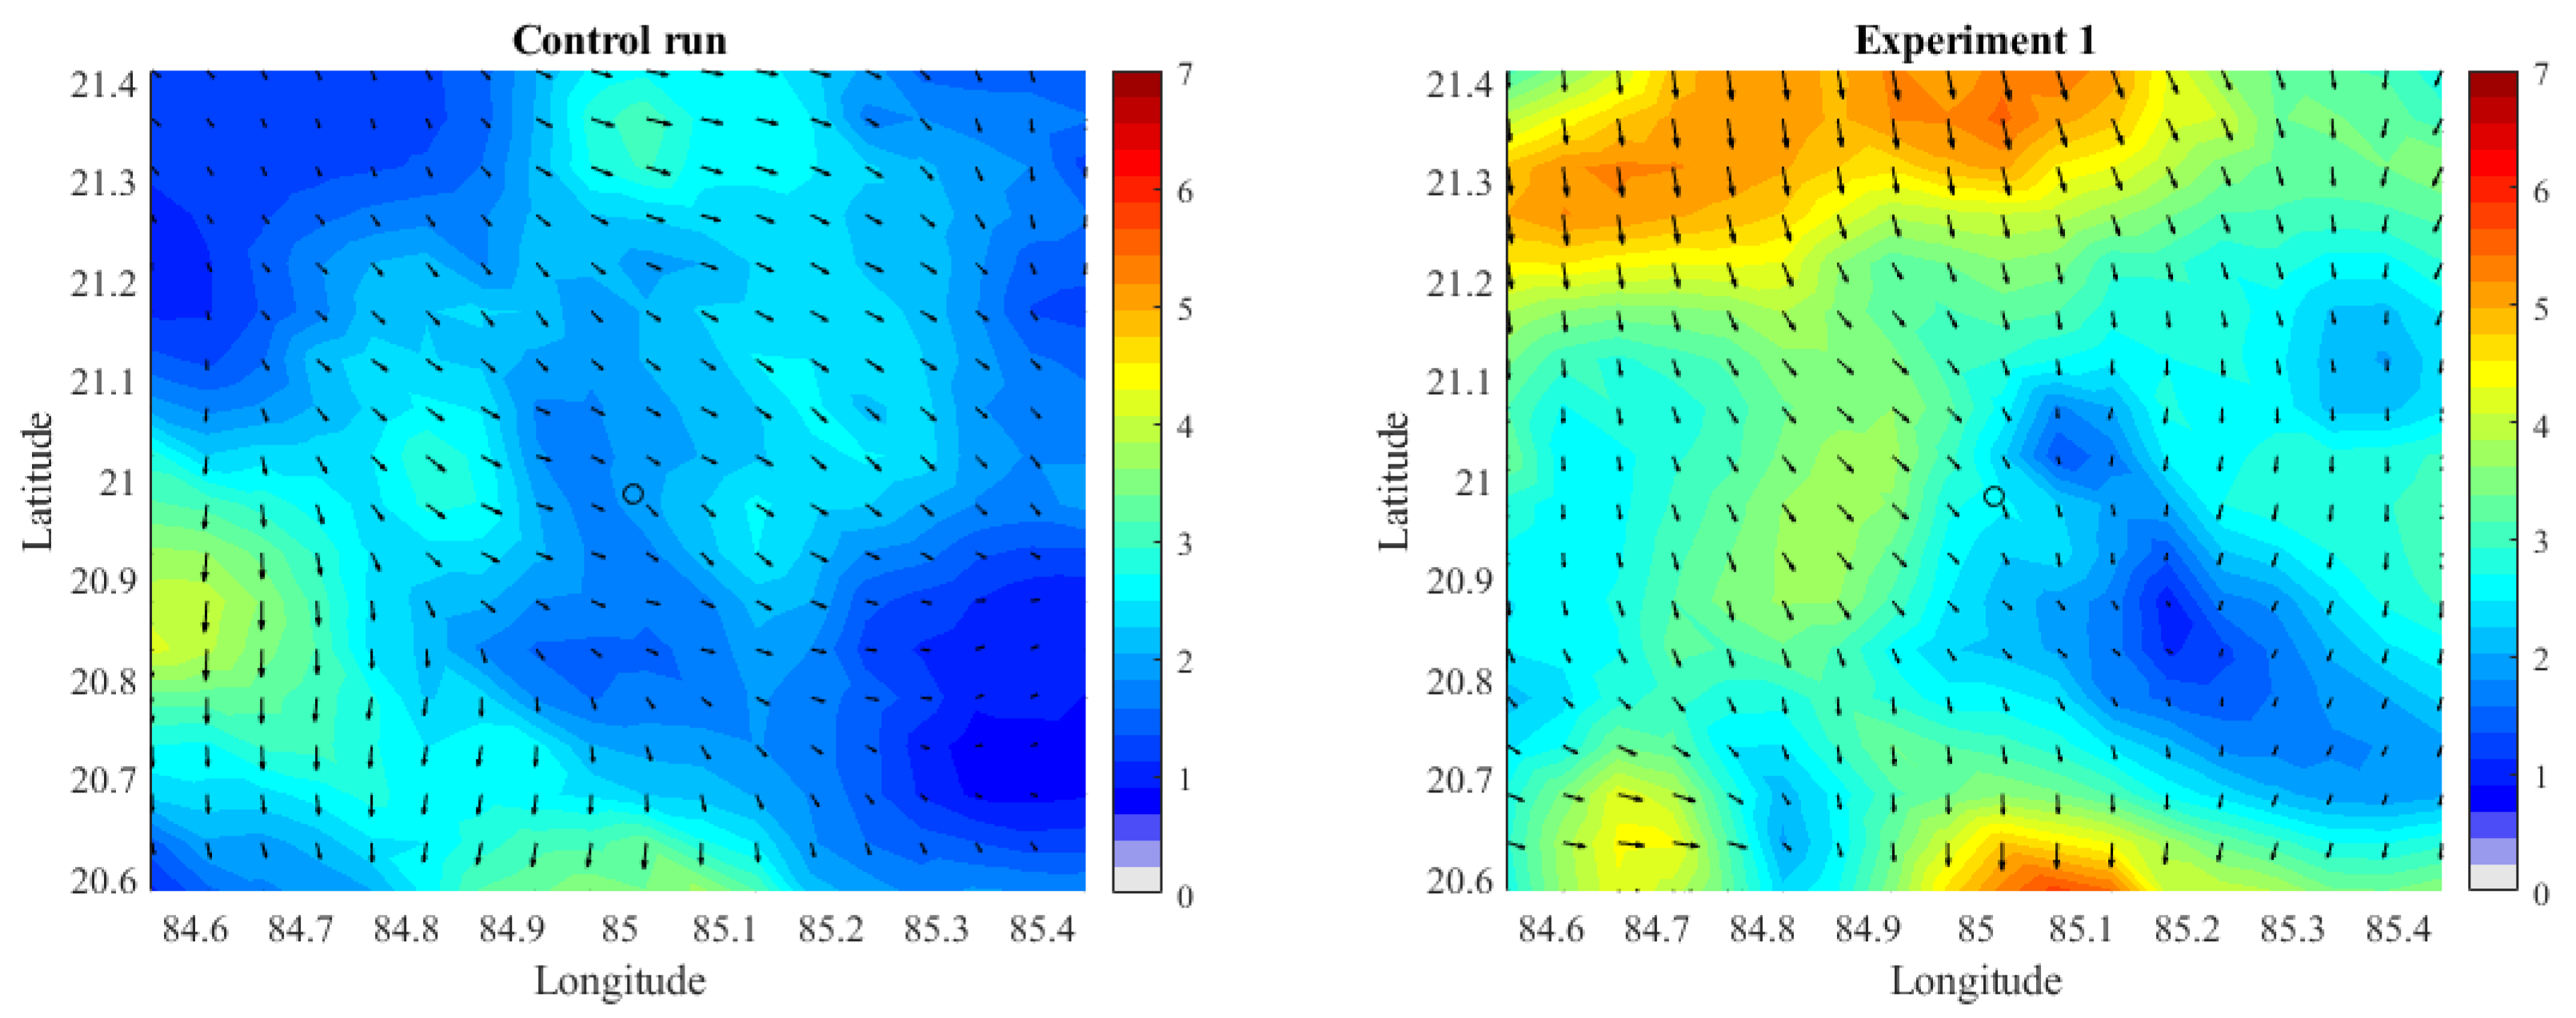
Rain event 1 was selected in the monsoon season on 16 August 2008. TRMM covered the Angul region at 11:45 UTC. Perturbation with a 10 K rise in the surface is completed at the centre pixel (85° E, 21° N), which corresponds to an industrial location shown by a circle mark. At the exact location, RH is recalculated based on the perturbed temperature and is used as the initial condition for the numerical experiment (Exp 1). Figure 3 shows the water vapour mixing ratio for the control run case with Exp 1. The water vapour mixing ratio increases near the perturbation location and is dispersed towards the north-west direction. Further, a clear signature is seen close to the perturbation location when moisture is added with the present case [56]. The dispersion or convergence moisture flux depends upon the intensity and direction of wind speed. Therefore, flow patterns in and around the industrial zone were studied. Figure 4 shows the spatial variation of wind speed and direction at the same instant at the near-surface level. A substantial enhancement of wind around the industrial site is seen in the perturbed case.
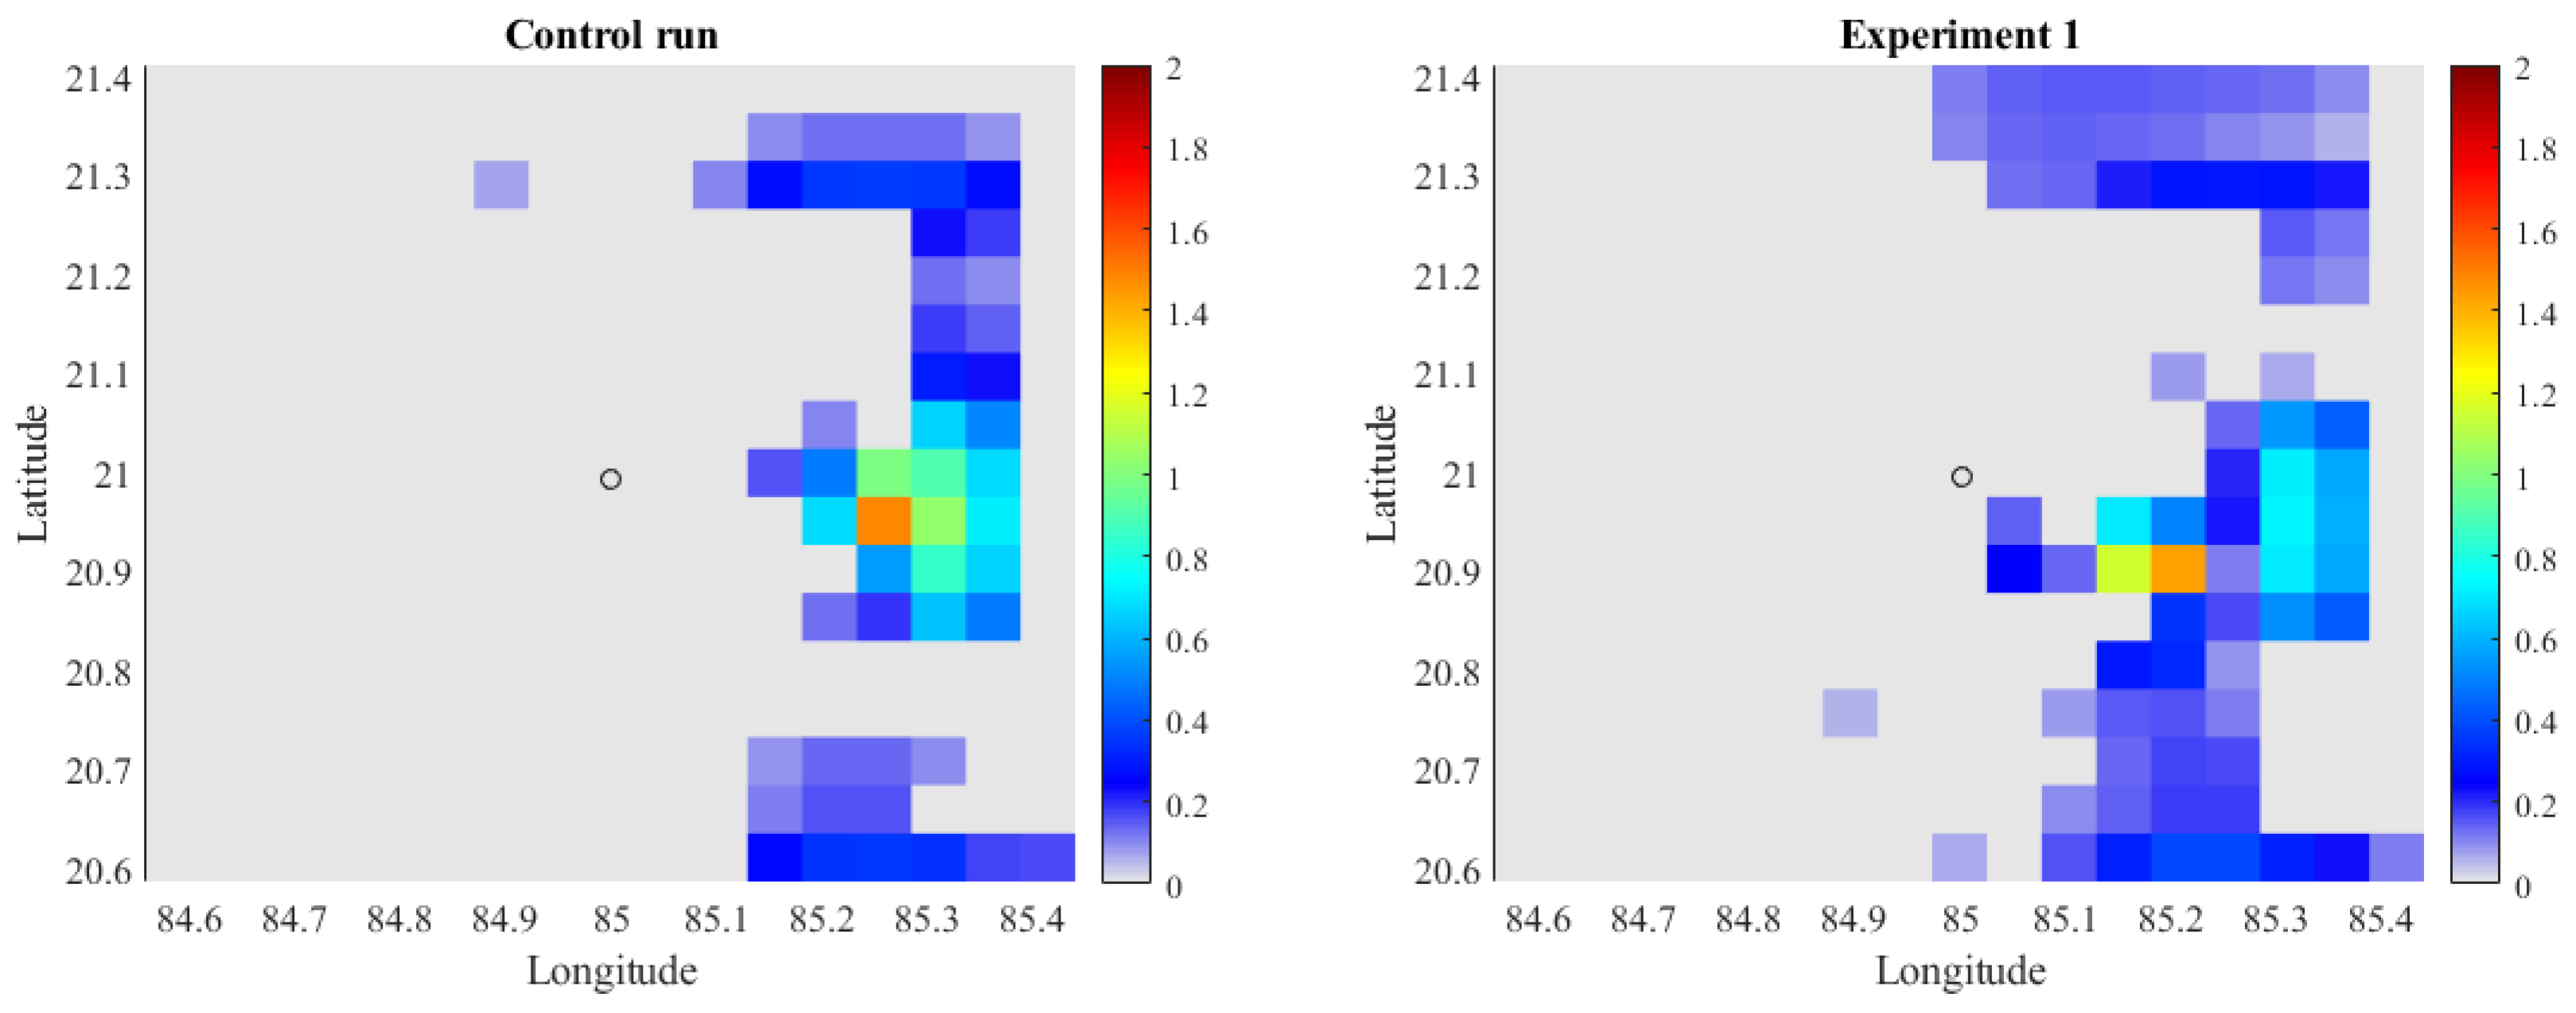
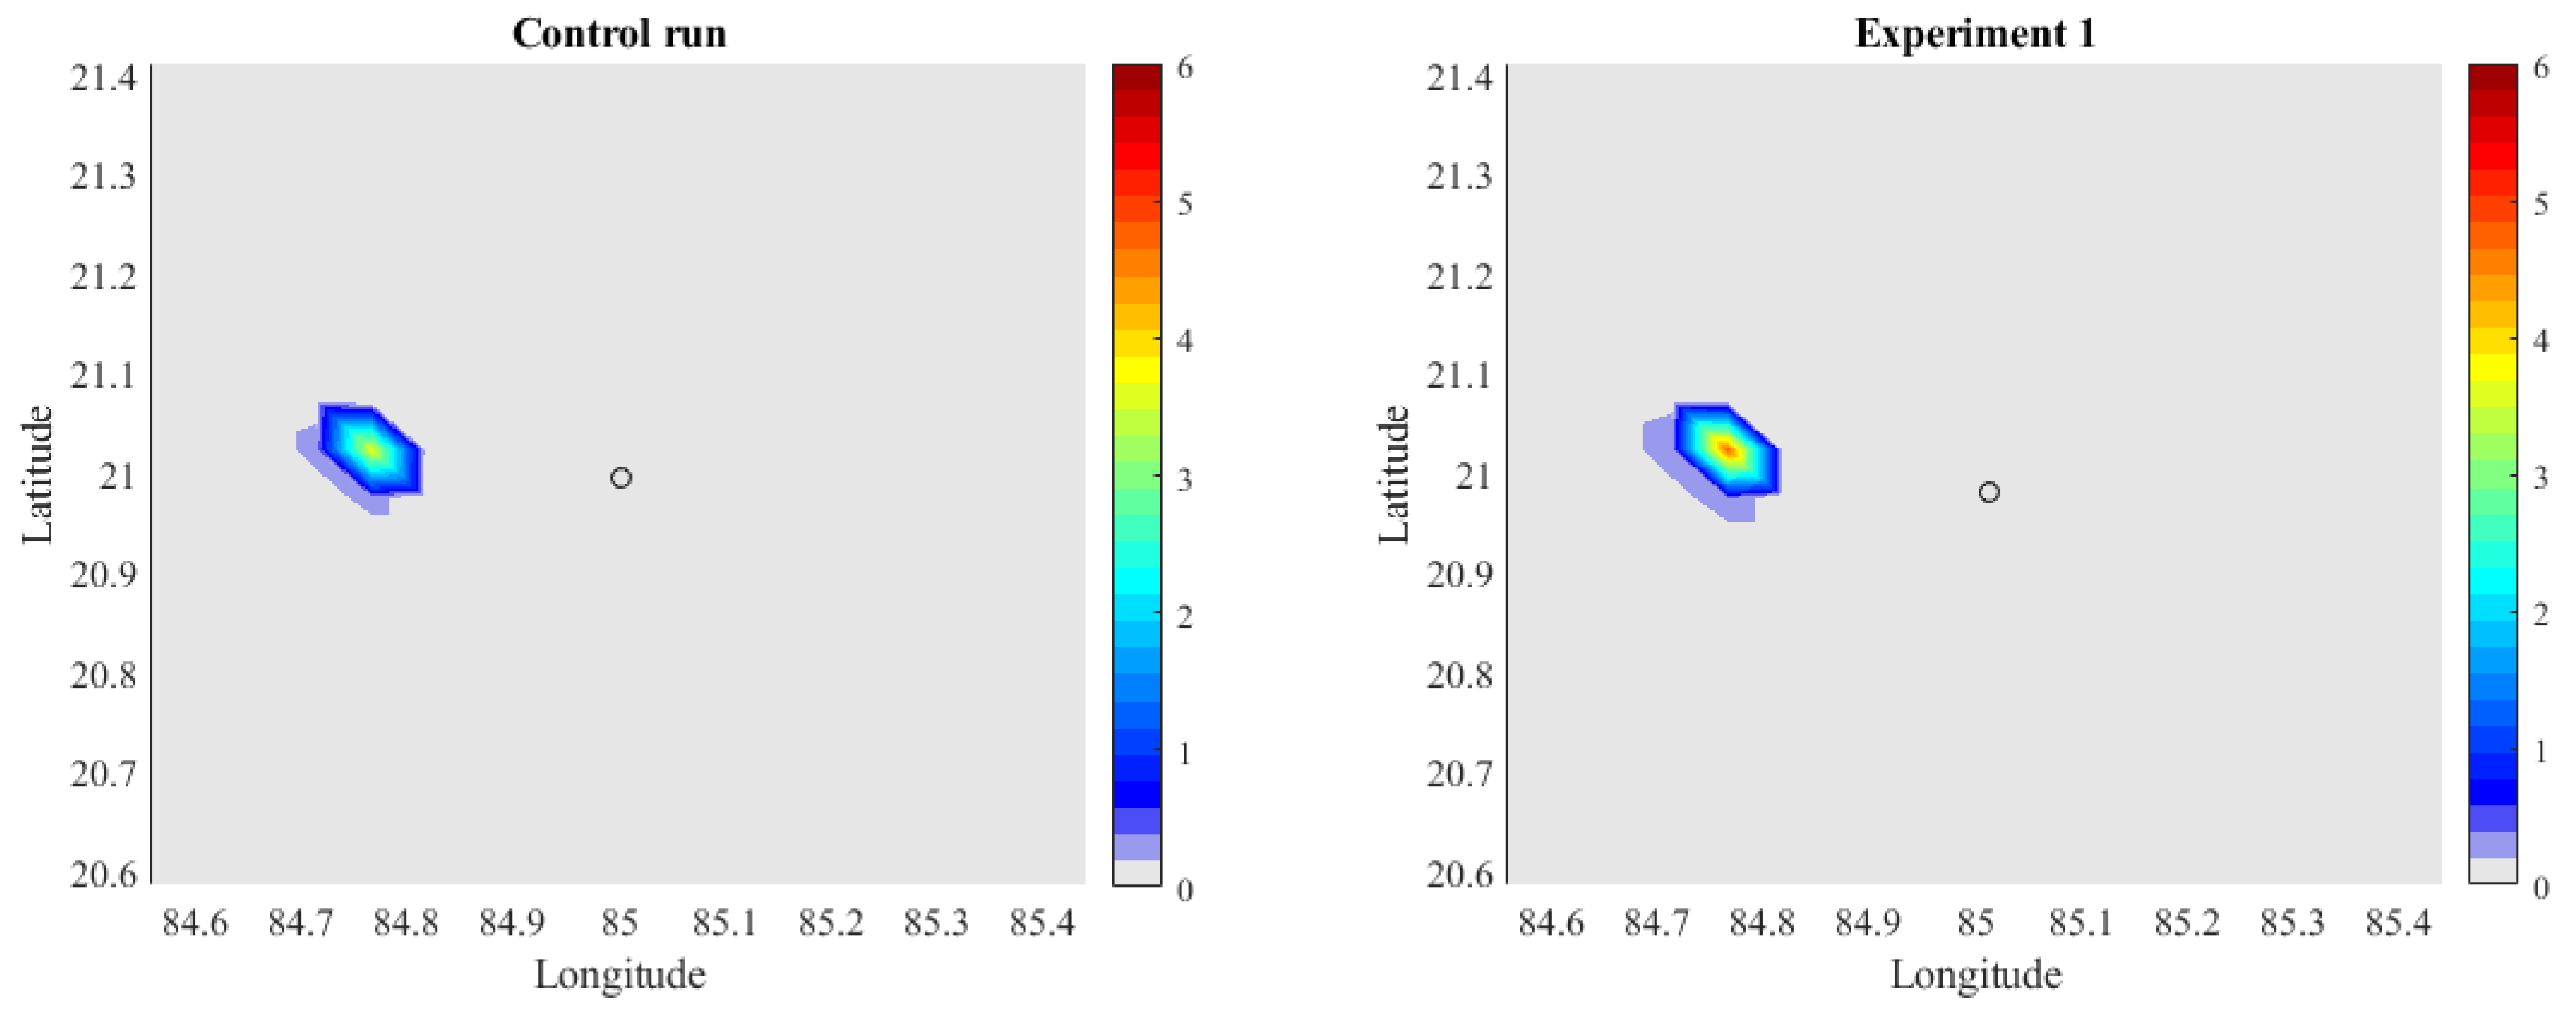
The effect of anthropogenic heat and moisture on precipitation was studied exclusively for the WDM6 microphysics scheme. From Figure 3, it was found that due to the addition of heat or with heat and moisture, the water vapour mixing ratio increases near the industrial site locally, which affects the microphysics of rain formation. Figure 5 shows an increase in rainfall in Exp 1. This enhancement in rainfall is about 21% from the control run case. This maximum rainfall was reported 18 km from the perturbed location towards the east. The study shows that even when the moisture content in the atmosphere remains the same, an increase in temperature results in rainfall augmentation. This augmentation is due to increased convective activity with the temperature rise. The increase in rainfall is more pronounced when moisture is released [56].
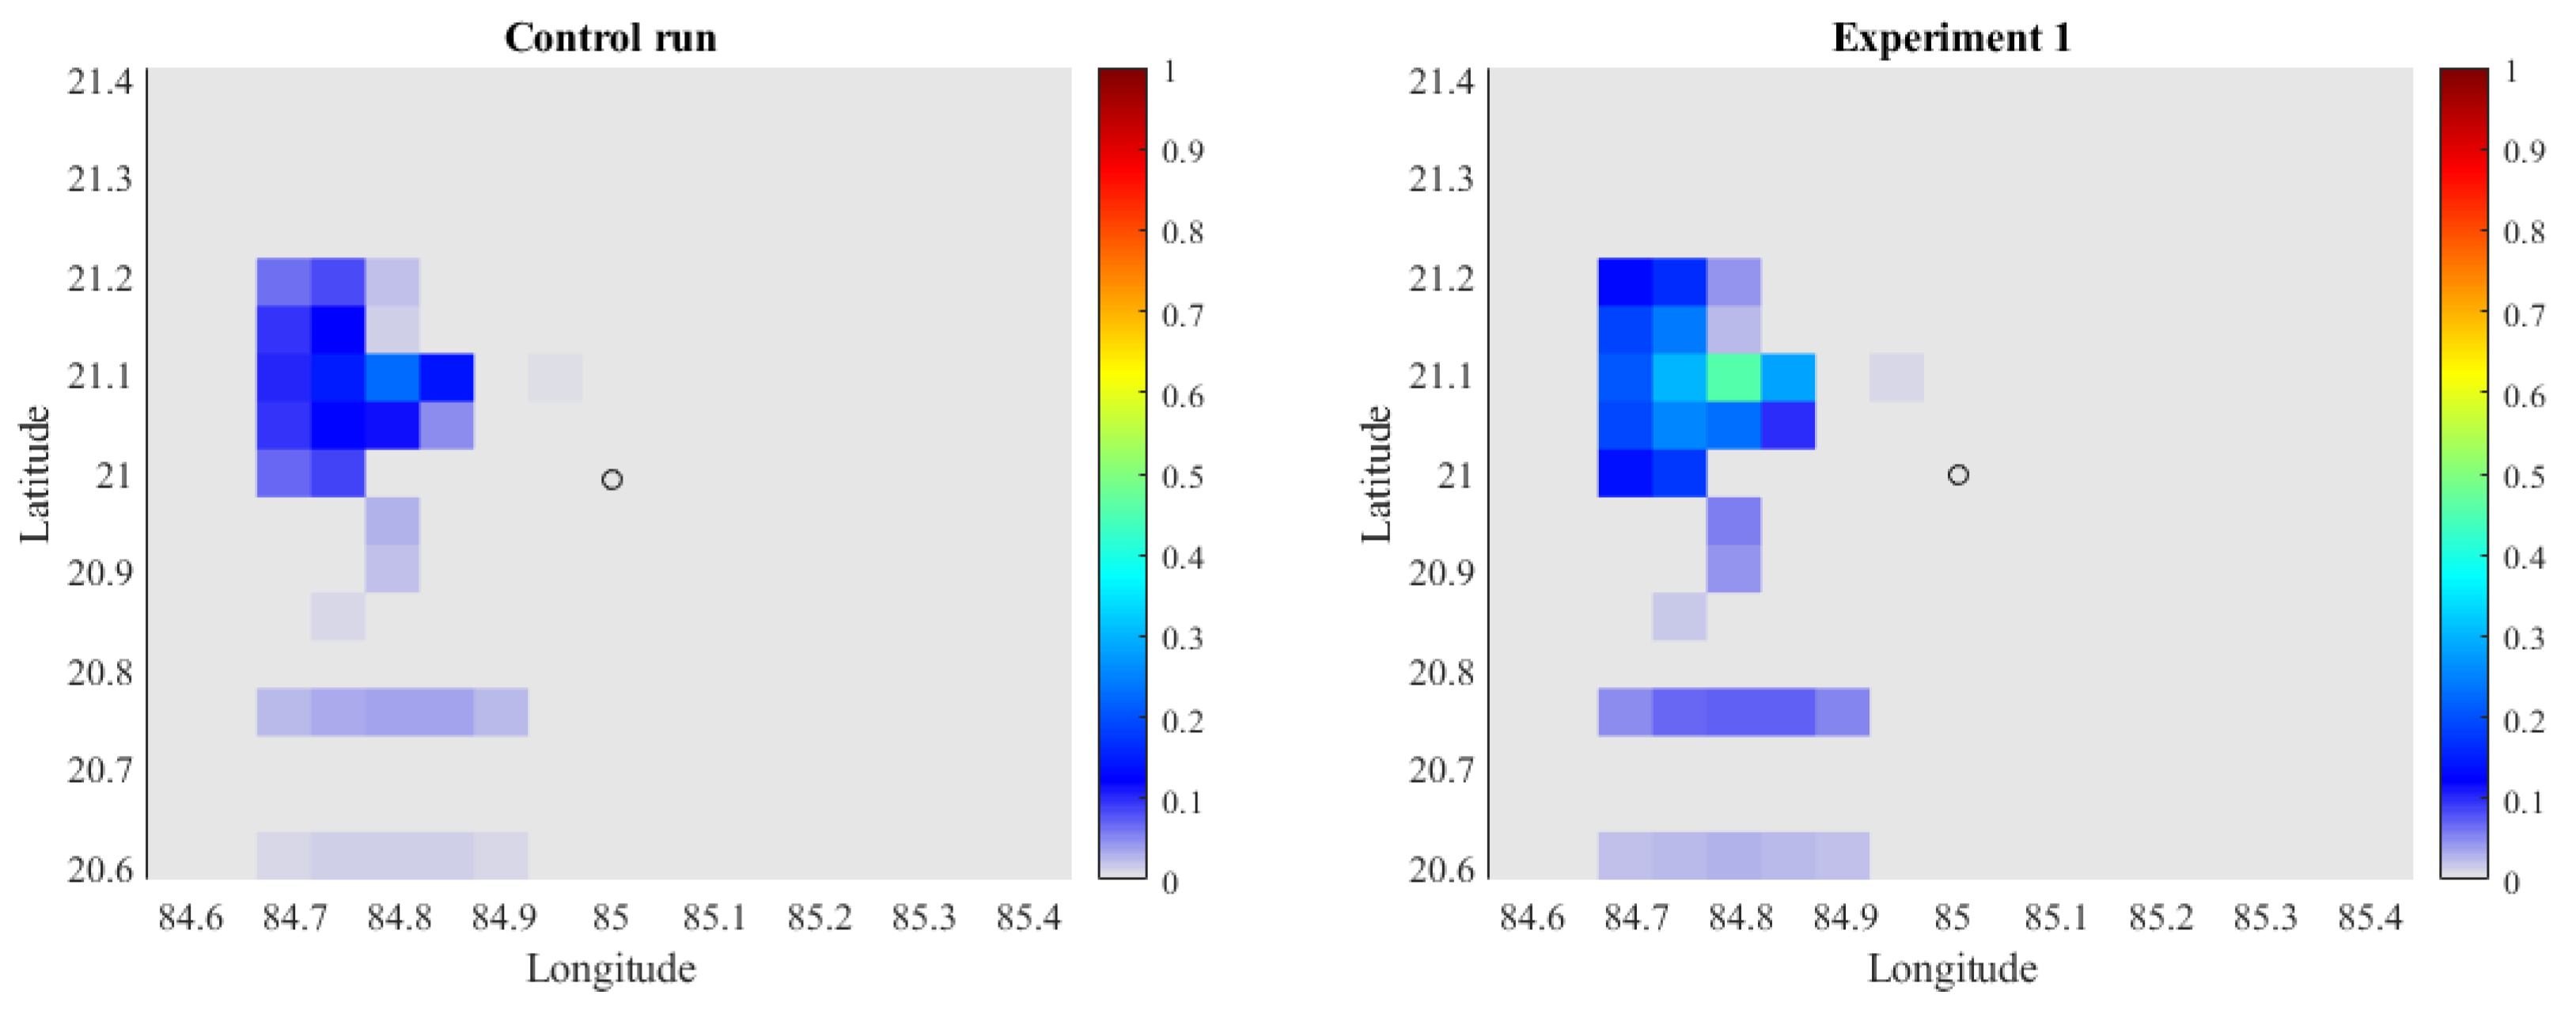
From the rain rate comparison, the increase in precipitation is found in the downwind side with heat or the addition of both heat and moisture. However, the comparison fails to bring out the impact of anthropogenic heat/moisture on the microphysics of rain formation. In order to account for this, the raindrop size distribution, cloud and rain number concentration around the industrial region are studied exclusively. Figure 6 shows the effect of anthropogenic heat and moisture on the raindrop size and its distribution. We found that the maximum median diameter is 1.4 mm near the industrial location with the increase in temperature. However, the drop size distribution is almost uniform irrespective of heat or moisture perturbation.
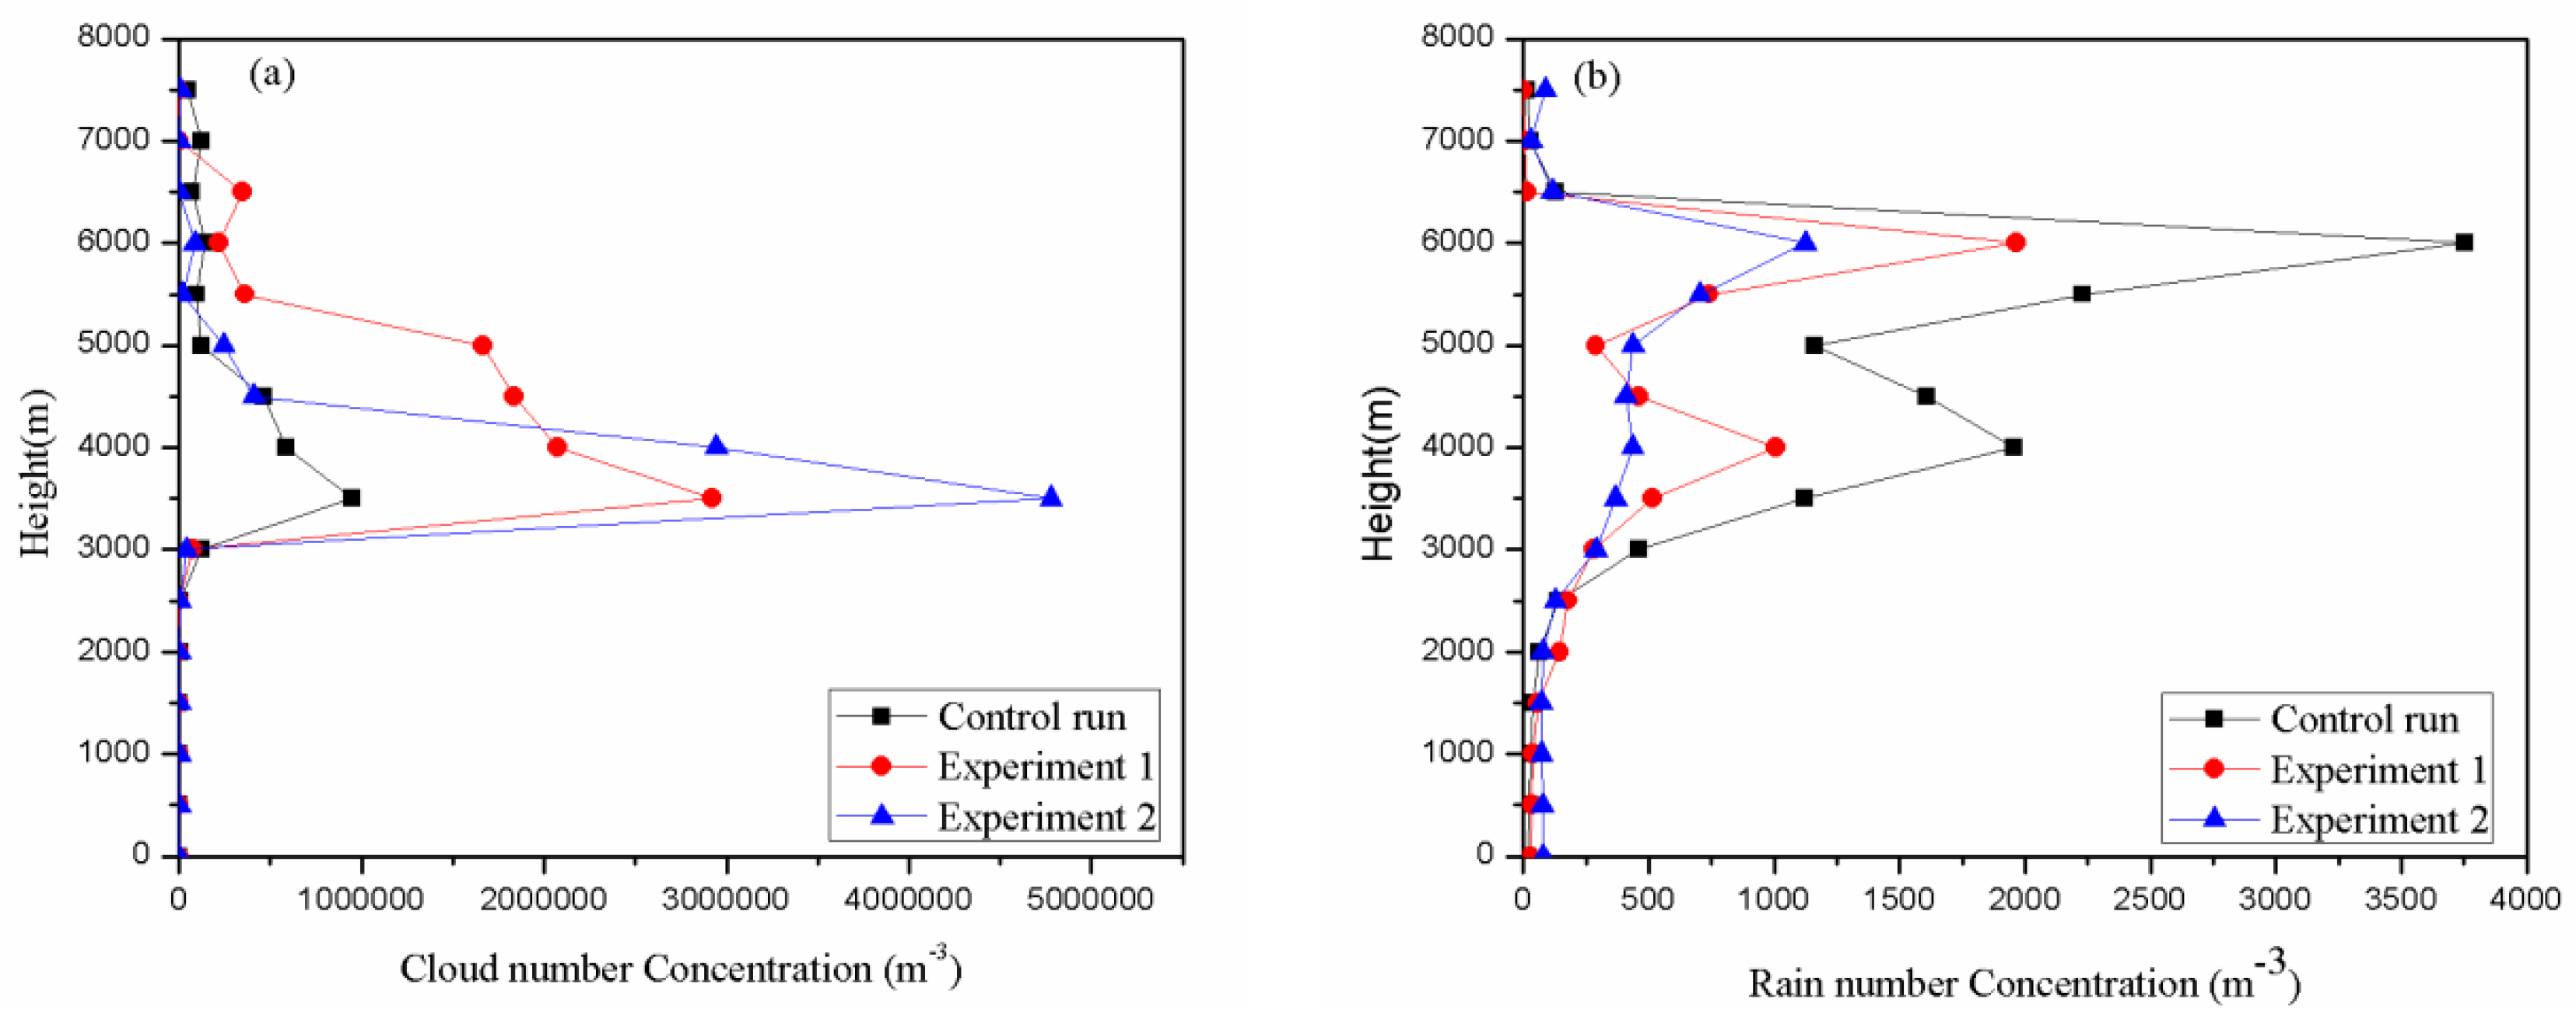
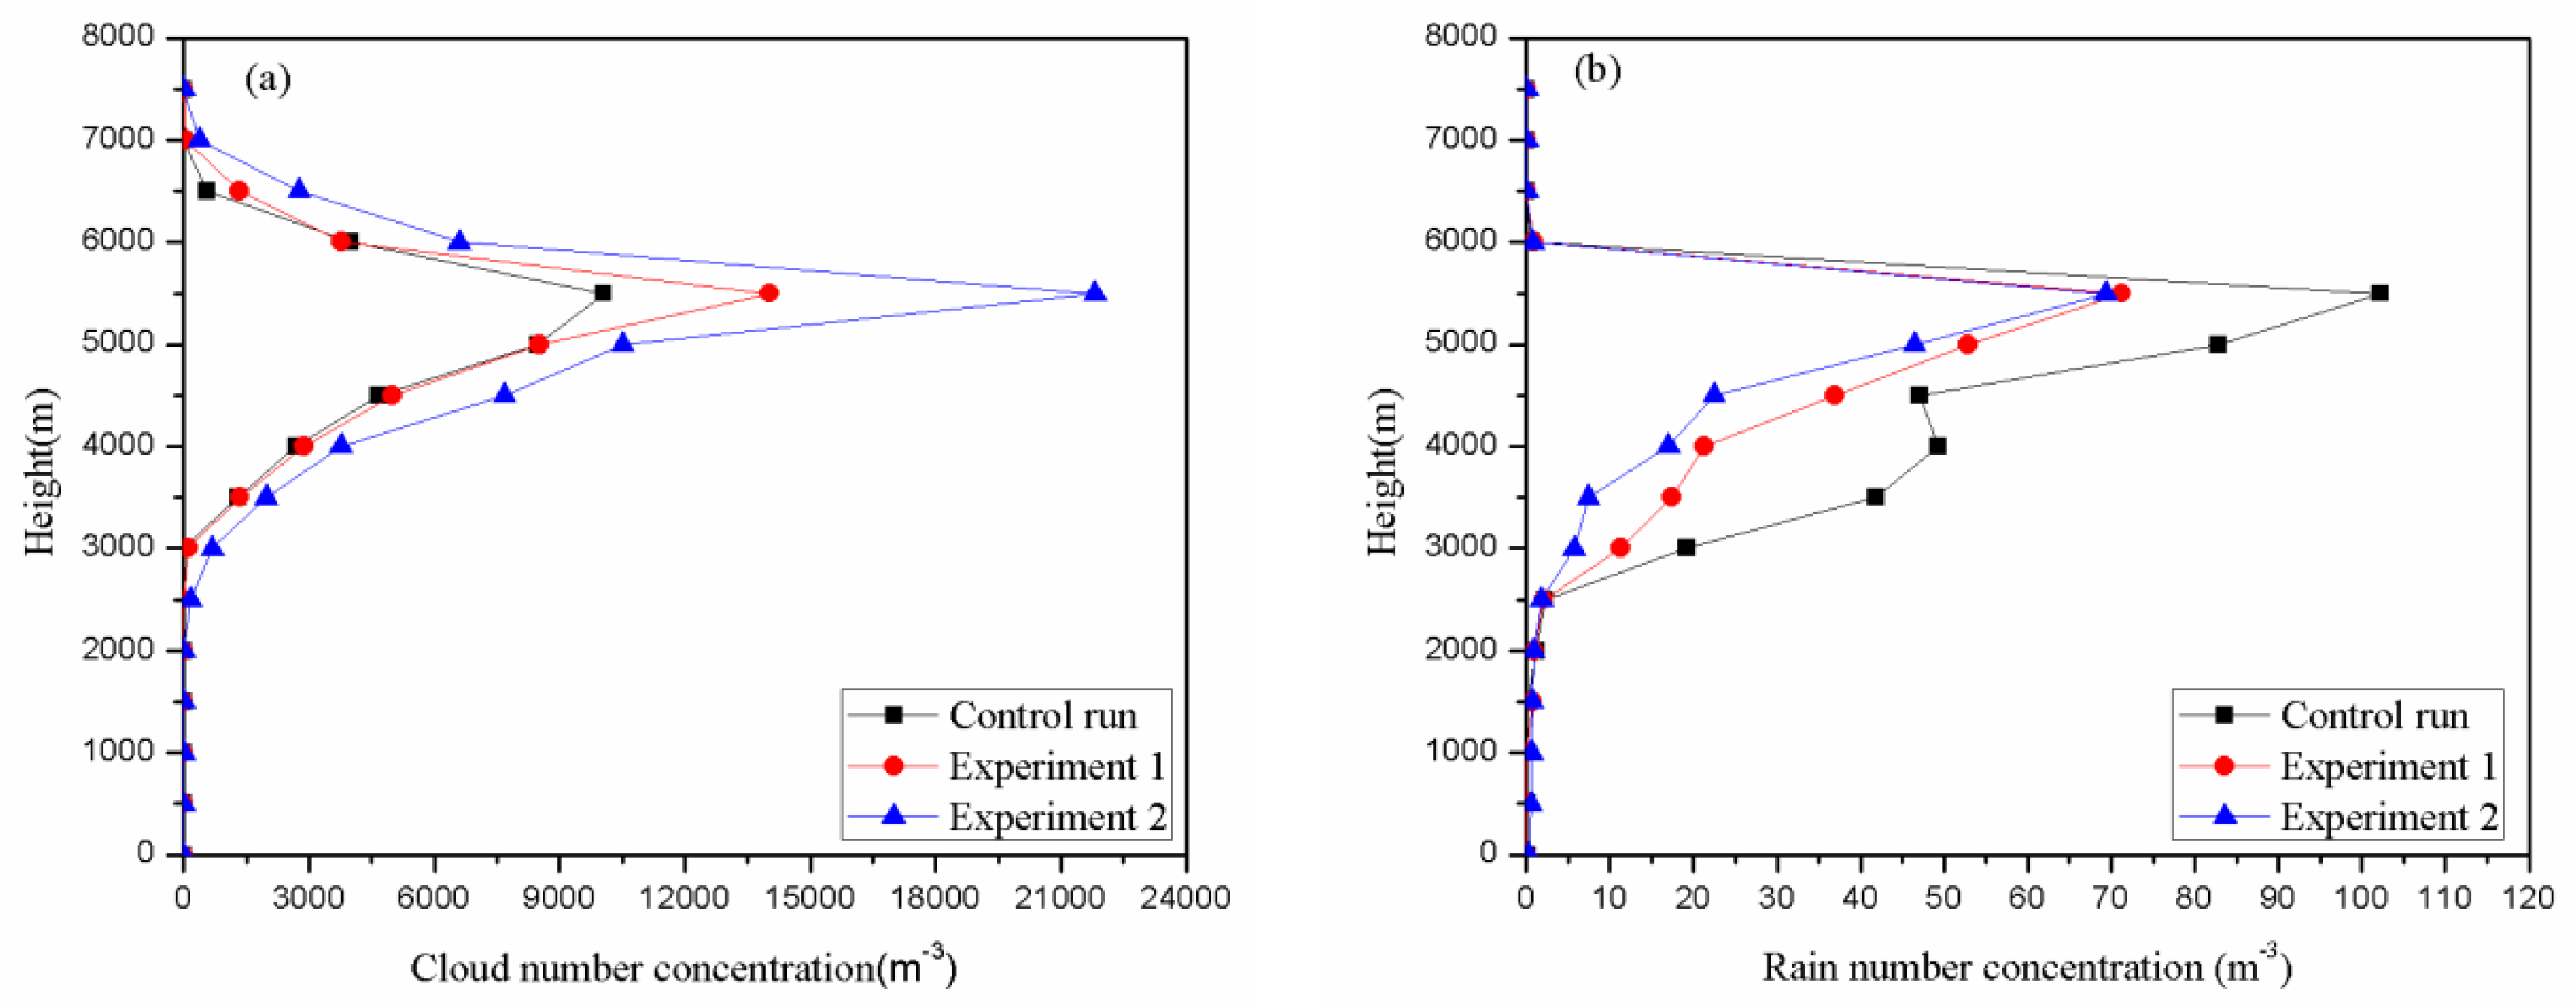
Figure 7 shows the spatial average of Cloud number concentration (Nc) and Rain number concentration (Nr) for WDM 6 microphysics scheme at 11:45 UTC on 16 August 2008 concerning vertical height. The concentration of cloud increases up to a particular height and then decreases. The maxima are obtained around 3.5 km from the surface. In Exp 2, the cloud number concentration increases rapidly compared to Exp 1 and the control run. This shows that the anthropogenic heat and moisture act as the cloud initiating perturbation. Maximum Nc reached around 4.78 × 10⁶ m−3 in heat and moisture addition case whereas it reduces to 2.9 × 10⁶ m−3, 0.94 × 10⁷ m−3 in heat addition alone and control run, respectively.
The vertical profile of rain number concentration (Nr) shows a different trend compared to cloud number concentration. A maximum peak was observed at 6 km height from the ground. Maximum Nr observed 3755 m−3 in the control run case, and it reduces to 1965 m−3 and 1124 m−3 in Exp 1 and Exp 2, respectively. The reverse trend could be because the increase in cloud number concentration inhibits auto conversion from cloud droplets to raindrops. Further raindrop size increases in Exp 1 (Figure 6) compared to the control run case.
5.3. Rain Event 2
Another rain event, observed during the pre-monsoon season on 22 March 2008, is considered for the numerical experiment. The TRMM satellite covered this rain event at 21.45 UTC. In this section, the water vapour mixing ratio, rain rate and its concentration, maximum median diameter of raindrop and flow pattern are compared similarly to Section 5.2 and correspond to the simulation time at 21:45 UTC.
Figure 8 shows the water vapour mixing ratio comparisons for the control run case with the numerical experiment. It has been seen from the figure that there is a slight increase in the water vapour mixing ratio even when only sensible heat is added to the atmosphere. A comparison with an earlier study [56] shows that when heat and moisture are added, the rate of increase is greater. The maximum water vapour ratio reported in this event is less compared to event 1, as discussed in Section 5.2.
Figure 9 shows flow pattern comparisons with perturbation in and around the industrial zone at the near-surface level. The wind speed in the perturbed case seems to be affected in the entire domain. However, in rain event 1, the wind speed changed only along the southeast direction from the centre. Additionally, the magnitude of wind reported in event 2 is significantly higher than in the control run.
Figure 10 shows rain comparisons at the near-surface level on 22 March 2008, at a particular instant. We found that the maximum rainfall rate increases compared to the control run case. A similar observation was reported for the earlier rain event 1 (Figure 5). This increase in rainfall is seen locally in the west direction of the industry, and the rate of increase is 12 per cent more in Exp 1 as compared to the control run. This trend further increases with the inclusion of moisture [56]. However, the increase of rainfall in event 2 is less than event 1.
Figure 11 shows the maximum median diameter for the control run case compared against the perturbed case with the WDM6 MS. From this comparison, it is clear that the maximum median diameter increases near the perturbation area in the numerical experiment, while drop size distribution is almost similar. In the control run case, the maximum median diameter is 0.2 mm, increasing to 0.4 mm in Exp 1.
Figure 12 shows the spatial average of Cloud number concentration (Nc) and Rain number concentration (Nr) for the WDM 6 microphysics scheme at a particular instant corresponding to 22 March 2008 with respect to vertical height. With the increase in atmospheric height, up to 2.5 km concentration of cloud is almost constant. Beyond 2.5 km, Nc increases up to a vertical height of 7.5 km when it peaks and then decreases. In Exp 2, cloud number concentration increases rapidly by the addition of heat and moisture compared to the control run and Exp 1. The maximum Nc observed in the control run, Exp 1 and Exp 2 are 10,050 m−3, 14,020 m−3 and 21,816 m−3, respectively.
The rain number concentration increases above 2.5 km when it peaks and decreases, similar to the cloud number concentration. The maximum peak is observed in the control run case and the minimum peak in Exp 2. Generally, an increase in cloud number concentration narrows down the cloud spectra of droplets, which reduces collision efficiency and inhibits auto conversion from cloud droplets to raindrops. The maximum Nc observed in the control run, Exp1 and Exp 2 are 102 m−3, 71 m−3 and 69 m−3, respectively. This reduction in Nr is primarily due to the increase in the average size of the raindrop. The raindrop size was found to increase in both experiments.
5.4. Discussion
Many studies do exist in the literature that indicate that industrial emission (i) enhances precipitation [7,8,10] or (ii) has no effect [9]. Again, a study in one of the urban areas of China shows (i) a decrease in rainfall [31] and (ii) an increase in rainfall [32]. This inconsistent result is due to the combined effect of urban geography, AH, the inclusion of moisture, industrial emission, etc. In these scenarios, it is difficult to conclude the effect of AH and moisture on rainfall. Again, the accurate estimation of AH over a region is even more challenging. To address these issues and to find the relative contribution of heat and moisture, a numerical experiment is conducted in the Angul district, one of the industrial regions of Odisha. A numerical experiment is designed to introduce AH (SH, LH) at the industrial site by controlling the temperature parameter alone. The AH without moisture addition was found out by recalculating RH correspond to perturbed temperature. The numerical experiments found that the precipitation rate increases due to the increase in AH or AH and moisture. Results also show more sensitivity with AH and moisture addition than AH introduction.
6. Summary and Conclusions
Numerical experiments were carried out with WDM6 microphysics schemes. The effect of anthropogenic heat and moisture on water vapour mixing ratio, maximum median diameter of the raindrop, precipitation rate, number concentration of cloud and rain and flow pattern were studied extensively for the two rain events considered.
Our study shows that the release of sensible heat to the atmosphere results in increased local rainfall against the control run case during the monsoon season. A similar observation was reported in Rain event 2 that occurred during the pre-monsoon season. Further, rainfall enhancement is more sensitive towards the 10 K increase temperature when the moisture quantity is retained in the atmosphere. The microphysical study found that the cloud number concentration increases by adding heat and moisture while the rain number concentration decreases. Additionally, the maximum median diameter of the raindrop is seen to increase with perturbation near the industrial zone. Since the raindrop size increases locally, this leads to a reduction of the spatial average rain number concentration. This study shows that the effect of heat and moisture from any anthropogenic source on local weather is very significant as it affects the convection mechanism. The wind circulation pattern changes, and stronger winds are formed in and around the industrial zone by perturbing the temperature for both events.
In this study, the IHI effect is confined to a narrow zone. By introducing a suitable dispersion model to the numerical experiment, IHI effect will be extended to the entire domain, and its effect on weather can be studied on a regional scale. It is expected that this present work will create a path for other researchers to study the impact on a larger scale.
Author Contributions
Conceptualization, S.R.K.; Methodology, P.M.; Supervision, S.R.K.; Writing—original draft, P.M.; Writing—review & editing, S.R.K. and C.R. All authors have read and agreed to the published version of the manuscript.
Funding
This research received no external funding.
Institutional Review Board Statement
Not applicable.
Informed Consent Statement
Not applicable.
Data Availability Statement
Authors of this paper are grateful to Goddard Earth Sciences (GES) and National Aeronautics and Space Administration (NASA) for providing TRMM satellite date online for free.
Conflicts of Interest
The authors declare no conflict of interest.
References
- Sailor, D.J.; Lu, L. A Top–Down Methodology for Developing Diurnal and Seasonal Anthropogenic Heating Profiles for Urban Areas. Atmos. Environ. 2004, 38, 2737–2748. [Google Scholar] [CrossRef]
- Fan, H.; Sailor, D.J. Modeling the Impacts of Anthropogenic Heating on the Urban Climate of Philadelphia: A Comparison of Implementations in Two PBL Schemes. Atmos. Environ. 2005, 39, 73–84. [Google Scholar] [CrossRef]
- Carson, J.E. Some Comments on the Atmospheric Consequences of Thermal Enrichment from Power Generating Stations on a Large Lake. In Proceedings of the 65th Annual Meeting of the Air Pollution Control Association, Atlantic City, NJ, USA, 27 June–1 July 1971. [Google Scholar]
- Hanna, S.R.; Swisher, S.D. Meteorological Effects of Heat and Moisture Produced by Man. Nucl. Saf. 1971, 12, 114–122. [Google Scholar]
- Hanna, S.R.; Gifford, F.A. Meteorological Effects of Energy Dissipation at Large Power Parks. Bull. Am. Meteorol. Soc. 1975, 56, 1069–1077. [Google Scholar] [CrossRef] [Green Version]
- Huff, F.A. Effect of Cooling Tower Effluents on Atmospheric Conditions in Northeastern Illinois: Preliminary Report; Illinois State Water Survey: Urbana, IL, USA, 1971. [Google Scholar]
- Huff, F.A. Potential Augmentation of Precipitation from Cooling Tower Effluents. Bull. Am. Meteorol. Soc. 1972, 53, 639–645. [Google Scholar] [CrossRef]
- Khemani, L.T.; Murty, B.V.R. Rainfall Variations in an Urban Industrial Region. J. Appl. Meteorol. 1973, 12, 187–194. [Google Scholar] [CrossRef] [Green Version]
- Martin, A. The Influence of a Power Station on Climate—A Study of Local Weather Records. Atmos. Environ. 1974, 8, 419–424. [Google Scholar] [CrossRef]
- Selvam, A.M.; Manohar, G.K.; Murty, B.V.R. Rainfall Variations around a Thermal Power Station. Atmos. Environ. 1976, 10, 963–968. [Google Scholar] [CrossRef]
- Hindman, E.E.; Tag, P.M.; Silverman, B.A.; Hobbs, P.V. Cloud Condensation Nuclei from a Paper Mill. Part II: Calculated Effects on Rainfall. J. Appl. Meteorol. 1977, 16, 753–755. [Google Scholar] [CrossRef]
- Murray, F.W.; Koenig, L.R.; Tag, P.M. Numerical Simulation of an Industrial Cumulus and Comparison with Observations. J. Appl. Meteorol. Climatol. 1978, 17, 655–668. [Google Scholar] [CrossRef] [Green Version]
- Guan, S.; Reuter, G.W. Numerical Simulation of a Rain Shower Affected by Waste Energy Released from a Cooling Tower Complex in a Calm Environment. J. Appl. Meteorol. 1995, 34, 131–142. [Google Scholar] [CrossRef] [Green Version]
- Guan, S.; Reuter, G.W. Numerical Simulation of an Industrial Cumulus Affected by Heat, Moisture, and CCN Released from an Oil Refinery. J. Appl. Meteorol. Climatol. 1996, 35, 1257–1264. [Google Scholar] [CrossRef] [Green Version]
- Shepherd, J.M.; Burian, S.J. Detection of Urban-Induced Rainfall Anomalies in a Major Coastal City. Earth Interact. 2003, 7, 1–17. [Google Scholar] [CrossRef] [Green Version]
- Shepherd, J.M. A Review of Current Investigations of Urban-Induced Rainfall and Recommendations for the Future. Earth Interact. 2005, 9, 1–27. [Google Scholar] [CrossRef] [Green Version]
- Chen, T.C.; Wang, S.Y.; Yen, M.C. Enhancement of Afternoon Thunderstorm Activity by Urbanisation in a Valley: Taipei. J. Appl. Meteorol. Climatol. 2007, 46, 1324–1340. [Google Scholar] [CrossRef]
- Zhang, L.; Yang, X.; Tang, J.; Fang, J.; Sun, X. Simulation of Urban Heat Island Effect and Its Impact on Atmospheric Boundary Layer Structure Over Yangtze River Delta Region in Summer. J. Meteorol. Sci. 2011, 31, 431–440. [Google Scholar]
- Ichinose, T.; Shimodozono, K.; Hanaki, K. Impact of Anthropogenic Heat on Urban Climate in Tokyo. Atmos. Environ. 1999, 33, 3897–3909. [Google Scholar] [CrossRef]
- Shahmohamadi, P.; Che-Ani, A.I.; Maulud, K.N.A.; Tawil, N.M.; Abdullah, N.A.G. The Impact of Anthropogenic Heat on Formation of Urban Heat Island and Energy Consumption Balance. Urban Stud. Res. 2011, 2011, 1–9. [Google Scholar] [CrossRef] [Green Version]
- Ramamurthy, P.; González, J.; Ortiz, L.; Arend, M.; Moshary, F. Impact of Heatwave on a Megacity: An Observational Analysis of New York City during July 2016. Environ. Res. Lett. 2017, 12, 054011. [Google Scholar] [CrossRef]
- Atkinson, B.W. The Effect of an Urban Area on the Precipitation from a Moving Thunderstorm. J. Appl. Meteorol. 1971, 10, 47–55. [Google Scholar] [CrossRef]
- Huff, F.A. Urban Hydrometeorology Review: The Robert E. Horton Lecture. In Proceedings of the Sixth Conference on Hydrometeorology, Indianapolis, Ind, USA, 29 October 1985. Bull. Am. Meteorol. Soc. 1986, 67, 703–712. [Google Scholar] [CrossRef] [Green Version]
- Ackerman, B.; Changnon, S.; Dzurisin, G.; Gatz, D.L.; Grosh, R.C. Summary of METROMEX, Volume 2: Causes of Precipitation Anomalies; Illinois State Water Survey: Urbana, IL, USA, 1978. [Google Scholar]
- Huff, F.A.; Vogel, J.L. Urban, Topographic and Diurnal Effects on Rainfall in the St. Louis Region. J. Appl. Meteorol. Climatol. 1978, 17, 565–577. [Google Scholar] [CrossRef] [Green Version]
- Changnon, S.A.; Semonin, R.G.; Auer, A.H.; Braham, R.R.; Hales, J. METROMEX: A Review and Summary. Meteormonogr. No. 40. Amer. Meteor. Soc. 1981, 1, 81. [Google Scholar]
- Changnon, S.A.; Shealy, R.T.; Scott, R.W. Precipitation Changes in Fall, Winter, and Spring Caused by St. Louis. J. Appl. Meteorol. Climatol. 1991, 30, 126–134. [Google Scholar] [CrossRef] [Green Version]
- Bornstein, R.D.; LeRoy, G.M. Urban Barrier Effects on Convective and Frontal Thunderstorms. Preprints. In Proceedings of the 4th AMS Conference on Mesoscale Processes, Boulder, CO, USA, 25–29 June 1990; pp. 508–516. [Google Scholar]
- Shepherd, J.M.; Pierce, H.; Negri, A.J. Rainfall Modification by Major Urban Areas: Observations from Spaceborne Rain Radar on the TRMM Satellite. J. Appl. Meteorol. 2002, 41, 689–701. [Google Scholar] [CrossRef]
- Mote, T.L.; Lacke, M.C.; Shepherd, J.M. Radar Signatures of the Urban Effect on Precipitation Distribution: A Case Study for Atlanta, Georgia. Geophys. Res. Lett. 2007, 34. [Google Scholar] [CrossRef]
- Feng, J.M.; Wang, Y.L.; Ma, Z.G.; Liu, Y.H. Simulating the Regional Impacts of Urbanisation and Anthropogenic Heat Release on Climate across China. J. Clim. 2012, 25, 7187–7203. [Google Scholar] [CrossRef]
- Chen, F.; Yang, X.; Wu, J. Simulation of the Urban Climate in a Chinese Megacity with Spatially Heterogeneous Anthropogenic Heat Data. J. Geophys. Res. Atmos. 2016, 121, 5193–5212. [Google Scholar] [CrossRef]
- Nie, W.; Zaitchik, B.; Ni, G.; Sun, T. Impacts of Anthropogenic Heat on Summertime Rainfall in Beijing. J. Hydrometeorol. 2017, 18, 693–712. [Google Scholar] [CrossRef]
- Kusaka, H.; Nawata, K.; Suzuki-Parker, A.; Takane, Y.; Furuhashi, N. Mechanism of Precipitation Increase with Urbanisation in Tokyo as Revealed by Ensemble Climate Simulations. J. Appl. Meteorol. Climatol. 2014, 53, 824–839. [Google Scholar] [CrossRef]
- Shimadera, H.; Kondo, A.; Shrestha, K.L.; Kitaoka, K.; Inoue, Y. Numerical Evaluation of the Impact of Urbanisation on Summertime Precipitation in Osaka, Japan. Adv. Meteorol. 2015, 2015, 1–11. [Google Scholar] [CrossRef]
- Wen, J.; Chen, J.; Lin, W.; Jiang, B.; Xu, S.; Lan, J. Impacts of Anthropogenic Heat Flux and Urban Land-Use Change on Frontal Rainfall near Coastal Regions: A Case Study of a Rainstorm over the Pearl River Delta, South China. J. Appl. Meteorol. Climatol. 2020, 59, 363–379. [Google Scholar] [CrossRef]
- Hu, C.; Fung, K.Y.; Tam, C.Y.; Wang, Z. Urbanisation Impacts on Pearl River Delta Extreme Rainfall Sensitivity to Land Cover Change Versus Anthropogenic Heat. Earth Space Sci. 2021, 8, 1–11. [Google Scholar] [CrossRef]
- Mokoena, R.; Mturi, G.; Maritz, J.; Mateyisi, M.; Klein, P. African Case Studies: Developing Pavement Temperature Maps for Performance-Graded Asphalt Bitumen Selection. Sustainability 2022, 14, 1048. [Google Scholar] [CrossRef]
- Elmarakby, E.; Khalifa, M.; Elshater, A.; Afifi, S. Tailored Methods for Mapping Urban Heat Islands in Greater Cairo Region. Ain Shams Eng. J. 2021, 13, 101545. [Google Scholar] [CrossRef]
- Mohan, M.; Singh, V.K.; Bhati, S.; Lodhi, N.; Sati, A.P.; Sahoo, N.R.; Dash, S.; Mishra, P.C.; Dey, S. Industrial Heat Island: A Case Study of Angul-Talcher Region in India. Arch. Meteorol. Geophys. Bioclimatol. Ser. B 2020, 141, 229–246. [Google Scholar] [CrossRef]
- Subramani, D.; Chandrasekar, R.; Ramanujam, K.S.; Balaji, C. A New Ensemble-Based Data Assimilation Algorithm to Improve Track Prediction of Tropical Cyclones. Nat. Hazards 2014, 71, 659–682. [Google Scholar] [CrossRef]
- Radhakrishnan, C.; Chandrasekar, V. CASA Prediction System over Dallas–Fort Worth Urban Network: Blending of Nowcasting and High-Resolution Numerical Weather Prediction Model. J. Atmospheric Ocean. Technol. 2020, 37, 211–228. [Google Scholar] [CrossRef]
- Ansari, T.U.; Ojha, N.; Chandrasekar, R.; Balaji, C.; Singh, N.; Gunthe, S.S. Competing Impact of Anthropogenic Emissions and Meteorology on the Distribution of Trace Gases Over Indian Region. J. Atmos. Chem. 2016, 73, 363–380. [Google Scholar] [CrossRef]
- Mittal, R.; Tewari, M.; Radhakrishnan, C.; Ray, P.; Singh, T.; Nickerson, A. Response of Tropical Cyclone Phailin (2013) in the Bay of Bengal to Climate Perturbations. Clim. Dyn. 2019, 53, 2013–2030. [Google Scholar] [CrossRef]
- Balaji, C.; Krishnamoorthy, C.; Chandrasekar, R. On the Possibility of Retrieving Near-Surface Rain Rate from the Microwave Sounder SAPHIR of the Megha-Tropiques Mission. Curr. Sci. 2014, 106, 587–593. [Google Scholar]
- Ramanujam, S.; Chandrasekar, R.; Chakravarthy, B. A New PCA-ANN Algorithm for Retrieval of Rainfall Structure in a Precipitating Atmosphere. Int. J. Numer. Methods Heat Fluid Flow 2011, 21, 1002–1025. [Google Scholar] [CrossRef]
- Ramanujam, S.; Radhakrishnan, C.; Subramani, D.; Chakravarthy, B. On the Effect of Non-Raining Parameters in Retrieval of Surface Rain Rate Using TRMM PR and TMI Measurements. IEEE J. Sel. Top. Appl. Earth Obs. Remote Sens. 2012, 5, 735–743. [Google Scholar] [CrossRef]
- Attada, R.; Parekh, A.; Chowdary, J.S.; Gnanaseelan, C. Reanalysis of the Indian Summer Monsoon: Four Dimensional Data Assimilation of AIRS Retrievals in a Regional Data Assimilation and Modeling Framework. Clim. Dyn. 2017, 50, 2905–2923. [Google Scholar] [CrossRef]
- Dani, V.; Pal, B.K. Climate Variability and Changes in Local Climate. Weather 2018, 73, 322–331. [Google Scholar]
- Chandrasekar, R.; Balaji, C. Sensitivity of Tropical Cyclone Jal Simulations to Physics Parameterisations. J. Earth Syst. Sci. 2012, 121, 923–946. [Google Scholar] [CrossRef] [Green Version]
- Chandrasekar, R.; Balaji, C. Impact of Physics Parameterisation and 3DVAR Data Assimilation on Prediction of Tropical Cyclones in the Bay of Bengal Region. Nat. Hazards 2016, 80, 223–247. [Google Scholar] [CrossRef]
- Kain, J.S.; Fritsch, J.M. A One-Dimensional Entraining/Detraining Plume Model and Its Application in Convective Parameterisation. J. Atmos. Sci. 1990, 47, 2784–2802. [Google Scholar] [CrossRef] [Green Version]
- Boadh, R.; Satyanarayana, A.N.V.; Krishna, T.R.; Madala, S. Sensitivity of PBL Schemes of the WRF-ARW Model in Simulating the Boundary Layer Flow Parameters for Their Application to Air Pollution Dispersion Modeling Over a Tropical Station. Atmósfera 2016, 29, 61–81. [Google Scholar] [CrossRef] [Green Version]
- Marshall, J.S. The Distribution of Raindrops with Size. J. Meteorol. 1948, 5, 165–166. [Google Scholar] [CrossRef]
- Cohard, J.M.; Pinty, J.P. A Comprehensive Two-Moment Warm Microphysical Bulk Scheme. I: Description and Tests. Q. J. R. Meteorol. Soc. 2000, 126, 1815–1842. [Google Scholar] [CrossRef]
- Mishra, P.; Kannan, S.R. A Numerical Experiment to Study the Impact of Temperature Enhancement by Anthropogenic Heating on Local Weather at the Angul Region of India. J. Earth Syst. Sci. 2022, 131, 1–16. [Google Scholar] [CrossRef]
- Koutsoyiannis, D. Clausius–Clapeyron Equation and Saturation Vapour Pressure: Simple Theory Reconciled with Practice. Eur. J. Phys. 2012, 33, 295. [Google Scholar] [CrossRef]
- Mishra, P.; Kannan, S.R. A Numerical Experiment to Study the Effect of Anthropogenic Heating on Local Weather. In Proceedings of the IEEE India Geoscience and Remote Sensing Symposium 2021, Ahmedabad, India, 6–10 December 2021. [Google Scholar]
Figure 1.
Configuration of nested model domains with Angul as the inner domain (d03).

Figure 2.
Comparison of TRMM PR near-surface rainfall with WRF simulated rainfall in mm/h.

Figure 3.
Water vapour mixing ratio comparisons on 16 August 2008 for WDM6 microphysics scheme at near-surface level.
Figure 3.
Water vapour mixing ratio comparisons on 16 August 2008 for WDM6 microphysics scheme at near-surface level.

Figure 4.
Flow pattern comparisons on 16 August 2008 for WDM6 at near-surface level.

Figure 5.
Rain rate (mm/h) comparisons on 16 August 2008 for WDM6 at near-surface level.

Figure 6.
Median diameter comparisons on 16 August 2008 for WDM6 at near-surface level.

Figure 7.
(a) Variation of Cloud number concentration on 16 August 2008 with vertical height, (b) Variation of Rain number concentration on 16 August 2008 with vertical height.
Figure 7.
(a) Variation of Cloud number concentration on 16 August 2008 with vertical height, (b) Variation of Rain number concentration on 16 August 2008 with vertical height.

Figure 8.
Water vapour mixing ratio comparisons on 22 March 2008 for WDM6 at near-surface level.

Figure 9.
Flow pattern comparisons on 22 March 2008 for WDM6 at near-surface level.

Figure 10.
Rain rate (mm/h) comparisons for WDM6 on 22 March 2008 at near-surface level.

Figure 11.
Median diameter comparisons on 22 March 2008 for WDM6 at near-surface level.

Figure 12.
(a) Variation of Cloud number concentration on 22 March 2008 with vertical height, (b) Variation of Rain number concentration on 16 August 2008 with vertical height.
Figure 12.
(a) Variation of Cloud number concentration on 22 March 2008 with vertical height, (b) Variation of Rain number concentration on 16 August 2008 with vertical height.


Table 1.
Model physics parameterisation schemes.
| Cumulus | |
| 1. Kain–Fritsch (new Eta) scheme | KF |
| 2. Betts–Miller–Janjic scheme | BMJ |
| 3. Grell–Devenyi ensemble scheme | GD |
| 4. New Grell scheme | GRE |
| PBL | |
| 1. Yonsei University scheme | YSM |
| 2. Mellor–Yamada–Janjic (Eta) TKE scheme | MYJ |
| 3. Mellor–Yamada–Nakanishi–Niino 2.5 level TKE | MYNN2.5 |
| 4. Mellor–Yamada–Nakanishi–Niino 3 level TKE | MYNN3 |
| Microphysics | |
| 1. Kessler scheme | KS |
| 2. Lin et al. scheme | LIN |
| 3. WRF Single Moment 3-class simple ice scheme | WSM3 |
| 4. WRF Single Moment 5-class scheme | WSM5 |
| 5. Ferrier (new Eta) microphysics | FERRIER |
| 6. WRF Single Moment 6-class scheme | WSM6 |
| 7. Morrison 2-moment scheme | MORRISON |
| 10. WRF Double moment, 5-class scheme | WDM5 |
| 11. WRF Double moment, 6-class scheme | WDM6 |
| 12. Thompson scheme | THOM |
Publisher’s Note: MDPI stays neutral with regard to jurisdictional claims in published maps and institutional affiliations. |
© 2022 by the authors. Licensee MDPI, Basel, Switzerland. This article is an open access article distributed under the terms and conditions of the Creative Commons Attribution (CC BY) license (https://creativecommons.org/licenses/by/4.0/).
Share and Cite
MDPI and ACS Style
Mishra, P.; Kannan, S.R.; Radhakrishnan, C. The Effect of Anthropogenic Heat and Moisture on Local Weather at Industrial Heat Islands: A Numerical Experiment. Atmosphere 2022, 13, 357. https://doi.org/10.3390/atmos13020357
AMA Style
Mishra P, Kannan SR, Radhakrishnan C. The Effect of Anthropogenic Heat and Moisture on Local Weather at Industrial Heat Islands: A Numerical Experiment. Atmosphere. 2022; 13(2):357. https://doi.org/10.3390/atmos13020357
Chicago/Turabian StyleMishra, Parthasarathi, Srinivasa Ramanujam Kannan, and Chandrasekar Radhakrishnan. 2022. "The Effect of Anthropogenic Heat and Moisture on Local Weather at Industrial Heat Islands: A Numerical Experiment" Atmosphere 13, no. 2: 357. https://doi.org/10.3390/atmos13020357
Note that from the first issue of 2016, this journal uses article numbers instead of page numbers. See further details here.