Article

Status of Air Pollution during COVID-19-Induced Lockdown in Delhi, India

1
Indian Institute of Remote Sensing, Dehradun 248001, India
2
RBased Services Private Limited, Delhi 110086, India
3
Centre for Climate Change & Water Research, Suresh Gyan Vihar University, Jaipur 302017, India
4
Department of Ecology, Environment and Remote Sensing, Government of Jammu and Kashmir, Srinagar 190018, India
5
Department of Geography, School of Environment and Earth Sciences, Central University of Punjab, VPO-Ghudda, Bathinda 151401, India
6
Centre for Sustainable Development, Suresh Gyan Vihar University, Jaipur 302017, India
7
Institute for Global Environmental Strategies, Hayama 240-0115, Kanagawa, Japan
*
Author to whom correspondence should be addressed.
Atmosphere 2022, 13(12), 2090; https://doi.org/10.3390/atmos13122090
Submission received: 28 September 2022 / Revised: 3 December 2022 / Accepted: 8 December 2022 / Published: 12 December 2022
(This article belongs to the Special Issue Feature Papers in Air Quality)

Abstract

:
To monitor the spread of the novel coronavirus (COVID-19), India, during the last week of March 2020, imposed national restrictions on the movement of its citizens (lockdown). Although India’s economy was shut down due to restrictions, the nation observed a sharp decline in particulate matter (PM) concentrations. In recent years, Delhi has experienced rapid economic growth, leading to pollution, especially in urban and industrial areas. In this paper, we explored the linkages between air quality and the nationwide lockdown of the city of Delhi using a geographic information system (GIS)-based approach. Data from 37 stations were monitored from 12 March, 2020 to 2 April, 2020 and it was found that the Air Quality Index for the city was almost reduced by 37% and 46% concerning PM2.5 and PM10, respectively. The study highlights that, in regular conditions, the atmosphere’s natural healing rate against anthropogenic activities is lower, as indicated by a higher AQI. However, during the lockdown, this sudden cessation of anthropogenic activities leads to a period in which the natural healing rate is greater than the induced disturbances, resulting in a lower AQI, and thus proving that this pandemic has given a small window for the environment to breathe and helped the districts of Delhi to recover from serious issues related to bad air quality. If such healing windows are incorporated into policy and decision-making, these can prove to be effective measures for controlling air pollution in heavily polluted regions of the World.

1. Introduction

Air pollution is a major concern worldwide; according to the World Health Organization (WHO) survey, 14 out of 15 of India’s most polluted cities have been affected. Air pollution, particularly in megacities, has an unfavorable impact on daily human life. Delhi has experienced rapid economic growth in recent years, which has led to pollution, especially in urban and industrial areas. In Delhi, the main contributors to PM10 contaminants are road dust (56%), concrete batching (10%), industrial-level sources (10%), and automobiles (9%) [1]. Air quality management in urban environments is required to safeguard human health, reduce industrial losses, maximize workers’ productivity, and enhance indoor air quality. In this regard, air quality monitoring, networks of Continuous Air Quality Monitoring (CAQM) stations, satellite datasets, and geographic information system (GIS) technology play a crucial role.
In India, since 1974, the Central Pollution Control Board (CPCB) has been responsible for air quality monitoring [2]. In major cities, networks were developed for air quality calculations. CPCB and other state pollution control boards currently maintain and manage a network of 133 ground stations, Continuous Air Quality Monitoring Stations (CAQM), and 37 CAQM stations within the Delhi area. The Government of Delhi has sought to regulate air pollution through vehicle enforcement laws such as the odd-even formula, the prohibition of 10-year-old diesel vehicles, the introduction of Compressed Natural Gas (CNG) vehicles, public incentives for carpooling, etc. Delhi’s major contaminants in the atmosphere are particulate matter (PM2.5 and PM10), nitrogen oxides, sulfur dioxide, carbon monoxide, ozone, benzene, toluene, xylene, carbonaceous and organic aerosols, metals, and volatile organic compounds [3]. The research published in May 2014 by the WHO used datasets from 2008–2013 and ranked Delhi as the most polluted city in the World, with an average yearly PM2.5 concentration of 153 µg/m3.
Many studies have been performed earlier on GIS techniques to track air pollution. This technology provides a detailed overview of the city, identifies the significant sources of pollution and the distribution pattern, helps decide where to make efforts to reduce pollution rates, and agrees on any relation between city characteristics and air pollution distribution. A GIS-based methodology has been established [4,5,6,7] and is increasingly utilized in the natural environment’s measurement, analysis, perception, simulation, and management [8,9,10,11,12]. The statistical interpolation process also uses GIS to create ‘virtual stations’ [13]. In light of this, on 14 April 2020, the Government of India extended the lockdown that had been put in place on 24 March, 2020 until 3 May, 2020. This action was taken to combat the virus’s lethality through social isolation and other measures, as recommended by the WHO [14]. India has developed a far-reaching strategy to address the pandemic and its economic woes properly. Zoning the COVID-19 epicenters is one such method. The federal government and the individual states are dividing the country into zones of varying danger; the zone with the greatest number of confirmed cases will be quarantined for a lengthy period of time [10].
During the first week of February 2020, the novel coronavirus (COVID-19) epidemic broke out in India. After monitoring its propagation, India imposed a nationwide lockdown from 24 March, 2020, leading to major declines in economic activities and related emissions. Although India’s economy was shut down to prevent COVID-19 from spreading, the nation observed a sharp decrease in particulate matter. Many researchers carried out the study of lockdown impact on air pollution in the Delhi and other cities of India [15,16,17,18] and have reported a reduction of AQI in the range of 30–50% and 40–60% for NOx.
Air quality assessment is carried out in Delhi based on ground measurements of 37 CAQM stations throughout this paper. The study highlights the impact of the lockdown on air quality standards due to an outbreak of Severe Acute Respiratory Syndrome Coronavirus 2 (SARS-CoV-2). The observation period of this study is taken from 12 March to 2 April 2020. The study further aims to show the potential of GIS in monitoring the Air Quality spatial distribution, mapping it on a microscale level, and analyzing the particulate matter concentrations of the Delhi region. Moreover, this research also hopes to demonstrate the potential rate of nature’s ability to heal from anthropogenic activities.

2. Materials and Methods
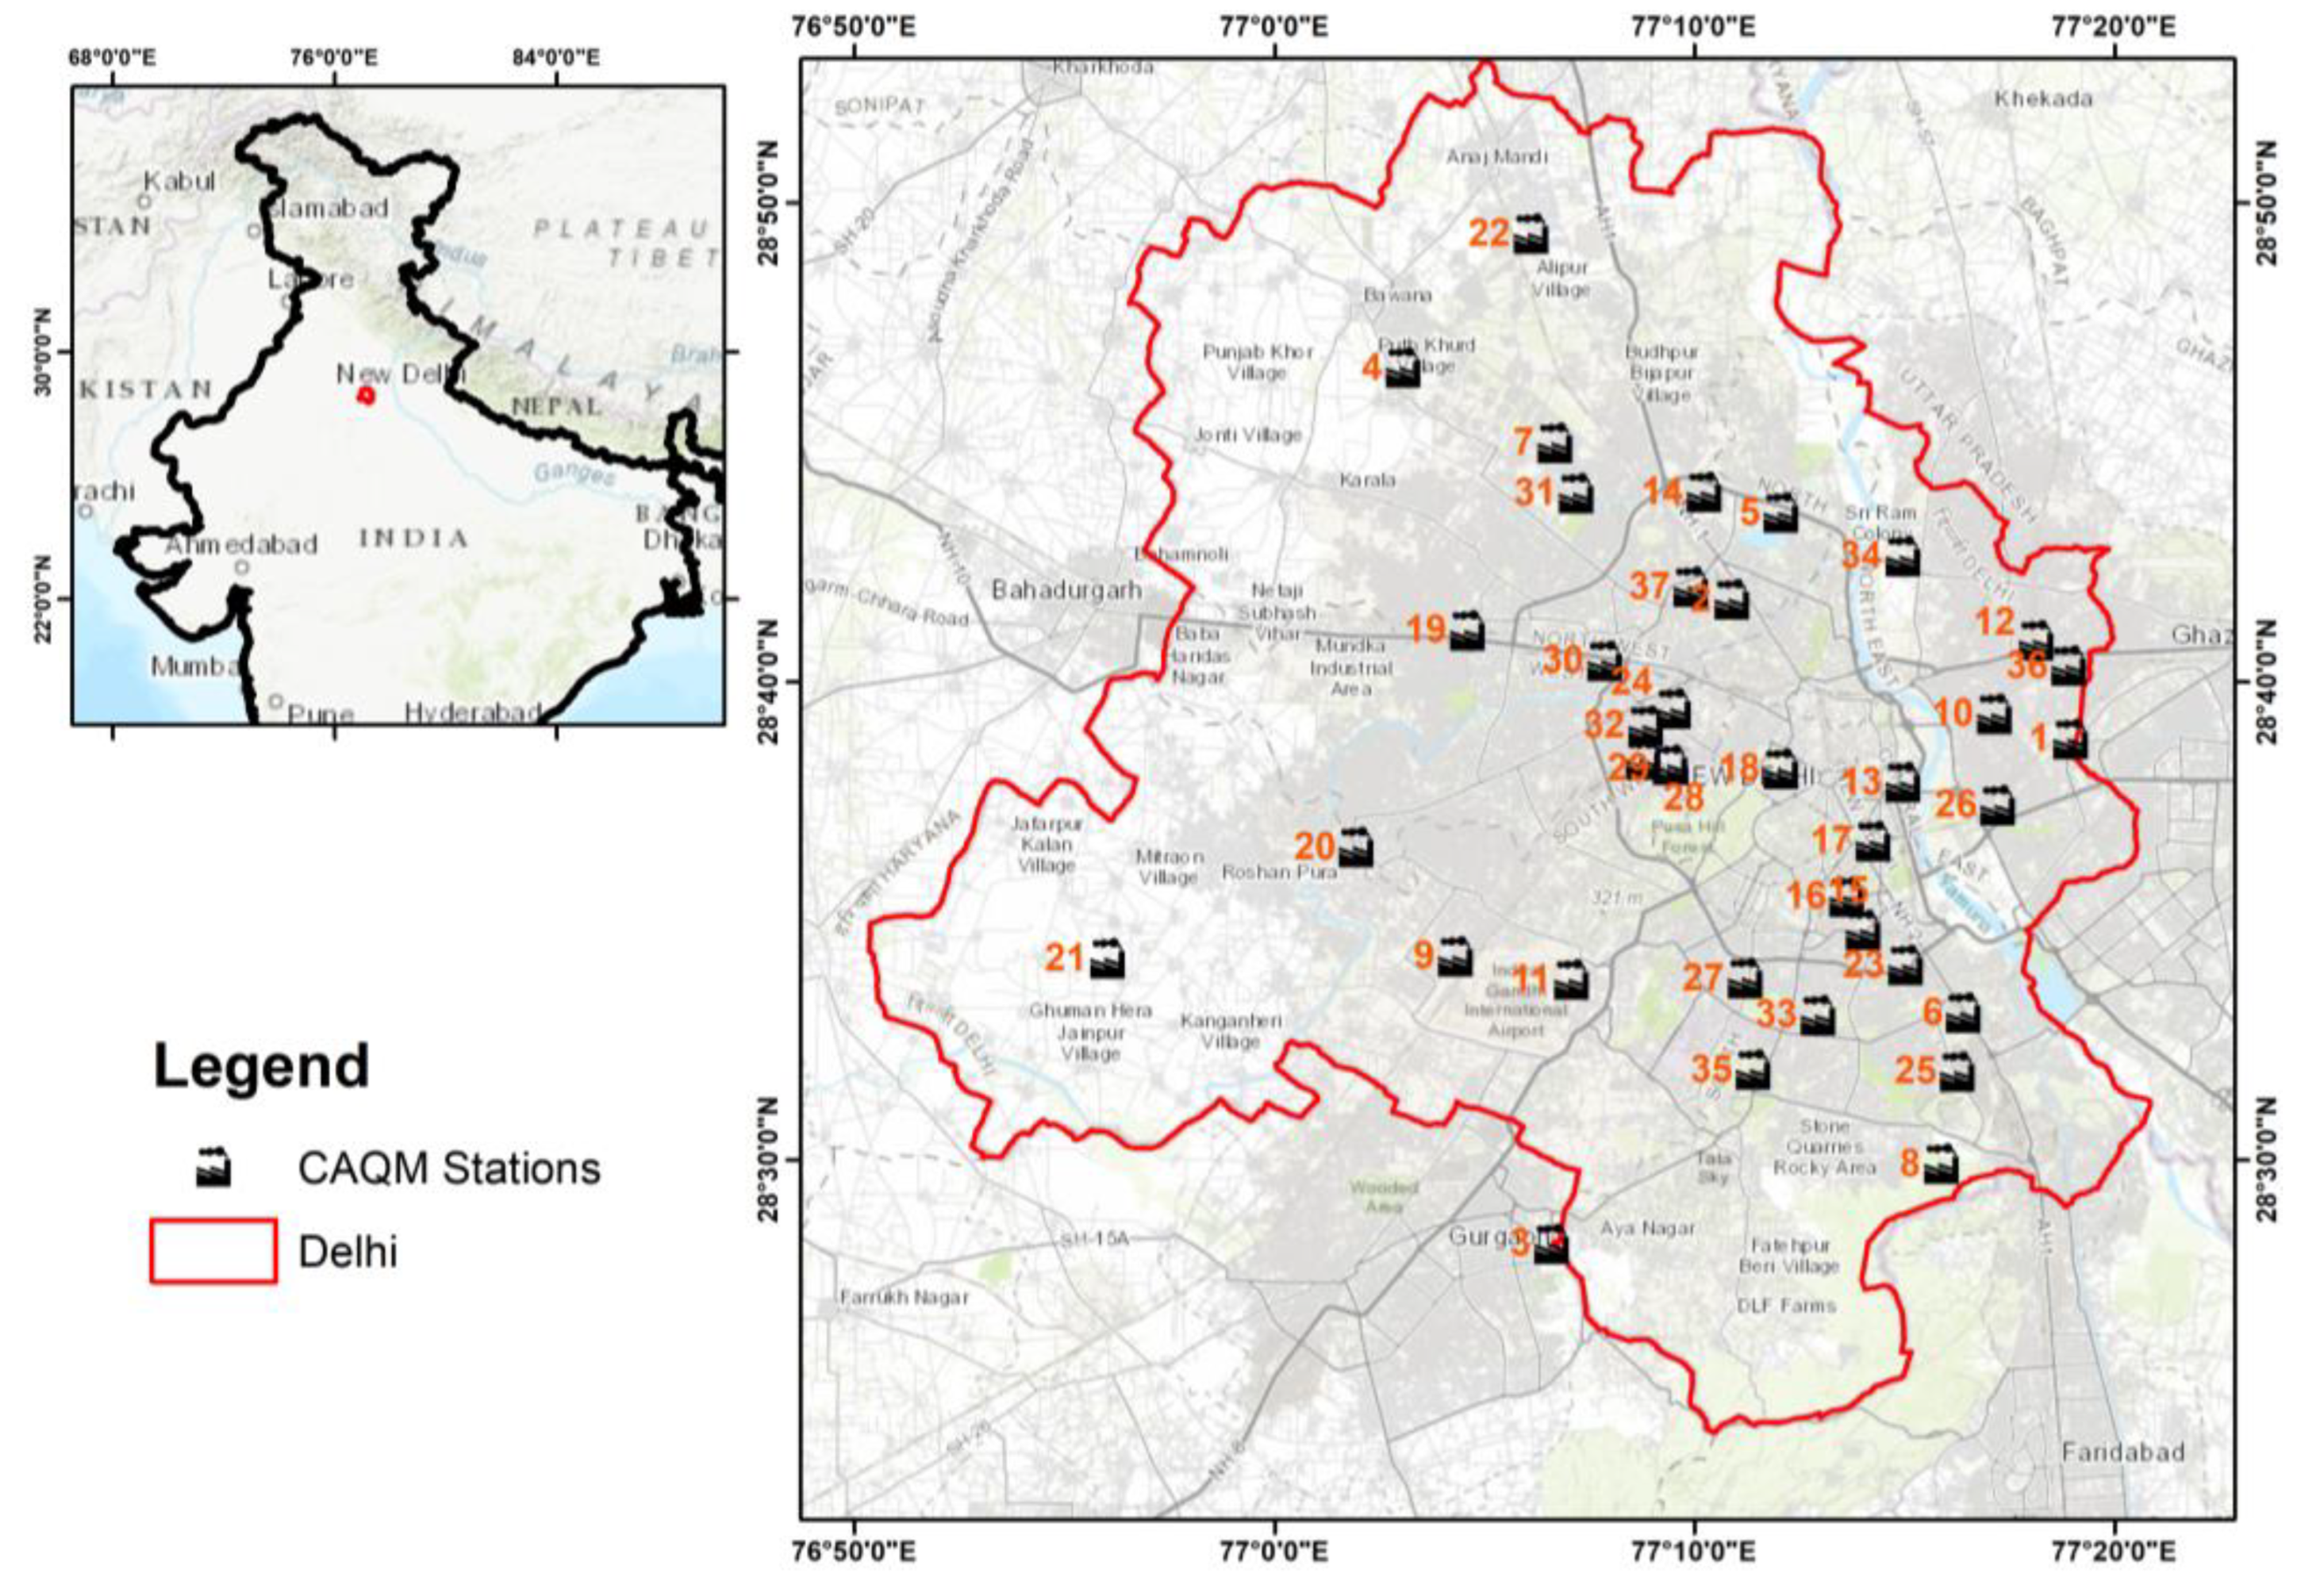
2.1. Study Area

Delhi is the capital of India and is also the country’s economic capital. Delhi is the most densely populated city in the country and the World. Delhi city has an area of approx. 1490 sq. km and extending between north latitudes 28°25’ and 28°55’ and east longitudes 76°45’ and 78°20’. It is surrounded on three sides by Haryana and on the east by Uttar Pradesh. According to the 2011 census, the population of Delhi was more than 11 million [19], India’s second-largest city after Mumbai, while the overall NCT city was around 16.8 million. Delhi has a subtropical humid dry-winter climate bordering a hot semi-arid climate. The warm season occurs between 21 March and 15 June, with a daily average high temperature of 39 °C (102 °F). The coldest day of the year is 4 January, between the mean of 2 °C (36 °F) and 14 °C (57 °F). The wind moves from the northwest to the southwest in early March. The selection of this study area is attributed to dramatic environmental changes due to the nationwide lockdown and the availability of air quality data for CAQM stations. The study area map is shown in Figure 1.
The methodology employed to assess the Air Quality parameters includes Data Acquisition from Delhi CAQM stations, Data Processing and Data Analysis. The Data Processing portion consists of converting all non-spatial data into spatial data. After conversion, spatial data was used for geospatial mapping of various pollutants, viz. PM10 and PM2.5. In the Data Analysis part, an error assessment of various interpolation techniques was performed, and the best interpolation technique was chosen. Then, the Air Quality Index was evaluated using the linear interpolation technique provided by the Environmental Protection Agency (EPA) [20]. The other processed result was analyzed to determine the variation in air pollution before and during the nationwide lockdown period. The period was chosen so that the effect of rainfall is minimal. The image below shows the rainfall in the pre- and during-lockdown period (Figure 2 and Figure 3).
It can be observed that during the pre-lockdown period, only one rainfall event took place, on 14 March, 2020, measuring around 16 mm. During the lockdown period (23 March 2020, to 2 April, 2022), only two precipitation events occurred in the study area that too, on the first two days of lockdown (i.e., on 23 and 24 March 2022), with an average precipitation of a meager 3.74 mm as shown in Figure 2 and Figure 3. This rules out any possibility of the influence of rain on the washing of atmospheric PM before and during the lockdown period. Using this study, we intended to show how the atmosphere gets influenced due to anthropogenic activities in the capital of India, New Delhi, considered the second most polluted city in the World. COVID-19, although it had its negative impacts on the human systems, it did show that if the human influence on the environment is reduced, the environment has an inbuilt mechanism to recover to its original state.
Wind can play a major role in concentrating the PM2.5 and PM10 in the atmosphere. However, it must be noted that Delhi is completely surrounded by industries on all sides. Under normal circumstances, winds act as the force for concentrating the PM in the Delhi region. Since the industries were shut down during the lockdown period, the lockdown provided the best opportunity to study their influence on the air quality index during the no-work (lockdown) period. The particulate matter due to industries was also reduced during the lockdown period. Therefore, this period was the best period for assessing the role of anthropogenic activities on atmospheric particulate matter.

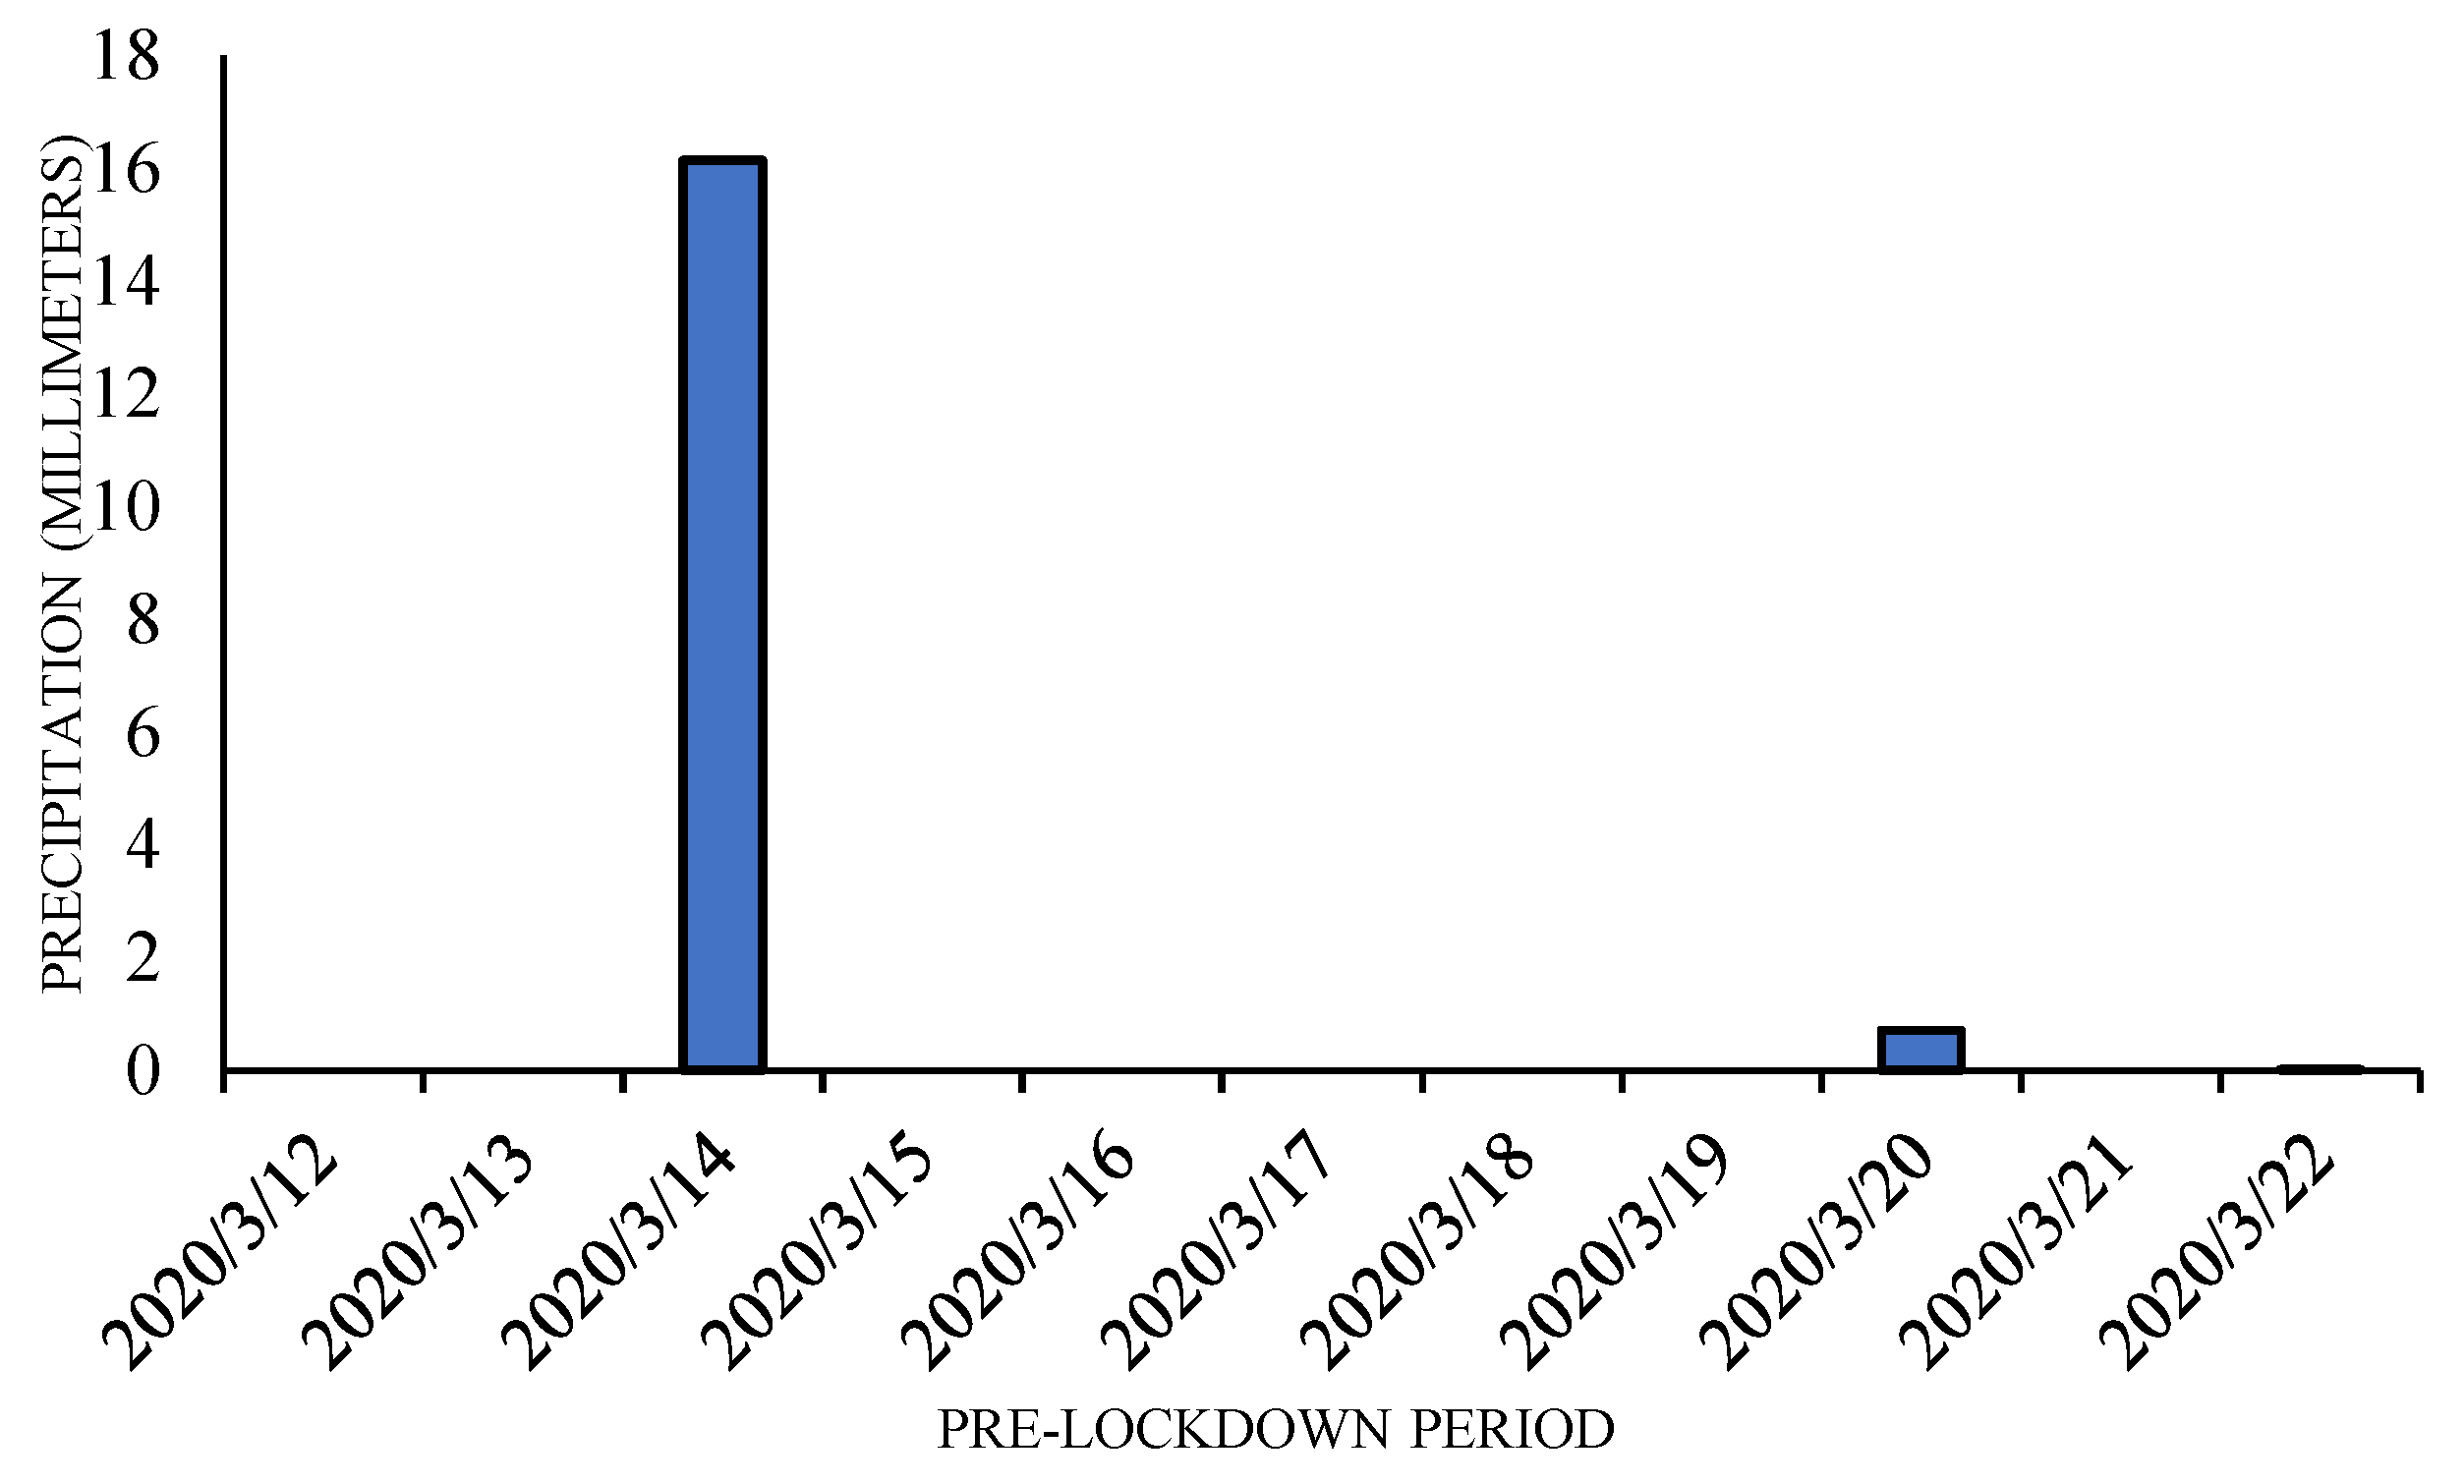
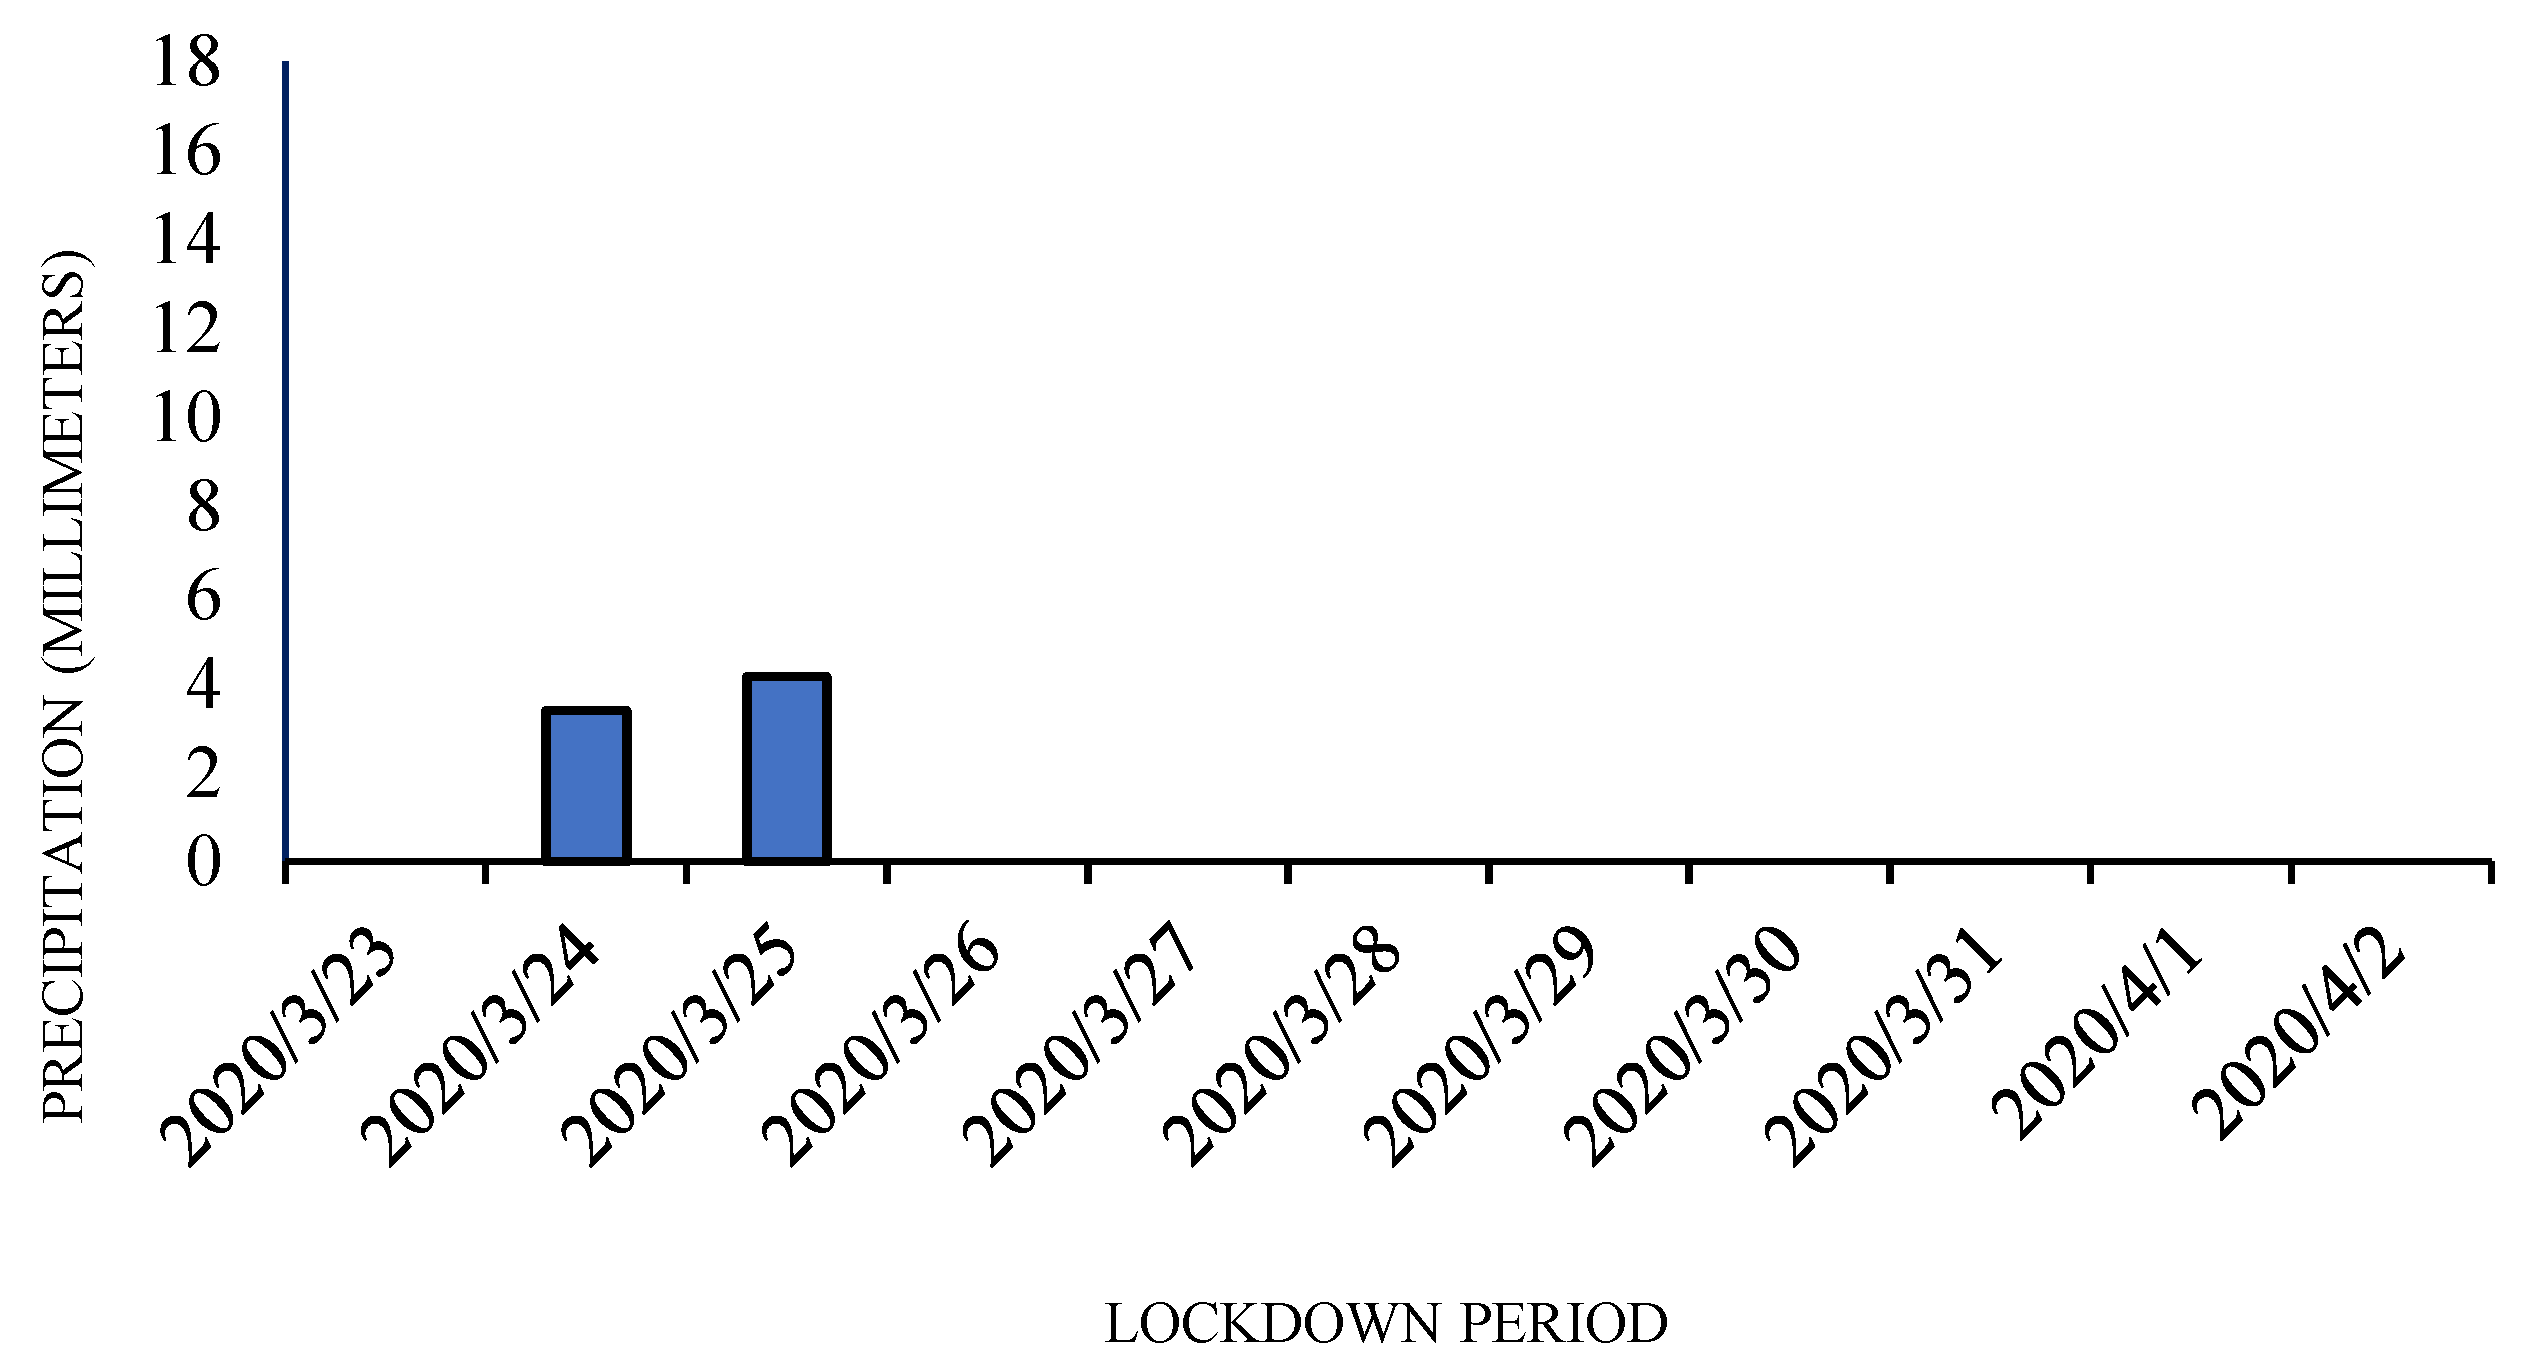
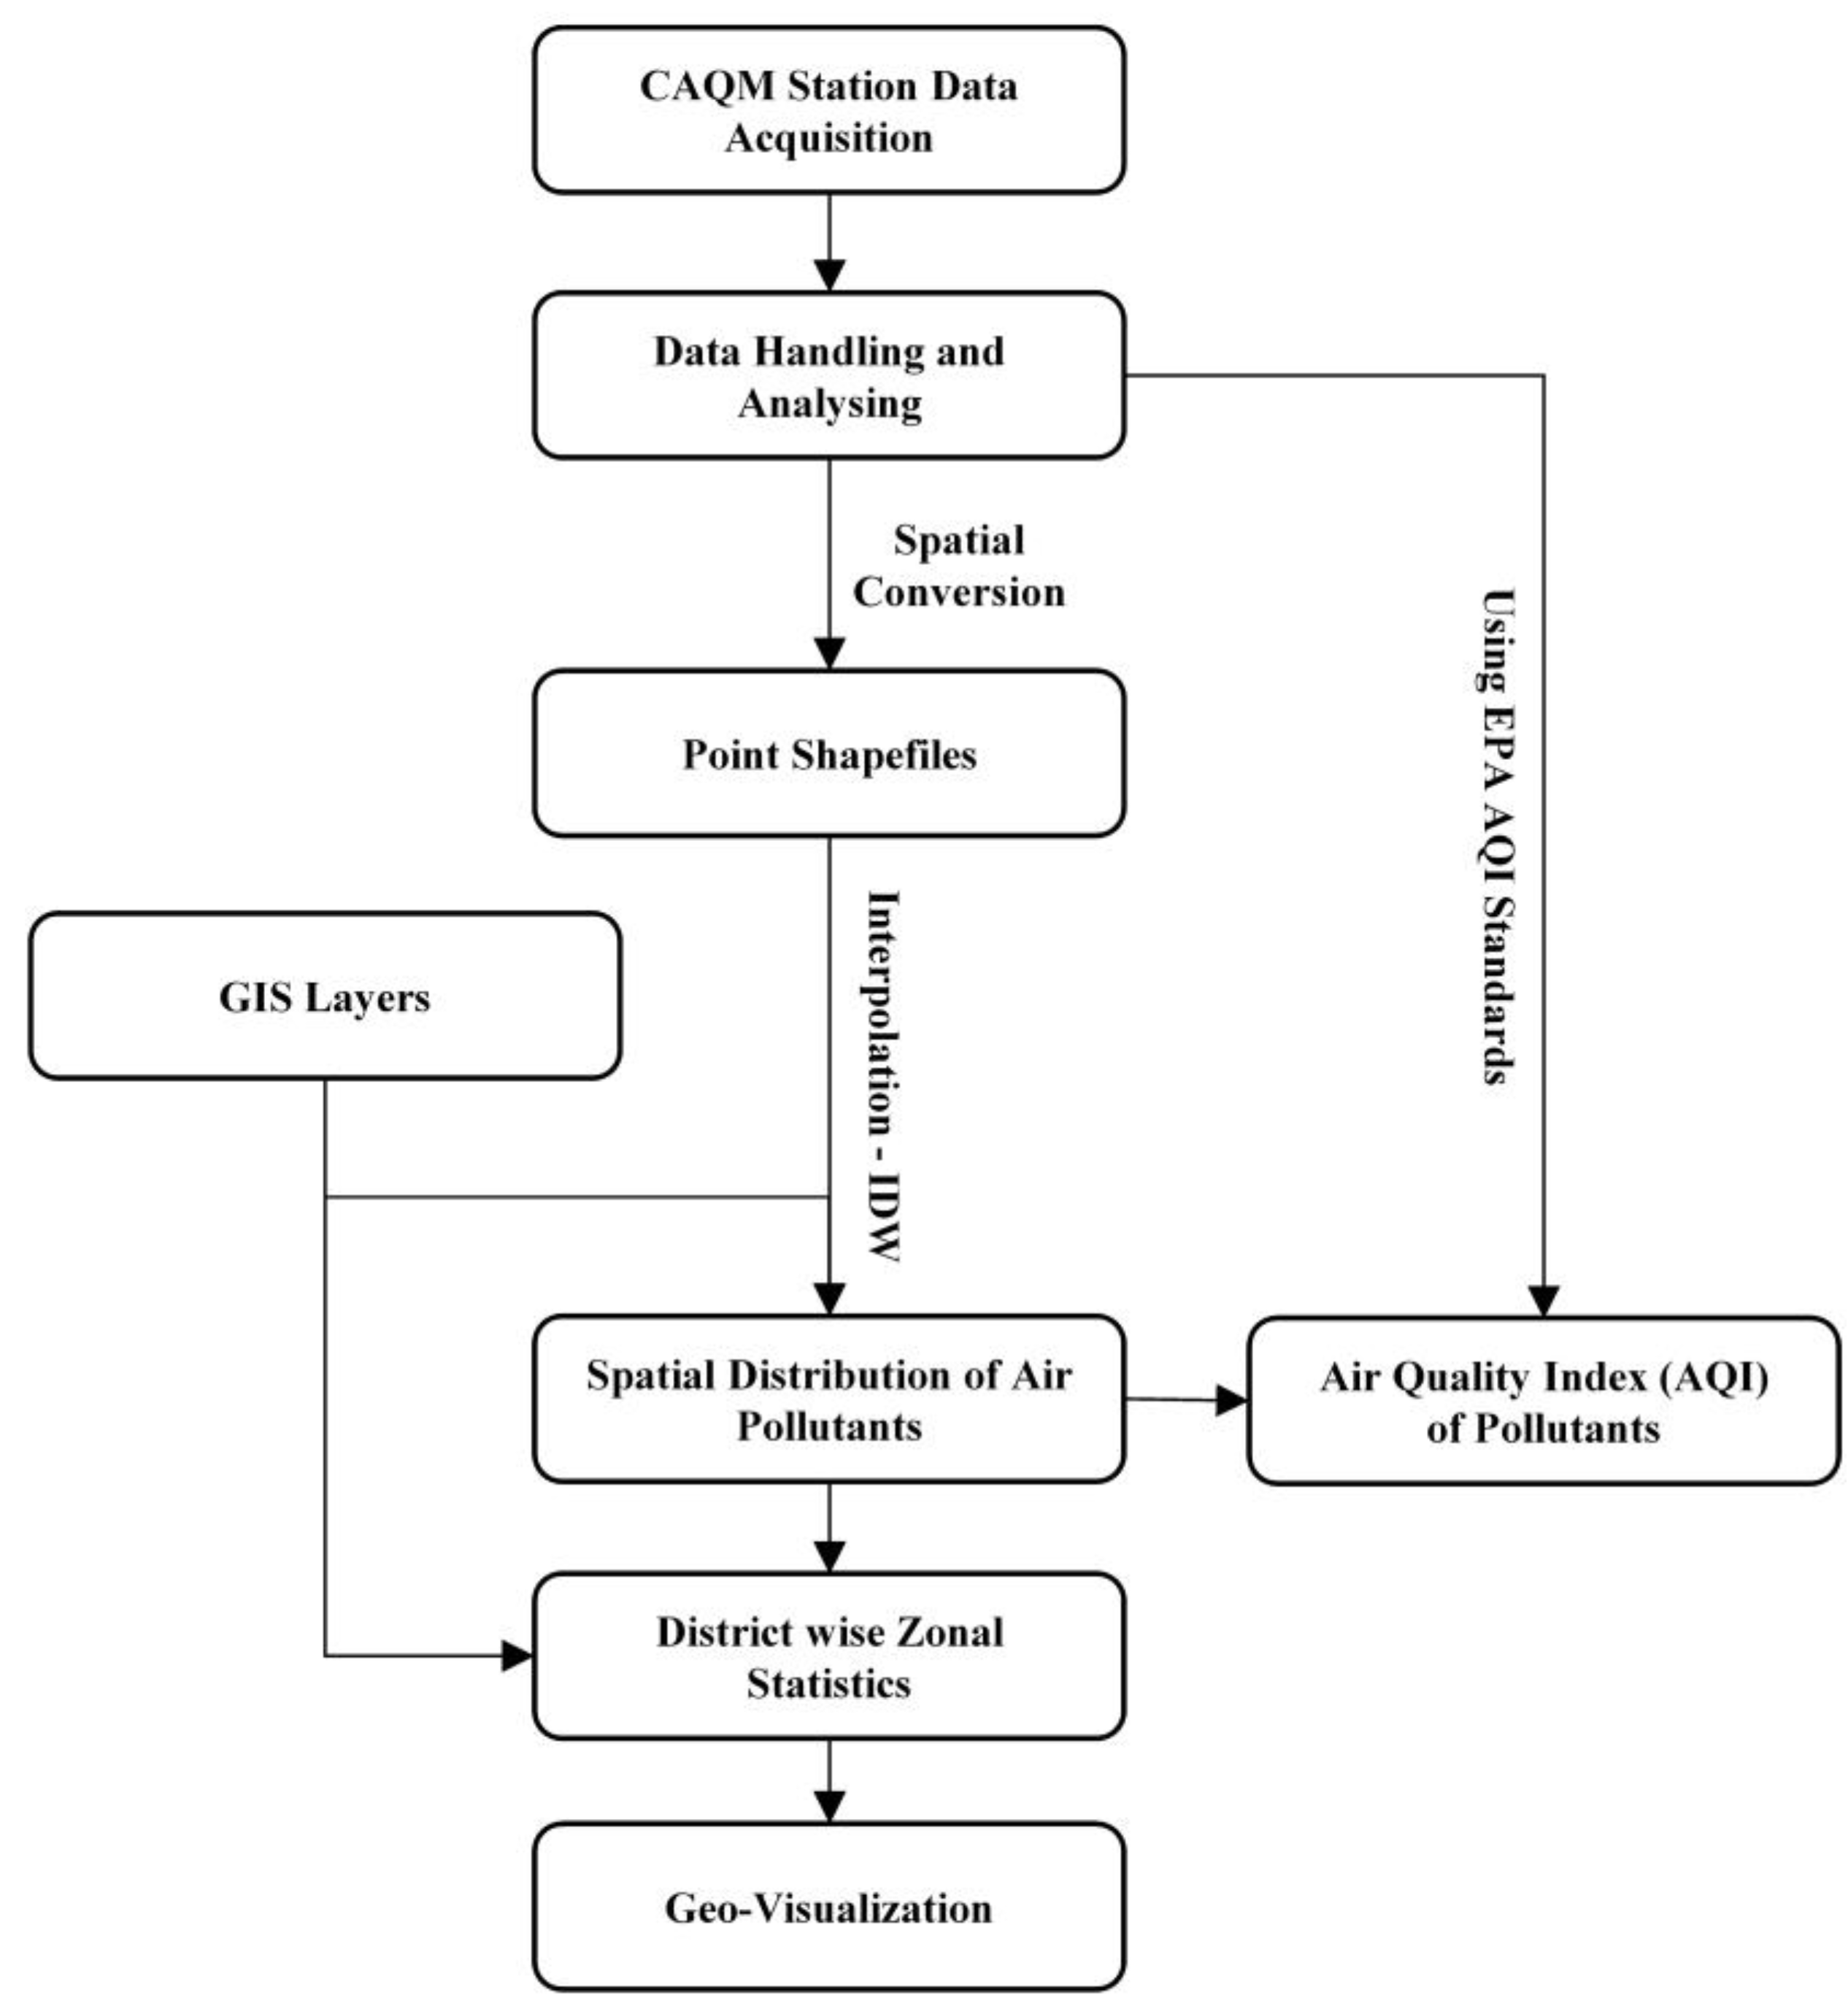
2.2. Data Acquisition

The first step includes the processing of data. Data used in this study are from 37 CAQM stations (Table 1), air pollutants, and GIS data. The air pollution data consists of two (2) pollutant components (PM2.5 and PM10) between 12 March, 2020, and 2 April, 2020. The date range for the study was split into two sections. One is the average from 12 March, 2020, to 22 March, 2020 (before lockdown) and the other from 23 March, 2020, to 2 April, 2020. The GIS dataset includes the administrative boundary of Delhi districts and locations of CAQM stations in the study area. The adopted methodology flow chart is shown in Figure 4.

2.3. Data Processing

The GIS Spatial Database and Spatial Analysis Software can help track air pollutants’ effects. Air contamination maps may be used to calculate areas, which also help determine the sensitivity locations involving different pollutants. The number of people impacted can also be computed using air quality maps. Plans and decisions aided by air quality maps can positively impact lowering pollution levels. This paper evaluates air pollution through the Air Quality Index and maps over the study area. GIS provides a versatile toolkit to store and locate, convert and display real-world spatial data for different purposes [21]. A GIS cataloging and metadata management system could be used at every process stage to track data manipulation [22]. Those involve input data update, data simplification, interpolation methods, measurement methods, calculation parameters, and other considerations that can impact the precision of the results. Therefore, in the research on the future effects of air pollution, GIS is becoming more relevant. GIS allows the electronic representation of air quality impacts and is an essential method for the outcomes study. Integrating GIS with air pollution prediction models generates a quick and accurate environmental impact assessment of air pollution. GIS Database Management System makes storing, collecting, controlling, and managing noise data easier. Air pollution maps can be produced based on the interpolation techniques available in GIS. A continuous spatial model of pollution levels can be created within GIS. The GIS provides a convenient environment for publishing pollution maps on the internet. The air pollution map can be integrated with other thematic maps depending on their use.

2.4. Data Pre-Processing and Cross-Validation

The objective evaluation procedures were carried out using cross-validation techniques to analyze the different interpolation methods’ precision, applicability, and efficacy. Cross-validation is the traditional technique for testing the precision of the effects of interpolation. Cross-validation is done by extracting information from the location, usually by one measurement at a time, measuring the value with the remaining evidence at that location, and then calculating the discrepancy between the true and the approximate value for each location [23]. The cross-validation method has been done by choosing five stations out of 37 stations in Delhi. We evaluated the difference between the actual data and the expected data of each interpolated process by measuring the mean error (ME) Equation (1) and the Root Mean Squared Error (RMSE) Equation (2) by various interpolation techniques. The ME tests the estimation, and the unbiased interpolation target should be near 0 [24,25]. The RMSE is a test of the accuracy of the different prediction methods. It is as low for unbiased and reliable forecasts as possible. The ME and RMSE were determined using the following equations [24,25,26,27,28,29,30].
ME = 1 n i = 1 n Z P i z a i
RMSE = 1 n i = 1 n Z P i z a i 2
where Z(Pi) is the prediction value, and z(ai) is the actual value of validating point i, n = the number of validation points, ME = mean prediction error, RMSE = root mean square error, i = validating point, ai = the position of validating point “i”.

2.5. Data Estimation–Air Quality Index

Implementing ambient air quality standards is necessary to enhance a system to effectively regulate ambient air quality and avoid the adverse effects of air pollution [31,32,33]. Air Quality Index (AQI) may be calculated using pollutant concentration data and linear interpolation, as shown below [34,35]. Table 2 displays the breakpoints (BP) relating to each air quality parameter. The results corresponding to each CAQM station were then mapped using the Inverse Distance Weight technique in the ArcGIS environment and were further classified into different levels of AQI [36].

3. Results and Discussion

3.1. Cross-Validation-Error Estimation

Equations (1) and (2) measured each interpolation layer’s ME and the RMSE. Four interpolation methods (IDW, Kriging, NN, Spline) statistical parameters were calculated using ArcGIS and provided in Table 3.
The goodness rating is reserved separately for ME and RMSE. The mathematical parameter suggests the lowest error in the ME of IDW with 2.18. This indicates that IDW is less partial than the other interpolators [37]. Although IDW displayed a lower RMSE when comparing RMSE values, specific IDW is better than other interpolators. IDW shows a low ME since uncertain position estimation is based on spatial autocorrelation, and the rate of air quality in known areas is anisotropic. IDW demonstrates lower RMSE than other interpolation strategies, as the reference points are still in the same place in IDW modeling as the nodes or edges. This means that IDW preserves all the consistency of the input data when also modeling the values between known points [38]. IDW techniques were therefore used in this paper.

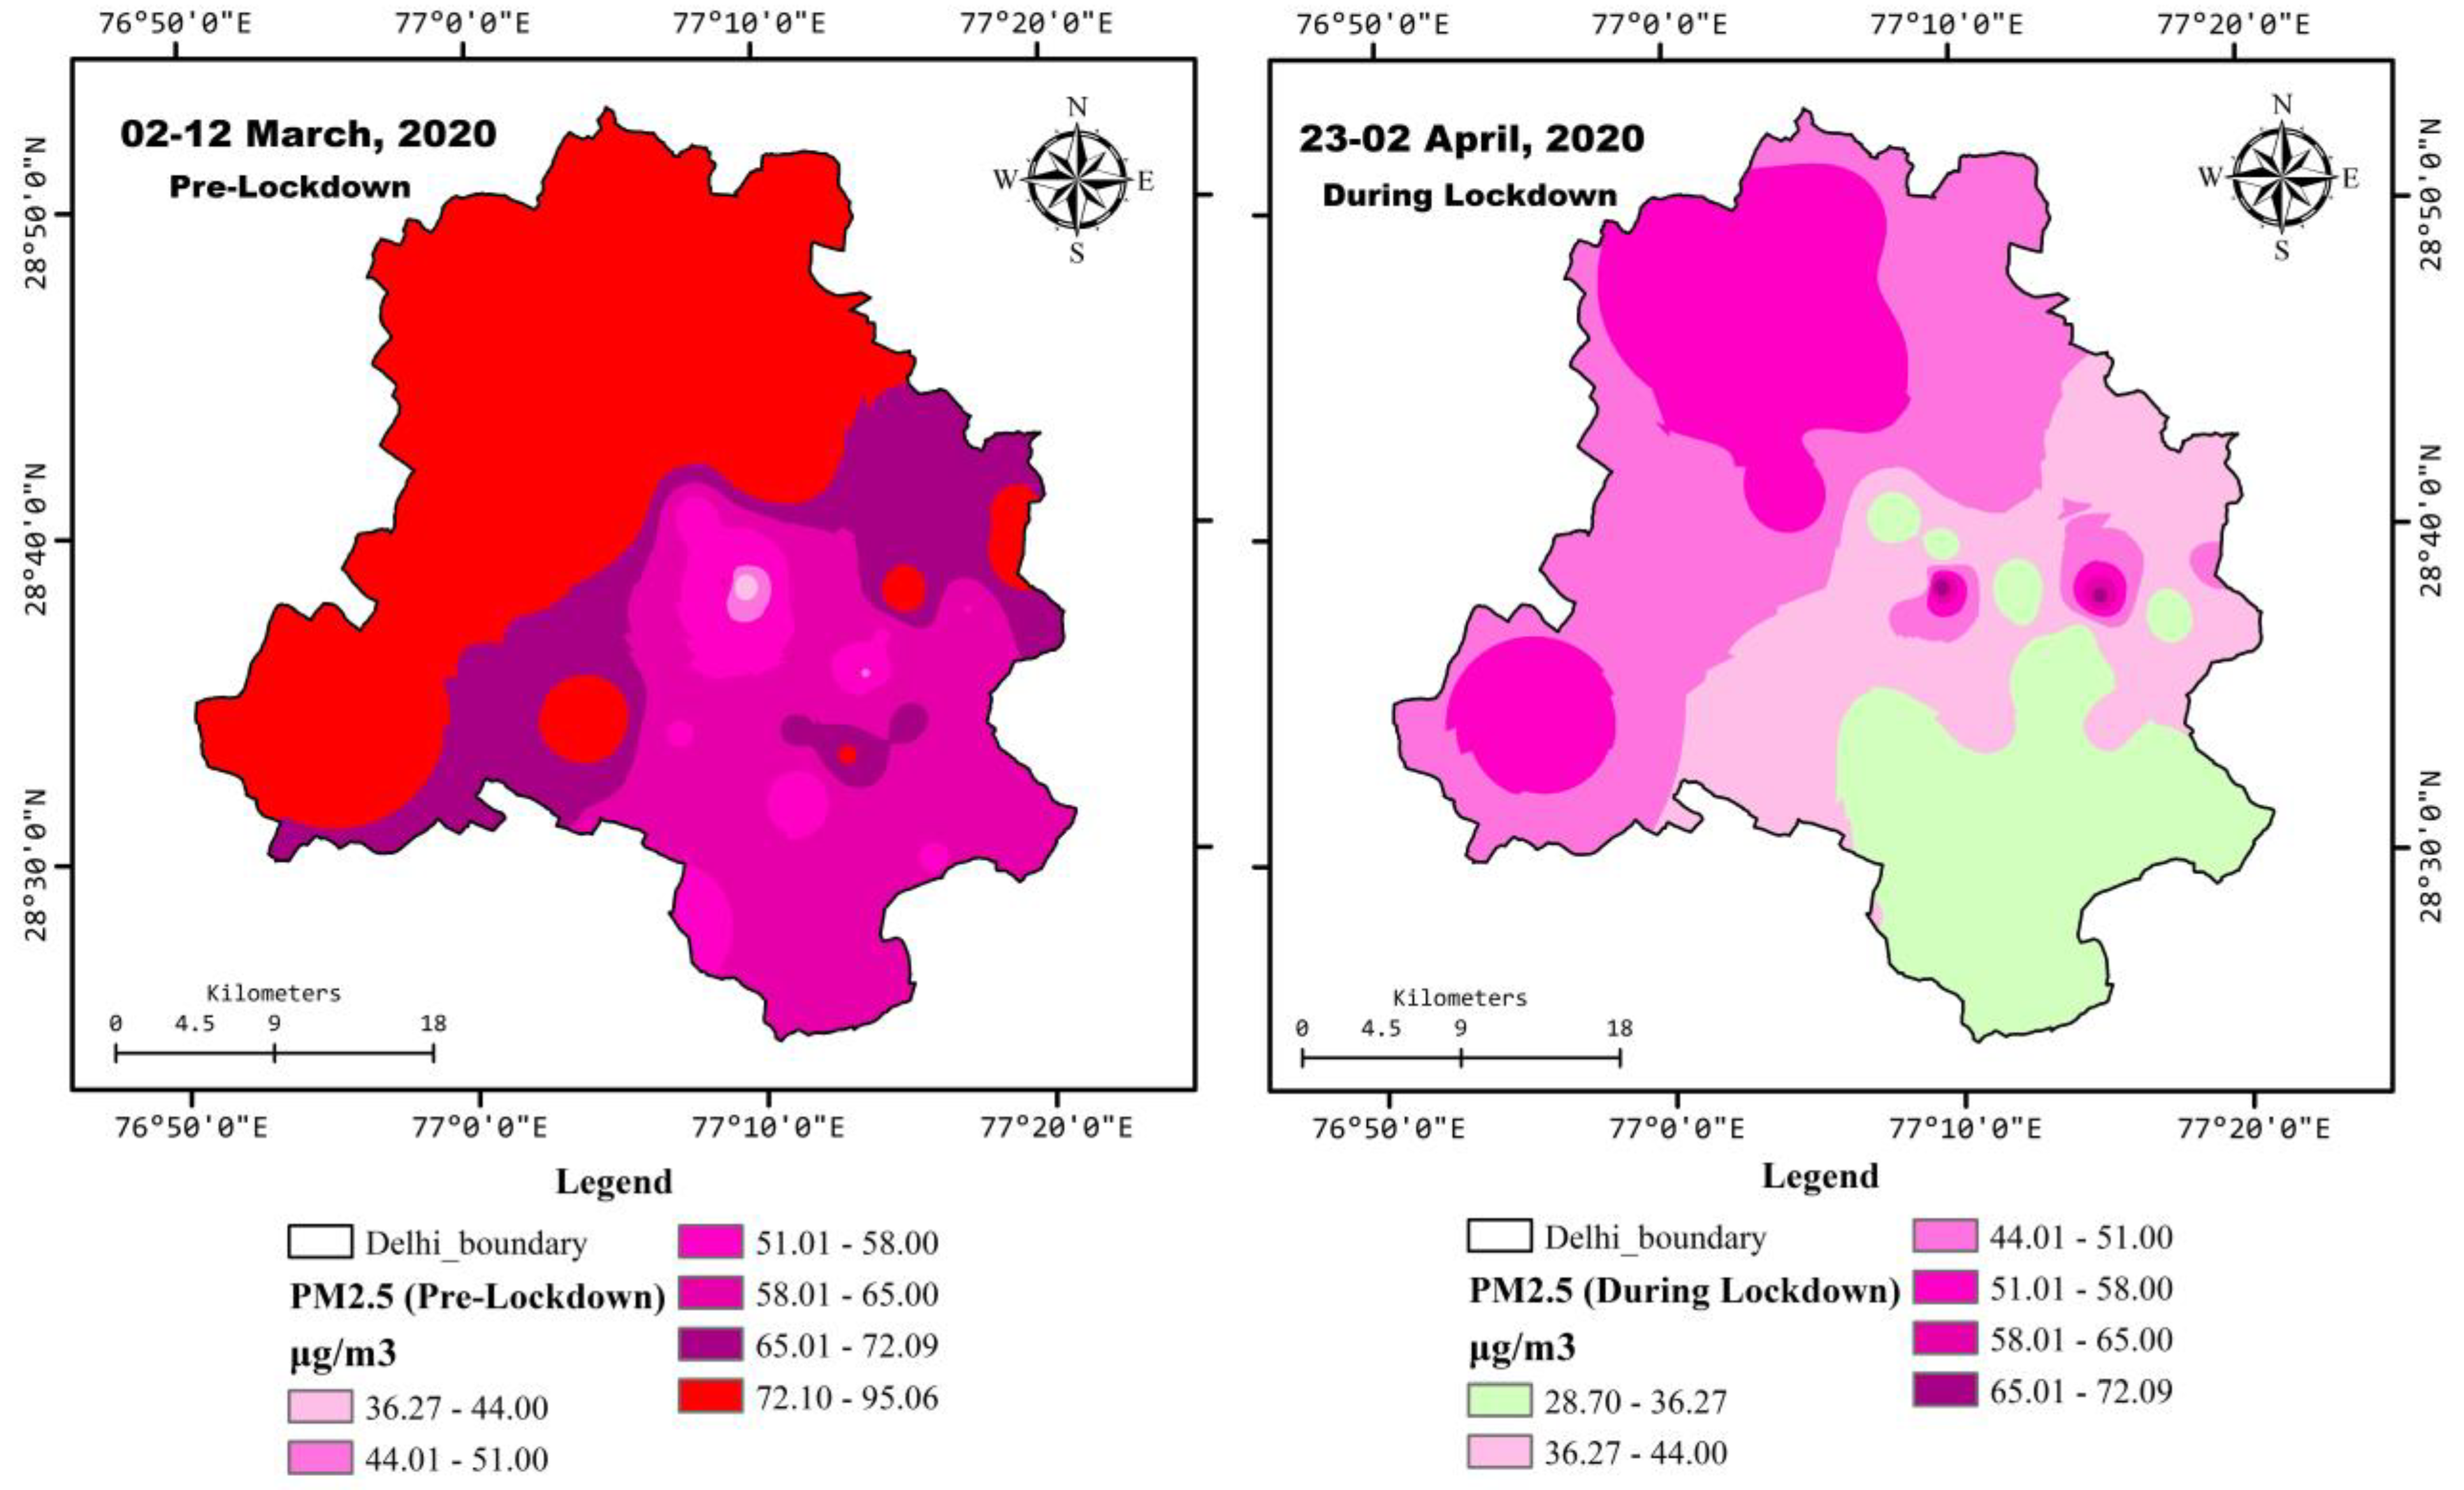
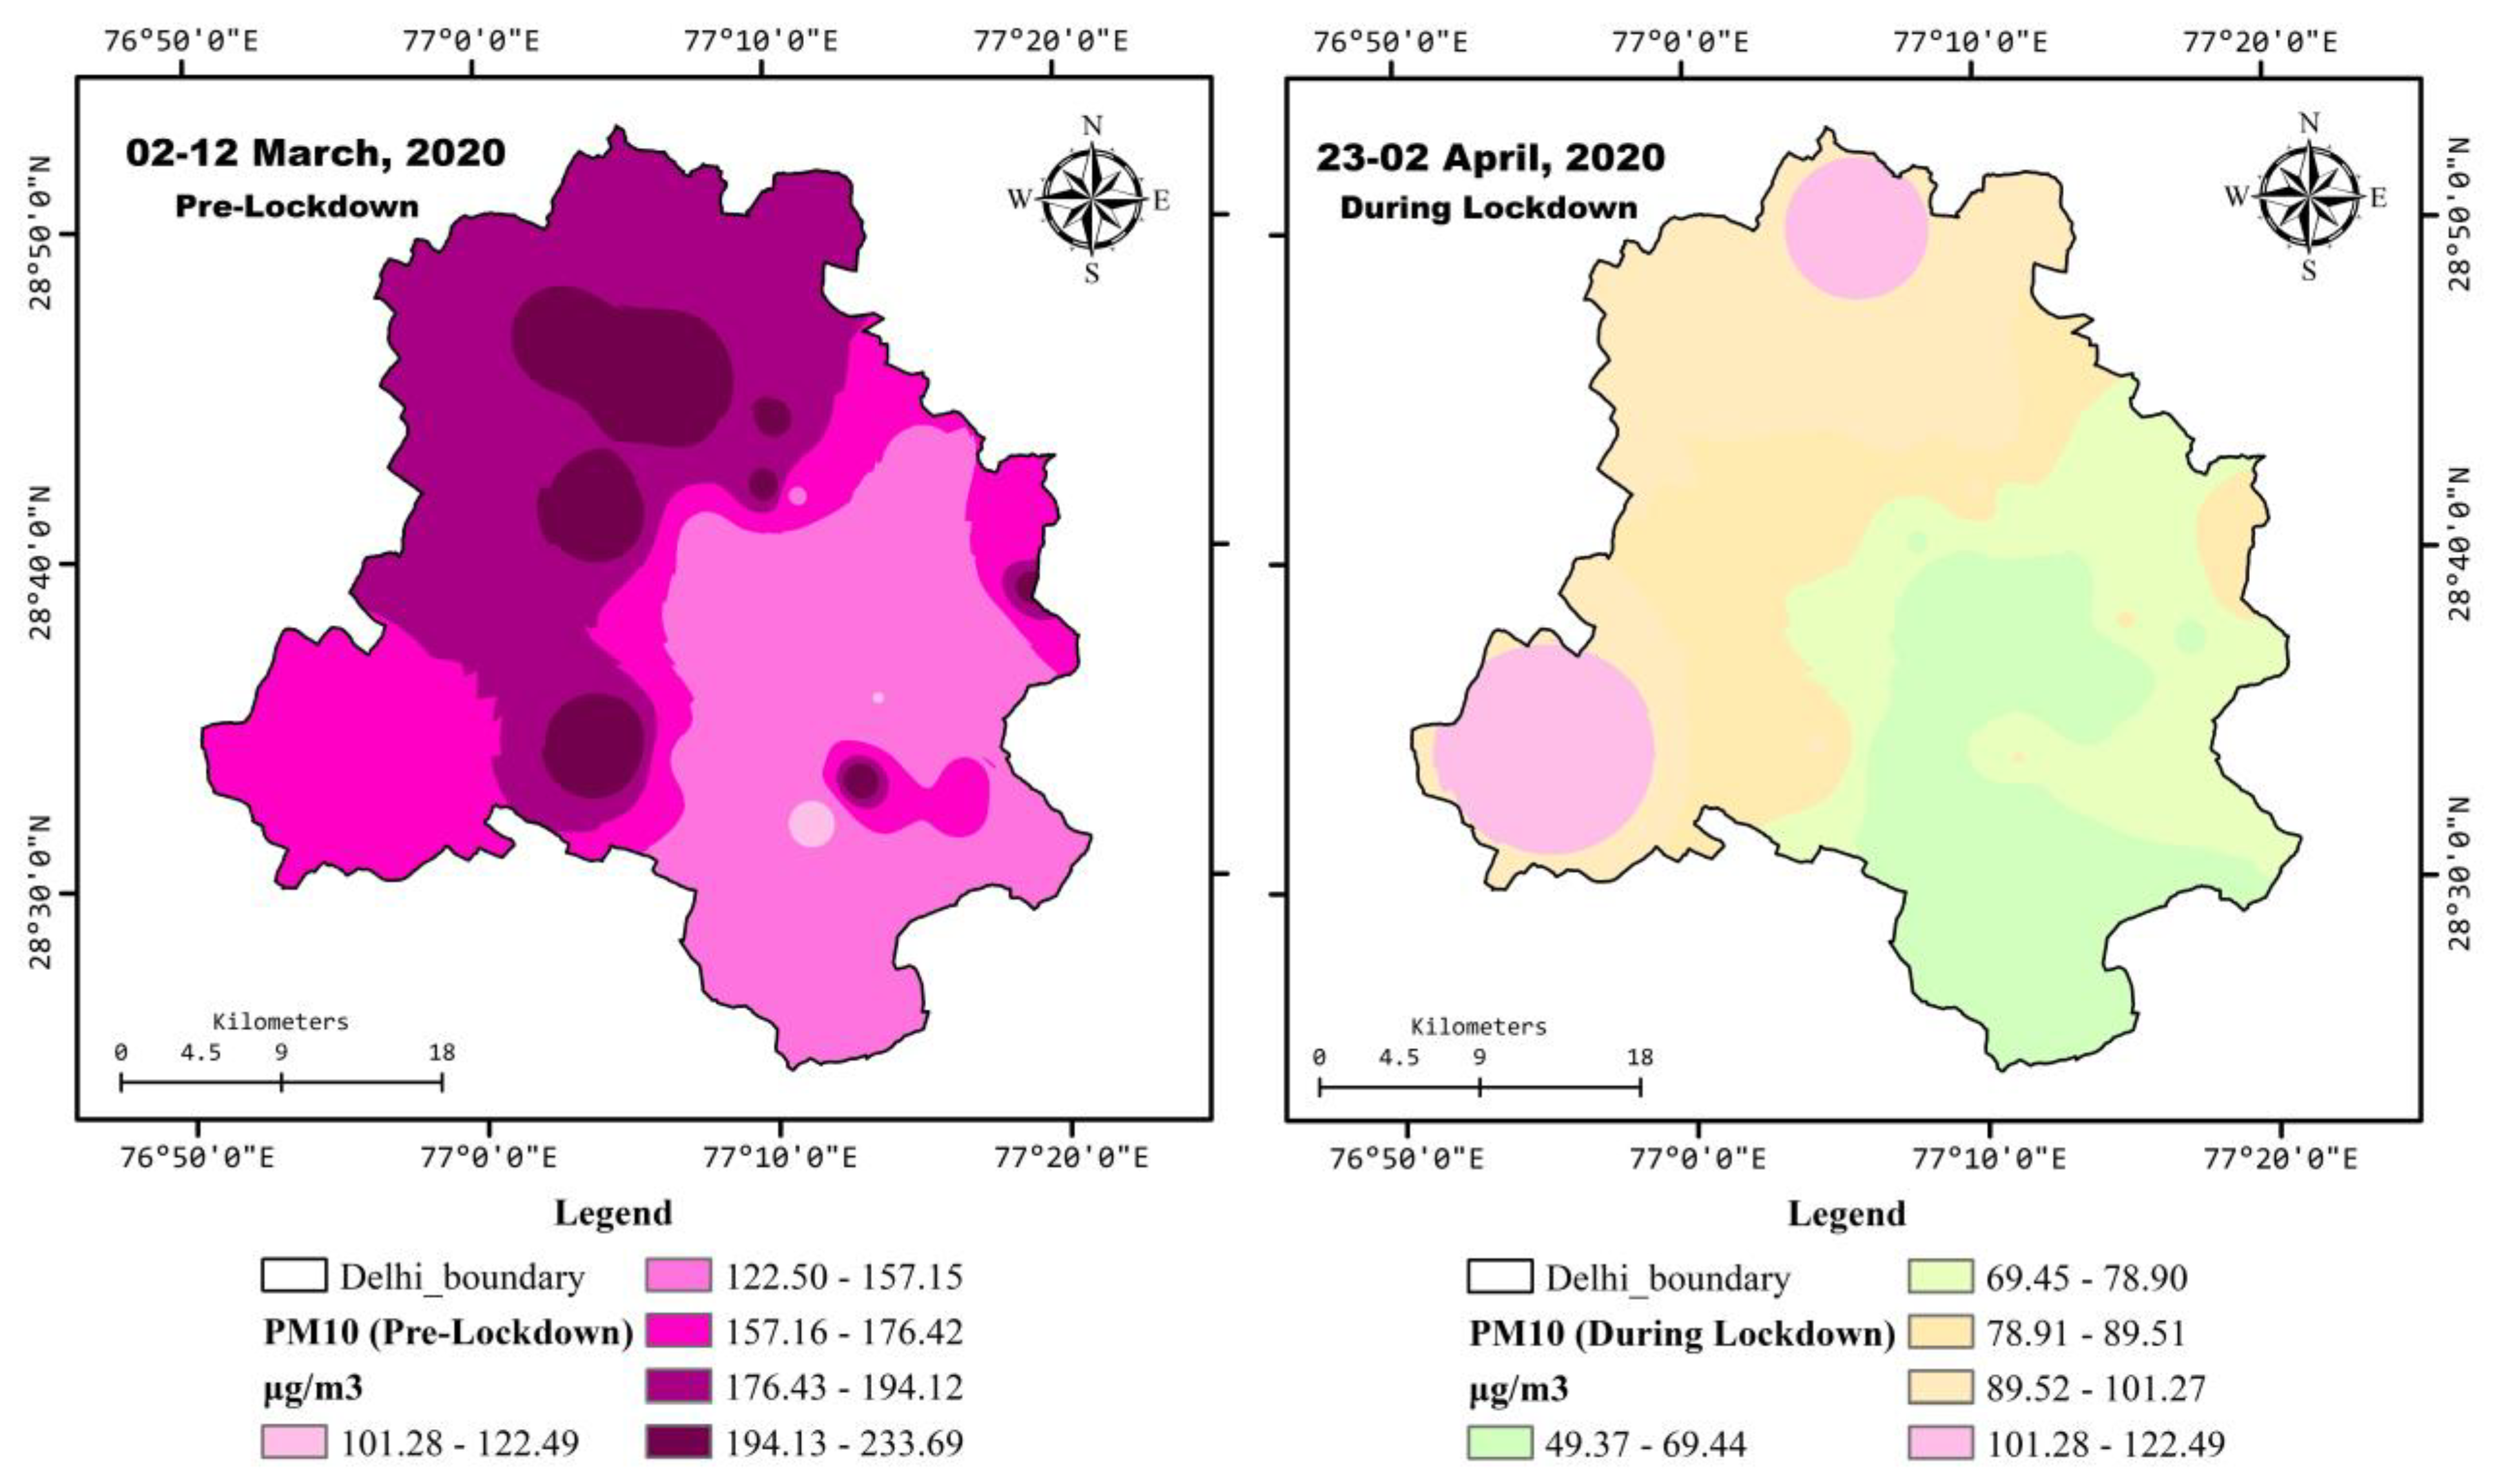
3.2. Data Interpolation and Mapping-Particulate Matter Concentration

The concentrations of air pollutants obtained at the CAQM stations (Table 1) have been measured, and their spatial distribution is mapped out. Figure 5 shows the distribution of PM2.5, and Figure 6 indicates the concentration of Particulate Matter 10 (PM10).
The levels of the concentrations are differentiated using color palettes (green is low concentration, and red is high concentration). In the distribution of PM2.5 pollutants map, it is found that before the lockdown period, the maximum level of the concentrations of PM2.5 was 95.06 µg/m3, and the minimum was 36.27 µg/m3, and during the lockdown, it reduced to the maximum value of 72.09 µg/m3 and minimum value of 28.70 µg/m3. It is also found that the North and North-West district of the Delhi region has the maximum concentration just before the lockdown period. Subsequent high concentrations were recorded in Delhi’s West and Southwest districts, and the places near the South and New Delhi districts have recorded low concentrations. During the lockdown period due to SARS-CoV-2, the concentration of PM2.5 was reduced in all districts.
The same trend was observed in the case of PM10. Before the lockdown period, the concentration of PM10 had a maximum value of 233.69 µg/m3 and a minimum value of 101.28 µg/m3. During the lockdown, it showed the same trend as PM2.5 and reduced in all Delhi districts. The concentration of PM10 level reduced to almost half of what it was before the lockdown period. Figure 5 and Figure 6 clearly show the change in the concentration level of PM2.5 and PM10, respectively.

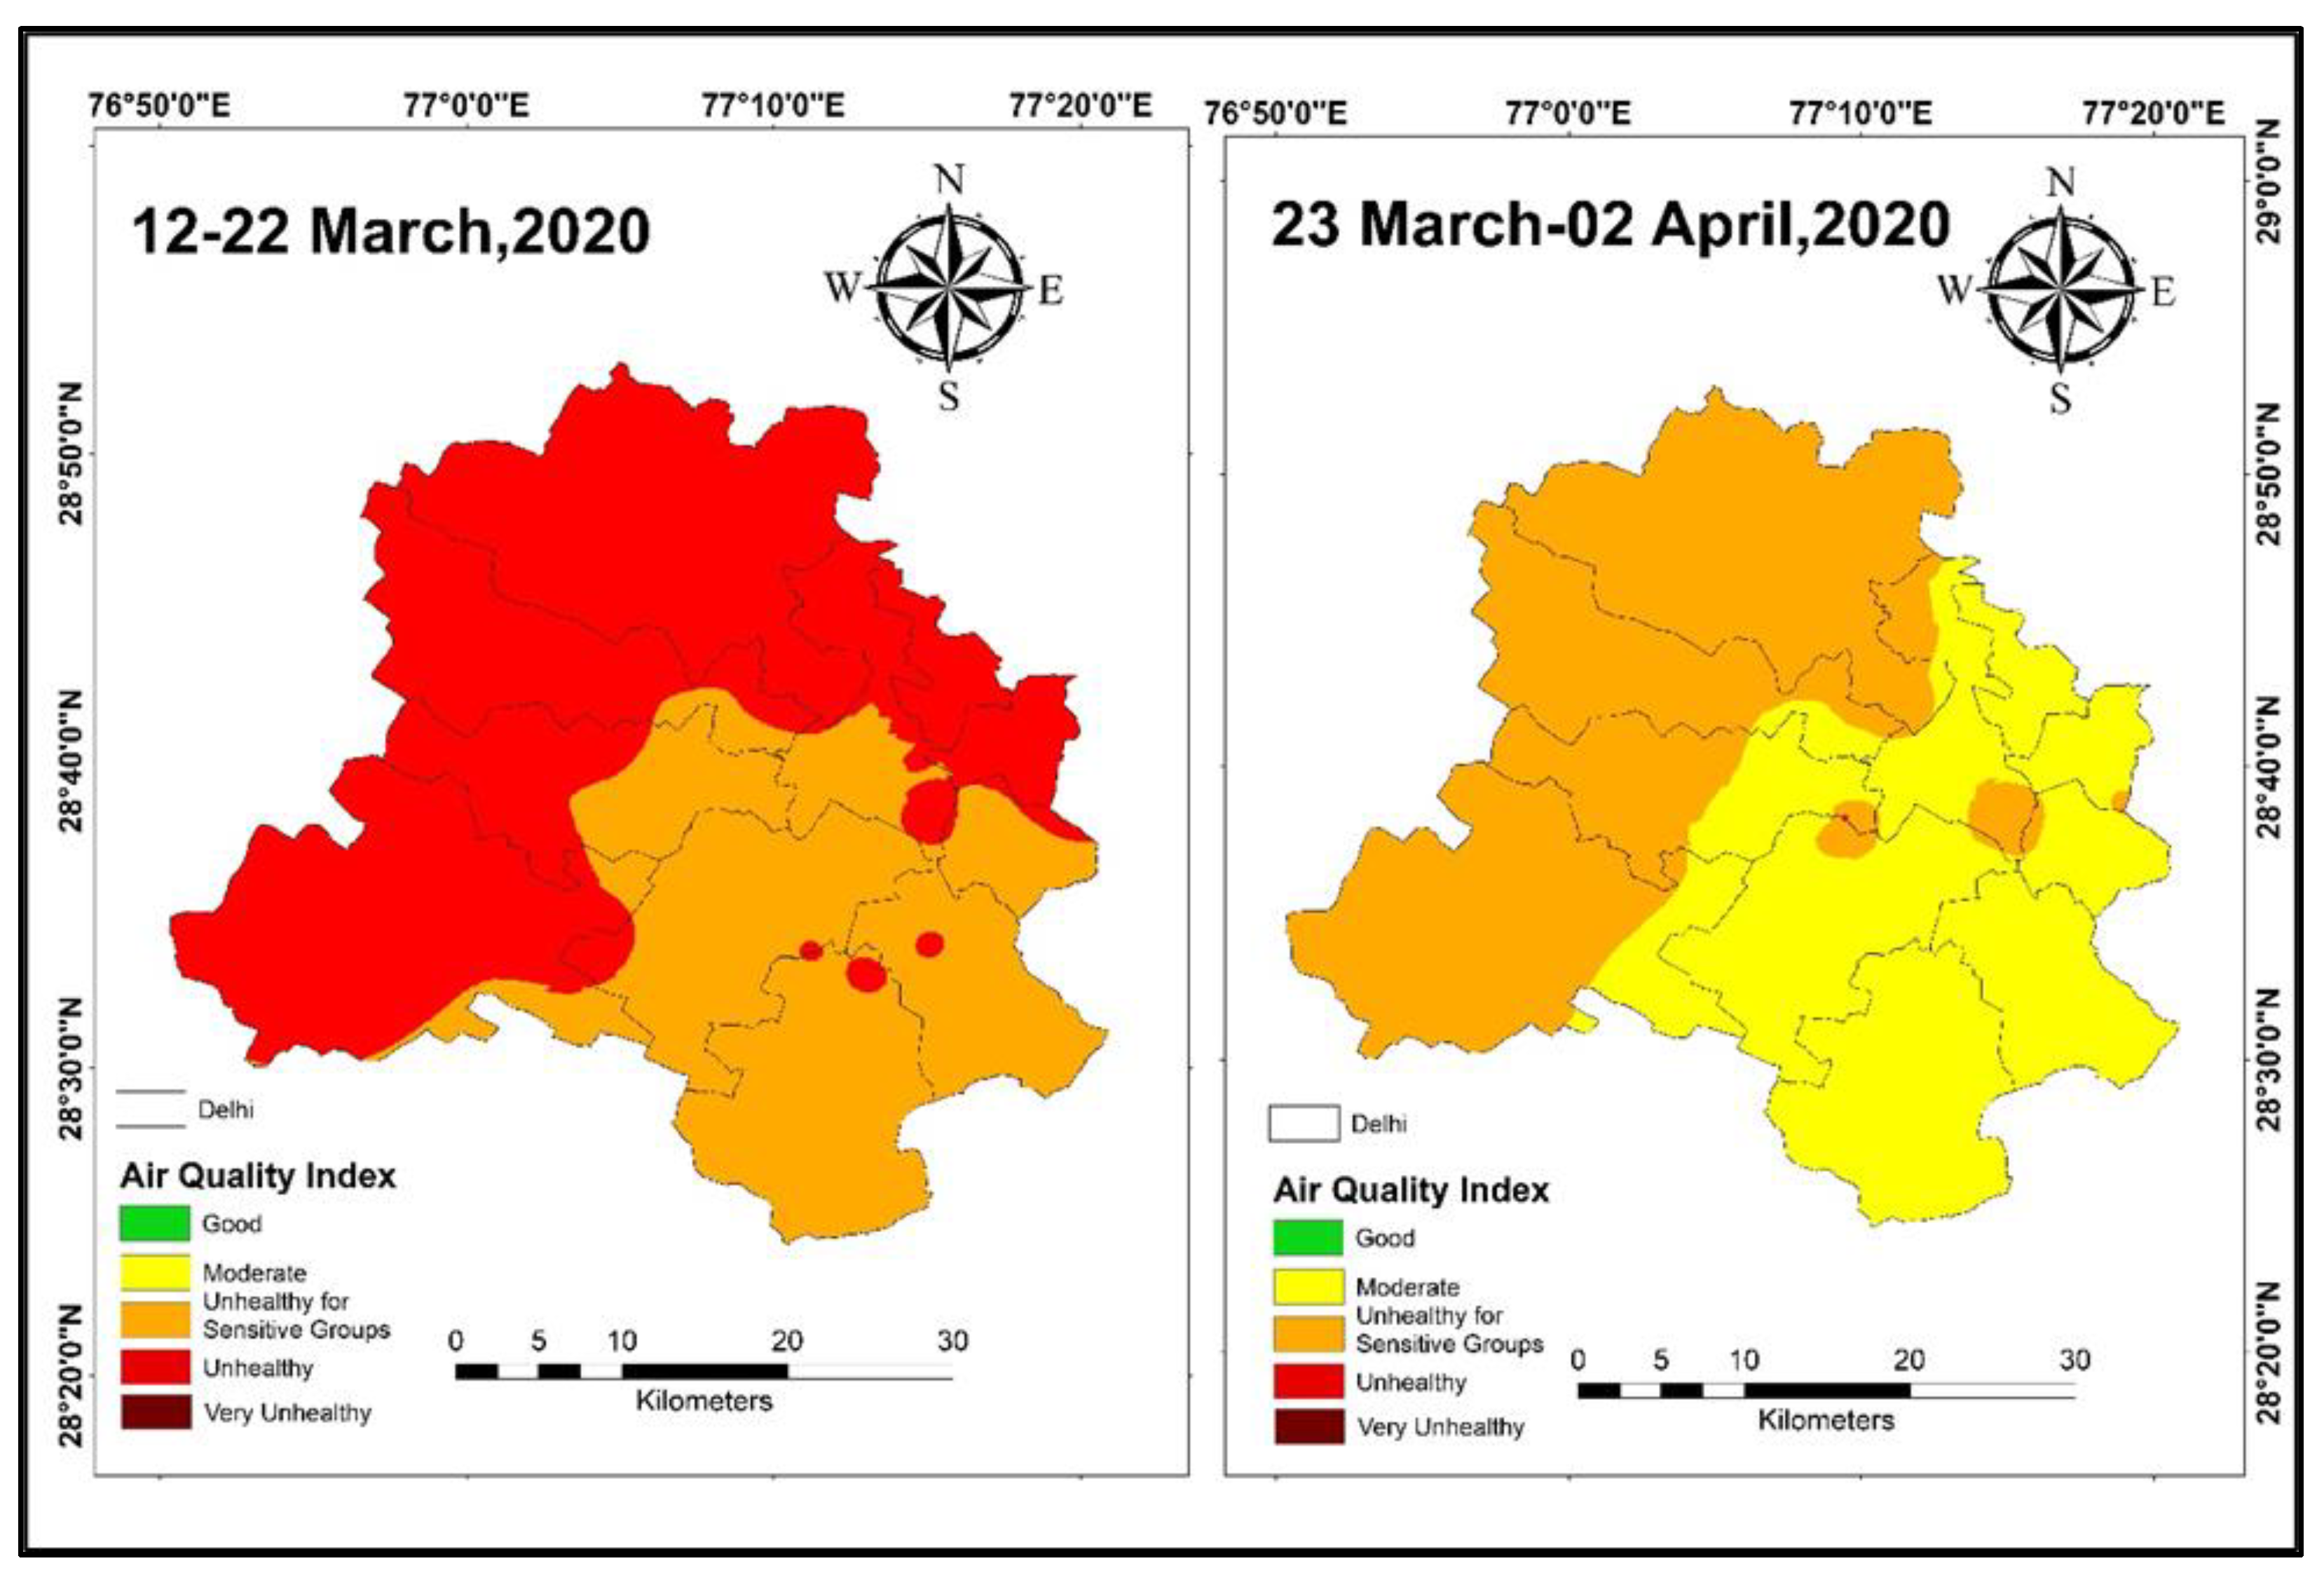
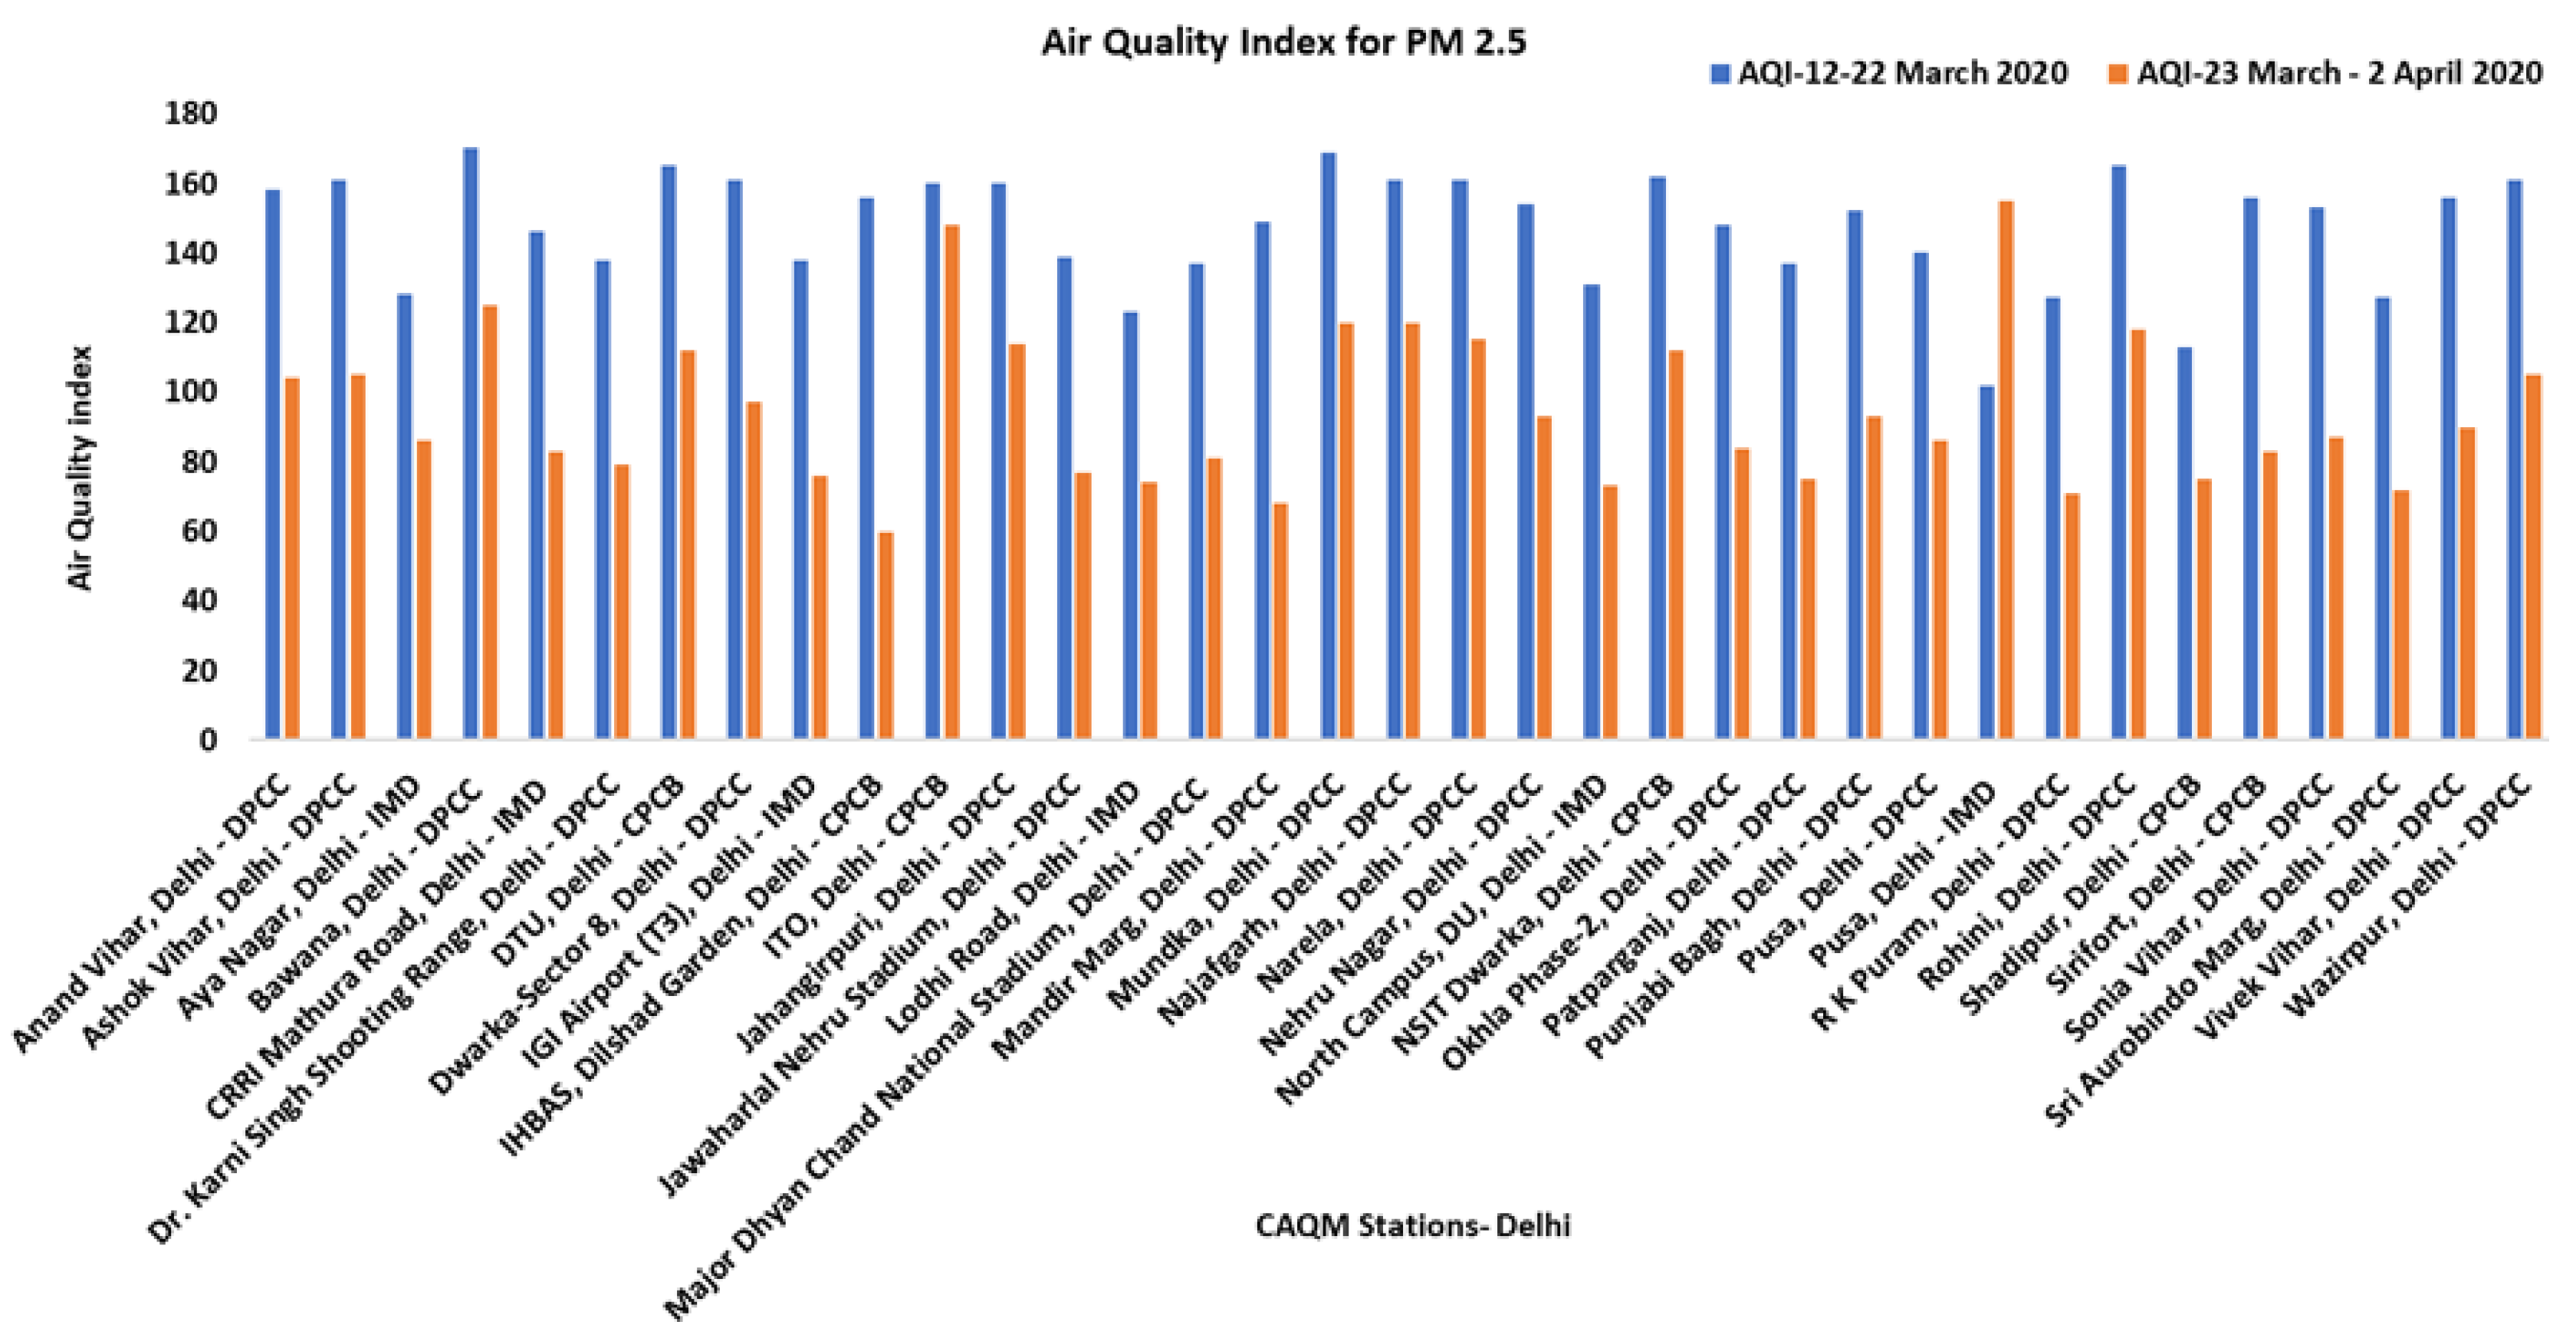
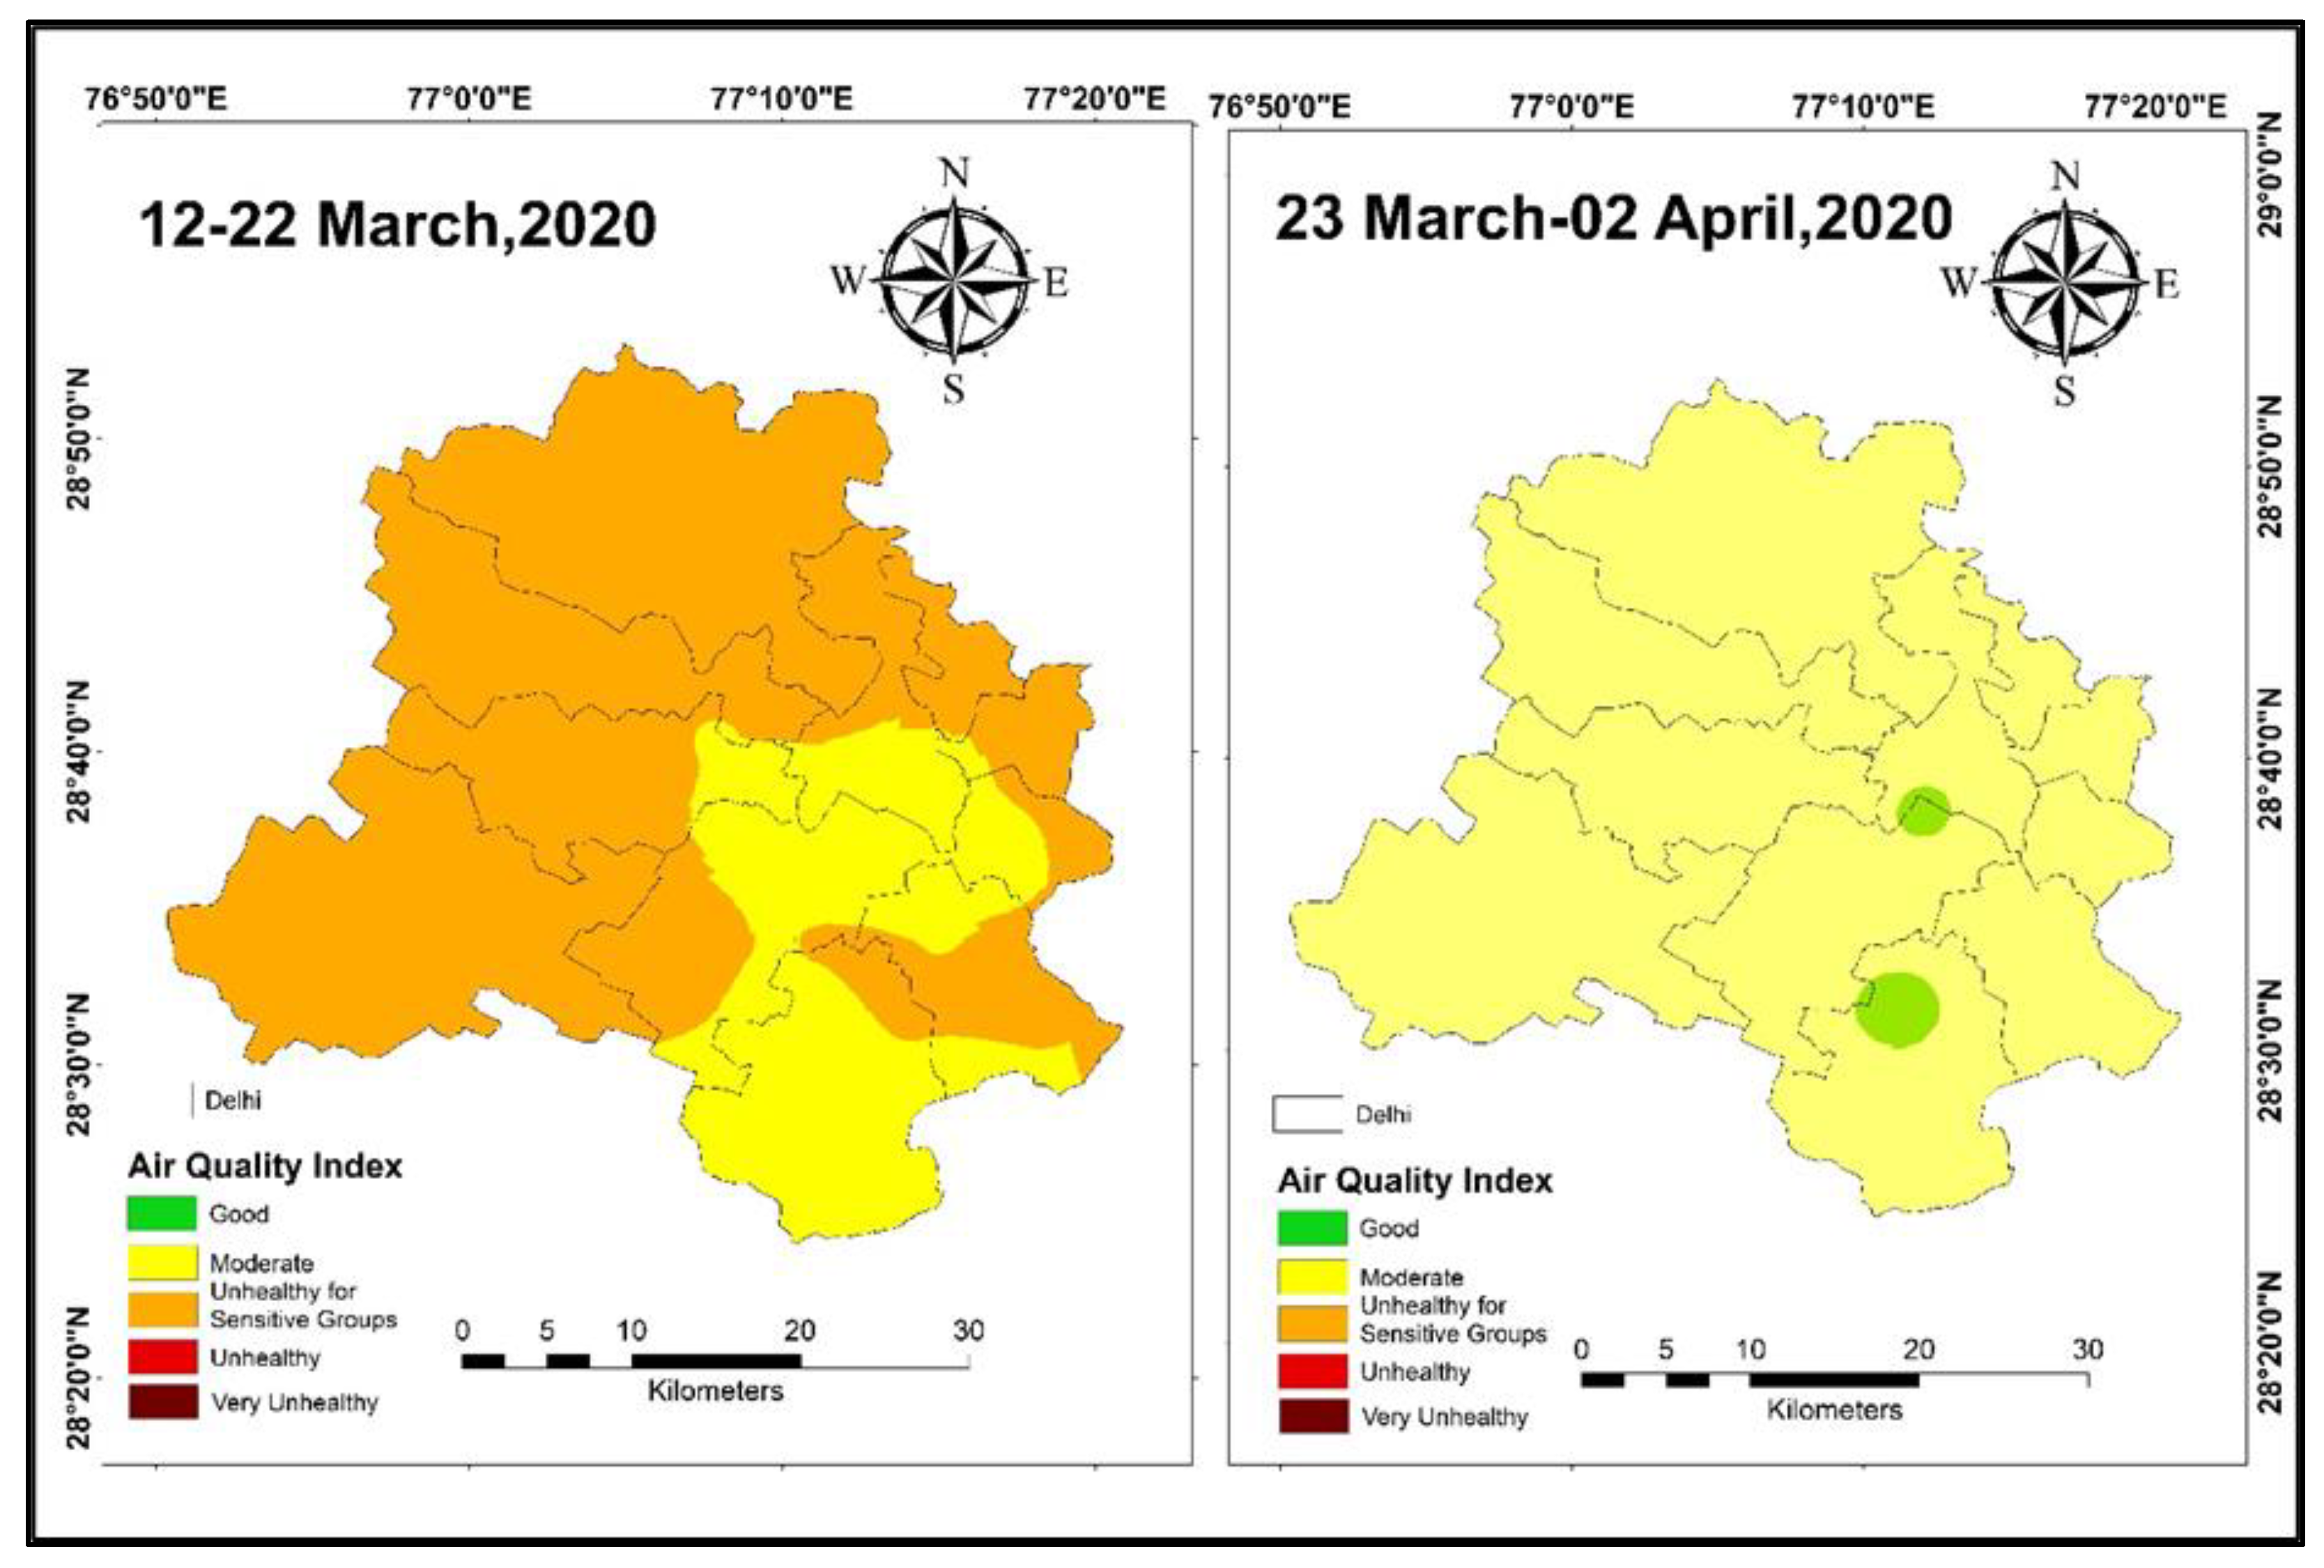
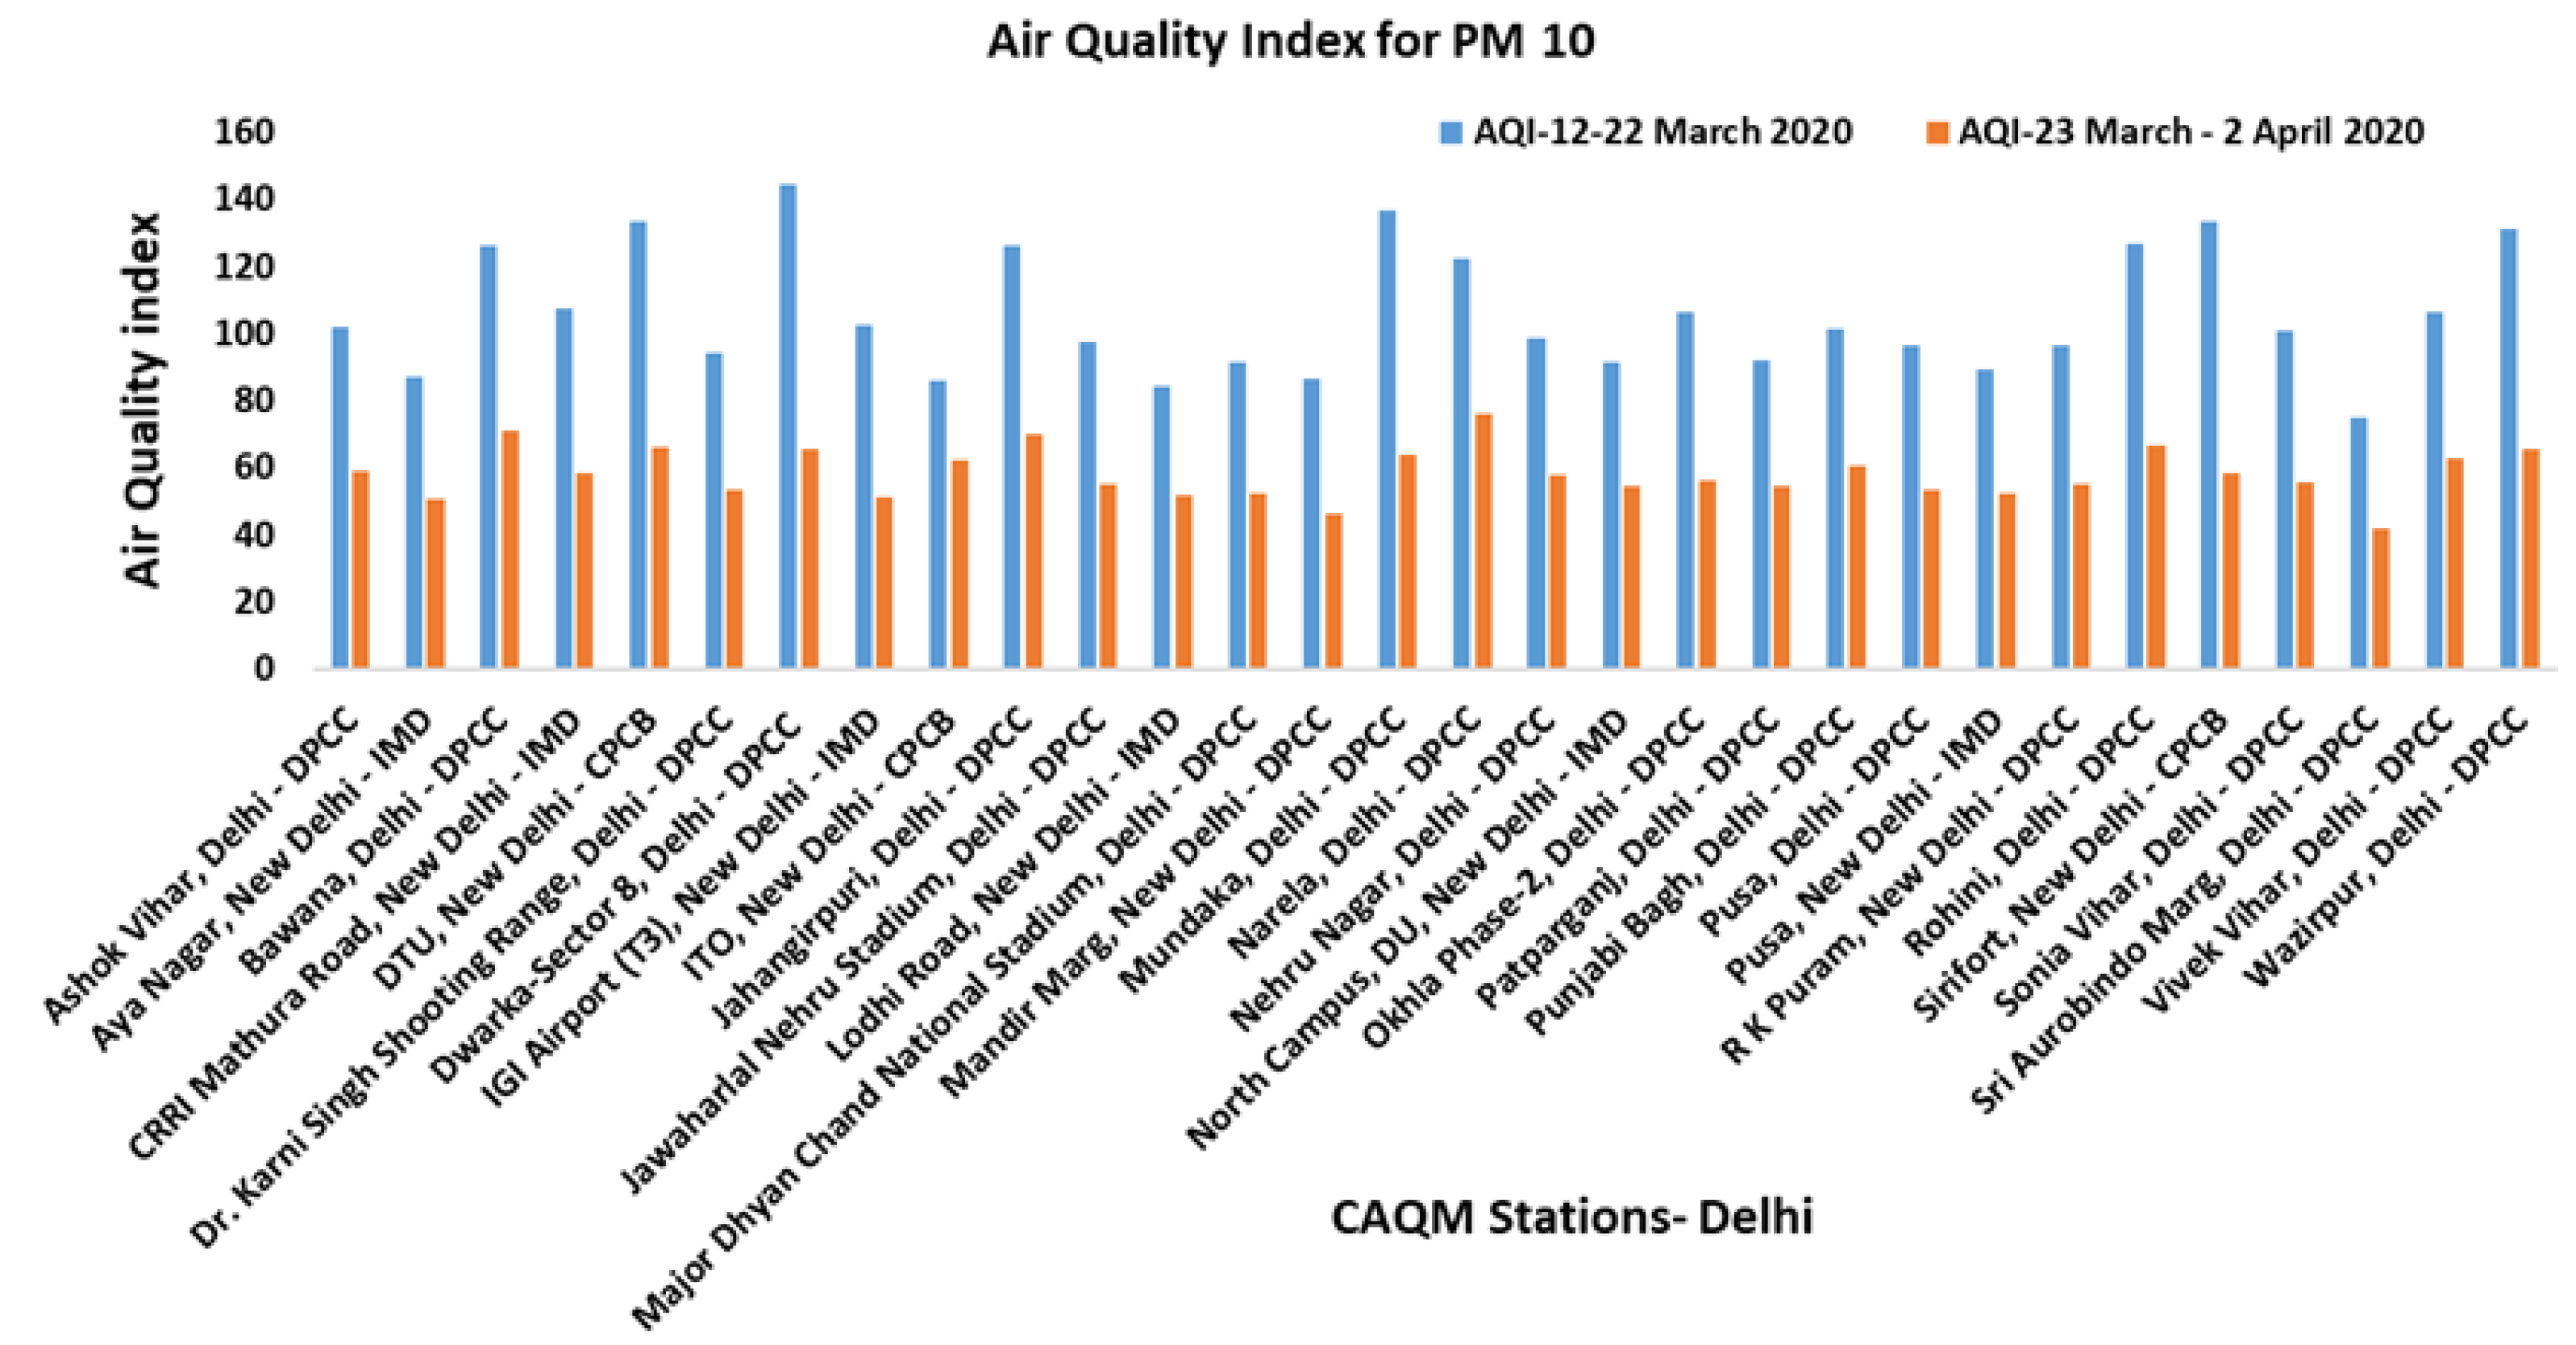
3.3. Data Interpolation and Mapping-Air Quality Index

The Air Quality Index (AQI) was estimated and displayed on the map for the measured PM 2.5 concentrations (Figure 7). In the AQI map, it is found that the AQI was classified into two groups before the lockdown period. One is an unhealthy level, and the other is unhealthy for sensitive groups of people. However, during the lockdown period, due to SARS-CoV-2 it changed, and the AQI levels fell into unhealthy for sensitive groups of people and moderate, respectively.
The district, namely Northwest, North, and Southwest, changed from unhealthy to unhealthy for sensitive groups due to the SARS-CoV-2 lockdown. The remaining districts changed from unhealthy for sensitive groups to moderate levels.
Figure 8 shows the values of AQI estimated for each CAQM station before and during the lockdown period. During the lockdown, the station IHBAS, Dilshad Garden, Delhi–CPCB, showed the maximum reduction in the AQI, i.e., from 156 to 60 (62%), and the station ITO, Delhi–CPCB, showed the minimum decrease, from 160 to 148 (8%). However, for the Pusa, Delhi–IMD, the AQI level increased from 102 to 155 (52%).
On comparing the districts-wise AQI for PM2.5 (Table 4), it was found that the maximum reduction of mean AQI was in the case of Shahdara district, i.e., from 154 to 83 (46%). The minimum reduction of mean AQI was found in the West district, i.e., from 147 to 102 (28%). Also, before the lockdown period, the mean AQI was highest in the North district (161) and lowest in the South and New Delhi districts (139). However, during the lockdown period, AQI reduced, and the same trend of maximum and minimum mean AQI levels is observed, i.e., highest for the North district (112) and lowest for the South (82), New Delhi (83), and Southeast (84) districts. Overall, the mean value of AQI for PM2.5 showed a net reduction of 37%.
The air quality index (AQI) for the recorded PM10 concentrations was calculated and depicted on the map shown in Figure 9. The AQI map shows that the AQI falls into two categories before the lockdown period: one is unhealthy for sensitive groups, and the other moderate. During the lockdown period, however, most of the AQI levels changed to moderate levels and some to, good levels.
Figure 10 represents the AQI for PM 10 before and during the lockdown; it is evident from the graph that the AQI level was reduced by almost 50% in almost all of the stations. The Dwarka-Sector 8, Delhi PCC station, showed a maximum reduction from 145 to 66 (55%), and the station ITO, New Delhi–CPCB, showed a minimum reduction, i.e., from 88 to 62 (30%).
On comparing the district-wise AQI for PM 10 (Table 5), it was found that the maximum reduction of mean AQI was in the case of the Northwest district, i.e., from 121 to 64 (47%). The minimum reduction of mean AQI was found in the West district, i.e., from 101 to 57 (43%). As well, before the lockdown period, the mean AQI was highest in the North district (122) and lowest in the South district (97). During the lockdown period, however, AQI reduced, and the same trend of maximum and minimum mean AQI levels is observed, i.e., the highest for the North district (68) and the lowest for the South district (53). Overall, the mean value of AQI for PM10 showed a net reduction of 46%.
As a result of COVID-19, normal life on Earth has been disrupted in ways that have not been seen in the last one hundred years [39,40]. Workers and the impoverished are hit worst by COVID-19′s restrictions, which have led to the global shutdown of all commercial and industrial units [41]. While a reduction in air pollution is desirable, it is not acceptable if this comes at the expense of food insecurity [42]. Multiple large, populated cities in northern India appear to have seen significant improvements due to the lockdown [43,44,45,46]. Over the past two decades, the phenomena underpinning global warming, climate change, and pollution in the Earth’s atmosphere have become central issues of scientific inquiry [47]. Air pollutants such as ozone (O3), nitrogen dioxide (NO2), carbon monoxide (CO), particulate matter (PM) in various size fractions (PM0.1 m, PM2.5 m, and PM10 m), volatile organic compounds (VOCs), and polycyclic aromatic hydrocarbons (PAHs) have had a significant impact on ecology, environment, and human health [48,49,50,51]. Toxic nitrogen oxide (NOx) emissions in both developing (India, China, etc.) and western industrialized countries were drastically reduced due to COVID-19 limitations on diesel, gasoline, and other petroleum fuel combustion [47,48,49]. Multiple studies have been done to learn how long-term lockdowns affect local and worldwide air quality [52,53,54,55,56,57,58,59,60,61,62,63]. The air quality greatly improved, according to these studies, once factories and cars stopped running. Despite the lockdowns, environmental and human health are again negatively impacted by particulate matter and pollutant gases (NOx/SOx/CO) in the post-COVID era [64,65]. Aerosols have been found to affect the radiation budget, human health, and even the strength of monsoons in a number of studies [66,67]. Increasing cardiovascular mortality is a known effect of chronic exposure to particulate matter, NOx, and ozone [68,69]. Particulate matter (PM2.5 and PM10) emissions are the greatest in India, followed by NO2, SO2 and CO, according to the national ambient air quality monitoring programme [70].
The study has demonstrated how, due to the lockdown, after years of poor air quality, certain Delhi neighborhoods were able to breathe easier. The findings also suggest that emergency lockdown tactics could be an option to deal with extreme air pollution if they are executed in a way that does not negatively impact the economy and poorer classes of society [71,72,73,74,75,76]. Based on this, there is a need to identify nature’s cyclic healing rate against anthropogenic activities. The government should focus on formulating specific policies to curb air pollution in Delhi. Some short-term policies like intermittent banning of certain anthropogenic activities (construction, mining, and burning of farm waste) based upon cyclic AQI patterns, medium-term policies such as preventing open incinerations, smog tower installations, and long-term policies such as vehicle emission norms, industrial operational timings, and public awareness campaigns.

4. Conclusions

While the whole nation was terrified by the outbreak of the SARS-CoV-2 pandemic, nature, on the other hand, was healing temporarily. This paper helped to explore the linkage between the air quality and nationwide lockdown due to SARS-CoV-2 for the city of Delhi using GIS technology. Data from almost 37 CAQM stations were observed before and during the lockdown period. The city’s Air Quality Index was reduced by nearly 37% and 46% concerning PM2.5 and PM10, respectively, due to the lockdown. Air pollution reduction could be mainly due to the decline in economic activities, related emissions, and vehicular emissions. The methodology employed in GIS technology helped to monitor the Air Quality Index changes efficiently. Furthermore, geo-visualization using GIS proved a better method for monitoring air pollution. However, the weather parameters such as wind speed, temperature, and altitude, which affect pollution dispersion, must be studied for high precision. Finally, it is possible to conclude that when human activities are abruptly ceased, the natural pace of healing exceeds the caused disruptions, resulting in a lower AQI, proving that this pandemic has given a small window for the environment to breathe and helped the districts of Delhi to recover from serious air quality situations. Also, the results show that such lockdown strategies, if implemented so that the economy and lower segments of society are not affected, could be a possible emergency measure to combat severe air pollution.

Author Contributions

Conceptualisation, S.S., H.S., V.S. (Vaibhav Shrivastava), V.S. (Vishal Sharma) and G.M.; methodology S.S., H.S., G.M. and V.S. (Vaibhav Shrivastava); software, S.S., H.S. and V.S. (Vaibhav Shrivastava); validation, S.S., H.S., V.S. (Vaibhav Shrivastava), V.S. (Vishal Sharma) and G.M.; formal analysis, S.S., H.S., V.S. (Vaibhav Shrivastava), V.S. (Vishal Sharma) and G.M.; investigation, S.S., H.S., V.S. (Vaibhav Shrivastava), V.S. (Vishal Sharma), P.K., S.K.S., M.F., S.K. and G.M.; resources, S.S., H.S., V.S. (Vaibhav Shrivastava), V.S. (Vishal Sharma), P.K., S.K.S., G.M., M.F. and S.K.; data curation, S.S., H.S., V.S. (Vaibhav Shrivastava), V.S. (Vishal Sharma), P.K., S.K.S., G.M., M.F. and S.K.; writing—original draft preparation, S.S., H.S., V.S. (Vaibhav Shrivastava) and V.S. (Vishal Sharma); writing—review and editing, S.S., H.S., V.S. (Vaibhav Shrivastava), V.S. (Vishal Sharma), P.K., S.K.S., G.M., M.F. and S.K.; visu-alization, S.S., H.S., V.S. (Vaibhav Shrivastava), V.S. (Vishal Sharma), P.K., S.K.S., G.M., M.F. and S.K.; supervision, S.S., H.S., V.S. (Vaibhav Shrivastava), V.S. (Vishal Sharma), S.K.S. and S.K.; project administration, P.K.; funding acquisition, P.K. All authors have read and agreed to the published version of the manuscript.

Funding

This research received no external funding.

Institutional Review Board Statement

Not applicable.

Informed Consent Statement

Not applicable.

Data Availability Statement

Data is available on request from the corresponding author.

Acknowledgments

The authors thank R-Based Services Private Limited, Delhi, India, for providing the required setup for this research. We thank all the five anonymous reviewers for their constructive suggestions throughout all the rounds of peer-review that have tremendously improved the quality and content of this manuscript.

Conflicts of Interest

The authors declare no conflict of interest.

References

  1. Sharma, M.; Dixit, O. Comprehensive study on air pollution and Green House Gases (GHGs) in Delhi. Biochem. J. 2015, 465. Available online: http://www.indiaenvironmentportal.org.in/content/439149/comprehensive-study-on-green-house-gases-ghgs-in-delhi/ (accessed on 31 December 2021).
  2. CPCB. National Air Quality Index. Central Pollution Control Board (CPCB). 2014. Available online: https://app.cpcbccr.com/AQI_India/ (accessed on 1 February 2022).
  3. Talukdar, S.; Tripathi, S.N.; Lalchandani, V.; Rupakheti, M.; Bhowmik, H.S.; Shukla, A.K.; Murari, V.; Sahu, R.; Jain, V.; Tripathi, N.; et al. Air pollution in New Delhi during late winter: An overview of a group of campaign studies focusing on composition and sources. Atmosphere 2021, 12, 1432. [Google Scholar] [CrossRef]
  4. Anselin, L.; Le Gallo, J. Interpolation of air quality measures in hedonic house price models: Spatial aspects. Spat. Econ. Anal. 2006, 1, 31–52. [Google Scholar] [CrossRef]
  5. Janssen, S.; Dumont, G.; Fierens, F.; Mensink, C. Spatial interpolation of air pollution measurements using CORINE land cover data. Atmos. Environ. 2008, 42, 4884–4903. [Google Scholar] [CrossRef]
  6. Jha, D.K.; Sabesan, M.; Das, A.; Vinithkumar, N.V.; Kirubagaran, R. Evaluation of interpolation technique for air quality parameters in Port Blair, India. Univers. J. Environ. Res. Technol. 2011, 1, 301–310. [Google Scholar]
  7. Narashid, R.H.; Mohd, W.M.N.W. Air quality monitoring using remote sensing and GIS technologies. In Proceedings of the 2010 International Conference on Science and Social Research, Kuala Lumpur, Malaysia, 5–7 December 2010; pp. 1186–1191. [Google Scholar] [CrossRef]
  8. Dadhich, A.P.; Goyal, R.; Dadhich, P.N. Assessment of spatio-temporal variations in air quality of Jaipur city, Rajasthan, India. Egypt. J. Remote Sens. Space Sci. 2018, 21, 173–181. [Google Scholar] [CrossRef]
  9. Meraj, G.; Farooq, M.; Singh, S.K.; Romshoo, S.A.; Nathawat, M.S.; Kanga, S. Coronavirus pandemic versus temperature in the context of Indian subcontinent: A preliminary statistical analysis. Environ. Dev. Sustain. 2021, 23, 6524–6534. [Google Scholar] [CrossRef]
  10. Kanga, S.; Sudhanshu Meraj, G.; Farooq, M.; Nathawat, M.S.; Singh, S.K. Reporting the management of COVID-19 threat in India using remote sensing and GIS based approach. Geocarto Int. 2020, 37, 1337–1344. [Google Scholar] [CrossRef]
  11. Kanga, S.; Meraj, G.; Farooq, M.; Nathawat, M.S.; Singh, S.K. Risk assessment to curb COVID-19 contagion: A preliminary study using remote sensing and GIS. Res. Sq. preprint. [CrossRef]
  12. Ranga, V.; Pani, P.; Kanga, S.; Meraj, G.; Farooq, M.; Nathawat, M.S.; Singh, S.K. National health-GIS Portal-A conceptual framework for effective epidemic management and control in India. Preprints 2020, 2020060325. [Google Scholar] [CrossRef]
  13. Wong, D.W.; Yuan, L.; Perlin, S.A. Comparison of spatial interpolation methods for the estimation of air quality data. J. Expo. Anal. Environ. Epidemiol. 2004, 14, 404–415. [Google Scholar] [CrossRef]
  14. Bhaskar, A.; Chandra, J.; Braun, D.; Cellini, J.; Dominici, F. Air pollution, SARS-CoV-2 transmission, and COVID-19 outcomes: A State-of-the-science review of a rapidly evolving research area. medRxiv 2020. [Google Scholar] [CrossRef]
  15. Banerji, S.; Mitra, D. Assessment of air quality in Kolkata before and after COVID-19 lockdown. Geocarto Int. 2022, 37, 6351–6374. [Google Scholar] [CrossRef]
  16. Kaloni, D.; Lee, Y.H.; Dev, S. Air quality in the New Delhi metropolis under COVID-19 lockdown. Syst. Soft Comput. 2022, 4, 200035. [Google Scholar] [CrossRef]
  17. Mahato, S.; Pal, S.; Ghosh, K.G. Effect of lockdown amid COVID-19 pandemic on air quality of the megacity Delhi, India. Sci. Total Environ. 2020, 730, 139086. [Google Scholar] [CrossRef]
  18. Mishra, A.K.; Rajput, P.; Singh, A.; Singh, C.K.; Mall, R.K. Effect of lockdown amid COVID-19 on ambient air quality in 16 Indian cities. Front. Sustain. Cities 2021, 3, 101. [Google Scholar] [CrossRef]
  19. Association between Air Pollution and COVID-19 Disease Severity via Bayesian Multinomial Logistic Regression with Partially Missing Outcomes. Available online: https://www.researchgate.net/publication/362390654_Association_between_air_pollution_and_COVID-19_disease_severity_via_Bayesian_multinomial_logistic_regression_with_partially_missing_outcomes (accessed on 14 November 2022).
  20. Census Population Data. Delhi Population Sex Ratio in Delhi Literacy rate Delhi NCR. 2015. Available online: http://www.census2011.co.in/census/state/delhi.html (accessed on 31 January 2020).
  21. EPA. Guidelines for Reporting of Daily Air Quality—Air Quality Index (AQI); EPA: Washington, DC, USA, 2006. [Google Scholar]
  22. Burrough, P.A. Principles of geographical information systems for land resources assessment. Geocarto Int. 1998, 1, 54. [Google Scholar] [CrossRef]
  23. Stoter, J.; de Kluijver, H.; Kurakula, V. 3D noise mapping in urban areas. Int. J. Geogr. Inf. Sci. 2008, 22, 907–924. [Google Scholar] [CrossRef]
  24. Davis, B.M. Uses and abuses of cross-validation in geostatistics. Mathematical Geology, Math. Geol. 1987, 19, 241–248. [Google Scholar] [CrossRef]
  25. Da Silva, N.A.; Webber, B.G.; Matthews, A.J.; Feist, M.M.; Stein, T.H.; Holloway, C.E.; Abdullah, M.F. Validation of GPM IMERG extreme precipitation in the Maritime Continent by station and radar data. Earth Space Sci. 2021, 8, e2021EA001738. [Google Scholar] [CrossRef]
  26. Dung, P.T.; Chuc, M.D.; Thanh, N.T.N.; Hung, B.Q.; Chung, D.M. Comparison of resampling methods on different remote sensing images for Vietnam’s Urban Classification. J. Inf. Technol. Commun. 2018. [CrossRef]
  27. Meraj, G.; Singh, S.K.; Kanga, S.; Islam, M. Modeling on comparison of ecosystem services concepts, tools, methods and their ecological-economic implications: A review. Model. Earth Syst. Environ. 2021, 8, 15–34. [Google Scholar] [CrossRef]
  28. Bera, A.; Taloor, A.K.; Meraj, G.; Kanga, S.; Singh, S.K.; Đurin, B.; Anand, S. Climate vulnerability and economic determinants: Linkages and risk reduction in Sagar Island, India; A geospatial approach. Quat. Sci. Adv. 2021, 4, 100038. [Google Scholar] [CrossRef]
  29. Fayaz, M.; Meraj, G.; Khader, S.A.; Farooq, M.; Kanga, S.; Singh, S.K.; Sahu, N. Management of landslides in a rural–urban transition zone using machine learning algorithms—A case study of a National Highway (NH-44), India, in the Rugged Himalayan Terrains. Land 2022, 11, 884. [Google Scholar] [CrossRef]
  30. Sinha, K.K.; Gupta, M.K.; Banerjee, M.K.; Meraj, G.; Singh, S.K.; Kanga, S.; Sahu, N. Neural network-based modeling of water quality in Jodhpur, India. Hydrology 2022, 9, 92. [Google Scholar] [CrossRef]
  31. Meraj, G.; Kanga, S.; Ambadkar, A.; Kumar, P.; Singh, S.K.; Farooq, M.; Sahu, N. Assessing the yield of wheat using satellite remote sensing-based machine learning algorithms and simulation modeling. Remote Sens. 2022, 14, 3005. [Google Scholar] [CrossRef]
  32. Burns, J.; Boogaard, H.; Polus, S.; Pfadenhauer, L.M.; Rohwer, A.C.; Van Erp, A.M.; Rehfuess, E.A. Interventions to reduce ambient air pollution and their effects on health: An abridged Cochrane systematic review. Environ. Int. 2020, 135, 105400. [Google Scholar] [CrossRef]
  33. Huang, J.; Pan, X.; Guo, X.; Li, G. Health impact of China’s Air Pollution Prevention and Control Action Plan: An analysis of national air quality monitoring and mortality data. Lancet Planet. Health 2018, 2, e313–e323. [Google Scholar] [CrossRef] [PubMed] [Green Version]
  34. World Health Organization. WHO Global Air Quality Guidelines: Particulate Matter (PM2. 5 and PM10), Ozone, Nitrogen Dioxide, Sulfur Dioxide And Carbon Monoxide; World Health Organization: Geneva, Switzerland, 2021. [Google Scholar]
  35. Tan, X.; Han, L.; Zhang, X.; Zhou, W.; Li, W.; Qian, Y. A review of current air quality indexes and improvements under the multi-contaminant air pollution exposure. J. Environ. Manag. 2021, 279, 111681. [Google Scholar] [CrossRef]
  36. Zhong, S.; Yu, Z.; Zhu, W. Study of the effects of air pollutants on human health based on Baidu indices of disease symptoms and air quality monitoring data in Beijing, China. Int. J. Environ. Res. Public Health 2019, 16, 1014. [Google Scholar] [CrossRef] [Green Version]
  37. Mohd Shafie, S.H.; Mahmud, M.; Mohamad, S.; Rameli, N.L.F.; Abdullah, R.; Mohamed, A.F. Influence of urban air pollution on the population in the Klang Valley, Malaysia: A spatial approach. Ecol. Process. 2022, 11, 1–16. [Google Scholar] [CrossRef]
  38. Munyati, C.; Sinthumule, N.I. Comparative suitability of ordinary kriging and inverse distance weighted interpolation for indicating intactness gradients on threatened savannah woodland and forest stands. Environ. Sustain. Indic. 2021, 12, 100151. [Google Scholar] [CrossRef]
  39. Ma, J.; Ding, Y.; Gan, V.J.; Lin, C.; Wan, Z. Spatiotemporal prediction of PM2. 5 concentrations at different time granularities using IDW-BLSTM. IEEE Access 2019, 7, 107897–107907. [Google Scholar] [CrossRef]
  40. Carswell, G.; De Neve, G.; Subramanyam, N. Getting home during lockdown: Migration disruption, labour control and linked lives in India at the time of COVID-19. J. Ethn. Migr. Stud. 2022, 48, 1–19. [Google Scholar] [CrossRef]
  41. Viswanathan, M.; Faruque Aly, H.; Duncan, R.; Mandhan, N. Unequal but essential: How subsistence consumer–entrepreneurs negotiate unprecedented shock with extraordinary resilience during COVID-19. J. Consum. Aff. 2021, 55, 151–178. [Google Scholar] [CrossRef]
  42. Wang, C.; Wang, D.; Abbas, J.; Duan, K.; Mubeen, R. Global financial crisis, smart lockdown strategies, and the COVID-19 spillover impacts: A global perspective implications from Southeast Asia. Front. Psychiatry 2021, 12, 643783. [Google Scholar] [CrossRef]
  43. Debnath, J.; Sahariah, D.; Lahon, D.; Nath, N.; Chand, K.; Meraj, G.; Farooq, M.; Kumar, P.; Kanga, S.; Singh, S.K. Geospatial modeling to assess the past and future land use-land cover changes in the Brahmaputra Valley, NE India, for sustainable land resource management. Environ. Sci. Pollut. Res. 2022, 1–24. [Google Scholar] [CrossRef]
  44. Wetchayont, P. Investigation on the impacts of COVID-19 lockdown and influencing factors on air quality in greater Bangkok, Thailand. Adv. Meteorol. 2021, 2021, 6697707. [Google Scholar] [CrossRef]
  45. Aboagye, E.M.; Mensah, F.; Effah, K.O.; Afrane, S.; Ampah, J.D.; Brenyah, S.A. “Temporal not Permanent:” The impact of Covid-19 cities lockdown on improving Air Quality—A critical review of Africa. J. Environ. Sustain. 2021, 8, 5. [Google Scholar]
  46. Ghecham, M.A. The impact of COVID-19 on economic growth of countries: What role has income inequality in it? Economies 2022, 10, 158. [Google Scholar] [CrossRef]
  47. Agarwal, S.; Punn, N.S.; Sonbhadra, S.K.; Tanveer, M.; Nagabhushan, P.; Pandian, K.K.; Saxena, P. Unleashing the power of disruptive and emerging technologies amid COVID-19: A detailed review. arXiv 2020, arXiv:2005.11507. [Google Scholar]
  48. Chakrabarty, D. The Anthropocene and the convergence of histories. In The Anthropocene and the Global Environmental Crisis; Routledge: London, UK, 2015; pp. 44–56. [Google Scholar]
  49. Amil, N.; Latif, M.T.; Khan, M.F.; Mohamad, M. Seasonal variability of PM 2.5 composition and sources in the Klang Valley urban-industrial environment. Atmos. Chem. Phys. 2016, 16, 5357–5381. [Google Scholar] [CrossRef] [Green Version]
  50. Martínez-Bravo, M.; Martínez-del-Río, J. Urban pollution and emission reduction. Sustain. Cities Communities 2020, 905–915. [Google Scholar] [CrossRef]
  51. Meo, S.A.; Almutairi, F.J.; Abukhalaf, A.A.; Alessa, O.M.; Al-Khlaiwi, T.; Meo, A.S. Sandstorm and its effect on particulate matter PM 2.5, carbon monoxide, nitrogen dioxide, ozone pollutants and SARS-CoV-2 cases and deaths. Sci. Total Environ. 2021, 795, 148764. [Google Scholar] [CrossRef] [PubMed]
  52. Wang, Z.; Lv, J.; Tan, Y.; Guo, M.; Gu, Y.; Xu, S.; Zhou, Y. Temporospatial variations and Spearman correlation analysis of ozone concentrations to nitrogen dioxide, sulfur dioxide, particulate matters and carbon monoxide in ambient air, China. Atmos. Pollut. Res. 2019, 10, 1203–1210. [Google Scholar] [CrossRef]
  53. Ramasamy, D. Enchanted improvements in air quality across India-A study from COVID-19 lockdown perspective. Adalya J. 2020, 9. [Google Scholar] [CrossRef]
  54. Kabiraj, S.; Gavli, N.V. Impact of SARS-CoV-2 pandemic lockdown on air quality using satellite imagery with ground station monitoring data in most polluted city Kolkata, India. Aerosol Sci. Eng. 2020, 4, 320–330. [Google Scholar] [CrossRef]
  55. Selvan Christyraj, J.R.S.; Selvan Christyraj, J.D.; Adhimoorthy, P.; Rajagopalan, K.; Nimita Jebaranjitham, J. Impact of biomedical waste management system on infection control in the midst of COVID-19 pandemic. In The Impact of the COVID-19 Pandemic on Green Societies; Springer: Cham, Switzerland, 2021; pp. 235–262. [Google Scholar]
  56. Donzelli, G.; Cioni, L.; Cancellieri, M.; Llopis-Morales, A.; Morales-Suárez-Varela, M. Air quality during COVID-19 lockdown. Encyclopedia 2021, 1, 519–526. [Google Scholar] [CrossRef]
  57. Soni, M.; Verma, S.; Jethava, H.; Payra, S.; Lamsal, L.; Gupta, P.; Singh, J. Impact of COVID-19 on the air quality over china and india using long-term (2009–2020) multi-satellite data. Aerosol Air Qual. Res 2021, 21, 200295. [Google Scholar] [CrossRef]
  58. Roy, S.; Saha, M.; Dhar, B.; Pandit, S.; Nasrin, R. Geospatial analysis of COVID-19 lockdown effects on air quality in the South and Southeast Asian region. Sci. Total Environ. 2021, 756, 144009. [Google Scholar] [CrossRef]
  59. Chowdhuri, I.; Pal, S.C.; Arabameri, A.; Ngo, P.T.T.; Roy, P.; Saha, A.; Chakrabortty, R. Have any effect of COVID-19 lockdown on environmental sustainability? A study from most polluted metropolitan area of India. Stoch. Environ. Res. Risk Assess. 2022, 36, 283–295. [Google Scholar] [CrossRef]
  60. Zhang, Y.; Zhao, B.; Jiang, Y.; Xing, J.; Sahu, S.K.; Zheng, H.; Hao, J. Non-negligible contributions to human health from increased household air pollution exposure during the COVID-19 lockdown in China. Environ. Int. 2022, 158, 106918. [Google Scholar] [CrossRef] [PubMed]
  61. Rahman, M.S.; Azad, M.A.K.; Hasanuzzaman, M.; Salam, R.; Islam, A.R.M.T.; Rahman, M.M.; Hoque, M.M.M. How air quality and COVID-19 transmission change under different lockdown scenarios? A case from Dhaka city, Bangladesh. Sci. Total Environ. 2021, 762, 143161. [Google Scholar] [CrossRef] [PubMed]
  62. Ranjan, A.K.; Patra, A.K.; Gorai, A.K. Effect of lockdown due to SARS COVID-19 on aerosol optical depth (AOD) over urban and mining regions in India. Sci. Total Environ. 2020, 745, 141024. [Google Scholar] [CrossRef] [PubMed]
  63. Aix, M.L.; Petit, P.; Bicout, D.J. Air pollution and health impacts during the COVID-19 lockdowns in Grenoble, France. Environ. Pollut. 2022, 303, 119134. [Google Scholar] [CrossRef] [PubMed]
  64. Bontempi, E.; Carnevale, C.; Cornelio, A.; Volta, M.; Zanoletti, A. Analysis of the lockdown effects due to the COVID-19 on air pollution in Brescia (Lombardy). Environ. Res. 2022, 212, 113193. [Google Scholar] [CrossRef]
  65. Guo, Q.; Wang, Z.; He, Z.; Li, X.; Meng, J.; Hou, Z.; Yang, J. Changes in air quality from the COVID to the post-COVID era in the beijing-tianjin-tangshan region in China. Aerosol Air Qual. Res. 2021, 21, 210270. [Google Scholar] [CrossRef]
  66. Khan, S.; Dahu, B.M.; Scott, G.J.A. Spatio-temporal study of changes in air quality from Pre-COVID era to Post-COVID era in Chicago, USA. Aerosol Air Qual. Res. 2022, 22, 220053. [Google Scholar] [CrossRef]
  67. Wang, Z.; Xue, L.; Liu, J.; Ding, K.; Lou, S.; Ding, A.; Huang, X. Roles of atmospheric aerosols in extreme meteorological events: A systematic review. Curr. Pollut. Rep. 2022, 8, 177–188. [Google Scholar] [CrossRef]
  68. Debdas, S.; Roy, K.; Saha, A.; Kundu, S.; Dasray, S.; Chouhan, S. Analysis and prediction of climate change in Post-Covid19 India. In Proceedings of the 2020 4th International Conference on Electronics, Communication and Aerospace Technology (ICECA), Coimbatore, India, 5–7 November 2020; pp. 1530–1536. [Google Scholar]
  69. Razak, N.I.A.; Ezani, N.E.; Ismail, N. Particulate matter-induced acute coronary syndrome: MicroRNAs as microregulators for inflammatory factors. Mediat. Inflamm. 2021, 2021, 6609143. [Google Scholar] [CrossRef]
  70. Silveyra, P.; Fuentes, N.; Rivera, L. Ozone I. human disorders: An overview. In A Handbook of Environmental Toxicology: Human Disorders and Ecotoxicology; CABI Books. CABI International, 2020; pp. 75–92. [Google Scholar]
  71. Gaur, A.; Tripathi, S.N.; Kanawade, V.P.; Tare, V.; Shukla, S.P. Four-year measurements of trace gases (SO2, NOx, CO, and O3) at an urban location, Kanpur, in Northern India. J. Atmos. Chem. 2014, 71, 283–301. [Google Scholar] [CrossRef]
  72. Pratap, V.; Tiwari, S.; Kumar, A.; Singh, A.K. COVID-19 lockdown induced air pollution reduction over India: A lesson for future air pollution mitigation strategies. J. Earth Syst. Sci. 2021, 130, 1–16. [Google Scholar] [CrossRef]
  73. de Frutos, F.; Cuerdo-Vilches, T.; Alonso, C.; Martín-Consuegra, F.; Frutos, B.; Oteiza, I.; Navas-Martín, M.Á. Indoor environmental quality and consumption patterns before and during the COVID-19 lockdown in twelve social dwellings in Madrid, Spain. Sustainability 2021, 13, 7700. [Google Scholar] [CrossRef]
  74. Ravindra, K.; Singh, T.; Vardhan, S.; Shrivastava, A.; Singh, S.; Kumar, P.; Mor, S. COVID-19 pandemic: What can we learn for better air quality and human health? J. Infect. Public Health 2022, 15, 187–198. [Google Scholar] [CrossRef] [PubMed]
  75. Bolaño-Ortiz, T.R.; Pascual-Flores, R.M.; Puliafito, S.E.; Camargo-Caicedo, Y.; Berná-Peña, L.L.; Ruggeri, M.F.; Cereceda-Balic, F. Spread of COVID-19, meteorological conditions and air quality in the city of Buenos Aires, Argentina: Two facets observed during its pandemic lockdown. Atmosphere 2020, 11, 1045. [Google Scholar] [CrossRef]
  76. Fu, F.; Purvis-Roberts, K.L.; Williams, B. Impact of the COVID-19 pandemic lockdown on air pollution in 20 major cities around the World. Atmosphere 2020, 11, 1189. [Google Scholar] [CrossRef]
Figure 1. The study area map depicting the CAQM stations. The distribution of the 37 CAQM stations is shown on the map.
Atmosphere 13 02090 g001
Figure 2. Rainfall in the pre-lockdown period.
Atmosphere 13 02090 g002
Figure 3. Rainfall during the lockdown period.
Atmosphere 13 02090 g003
Figure 4. The overall methodology used in this study.
Atmosphere 13 02090 g004
Figure 5. Distribution of PM2.5 concentrations before and during the lockdown. The same classes have been provided with the same colour scheme for easy visualization of assessing the changes in the PM2.5 before and during the lockdown. It must be noted that pre-lockdown period PM2.5 ranges from 36.27 to 95.06 μg/m3. In contrast, during the lockdown, it went down and ranged from 28.70 to 72.09 μg/m3.
Atmosphere 13 02090 g005
Figure 6. Distribution of PM10 pollutants before (12–22 March 2020) and during the lockdown (23 March–2 April 2020). It must be noted that only one class overlapped between the two periods of analysis, i.e., 101.28–122.49. This class has been provided the same color scheme in pre-lockdown period and during lockdown period maps. It must be noted that pre-lockdown period PM10 ranged from 101.28 to 233.69 μg/m3. In contrast, during lockdown, it went down and ranged from 49.37 to 122.49 μg/m3.
Atmosphere 13 02090 g006
Figure 7. AQI map of PM2.5 before (12–22 March 2020) and during the lockdown (23 March–2 April 2020).
Atmosphere 13 02090 g007
Figure 8. Comparison plot of AQI for PM2.5 between the pre- and during-lockdown periods.
Atmosphere 13 02090 g008
Figure 9. AQI map of PM10 before (12–22 March 2020) and during the lockdown (23 March–2 April 2020).
Atmosphere 13 02090 g009
Figure 10. Comparison plot of AQI for PM10 between the pre- and during-lockdown periods.
Atmosphere 13 02090 g010
Table 1. List of Continuous Air Quality Monitoring Stations (CAQM) stations maintained by the Central Pollution Control Board (CPCB), Delhi Pollution Control Committee (DPCC), and India Meteorological Department (IMD).
Sl. No.Station NameSl. No.Station Name
1Anand Vihar, Delhi-DPCC20NSIT Dwarka, New Delhi-CPCB
2Ashok Vihar, Delhi-DPCC21Najafgarh, Delhi-DPCC
3Aya Nagar, New Delhi-IMD22Narela, Delhi-DPCC
4Bawana, Delhi-DPCC23Nehru Nagar, Delhi-DPCC
5Burari Crossing, New Delhi-IMD24North Campus, DU, New Delhi-IMD
6CRRI Mathura Road, New Delhi-IMD25Okhla Phase-2, Delhi-DPCC
7DTU, New Delhi-CPCB26Patparganj, Delhi-DPCC
8Dr Karni Singh Shooting Range, Delhi-DPCC27Punjabi Bagh, Delhi-DPCC
9Dwarka-Sector 8, Delhi-DPCC28Pusa, Delhi-DPCC
10East Arjun Nagar, Delhi-CPCB29Pusa, New Delhi-IMD
11IGI Airport (T3), New Delhi-IMD30R K Puram, New Delhi-DPCC
12IHBAS, Dilshad Garden, New Delhi-CPCB31Rohini, Delhi-DPCC
13ITO, New Delhi-CPCB32Shadipur, New Delhi-CPCB
14Jahangirpuri, Delhi-DPCC33Sirifort, New Delhi-CPCB
15Jawaharlal Nehru Stadium, Delhi-DPCC34Sonia Vihar, Delhi-DPCC
16Lodhi Road, New Delhi-IMD35Sri Aurobindo Marg, Delhi-DPCC
17Major Dhyan Chand National Stadium, Delhi-DPCC36Vivek Vihar, Delhi-DPCC
18Mandir Marg, New Delhi-DPCC37Wazirpur, Delhi-DPCC
19Mundaka, Delhi-DPCC
Table 2. Breakpoints (BP) for the AQI parameters.
Breakpoints (BP)Air Quality Index (AQI)Category
PM2.5 (µg/m3)PM10 (µg/m3)
0.0–15.40–540–50Good
15.5–40.455–15451–100Moderate
40.5–65.4155–254101–150Unhealthy for sensitive groups
65.5–150.4255–354151–200Unhealthy
150.5–250.4355–424201–300Very unhealthy
>250.5>425301–400Hazardous
Table 3. Statistical overview of the air pollution model interpolation errors (with measured sample values minus interpolated (μg /m3)).
IDWKrigingNNSpline
MIN37.1151.9237.58−17.20
MAX82.3771.6682.21120.80
RANGE45.2619.7444.63138.01
MEAN62.5760.6762.0460.30
STD6.954.767.8821.40
ME2.182.253.639.85
RMSE5.626.055.7024.40
GOODNESS RANK OF MEIIIIIIIV
GOODNESS RANK OF RMSEIIIIIIIV
Table 4. District-wise comparison of AQI for PM2.5.
S No.District Name12–22 March 202023 March–2 April 2020
MinMaxMeanMinMaxMean
1North15117016195125112
2North East151156154749989
3West10216914771155102
4East1371571467512990
5South West13816215487120108
6Central1251601507314899
7New Delhi1031611396815388
8South127156139729382
9Shahdara1501581546010483
10South East123154144749384
11North West12816915873120109
Table 5. District-wise comparison of AQI for PM10.
S No.District Name12–22 March 202023rd March–02nd April 2020
MinMaxMeanMinMaxMean
1North102134122597668
2North East99114104556358
3West89136114526459
4East89128101556257
5South West101144113546559
6Central86124102476858
7New Delhi84145101466654
8South7513397426153
9Shahdara95131107576360
10South East84121101525856
11North West97137121556964
Publisher’s Note: MDPI stays neutral with regard to jurisdictional claims in published maps and institutional affiliations.

