
Aerosol Characterization with Long-Term AERONET Sun-Photometer Measurements in the Naples Mediterranean Area


1
Dipartimento di Fisica “Ettore Pancini”, Università degli Studi di Napoli Federico II, Via Cintia, 80126 Napoli, Italy
2
Consiglio Nazionale delle Ricerche Istituto di Metodologie per l’Analisi Ambientale, C.da S. Loja, Tito Scalo, 85050 Potenza, Italy
*
Author to whom correspondence should be addressed.
Atmosphere 2022, 13(12), 2078; https://doi.org/10.3390/atmos13122078
Submission received: 26 October 2022
/
Revised: 6 December 2022
/
Accepted: 7 December 2022
/
Published: 10 December 2022
(This article belongs to the Special Issue Natural Sources Aerosol Remote Monitoring)
Abstract
:We report on the characterization of columnar aerosol optical and microphysical properties in the Naples Mediterranean area over a period of five years by the ground-based sun–sky–lunar photometer operating at our observational station in the frame of the AERONET network. Statistical and climatological analyses of daily mean values of aerosol optical depth at 440 nm (AOD440) and Ångström exponent at 440/870 nm (α440/870) allowed for highlighting their typical seasonal behavior. In particular, we observe higher mean values of the AOD440 during summer or spring, which are consistent with an increased frequency of both Saharan dust transport events and biomass burning episodes affecting the measurement area in these periods of the year. Conversely, α440/870 does not show any typical seasonal trend. In order to gain information on the different aerosol contributions along the atmospheric column, the frequency distributions of AOD440 and α440/870 were analyzed and fitted by a superposition of Gaussian functions. The most populated modes are centered at α440/870 = 1.26 ± 0.07 and AOD440 = 0.16 ± 0.01. These values are associated with continental polluted aerosol mixed with sea salt aerosol and correspond to the background conditions typically observed in clear atmospheric conditions. Daily size distributions averaged over each month highlight that the fine aerosol component always prevails over the coarse fraction, except for the few months in which Saharan dust events are particularly frequent. Finally, the mean value of the SSA at 440 nm resulted as 0.94 ± 0.05, while the refractive index real and imaginary part were 1.47 ± 0.07 and (6.5 ± 0.2) × 10−3, respectively. These values are in agreement with those observed in other Mediterranean sites located in Southern Italy, evidencing a rather characteristic feature of the geographical region.
1. Introduction
Atmospheric aerosol is an important component of the Earth system. Aerosol measurement and monitoring are important to better understand its impact on air quality and human health, and to reduce the uncertainty about its climatic role [1]. For this reason, it is fundamental to monitor aerosol continuously and to retrieve its physical and chemical properties. This is the purpose of many ground-based networks such as SKYNET (SKYradiometer NETwork) [2], EARLINET (European Aerosol Research Lidar NETwork), and AERONET (AErosol RObotic NETwork). SKYNET analyzes aerosol–cloud–solar radiation interaction with sun–sky radiometers, while EARLINET uses lidar to provide aerosol data on a continental scale [3]. AERONET is an important global aerosol-monitoring network that has more than 800 automated ground-based sun-photometers distributed all over the world, aiming to provide long-term and continuous observations with high temporal resolution of aerosol optical and microphysical properties for research purposes [4]. Many studies are carried out worldwide, providing continuous aerosol columnar properties with the purpose of characterizing dominant aerosol type over a specific source region [5,6,7,8,9]. For example, Ref. [10] used an eight-year dataset of AERONET measurements highlighting the variability of aerosol optical and microphysical properties corresponding to seven different sites in the Middle East and in the Eastern Mediterranean Sea regions, whereas in Ref. [11], AERONET measurements were used with the aim of characterizing dominant aerosol types over Europe, the Middle East, North Africa and the Arabian Peninsula. Similar studies based on remote sensing observations carried out over many years are reported in Refs. [12,13]. These studies provide an aerosol characterization illustrating seasonal variation of their properties in key locations characteristic of different environments with a focus on the contribution of mineral particles in the regions most affected by the presence of desert dust.
Moreover, field experiments using a multi-instrument measurement approach showed significant differences between the measured aerosol physical, chemical, and optical characteristics, depending on their natural and anthropogenic sources as well as on local and long-range transport phenomena [14,15,16]. The Mediterranean Basin, for its peculiar geographical location, is characterized by a large diversity of aerosol that coexists in the atmosphere (e.g., mainly marine aerosol, anthropogenic aerosol, local and long-range transported biomass burning aerosol, and mineral dust transported from the Southern Sahara desert region); for this reason, this geographical area is frequently subject to investigations exploiting different methodologies [17,18,19]. In particular, dust transport from the Southern Sahara Desert is a very common phenomenon that has an important impact on the atmosphere. It has been documented in many works using AERONET products [20,21,22,23,24,25,26] and in synergy with data obtained from other instruments, such as lidars [27,28,29,30,31,32] and radiometers [33,34].
Here, we report the first long-term data analysis in the framework of AERONET for the coastal central Mediterranean site of Naples. This area is characterized by sea breeze circulation that can modify the aerosol composition and vertical distribution [35]. For this reason, aerosol characterization is a challenge. In the present study, we identify seasonal patterns of aerosol properties over a five-year period, focusing on optical depth and Angstrom exponent to evaluate their concentration and dimension, respectively. In particular, our analysis focuses on the identification of the Saharan dust transport events that modulate the aerosol vertical distribution in the atmosphere. This is achieved by using the HYSPLIT (Hybrid Single-Particle Lagrangian Integrated Trajectory) and BSC-DREAM8b models with the aim to characterize the dominant component of aerosols in the free troposphere. Finally, we investigate columnar microphysical properties of aerosol and discuss the results of our analysis.
2. Materials and Methods
2.1. Location and Instruments
The National Facility of the ACTRIS Research Infrastructure [36] at the University of Naples “Federico II” is equipped with active and passive remote sensing instruments for atmospheric aerosol studies. Among others, a CIMEL sun-photometer has been operative since April 2016 in the framework of AERONET.
Here, we report on the aerosol characterization provided by a CIMEL CE318T sun–sky–lunar photometer [37] that acquires Sun radiance at 8 different wavelengths: 340, 380, 440, 500, 675, 870, 1020 and 1640 nm. Aerosol columnar properties are automatically measured in three different modes: direct Sun, direct Moon and sky radiance measurements. Data coverage is limited by weather conditions and periodical instrument calibration; products are available to users in near real time on the AERONET website (https://aeronet.gsfc.nasa.gov, accessed on 1 February 2022). Moreover, lunar data are also available during full-moon period.
AERONET direct sun/moon products are aerosol optical depth (AOD) and Ångström exponent (α); inversion algorithms provide aerosol volume size distribution, single scattering albedo and real and imaginary parts of the refractive index [38,39]. The accuracy level of the retrieved product is described in detail in [40].
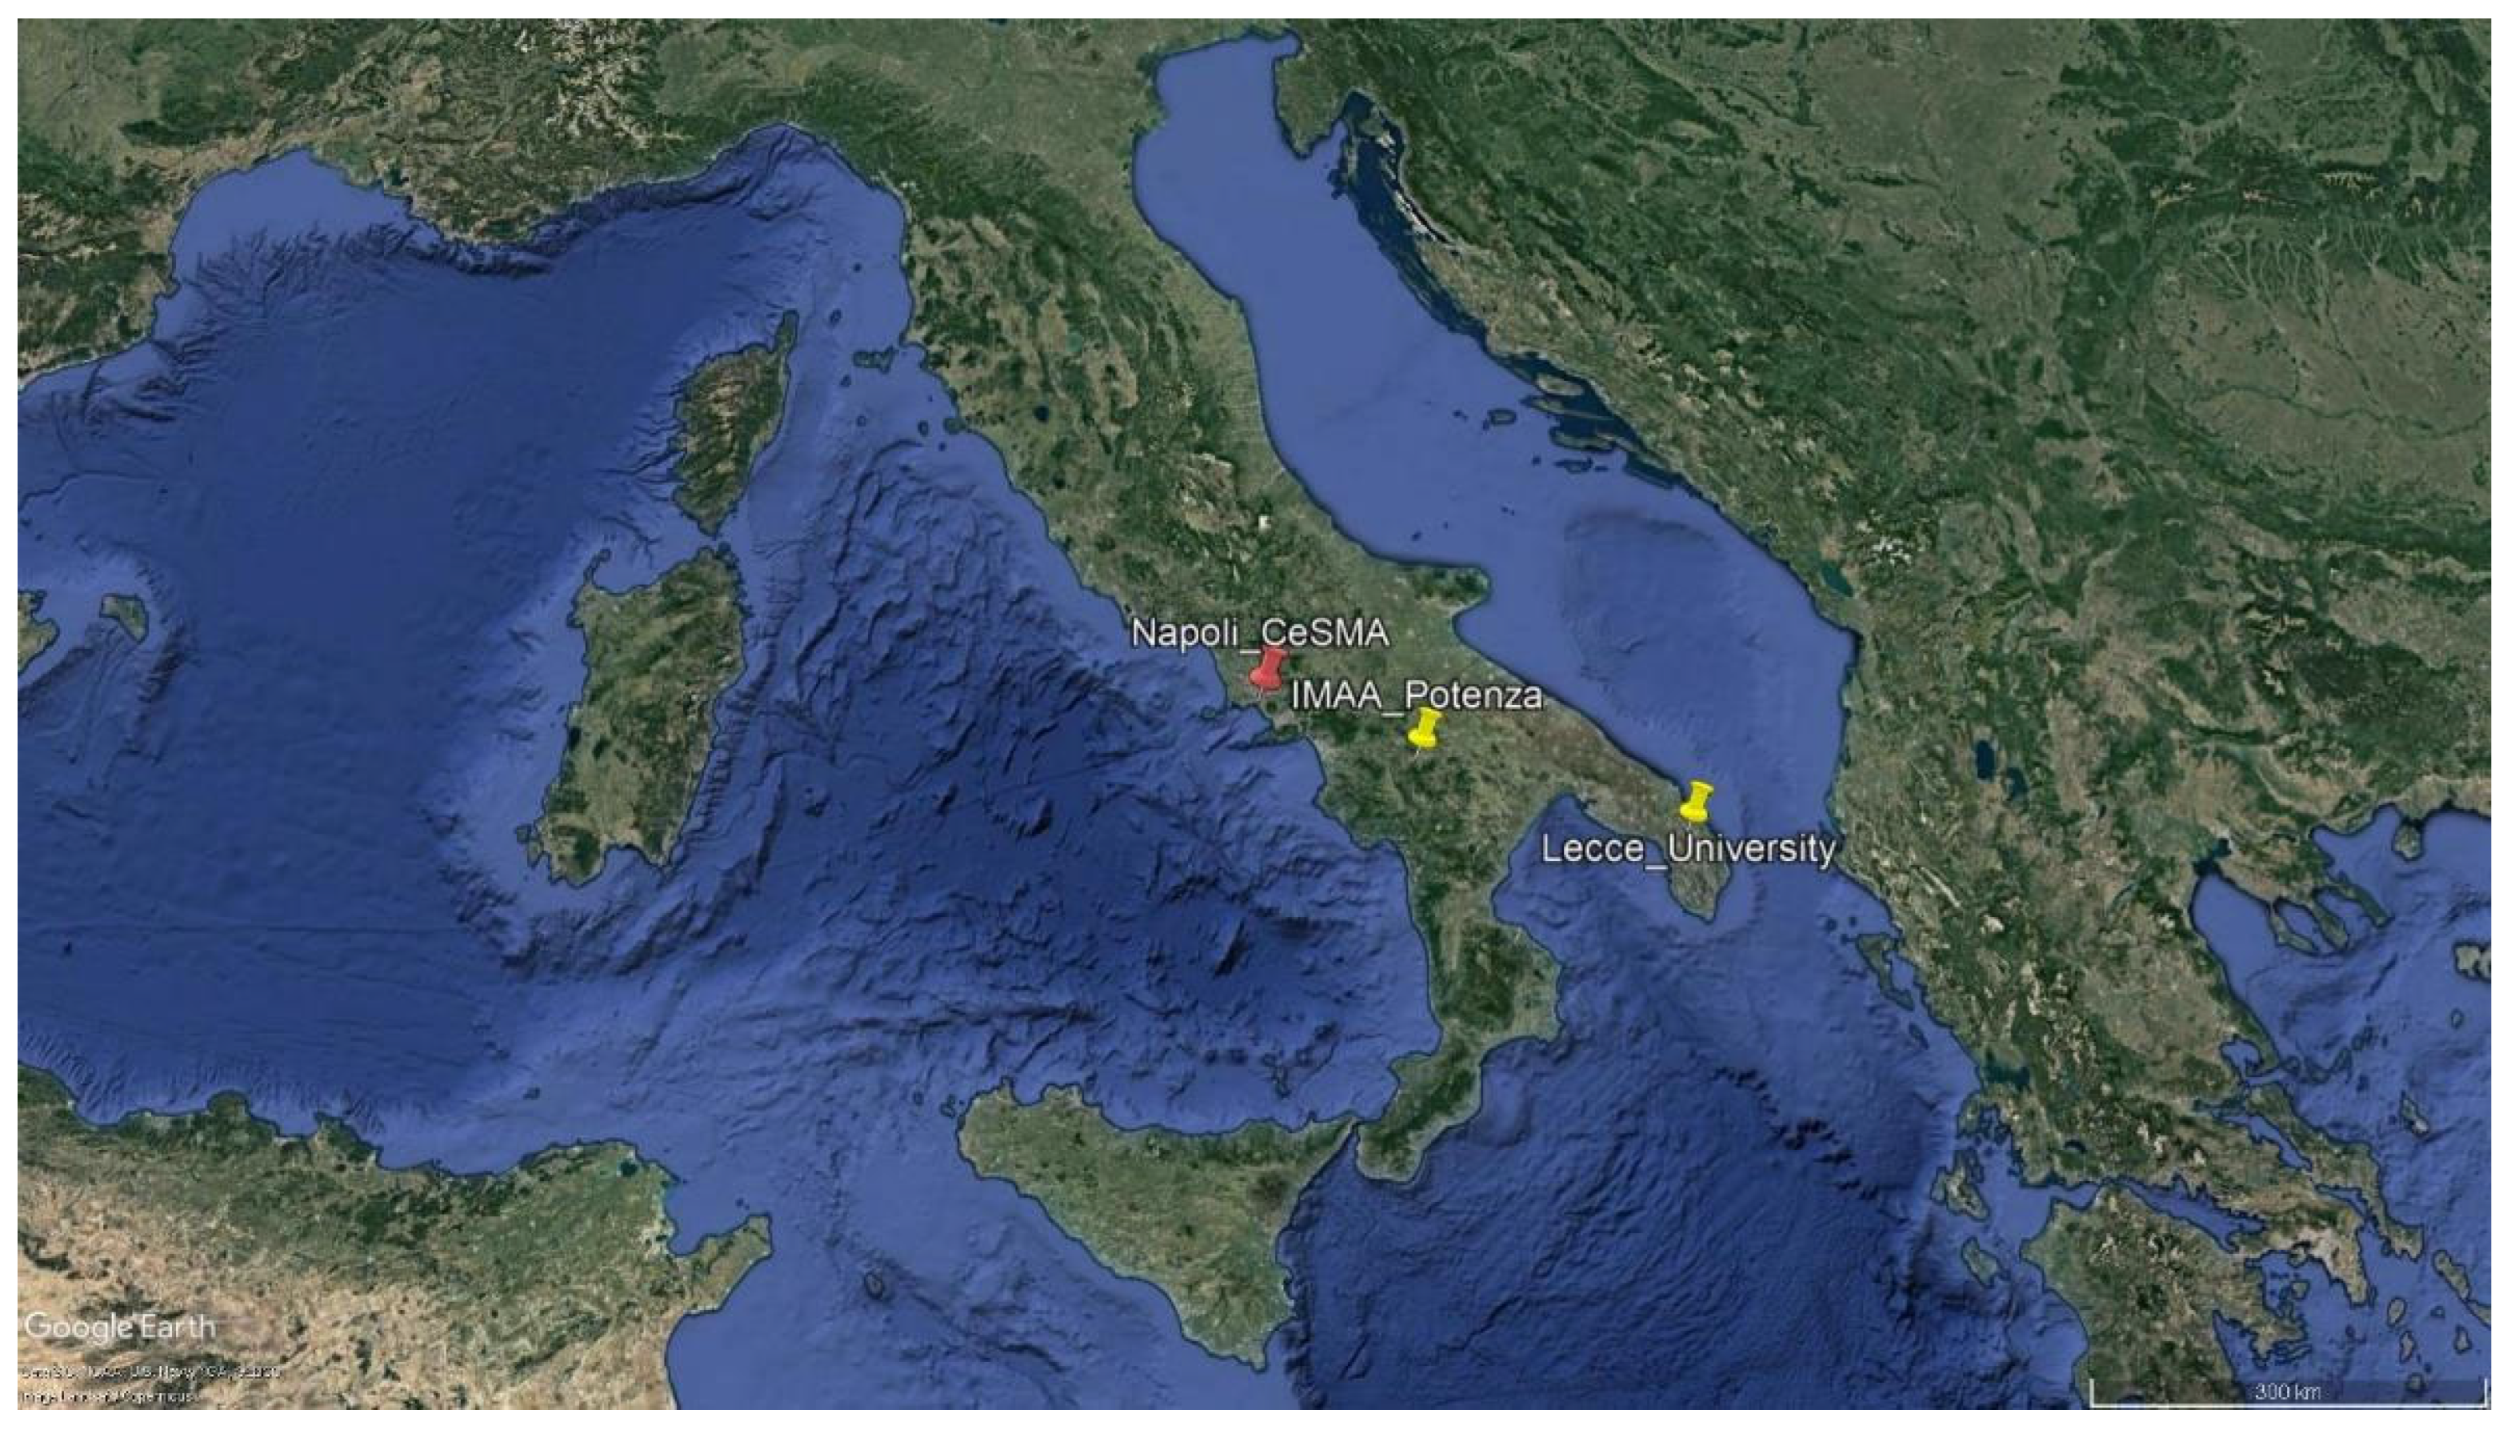
The Napoli-CeSMA AERONET sun-photometer is located one kilometer from the Mediterranean Sea (40.83684° N, 14.30657° E, Elevation: 50.0 m). The measurement area (Figure 1) represents an ideal site for a long-term assessment of the various types of aerosol produced by different sources in the center of the Mediterranean basin, being influenced from marine aerosol of the near Mediterranean Sea [35,41], anthropogenic aerosol produced by the urban and industrial areas of Naples and the European region in the north [42], local and long-range transported biomass burning aerosol [43], and mineral dust transported from the Southern Sahara desert region [44,45].
Saharan dust transport events are very common in the Mediterranean basin [28]. Here, aerosol air mass back-trajectories, provided by the Hybrid Single-Particle Lagrangian Integrated Trajectory (HYSPLIT) model developed by the National Oceanic and Atmospheric Administration (NOAA) Air Resources Laboratory [46], are exploited to identify the origin and pathway of the aerosol. Moreover, in order to assess different aerosol contributions in the atmospheric column over the station, back-trajectories analysis was also supported by the BSC-DREAM8b daily forecasts (http://www.bsc.es/ess/bsc-dust-dailyforecast/, accessed on 1 February 2022) and by the NASA Fire Information for Resource Management System (FIRMS). The former provides vertical distribution and temporal variability of the dust, whereas the latter delivers information, derived from satellite observations, on active fire that could identify the presence of biomass burning aerosol in the measurement area.
2.2. Columnar Aerosol Properties
Level 1.5 (automatically cloud screened) daily averaged data acquired from January 2017 to December 2021 are considered here, reporting for the first time a five-year long-term monitoring of the main columnar aerosol properties over the area of Naples. In total, 1248 solar and 667 lunar days of measurements were analyzed with the aim of characterizing atmospheric aerosol content and properties. The two main parameters investigated are AOD at 440 nm and the Ångström coefficient α at 440/870 nm, estimated as:
The former is proportional to the total column load of aerosol in the atmosphere, whereas the latter is inversely proportional to the aerosol particle size [47]. These parameters are available for both solar and lunar measurements. Other inversion products are also available, but only for solar data. In an attempt to obtain a more complete characterization of the aerosol evolution in a long-term study, we also considered the single scattering albedo (SSA) at four different wavelengths (440, 675, 870, 1020 nm), the fine and coarse components of AOD at 500 nm, as well as the volume particle size distributions. The inversion algorithm provides the size distribution dV/dln(r) in μm3/μm2, in the size range from 0.05 to 15 µm separated in 22 equidistant bins on a logarithmic scale [38], which can gain information on fine and coarse mode fractions of the atmospheric aerosol. The size distribution is described by a lognormal bi-modal distribution, thus providing the values of the mean radius and the relative contribution of the two components. Our analysis of the aerosol columnar properties endows a reliable and valuable characterization of the main aerosol types present over the measurement area.
2.3. Aerosol Source Identification
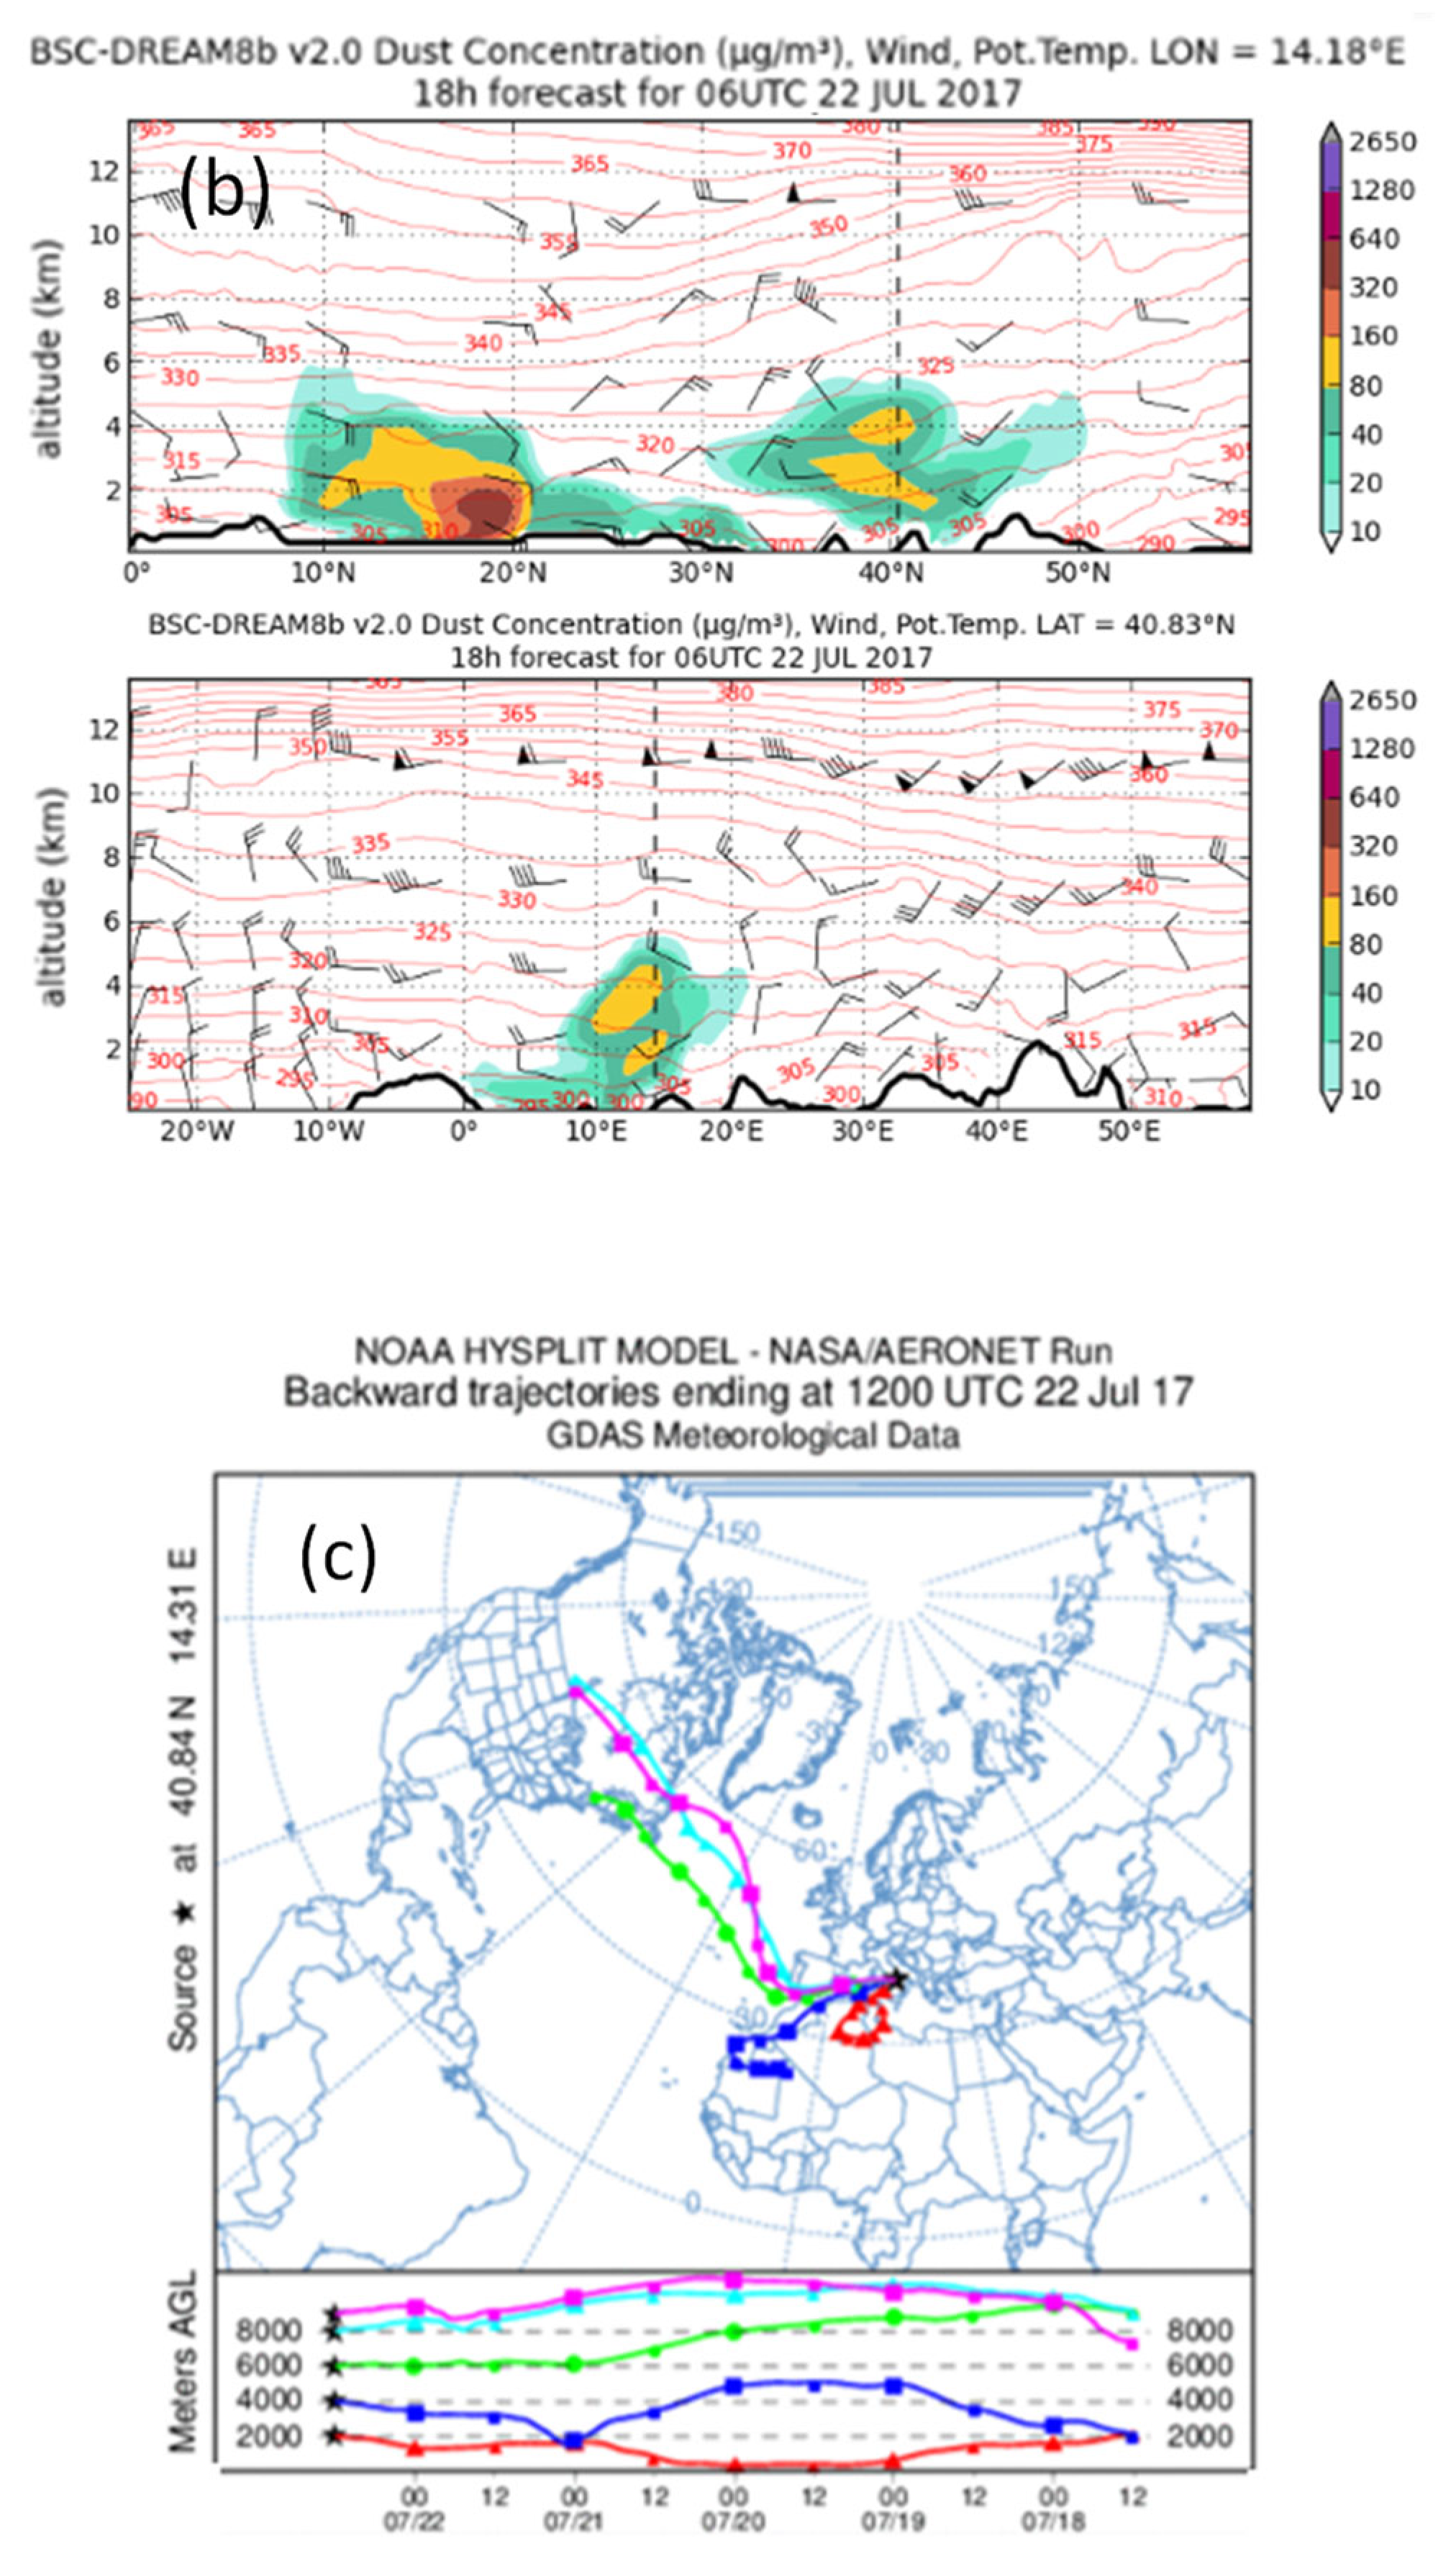
The web version of the HYSPLIT trajectory model is available online at the aeronet.gsfc.nasa.gov website (https://www.ready.noaa.gov/HYSPLIT, accessed on 1 February 2022) at each of the AERONET sites. Trajectory images provided on this website can be obtained at five altitude levels and custom hours. Back-trajectories have been largely used in a wide number of aerosol studies, particularly to locate aerosol sources [23]. Dust outbreaks were identified using 5 days of back-trajectories, which correspond to the typical travel time of dust particles from northwestern Africa to south Italy. We used back-trajectories ending over Naples at altitudes between 2000 and 8000 m corresponding to the vertical extension of desert dust plumes, which are generally confined at this altitude range as illustrated in our previous study based on lidar observations [44]. The advection of dust particles from northwestern Africa was supported by the dust concentration profiles and dust load obtained from the BSC-DREAM8b model operated by the Barcelona Supercomputing Center; the BSC-DREAM8b is a model developed to simulate and/or predict the atmospheric cycle of mineral dust. The model provides the spatial and temporal variability of dust aerosol load and optical depth [48] for the monitoring site of this study. As an example, Figure 2 displays the results of the models corresponding to a typical Saharan dust transport event that occurred on 22 July 2017. Figure 2a shows the vertical profile of dust concentration (µg/m3) in the atmosphere over Naples while Figure 2b shows DREAM dust concentration forecast maps at longitude 14.18°E and latitude 40.83°N of the monitoring site.
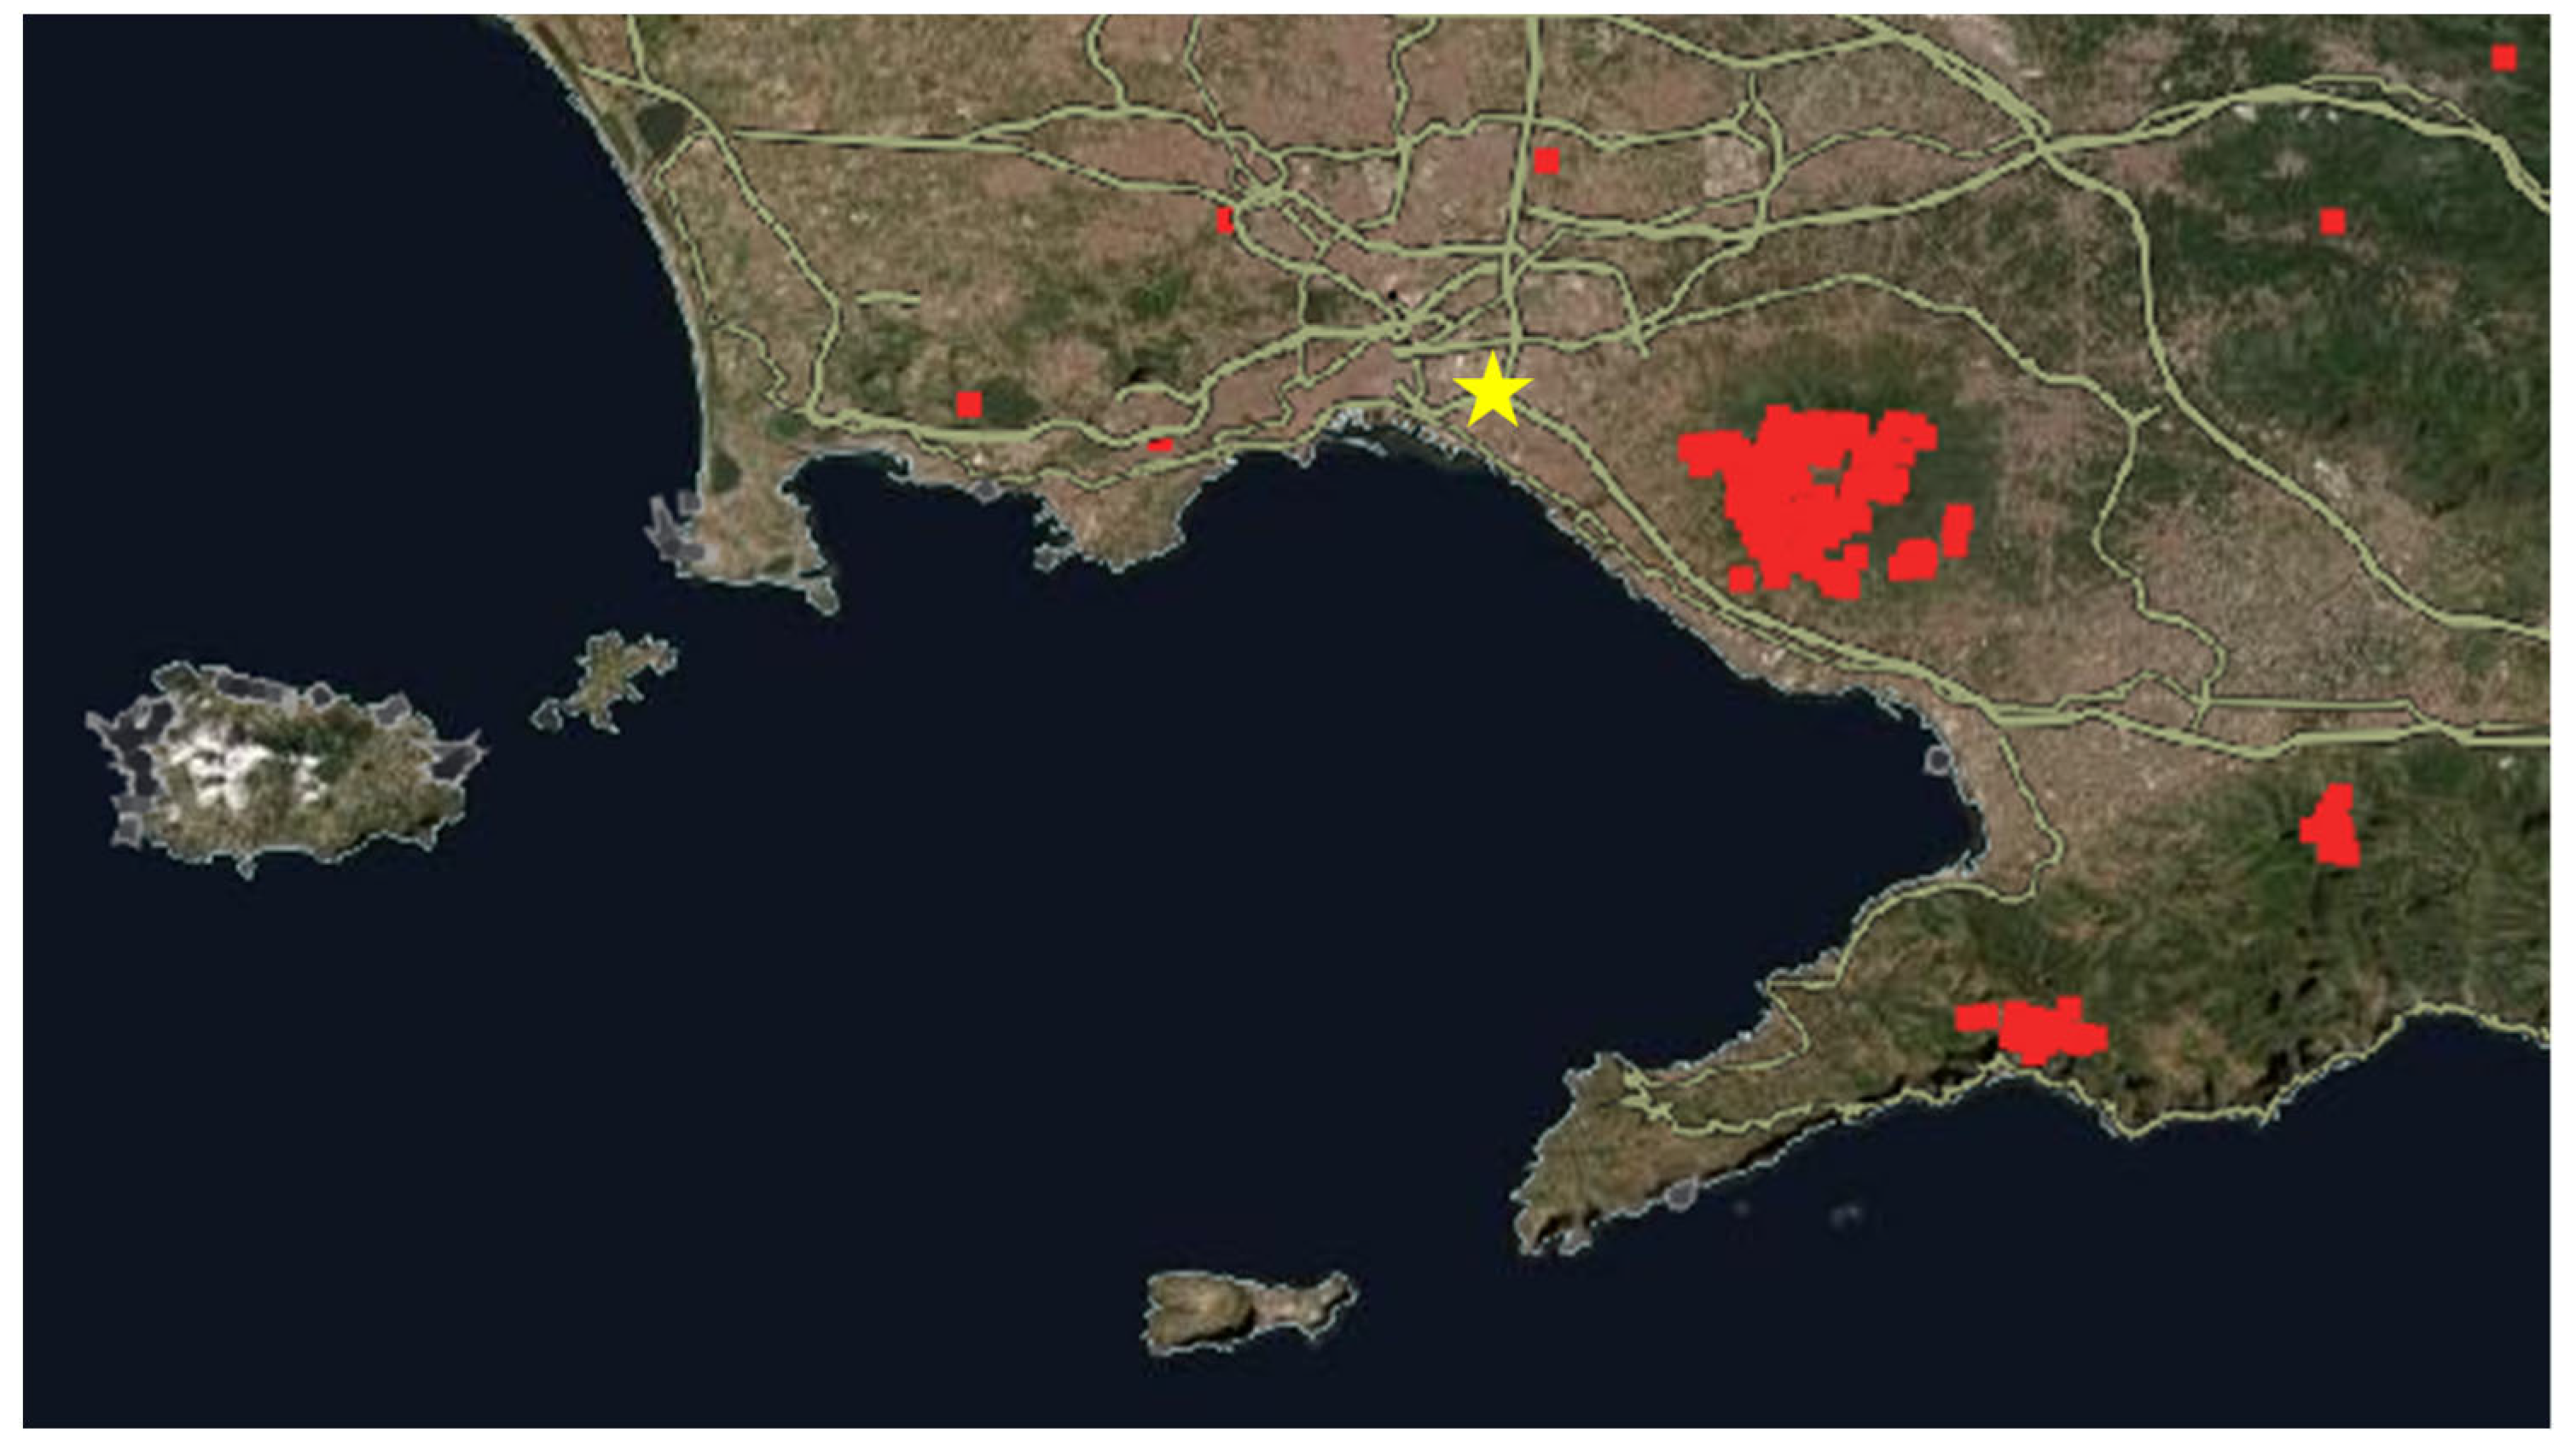
Fires events derived from satellite observations by the MODIS (Moderate Resolution Imaging Spectroradiometer) and VIIRS (Visible Infrared Imaging Radiometer Suite) instruments and reported by the NASA Fire Information for Resource Management System (FIRMS) were used to identify wildfire activity near the observational site that might cause the presence of atmospheric aerosol originating from biomass burning (https://firms.modaps.eosdis.nasa.gov, accessed on 30 September 2022). Figure 3 reports the FIRMS map corresponding to 12 July 2017 when fires affected a very large area of the Vesuvius National Park and the smoke was driven by winds toward the city of Naples. The biomass burning aerosols were blown by wind toward the north–west direction, especially on 12 and 13 July when the wind speed reached values as high as 10 m/s [43].
3. Results and Discussion
Here, we illustrate the results of our five-year analysis on the columnar aerosol properties measured by the AERONET sun–sky–lunar photometer of the observational station at the University of Naples “Federico II”. We first discuss in Section 3.1 the seasonal variation of the aerosol AOD at 440 nm (AOD440) and Angstrom coefficient at 440/870 nm (α440/870); then, in Section 3.2, the various aerosol typologies are recognized by means of the relationship between the previous two parameters. Finally, the analysis of the aerosol microphysical properties is reported in Section 3.3.
3.1. Seasonal and Statistical Analysis
In order to characterize the mean properties of the atmospheric aerosol observed above the measurement area and verify possible seasonal trends, the temporal variability of their columnar properties was studied, and a statistical analysis on AOD440 and α440/870 was performed on both diurnal and nocturnal data.
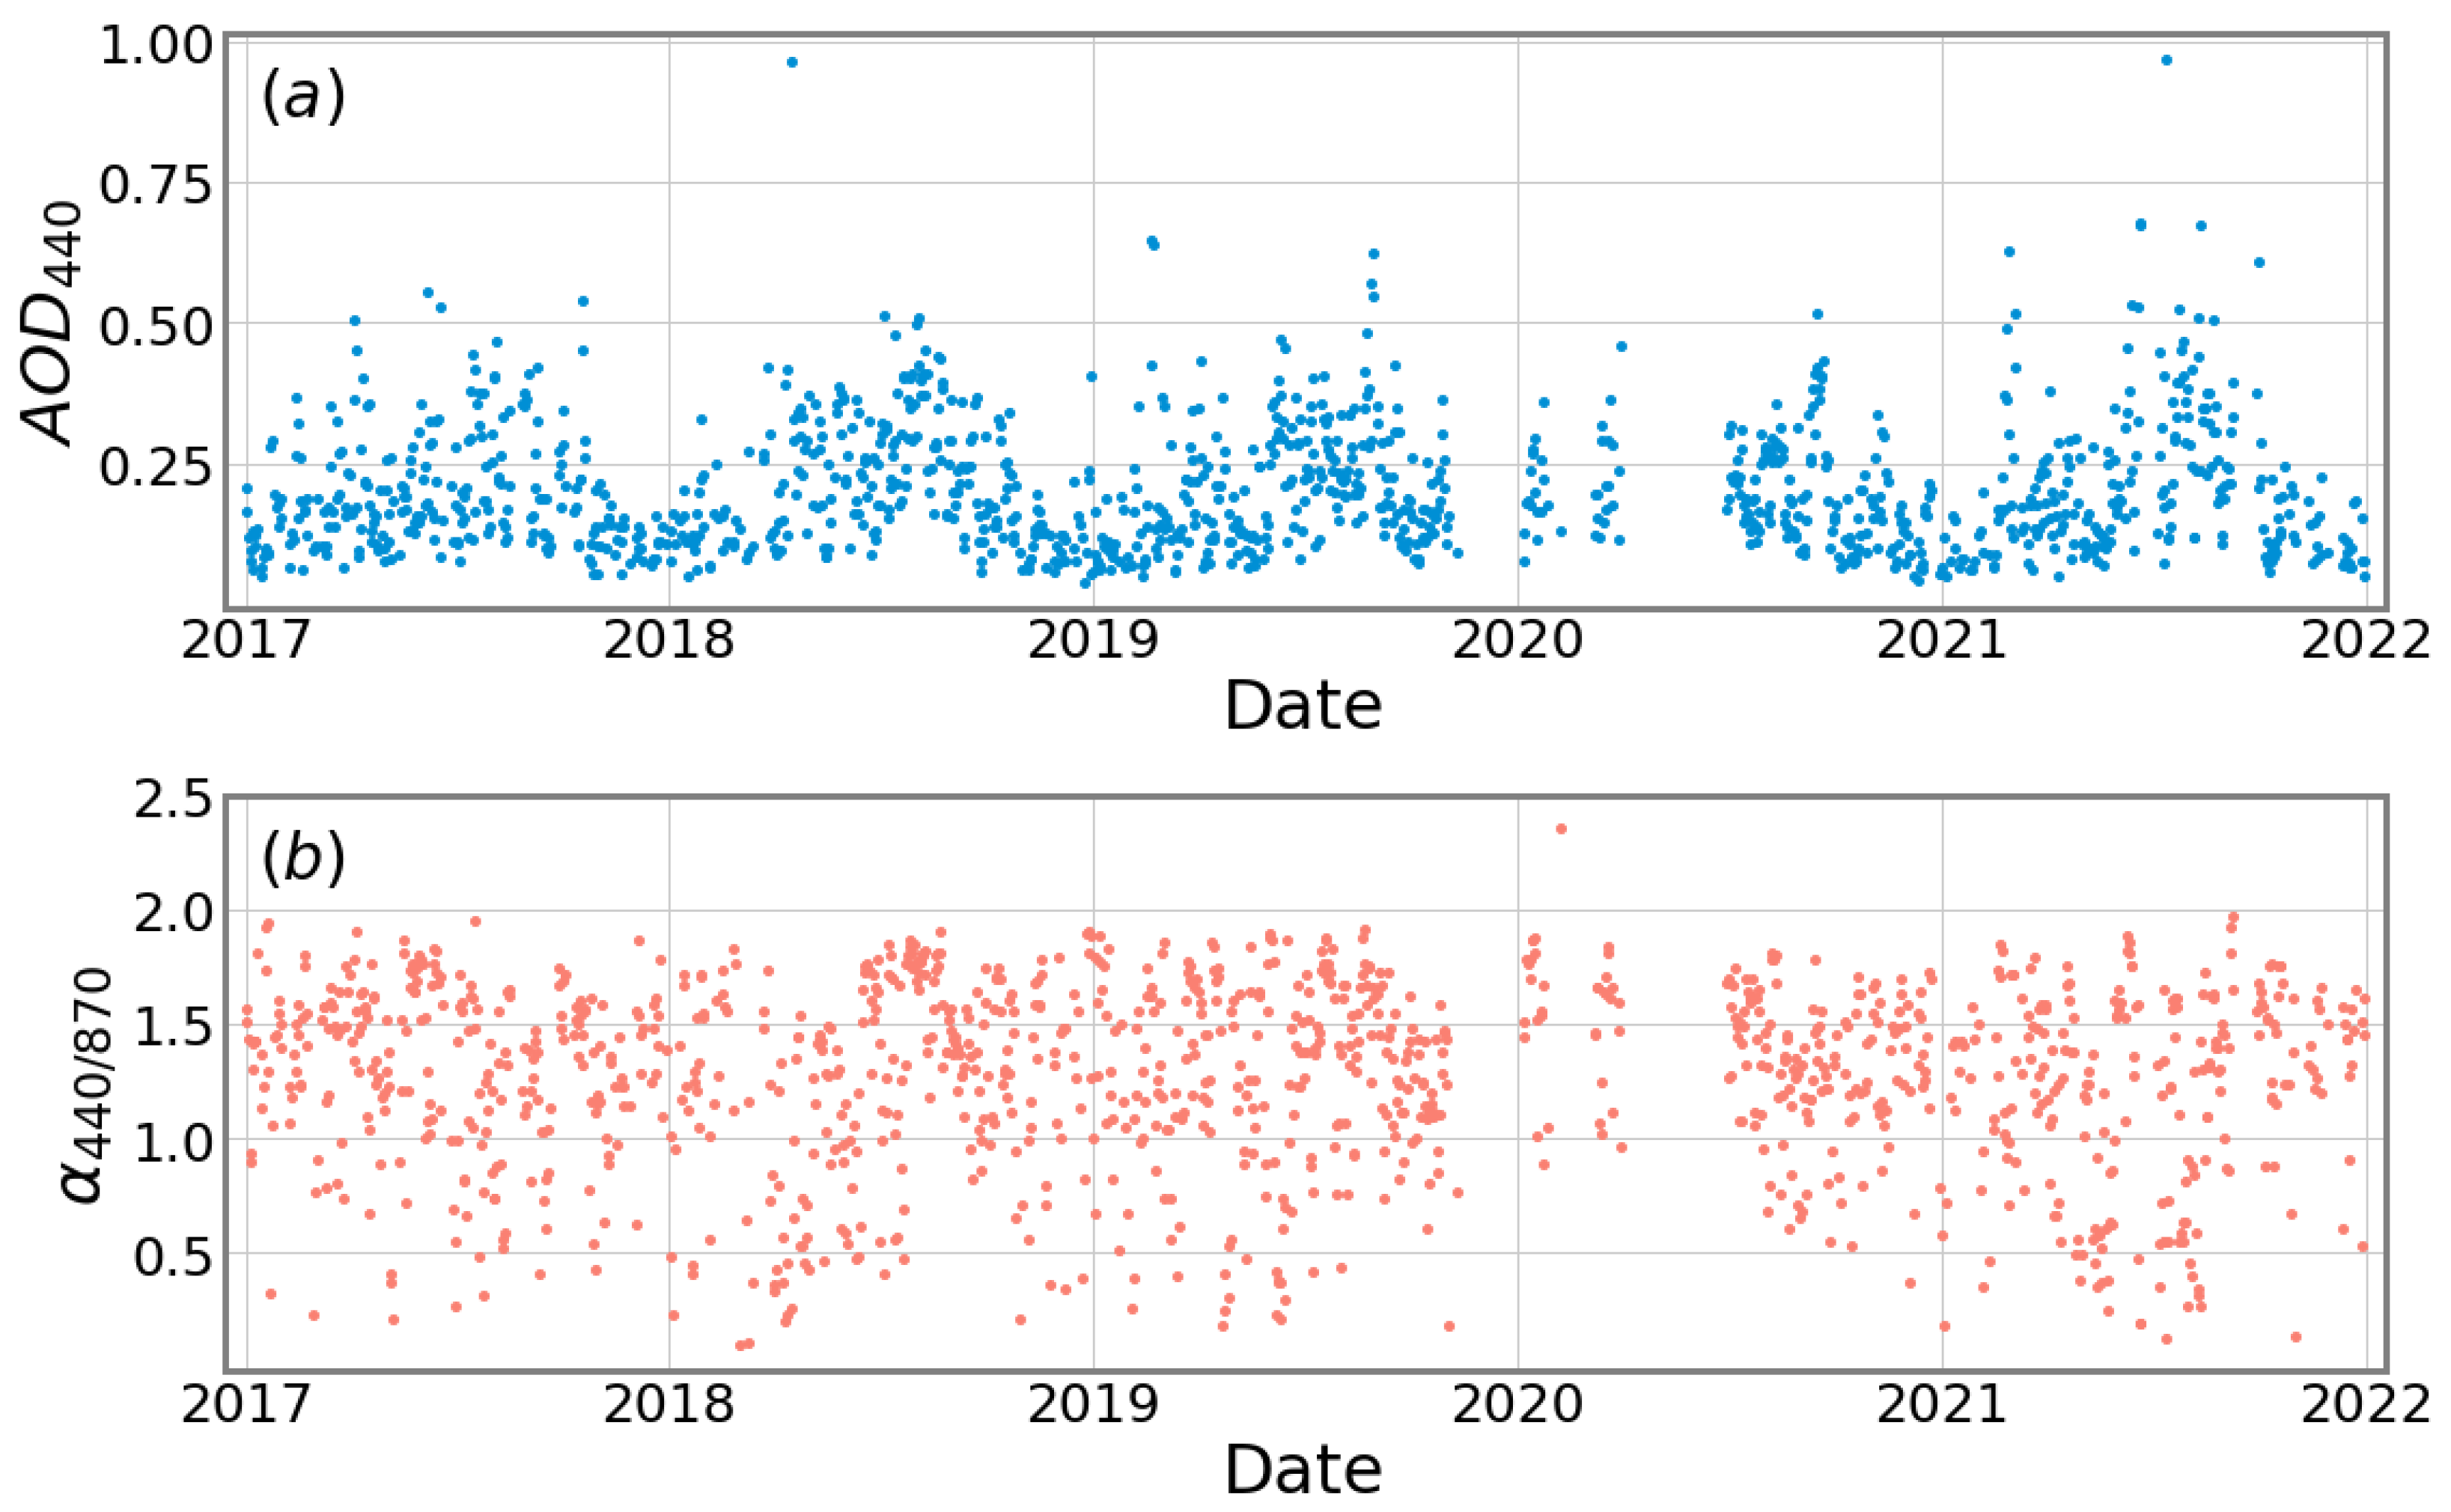
Figure 4 displays the temporal variability of daily mean values of AOD440 and α440/870 registered in diurnal observations (solar data). The data show a large day-by-day variability with values of AOD440 and α440/870 varying in the ranges (0.04–0.97) and (0.1–2.36), respectively. Generally, the atmospheric turbidity increases from winter to summer. Daily AOD440 reaches its maximum value during the spring/summer period, while α440/870 is strongly variable during the different seasons.
These values are in agreement with those reported for the Mediterranean region [22,24,25,26,33,49] and reflect the large variability of the aerosol concentration and properties in the measurement area due to the different types of aerosols, produced by both natural and anthropogenic sources, whose ageing processes involve chemical and microphysical changes with time. AERONET-derived aerosol data measured in the western Mediterranean Sea showed values of AOD340 in the range 0.05–0.65 and α440/870 in the range 0.2–1.7. Moreover, in the southeast of Italy at the Lecce-AERONET station, AOD440 in the range 0.05–0.96 and α440/870 in the range 0.1–2.2 were measured, while AOD495.7 in the range 0.03–1.13 and α415.6/868.7 in the range −0.32–2.5 were obtained at the island of Lampedusa in the Central Mediterranean.
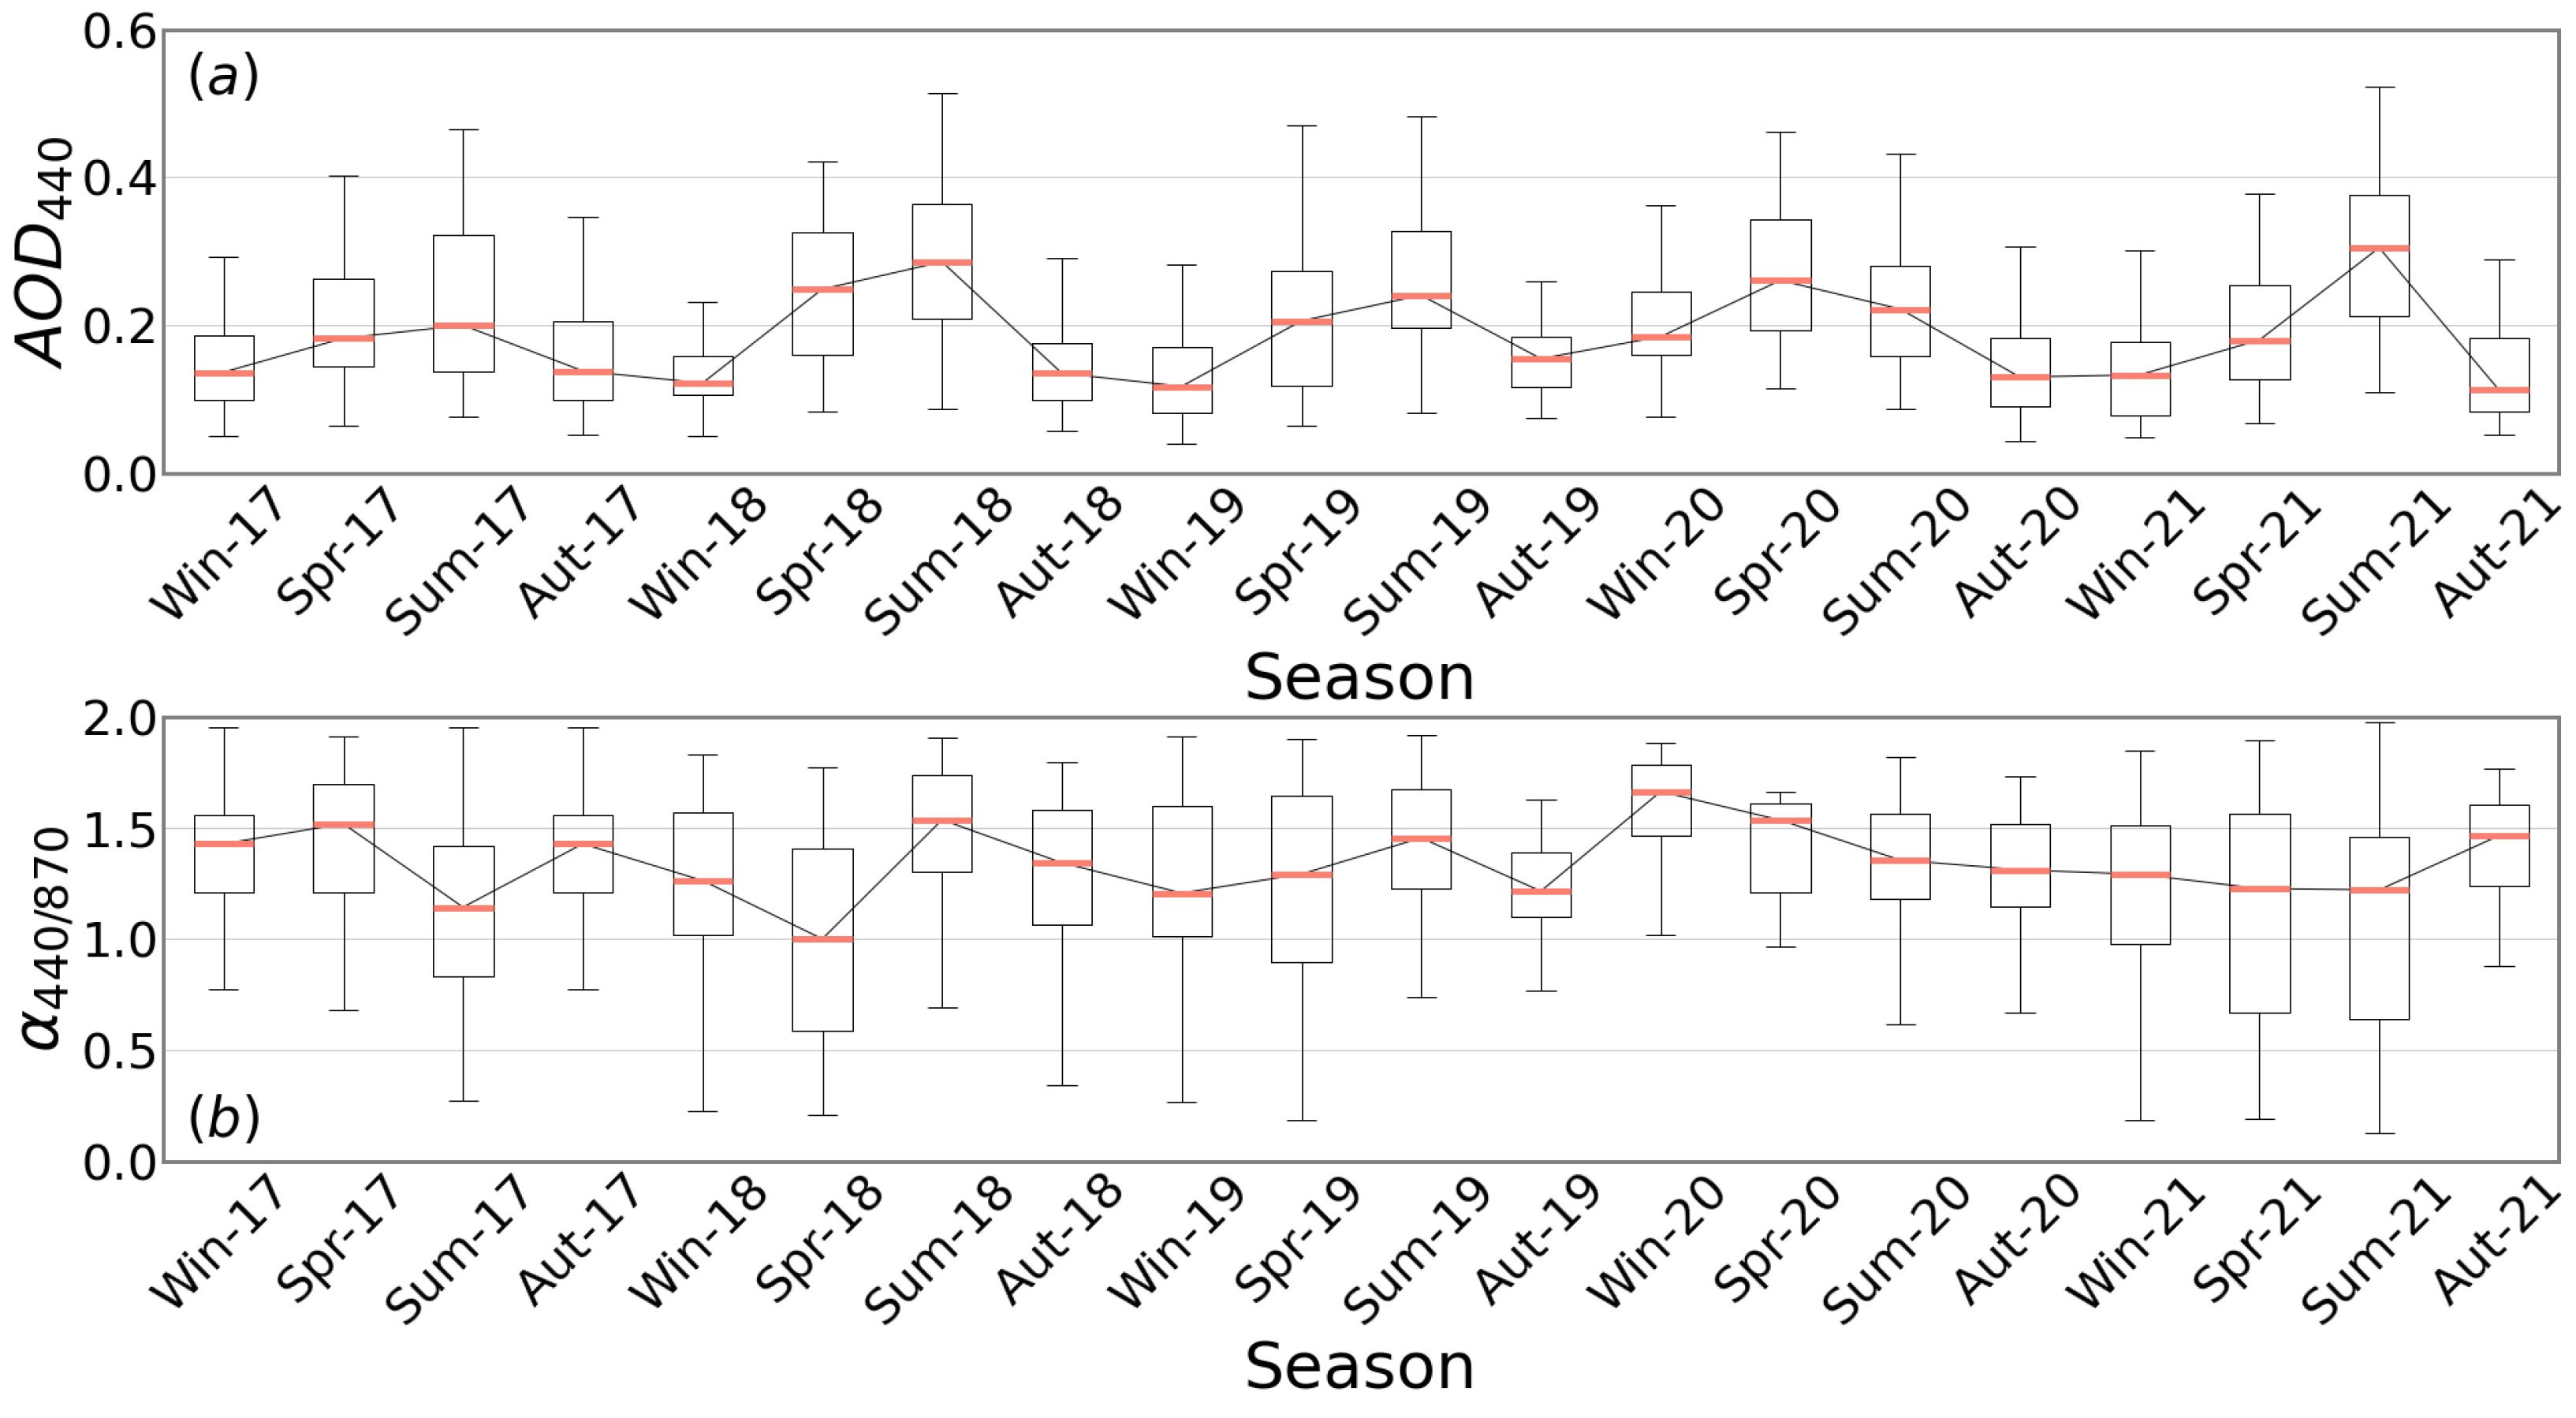
Seasonal statistical values of both AOD440 and α440/870 were evaluated, and their temporal variation is reported in the boxplot in Figure 5. The horizontal segments in the boxplots represent the median of the set of values, while the box boundaries are the 25th and 75th percentiles. The AOD440 shows an evident seasonal behavior with the higher AOD440 median values reaching a level of about 0.3 during summer or spring. These values are typical of the Mediterranean basin regions, where during the warm seasons, the frequency of Saharan dust transport events is higher [13,28,44]. The obtained results agree well with three years of systematic lidar observations carried out in the measurement area that showed a predominance of sand dust transport events (~70%) in spring and summer [44]. The AOD440 seasonal behavior could also be influenced by the numerous forest fires and biomass burning episodes affecting the measurement area, especially in summer. Moreover, the increase in AOD440 is also related to the stronger convection and the longer residence time of the atmospheric aerosol during this season. In particular, Saharan dust transport leads to higher AOD440 and lower α440/870 values, as a consequence of an increased content of larger sand particles in the atmospheric column, whereas biomass burning aerosol corresponds mainly to fine aerosol in the atmosphere linked with an increment in the α440/870 values. This could explain the α440/870 behavior that, on the contrary, seems to not evidence any typical seasonal trend.
This behavior could also be related to the coexistence of particles of different nature and typology, produced by local sources or long-range transport phenomena, whose mixing in the atmosphere is favored by high evaporation, low precipitation, and remarkable solar activity [50]. The same AOD440 seasonality and α440/870 variability is observed for lunar data as well (not shown).
Table 1 summarizes yearly averaged values of AOD440 and α440/870 for both diurnal and nocturnal observations. The reported errors were calculated as the standard deviation. We note that in the 2020 diurnal data corresponding to February, April, May and June are missing, but this year does not show many different values with respect to the other years. The solar AOD440 average over five years is 0.21 ± 0.13, while solar α440/870 average is 1.3 ± 0.4. For every year, the lunar AOD440 and α440/870 average values are consistent with the solar data, within the uncertainties. The value of the lunar AOD440 averaged over the analyzed period is 0.22 ± 0.13, while the lunar α440/870 average is 1.2 ± 0.4.
These values are consistent with the ones observed in other AERONET sites located in Southern Italy and the Mediterranean Basin and obtained from multi-year ground-based AERONET observations carried out from 22 Mediterranean stations [25]. In particular, our results agree with Lecce (AOD440 = 0.21, α440/870 = 1.21) and Potenza (AOD440 = 0.21, α440/870 = 1.35), two close southern stations where the influence of desert dust is also significant.
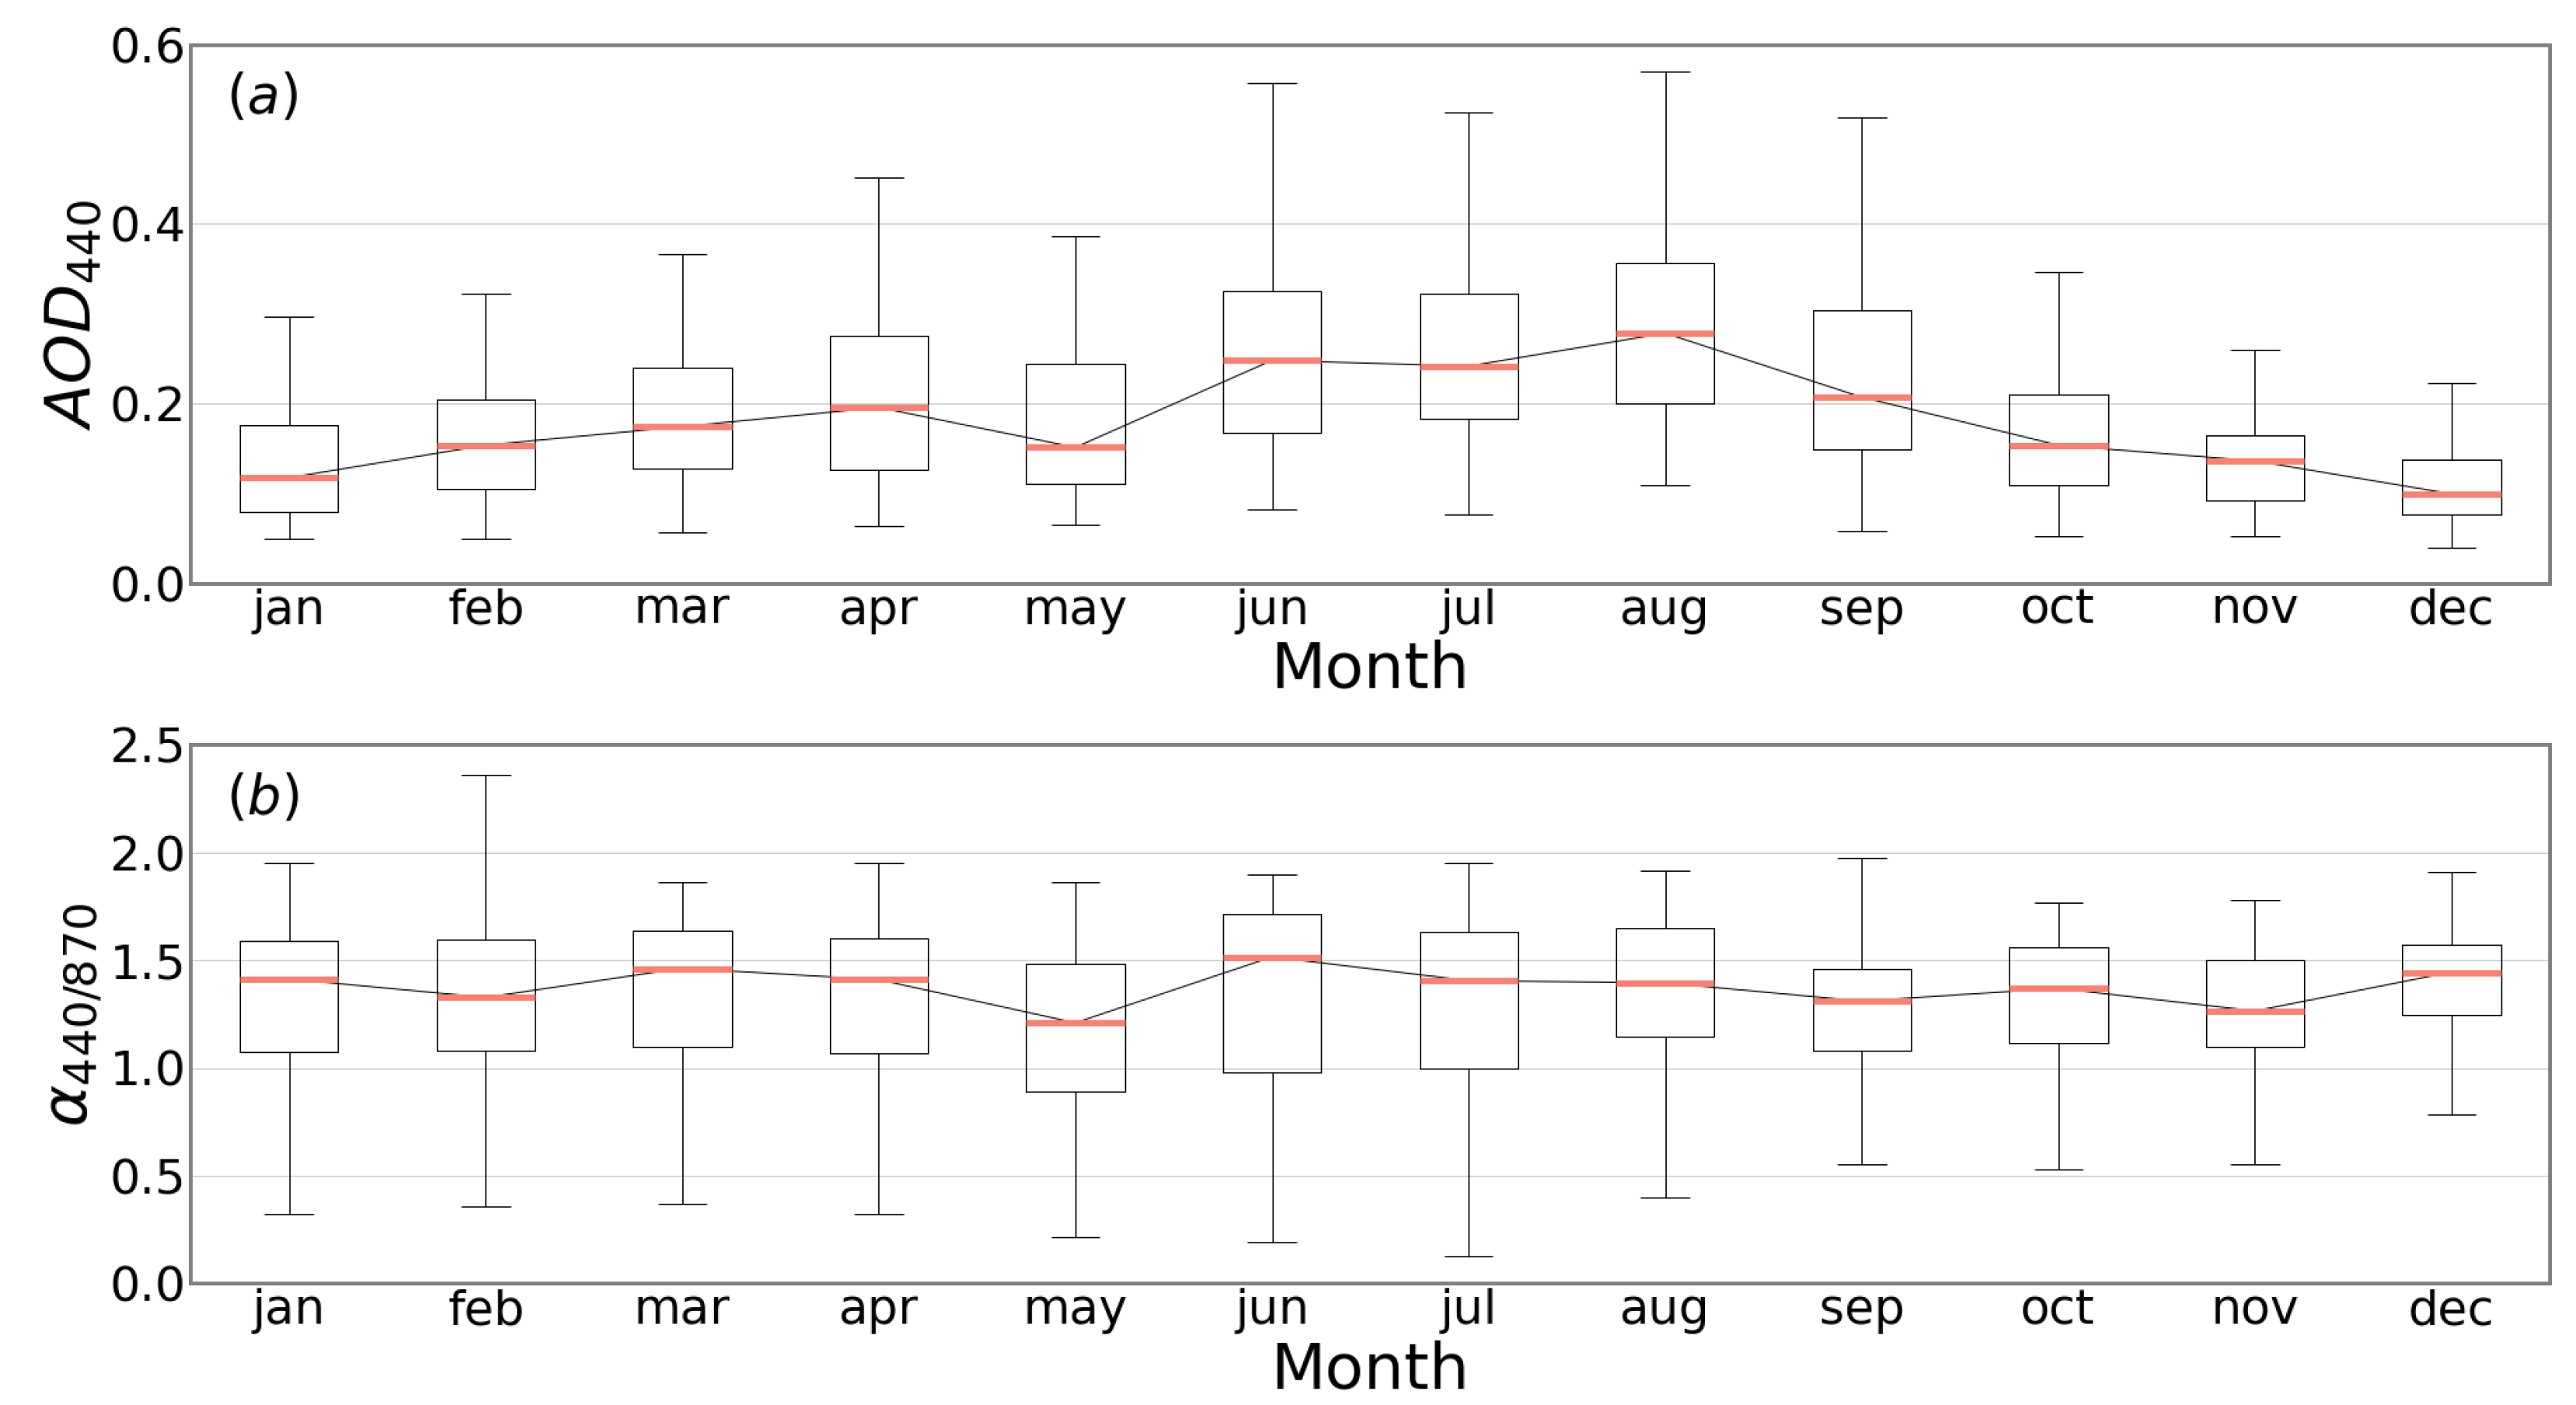
Figure 6 reports the boxplots obtained from daily data in each month of AOD440 and α440/870 over a period of five years. AOD440 shows a pronounced seasonality, reaching the highest median value of 0.27 in August, whereas a minimum value of 0.10 is achieved in December. The same behavior is observed for the lunar data, with AOD440 maximum and minimum values in the same months, equal to a median of 0.26 in August and 0.11 in December, respectively. This result is in good agreement with that observed at the Lecce AERONET site in the years 2016–2019 [51], suggesting a rather typical feature of the Mediterranean area: during spring and summer, dust events and biomass burning episodes lead to larger AOD, while during late autumn and winter, the atmosphere is clearer due to the higher frequency of rainy days [20,43]. Instead, α440/870 does not show a clear seasonal trend, sitting at values between 1.2 and 1.5 for all of the year. For lunar data, α440/870 has a minimum in May, with a median of 1.1, and the highest peak in August, with a median of 1.6.
The sun and lunar AOD behavior can likely result from contributing causes linked to an increase in the frequency of the Saharan dust transport events [44], which carry coarse particles in the atmosphere, and of the fire events [43]. Moreover, the seasonal rise of solar flux can favor formation of secondary particles by photochemical processes [52] producing fine particles in the atmospheric column that lead to a rise in the AOD440. Monthly median values of α440/870 resulted in larger than 1 according to a prevailing fine-particle fraction in the atmospheric column. The α440/870 values are higher during winter consistently with both the lower frequency of Saharan dust events in such a period and the larger concentration of fine aerosols related to urban traffic and domestic heating. Lower α440/870 values were measured in May, probably as a consequence of an increased coarse particles fraction arising from dust or marine aerosol transport.
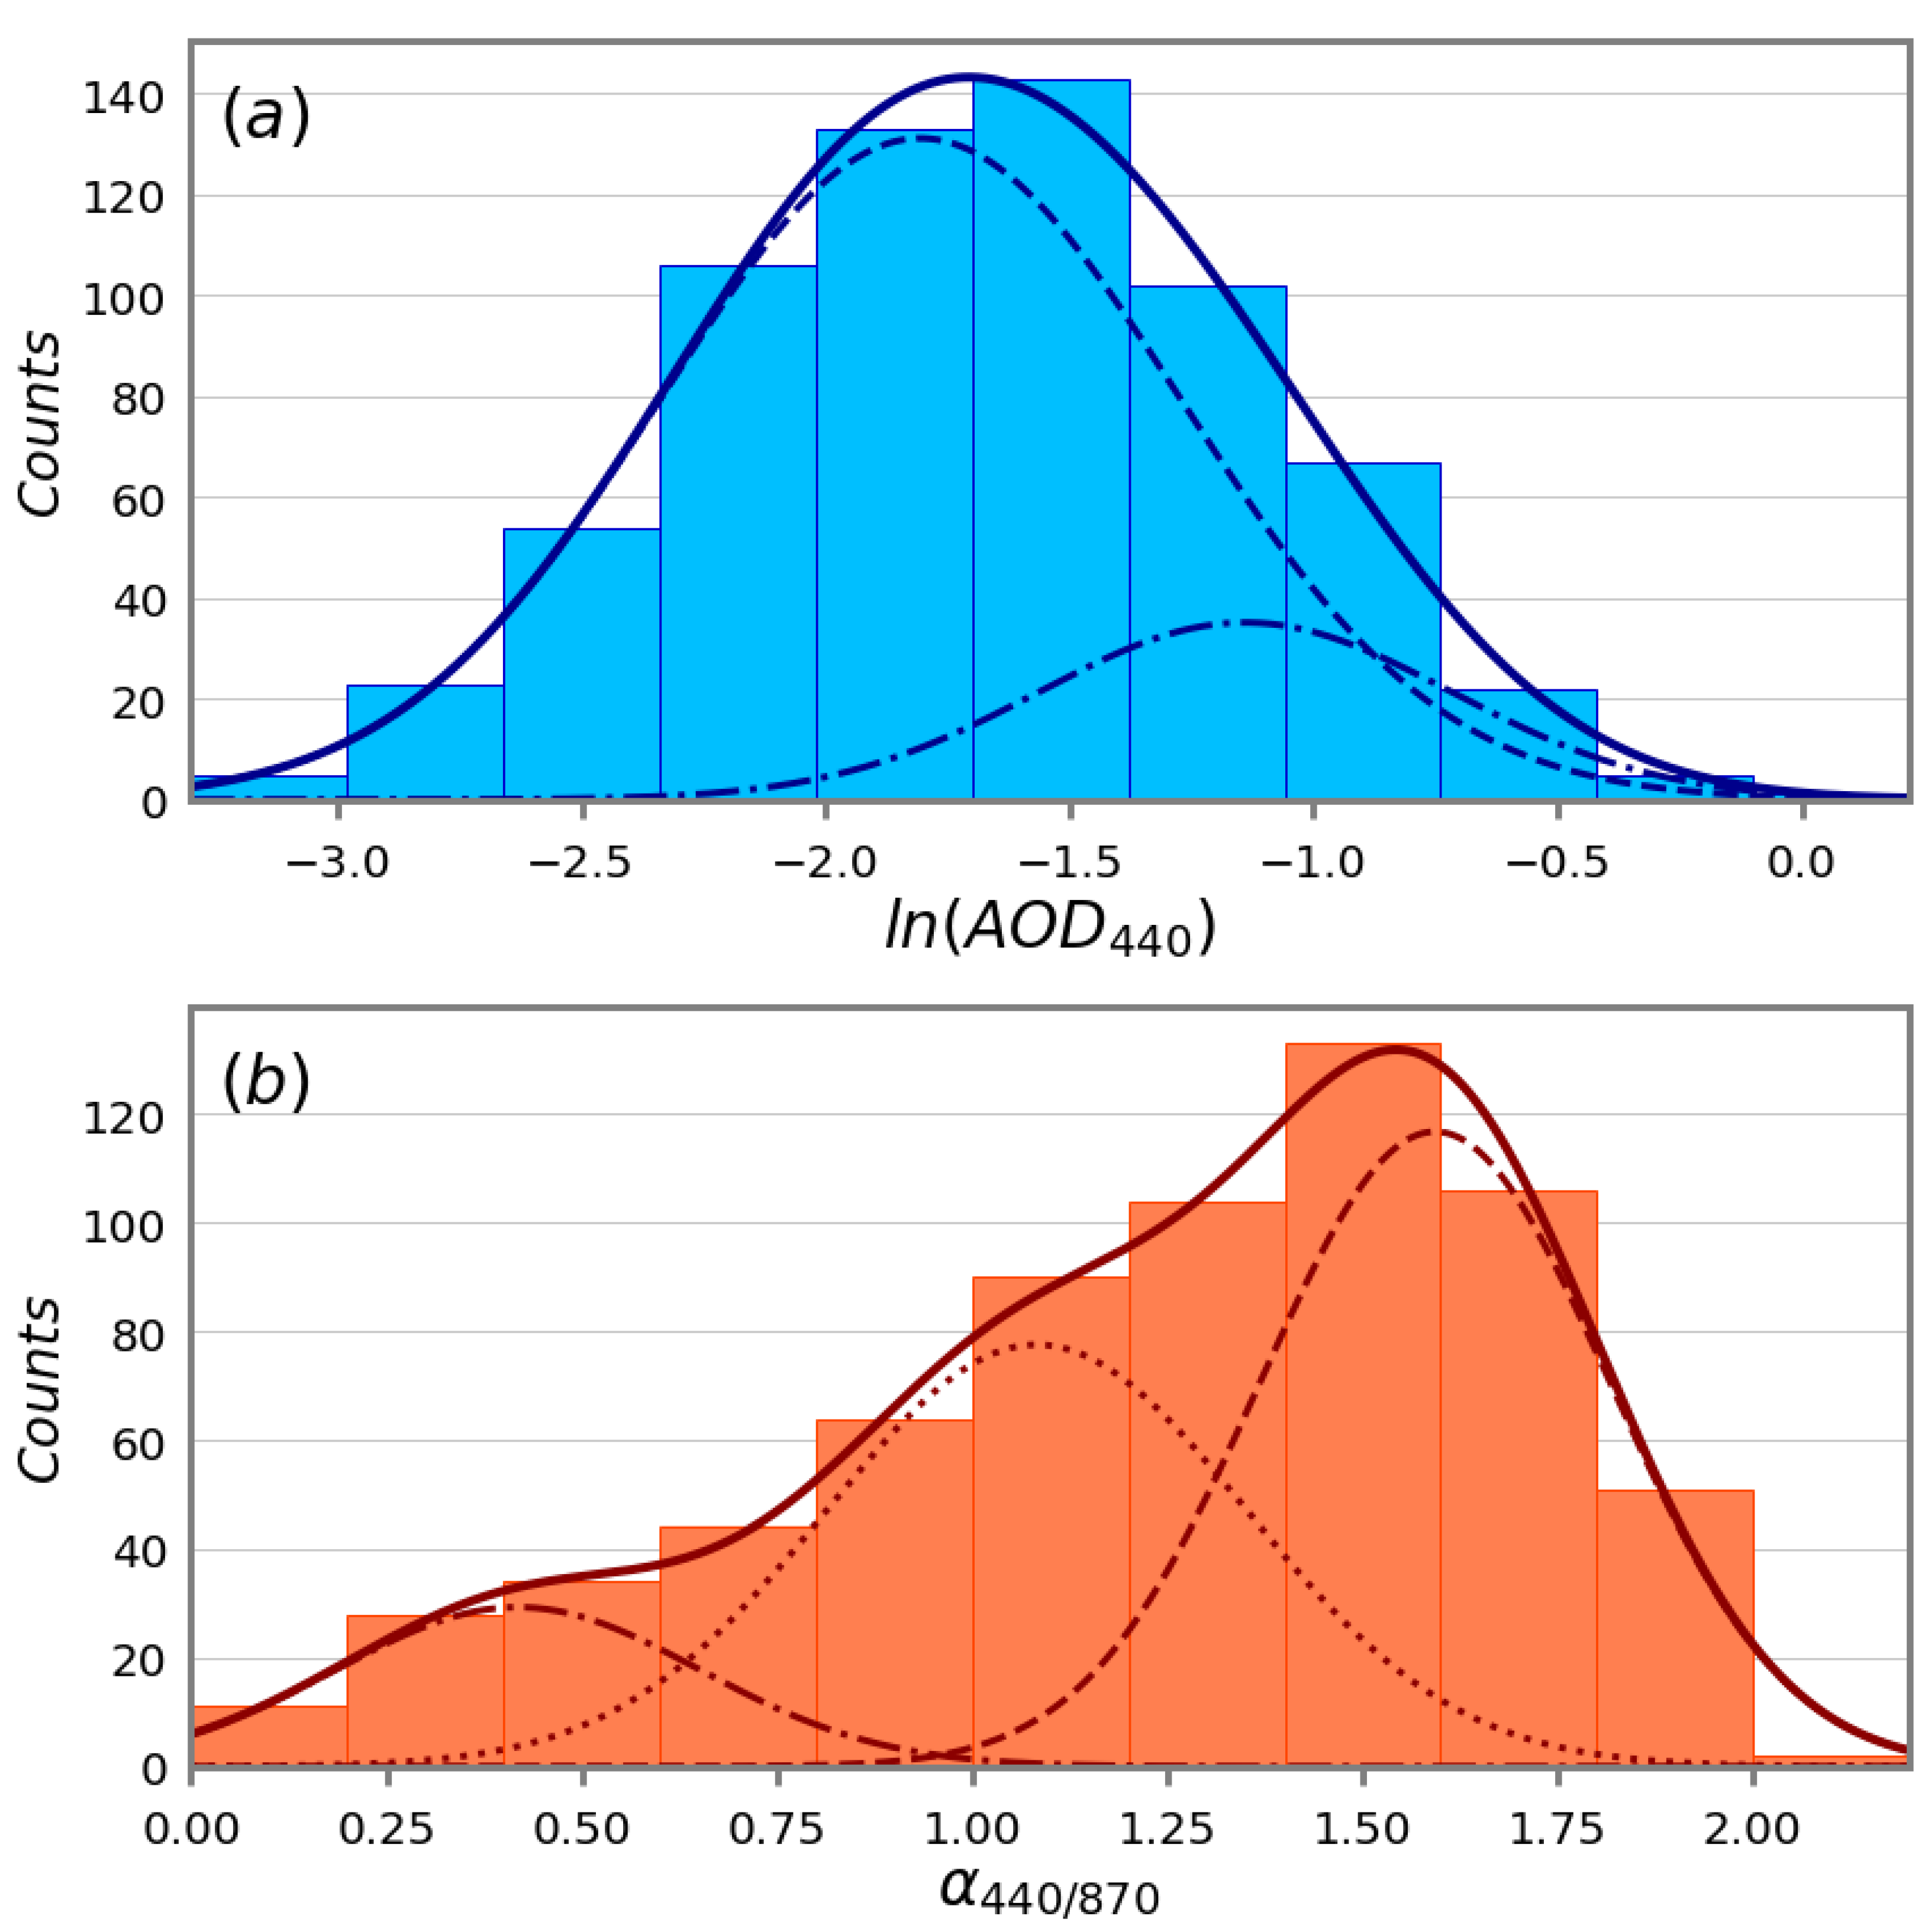
In an attempt to discriminate different aerosol contributions along the atmospheric column, frequency distribution of AOD440 and α440/870 were analyzed by taking into account that a lognormal distribution is a better reference for AOD440 statistics [53], whereas α440/870 is expected to be normally distributed [54]. Therefore, count distributions of ln (AOD440) and α440/870 were derived and fitted in terms of a superposition of various Gaussian distributions.
The results are reported in Figure 7. The count distribution of ln (AOD440) is fitted by a bimodal normal distribution (solid line in Figure 7a), whose centers at −1.83 ± 0.05 and −1.15 ± 0.03 correspond to AOD440 values of 0.16 ± 0.01 and 0.31 ± 0.01. The corresponding standard deviations are 1.08 and 0.51, respectively. The first mode (dashed line) includes most of the data and corresponds to typical AOD440 values observed in clear atmospheric conditions. Conversely, the second mode (dashed-dotted line), less populated, corresponds to very high aerosol content (higher AOD440 values) due to particularly high turbidity episodes such as biomass burning, generating fine mode particles in the atmosphere, or Saharan dust transport, characterized by particles mainly in coarse mode. The count distribution of α440/870 is well fitted by a three-modal normal distribution (solid line in Figure 7b), centered at 0.57 ± 0.07, 1.26 ± 0.07 and 1.63 ± 0.03 and with standard deviations of 0.49, 0.48 and 0.34, respectively. The mode centered at 0.57 (dotted line) corresponds to aerosol mainly in coarse mode, such as long-range transported dust aerosol from the African region or sea salt aerosol due to the closeness of the Mediterranean Sea. Pure marine aerosol is characterized by low α values corresponding to a coarse component typically with values of α440/870 < 0.6 [21]. Conversely, the mode centered at 1.63 (dashed-dotted line) corresponds to local urban pollution [24] or to fine mode aerosol produced by biomass burning episodes [43] that are frequent during summer, both usually characterized by a fine component with α440/870 > 1.5. The most populated mode is the one centered at 1.26 (dashed line), corresponding to background conditions associated with continental polluted aerosol mixed with sea salt aerosol.
The same analysis carried out for lunar data is in agreement with these results, as shown in Figure 8. The ln(AOD440) is again well fitted by a bimodal normal distribution (solid line in Figure 8a) with centers at −1.8 ± 0.5 (dashed line) and −1.1 ± 0.7 (dashed-dotted line) and standard deviations of 1.06 and 0.85. These central values of ln(AOD440) correspond to AOD440 of 0.16 ± 0.08 and 0.3 ± 0.2, respectively. α440/870 is fitted by a three-modal normal distribution centered at 0.4 ± 0.3 (dotted line), 1.1 ± 0.2 (dashed line) and 1.6 ± 0.1 (dashed-dotted line). The corresponding values of the standard deviation are standard deviations of 0.4, 0.5 and 0.4, respectively. The same conclusions on the aerosol composition of the most populated modes for solar data can be deduced for lunar ones.
Multimode frequency distributions of AOD440 and α440/870 were observed in different European AERONET stations, suggesting similar prevalent aerosol contributions in the measurement area. As an example in Potenza [24], the contribution of different aerosol types was quantified using a k-mean cluster analysis based on AOD and α frequency distributions that could identify, in the AOD-α scatter plot, three prevailing aerosol types classified as dust, continental, and maritime, and a fourth one classified as mixed. More recently, from two years of AERONET measurements carried out over Sofia City, Bulgaria, aerosol main components are identified using AOD-α-based aerosol classifications starting from the AOD and α frequency distributions with two AOD and three α modes [55].
3.2. Dust Aerosol Characterization
In order to identify AOD440 and α440/870 values correlated to a particular aerosol typology, data corresponding to Saharan dust events were selected. Saharan dust transport is a recurrent event over the Mediterranean area, and this is especially true for Southern Italy [22,28,33]. From the identification of Saharan dust transport events using the HYSPLIT and BSC-DREAM8b models, the frequency of days with Saharan dust presence per year in Naples varies between 17% and 41% over the 2017–2021 period.
The annual mean values of AOD440 and α440/870 registered for dust (SD) and no dust (NSD) days, for solar data, are summarized in Table 2, where N indicates the number of measured samples. The table evidences that the presence of Saharan dust leads to higher AOD440 values (annual average > 0.2) and to lower α440/870 values (annual average < 1.1), due to a larger contribution of coarse aerosol in the atmospheric column. We note that normally coarse-mode aerosols have Angstrom exponent < 0.5 [49]; therefore, Angstrom exponent values measured during SD mostly represent mixed-mode aerosols according to the geographical location of the measurement area, which is characterized by a large diversity of aerosols co-existing in the atmosphere. A small fraction of dust aerosols can also be found in the fine fraction, thus explaining the values larger than 0.5 of the retrieved α440/870. The AOD440 increment between SD and NSD days is about 20–30%, while the α440/870 reduction is about 20–50%. The same variation in percentage is also confirmed by the lunar data.
Seasonal averages of AOD440 and α440/870 showed larger differences between SD and NSD days during summer and spring, according to the larger frequency of more intense dust events observed in the warm season [44].
Further insights on the aerosol typology can be gained by resorting to the scatter plot of α440/870 vs. AOD440 [22,24]. The methodology that uses the combination of these two parameters to gain information on dominant aerosol type has already been used in many previous studies [21,33,55,56,57,58]. It is a useful method that can discriminate different classes of aerosols.
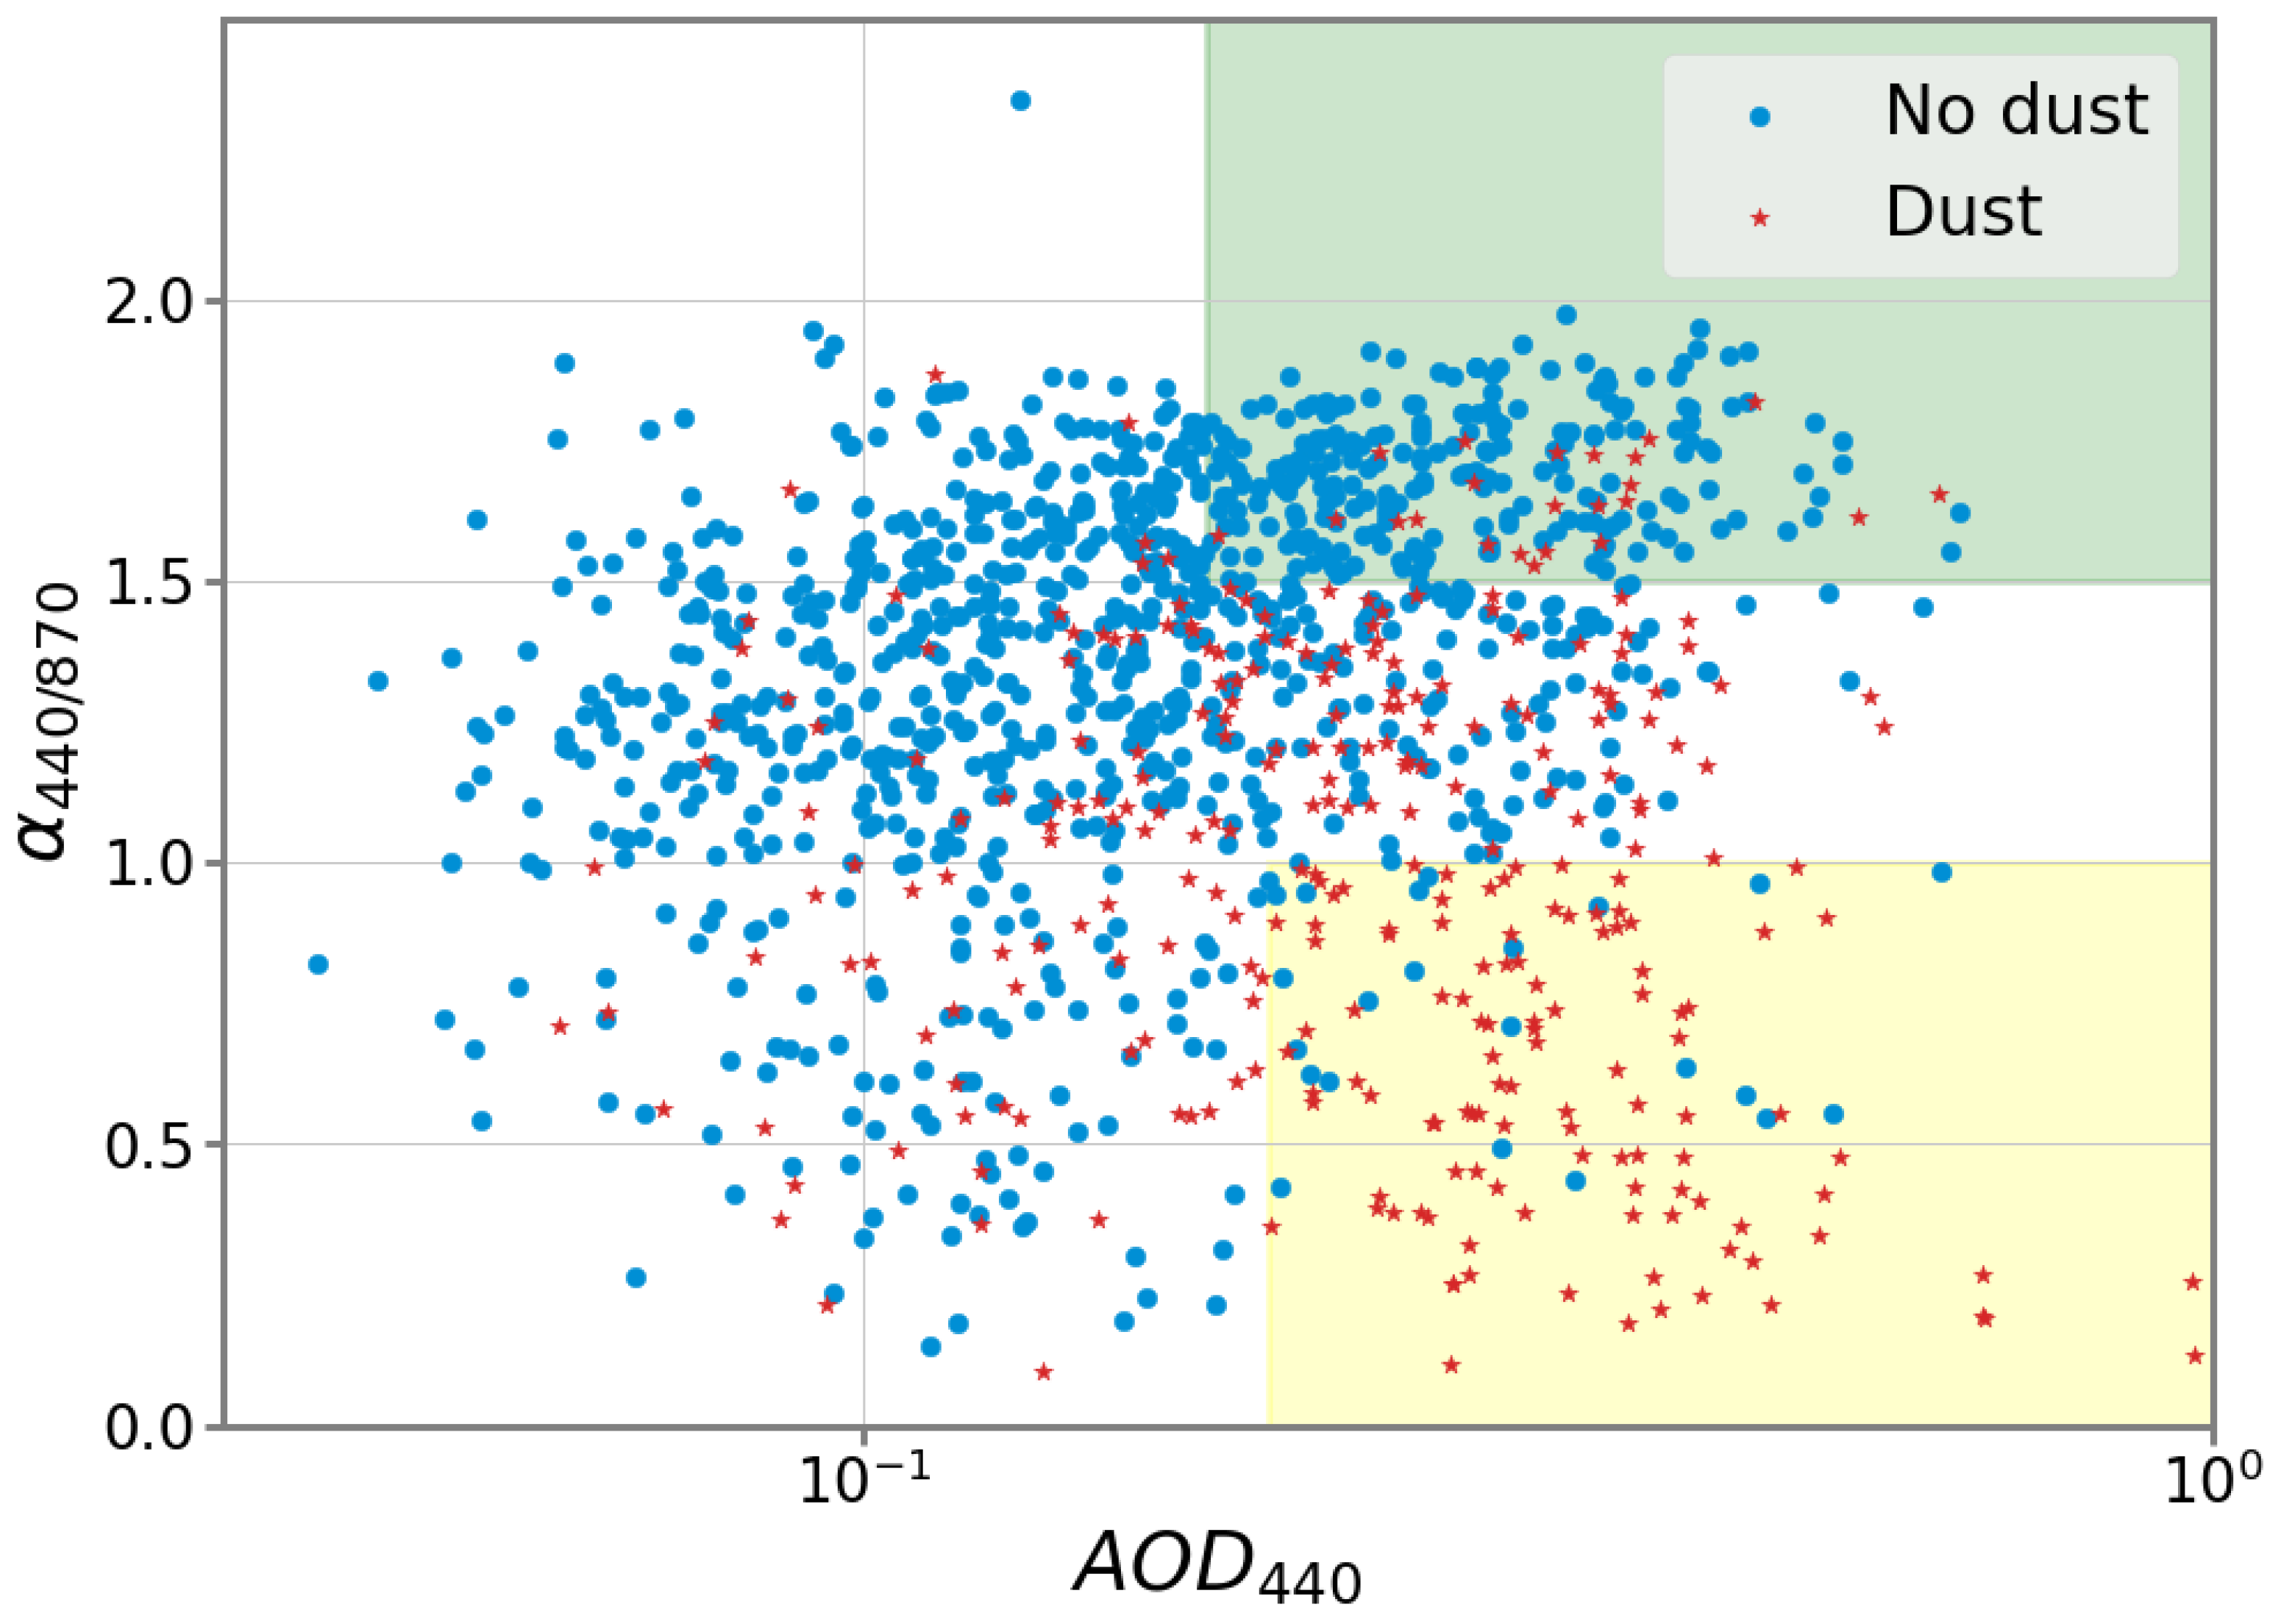
We hereafter use the scatter plot of α440/870 vs. AOD440, based on the results of the count distributions reported in Figure 7, together with model outcomes in order to define different threshold values useful in identifying the different classes of aerosol typology prevailing in the atmospheric column over the Naples area.
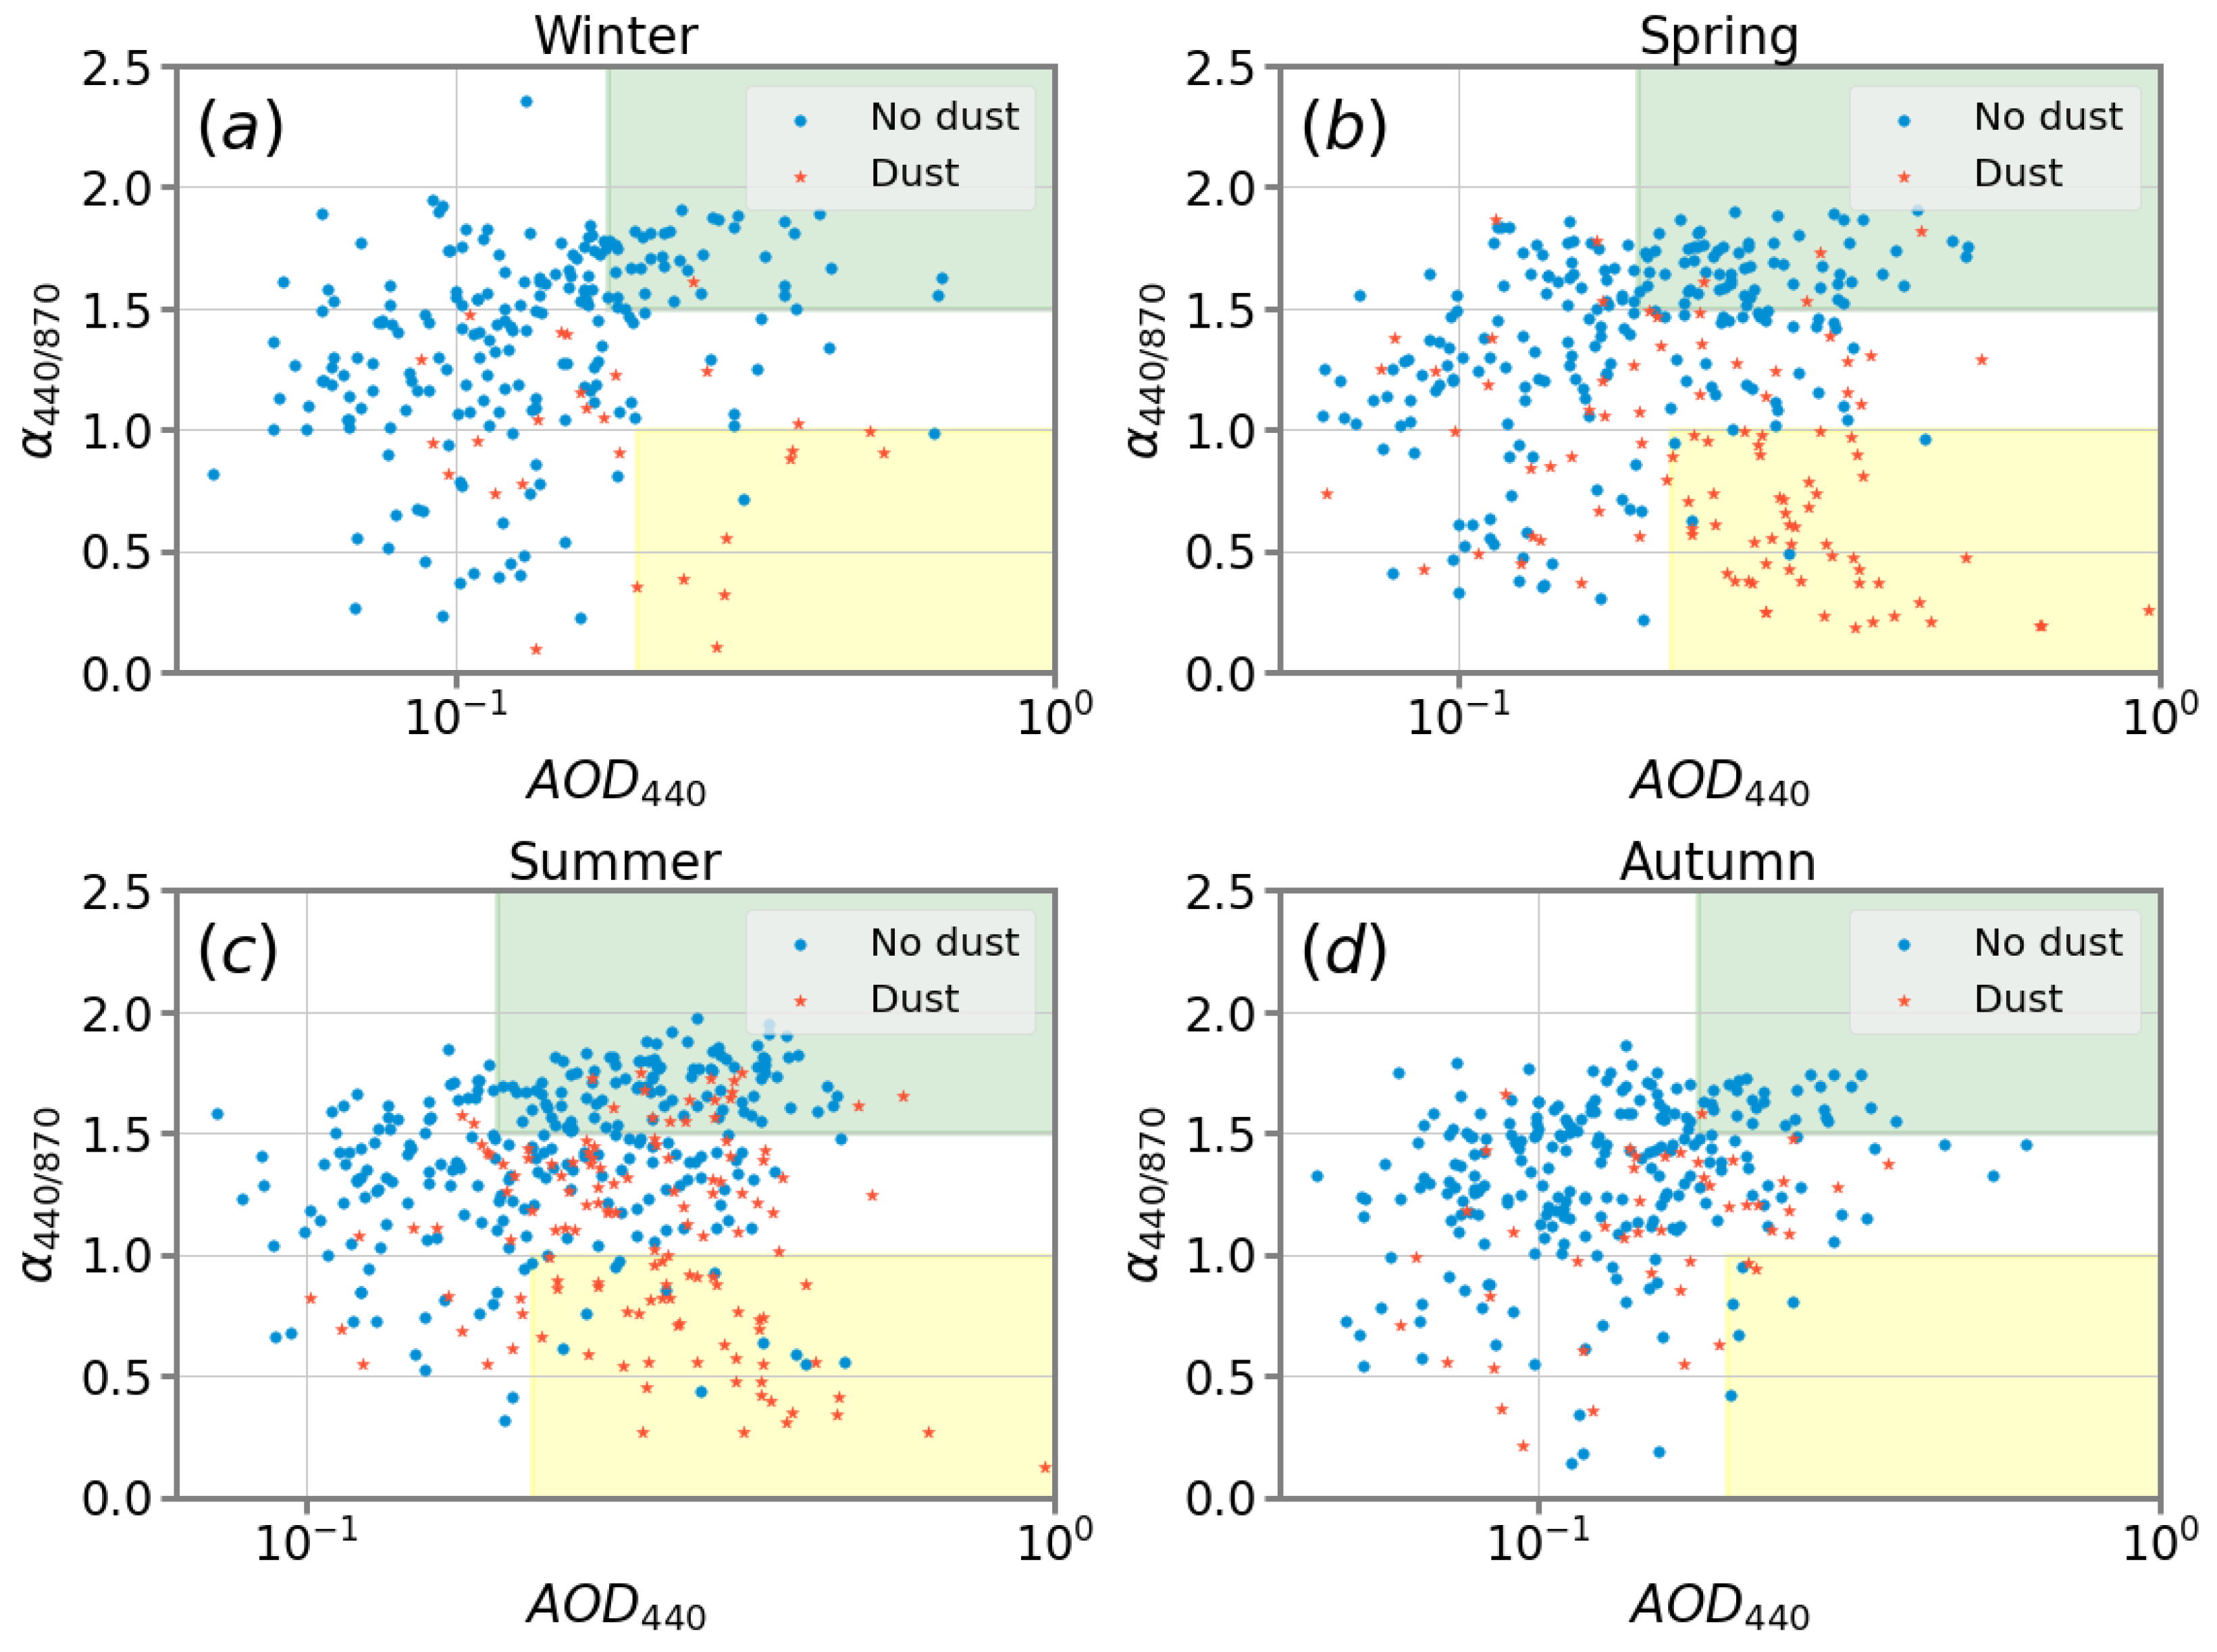
These plots are reported in Figure 9, and they refer to all the data over the five-year period, and Figure 10 displays the data collected according to the corresponding season. To improve their readability, the plots are displayed in semi-log scales, i.e., a linear scale is used for α440/870 and a log-scale for AOD440. Each datapoint represents a daily mean; meanwhile, the different colors distinguish between SD and NSD days. In all plots, most the data lies in the central-upper left part of the plot, addressing the typical (α440/870, AOD440) values of the observational site. The values of such a region are consistent with the predominant components present in the histograms reported in Figure 7, which evidence that the most populated modes correspond to an AOD440 of 0.16 and an α440/870 of 1.26. Such observation addresses the typical atmospheric conditions of the site and corresponds to a predominance of marine aerosol, coming from the near Mediterranean Sea, mixed with polluted continental aerosol of an urban and industrial site. Two areas, mostly populated during warm seasons, were identified in the plots: the first one (green rectangle) corresponding to AOD440 > 0.18 and α440/870 > 1.5, and the second (yellow rectangle) corresponding to AOD440 > 0.2 and α440/870 < 1. The green area thresholds, according to Ref. [59], identify biomass burning aerosols; 70% of the datapoints in this area belong to spring or summer, evidencing a seasonality. Biomass burning episodes are more frequent during warm seasons. The corresponding values agree with those measured during multiple huge fires that occurred on Mount Vesuvius (Italy) on 2017 [43], whose results evidenced the presence of fine-mode aerosol with large mean values of AOD440 > 0.25 and α440/870 > 1.5 above the measurement area. This suggests that in the count distribution reported in Figure 7, the AOD440 mode centered at 0.31 and the α440/870 mode centered at 1.63 likely correspond to biomass burning aerosol, together with a presence of fine continental aerosol. Conversely, the yellow region corresponding to high AOD440 and low α440/870 values can be linked to mineral dust aerosol as evidenced by a larger density of data associated with Saharan dust transport events. A clear seasonality is again visible, with 86% of the datapoints belonging to spring and summer. Moreover, 82% of the datapoints in this area correspond to days in which Saharan dust presence was identified. Considering the total dust events observed during the 5 years, 23% of all dust events lie in this region, representing the most intense events that occurred during this period. The measured values correspond to the AOD440 mode centered at 0.31 and the α440/870 mode centered at 0.57.
3.3. Aerosol Microphysical Characterization
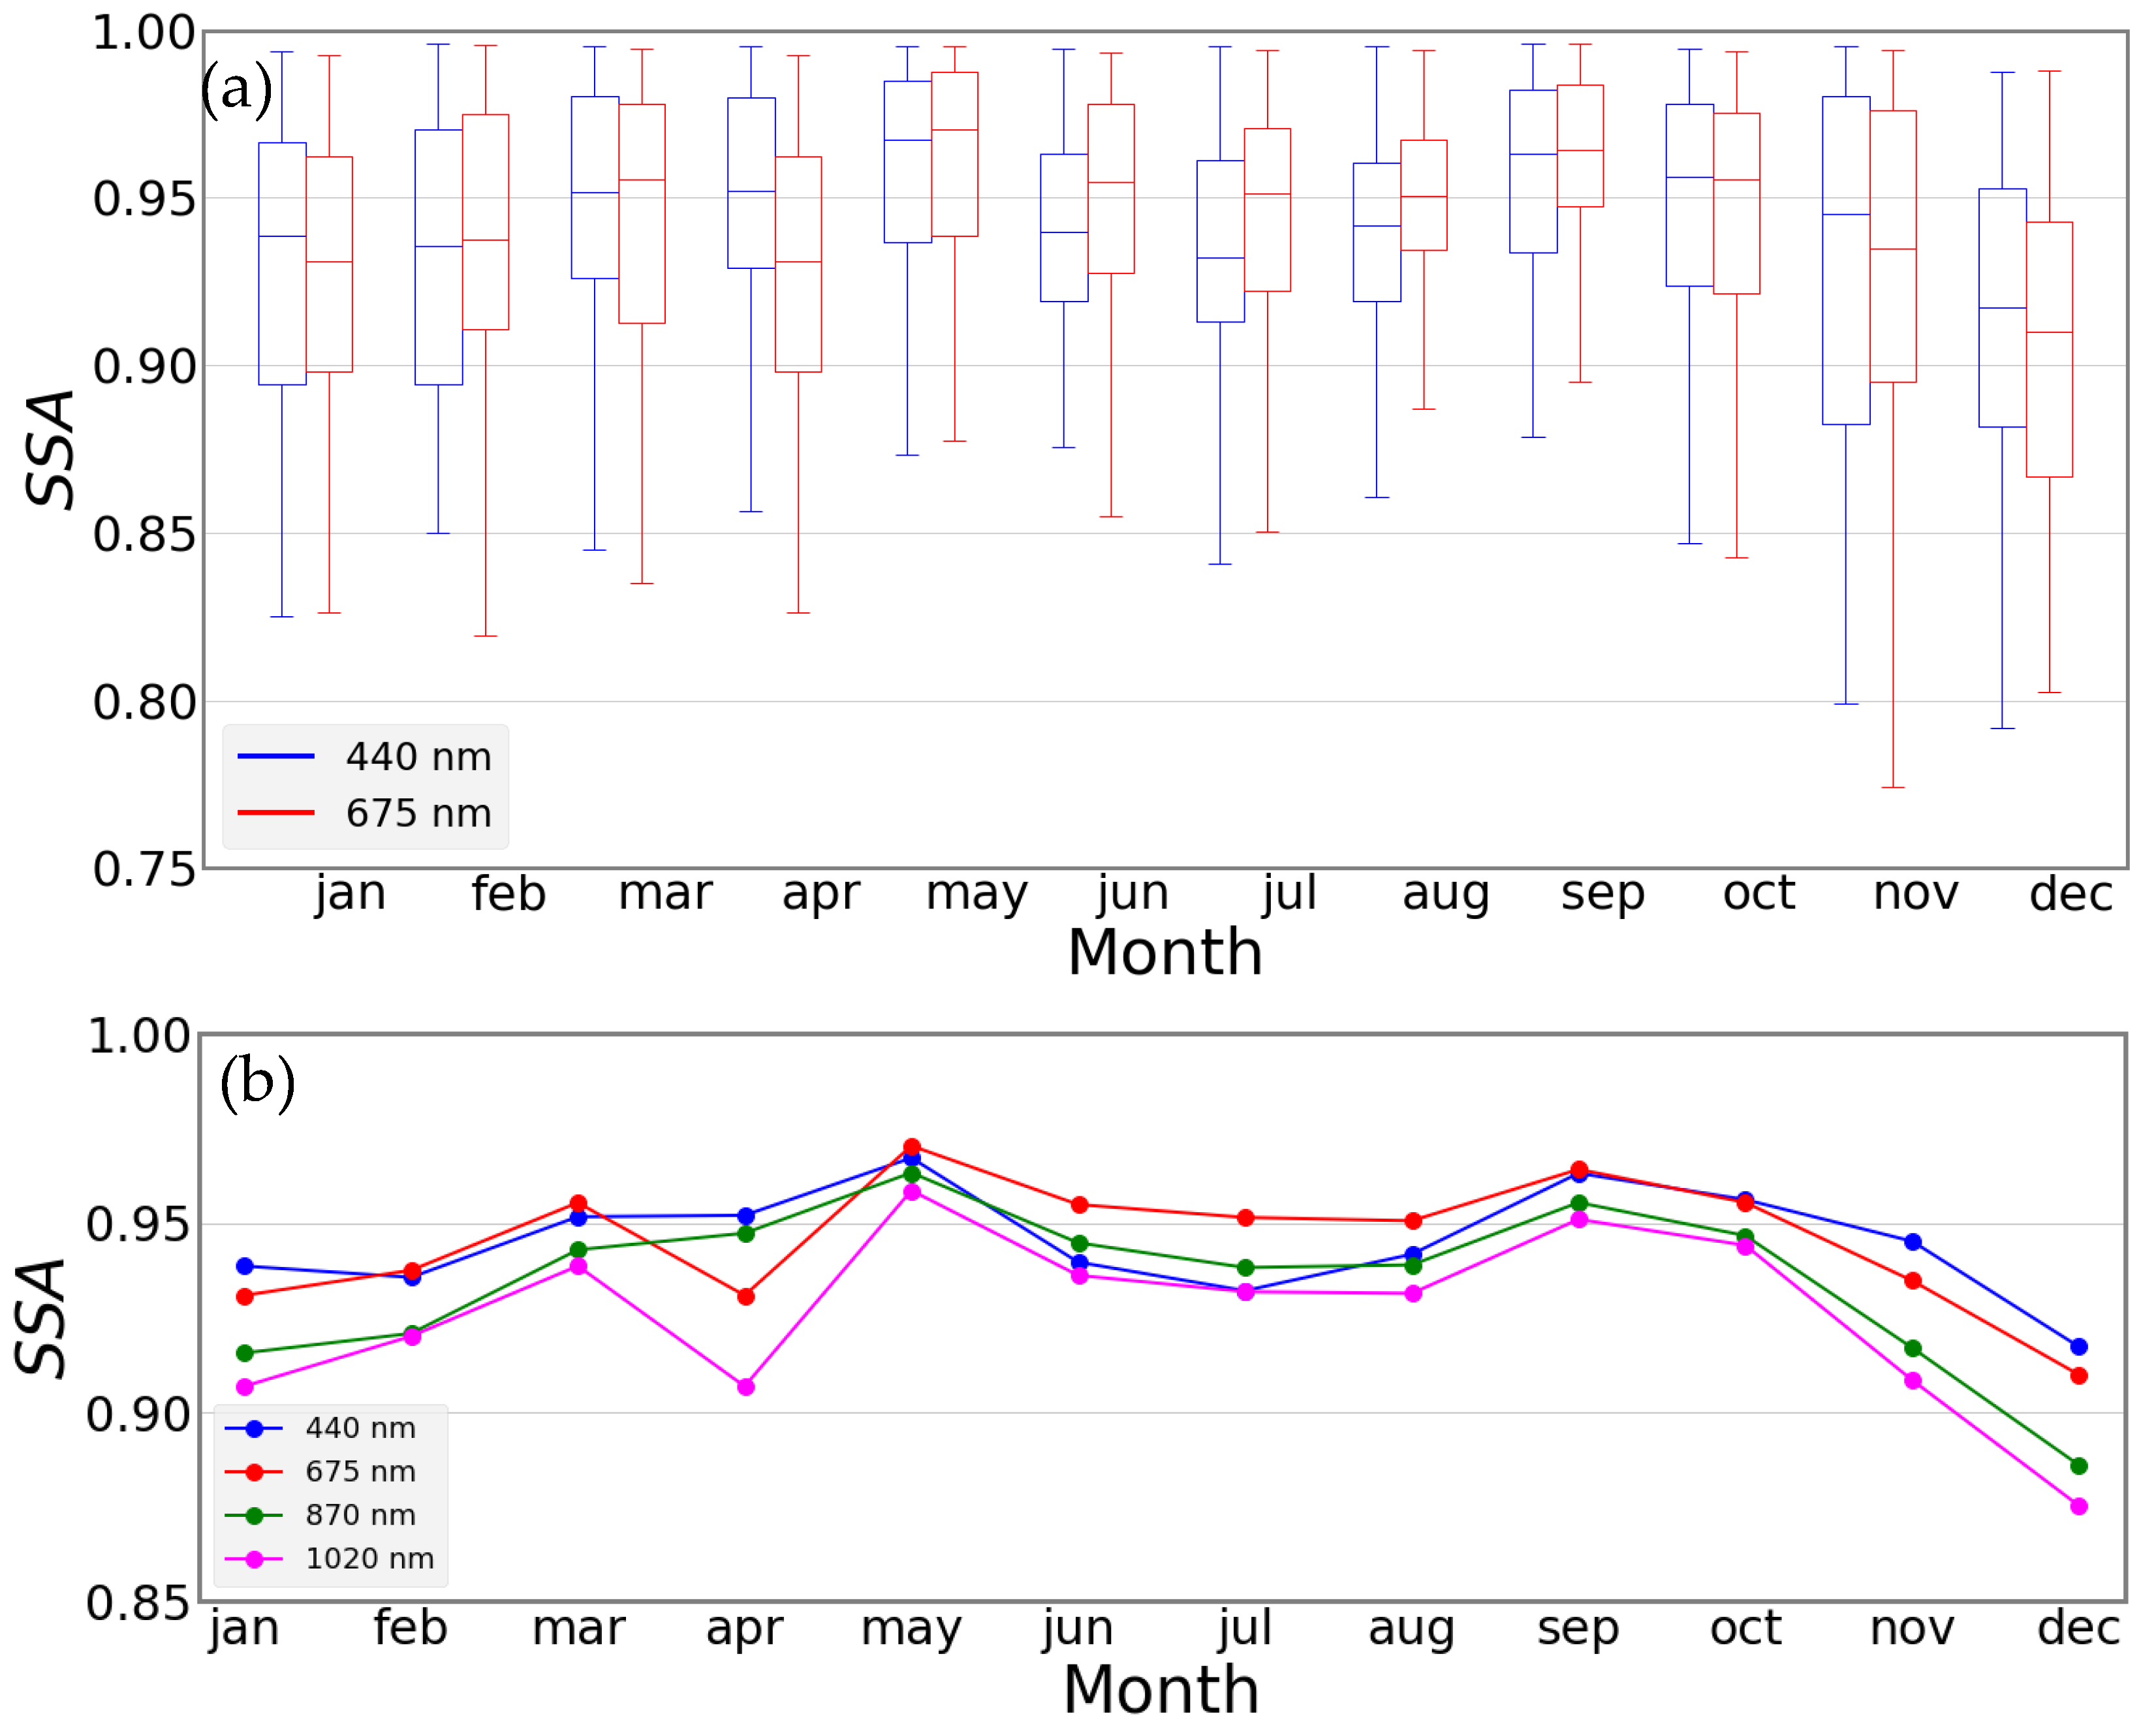
Sky radiance measurements are inverted using AERONET algorithms, retrieving aerosol features as size distribution, single scattering albedo (SSA) and complex index of refraction [38,60]. The SSA, defined as the fraction of the aerosol light scattering over the total extinction, gives information on the importance of absorption processes with respect to other extinction phenomena, such as scattering. Boxplots of SSA at 440 and 675 nm are reported in Figure 11a, whereas medians SSA values at four different wavelengths are reported in Figure 11b. The lowest values are retrieved during November and December, corresponding to more absorbing particles in the atmospheric column. The higher values are retrieved in May and September. A similar annual trend with minima and maxima occurring in cold and warm seasons, respectively, was observed over Athens, Greece [61] for the period 2008–2018. The spectral dependence of the SSA evidences an increase in the values passing from 440 to 675 nm from April to September, in agreement with a larger contribution of more aerosol absorbing at lower wavelengths in the atmospheric column [62]. Combining the SSA annual variation and spectral dependence with the AOD440 and α440/870 behavior reported in Figure 6, we can affirm that in April and May, a larger contribution of dust aerosol was observed over the Naples area, according to a larger contribution of less absorbing aerosol with larger dimension. On the other hand, the decrease in the SSA at the higher wavelength during the cold season could be linked to brown carbon aerosols and polluted dust mixtures within the urban area [63]. This is evident in particular for the cold months (November, December and January), mainly dominated by urban local pollutants (e.g., industrial activities, domestic heating, road traffic). The mean values of the SSA at 440 and 675 nm are 0.94 ± 0.05 and 0.94 ± 0.04, respectively. These values agree well with those registered in other Mediterranean urban/industrial polluted sites with moderately absorbing aerosol, according to SSA close to 0.95 ± 0.04, as reported in Ref. [25].
The real part of the refractive index does not show a seasonal behavior, while the imaginary part of the refractive index, being correlated to particle absorption, shows a seasonal behavior as expected from the SSA analysis. For 440 nm, average values of 1.47 ± 0.07 and (6.5 ± 0.2) × 10−3 were obtained for the real and imaginary parts, respectively, in agreement with previous estimates obtained for urban/polluted aerosols in the Mediterranean area.
AERONET inversion algorithms also provide the AOD at 500 nm (AOD500), separated in fine and coarse components. Following Ref. [26], which carried out an analysis for various Western Mediterranean AERONET stations, this parameter can be used to evaluate the impact of Saharan dust on the observational site. During the five-year period, the fine aerosol component always prevails over the coarse one, with the exception of two months in which Saharan dust events are particularly frequent (April 2018, June 2021). The mean AOD500 of the fine component does not change much during the five years, while that of the coarse one shows larger values in 2021. The AOD500 fine to coarse ratio, useful in estimating the prevalence of one component over the other, is larger than 2 for the period 2017–2020, while lowering to 1.65 for 2021. This last year is characterized by a larger presence of coarse particles due to a greater frequency and intensity of Saharan dust events.
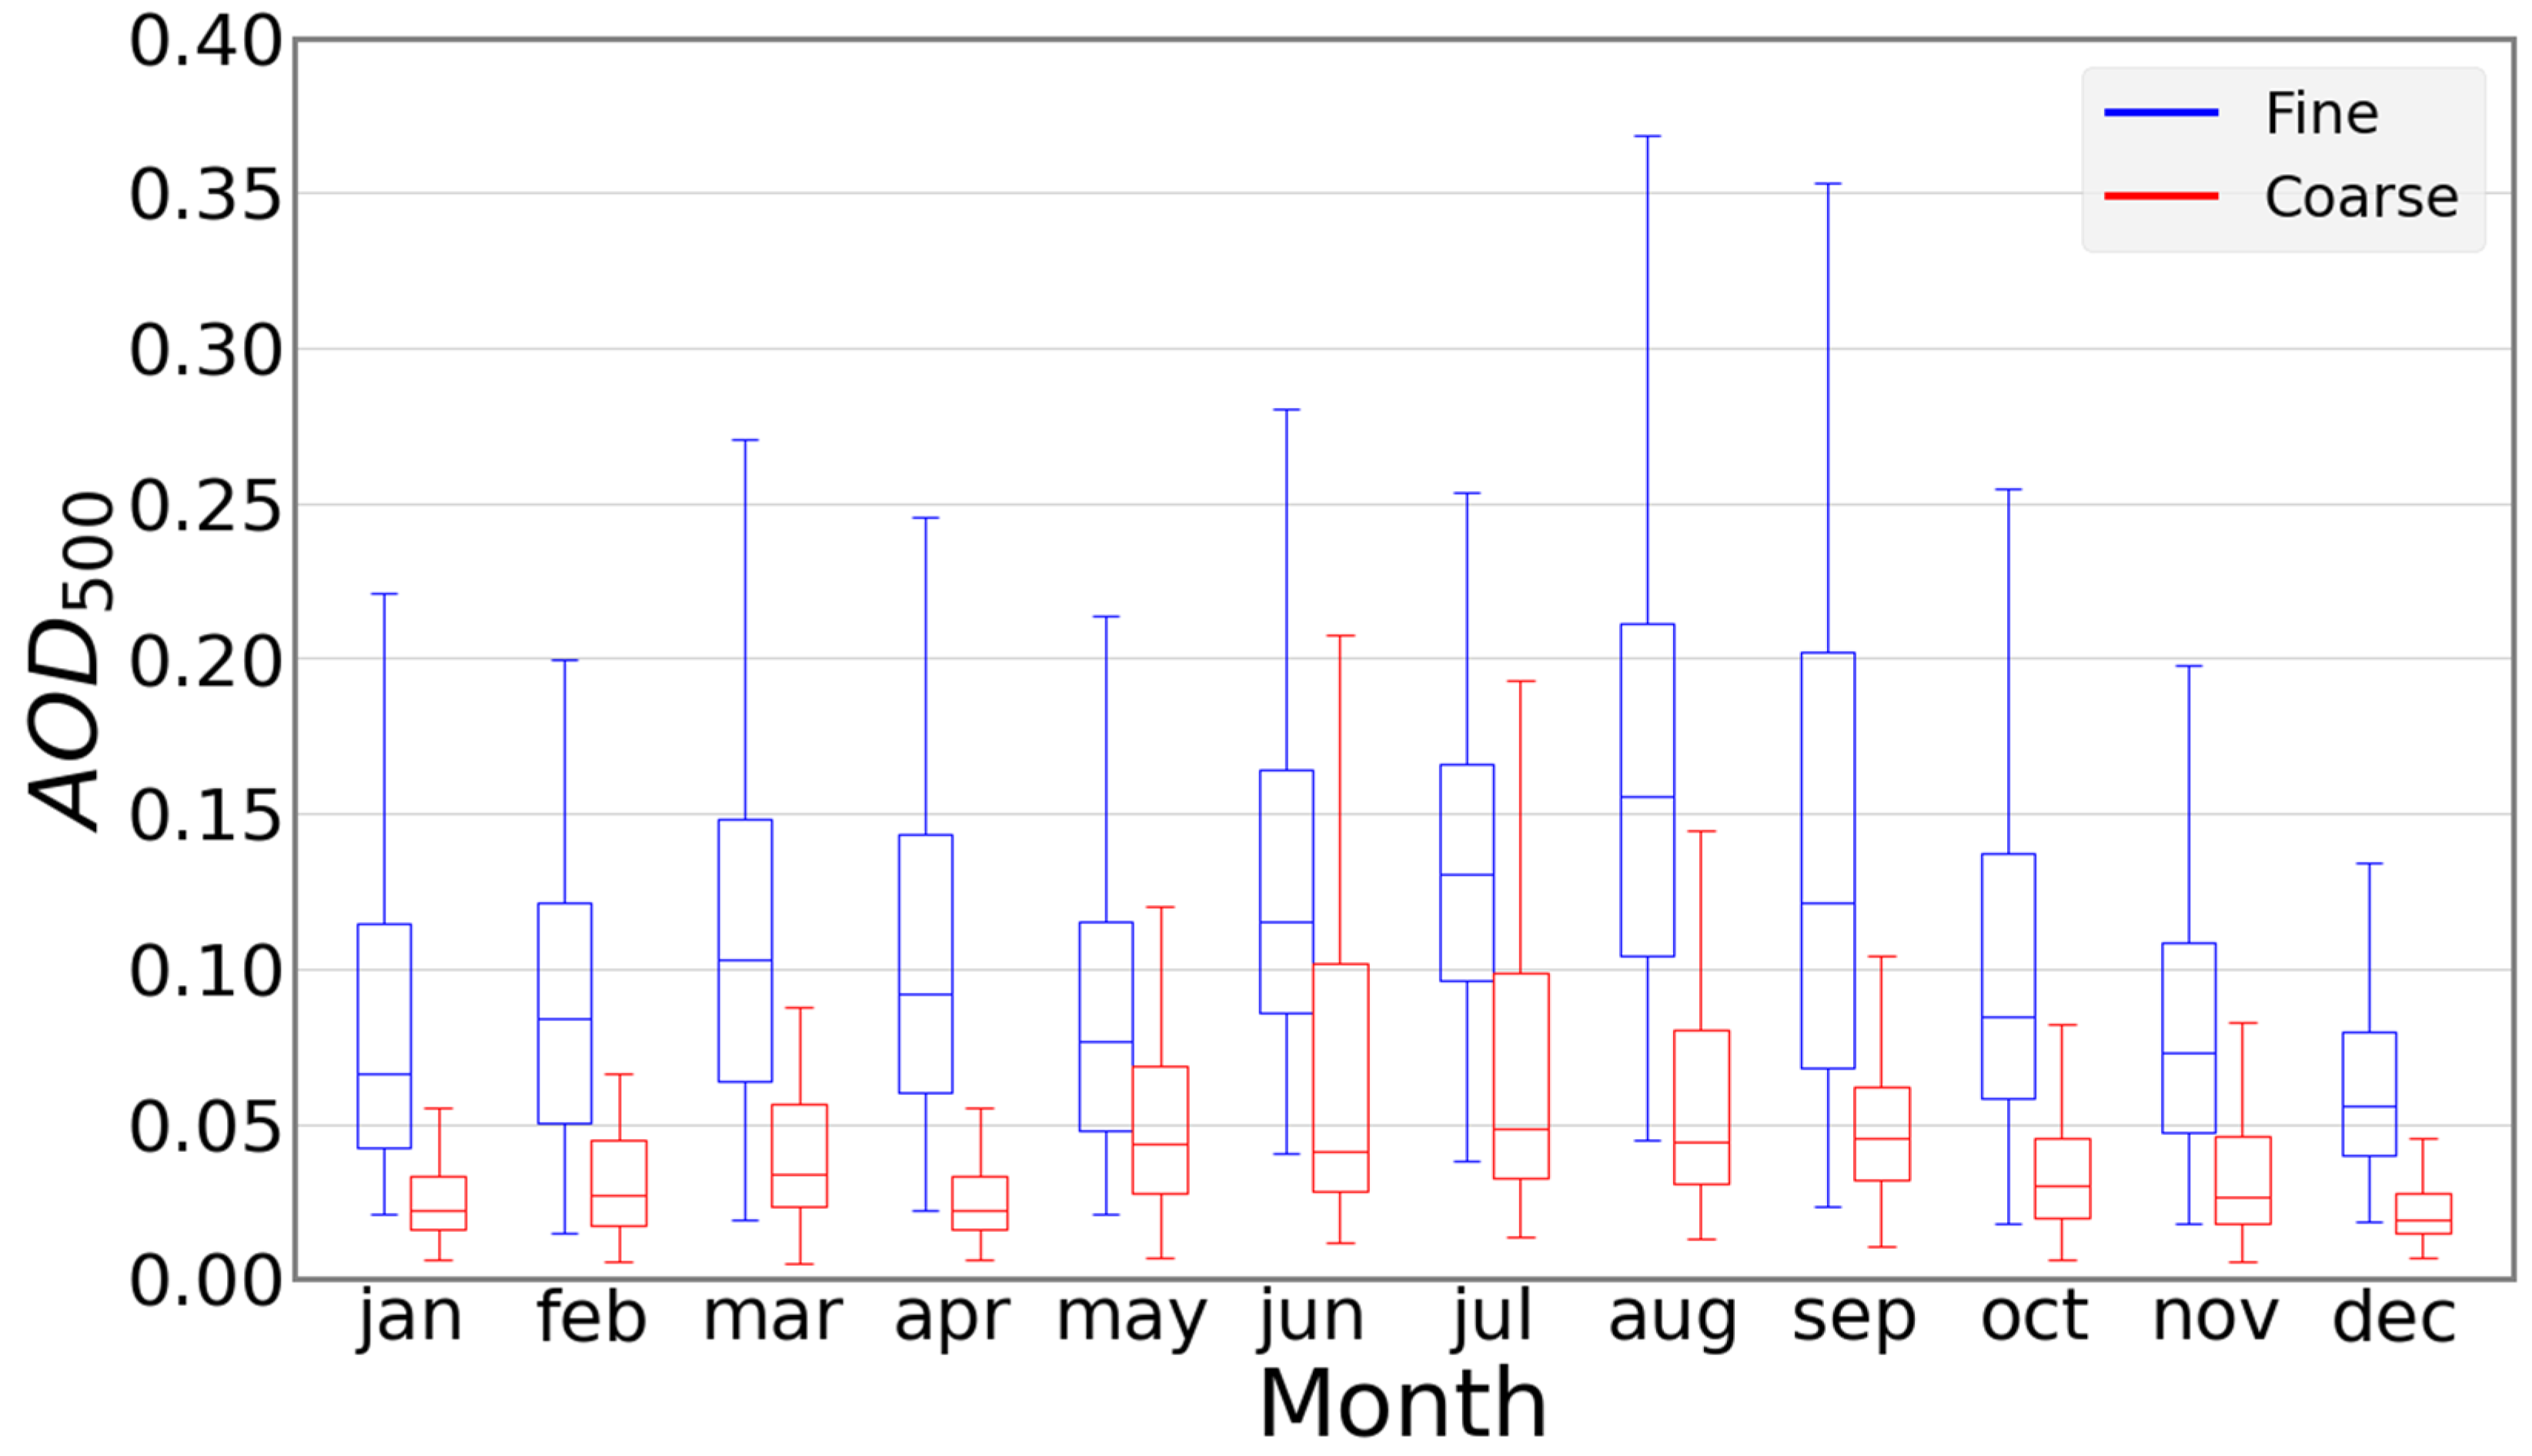
Figure 12 reports boxplots over the five years of the monthly AOD500 for both fine and coarse particles. Both components display seasonal behavior, as already observed for the total AOD440, and in each month, the AOD500 of the fine fraction is larger than that of the coarse one. This seems to evidence a typical feature of the observational site likely related to the urban character of the measurement area. Polluted and anthropogenic-mixed aerosol, generally in the accumulation mode, are characterized by higher AOD500 values being more subject to hygroscopic growth than coarse particles. For the fine component, the highest value is registered in August, in agreement with higher values of α440/870 observed during this month. Instead, the coarse component displays larger values in warm months.
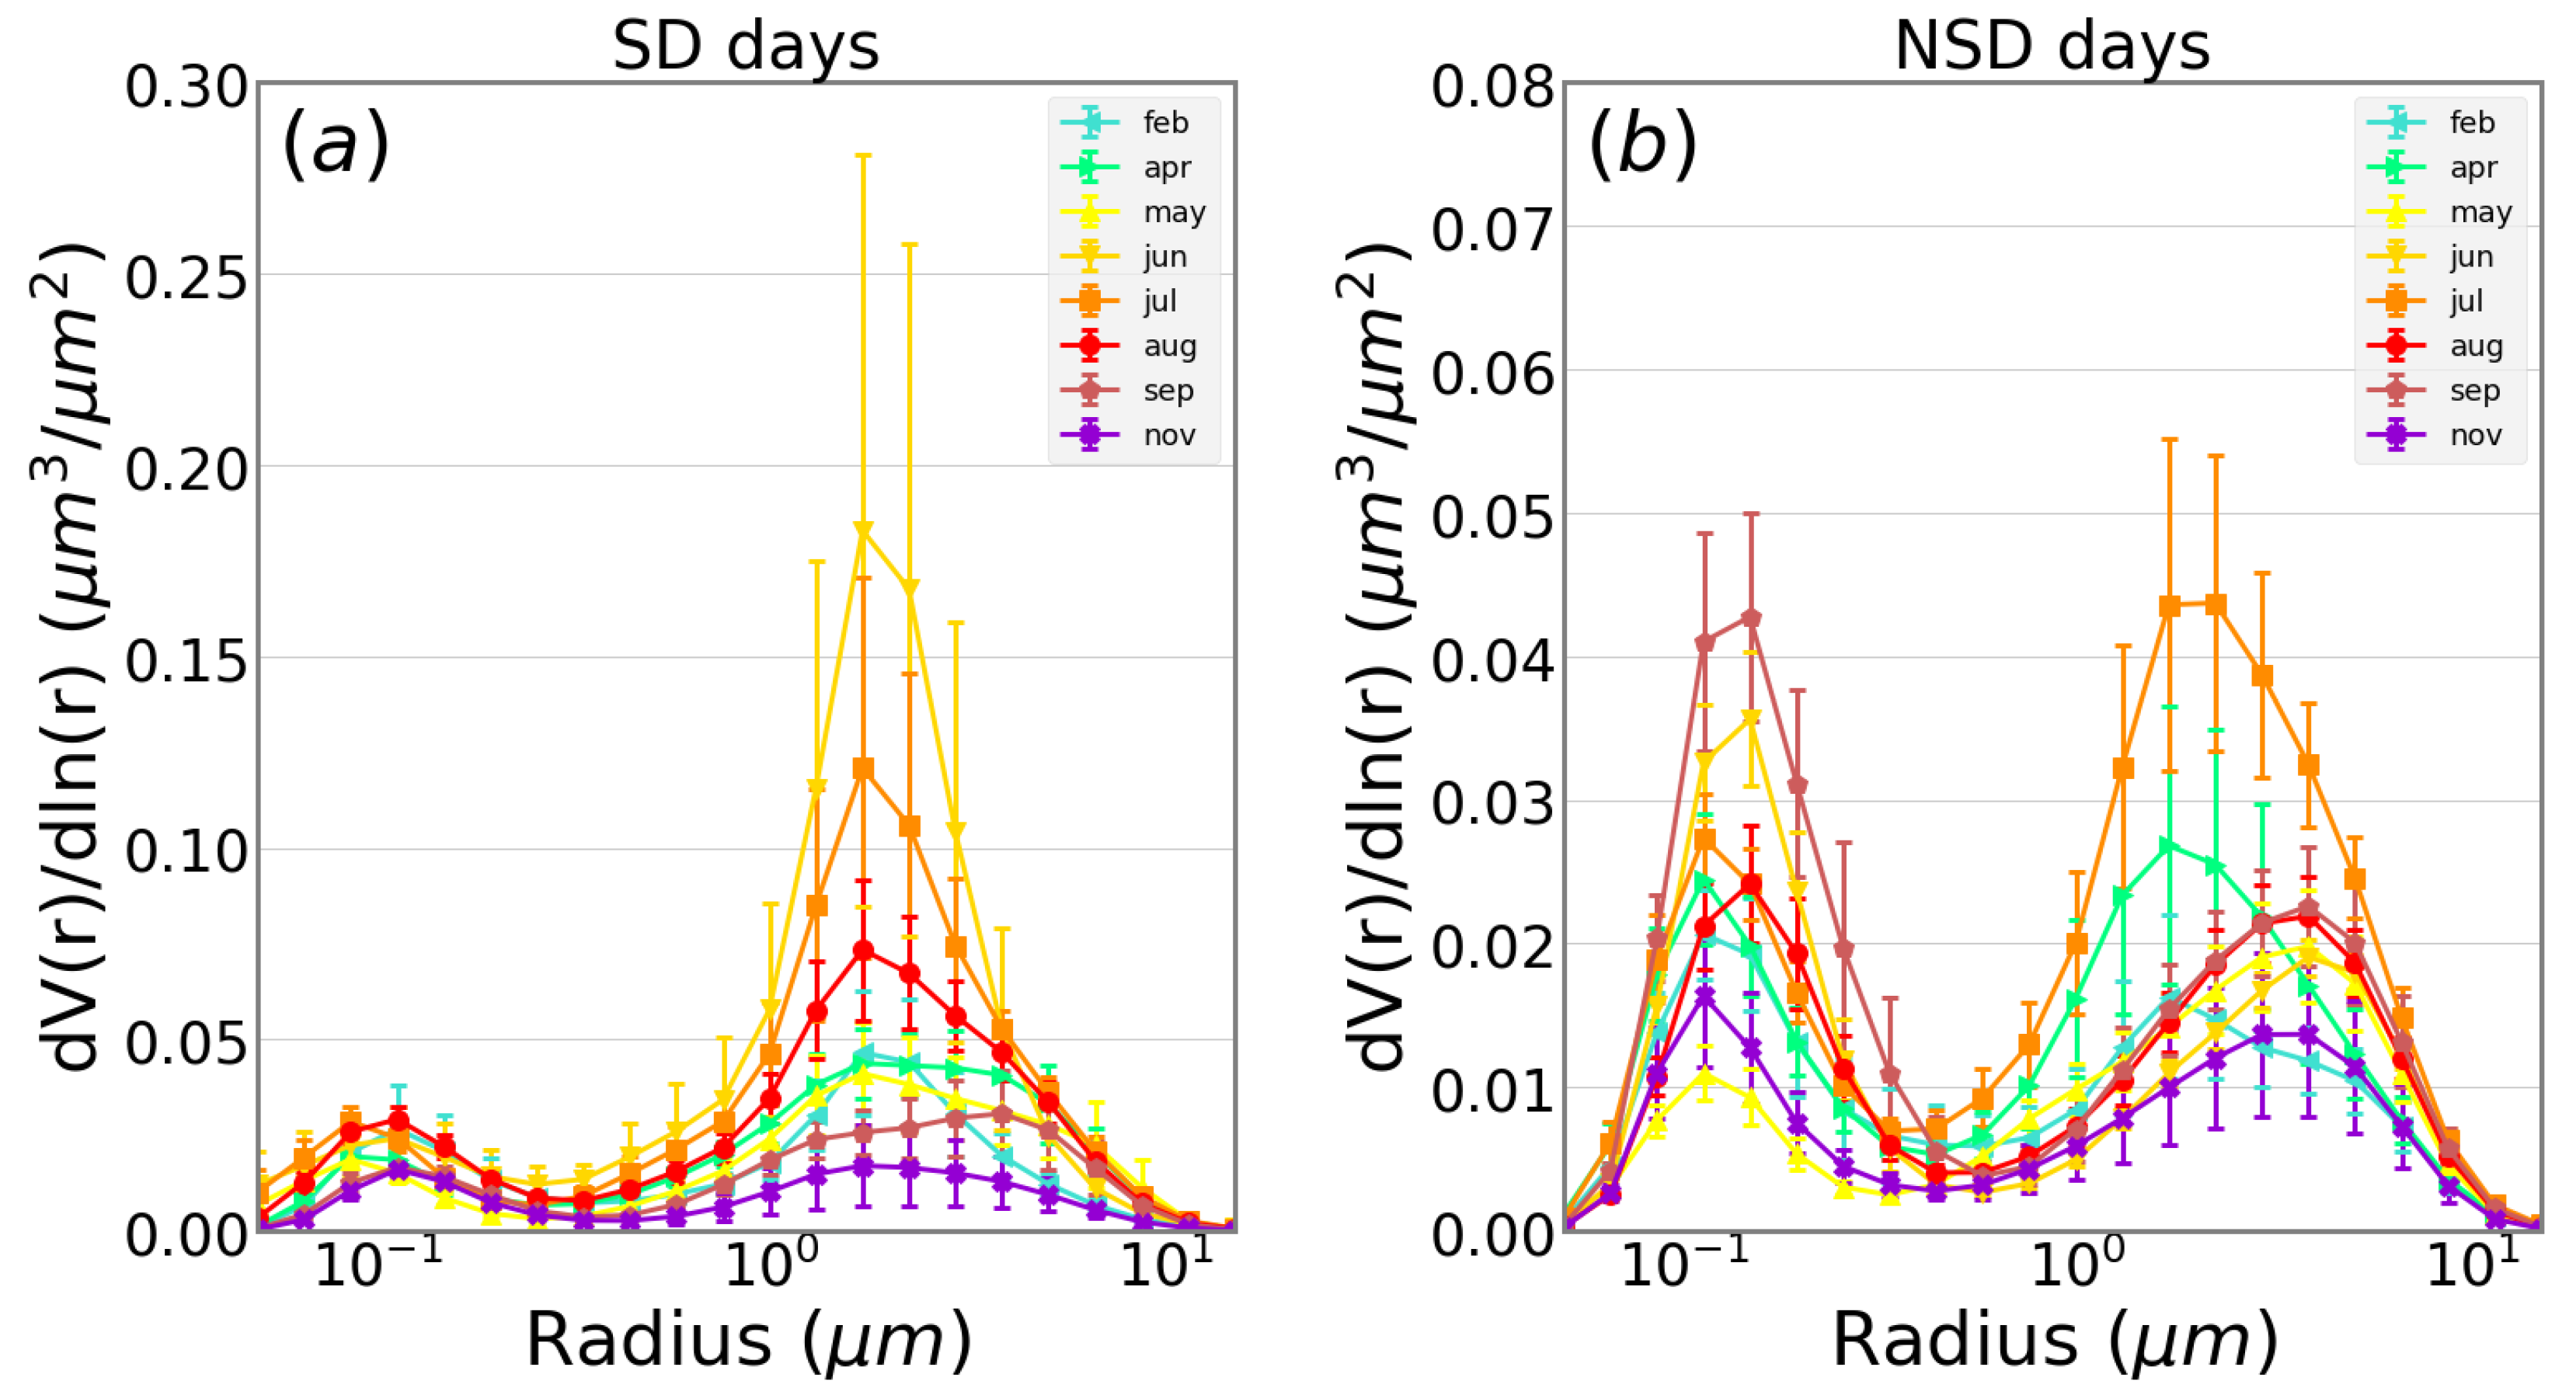
Daily size distributions were averaged over each month, dividing the data in days with and without influence of Saharan dust and represented together for each year. In Figure 13, the plots obtained for the year 2021 are shown as an example. Only the months in which at least two days with Saharan dust events were observed are reported. In both plots, the bi-modal size distribution highlights how the coarse mode is much higher during warm months, such as in June, July and August, when dust transport above the measurement area is more frequent. Moreover, for all the months, the coarse modes obtained considering only days without dust events are similar. On the other hand, fine mode does not change much considering only Saharan dust events and their absence, confirming how these events transport, to a greater extent, a larger dimension of aerosol. The same behavior is observed for all the other years (data not shown), with coarse mode peaks observed only for dust days in the months between April and August, as observed in 2021. Only 2021 data are presented because. As already observed, it is the year with the most intense Saharan dust transport events; it has the highest peak for the coarse mode observed during the five years. For all other years, the same variation between dust and no dust plot is clearly present, although the differences in values are smaller. Fine mode peaks are usually observed during August, and this justifies the α440/870 peaks observed during this month.
4. Conclusions
A five-year statistical and climatological analysis of the aerosol optical and microphysical properties obtained from AERONET ground-based remote sensing observations in a Mediterranean area was reported. Seasonal behavior was observed in the AOD440, which reaches daily mean values larger than 0.3 during dust advection or forest fire episodes. Measured α440/870 values did not show any typical seasonal trend, in agreement with the large variability of the aerosol properties and dimensions due to the coexistence of particles of different nature and typology in the measurement area. AOD440 and α440/870 mean values indicated a predominance of marine aerosol, coming from the near Mediterranean Sea, mixed with polluted continental aerosol characteristic of an urban and industrial area. The frequency distribution of AOD440 and α440/870 could discriminate between the background conditions, corresponding to the continental polluted aerosol mixed with sea salt aerosol, and the long-range transported dust from the Sahara region or the biomass burning events occurring in the measurement area. The particle size distribution highlighted a predominance of the aerosol fine fraction in the atmospheric column, with the occurrence of coarse mode peaks mainly during dust transport events. Finally, this study confirms the typical Mediterranean nature of the measurement area dominated by fine pollution particles mixed, mainly during summer, with biomass burning aerosol and larger aerosol components associated with major dust events from the Sahara Desert. Our experimental findings are relevant to climate change and air quality studies, providing useful information on the Mediterranean aerosol optical and microphysical properties.
Author Contributions
Conceptualization and work coordination, R.D.; methodology, A.B. and R.D.; photometer processing and analysis, R.D. and A.S.; writing—original draft preparation, S.A. and A.B.; writing—review and editing, all authors; visualization, R.D. and A.S. All authors have read and agreed to the published version of the manuscript.
Funding
The research leading to these results has received funding from the European Union’s Horizon 2020 Framework Program for Research and Innovation (grant agreement no. 654109–ACTRIS-2 Aerosols, Clouds, and Trace Gases Research InfraStructure).
Institutional Review Board Statement
Not applicable.
Informed Consent Statement
Not applicable.
Data Availability Statement
Data from AERONET are publicly available on https://aeronet.gsfc.nasa.gov, accessed on 1 February 2022. HYSPLIT model is publicly available on https://www.ready.noaa.gov/HYSPLIT, accessed on 1 February 2022. BSC-DREAM8b model is publicly available on http://www.bsc.es/ess/bsc-dust-dailyforecast, accessed on 1 February 2022.
Acknowledgments
The authors gratefully acknowledge the NOAA Air Resource Laboratory (ARL) for provision of the HYSPLIT transport and dispersion model and/or READY website used in this publication. Data from the BSC-DREAM8b (Dust Regional Atmospheric Model) model were operated by the Barcelona Supercomputing Center (http://www.bsc.es/ess/bsc-dust-daily-forecast/, accessed on 1 February 2022). A.S. acknowledges the support by the Ministero dell’Istruzione, dell’Università e della Ricerca in the frame of PIANO STRALCIO RICERCA E INNOVAZIONE 2015–2017 “PNIR-Programma Nazionale Infrastrutture di Ricerca”, Rafforzamento del capitale umano delle Infrastrutture di Ricerca (CIR01_00015). The authors acknowledge AERONET (https://aeronet.gsfc.nasa.gov/, accessed on 30 September 2022) for maintenance services.
Conflicts of Interest
The authors declare no conflict of interest. The funders had no role in the design of the study; in the collection, analyses, or interpretation of data; in the writing of the manuscript; or in the decision to publish the results.
References
- IPCC. Climate Change 2021: The Physical Science Basis. In Contribution of Working Group I to the Sixth Assessment Report of the Intergovernmental Panel on Climate Change; Masson-Delmotte, V., Zhai, P., Pirani, A., Connors, S.L., Péan, C., Berger, S., Caud, N., Chen, Y., Goldfarb, L., Gomis, M.I., et al., Eds.; Cambridge University Press: Cambridge, UK, 2021. [Google Scholar]
- Takamura, T.; Nakajima, T.; SKYNET Community Group. Overview of SKYNET and its activities. Proceedings of AERONET workshop, El Arenosillo. Opt. Pura Apl. 2004, 37, 3303–3308. [Google Scholar]
- Pappalardo, G.; Amodeo, A.; Apituley, A.; Comeron, A.; Freudenthaler, V.; Linné, H.; Ansmann, A.; Bösenberg, J.; D’Amico, G.; Mattis, I.; et al. EARLINET: Towards an Advanced Sustainable European Aerosol Lidar Network. Atmos. Meas. Tech. 2014, 7, 2389–2409. [Google Scholar] [CrossRef] [Green Version]
- Holben, B.N.; Eck, T.F.; Slutsker, I.; Tanré, D.; Buis, J.P.; Setzer, A.; Vermote, E.; Reagan, J.A.; Kaufman, Y.J.; Nakajima, T.; et al. AERONET—A Federated Instrument Network and Data Archive for Aerosol Characterization. Remote Sens. Environ. 1998, 66, 1–16. [Google Scholar] [CrossRef]
- Wang, S.-H.; Huang, H.-Y.; Lin, C.-H.; Pani, S.K.; Lin, N.-H.; Lee, C.T.; Janjai, S.; Holben, B.N.; Chantara, S. Columnar aerosol types and compositions over peninsular Southeast Asia based on long-term AERONET data. Air Qual. Atmos. Health 2021. [Google Scholar] [CrossRef]
- Aladodo, S.S.; Akoshile, C.O.; Ajibola, T.B. Seasonal Tropospheric Aerosol Classification Using AERONET Spectral Absorption Properties in African Locations. Aerosol. Sci. Eng. 2022, 6, 246–266. [Google Scholar] [CrossRef]
- Giles, D.M.; Holben, B.N.; Eck, T.F.; Sinyuk, A.; Smirnov, A.; Slutsker, I.; Dickerson, R.R.; Thompson, A.M.; Schafer, J.S. An analysis of AERONET aerosol absorption properties and classifications representative of aerosol source regions. J. Geophys. Res. 2012, 117, D17203. [Google Scholar] [CrossRef] [Green Version]
- Khan, R.; Kumar, K.R.; Zhao, T.; Ali, G. The Contribution of Different Aerosol Types to Direct Radiative Forcing over Distinct Environments of Pakistan Inferred from the AERONET Data. Environ. Res. Lett. 2020, 15, 114062. [Google Scholar] [CrossRef]
- Khan, R.; Kumar, K.R.; Zhao, T. The Climatology of Aerosol Optical Thickness and Radiative Effects in Southeast Asia from 18-Years of Ground-Based Observations. Environ. Pollut. 2019, 254, 113025. [Google Scholar] [CrossRef]
- Xu, X.; Xie, L.; Yang, X.; Wu, H.; Cai, L.; Qi, P. Aerosol Optical Properties at Seven AERONET Sites over Middle East and Eastern Mediterranean Sea. Atmos. Environ. 2020, 243, 117884. [Google Scholar] [CrossRef]
- Logothetis, S.-A.; Salamalikis, V.; Kazantzidis, A. Aerosol Classification in Europe, Middle East, North Africa and Arabian Peninsula Based on AERONET Version 3. Atmos. Res. 2020, 239, 104893. [Google Scholar] [CrossRef]
- Kambezidis, H.D.; Kaskaoutis, D.G. Aerosol Climatology over Four AERONET Sites: An Overview. Atmos. Environ. 2008, 42, 1892–1906. [Google Scholar] [CrossRef]
- Basart, S.; Pérez, C.; Cuevas, E.; Baldasano, J.M.; Gobbi, G.P. Aerosol Characterization in Northern Africa, Northeastern Atlantic, Mediterranean Basin and Middle East from Direct-Sun AERONET Observations. Atmos. Chem. Phys. 2009, 9, 8265–8282. [Google Scholar] [CrossRef] [Green Version]
- Wang, S.-H.; Lei, H.-W.; Pani, S.K.; Huang, H.-Y.; Lin, N.-H.; Welton, E.J.; Chang, S.-C.; Wang, Y.-C. Determination of Lidar Ratio for Major Aerosol Types over Western North Pacific Based on Long-Term MPLNET Data. Remote Sens. 2020, 12, 2769. [Google Scholar] [CrossRef]
- Rogozovsky, I.; Ansmann, A.; Althausen, D.; Heese, B.; Engelmann, R.; Hofer, J.; Baars, H.; Schechner, Y.; Lyapustin, A.; Chudnovsky, A. Impact of Aerosol Layering, Complex Aerosol Mixing, and Cloud Coverage on High-Resolution MAIAC Aerosol Optical Depth Measurements: Fusion of Lidar, AERONET, Satellite, and Ground-Based Measurements. Atmos. Environ. 2021, 247, 118163. [Google Scholar] [CrossRef]
- Viswanatha Vachaspati, C.; Reshma Begam, G.; Nazeer Ahammed, Y.; Raghavendra Kumar, K.; Reddy, R.R. Characterization of Aerosol Optical Properties and Model Computed Radiative Forcing over a Semi-Arid Region, Kadapa in India. Atmos. Res. 2018, 209, 36–49. [Google Scholar] [CrossRef]
- Gerasopoulos, E.; Kouvarakis, G.; Babasakalis, P.; Vrekoussis, M.; Putaud, J.-P.; Mihalopoulos, N. Origin and Variability of Particulate Matter (PM10) Mass Concentrations over the Eastern Mediterranean. Atmos. Environ. 2006, 40, 4679–4690. [Google Scholar] [CrossRef]
- Dubovik, O.; Li, Z.; Mishchenko, M.I.; Tanré, D.; Karol, Y.; Bojkov, B.; Cairns, B.; Diner, D.J.; Espinosa, W.R.; Goloub, P.; et al. Polarimetric Remote Sensing of Atmospheric Aerosols: Instruments, Methodologies, Results, and Perspectives. J. Quant. Spectrosc. Radiat. Transf. 2019, 224, 474–511. [Google Scholar] [CrossRef]
- Di Iorio, T.; di Sarra, A.; Sferlazzo, D.M.; Cacciani, M.; Meloni, D.; Monteleone, F.; Fuà, D.; Fiocco, G. Seasonal Evolution of the Tropospheric Aerosol Vertical Profile in the Central Mediterranean and Role of Desert Dust. J. Geophys. Res. Atmos. 2009, 114, 1–9. [Google Scholar] [CrossRef] [Green Version]
- Fotiadi, A.; Hatzianastassiou, N.; Drakakis, E.; Matsoukas, C.; Pavlakis, K.G.; Hatzidimitriou, D.; Gerasopoulos, E.; Mihalopoulos, N.; Vardavas, I. Aerosol Physical and Optical Properties in the Eastern Mediterranean Basin, Crete, from Aerosol Robotic Network Data. Atmos. Chem. Phys. 2006, 6, 5399–5413. [Google Scholar] [CrossRef] [Green Version]
- Toledano, C.; Cachorro, V.E.; Berjon, A.; de Frutos, A.M.; Sorribas, M.; de la Morena, B.A.; Goloub, P. Aerosol optical depth and Ångström exponent climatology at El Arenosillo AERONET site (Huelva, Spain). Q. J. R. Meteorol. Soc. A J. Atmos. Sci. Appl. Meteorol. Phys. Oceanogr. 2007, 133, 795–807. [Google Scholar] [CrossRef]
- Santese, M.; De Tomasi, F.; Perrone, M.R. Advection Patterns and Aerosol Optical and Microphysical Properties by AERONET over South-East Italy in the Central Mediterranean. Atmos. Chem. Phys. 2008, 8, 1881–1896. [Google Scholar] [CrossRef]
- Toledano, C.; Cachorro, V.E.; de Frutos, A.M.; Torres, B.; Berjón, A.; Sorribas, M.; Stone, R.S. Airmass Classification and Analysis of Aerosol Types at El Arenosillo (Spain). J. Appl. Meteorol. Climatol. 2009, 48, 962–981. [Google Scholar] [CrossRef]
- Boselli, A.; Caggiano, R.; Cornacchia, C.; Madonna, F.; Lucia, M.; Macchiato, M.; Pappalardo, G.; Trippetta, S. Multi Year Sun-Photometer Measurements for Aerosol Characterization in a Central Mediterranean Site. Atmos. Res. 2012, 104, 98–110. [Google Scholar] [CrossRef]
- Mallet, M.; Dubovik, O.; Nabat, P.; Dulac, F.; Kahn, R.; Sciare, J.; Paronis, D.; Léon, J.F. Absorption Properties of Mediterranean Aerosols Obtained from Multi-Year Ground-Based Remote Sensing Observations. Atmos. Chem. Phys. 2013, 13, 9195–9210. [Google Scholar] [CrossRef] [Green Version]
- Benkhalifa, J.; Léon, J.; Chaabane, M. Aerosol Optical Properties of Western Mediterranean Basin from Multi-Year AERONET Data. J. Atmos. Sol. -Terr. Phys. 2017, 164. [Google Scholar] [CrossRef]
- Pérez, C.; Nickovic, S.; Baldasano, J.M.; Sicard, M.; Rocadenbosch, F.; Cachorro, V.E. A Long Saharan Dust Event over the Western Mediterranean: Lidar, Sun Photometer Observations, and Regional Dust Modeling. J. Geophys. Res. Atmos. 2006, 111. [Google Scholar] [CrossRef]
- Barnaba, F.; Gobbi, G.P. Aerosol Seasonal Variability over the Mediterranean Region and Relative Impact of Maritime, Continental and Saharan Dust Particles over the Basin from MODIS Data in the Year 2001. Atmos. Chem. Phys. 2004, 4, 2367–2391. [Google Scholar] [CrossRef] [Green Version]
- Santese, M.; De Tomasi, F.; Perrone, M.R. AERONET Versus MODIS Aerosol Parameters at Different Spatial Resolutions over Southeast Italy. J. Geophys. Res. Atmos. 2007, 112. [Google Scholar] [CrossRef]
- Floutsi, A.A.; Korras-Carraca, M.B.; Matsoukas, C.; Hatzianastassiou, N.; Biskos, G. Climatology and Trends of Aerosol Optical Depth over the Mediterranean Basin during the Last 12 years (2002–2014) Based on Collection 006 MODIS-Aqua Data. Sci. Total Environ. 2016, 551–552, 292–303. [Google Scholar] [CrossRef]
- Mishra, A.K.; Rudich, Y.; Koren, I. Spatial Boundaries of Aerosol Robotic Network (AERONET) Observations over the Mediterranean Basin. Geophys. Res. Lett. 2016, 43, 2259–2266. [Google Scholar] [CrossRef] [Green Version]
- Tuna Tuygun, G.; Gündoğdu, S.; Elbir, T. Estimation of Ground-Level Particulate Matter Concentrations Based on Synergistic Use of MODIS, MERRA-2 and AERONET AODs over a Coastal Site in the Eastern Mediterranean. Atmos. Environ. 2021, 261, 118562. [Google Scholar] [CrossRef]
- Pace, G.; di Sarra, A.; Meloni, D.; Piacentino, S.; Chamard, P. Aerosol Optical Properties at Lampedusa (Central Mediterranean). 1. Influence of Transport and Identification of Different Aerosol Types. Atmos. Chem. Phys. 2006, 6, 697–713. [Google Scholar] [CrossRef] [Green Version]
- Formenti, P.; Mbemba Kabuiku, L.; Chiapello, I.; Ducos, F.; Dulac, F.; Tanré, D. Aerosol Optical Properties Derived from POLDER-3/PARASOL (2005–2013) over the Western Mediterranean Sea—Part 1: Quality Assessment with AERONET and in Situ Airborne Observations. Atmos. Meas. Tech. 2018, 11, 6761–6784. [Google Scholar] [CrossRef] [Green Version]
- Boselli, A.; Armenante, M.; D’Avino, L.; D’Isidoro, M.; Pisani, G.; Spinelli, N.; Wang, X. Atmospheric Aerosol Characterization Over Naples During 2000–2003 EARLINET Project: Planetary Boundary-Layer Evolution and Layering. Bound. -Layer Meteorol. 2009, 132, 151–165. [Google Scholar] [CrossRef]
- Pappalardo, G. ACTRIS Aerosol, Clouds and Trace Gases Research Infrastructure. EPJ Web Conf. 2018, 176, 09004. [Google Scholar] [CrossRef]
- Barreto, Á.; Cuevas, E.; Granados-Muñoz, M.-J.; Alados-Arboledas, L.; Romero, P.M.; Gröbner, J.; Kouremeti, N.; Almansa, A.F.; Stone, T.; Toledano, C.; et al. The New Sun-Sky-Lunar Cimel CE318-T Multiband Photometer; a Comprehensive Performance Evaluation. Atmos. Meas. Tech. 2016, 9, 631–654. [Google Scholar] [CrossRef] [Green Version]
- Dubovik, O.; King, M. A Flexible Inversion Algorithm for Retrieval of Aerosol Optical Properties from Sun and Sky Radiance Measurements. J. Geophys. Res. 2000, 105, 20673–20696. [Google Scholar] [CrossRef] [Green Version]
- Holben, B.N.; Tanré, D.; Smirnov, A.; Eck, T.F.; Slutsker, I.; Abuhassan, N.; Newcomb, W.W.; Schafer, J.S.; Chatenet, B.; Lavenu, F.; et al. An Emerging Ground-Based Aerosol Climatology: Aerosol Optical Depth from AERONET. J. Geophys. Res. Atmos. 2001, 106, 12067–12097. [Google Scholar] [CrossRef]
- Dubovik, O.; Smirnov, A.; Holben, B.N.; King, M.D.; Kaufman, Y.J.; Eck, T.F.; Slutsker, I. Accuracy Assessments of Aerosol Optical Properties Retrieved from Aerosol Robotic Network (AERONET) Sun and Sky Radiance Measurements. J. Geophys. Res. Atmos. 2000, 105, 9791–9806. [Google Scholar] [CrossRef] [Green Version]
- Sannino, A.; D’Emilio, M.; Castellano, P.; Amoruso, S.; Boselli, A. Analysis of Air Quality during the COVID-19 Pandemic Lockdown in Naples (Italy). Aerosol. Air Qual. Res. 2021, 21, 200381. [Google Scholar] [CrossRef]
- De Marco, C.; Boselli, A.; D’Anna, A.; Sannino, A.; Sasso, G.; Sirignano, M.; Spinelli, N.; Wang, X. Mutiparametric Characterization of Atmospheric Particulate in a Heavy-Polluted Area of South Italy. Atmos. Clim. Sci. 2022, 12, 493–516. [Google Scholar] [CrossRef]
- Boselli, A.; Sannino, A.; D’Emilio, M.; Wang, X.; Amoruso, S. Aerosol Characterization during the Summer 2017 Huge Fire Event on Mount Vesuvius (Italy) by Remote Sensing and In Situ Observations. Remote Sens. 2021, 13, 2001. [Google Scholar] [CrossRef]
- Pisani, G.; Boselli, A.; Spinelli, N.; Wang, X. Characterization of Saharan Dust Layers over Naples (Italy) during 2000–2003 EARLINET Project. Atmos. Res. 2011, 102, 286–299. [Google Scholar] [CrossRef]
- Sannino, A.; Amoruso, S.; Damiano, R.; Scollo, S.; Sellitto, P.; Boselli, A. Optical and Microphysical Characterization of Atmospheric Aerosol in the Central Mediterranean during Simultaneous Volcanic Ash and Desert Dust Transport Events. Atmos. Res. 2022, 271, 1–9. [Google Scholar] [CrossRef]
- Stein, A.F.; Draxler, R.R.; Rolph, G.D.; Stunder, B.J.B.; Cohen, M.D.; Ngan, F. NOAA’s HYSPLIT Atmospheric Transport and Dispersion Modeling System. Bull. Am. Meteorol. Soc. 2015, 96, 2059–2077. [Google Scholar] [CrossRef]
- Schuster, G.L.; Dubovik, O.; Holben, B.N. Angstrom Exponent and Bimodal Aerosol Size Distributions. J. Geophys. Res. Atmos. 2006, 111. [Google Scholar] [CrossRef] [Green Version]
- Nickovic, S.; Kallos, G.; Papadopoulos, A.; Kakaliagou, O. Model for Prediction of Desert Dust Cycle in the Atmosphere. J. Geophys. Res. 2001, 106, 18113–18130. [Google Scholar] [CrossRef] [Green Version]
- Lyamani, H.; Valenzuela, A.; Perez-Ramirez, D.; Toledano, C.; Granados-Muñoz, M.J.; Olmo, F.J.; Alados-Arboledas, L. Aerosol Properties over the Western Mediterranean Basin: Temporal and Spatial Variability. Atmos. Chem. Phys. 2015, 15, 2473–2486. [Google Scholar] [CrossRef] [Green Version]
- Michaelides, S.; Karacostas, T.; Sánchez, J.L.; Retalis, A.; Pytharoulis, I.; Homar, V.; Romero, R.; Zanis, P.; Giannakopoulos, C.; Bühl, J.; et al. Reviews and Perspectives of High Impact Atmospheric Processes in the Mediterranean. Atmos. Res. 2018, 208, 4–44. [Google Scholar] [CrossRef]
- Perrone, M.; Lorusso, A.; Romano, S. Diurnal and Nocturnal Aerosol Properties by AERONET Sun-Sky-Lunar Photometer Measurements along Four Years. Atmos. Res. 2021, 265, 105889. [Google Scholar] [CrossRef]
- Bergamo, A.; Tafuro, A.M.; Kinne, S.; De Tomasi, F.; Perrone, M.R. Monthly-Averaged Anthropogenic Aerosol Direct Radiative Forcing over the Mediterranean Based on AERONET Aerosol Properties. Atmos. Chem. Phys. 2008, 8, 6995–7014. [Google Scholar] [CrossRef]
- O’Neill, N.T.; Ignatov, A.; Holben, B.N.; Eck, T.F. The Lognormal Distribution as a Reference for Reporting Aerosol Optical Depth Statistics; Empirical Tests Using Multi-Year, Multi-Site AERONET Sunphotometer Data. Geophys. Res. Lett. 2000, 27, 3333–3336. [Google Scholar] [CrossRef]
- Knobelspiesse, K.D.; Pietras, C.; Fargion, G.S.; Wang, M.; Frouin, R.; Miller, M.A.; Subramaniam, A.; Balch, W.M. Maritime Aerosol Optical Thickness Measured by Handheld Sun Photometers. Remote Sens. Environ. 2004, 93, 87–106. [Google Scholar] [CrossRef]
- Evgenieva, T.; Gurdev, L.; Toncheva, E.; Dreischuh, T. Optical and Microphysical Properties of the Aerosol Field over Sofia, Bulgaria, Based on AERONET Sun-Photometer Measurements. Atmosphere 2022, 13, 884. [Google Scholar] [CrossRef]
- Zachary, M.; Niu, S.; Lü, J. Aerosol Optical and Micro-Physical Characteristic Derived from AERONET in Kenya. Open Access Libr. J. 2018, 5, 1–16. [Google Scholar] [CrossRef]
- Deep, A.; Pandey, C.P.; Nandan, H.; Singh, N.; Yadav, G.; Joshi, P.C.; Purohit, K.D.; Bhatt, S.C. Aerosols Optical Depth and Ångström Exponent over Different Regions in Garhwal Himalaya, India. Environ. Monit. Assess 2021, 193, 324. [Google Scholar] [CrossRef]
- Toledano, C.; Wiegner, M.; Garhammer, M.; Seefeldner, M.; Gasteiger, J.; MüLLER, D.; Koepke, P. Spectral Aerosol Optical Depth Characterization of Desert Dust during SAMUM 2006. Tellus B Chem. Phys. Meteorol. 2009, 61, 216–228. [Google Scholar] [CrossRef]
- Burgos, M.A.; Mateos, D.; Cachorro, V.E.; Toledano, C.; de Frutos, A.M.; Calle, A.; Herguedas, A.; Marcos, J.L. An Analysis of High Fine Aerosol Loading Episodes in North-Central Spain in the Summer 2013—Impact of Canadian Biomass Burning Episode and Local Emissions. Atmos. Environ. 2018, 184, 191–202. [Google Scholar] [CrossRef]
- Giles, D.M.; Sinyuk, A.; Sorokin, M.G.; Schafer, J.S.; Smirnov, A.; Slutsker, I.; Eck, T.F.; Holben, B.N.; Lewis, J.R.; Campbell, J.R.; et al. Advancements in the Aerosol Robotic Network (AERONET) Version 3 Database—Automated near-Real-Time Quality Control Algorithm with Improved Cloud Screening for Sun Photometer Aerosol Optical Depth (AOD) Measurements. Atmos. Meas. Tech. 2019, 12, 169–209. [Google Scholar] [CrossRef] [Green Version]
- Raptis, I.-P.; Kazadzis, S.; Eleftheratos, K.; Amiridis, V.; Fountoulakis, I. Single Scattering Albedo’s Spectral Dependence Effect on UV Irradiance. Atmosphere 2018, 9, 364. [Google Scholar] [CrossRef] [Green Version]
- Li, J.; Carlson, B.E.; Dubovik, O.; Lacis, A.A. Recent Trends in Aerosol Optical Properties Derived from AERONET Measurements. Atmos. Chem. Phys. 2014, 14, 12271–12289. [Google Scholar] [CrossRef]
- Raptis, I.-P.; Kazadzis, S.; Amiridis, V.; Gkikas, A.; Gerasopoulos, E.; Mihalopoulos, N. A Decade of Aerosol Optical Properties Measurements over Athens, Greece. Atmosphere 2020, 11, 154. [Google Scholar] [CrossRef]
Figure 1.
Geographical location of the Napoli Cesma monitoring site. Other Southern Italy AERONET sites are also shown.
Figure 1.
Geographical location of the Napoli Cesma monitoring site. Other Southern Italy AERONET sites are also shown.

Figure 2.
(a,b) BSC-Dream dust forecast model results corresponding to dust concentration (µg m−3) on 22 July 2017 in Naples. (c) HYSPLIT-NOAA model outcomes showing five-day air mass back-trajectories ending over the measurement area between 2000 and 8000 m of altitude on 22 July 2017.
Figure 2.
(a,b) BSC-Dream dust forecast model results corresponding to dust concentration (µg m−3) on 22 July 2017 in Naples. (c) HYSPLIT-NOAA model outcomes showing five-day air mass back-trajectories ending over the measurement area between 2000 and 8000 m of altitude on 22 July 2017.


Figure 3.
Example of FIRMS maps reporting active fire data (red points) on 12 July 2017, when the area of the Vesuvius National Park was interested by a very large fire. Yellow star represents the measurement site.
Figure 3.
Example of FIRMS maps reporting active fire data (red points) on 12 July 2017, when the area of the Vesuvius National Park was interested by a very large fire. Yellow star represents the measurement site.

Figure 4.
Solar AOD440 (a) and α440/870 (b) evolution during the 2017–2021 time period.

Figure 5.
Time series boxplots of seasonal AOD440 (a) and α440/870 (b), calculated from AERONET daily mean values over the five years (2017–2021). The horizontal bold segments illustrate the median values for each season, while the lower and upper boundaries of each box represent the 25th and 75th percentile, respectively. Whiskers are based on the 1.5 IQR value.

Figure 6.
Monthly boxplots calculated over the five years (2017–2021) from AERONET daily mean values, for both AOD440 (a) and α440/870 (b). The horizontal bold segments illustrate the median values for each season, while the lower and upper boundary of each box represent the 25th and 75th percentiles, respectively. Whiskers are based on the 1.5 IQR value.

Figure 7.
Histograms for solar ln (AOD440) (a) and α440/870 (b) with multi-modal Gaussian fits. Different contributions can be identified by different line styles.
Figure 7.
Histograms for solar ln (AOD440) (a) and α440/870 (b) with multi-modal Gaussian fits. Different contributions can be identified by different line styles.

Figure 8.
Histograms for lunar ln (AOD440) (a) and α440/870 (b) with multi-modal Gaussian fits. Different contributions can be identified by different line styles.
Figure 8.
Histograms for lunar ln (AOD440) (a) and α440/870 (b) with multi-modal Gaussian fits. Different contributions can be identified by different line styles.

Figure 9.
AOD440-α440/870 scatter plot of all observations during 2017–2021. The scale is semi-log, with logarithm scale on the horizontal axis. Red datapoints represent days in which Saharan dust transportation events were observed, while blue datapoints are used for all the other days. Green areas contain couples with AOD440 > 0.18 and α440/870 > 1.5; yellow areas contain couples with AOD440 > 0.2 and α440/870 < 1.

Figure 10.
AOD440-α440/870 scatter plots for winter (a), spring (b), summer (c) and autumn (d) seasons. The scale is semi-log, with logarithm scale on the horizontal axis. Red datapoints represent days in which Saharan dust transportation events were observed, while blue datapoints are used for all the other days. Green areas contain couples with AOD440 > 0.3 and α440/870 > 1.5, and yellow areas contain couples with AOD440 > 0.2 and α440/870 < 1. There are a total of 238 points for winter, 320 points for spring, 400 points for summer and 290 points for autumn.

Figure 11.
(a) Evolution of SSA at 440 and 675 nm provided by AERONET with data classified by month over five years (2017–2021). Error bars indicate mean standard deviation. Horizontal segments show the median values for each season, while the lower and upper boundaries of each box represent the 25th and 75th percentiles, respectively. Whiskers are based on the 1.5 IQR value. (b) SSA median values for 440, 675, 870 and 1020 nm, showing monthly variation during the years.

Figure 12.
Evolution of AOD500 fine and coarse component provided by AERONET monthly averaged over five years (2017–2021), computed using daily data. Bold lines illustrate the median values for each season, while the lower and upper boundaries of each box represent the 25th and 75th percentiles, respectively. Whiskers are based on the 1.5 IQR value.

Figure 13.
Volume particle size distribution monthly averages obtained for months of 2021 in which Saharan dust events were observed. Daily data are divided into days with (a) and without (b) the influence of Saharan dust transportation events. Note that the horizontal axis is on a logarithmical scale and The vertical axis scale is different for the two plots.


Table 1.
Solar and lunar AOD440 and α440/870 mean values for each year. Number N of available daily data for each year is also reported. Errors are estimated as standard deviation.
Table 1.
Solar and lunar AOD440 and α440/870 mean values for each year. Number N of available daily data for each year is also reported. Errors are estimated as standard deviation.
| Year | Nsol | AOD440 sol | α440/870 sol | Nlun | AOD440 lun | α440/870 lun |
|---|---|---|---|---|---|---|
| 2017 | 267 | 0.19 ± 0.10 | 1.3 ± 0.4 | 106 | 0.20 ± 0.09 | 1.3 ± 0.4 |
| 2018 | 270 | 0.22 ± 0.12 | 1.2 ± 0.4 | 146 | 0.23 ± 0.13 | 1.2 ± 0.5 |
| 2019 | 272 | 0.21 ± 0.11 | 1.3 ± 0.4 | 142 | 0.23 ± 0.14 | 1.2 ± 0.4 |
| 2020 | 189 | 0.20 ± 0.11 | 1.4 ± 0.3 | 150 | 0.19 ± 0.11 | 1.3 ± 0.4 |
| 2021 | 250 | 0.21 ± 0.09 | 1.2 ± 0.4 | 123 | 0.23 ± 0.15 | 1.2 ± 0.4 |
| Tot | 1248 | 0.21 ± 0.11 | 1.3 ± 0.4 | 667 | 0.22 ± 0.13 | 1.2 ± 0.4 |
Table 2.
Solar AOD440 and α440/870 mean values for each year, with daily data grouped into days without (NSD) and with (SD) the influence of Saharan dust transportation events. Errors are estimated as mean standard deviation.
Table 2.
Solar AOD440 and α440/870 mean values for each year, with daily data grouped into days without (NSD) and with (SD) the influence of Saharan dust transportation events. Errors are estimated as mean standard deviation.
| Year | SD | NSD | ||||
|---|---|---|---|---|---|---|
| N | AOD440 | α440/870 | N | AOD440 | α440/870 | |
| 2017 | 44 | 0.24 ± 0.11 | 1.0 ± 0.4 | 223 | 0.18 ± 0.10 | 1.4 ± 0.3 |
| 2018 | 96 | 0.26 ± 0.12 | 0.9 ± 0.4 | 174 | 0.20 ± 0.11 | 1.4 ± 0.4 |
| 2019 | 73 | 0.27 ± 0.11 | 1.1 ± 0.5 | 199 | 0.18 ± 0.10 | 1.3 ± 0.4 |
| 2020 | 25 | 0.24 ± 0.10 | 1.0 ± 0.3 | 164 | 0.19 ± 0.09 | 1.4 ± 0.3 |
| 2021 | 64 | 0.29 ± 0.17 | 0.9 ± 0.4 | 187 | 0.19 ± 0.11 | 1.3 ± 0.4 |
Publisher’s Note: MDPI stays neutral with regard to jurisdictional claims in published maps and institutional affiliations. |
© 2022 by the authors. Licensee MDPI, Basel, Switzerland. This article is an open access article distributed under the terms and conditions of the Creative Commons Attribution (CC BY) license (https://creativecommons.org/licenses/by/4.0/).
Share and Cite
MDPI and ACS Style
Damiano, R.; Sannino, A.; Amoruso, S.; Boselli, A. Aerosol Characterization with Long-Term AERONET Sun-Photometer Measurements in the Naples Mediterranean Area. Atmosphere 2022, 13, 2078. https://doi.org/10.3390/atmos13122078
AMA Style
Damiano R, Sannino A, Amoruso S, Boselli A. Aerosol Characterization with Long-Term AERONET Sun-Photometer Measurements in the Naples Mediterranean Area. Atmosphere. 2022; 13(12):2078. https://doi.org/10.3390/atmos13122078
Chicago/Turabian StyleDamiano, Riccardo, Alessia Sannino, Salvatore Amoruso, and Antonella Boselli. 2022. "Aerosol Characterization with Long-Term AERONET Sun-Photometer Measurements in the Naples Mediterranean Area" Atmosphere 13, no. 12: 2078. https://doi.org/10.3390/atmos13122078
Note that from the first issue of 2016, this journal uses article numbers instead of page numbers. See further details here.