Article

Spatial Analysis of GHG Balances and Climate Change Mitigation in Rural Areas: The Case of Emilia–Romagna Region

1
Departments of Architecture and Arts, Planning and Climate Change Lab, Università Iuav di Venezia, S. Croce 1957, 30135 Venice, Italy
2
EPIC—Feem@Iuav, Fondazione Eni Enrico Mattei, Palazzo delle Stelline, Corso Magenta 63, 20123 Milan, Italy
*
Author to whom correspondence should be addressed.
Atmosphere 2022, 13(12), 2060; https://doi.org/10.3390/atmos13122060
Submission received: 16 November 2022 / Revised: 28 November 2022 / Accepted: 7 December 2022 / Published: 8 December 2022
(This article belongs to the Special Issue Urban Climate Mitigation Techniques and Technologies)

Abstract

:
This paper aims to analyse the issue of mitigation and the balance of greenhouse gases in the rural contexts of the Emilia–Romagna region (Italy) due to climate change. The approach is based on the experimentation of a methodology, populated by available spatial databases and refined with a series of technical meetings, where it was possible to weigh availability and alternative choices within the identified assessment model. The objective of the research is to create a regional GHG balance map, in order to classify the territory for this specific dynamic. The aim of this approach is supporting policy decisions related to the Common Agricultural Policy at a regional level.

1. Introduction

Climate change and the consequent warming of average temperatures could, in the near future, have a negative impact both on food production and thus on food security itself [1], as well as on rural territories and landscapes [2]. Rising temperatures and extreme events directly impact crops through drought or too intense and concentrated rainfall, but also indirectly by increasing the presence of pathogens and pests, ultimately leading to a change in farm management. Furthermore, agriculture and farming practices, typical of rural areas, are recognised as very relevant factors in the emission of greenhouse gases (GHGs), and therefore, a direct cause of climate change itself. Considering this situation, it becomes fundamental that rural territories act on a double front: mitigation (a), through the reduction of the CO2 produced and the consequent storage and sequestration connected to agricultural practices, and adaptation (b), related to the effects of climate change in relation to flooding [3].
The objective of the research is to create a regional map of the GHG budget in order to classify the rural context; thus, the output could be useful both for the relationship with spatial planning choices, and for place-based actions in agricultural policies that are adopted at a regional level in Italy.
Given the trend, which is now irreversible in the short term, it is necessary to implement tools able to preserve certain rural areas and the resulting landscapes. Rural territories through agricultural practices find themselves both a source and an affected subject of climate change.
The European Union has ambitious emission reduction targets to reach the Paris Agreement, with a reduction of at least 40% of GHGs by 2030. This target was further increased from 50% to 55% as part of the Green Deal programme [4], which aims for carbon neutrality by 2050. In this context, the area of land use, land-use change and forestry (LULUCF) was formally included in the Effort Sharing Regulation (ETS) for the period 2021–2030 [5], with a binding commitment that emissions from land use are fully offset by equivalent CO2 removal (the so-called ‘no-debt’ rule). Therefore, it becomes very relevant for territories to understand their potential to absorb and store CO2 and this can be done through assessment and mapping, especially to support land use decisions and policies.
In this case, rural and agricultural territories are given priority, although cross-sectional studies on the subject are very limited and are generally based on land cover assessment [6,7]. For example, there are many agro-culture-specific studies; in fact, several pieces of research have suggested the preferential mitigation benefits of the albedo management of cropland through practices such as no-tillage or crop bio-geoengineering [8]. Others study and suggest the different uptake through the insertion of trees in cultivated land [9]; other work studies the uptake of orchards, olive groves, vineyards [10], or of wheat, sunflower, etc. [11]. Restoring degraded ecosystems and creating new ones is essential to improve the provision of ecosystem services at the landscape level [12], also providing healthy habitats for biodiversity and improving connectivity between natural areas in urban and rural landscapes across Europe [13]. In this sense, there is growing evidence that interventions, which address the way land is used, are both effective and necessary for climate mitigation and adaptation. The IPCC [14] has highlighted that all scenarios aimed at limiting climate change must rely on tools that act on changing land use, reducing sources of GHGs through ecosystem management and sustainable agricultural practices. All of these actions involving rural and agricultural land have been estimated to have the potential to provide about 30% of the CO2 mitigation needed until 2030 to keep warming below 2 °C [15,16]. Climate mitigation, i.e., the reduction of climate-altering gases in the atmosphere, can be achieved either through actions to reduce emissions or through carbon sink sequestration, so as to stabilise their concentration in the atmosphere around values that will keep the temperature increase within ‘sustainable’ limits for societies. In the specific theme of climate change, the concept of “mitigation” can be defined as: a human intervention to reduce the sources or enhance the storage elements of GHGs, but also consider interventions to reduce the sources of other substances that have a direct or indirect effect on climate and climate change [17,18].
In this context, Nature-based Solutions (NbS) are sometimes considered, i.e., those measures that conserve, restore or enhance ‘forests, wetlands, grasslands and agricultural land’ in order to: reduce CO2 emissions or remove CO2 from the atmosphere, but also to limit the impacts of extreme events (water and heat) through specific measures such as reforestation, forest conservation and management, agro-forestry, cropland nutrient management, conservation agriculture, coastal wetland restoration and peatland conservation and restoration [19,20]. In other words, these measures have the capacity to support or enhance carbon storage and sequestration. Across Europe, numerous agricultural and livestock production systems use these types of solutions. The key principle on which they are based is ecologically based diversification, as it reduces vulnerability, while at the same time it can increase productivity. Examples of good practices are: integrated crop–livestock systems, soil organic matter management, mixed cropping, crop rotations, biological pest control and agroforestry. Climate disaster resilience is closely related to farms with higher levels of biodiversity [21]; one of the main limitations found in the application of these actions is the identification of the areas that need priority intervention [22], such as those ones identified as vulnerable or subject to risk. In this regard, there are numerous studies that attempt to analyse the territory by identifying and mapping vulnerabilities and risks due to climate change [23,24]. However, the experiments have almost all been carried out in urban contexts where permeable and non-permeable surfaces are identified, and where the risk is given by the presence of man and his infrastructures [25]. On the other hand, the cases of assessments and mapping related to rural areas, agricultural areas and their landscape are very limited. The scientific literature in this sense is mainly focused on specific studies about agricultural crops, suggesting solutions and tools aimed not so much at land management and planning but rather at agronomic scale [26,27]. For this reason, a study like this, based on specific research funded by the Emilia–Romagna region on rural territories, represents a new approach to climate issues related to agriculture on a territorial scale. The research developed was built on the already existing data and information of the Emilia–Romagna region, including the output of previous projects.

2. Materials and Methods

About the European and global mitigation objectives, actions that conserve or improve carbon stocks have been much studied and implemented in recent years. Indeed, although the value of such actions has long been recognised within the climate science community, as successive IPCC reports and the Paris Agreement have shown, the growing momentum behind the need to achieve ‘zero’ emissions has brought a new urgency to exploring their potential, especially since the 2019 UN Climate Action Summit. In fact, while in the past a focus was on managing land use and land use change in the Global South, in order to mitigate climate change, nowadays a strong focus on agricultural soil as a carbon sink element is also necessary in more developed regions. A critical factor shaping carbon storage potential is the nature and organic component of the soil, particularly organic carbon, and the extent to which organic matter is added to the soil over time. Good soil management, through the use of agronomic practices geared towards carbon sequestration, such as the use of cover crops or zero tillage, is thought in the literature to bring long-term climate mitigation benefits, as soils can effectively sequester carbon, keeping it out of the atmosphere [28,29]. Currently, soil management in rural areas, due to current agricultural systems, is not proving effective in this regard; studies suggest that there is significant loss of soil organic carbon in several regions, especially in areas such as the Po Valley [30], so that European soils in agricultural areas are likely to be contributors to rather than absorbers of atmospheric carbon [31].
An estimated 86% of European agricultural areas have soil organic carbon losses caused by erosion due to the use of traditional, non-conservative tillage techniques [32,33,34], with greater losses in intensive systems than in those with lower levels of intensity [35]. Studies suggest that soil organic carbon loss varies within different farming systems, both due to the specificities of topology and climate, and according to land management practices [36].
The selected case study is the Emilia–Romagna region, in the centre-north of Italy, which covers an area of 22,510 km2 and has a population of 4.4 million inhabitants [37]. The climate is temperate sub-continental, with hot and humid summers and cold and frosty winters, tending to sublittoral only along the coastal strip [38]. According to the Corine land cover 2020 dataset elaborated by the Emilia–Romagna region with Copernicus data [39], the area is covered for 35.75% by artificial surfaces, for 30.05% by agricultural areas, for 0.91% by forests and semi-natural areas and for 33.29% by water bodies without considering the lagoon (Figure 1).
In the last year, in the Italian context, there has been a strong process of urbanisation that has led the Emilia–Romagna region to suffer a strong loss of potential agricultural land (8.93%) [40]. Considering the limited experimentation of the assessment and mapping of mitigation related to climate change effects, for this specific study, an ad hoc methodology was developed and tested, based on the general methodology proposed by the IPCC [41].

2.1. Mapping Approach

The aim of this study is to test a methodological model for the assessment of GHG balance focused on rural and agricultural land, useful for mitigation studies/interventions. As can be deduced from the scheme in Figure 2, agriculture and, more generally, land use are both a source of CO2 emission and absorption, so the assessment and related mapping of mitigation capacity will have to consider both positive and negative variables and determinants.
The assessment of the climate–gas balance cannot be summarised through a number, but must be interpreted by interpolating different information references. The more spatial data available, the greater the considerations regarding the degree of mitigation capacity of the territory. Here too, mapping plays a central role in identifying the priority areas for intervention and the most efficient measures with respect to the analysed territory (where and how).
The geospatial assessment of mitigation was based on regional geodatabases from which layers were selected to meet the objectives of the paper. Following the mitigation Equation (3), the selected layers were divided into two main categories, as shown in Table 1: emissions and absorption capacity. In the first category, there is (i) INEMAR (INventario EMissioni ARia) emissions and in the second one there are: (ii) agricultural crops and potential carbon sequestration; (iii) agronomic practices; (iv) presence of hedgerows and rows; and (v) potential carbon sequestration (ES-CST).
The used approach regarding the construction of the cognitive framework and the mapping includes two phases, as illustrated in Figure 3:
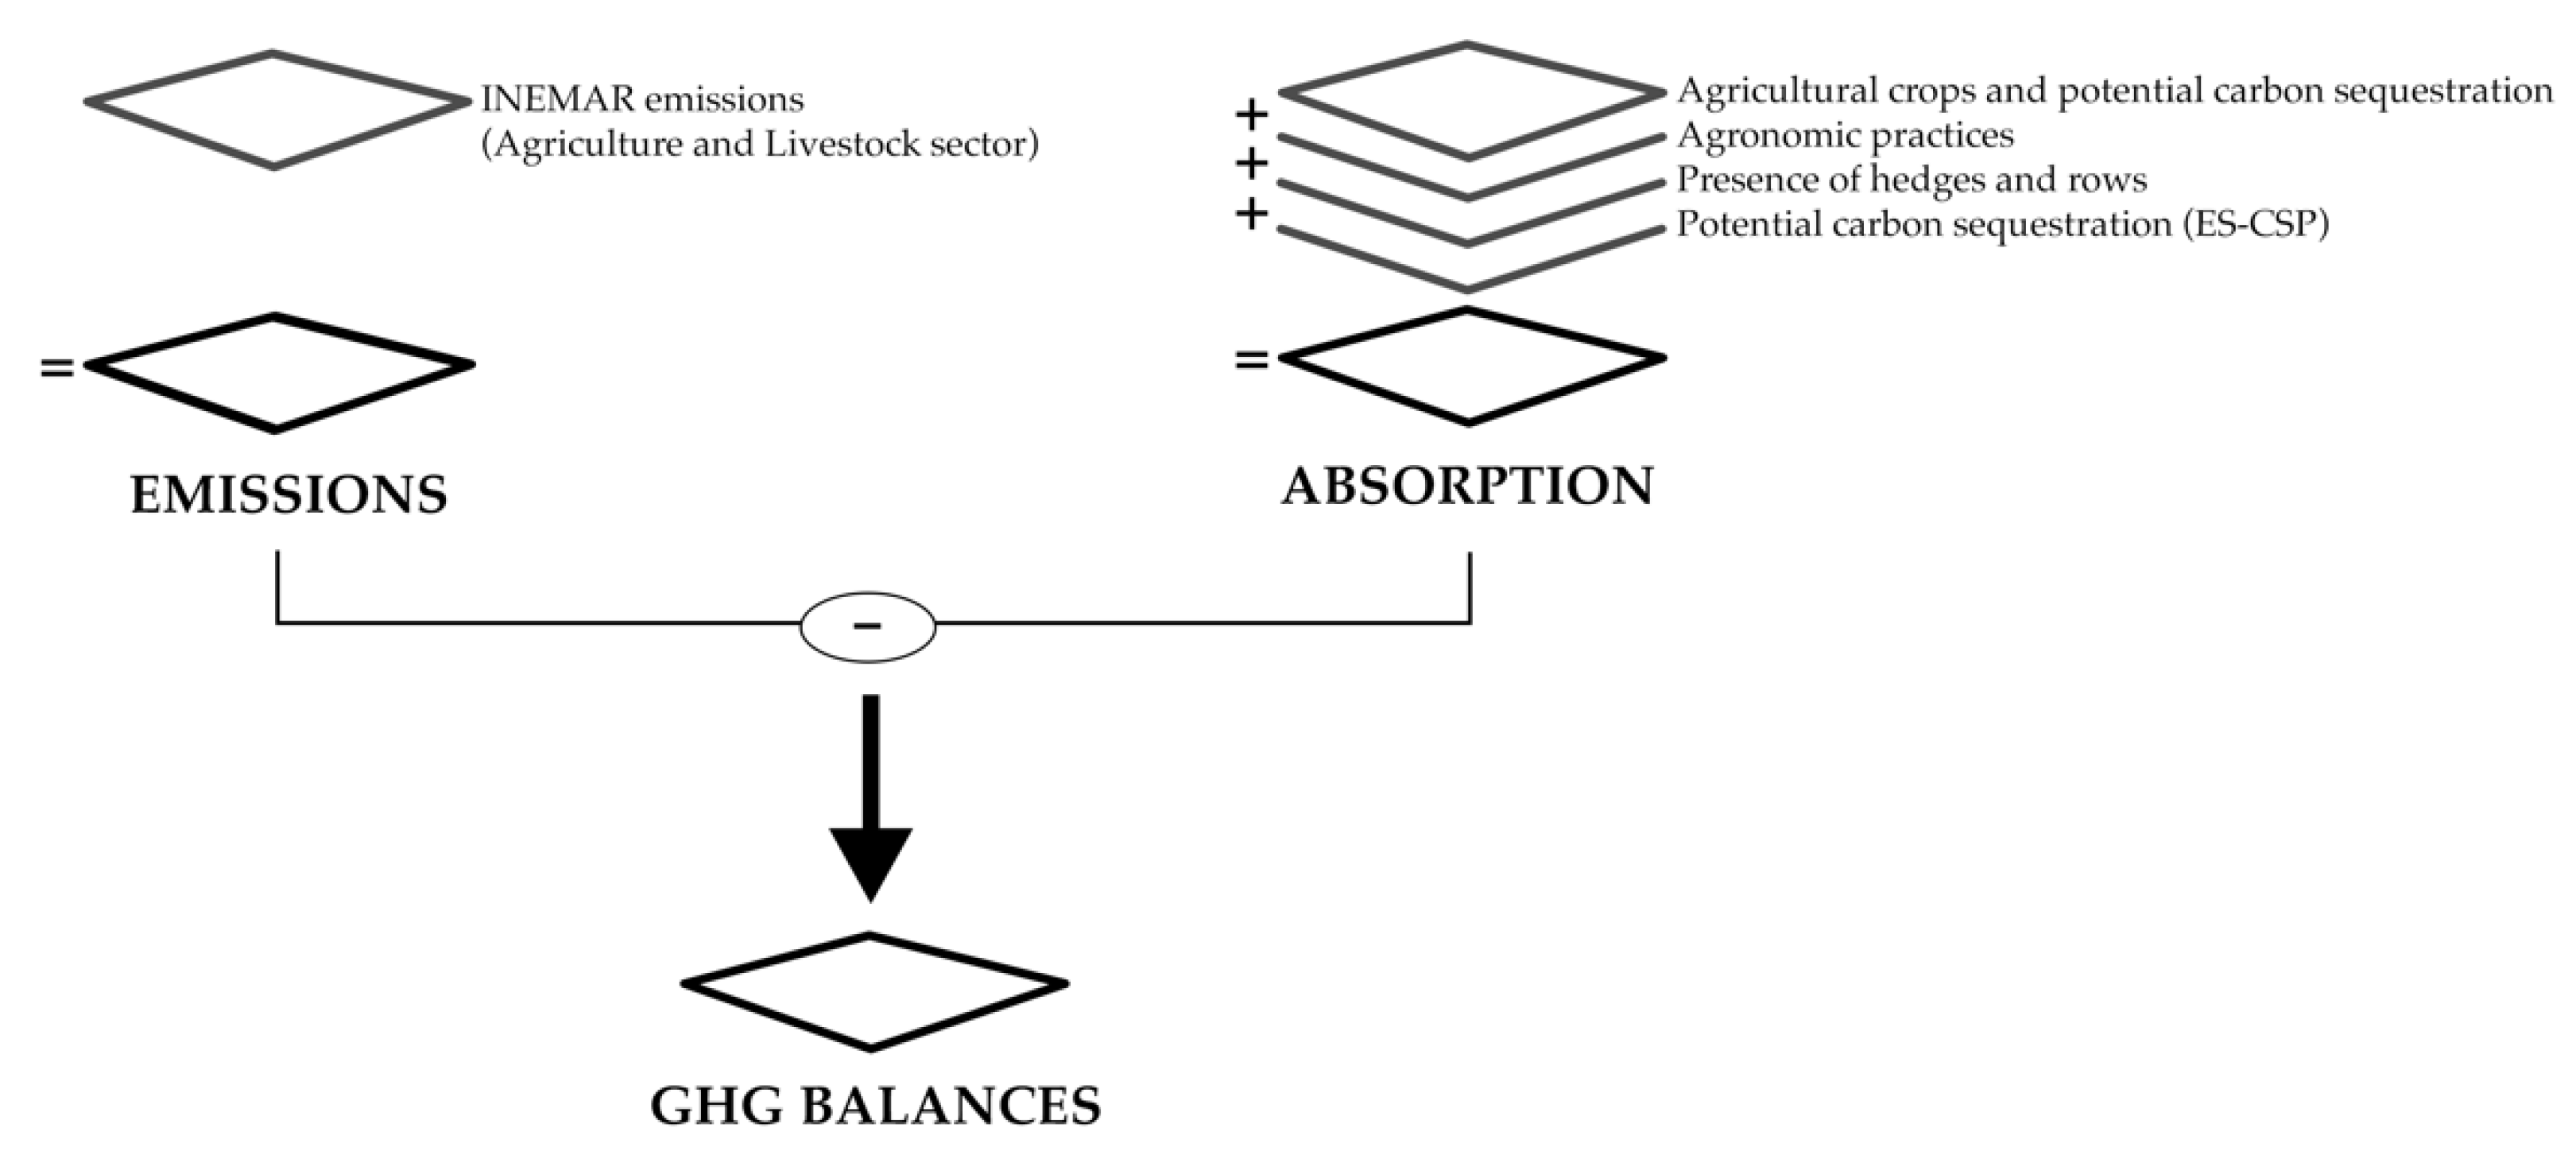
  • Assessment and mapping of GHG emissions.
  • Assessment and mapping of GHG absorption.
These steps were developed using different spatial criteria to quantify different properties.

2.2. Step 1: Assessment and Mapping of GHG Emissions

The evaluation of the Emilia–Romagna region’s rural territory emissions was based on a cognitive framework based on the layer: (i) INEMAR emissions. The regional inventory of atmospheric emissions is carried out through the INEMAR software, a tool developed and progressively updated in the framework of an interregional convention that currently involves, in addition to Emilia–Romagna, other Italian regions. The reference methodology implemented in INEMAR is the EMEP-CORINAIR methodology. Emission data are returned at municipal level. The classification of emissions according to this methodology involves the use of the SNAP (Selected Nomenclature for Sources of Air Pollution) coding and estimation according to it. The anthropogenic and natural activities that can give rise to emissions into the atmosphere are divided into 11 macro-sectors, including “Energy production and fuel processing”, “Industrial and Non-industrial combustion”, “Road Transport”, “Agriculture and Livestock”, “Waste treatment and disposal” and others. Based on this research activity, the study will focus on Agriculture and Livestock (macro-sector 10), which in turn is divided into 6 sectors (Table 2):
  • Fertilizer Crops;
  • Crops without fertilizers;
  • Enteric fermentation;
  • Wastewater management with reference to organic compounds;
  • Wastewater management related to nitrogen compounds;
  • Particulate emissions from livestock farms.
This emissions inventory considers different air pollutants, whose data are expressed in tonnes/year, where:
  • NOx: nitrogen oxides—indirect greenhouse gas;
  • PTS: total suspended dust;
  • PM10: dust with a diameter of less than 10 mm;
  • PM2.5: dust with a diameter of less than 2.5 mm;
  • NH3: ammonia;
  • VOCs: volatile organic compounds—indirect greenhouse gases;
  • N2O: nitrous oxide—greenhouse gas;
  • CH4: methane—greenhouse gas.
The result is an information layer in which the territory is characterised by agricultural GHG emissions on a municipal scale. About the information layer, a normalisation of the values was followed, according to the Equation (1):
A = X X m i n / X m a x X m i n
where:
  • X = value considered;
  • Xmin = minimum value of the class of the specific layer;
  • Xmax = maximum value of the class of the specific layer.

2.3. Step 2: Assessment and Mapping of GHG Absorption

The second phase consists of the study of the territorial capacity to absorb climate-altering gases in terms of (ii) agricultural crops and their potential carbon sequestration; (iii) agronomic practices; (iv) presence of hedges and rows; (v) potential carbon sequestration (ES-CST).
The presence of (ii) agricultural crops plays an important role in the production and storage of CO2 from and in the soil, an illustration of which is the fact that, on average, ploughed land emits 2 to 3 times more GHG into the atmosphere than land left fallow [42]. The presence of crops, in fact, helps the mixing of soil and organic particles as it breaks up soil aggregates, thus favouring the production of CO2. Although agricultural soils are also a significant source of carbon dioxide emissions, the choice of a certain type of crop rather than another can favour greater carbon dioxide capture [43]. The proposed methodology is based on the layers of crop graphs, to which each individual crop is assigned a scale of values (‘high’, ‘medium’, ‘low’) based on the biomass production by the crop under consideration, intended as a proxy for the carbon stored in life cycle. In addition, for each crop, a dichotomous value ‘Yes’ or ‘No’ was assigned based on the potential to vary its carbon storage in the soil according to tillage techniques (Appendix A). These values were assigned following (10) interviews conducted with local agronomists and agricultural scientists in the first phase of this research and from the study of agronomic manuals [44,45,46]. It may be misleading considering an intensive agricultural crop with high CO2 uptake capacity, such as beet or maize, in the same way as a forest or fruit crop with much longer growing cycles and negligible soil movement [47].
In the analysis of element (iii) agronomic practices, those with minimal or no tillage, namely those that do not envisage the use of ploughing, were not taken into account and are associated with zero CO2 emissions due to a different diffusivity of the gases in the soil, which are less free to move [48]. About this specific reason, a specific layer was considered in the methodology, derived from a layer provided by the Emilia–Romagna region with respect to the specific commitments of the second pillar. On this layer, a selection was made with respect to those soils that fell within the commitment ‘10.1.04—Conservation agriculture and increase in organic matter’ of the RDP, which finances agricultural enterprises to meet the additional costs and lost revenues resulting from commitments arising from the introduction of conservation agriculture, as opposed to conventional agriculture. Although it is true that the use of these techniques depends first and foremost on the willingness of the farmer, who could also implement these actions on a voluntary basis, it was nevertheless decided to consider this layer as a significant proxy for the presence of these practices in the territory.
The layer (iv) related to the presence of hedges and rows certainly represents an informative reference level of information with respect to the mitigation capacity of an agricultural context. Such elements, in fact, are generally positioned in marginal portions of agricultural land, often not used for agricultural production, thus determining an additional net sequestration of CO2 for these spaces.
Only the CST service, i.e., the (v) carbon sequestration potential, the information layer considered necessary to assess the potential capacity of soils to store carbon dioxide, was considered for the analysis with respect to exposure. The layer was produced for the entire lowland as part of the SOS4LIFE project [49]. Maps of the ecosystem services provided by soils for the lowland area have been published and are freely downloadable, containing the mapping of several ecosystem services including:
-
BIO: Habitat for soil organisms;
-
BUF: Protective capacity;
-
CST: Carbon stock (potential);
-
PRO: Biomass production;
-
WAR: Deep water infiltration;
-
WAS: Water reserve.
For each of the (4) individual information layers, a normalisation of the values was followed, according to Equation (1).
The maximum observed value is set equal to 1, and the value 0 indicates the relative minimum in the area considered, which is the entire Emilia–Romagna plain. A complete mapping of the ecosystem service for the entire Emilia–Romagna region is not available for this layer, since there are no values for the Apennines. Carrying out this operation in a GIS environment made it possible to obtain 4 layers, with the same scale of values expressed from 0–1 and therefore comparable. This made it possible to aggregate the aspects examined and to obtain a general overview based on Equation (2):
B = X i i + X i i i + X i v + X v / 4
where:
  • Xii = agricultural crops and their potential carbon sequestration;
  • Xiii = agronomic practices;
  • Xiv = presence of hedges and rows;
  • Xv = potential carbon sequestration (ES-CST).
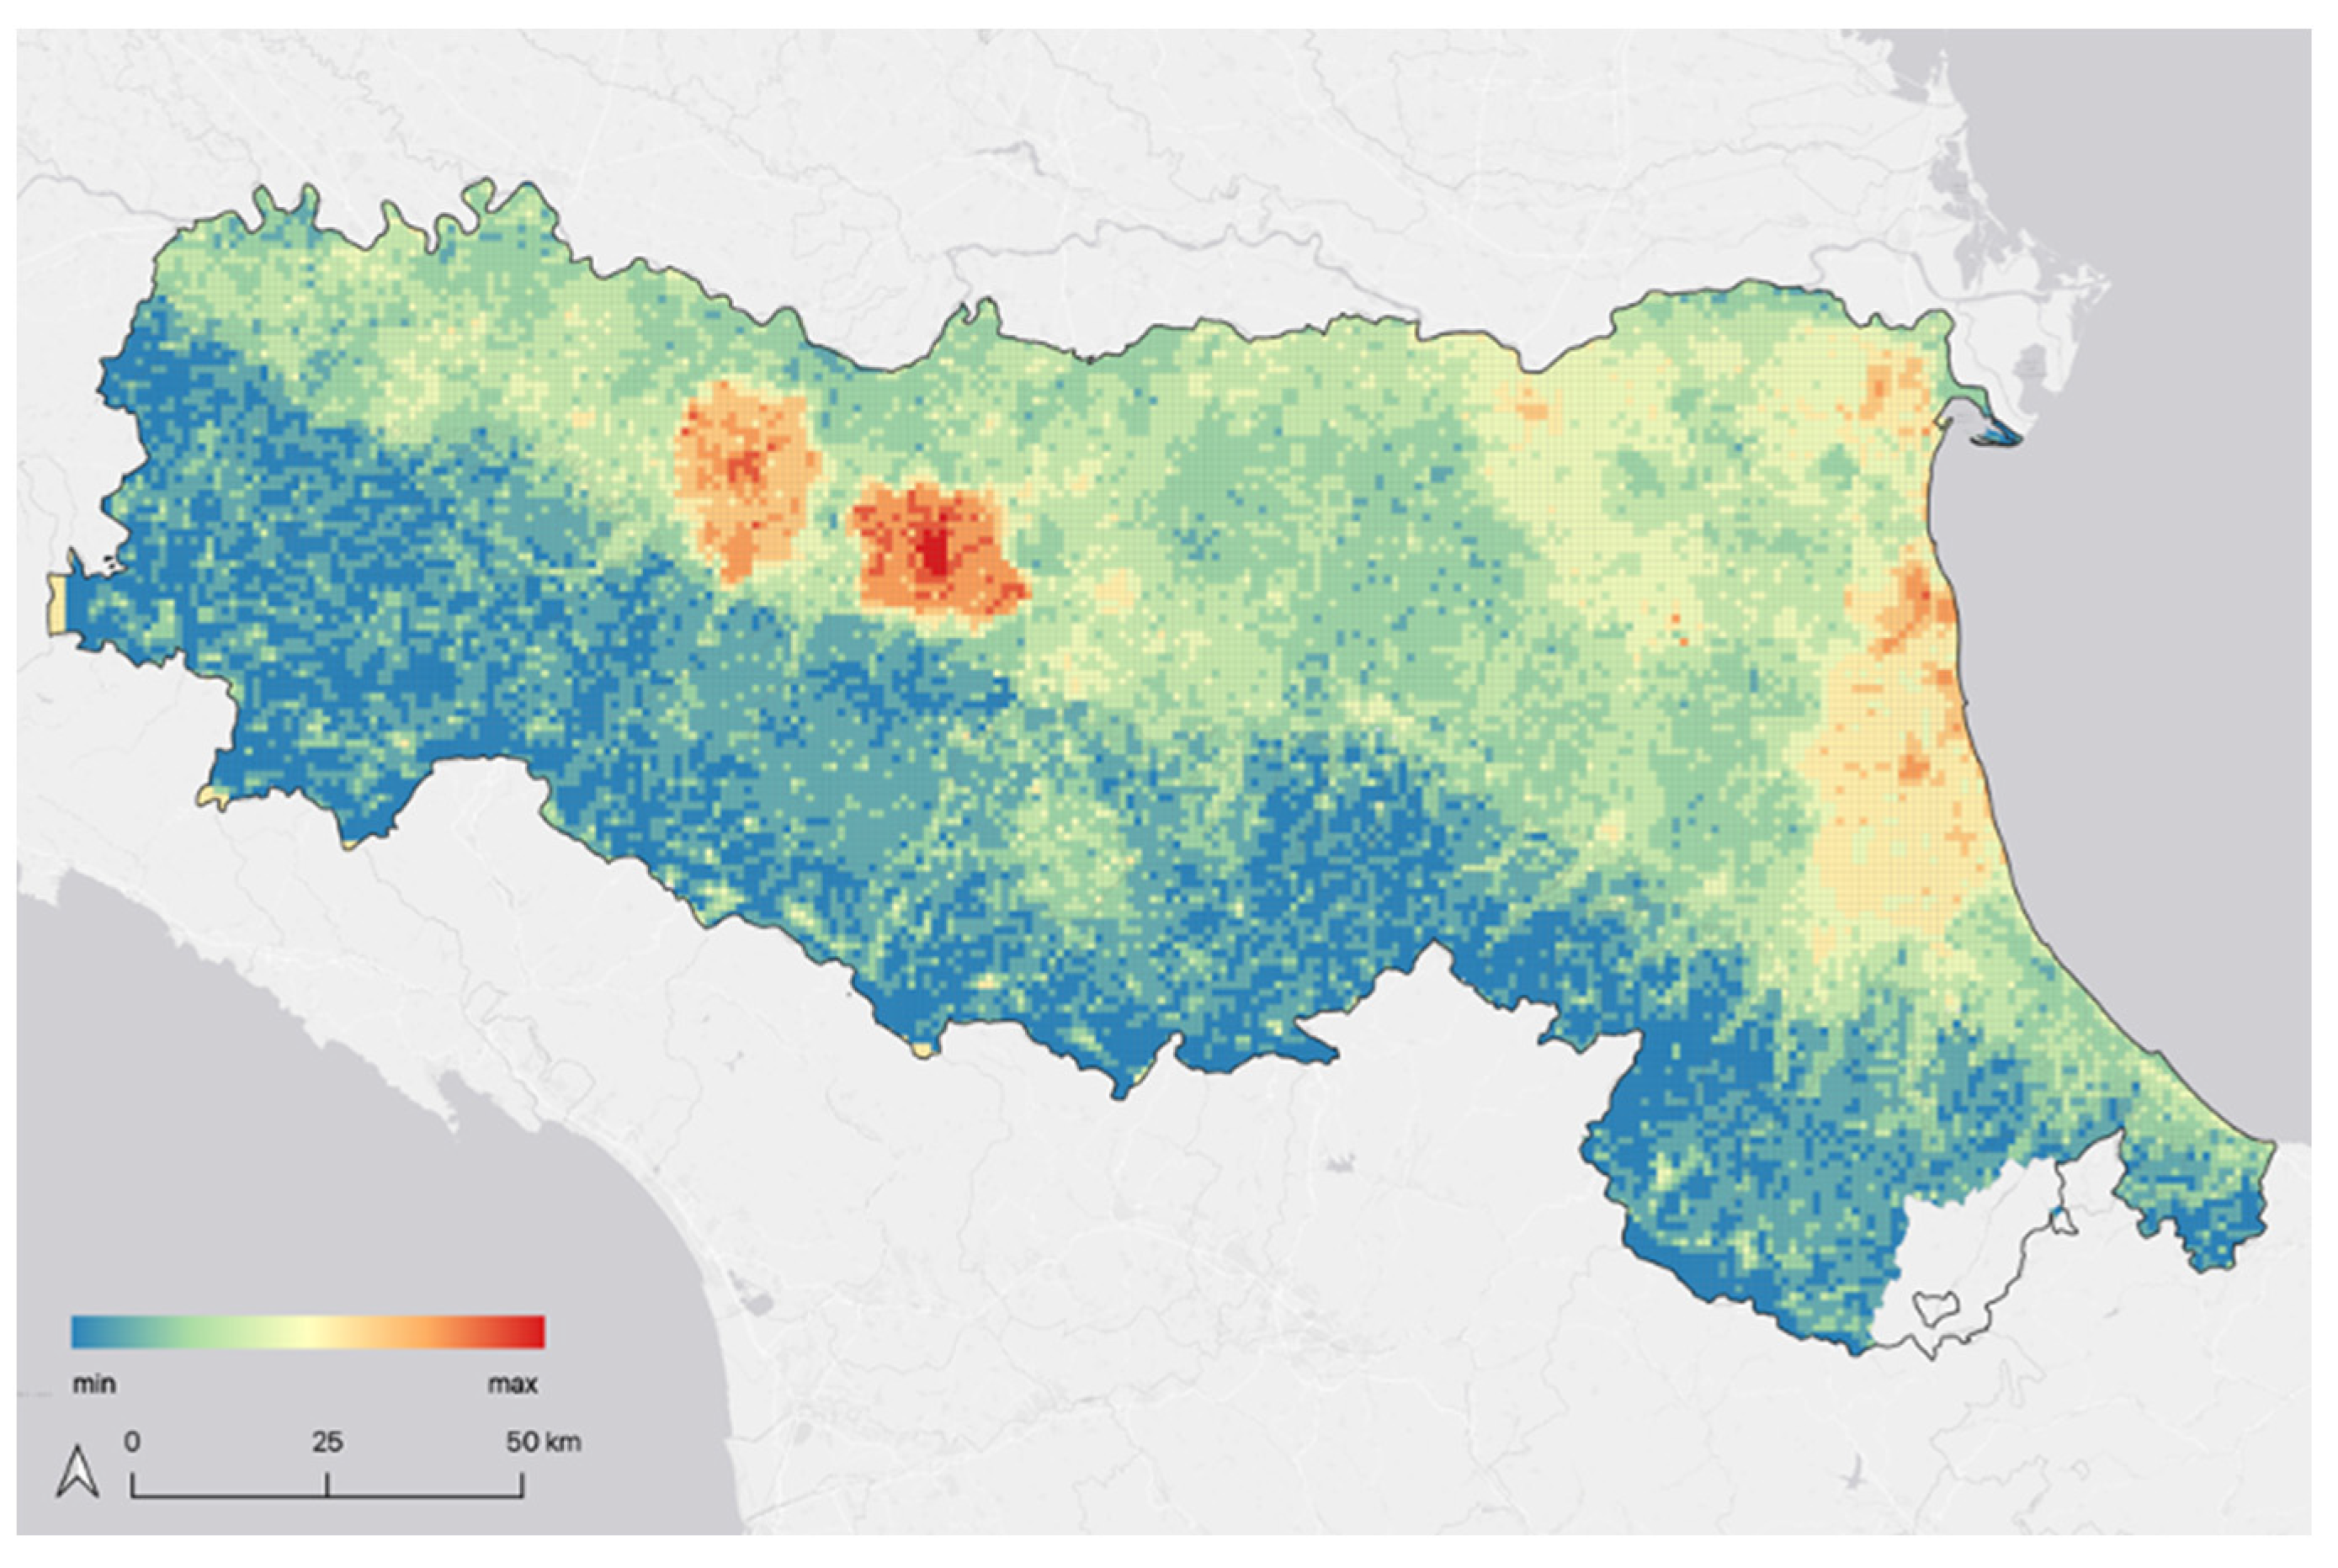
3. Results

Based on the equations shown and the geospatial processing carried out in GIS, it is possible to assess the GHG balance. To do this, the two layers obtained (GHG emissions and GHG absorption, respectively) are further processed using Equation (3):
GHG = E A
where:
  • GHG = GHG balance;
  • E = GHG emissions;
  • A = GHG absorption.
To produce this map (Figure 4), a matrix was created in which the different layers were used and processed according to a mesh structure consisting of cells with a side of 1 km.
In Figure 4, the main result on the spatial distribution of the GHG balance is displayed, from which it is possible to identify areas with a positive GHG balance and thus a higher presence of non-absorbed pollutants.
Approximately 2,212,064 ha of “emissive” area was mapped, of which the “Low” and “Medium-Low” GHG balance classes account for about 44%, while 25.37% fall into the “High” and “Medium-High” classes, as reported in Table 3. The middle class is the largest, reaching almost 31% of the total.
In the Apennine zone, it is possible to observe a predominantly negative balance, which therefore presents a lower quantity of CO2 equivalent emitted than that sequestered. This is by virtue of a context characterised by the presence of the Apennine ridge and passes, which favour a high level of potential sequestration on the ground, thanks also to the consistent presence of tree elements and in particular cow pastures, heaths, mountain grasslands in the higher altitudes and chestnut groves and mesophyll broadleaf forests in the lower zones. The GHG balance of the lowland area is considered neutral overall under an average emission scenario and an average sequestration capacity by virtue of a complex agrarian mosaic. In detail, two areas are characterised by a positive balance due to high emissive content, namely the area between Parma and Reggio Emilia and the area from Ravenna to the Comacchio Valleys. The considerable emissions related to the provinces of Parma and Reggio Emilia are linked to the large number of cattle farms (Figure 5) in the area for dairy production; in fact, these areas are characterised by the production of multiple Protected Designation of Origin (PDO) products (such as Parmigiano Reggiano and Prosciutto di Parma) and a Protected Geographical Indication (PGI) product. Parma, with 12 supply chains in the PDO and PGI food sector, is Italy’s leading province in terms of economic value generated, with a turnover of EUR 1.1 billion, equal to 18.3% of the national IG food sector [50].
The area between Ravenna and the Comacchio Valleys, on the other hand, has a high balance due in part to the consistent production of industrial and horticultural crops (such as the Pera dell’Emilia–Romagna PGI and the Pesca e Nettarina di Romagna PGI), and also due to the strong presence of aquaculture, which has a significant Life Cycle Assessment (LCA) impact on emissions. In the hillside area, from the point of view of climate-altering gases, there is a substantially neutral balance between the quantities of equivalent CO2 emitted and sequestered. This fact depends on an average emissive framework of the rural territory and a discrete level of potential storage on the ground and a good presence of tree elements even in the productive agricultural context, characterised, furthermore, by crops with a high photosynthetic capacity. The areas of the high hills and mountains of Emilia–Romagna are characterised by a decidedly low emission profile with respect to the balance of climate-altering gases, thanks to a high storage capacity due to the significant surface area covered by woods and a moderate emission of pollutants in the agricultural context; in fact, the autumn–winter arable crops represent a limited source of emissions.

4. Discussion

This study investigated and described a developed methodology for the spatial analysis of mitigation applied to the rural context of the Emilia–Romagna Region. The study shows a step-by-step guide on how to develop an approach to identify the GHG balance and the areas with the greatest presence of greenhouse gases that are not absorbed and/or sequestered. Although the use of a more detailed database should allow for the more in-depth knowledge of performance, the proposed methodology permits a relevant assessment at a regional scale, which is mainly useful for policy making and spatial planning decisions [51]. Moreover, the advantage of this approach is the ease with which it can be replicated in other spatial contexts, through the definition of local proxies. These must be based on available information layers, usually held by the local government, or which can be obtained from satellite data [3].
The analysis conducted, considering the specific limitations, can represent a good starting point for assessing mitigation. The limits identified can be briefly summarised as follows:
  • with regard to the datasets used, a limited availability of some uniform layers for the whole regional area (e.g., the Potential Carbon Sequestration, which does not cover the whole area);
  • the lack of dynamism of some layers with respect to the real evolution of the territory (e.g., the INEMAR emission data date back to 2017, although the updating of the regional inventory of atmospheric emissions should be carried out at least every three years);
  • the techniques used with respect to agronomic practices depend on the willingness of the farmer, who could also implement these actions on a voluntary basis;
  • the inevitable approximation of reality, resulting from the use of a limited set of layers.
Therefore, further exploration and practical implementation is necessary to obtain important knowledge and fill existing gaps. This type of study can influence both the choice of certain mitigation strategies and the areas of application and can be applied and adapted, in particular, in the definition of actions resulting from agricultural policy and landscape planning. Furthermore, the research can be deepened with the definition of a GHG risk classification in the study area, so that the methodology discussed in this paper can become a tool that can make important additions to landscape planning instruments such as the Regional Landscape Plan or Rural Development Plans.
Future implementations, which concern the definition of a risk classification, can guarantee greater detail, depth and knowledge of the territory.

5. Conclusions

This article highlights how the issue of mitigation and GHG balance can be investigated on a large regional scale in rural territory, and how this method represents a new approach to agriculture-related climate issues on a territorial scale.
This method can be replicated for the assessment and mapping of different factors, which persist in parallel, and could allow a synoptic vision of territories with respect to climate change. This paper provides a methodology capable of assessing mitigation in rural contexts, which could be extremely important in future Common Agricultural Policy, where giving priority in action to the most vulnerable territories—such as with the Nitrate Directive—is an important act of resource efficiency, in order to finance more result-based actions. In conclusion, it is clear that without an extensive planning and political process promoted by public administration and local commitment, it is not easy for private citizens and farmers to work synergistically to minimise negative effects and GHG emissions.

Author Contributions

Conceptualization, K.F., G.D.G., A.B. and G.L.; Data curation, K.F., A.B. and G.D.G.; Formal analysis, M.R. and G.L.; Investigation, K.F. and A.B.; Methodology, K.F., G.D.G. and G.L.; Resources, G.D.G. and A.B.; Software, K.F.; Supervision, M.R. and G.L.; Validation, G.D.G., M.R. and G.L.; Visualization, K.F.; Writing—original draft, K.F. and A.B.; Writing—review and editing, K.F., A.B. and G.D.G. All authors have read and agreed to the published version of the manuscript.

Funding

This research was funded by Regione Emilia Romagna and Università Iuav di Venezia, grant number E78D20000880007 and The APC was funded by Università Iuav di Venezia.

Institutional Review Board Statement

Not applicable.

Informed Consent Statement

Not applicable.

Data Availability Statement

Publicly available datasets were analysed in this study. These data can be found here: INEMAR (INventario EMissioni ARia) emissions: https://datacatalog.regione.emilia-romagna.it/catalogCTA/dataset/inventario-regionale-emissioni-in-atmosfera-inemar (accessed on 20 February 2022); agricultural crops and potential carbon sequestration: https://agreagestione.regione.emilia-romagna.it/agrea-file/ (accessed on 19 February 2022); agronomic practices: https://agricoltura.regione.emilia-romagna.it/produzioni-agroalimentari/temi/bio-agro-climambiente (accessed on 3 March 2022); presence of hedgerows and rows: https://agreagestione.regione.emilia-romagna.it/agrea-file/ (accessed on 23 February 2022); potential carbon sequestration (ES-CST): https://ambiente.regione.emilia-romagna.it/it/geologia/suoli/suoli-pianificazione/servizi-ecosistemici-del-suolo (accessed on 1 April 2022).

Acknowledgments

We are highly thankful for administrative and technical support (such as the materials used for the studies): Emilia-Romagna Region, in particular: Graziella Guaragno; Giovanni Pancaldi, Forestry Standards; Nicola Laruccia, Zoning and Crop Graphic Plans; Agriculture Service; Paola Tarocco, Soil Service; Patrizia Bianconi, Sustainable Development; Sofia Cei, Agritourism; Paola Siragusa, Agricultural Motor Users; Giampaolo Sarno, Effluents and Livestock Waste; Eng. Patrizia Ercoli, Plans and Programs Hydraulic Sector. ARPAE Emilia–Romagna, in particular: C. Cacciamani and R.Tomozeiu; Iuav University of Venice: Gianfranco Pozzer.

Conflicts of Interest

No conflict of interest is declared by the authors.

Appendix A. CO2 Sequestered for Type of Crop

Type of CropCO2 SequesteredDependent on Soil Working Techniques
ACHILLEALowYes
GARLICLowYes
AGRETTOLowYes
ALTEALowYes
AMARANTHighYes
ANETOLowYes
COMMON ANISE LowYes
ARACHIDLowYes
OATMediumYes
BARBABIETOLAHighYes
BASILLowYes
WHITSPINHighYes
BIETOLAMediumYes
BORAGEMediumYes
HEMPHighYes
MISCANTHUS SINENSISHighYes
SUGAR CANEHighYes
CARROTLowYes
CAULIFLOWERLowYes
CABBAGE RAPALowYes
CHICKPEALowYes
CETRIOLLowYes
CHENOPODIUM QUINOALowYes
CHICKBERRYLowYes
CYCLAMIN LowYes
CHICORYLowYes
COLZAMediumYes
CORIANDOLMediumYes
CRESCIONLowYes
CUMINLowYes
CHIVELowYes
MEDIUM HERBHighYes
HERBSHighYes
FACELIAHighYes
BEANSMediumYes
FARROMediumYes
STRAWBERRYLowYes
NUTSHighYes
IRISLowYes
SUNFLOWERHighYes
WHEAT DURUM/TENEROMediumYes
SANDWHEATMediumYes
GRANTURCOHighYes
HYPERICOMediumYes
HYSSOPMediumYes
RASPBERRYMediumYes
LAVENDERLowYes
GRAIN LEGUMESMediumYes
LENTILSMediumYes
LINENMediumYes
LOIETTOHighYes
LUPINELLAMediumYes
ALMONDHighYes
MINTLowYes
PEPPERMINTLowYes
LEMONMediumYes
BLUEBERRY HighYes
NITROGEN-FIXING MIXMediumYes
WALNUTHighYes
OLIVEHighYes
BARLEYMediumYes
PANICOMediumYes
PEAKMediumYes
RAFFINHighYes
RAVIZZONEMediumYes
RICEMediumYes
CELERYLowYes
SEGALAMediumYes
SEEDSALMediumYes
SENAPEMediumYes
SOYAMediumYes
SORBMediumYes
SORGUMMediumYes
TOPINAMBURMediumYes
TRITICALMediumYes
TRITORDEUMMediumYes
VECCEMediumYes
VERBENA OFFICINALELowYes
VINEHighYes
SAFFRONLowYes
PUMPKINMediumYes
ZUCCHINOLowYes
Source: interviews conducted with local agronomists and farmers and agronomic manuals.

References

  1. Lucertini, G.; Di Giustino, G. Urban and Peri-Urban Agriculture as a Tool for Food Security and Climate Change Mitigation and Adaptation: The Case of Mestre. Sustainability 2021, 13, 5999. [Google Scholar] [CrossRef]
  2. Tripathi, A.; Tripathi, D.K.; Chauhan, D.K.; Kumar, N.; Singh, G.S. Paradigms of climate change impacts on some major food sources of the world: A review on current knowledge and future prospects. Agric. Ecosyst. Environ. 2016, 216, 356–373. [Google Scholar] [CrossRef]
  3. Di Giustino, G.; Bonora, A.; Federico, K.; Reho, M.; Lucertini, G. Spatial Analysis of the Vulnerability to Flooding in the Rural Context: The Case of the Emilia Romagna Region. Atmosphere 2022, 13, 1181. [Google Scholar] [CrossRef]
  4. European Union. Delivering the European Green Deal: The Decisive Decade; European Commission: Brussels, Belgium, 2021. [Google Scholar] [CrossRef]
  5. Erbach, G. Effort Sharing Regulation, 2021–2030: Limiting Member States’ Carbon Emissions; EPRS: European Parliamentary Research Service: Bruxelles, Belgium, 2018. [Google Scholar]
  6. Lugato, E.; Cescatti, A.; Jones, A.; Ceccherini, G.; Duveiller, G. Maximising climate mitigation potential by carbon and radiative agricultural land management with cover crops. Environ. Res. Lett. 2020, 15, 094075. [Google Scholar] [CrossRef]
  7. Pahar, S.P.P.; Nursaputra, M. Mapping of carbon absorption based on land use in upstream of Jeneberang watershed. IOP Conf. Ser. Earth Environ. Sci. 2020, 575, 012237. [Google Scholar] [CrossRef]
  8. Seneviratne, S.I.; Phipps, S.J.; Pitman, A.J.; Hirsch, A.L.; Davin, E.L.; Donat, M.G.; Kravitz, B. Land radiative management as contributor to regional-scale climate adaptation and mitigation. Nat. Geosci. 2018, 11, 88–96. [Google Scholar] [CrossRef]
  9. Chapman, M.; Walker, W.S.; Cook-Patton, S.C.; Ellis, P.W.; Farina, M.; Griscom, B.W.; Baccini, A. Large climate mitigation potential from adding trees to agricultural lands. Glob. Chang. Biol. 2020, 26, 4357–4365. [Google Scholar] [CrossRef]
  10. Costantini Scala, A.; Asdrubali, F.; Presciutti, A. Rete Rurale Nazionale. Sfide ed Opportunità dello Sviluppo Rurale per la Mitigazione e L’adattamento ai Cambiamenti Climatici. Piano Strategico dello Sviluppo Rurale. L’agricoltura a Beneficio di Tutti; Ministero delle Politiche Agricole Alimentari e Forestali: Rome, Italy, 2012; ISBN 9788896095119.
  11. Gonzalez-Sanchez, E.J.; Veroz-Gonzalez, O.; Conway, G.; Moreno-Garcia, M.; Kassam, A.; Mkomwa, S.; Carbonell-Bojollo, R. Meta-analysis on carbon sequestration through Conservation Agriculture in Africa. Soil Tillage Res. 2019, 190, 22–30. [Google Scholar] [CrossRef]
  12. Marino, D.; Palmieri, M.; Marucci, A.; Pili, S. Long-term land cover changes and ecosystem services variation: Have the anthropogenic transformations degraded human well-being in Italy? Ital. Rev. Agric. Econ. 2022, 77, 7–23. [Google Scholar] [CrossRef]
  13. Naumann, S.; Davis, M. Biodiversity and Nature-Based Solutions: Analysis of EU Funded Projects; Independent Expert Report; Publications Office of the European Union: Luxembourg, 2020. [Google Scholar] [CrossRef]
  14. Stocker, T.F.; Qin, D.; Plattner, G.-K.; Tignor, M.; Allen, S.K.; Boschung, J.; Nauels, A.; Xia, Y.; Bex, V.; Midgley, P.M.; et al. Climate Change 2013: The Physical Science Basis. Contribution of Working Group I to the Fifth Assessment Report of the Intergovernmental Panel on Climate Change; Cambridge University Press: Cambridge, UK, 2013. [Google Scholar] [CrossRef] [Green Version]
  15. Seddon, N.; Chausson, A.; Berry, P.; Girardin, C.A.; Smith, A.; Turner, B. Understanding the value and limits of nature-based solutions to climate change and other global challenges. Philos. Trans. R. Soc. B 2020, 375, 20190120. [Google Scholar] [CrossRef] [Green Version]
  16. Seddon, N.; Daniels, E.; Davis, R.; Chausson, A.; Harris, R.; Hou-Jones, X.; Wicander, S. Global recognition of the importance of nature-based solutions to the impacts of climate change. Glob. Sustain. 2020, 3, E15. [Google Scholar] [CrossRef]
  17. Yating, Z.; Bilal, M.A. Chapter 2—Temperature extremes in a changing climate. In Climate Change and Extreme Events; Elsevier: Amsterdam, The Netherlands, 2021; pp. 9–23. [Google Scholar] [CrossRef]
  18. Allwood, J.M.; Bosetti, V.; Dubash, N.K.; Gómez-Echeverri, L.; Stechow, C.V.; D’Agosto, M.; Zwickel, T. Glossary, Acronyms and Chemical Symbols [Annex I]. In Climate Change 2014: Mitigation of Climate Change; Cambridge University Press: Cambridge, UK, 2014; pp. 1247–1279. [Google Scholar]
  19. Miralles-Wilhelm, F. Nature-Based Solutions in Agriculture: Sustainable Management and Conservation of Land, Water and Biodiversity; Food and Agriculture Organization: Rome, Italy, 2021. [Google Scholar] [CrossRef]
  20. Bellamy, R.; Osaka, S. Unnatural climate solutions? Nat. Clim. Chang. 2020, 10, 98–99. [Google Scholar] [CrossRef]
  21. Altieri, M.A.; Nicholls, C.I.; Henao, A.; Lana, A.M. Agroecology and the design of climate change-resilient farming systems. Agron. Sustain. Dev. 2015, 35, 869–890. [Google Scholar] [CrossRef] [Green Version]
  22. Litt, G.; Ferraioli, E.; Magni, F.; Lucertini, G.; Musco, F. Inter-Municipal Methodology for Climate Transition Strategies: The First Case in Italy. Sustainability 2022, 14, 2529. [Google Scholar] [CrossRef]
  23. Klein, R.J. Identifying countries that are particularly vulnerable to the adverse effects of climate change: An academic or political challenge. Carbon Clim. Law Rev. 2009, 3, 284. [Google Scholar] [CrossRef]
  24. Muccione, V.; Allen, S.K.; Huggel, C.; Birkmann, J. Differentiating regions for adaptation financing: The role of global vulnerability and risk distributions. Wiley Interdiscip. Rev. Clim. Chang. 2017, 8, e447. [Google Scholar] [CrossRef]
  25. Maragno, D.; Dall’omo, C.F.; Pozzer, G.; Musco, F. Multi-Risk Climate Mapping for the Adaptation of the Venice Metro-politan Area. Sustainability 2021, 13, 1334. [Google Scholar] [CrossRef]
  26. Bonari, E.; Ceccon, P. Verso un Approccio Integrato allo Studio dei Sistemi Colturali; FrancoAngeli: Milan, Italy, 2002; Volume 202, ISBN 9788846440709. [Google Scholar]
  27. Avagnina, S.; Del Vecchio, A.; Gaudino, S.; Goia, I.; Sacco, D.; Grignani, C.; Bourlot, G. Programma di Sviluppo Rurale. Monitoraggio Intensivo Mediante una Rete di Casi Studio Sulle Tecniche Agronomiche e sui Terreni Agrari; Progetto MITA NET: Milan, Italy, 2012. [Google Scholar]
  28. Soane, B.D.; Ball, B.C.; Arvidsson, J.; Basch, G.; Moreno, F.; Roger-Estrade, J. No-till in northern, western and south-western Europe: A review of problems and opportunities for crop production and the environment. Soil Tillage Res. 2012, 118, 66–87. [Google Scholar] [CrossRef] [Green Version]
  29. Tellatin, S.; Myers, R.L. Cover crop impacts on US cropland carbon sequestration. J. Soil Water Conserv. Sept. 2018, 73, 117A–121A. [Google Scholar] [CrossRef]
  30. Jones, R.J.A.; Hiederer, R.; Rusco, E.; Loveland, P.J.; Montanarella, L. The Map of Organic Carbon in Topsoils in Europe, Version 1.2, September 2003: Explanation of Special Publication Ispra 2004 No. 72 (S.P.I.04.72); European Soil Bureau Research Report, No.17, EUR 21209 EN, 26pp. and 1 Map in ISO B1 Format; Office for Official Publications of the European Communities: Luxembourg, 2004. [Google Scholar]
  31. Lugato, E.; Paustian, K.; Panagos, P.; Jones, A.; Borrelli, P. Quantifying the erosion effect on current carbon budget of European agricultural soils at high spatial resolution. Glob. Chang. Biol. 2016, 22, 1976–1984. [Google Scholar] [CrossRef] [Green Version]
  32. Renzi, G. Carbonio Organico e Uso del Suolo; Università Degli Studi Della Tuscia: Viterbo, Italy, 2016; Available online: http://hdl.handle.net/2067/3018 (accessed on 10 January 2022).
  33. Conselvan, G.B. Suoli Sottoposti a Tecniche di Agricoltura Conservativa: Studio dei Parametri Chimico-Biologici; Università degli Studi di Padova, Dipartimento Agronomia Animali Alimenti Risorse Naturali e Ambiente: Padua, Italy, 2013. [Google Scholar]
  34. Fracasso, R. L’applicazione dell’agricoltura conservativa per garantire la funzionalità del suolo quale bene pubblico nella riforma della Politica Agricola Comunitaria (PAC). Aestimum 2015, 43, 165–176. [Google Scholar] [CrossRef]
  35. Pérez-Soba, M.; Paracchini, M.L.; Barredo, J.; Caudullo, G.; Cormont, A.; van Doorn, A.; van Eupen, M.; Guiomar, N.; Hendriks, K.; Miguel Ayala, L.; et al. Deliverable 2.2: Database and Classification System of Different Types of PG/ESS in Relation to Farming/Forestry Systems; PEGASUS: Public Ecosystem Goods and Services from Land Management—Unlocking the Synergies; European Commission: Luxembourg, 2016. [Google Scholar]
  36. Füssel, H.M. Climate Change, Impacts and Vulnerability in Europe 2012 (EEA Report No 12/2012)-Version of 20.06. 2013; European Environment Agency (EEA): Copenhagen, Denmark, 2012. [Google Scholar]
  37. Regione Emilia-Romagna Statistica. Available online: https://statistica.regione.emilia-romagna.it/ (accessed on 16 April 2022).
  38. Centro Meteo. Il Clima Della Regione Emilia-Romagna. Available online: http://www.centrometeo.com/articoli-reportage-approfondimenti/climatologia (accessed on 11 January 2022).
  39. Regione Emilia-Romagna Geoportale. Coperture Vettoriali Uso Del Suolo Di Dettaglio–Edizione 2020. Available online: https://geoportale.regione.emilia-romagna.it/catalogo/dati-cartografici/pianificazione-e-catasto/uso-del-suolo/layer-9 (accessed on 16 June 2022).
  40. Sistema Nazionale Per La Protezione dell’Ambiente. Consumo Di Suolo, Dinamiche Territoriali E Servizi Ecosistemici. Edizione 2021. Available online: https://www.snpambiente.it/2021/07/14/consumo-di-suolo-dinamiche-territoriali-e-servizi-ecosistemici-edizione-2021/ (accessed on 20 February 2022).
  41. IPCC. Climate Change 2014 Impacts, Adaptation and Vulnerability: Part A: Global and Sectoral Aspects: Working Group II Contribution to the Fifth Assessment Report of the Intergovernmental Panel on Climate Change; Cambridge University Press: Cambridge, UK, 2014. [Google Scholar]
  42. Passioura, J.B. Soil conditions and plant growth. Plant Cell Environ. 2002, 25, 311–318. [Google Scholar] [CrossRef] [PubMed]
  43. Rastogi, M.; Shalini, S.; Pathak, H. Emission of carbon dioxide from soil. Curr. Sci. 2002, 82, 510–516. Available online: http://www.jstor.org/stable/24105957 (accessed on 13 April 2022).
  44. Scaramuzzi, F.; Alpi, A.; Crescimanno, F.G.; Sansavini, S. Arboricoltura generale. Arboric. Gen. 2013, 10, 191–210. [Google Scholar] [CrossRef]
  45. Tassinari, G.; Calzecchi-Onesti, A. Manuale Dell’agronomo, Il Nuovo Tassinari, 6th ed.; Reda: Dammam, Saudi Arabia, 2020. [Google Scholar]
  46. Ceccon, P.; Fagnano, M.; Grignani, C.; Monti, M.; Orlandini, S. Agronomia; Edises: Napoli, Italy, 2017. [Google Scholar]
  47. Zomer, R.J.; Bossio, D.A.; Sommer, R.; Verchot, L.V. Global Sequestration Potential of Increased Organic Carbon in Cropland Soils. Sci. Rep. 2021, 11, 18720. [Google Scholar] [CrossRef]
  48. Pavelka, M.; Acosta, M.; Kiese, R.; Altimir, N.; Brümmer, C.; Crill, P.; Kutsch, W. Standardisation of chamber technique for CO2, N2O and CH4 fluxes measurements from terrestrial ecosystems. Int. Agrophysics 2018, 32, 569–587. [Google Scholar] [CrossRef]
  49. S.O.S. 4 LIFE. Save Our Soil for LIFE. Available online: https://www.sos4life.it/progetto/ (accessed on 3 January 2022).
  50. Ismea, Fondazione Qualivita. XIV Rapporto Annuale sul Settore Food&Wine Italiano dei Prodotti a Qualità Certificata DOP IGP STG. Ministero delle Politiche Agricole, AICIG, Federdoc e Consorzi di Tutela. 2016. Available online: https://www.qualivita.it/news/emilia-romagna-il-food-dop-igp-vale-26-miliardi-2/ (accessed on 6 April 2022).
  51. Lucertini, G.; Di Giustino, G.; dall’Omo, C.F.; Musco, F. An innovative climate adaptation planning process: iDEAL project. J. Environ. Manag. 2022, 317, 115408. [Google Scholar] [CrossRef]
Figure 1. Study area map.
Atmosphere 13 02060 g001
Figure 2. Methodology for assessing the GHG balance. From this figure it can be deduced that agriculture and more generally land use are sources of both CO2 emission and absorption. Where there is absorption, mitigation occurs, while where there is emission, there is an impact that can be mitigated through specific processes.
Atmosphere 13 02060 g002
Figure 3. Schematic of the layers considered for the assessment and mapping of the GHG balance.
Atmosphere 13 02060 g003
Figure 4. GHG balance map. In this image, as the spectral gradient changes towards red, areas with a positive GHG balance are identified.
Atmosphere 13 02060 g004
Figure 5. Presence of farms. In this image it is possible to see how the concentration of farms (b) settles in Parma and Reggio–Emilia (a), characterised by a positive balance due to the high number of dairy farms.
Atmosphere 13 02060 g005
Table 1. Information layers and related elements identified.
Main FactorsLayersDescriptionSource *
Emissions(i)INEMAR emissions related to the agriculture and livestock sectorEmilia–Romagna
Regional Geoportal
Absorption(ii)Agricultural crops and
potential carbon sequestration
AGREA, Emilia–Romagna Region
(iii)Agronomic practicesEmilia–Romagna
Regional Geoportal
(iv)Presence of hedges and rowsAGREA, Emilia–Romagna Region
(v)Potential carbon sequestration (ES-CST)Emilia–Romagna
Regional Geoportal
* Link to the data source available in the “Data Availability Statement” section.
Table 2. INEMAR emissions by sector (expressed in tonnes/year).
SECTORNOxPTSPM10PM2.5NH3VOCN2OCH4
1. Fertiliser Crops405.1 10,183.425,6661237.52715.6
2. Crops without
fertilisers
1092.91099.2873.9
4. Enteric
fermentation
50,531.2
5. Wastewater
management with reference to organic compounds
58.4 19,508.9
9. Wastewater
management
related to nitrogen compounds
34,603.8 3679.8
10. Particulate
emissions from
livestock farms
872.4515.4232.2
Table 3. Detail of the surfaces of the GHG balance classes.
Class of VulnerabilitySurface (ha)Percentage of Total GHG Balance
Low508,619.423.00%
Medium–low459,984.420.80%
Medium682,158.330.84%
Medium–high391,985.217.72%
High169,316.97.65%
Publisher’s Note: MDPI stays neutral with regard to jurisdictional claims in published maps and institutional affiliations.

